Embed Size (px)
Citation preview

Stadium Reconstruction EIR Appendices
APPENDIX K
NOISE TECHNICAL REPORT


NOISE TECHNICAL REPORT
STADIUM RECONSTRUCTION PROJECT SAN DIEGO, CALIFORNIA
Prepared for:
City of San Diego Public Works Department
525 B Street, Suite 500, M.S. 908A San Diego, California 92101
Prepared by:
AECOM 401 West A Street, Suite 1200 San Diego, California 92101
August 2015


Stadium Reconstruction Project – Noise Technical Report Page i Stadium Reconstruction Stadium Reconstruction Noise Tech Rpt 8/9/2015
TABLE OF CONTENTS Section Page
GLOSSARY OF TERMS AND ACRONYMS ...............................................................................v
1.0 INTRODUCTION ...............................................................................................................1 1.1 Purpose of Study ..................................................................................................... 1 1.2 Project Description.................................................................................................. 1 1.3 Project Location ...................................................................................................... 1
2.0 PROJECT DESCRIPTION ..................................................................................................5
3.0 NOISE AND VIBRATION TERMINOLOGY ...................................................................7 3.1 Noise Descriptors .................................................................................................... 7 3.2 Vibration ................................................................................................................. 9
4.0 REGULATORY FRAMEWORK .....................................................................................11 4.1 Federal Regulations .............................................................................................. 11 4.2 State Regulations .................................................................................................. 11
California Administrative Code, Title 24, Interior Noise ......................................11 California Government Code, General Plan Noise Elements ................................11 California Environmental Quality Act of 1970 .....................................................11
4.3 Local Regulations ................................................................................................. 12 City of San Diego...................................................................................................13 General Plan, Noise Element .................................................................................13 Noise Ordinance.....................................................................................................16
5.0 EXISTING CONDITIONS ................................................................................................21 5.1 Land Uses.............................................................................................................. 21 5.2 Noise Environment ............................................................................................... 21 5.3 Noise-Sensitive Receptors .................................................................................... 23
Noise Measurements and Observations .................................................................25
6.0 IMPACT ANALYSIS ........................................................................................................31 6.1 Construction .......................................................................................................... 31 6.2 Vibration ............................................................................................................... 39 6.3 Traffic Noise ......................................................................................................... 41 6.4 Operational Noise ................................................................................................. 41

Page ii Stadium Reconstruction Project – Noise Technical Report Stadium Reconstruction Noise Tech Rpt 8/9/2015
7.0 MITIGATION MEASURES .............................................................................................51 7.1 Mitigation Measures ............................................................................................. 51
7.1.1 Operation ...................................................................................................51 7.1.2 Construction Noise Reduction Measures ..................................................51
8.0 REFERENCES ..................................................................................................................55 APPENDIX A. Noise Data

Stadium Reconstruction Project – Noise Technical Report Page iii Stadium Reconstruction Stadium Reconstruction Noise Tech Rpt 8/9/2015
LIST OF FIGURES
Figure Page 1 Regional Map .......................................................................................................................2 2 Project Vicinity Map ............................................................................................................3 3 Noise Measurement Locations ...........................................................................................27 4 Predicted Daytime Ambient (non-event) at Qualcomm Stadium,
Noise Level Contours ........................................................................................................45 5 Predicted Daytime Ambient plus Typical NFL Game Event at
Qualcomm Stadium, Noise Level Contours ......................................................................47 6 Predicted Daytime Ambient plus Typical NFL Game at
Stadium Reconstruction, Noise Level Contours ................................................................49
LIST OF TABLES
Table Page 1 Typical Noise Levels ...........................................................................................................8 2 Human and Structural Response to Vibration ...................................................................12 3 Land Use – Noise Compatibility Guidelines .....................................................................14 4 Sound Level Limits ............................................................................................................17 5 Traffic Noise Significance Thresholds ..............................................................................18 6 Noise Measurement Locations ...........................................................................................26 7 Ambient Noise Measurement Data ....................................................................................29 8 Construction Equipment Noise Levels ..............................................................................32 9 Temporary Net Increase in Ambient Noise Levels, Weekday ..........................................37 10 Temporary Net Increase in Ambient Noise Levels, Saturdays ..........................................38 11 Construction Noise Levels at Receptors ............................................................................39 12 Construction Equipment Vibration Levels ........................................................................40

Page iv Stadium Reconstruction Project – Noise Technical Report Stadium Reconstruction Noise Tech Rpt 8/9/2015
This page intentionally left blank.

Stadium Reconstruction Project – Noise Technical Report Page v Stadium Reconstruction Stadium Reconstruction Noise Tech Rpt 8/9/2015
GLOSSARY OF TERMS AND ACRONYMS AADT annual average daily traffic ADT average daily traffic AED Advanced Explosives Demolition ALUCP Airport Land Use Compatibility Plan AMA American Motorcycle Association AMSL above mean sea level Caltrans California Department of Transportation CEC California Energy Commission CEQA California Environmental Quality Act CNEL Community Noise Equivalent Level City City of San Diego CV concert venue cy cubic yard(s) dB decibel dBA a-weighted decibel DSI Demolition Services, Inc. EIR Environmental Impact Report FHWA Federal Highway Administration FTA Federal Transit Administration I-8 Interstate 8 I-15 Interstate 15 in/sec inches per second ISO International Organization for Standardization KMEP MVT Kinder Morgan Energy Partners Mission Valley Terminal KVA kilovolt amps Ldn day/night average sound level Lmax maximum noise level in/sec inches per second LD Larson-Davis, Inc. Leq equivalent noise level over a period of time LOS level of service LT long-term MHPA Multiple Habitat Planning Area mph miles per hour MTS Metropolitan Transit System

Page vi Stadium Reconstruction Project – Noise Technical Report Stadium Reconstruction Noise Tech Rpt 8/9/2015
NFL National Football League ppv peak particle velocity SANDAG San Diego Association of Governments SDIA San Diego International Airport SDCRRA San Diego County Regional Airport Authority SDSU San Diego State University SLM sound level meter ST short-term SX Supercross

Stadium Reconstruction Project – Noise Technical Report Page 1 Stadium Reconstruction Stadium Reconstruction Noise Tech Rpt 8/9/2015
1.0 INTRODUCTION 1.1 PURPOSE OF STUDY This Noise Technical Report summarizes the ambient noise surveys completed for the Stadium Reconstruction Project (Project). This report analyzes potential impacts to noise-sensitive receptors resulting from the Project and identifies avoidance, minimization, and mitigation measures to reduce potential significant noise impacts to noise-sensitive receptors. The results of this analysis will be incorporated into an Environmental Impact Report (EIR) in-line with the requirements of the California Environmental Quality Act (CEQA). 1.2 PROJECT DESCRIPTION The City of San Diego is proposing to construct a new stadium replacing the existing Qualcomm Stadium on the 166-acre site located in the Mission Valley community in San Diego County, California. The Project site is owned and under local land use jurisdiction of the City. The new stadium would have a maximum normal capacity of up to 68,000 seats. However, it would be designed to allow for expansion within the stadium footprint to approximately 72,000 seats for special events such as a National Football League (NFL) Super Bowl. The new stadium would consist of approximately 1.75 million square feet, with a structure footprint of approximately 750,000 square feet. The new stadium would have a maximum height of approximately 250 feet above ground level, which includes stadium lights and architectural features on the top of the structure. 1.3 PROJECT LOCATION The Project site is located in the City of San Diego, within Mission Valley, just west of Interstate 15 (I-15) and north of Interstate 8 (I-8) (Figure 1). The 17-acre stadium footprint is located on a portion of the 166-acre Project site, which is bounded by Friars Road to the north, I-15 to the east, the San Diego River to the south, and large commercial development to the west (Figure 2). Land use within the immediate vicinity includes both residential and commercial development, as well as open space (e.g., San Diego River).

!
!
!
!
!
! !
!
!
!
!
!
!
!!
!
!
!
!
!
!
!!
!
!
!!
!
!
!
! !
!
!
!
!
!
!
!
!
!
_̂
!"̂$
%&s(
A̧
A³
!"_$
AË
!"a$
A¹
Pacific Ocean Ag
%&u(
A¦
?n
M E X I C O
R I V E R S I D E C O U N T Y
S A N D I E G O C O U N T Y
?t
Otay
Pala
Jamul
Poway
Vista
Tecate
Bonita
AlpineSantee
Julian
Ramona
La Mesa
Del Mar
Bonsall
Rainbow
Coronado
El Cajon
Descanso
Del Dios
Leucadia
Carlsbad
San Diego
Fernbrook
Encinitas
Escondido
Oceanside
Fallbrook
San Marcos
Chula Vista
Lemon Grove
Mesa Grande
Solana Beach
San Luis Rey
Spring Valley
Valley Center
Imperial Beach
Warner Springs
Rancho Santa Fe
Eucalyptus Hills
Camp Pendleton
San Diego Country Estates
Rancho San Diego
National City
Lakeside
LAKE HENSHAW
EL CAPITANRESERVOIR
LAKE HODGES
BARRETT LAKE
SAN VICENTERESERVOIR
LOWER OTAYRESERVOIR
SWEETWATER RESERVOIR
SUTHERLANDRESERVOIR
LOVELANDRESERVOIR
LAKE WOHLFORD
O NEILL LAKE
LAKE MURRAY
MIRAMAR RESERVOIR
UPPER OTAYRESERVOIR
LAKE RAMONA
LAKE POWAY
PALO VERDELAKE
DIXON RESERVOIR
LAKE SAN MARCOS
TURNER LAKE
Figure 1Regional Map
Source: Esri; SanGIS; SANDAG.
Scale: 1:506,880; 1 inch = 8 miles
8 0 84 Miles
I
Project Site
Path
: P:\
_604
3\60
4318
85_S
D_S
tadi
umEI
R\90
0-C
AD-G
IS\9
20 G
IS\9
22_M
aps\
Noi
se\F
ig1_
Proj
ectL
ocat
ion.
mxd
, 8/
6/20
15, D
anie
l_Ar
ella
no
Stadium Reconstruction Project - Noise Technical Report

Page x-xx
!"a$
%&s(
!"_$
Project Site
%&s(
Aù
!"̂$
?h
Stadium Reconstruction Project - Noise Technical Report
Source: Esri 2010; AECOM 2015.
Scale: 1 = 63,360; 1 inch = 1 mile
Figure 2Project Vicinity
1 0 10.5 Miles
I
Path
: P:\_
6043
\604
3188
5_SD
_Sta
dium
EIR\
900-
CAD
-GIS
\920
GIS
\922
_Map
s\N
oise
\Fig
2_Vi
cini
ty.m
xd,
7/28
/201
5, D
anie
l_Ar
ella
no

Page 4 Stadium Reconstruction Project – Noise Technical Report Stadium Reconstruction Noise Tech Rpt 8/9/2015
This page intentionally left blank.

Stadium Reconstruction Project – Noise Technical Report Page 5 Stadium Reconstruction Stadium Reconstruction Noise Tech Rpt 8/9/2015
2.0 PROJECT DESCRIPTION The Project would replace the existing Qualcomm Stadium with the construction of a new stadium on an approximately 17-acre portion in the northeast corner of the 166-acre Project site. Once the new stadium is operational, the existing Qualcomm Stadium would be demolished, which is located on an approximately 15-acre portion in the center of the Project site surrounded by stadium parking. The new stadium is anticipated to be leased to the NFL for playing home games during the NFL pre-season, regular season, and post-season. The new stadium would also be used for events similar to what currently occurs at Qualcomm Stadium. Construction preparation would begin along with some equipment mobilization toward the latter part of the 2016 NFL season. Once the season ends, full construction would begin. Construction would continue through the 2017 and 2018 NFL seasons. Construction activities would not occur on game days. The initial Project construction stages would include designating a construction area and beginning removal of the existing parking lot northeast of Qualcomm Stadium. The new stadium site is below the elevation of Qualcomm Stadium. To avoid drainage and terrain issues, approximately 490,000 cubic yards (cy) of fill material would be imported to elevate the new stadium site so that field level would be approximately 65 to 70 feet above sea level. A retaining wall up to 20 feet tall would be required along the northeast Project site boundary to hold the imported fill. Utility conduits and duct banks would be installed prior to the soil import. Once the fill has been installed and compacted, installation of the new stadium foundation would begin supported on deep foundations, which would include piles. To support Qualcomm Stadium, both driven steel piles (original construction in the 1960s) and drilled shafts (1997 expansion) were used, and both foundation types are feasible for support of the new stadium structure. Other pile types, such as auger cast piles and displacement auger cast piles, would also be considered for the new stadium during the final design phase. The installation of the new stadium foundation would last approximately 5 months; after which, construction of the new stadium structure would begin including the seating areas, roof, fixtures, and exterior. Construction/demolition truck haul routes would be established, and a construction/demolition traffic management plan would be implemented. The anticipated truck haul routes would be immediate access to and from I-15 and the Project site main entrance via Friars Road. . Project construction/demolition hours of operation would be from 7:00 am to 7:00 pm on weekdays and Saturdays, in accordance with the City Noise Ordinance. Construction/demolition traffic would

Page 6 Stadium Reconstruction Project – Noise Technical Report Stadium Reconstruction Noise Tech Rpt 8/9/2015
avoid peak hours in the mornings (7:00 a.m.to 8:30 a.m.) and afternoons (4:00 p.m. to 6:00 p.m.). Project construction noise would be generated during the following Project construction phases:
(1) demolition of parking pavement for new stadium footprint;
(2) new stadium site preparation including export of excavated material, and import and placement of fill;
(3) pile driving for new stadium foundation;
(4) construction of the new stadium;
(5) demolition of the existing Qualcomm Stadium; and
(6) reconstruction of the Project site parking lot.

Stadium Reconstruction Project – Noise Technical Report Page 7 Stadium Reconstruction Stadium Reconstruction Noise Tech Rpt 8/9/2015
3.0 NOISE AND VIBRATION TERMINOLOGY 3.1 NOISE DESCRIPTORS Noise is generally defined as unwanted or objectionable sound. The effects of noise on people can include general annoyance, interference with speech communication, sleep disturbance and, in the extreme, hearing impairment. The unit of measurement used to describe a noise level is the decibel (dB); decibels are measured on a logarithmic scale that quantifies sound intensity in a manner similar to the Richter scale used for earthquake magnitudes. Thus, a doubling of the energy of a noise source, such as doubling of traffic volume, would increase the noise level by 3 dB; a halving of the energy would result in a 3-dB decrease. Human Perception of Noise The human ear is not equally sensitive to all frequencies within the sound spectrum. Therefore, a method called “A-weighting” is used to filter noise frequencies that are not audible to the human ear. The A-scale approximates the frequency response of the average young ear when listening to most ordinary everyday sounds. When people make relative judgments of the loudness or annoyance of a sound, their judgments correlate well with the A-scale levels of those sounds. Therefore, the “A-weighted” noise scale is used for measurements and standards involving the human perception of noise. In this report, all noise levels are A-weighted and “dBA” is understood to identify the A-weighted dB. Table 1 provides typical noise levels associated with common activities. Human perception of noise has no simple correlation with acoustical energy. The perception of noise is not linear in terms of dBA or in terms of acoustical energy. Two noise sources do not sound twice as loud as one source. It is widely accepted that the average healthy ear can barely perceive changes of 3 dBA (increase or decrease); that a change of 5 dBA is readily perceptible; and that an increase (or decrease) of 10 dBA sounds twice (or half) as loud (Caltrans 2011). Averaging Noise Levels In addition to noise levels at any given moment, the duration and averaging of noise over time is also important for the assessment of potential noise disturbance. Noise levels varying over time are averaged over a period of time, usually hour(s), expressed as dBA Leq. For example, Leq(3) would be a 3-hour average noise level. When no period is specified, a 1-hour average is assumed (Leq(1) or Leq).

Page 8 Stadium Reconstruction Project – Noise Technical Report Stadium Reconstruction Noise Tech Rpt 8/9/2015
Table 1 Typical Noise Levels
Common Outdoor Activities Noise Level (dBA) Common Indoor Activities
- 110 Rock Band Jet Fly-over at 300 m (1,000 ft) 100 - Gas Lawn Mower at 1 m (3 ft) 90 - Diesel Truck at 15 m (50 ft), at 80 km/hr (50 mph) 80 Food Blender at 1 m (3 ft)
Garbage Disposal at 1 m (3 ft) Noisy Urban Area, Daytime Gas Lawn Mower, 30 m (100 ft) 70 Vacuum Cleaner at 3 m (10 ft)
Commercial Area Heavy Traffic at 90 m (300 ft) 60 Normal Speech at 1 m (3 ft)
Quiet Urban Daytime 50 Large Business Office Dishwasher in Next Room
Quiet Urban Nighttime 40 Theater, Large Conference Room (Background) Quiet Suburban Nighttime 30 Library Quiet Rural Nighttime 20 Bedroom at Night, Concert Hall (Background) - 10 Broadcast/Recording Studio Lowest Threshold of Human Hearing 0 Lowest Threshold of Human Hearing Source: Caltrans 2011 Notes: m=meters ft=feet km/hr=kilometers per hour mph=miles per hour
The time of day of noise is also an important factor to consider when assessing potential community noise impacts, as noise levels that may be acceptable during the daytime hours may create disturbance during evening or nighttime hours, when people are typically at home and sleeping. The Community Noise Equivalent Level (CNEL) is a descriptor used to characterize average noise levels over a 24-hour period, calculated from hourly Leq values, with 5 dBA added to the hourly Leq levels occurring between 7:00 p.m. and 10:00 p.m. and 10 dBA added to the hourly Leq levels occurring between 10:00 p.m. and 7:00 a.m., to reflect the greater disturbance potential from evening and nighttime noise, respectively. The day/night average sound level (Ldn) is the same as the CNEL, except the evening period is included in the daytime period. Noise Attenuation From the source to the receiver, noise changes both in level and frequency spectrum. The most obvious change is the decrease in noise as the distance from the source increases. The manner in which noise reduces with distance depends on the following important factors: ground

Stadium Reconstruction Project – Noise Technical Report Page 9 Stadium Reconstruction Stadium Reconstruction Noise Tech Rpt 8/9/2015
absorption, atmospheric effects and refraction, shielding by natural and man-made features, noise barriers, diffraction, and reflection. For a point or stationary noise source, such as construction equipment, the attenuation or drop-off in noise level would be at least -6 dBA for each doubling of unobstructed distance between source and the receiver and could attenuate to -7.5 dBA depending on the acoustic characteristics of the intervening ground. For a linear noise source, such as vehicles traveling on a roadway, the attenuation or drop-off in noise level would be approximately -3 dBA for each doubling of unobstructed distance between source and the receiver and could attenuate to -4.5 dBA depending on the acoustic characteristics of the intervening ground. A large object in the path between a noise source and a receiver can significantly attenuate noise levels at that receiver. The amount of attenuation provided by this “shielding” depends on the size of the object and the frequencies of the noise levels. Natural terrain features, such as hills and dense woods, as well as man-made features, such as buildings and walls, can significantly alter noise levels. Walls or berms are often specifically used to reduce, or attenuate, noise. Noise-Sensitive Receptors Some land uses are considered more sensitive to noise than others due to the types of persons or activities involved, such as sleeping, reading, talking, or convalescing. Noise-sensitive receptors are generally considered humans engaged in activities, or occupying land uses, that may be subject to the stress of significant interference from noise including, but not limited to, talking, reading, and sleeping. Typically, land uses associated with noise-sensitive human receptors include residential dwellings, hotels/motels, hospitals, nursing homes, educational facilities, and libraries. In addition to human receptors, protected animal species and their habitats, e.g., special-status bird species protected under federal and California regulations, may be considered noise-sensitive receptors during their breeding season. Special-status species have been afforded protection or special recognition by federal, state, or local resource agencies or organizations, and typically have relatively limited distribution and may require specialized habitat conditions. 3.2 VIBRATION In addition to noise, construction activities generate vibration, which can be interpreted as energy transmitted in waves through the soil mass. These energy waves generally dissipate with distance from the vibration source, due to spreading of the energy and frictional losses. The energy

Page 10 Stadium Reconstruction Project – Noise Technical Report Stadium Reconstruction Noise Tech Rpt 8/9/2015
transmitted through the ground as vibration, if great enough and in proximity to structures, can result in structural damage. Typical outdoor sources of perceptible groundborne vibration are construction equipment and traffic on rough (i.e., unpaved or uneven) roads. Construction activity can also result in varying degrees of groundborne vibration, depending on the type of equipment, methods employed, distance between source and receptor, duration, number of perceived vibration events, and local geology. Groundborne vibrations from typical construction activities do not often reach levels that can damage structures in proximity to construction, but their effects may manifest and be noticeable in buildings that are within 25 feet of construction activities. One major concern with regard to construction vibration is potential building damage, which is assessed in terms of peak particle velocity (ppv), typically in units of inches per second (in/sec). In addition to structural damage, the vibration of room surfaces affects people as human annoyance. Human and structural response to different vibration levels is influenced by a number of factors, including ground type, distance between source and receptor, duration, and the number of perceived vibration events. Typically, a vibration level of 0.1 in/sec ppv is the threshold of human annoyance, and 0.2 ppv is the threshold of risk of structural damage. Construction operations generally include a wide range of activities that can generate various levels of groundborne vibration. In general, blasting and demolition of structures generate the highest vibrations. Heavy truck transport can also generate groundborne vibrations, which vary depending on vehicle type, weight, and pavement conditions. At 25 feet, some construction equipment generates vibration at levels exceeding the threshold of human annoyance (0.1 in/sec ppv), and at levels exceeding the threshold of risk of structural damage (0.2 in/sec ppv). However, at 50 feet, this same equipment is below the thresholds of human annoyance and structural damage (FTA 2006).

Stadium Reconstruction Project – Noise Technical Report Page 11 Stadium Reconstruction Stadium Reconstruction Noise Tech Rpt 8/9/2015
4.0 REGULATORY FRAMEWORK This section provides a summary of the applicable federal, state, and local noise regulations. 4.1 FEDERAL REGULATIONS The federal government actively advocates that local jurisdictions use their land use regulatory authority to arrange new development in such a way that “noise-sensitive” uses are prohibited from being sited adjacent to a highway or, alternately, that the developments are planned and constructed in such a manner that potential noise impacts are minimized. Federal noise policies and programs are developed by federal agencies of the U.S. Department of Transportation through its various operating agencies, i.e., the Federal Aviation Administration, the Federal Transit Administration (FTA), and the Federal Highway Administration (FHWA). 4.2 STATE REGULATIONS California Administrative Code, Title 24, Interior Noise Title 24 of the California Administrative Code requires that residential structures, other than detached single-family dwellings, be designed to prevent the intrusion of exterior noise so that the interior CNEL with windows closed and attributable to exterior sources does not exceed 45 dBA CNEL in any habitable room. This requirement is applicable to new hotels, motels, apartment houses, and dwellings other than detached single-family dwellings. This standard is implemented by the California State Building Code Section 1208A.8.2 by stating that “interior noise levels attributable to exterior sources shall not exceed 45 dBA CNEL in any habitable room.” California Government Code, General Plan Noise Elements California does not promulgate statewide standards for environmental noise, but the California State Government Code Section 65302 (f) requires each local jurisdiction to draft a Noise Element for their General Plan to establish acceptable noise limits for various land uses. California Environmental Quality Act of 1970 CEQA, Public Resources Code 21100 et seq., requires lead agencies to evaluate the environmental impact associated with a proposed project. CEQA requires that a local agency

Page 12 Stadium Reconstruction Project – Noise Technical Report Stadium Reconstruction Noise Tech Rpt 8/9/2015
prepare an environmental impact report on any project it proposes to approve that may have a significant effect on the environment. Technical reports such as this noise report are used to develop noise sections of EIRs. CEQA Guidelines (California Code of Regulations, Title 14, Division 6, Chapter 3, Section 15064.7) provides thresholds of significance for noise. California Department of Transportation The California Department of Transportation (Caltrans) provides vibration level thresholds for architectural and structural damage and human perception thresholds. The Project is not subject to Caltrans requirements; however, Caltrans provides vibration thresholds for reference. To assess the potential for structural damage associated with vibration from construction activities, the vibratory ground motion in the vicinity of an affected structure is measured in terms of ppv, typically in units of in/sec. Table 2 presents the vibration level thresholds for architectural and structural damage and human perception and annoyance.
Table 2 Human and Structural Response to Vibration
Effects on Structures and People Peak Vibration Threshold (ppv)
(in/sec) Structural damage to commercial structures 6 Structural damage to residential buildings 2 Architectural damage 1.0 General threshold of human annoyance 0.1 General threshold of human perception 0.01
Source: Caltrans 2002 As shown in Table 2, structural damage occurs to various structures when vibration levels reach 2 to 6 in/sec ppv at the respective structures. One-half of the minimum of this threshold range (i.e., 1 in/sec ppv), is considered a safe criterion that would protect against structural damage. For its construction projects, Caltrans uses a vibration criterion of 0.2 in/sec ppv, except for pile driving and blasting activities. 4.3 LOCAL REGULATIONS City policies, ordinances, and significance thresholds with respect to noise are included in the Noise Element of the City’s General Plan (City of San Diego 2008), the City’s Municipal Code Noise Ordinance (City of San Diego 2010), and the City’s CEQA Significance Determination Thresholds (City of San Diego 2011).

Stadium Reconstruction Project – Noise Technical Report Page 13 Stadium Reconstruction Stadium Reconstruction Noise Tech Rpt 8/9/2015
City of San Diego General Plan, Noise Element The Noise Element of the City’s General Plan (City of San Diego 2008) provides goals and policies to guide compatible land uses and incorporate of noise attenuation measures for new uses. The City’s goal is controlling noise to acceptable levels at its source. However, when this is not feasible, the City applies additional measures to limit the effect of noise on future land uses, which include spatial separation, site planning, and building design techniques that address noise exposure and the insulation of buildings to reduce interior noise levels. The Noise Element provides land use and noise compatibility guidelines (City of San Diego 2008), which are provided in Table 3. As shown in Table 3, the City’s exterior unconditional noise level standard for noise-sensitive areas is 60 dBA CNEL. The City assumes that current standard construction techniques provide a 15 dB reduction of exterior noise levels to achieve the interior noise standard of 45 dBA CNEL (City of San Diego 2008). When exterior noise levels are greater than 60 dBA CNEL, consideration of specific construction techniques is required. Multiple dwelling units are “compatible” with exterior noise levels lower than 60 dBA CNEL and, in areas with exterior noise levels of up to 70 dBA CNEL, are “conditionally compatible” provided that the building structure attenuates interior noise levels to 45 dBA CNEL. Commercial uses (such as Qualcomm Stadium) are “conditionally compatible” with noise levels up to 75 dBA CNEL and “compatible” with noise levels up to 65 dBA CNEL. In addition, the Noise Element provides goals and policies that address mixed-use developments, sensitive receptors, site planning, operations, circulation, and noise attenuating measures. The goals and policies applicable to the Project site include: Goal A: Noise and Land Use Compatibility
• Consider existing and future noise levels when making land use planning decisions to minimize people’s exposure to excessive noise.
Policy NE-A.1. Separate excessive noise-generating uses from residential and other noise-sensitive land uses with a sufficient spatial buffer of less sensitive uses.
Goal B: Motor Vehicle Traffic Noise
• Minimal excessive motor vehicle traffic noise on residential and other noise-sensitive land uses.

Page 14 Stadium Reconstruction Project – Noise Technical Report Stadium Reconstruction Noise Tech Rpt 8/9/2015
Policy NE-B.1. Encourage noise-compatible land uses and site planning adjoining existing and future highways and freeways.
Table 3 Land Use – Noise Compatibility Guidelines
Source: City of San Diego 2008

Stadium Reconstruction Project – Noise Technical Report Page 15 Stadium Reconstruction Stadium Reconstruction Noise Tech Rpt 8/9/2015
Table 3 (Continued) Land Use – Noise Compatibility Guidelines
Source: City of San Diego 2008
Policy NE-B.4. Require new development to provide facilities which support the use of alternative transportation modes such as walking, bicycling, carpooling and, where applicable, transit to reduce peak-hour traffic.
Policy NE-B.5. Designate local truck routes to reduce truck traffic in noise-sensitive land uses areas.
Policy NE-B.7. Promote the use of berms, landscaping, setbacks, and architectural design where appropriate and effective, rather than conventional wall barriers to enhance aesthetics.
Goal E: Commercial and Mixed-Use Activity Noise:
• Minimal exposure of residential and other noise-sensitive land uses to excessive commercial and mixed-use related noise.

Page 16 Stadium Reconstruction Project – Noise Technical Report Stadium Reconstruction Noise Tech Rpt 8/9/2015
Policy NE-E.1. Encourage the design and construction of commercial and mixed-use structures with noise attenuation methods to minimize excessive noise to residential and other noise-sensitive land uses.
Goal G: Construction, Refuse Vehicles, Parking Lot Sweepers, and Public Activity Noise:
• Minimal exposure of residential and other noise-sensitive land uses to excessive construction, refuse vehicles, parking lot sweeper-related noise and public noise.
Goal H: Event Noise:
• Balance the effects of noise associated with events with the benefits of the events.
Policy NE-H.2. Ensure that the future residential and other noise-sensitive land uses adjacent to the ballpark and stadium are compatible with event noise levels.
Noise Ordinance The City regulates noise through the City’s Municipal Code, Chapter 5, Article 9.5, Noise Abatement and Control. The following sections of the Ordinance provide sound level limits between adjacent properties, noise insulation standards, and construction noise limits.
Section 59.5.0401 Sound Level Limits regulates noise generated by on-site sources associated with project operation, such as heating, ventilation, and air conditioning (HVAC) units. The property line noise level limits for various land uses by time of day are shown in Table 4.
Section 59.50404 Construction Noise of the noise ordinance regulates noise produced by construction activities. Construction activities are prohibited between the hours of 7 p.m. and 7 a.m. and on Sundays and certain legal holidays, unless a permit has been granted beforehand by the Noise Abatement and Control Administrator or conjunction with emergency work. Section 59.5.0404 limits construction noise to an average sound level of 75 dBA during the 12-hour period from 7 a.m. to 7 p.m. at or beyond the property lines of any property zoned residential.

Stadium Reconstruction Project – Noise Technical Report Page 17 Stadium Reconstruction Stadium Reconstruction Noise Tech Rpt 8/9/2015
Table 4 Sound Level Limits
Land Use Zone Time of Day One-Hour Average Sound Level (dB)
1. Single-Family Residential 7 a.m. to 7 p.m. 50
7 p.m. to 10 p.m. 45 10 p.m. to 7 a.m. 40
2. Multi-Family Residential (Up to a maximum density of 1/2,000)
7 a.m. to 7 p.m. 55 7 p.m. to 10 p.m. 50 10 p.m. to 7 a.m. 45
3. All Other Residential 7 a.m. to 7 p.m. 60
7 p.m. to 10 p.m. 55 10 p.m. to 7 a.m. 50
4. Commercial 7 a.m. to 7 p.m. 65
7 p.m. to 10 p.m. 60 10 p.m. to 7 a.m. 60
5. Industrial or Agricultural Any time 75
Source: City of San Diego 2010 Significance Determination Thresholds The City of San Diego’s CEQA Significance Determination Thresholds outline the criteria and thresholds used to determine whether project impacts are significant (City of San Diego 2011). The following applicable thresholds have been used in this analysis for identifying significant noise impacts applicable to the Project: Interior and Exterior Noise Impacts from Traffic-Generated Noise The City’s CEQA significance determination thresholds provide guidance on implementing the City’s noise policies and ordinances, including the general thresholds of significance for uses affected by traffic noise included in Table 5. As shown in Table 5, the noise level at exterior usable open space for single- and multifamily residences should not exceed 65 dBA. Operational noise is typically considered permanent, in the sense of the duration of the operation of the constructed facility, while not continuous in nature and occurring only when the stadium is hosting an event (in progress). A significant permanent increase is defined as a direct Project-related permanent ambient increase of 3 dBA or greater, where exterior noise levels would already exceed the City’s significance thresholds (City of San Diego 2011) (e.g., 65 dBA daytime for single-family residential land uses). An increase of 3 dBA is perceived by the human ear as a barely perceptible increase.
Page 18 Stadium Reconstruction Project – Noise Technical Report Stadium Reconstruction Noise Tech Rpt 8/9/2015
Table 5 Traffic Noise Significance Thresholds
Structure of Proposed Use That Would Be Impacted by
Traffic Noise Interior Space
Exterior Useable Space1
General Indication of Potential Significance
Single-family detached 45 dB 65 dB
Structure or outdoor useable area2 is <50 feet from the center of the closest (outside) lane on a street with existing or future ADTs >7,500
Multi-family, school, library, hospital, day care center, hotel, motel, park, convalescent home
Development Services Department (DSD) ensures 45 dB pursuant to Title 24
65 dB
Office, church, business, professional uses n/a 70 dB
Structure or outdoor useable area is <50 feet from the center of the closest lane on a street with existing or future ADTs >20,000
Commercial, retail, industrial, outdoor sports uses n/a 75 dB
Structure or outdoor useable area is <50 feet from the center of the closest lane on a street with existing or future ADTs >40,000
Source: City of San Diego 2011 1 If a project is currently at or exceeds the significance thresholds for traffic noise described above and noise
levels would result in less than a 3-dB increase, then the impact is not considered significant. 2 Exterior useable areas do not include residential front yards or balconies unless the areas such as balconies are
part of the required useable open space calculation for multi-family units. Noise from Adjacent Stationary Uses (Noise Generators) The Ordinance also limits property line noise levels for various land uses by time of day for noise generated by on-site sources associated with project operation (Table 4), (e.g., for multifamily residential, 55 dBA Leg from 7 a.m. to 7 p.m., 50 dBA Leg from 7 p.m. to 10 p.m., and 50 dBA Leg from 10 p.m. to 7 a.m.). A project that would generate noise levels at the property line that exceed the City‘s Noise Ordinance Standards is considered potentially significant (such as potentially a carwash or projects operating generators or noisy equipment). If a nonresidential use, such as a commercial, industrial, or school use, is proposed to abut an existing residential use, the decibel level at the property line should be the arithmetic mean of the decibel levels allowed for each use as set forth in Section 59.5.0401 of the Municipal Code (Table 4). Although the noise level above could be consistent with the City‘s Noise Ordinance Standards, a noise level above 65 dB (A) CNEL at the residential property line could be considered a significant environmental impact.

Stadium Reconstruction Project – Noise Technical Report Page 19 Stadium Reconstruction Stadium Reconstruction Noise Tech Rpt 8/9/2015
Impacts to Sensitive Wildlife Noise mitigation may be required for significant noise impacts to certain avian species during their breeding season, depending upon the location of the project such as in or adjacent to an Multiple Habitat Planning Area (MHPA), whether or not the project is occupied by California gnatcatcher, least Bell’s vireo, southern willow flycatcher, least tern, cactus wren, tricolored blackbird, or western snowy plover, and whether or not noise levels from the project, including construction during the breeding season of these species, would exceed 60 dBA or existing ambient noise level if above 60 dBA. In addition, significant noise impacts to the California gnatcatcher are only analyzed if the project is within an MHPA; there are no restrictions for the gnatcatcher outside the MHPA any time of year. Temporary Construction Noise and Sound Level Limits Temporary construction noise that exceeds 75 dB (A) Leq at a sensitive receptor would be considered significant. Construction noise levels measured at or beyond the property lines of any property zoned residential shall not exceed an average sound level greater than 75 dB during the 12-hour period from 7:00 a.m. to 7:00 p.m. In addition, construction activity is prohibited between the hours of 7:00 p.m. of any day and 7:00 a.m. of the following day, or on legal holidays as specified in Section 21.04 of the San Diego Municipal Code, with the exception of Columbus Day and Washington‘s Birthday, or on Sundays, that would create disturbing, excessive, or offensive noise unless a permit has been applied for and granted beforehand by the Noise Abatement and Control Administrator, in conformance with San Diego Municipal Code Section 59.5.0404. Additionally, where temporary construction noise would substantially interfere with normal business communication, or affect sensitive receptors, such as day care facilities, a significant noise impact may be identified. Noise/Land Use Compatibility The City’s General Plan Noise Element, Table 3, indicates the City’s exterior unconditional “compatible” noise level standard for noise-sensitive areas is 60 dBA CNEL. The City assumes that standard construction design techniques would provide a 15-dB reduction of exterior noise levels to interior noise levels of 45 dBA CNEL or less when exterior sources are 60 dBA CNEL or less. When exterior noise levels are greater than 60 dBA CNEL and the interior threshold is 45 dBA CNEL, consideration of specific construction techniques is required. Areas with exterior noise levels of up to 70 dBA CNEL are “conditionally compatible” provided that the building structure attenuates interior noise levels to 45 dBA CNEL.

Page 20 Stadium Reconstruction Project – Noise Technical Report Stadium Reconstruction Noise Tech Rpt 8/9/2015
This page intentionally left blank.

Stadium Reconstruction Project – Noise Technical Report Page 21 Stadium Reconstruction Stadium Reconstruction Noise Tech Rpt 8/9/2015
5.0 EXISTING CONDITIONS 5.1 LAND USES Existing land uses within the Project site include the existing Qualcomm Stadium with associated parking lot, a soccer field and recycling center in the southwest corner of the site, and the MTS Trolley Green Line station and trolley line that traverses the southern portion of the site. An MTS Trolley Electric Substation is located at the southeast corner of the site. The Project site is surrounded by major roadways, interstates, existing development, and two surface-water features (San Diego River to the south and Murphy Canyon Creek to the east). Office buildings and large commercial/retail uses are located to the west; and higher density, multifamily residential land uses are located to the northwest and southwest of the Project site and east of I-15. The Kinder Morgan Energy Partners Mission Valley Terminal (KMEP MVT) is located to the northeast of the Project site at 9950 San Diego Mission Road, west of I-15. Friars Road bisects KMEP MVT. The Project would cover an area of approximately 17 acres northeast of the existing Qualcomm Stadium within the 166-acre Stadium parking lot. The ground surface in the Project vicinity generally slopes gradually down toward the south and southwest toward the San Diego River. At the Project location, the existing ground surface ranges from about 55 to 75 feet above mean sea level (AMSL). The Project site is relatively flat, with no topographic features that could serve as a noise barrier. The Project site is bounded by Friars Road to the north, I-15 to the east, the San Diego River Floodway to the south, and developed area to the west consisting of office buildings, large commercial/retail uses, and a public library. Further north and south, the Project site is in proximity to mesas of the north and south rim of Mission Valley with single-family residential development; further the east and west is the relatively flat developed area of Mission Valley. 5.2 NOISE ENVIRONMENT Noise Sources (No Qualcomm Stadium Event)
The primary noise source on and surrounding the Project site is traffic noise. Secondary noise sources are activities at the surrounding industrial, commercial, office, and residential areas, trolley service, and aircraft flyovers.

Page 22 Stadium Reconstruction Project – Noise Technical Report Stadium Reconstruction Noise Tech Rpt 8/9/2015
The existing noise environment surrounding the Project site (non-event) is primarily influenced by noise from vehicle traffic on the roadways adjacent to and in proximity to the Project site including Friars Road to the north, San Diego Mission Road to the northeast, I-15 to the east, and Qualcomm Way to the south and west. Camino Del Rio North and I-8 are located south of the San Diego River, approximately 675 and 750 feet, respectively, from the Project site’s southern boundary. The predominant traffic noise at the Project site and surrounding areas is from I-15, I-8, and Friars Road, which are described as:
• I-15 – a north-south eight-lane highway facility with four general purpose lanes in each direction, and provides north/south on/off ramps at Friars Road to access the Project site.
• I-8 – an east-west ten-lane highway facility with five general purpose lanes in each direction, and does not provide on/off ramps to directly access the Project site.
• Friars Road – a six-lane divided roadway with a posted speed limit of 50 mph, and provides direct access to the Project site.
Traffic noise level on roadways is dependent upon traffic volume, speed, flow, vehicle mix, pavement type and condition. At higher speeds, typically on freeways, highways and primary arterials, the noise from tire/pavement interaction can be greater than from vehicle exhaust and engine noise (City of San Diego 2008). Generally, traffic noise is increased by heavier traffic volumes, higher speeds, and large trucks. Free-flowing traffic just before or just after peak traffic periods is often the noisiest. Peak traffic periods generally result in lower noise levels due to traffic congestion, which lowers traffic speeds (Caltrans 2011). Trolley service is provided at the Project site by the San Diego Metropolitan Transit System (MTS) trolley (the Green Line) at 15-minute intervals during the weekday commute and 15- to 20-minute intervals on the weekend mid-day hours. The Green Line provides service from Downtown San Diego to the City of Santee, with service to the Project site every day from approximately 5:00 am to midnight. The Green Line runs east-west north of I-8 and traverses the southern portion of the Project site, with a trolley stop at Qualcomm Stadium (Qualcomm Station) within the Project site. Stadium patrons utilize the trolley for stadium events including approximately 21-26 percent of the attendance at NFL football games and approximately 12-15 percent of the attendance at San Diego State University Aztecs football games (AECOM 2015b).
Random aircraft flyovers occur in the vicinity of the Project site from high altitude commercial and military jets; low elevation traffic and news helicopters, and low elevation single-engine fixed wing aircraft. The closest airports to the Project site include San Diego International

Stadium Reconstruction Project – Noise Technical Report Page 23 Stadium Reconstruction Stadium Reconstruction Noise Tech Rpt 8/9/2015
Airport (SDIA) (approximately 5 miles to the southwest) and Montgomery Field (approximately 2 miles to the north). The Project site is not within SDIA’s Airport Influence Area and is located approximately 2 miles north of the SDIA approach flight path (east-west) (SDCRAA 2014). The Project site is within Montgomery Field’s Airport Influence Area, however, only for overflight notification and airspace protection (SDCRAA 2010). Noise Sources (Qualcomm Stadium Event) The existing noise environment of the Project site and the surrounding area during a Qualcomm Stadium event is primarily influenced by traffic noise from vehicle traffic on the roadways adjacent to and in proximity to the Project site, and secondarily, from the noise generated by the stadium event. As discussed in Chapter 3, major events occurring at existing Qualcomm Stadium include:
• NFL football games (including pre-season, regular season, post-season games)
• College football games (including regular season, post-season bowl games)
• Music concert events
• Motor sports events (including monster truck rally, American Motorcycle Association [AMA] Supercross or SX)
NFL games typically occur on Sundays, generally starting at 1:00 to 1:30 p.m. and lasting approximately 3 hours. The existing Qualcomm Stadium parking lot opens 4 hours prior to official game start-time and closes approximately 2 hours after game conclusion. Occasionally, NFL games are played on Sunday (5:30 p.m.), Monday (5:30 p.m.), Thursday (7:00 p.m.), or Saturday (at 5:00 p.m.) (San Diego Chargers 2015). College football games (primarily San Diego State University [SDSU] Aztecs) typically occur on Saturdays starting at 7:30 p.m. and last approximately 3 hours. The stadium parking lot is open 3 hours prior to start time and approximately 2 hours after game conclusion. In December, two college bowl games are played at a time and date determined each year. Music concerts occur infrequently based on other available music venues in San Diego, and typically occur in the evening of any given day. The existing Qualcomm Stadium parking lot is open several hours prior to concert start and conclusion. The motor sports events typically occur on Saturday evenings. 5.3 NOISE-SENSITIVE RECEPTORS Noise-sensitive receptors are land uses associated with indoor and/or outdoor activities (sleeping, studying, or convalescing) that may be subject to stress and/or significant interference from

Page 24 Stadium Reconstruction Project – Noise Technical Report Stadium Reconstruction Noise Tech Rpt 8/9/2015
noise. Noise-sensitive receptors typically include residential dwellings, dormitories, mobile homes, hotels, motels, hospitals, nursing homes, educational facilities (i.e., classrooms), passive recreation areas, daycare facilities, and libraries. The Noise Element of the City’s General Plan defines noise-sensitive land uses to include, but not necessarily limited to, residential uses, hospitals, nursing facilities, intermediate care facilities, child educational facilities, libraries, museums, places of worship, child care facilities, and certain types of passive recreational parks and open space (City of San Diego 2008). There are no noise-sensitive human receptors on the Project site. The nearest human noise-sensitive receptors in proximity to the Project site boundary are off-site residences, as shown in Figure 3. Multifamily housing is approximately 175 feet to the northwest across Friars Road at an elevation of approximately 150 feet AMSL with a direct line-of-sight of the existing Qualcomm Stadium, which has an elevation of approximately 85 feet AMSL at its base. Additional multifamily housing is approximately 400 feet to the east across I-15 at an elevation of approximately 70 feet AMSL with I-15 obstructing line-of-sight of the existing Qualcomm Stadium. Additional multifamily housing is approximately 500 feet to the east across I-15 and San Diego Mission Road at an elevation of approximately 100 feet AMSL with an obstructed line-of-sight of the existing Qualcomm Stadium. The nearest single-family housing is approximately 700 feet to the north of the existing Qualcomm Stadium boundary across Friars Road at an elevation of approximately 275 feet AMSL on the north rim of Mission Valley with a direct line-of-sight of the existing Qualcomm Stadium. Additional single-family housing is approximately 1,800 feet to the south across I-8 at an elevation of approximately 400 feet AMSL on the south rim of Mission Valley with a direct line-of-sight of the existing Qualcomm Stadium. One single-family residence is located approximately 2,000 feet southwest of the Project site boundary along Camino Del Rio South, south of and adjacent to I-8. In addition to human receptors, special-status bird species may be considered noise-sensitive receptors; especially during their breeding season. Special-status species have been afforded protection or special recognition by federal, state, or local resource agencies or organizations, and typically have relatively limited distribution and may require specialized habitat conditions. There are no noise-sensitive special-status bird species on the Project site, except within 235 feet of the San Diego River floodway along the southern boundary of the Project site (i.e., no special-status species on the developed area of the Project site). Special-status bird species have the potential to occur within the floodplain of the San Diego River channel corridor and Murphy Canyon Creek based on presence of suitable habitat (AECOM 2015a). Project impacts are analyzed in the Project Biological Technical Report (AECOM 2015a).

Stadium Reconstruction Project – Noise Technical Report Page 25 Stadium Reconstruction Stadium Reconstruction Noise Tech Rpt 8/9/2015
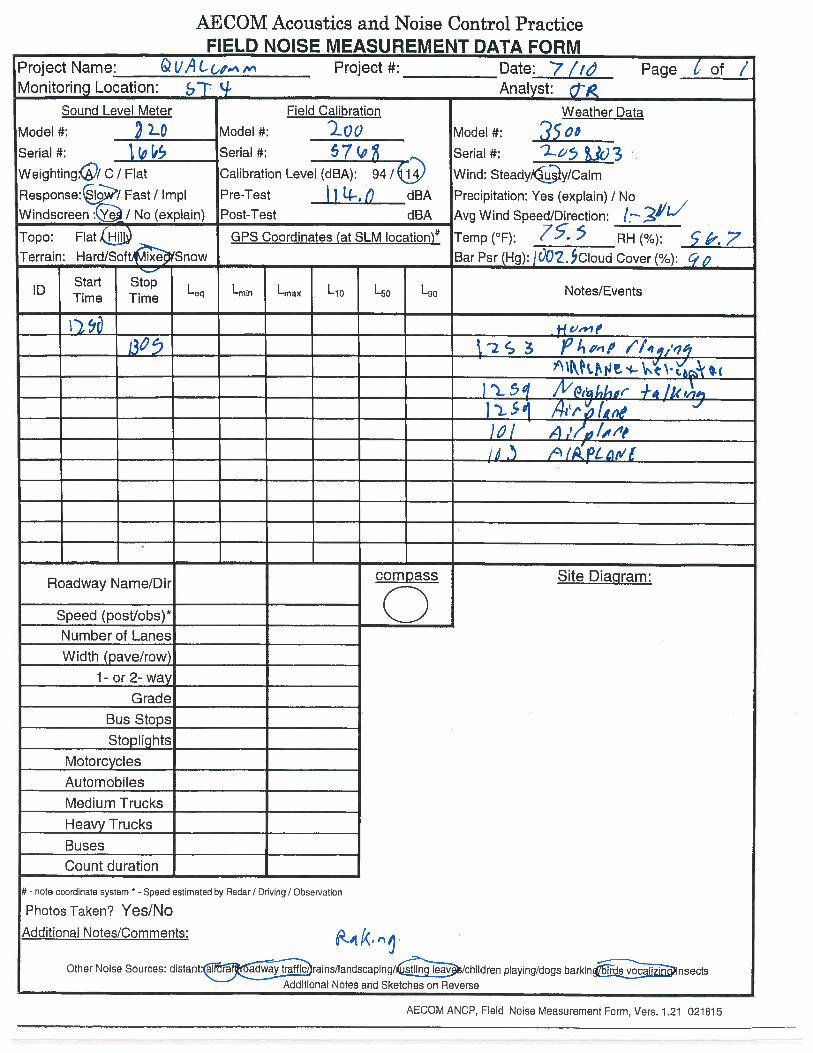
Noise Measurements and Observations To characterize the existing ambient noise environment, noise measurements and observations were performed on the Project site and at nearby noise-sensitive receptors in proximity to the Project site. Ambient noise levels were measured at the nearest residences, to the north, northwest, east, and south of the stadium site; a public library west of the stadium site; and at noise-sensitive bird habitat of the floodplain of the San Diego River at the southern boundary of the stadium site near the MTS Trolley Station – Qualcomm Stadium. A combination of short-term (“ST”, 15-minute duration) and long-term (“LT”, 24-hour day-night) noise measurements were performed during stadium event and non-event days. Noise measurement locations and observations are summarized in Table 6, and located in Figure 3. As shown in Table 6, the LT measurements were performed at the single-family and multifamily residences nearest to the existing Qualcomm Stadium and the new stadium site. Three additional measurements were performed at the existing Qualcomm Stadium during the One Direction concert on Thursday, July 9, 2015. These concert venue (CV) measurements (CV-1, CV-2, and CV-3) were conducted for the purpose of collecting data to support a prediction model of typical stadium concert event noise. On Wednesday, July 8, 2015, LT ambient noise measurements (LT-1 through LT-4) were initiated at the residences nearest the Project site. From July 8–13, 2015, ST noise measurements were regularly taken near these residences (ST-1 through ST-4), the southern boundary of the Project site (ST-6), an office/commercial area (ST-5), and a public library (ST-7). On Monday, July 13, the LT measurements were concluded. Measured noise levels are summarized in Table 7, and detailed in Appendix A. Noise measurements were taken by AECOM noise specialists using sound level meters (SLMs) manufactured by Larson-Davis, Inc. (LD). ST noise measurements were made with LD Model 820 SLM, and LT measurements with LD Models 820, 720, and LxT SLM. The SLMs were programmed in “slow” response mode, and to record noise levels with A-weighting. All noise measurements were taken approximately 5 feet above ground level using stationary tripods. SLM calibration was field-checked before and after each measurement using LD Model CAL 200 and CAL 150 calibrators. During the measurements, the weather was generally clear and dry, with winds 0 to 9 mph, and temperatures ranging between 65 to 89 degrees Fahrenheit.

Page 26 Stadium Reconstruction Project – Noise Technical Report Stadium Reconstruction Noise Tech Rpt 8/9/2015
Table 6 Noise Measurement Locations
Site ID* Location
Distance and Direction from
Qualcomm Stadium
Representative Land Use Dominant Noise Source
LT-1 I-15 along fence line behind backside of Bella Posta Apartments
1,450 feet east Location used to measure I-15 traffic noise only, not adjacent housing area.
Vehicle traffic on I-15
LT-2 9477 Goodwick Court, east of Mission Village Drive 1,800 feet north
Single-family housing north of stadium site, exterior use area
Vehicle traffic on Friars Road and I-15
LT-3
Monte Vista Apartments Unit 3302 Northwest of Friars Road and Qualcomm Stadium
1,500 feet northwest Multifamily housing Vehicle traffic on
Friars Road
LT-4
5262 Cromwell Court south of I-8 and Qualcomm Stadium, at end of Cromwell Court
2,400 feet south Single-family housing Vehicle traffic on I-8
ST-1 Bella Posta Apartments east of I-15 and north of San Diego Mission Road
1,550 feet northeast
Multifamily housing within interior courtyard Vehicle traffic on I-15
ST-2 Rancho Mission Villas Unit 209, east of I-15 and Qualcomm Stadium
1,750 feet east Multifamily housing next to porch deck Vehicle traffic on I-15
ST-3 Mission Terrace Apartments Unit 7 east of I-15, north of San Diego Mission Road
1,850 feet northeast
Multifamily housing at top of stairs next to residence
Vehicle traffic on I-15 and San Diego Mission Road
ST-4 9391 Broadview, north of Friars Road, west of Mission Village Road
1,900 feet northwest
Single-family home on back deck
Vehicle traffic on Friars Road, Stadium concert event
ST-5 2365 Northside Drive west of Qualcomm Stadium south of Friars Road
1,375 feet west Commercial Space, Office building at outdoor use area
Vehicle traffic on Friars Road, Saturday car racing
ST-6 Qualcomm Stadium south parking lot boundary 600 feet south Parking lot, river habitat
Trolley station Vehicle traffic on I-8 and trolley noise
ST-7 Mission Valley Public Library north of Fenton Parkway and Trolley line
2,200 feet southwest
Library outdoor use area Vehicle traffic on I-8 and trolley noise, soccer announcer
* The Site ID corresponds to noise measurement locations shown in Figure 3.

Page x-xx
#*
#*
#*
#*
")
")
")
")
")
")
$+
$+
$+
")
!"a$
!"_$
%&s(
ST-7
CV-3
CV-2
CV-1
ST-4
ST-6
ST-5
ST-3
ST-2
ST-1
LT-4
LT-3
LT-2
LT-1
Fria
rs R
d
CAMIN
O Del
Rio
San Diego Mission Rd
Ronda Ave
Fa
irm
ou
nt
Av
e
Ra
nc
ho
Mis
si o
n R
d
Rio
San
Die
go D
r
Fenton Pky
No
rth
sid
e D
r
Barte
l St
Mis
sio
n V
illag
e D
r
Mel
bourn
e D
r
Wa
rd R
d
Ha
rco
urt D
r
River R
un Dr
Mo
nette D
r
Caminito Cascara
Ray
mel
l Dr
Mo
ble
y S
t
Mission
City P
ky
Ma
mm
oth
Dr
Palisades Rd
Ba
rte
l Pl
Yolanda AveMo
on
sto
ne
Dr
San
to R
d
Podell Ave
R B
on
ito
Wa
y
Wils
hir
e D
r
Old
Qu
arry
Rd
R R
un D
r
Eileen Dr
Ca
min
ito
Yu
ca
tan
Caminito Cuervo
Scheidler Way
Ca
min
ito
Ele
ga
nte
CAMINO Del R
io
Friars
Rd
Rio S
an D
iego
Dr
Source: NAIP 2014.
Scale: 1 = 9,000; 1 inch = 750 feet
Figure 3Noise Measurement Locations
750 0 750375 Feet
IStadium Reconstruction Project - Noise Technical Report
LEGEND
Project Site
Measurement Locations
$+ Concert Venue (CV)
#* Long-Term (LT)
") Short-Term (ST)
Path
: P:\_
6043
\604
3188
5_SD
_Sta
dium
EIR\
900-
CAD
-GIS
\920
GIS
\922
_Map
s\N
oise
\Fig
3_St
adiu
m_N
oise
Mea
sure
men
ts.m
xd,
7/27
/201
5, D
anie
l_Ar
ella
no

Page 28 Stadium Reconstruction Project – Noise Technical Report Stadium Reconstruction Noise Tech Rpt 8/9/2015
This page intentionally left blank.

Stadium Reconstruction Project – Noise Technical Report Page 29 Stadium Reconstruction Stadium Reconstruction Noise Tech Rpt 8/9/2015
Table 7 Ambient Noise Measurement Data
Site ID* Type
Weekday Saturday Sunday Day Evening Night Day Evening Night Day Evening Night
LT-1 MFH 76 74 71 75 74 72 74 74 70 LT-2 SFH 63 62 58 62 61 60 61 60 58 LT-3 MFH 59 60 52 64 56 54 57 56 53 LT-4 SFH 67 66 61 67 66 63 67 66 62 ST-1 MFH 61 59 56 59 58 56 59 59 55 ST-2 MFH 71 70 66 70 69 67 69 69 65 ST-3 MFH 69 69 65 69 68 66 68 68 64 ST-4 SFH 57 58 48 54 46 44 54 53 50 ST-5 Office 57 58 50 62 54 52 53 52 49 ST-6 River 62 60 55 58 57 54 59 58 54 ST-7 Library 51 51 46 62 61 58 n/a n/a n/a
* The Site ID corresponds to locations shown in Figure 3. MFH = Multifamily Housing; SFH = Single-family Housing; n/a = not applicable All noise levels are expressed as dBA Leq As shown in Table 7, ambient average noise level measurements ranged from 44 to 76 dBA Leq. Noise sources were primarily from vehicle traffic on adjacent roadways of Friars Road, I-15, or I-8. Weekday measurement does not include concert event on Thursday, July 9, 2015, when the existing Qualcomm Stadium hosted a music concert by the group One Direction, which was recorded to be utilized for the modeling of stadium concert event noise.

Page 30 Stadium Reconstruction Project – Noise Technical Report Stadium Reconstruction Noise Tech Rpt 8/9/2015
This page intentionally left blank.

Stadium Reconstruction Project – Noise Technical Report Page 31 Stadium Reconstruction Stadium Reconstruction Noise Tech Rpt 8/9/2015
6.0 IMPACT ANALYSIS This section addresses Project-related noise and vibration impacts that would occur during Project construction and operation. 6.1 CONSTRUCTION Methodology Construction noise is considered temporary and short term. Construction noise at its source varies depending on construction activities and duration, and the type and usage of equipment involved. Noise impacts from construction are dependent on the construction noise levels generated, the timing and duration of the construction activities, proximity to sensitive receptors, and noise regulations and standards. Construction equipment can be stationary or mobile. Stationary equipment operates in one location for various periods of time with fixed-power operation, such as pumps, generators, and compressors, or a variable noise operation, such as pile drivers, rock drills, and pavement breakers. Mobile equipment moves around the construction site such as bulldozers, graders, and loaders (FTA 2006). Heavy construction equipment typically operates for short periods at full power followed by extended periods of operation at lower power, idling, or powered-off conditions. Typically, site preparation involves demolition, grading, compacting, and excavating, which would include the use of backhoes, bulldozers, loaders, excavation equipment (e.g., graders and scrapers), pile drivers, and compaction equipment. Finishing activities may include the use of pneumatic hand tools, scrapers, concrete trucks, vibrators, and haul trucks. Typical maximum noise levels generated by various pieces of construction equipment are listed in Table 8. As shown in Table8, maximum noise levels range from 70 to 95 dBA Lmax, depending upon the piece of equipment operating (FTA 2006). In typical construction projects, grading and impact activities typically generate the highest noise levels. Grading involves the largest heaviest equipment and typically includes bulldozers, excavators, dump trucks, front-end loaders, and graders with maximum noise levels range from 80 to 85 dBA Lmax. Impact equipment includes pile drivers, rock drills, pavement breakers, concrete crushers, and industrial/concrete saws with maximum noise levels range from 90 to 95 dBA Lmax. Each phase of construction has a specific equipment mix, depending on the work to be accomplished during that phase. Each phase also has its own noise characteristics; some phases would have higher continuous noise levels than others, and some have high-impact noise levels.

Page 32 Stadium Reconstruction Project – Noise Technical Report Stadium Reconstruction Noise Tech Rpt 8/9/2015
Table 8 Construction Equipment Noise Levels
Equipment Noise Level (dBA Lmax) at 50 Feet
Auger Drill Rig 85 Backhoe 80 Blasting 94 Chain Saw 85 Clam Shovel 93 Compactor (ground) 80 Compressor (air) 80 Concrete Batch Plant * 80 Concrete Crushing Plant ** 86 Concrete Mixer Truck 85 Concrete Pump 82 Concrete Saw 90 Crane (mobile or stationary) 85 Dozer 85 Dump Truck 84 Excavator 85 Front End Loader 80 Generator (25 KVA or less) 70 Generator (more than 25 KVA) 82 Grader 85 Hydra Break Ram 90 Impact Pile Driver (diesel or drop) 95 Insitu Soil Sampling Rig 84 Jackhammer 85 Mounted Impact Hammer (hoe ram) 90 Paver 85 Pneumatic Tools 85 Pumps 77 Rock Drill 85 Scraper 85 Tractor 84 Vacuum Excavator (vac-truck) 85 Vibratory Concrete Mixer 80 Vibratory Pile Driver 95
Source: Thalheimer 2000, *FTA 2006, **Ldn Consulting, Inc. 2011 KVA = kilovolt amps
Typical construction projects, with equipment moving from one point to another, work breaks, and idle time, have hourly average noise levels (Leq) that are lower than loud short-term, or instantaneous, peak noise events shown in Table 8. The Leq of each phase is determined by combining the Leq contributions from each piece of equipment used in that phase (FTA 2006). Therefore, typically, hourly average noise levels would be approximately 75 to 80 dBA Leq at 50

Stadium Reconstruction Project – Noise Technical Report Page 33 Stadium Reconstruction Stadium Reconstruction Noise Tech Rpt 8/9/2015
feet from the center of the non-impact construction activities area is assumed to occur, with 90 dBA Leq at 50 feet for impact equipment. Noise levels of other activities would be less. Noise levels from construction activities would attenuate with distance at a rate of 6 dBA per doubling of distance over acoustically hard sites, such as streets and parking lots. Intervening structures and/or topography would further attenuate noise levels. These factors generally limit the distance construction noise travels and ensure noise impacts from construction are localized. Modeling Construction noise from each of six distinct categories of activity was predicted at the representative nearby noise-sensitive receivers with a technique based on the “general assessment” methodology as appearing in Chapter 12 of the FTA’s Transit Noise and Vibration Impact Assessment (FTA 2006) guidance report. In summary, this technique presumes the two loudest pieces of equipment associated with an activity are operating at full power and located at the geographic center of a construction area or zone. The following details the expected major noise producer(s) based on available anticipated roster of Project construction equipment and schedule, and their location for each studied construction activity phase.
• Demolition of the Parking Lot (new stadium site) –Vibrator plates (88 dBA Leq at 50 feet) located up to 550 feet away from the centerpoint of the existing Qualcomm Stadium and 450 feet away from the centerpoint of the new stadium site; concrete/asphalt-crushing plant (86 dBA Leq at 50 feet) centered approximately 1,000 feet east of the existing Qualcomm Stadium footprint.
• Project Site Preparation (new stadium site)– Scrapers (92 dBA Leq at 50 feet) located up to 550 feet away from the centerpoint of the existing Qualcomm Stadium and 450 feet away from the centerpoint of the new stadium site.
• Pile-driving (new stadium site) – One impact or vibratory-type pile driver (88 dBA Leq at 50 feet) as close as the perimeter of the new stadium site.
• Facility Construction (new stadium) – Pettibones and other lifts (95 dBA Leq at 50 feet) at the center of the new stadium site; concrete batch plant (80 dBA Leq at 50 feet) centered approximately 1,000 feet east of the existing Qualcomm Stadium footprint.
• Demolition of the existing Qualcomm Stadium – Fans and track hoes (86 dBA Leq at 50 feet) at the center of the existing Qualcomm Stadium footprint; concrete-crushing plant (86 dBA Leq at 50 feet) centered approximately 1,000 feet east of the existing Qualcomm Stadium footprint.
Page 34 Stadium Reconstruction Project – Noise Technical Report Stadium Reconstruction Noise Tech Rpt 8/9/2015
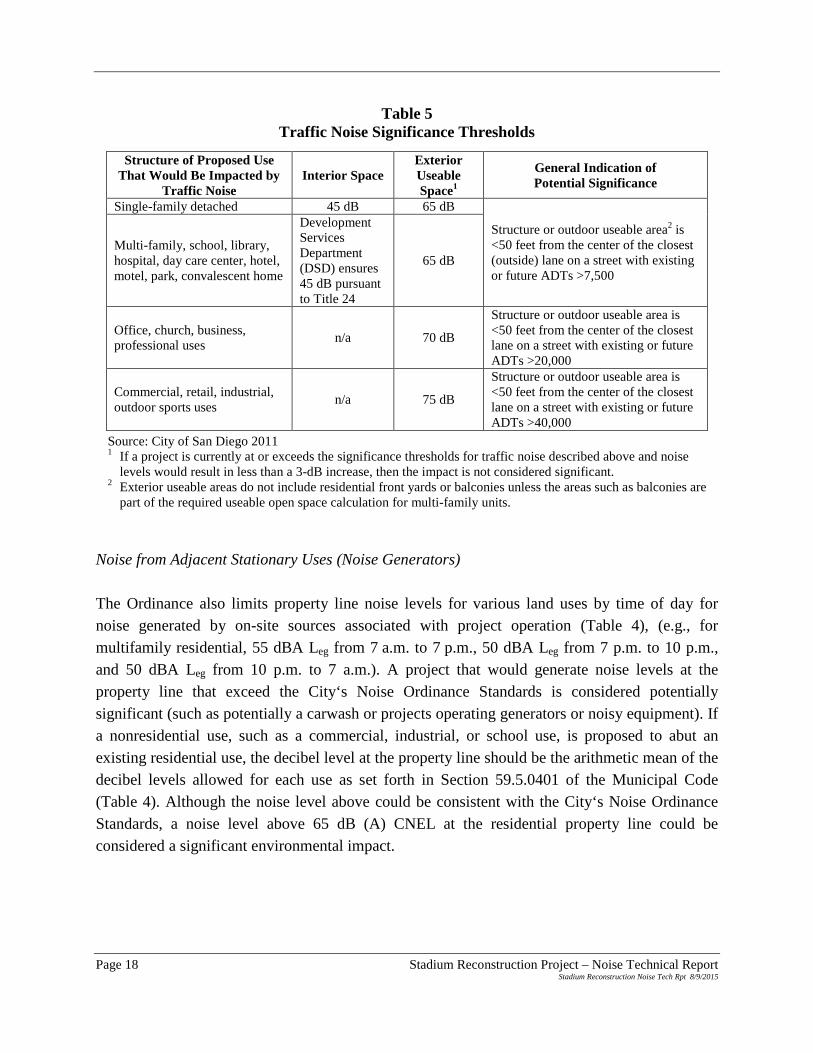
• Reconstruction of Parking Lot –Saw cutters and scrapers (92 dBA Leq at 50 feet) located as close as the Project boundary to the northern, eastern, and western sides, and no closer than 235 feet from the southern Project boundary, and not in the far southwest corner of the Project site.
Reference data from the FHWA’s Roadway Construction Noise Model User’s Guide (FHWA 2006) was used to define the sound source levels and acoustical usage factors (i.e., what percentage of time would equipment operate at full power) of construction equipment or activities indicated in the above bullets. The six construction phases listed above were assumed to occur sequentially—not concurrently. Sound propagation between these construction noise sources and the representative receivers was estimated with an Excel spreadsheet model that incorporates algorithms and data based on International Organization for Standardization (ISO) 9613-2 standards, accounting for geometric divergence and acoustical absorption from air and ground effects. Impact Analysis Project construction and demolition activities would occur on the Project site. Construction activities of the new stadium would occur in the northeast area of the Project site, with construction staging areas east of Qualcomm Stadium. The demolition of Qualcomm Stadium would occur in the center area of the Project site. Project construction noise would be generated during the following Project construction phases of:
(1) demolition of parking pavement for new stadium footprint, (2) site preparation including import and placement of fill, (3) pile driving for new stadium foundation, (4) construction of the new stadium, (5) demolition of the existing Qualcomm Stadium, and (6) reconstruction of the parking lot.
Project noise analysis is based on Project construction/demolition phases occurring separately, i.e., without overlapping. Construction and demolition noise would be localized at the specific areas of construction activity and anticipated to occur from 7 a.m. to 7 p.m. Monday through Saturday, during the allowable construction hours (i.e., within 7 a.m. to 7 p.m.) of the City’s noise ordinance. Project construction activities relating to parking lot pavement removal and/or replacement near the northern and eastern boundaries of the Project site would be closest to residences that are
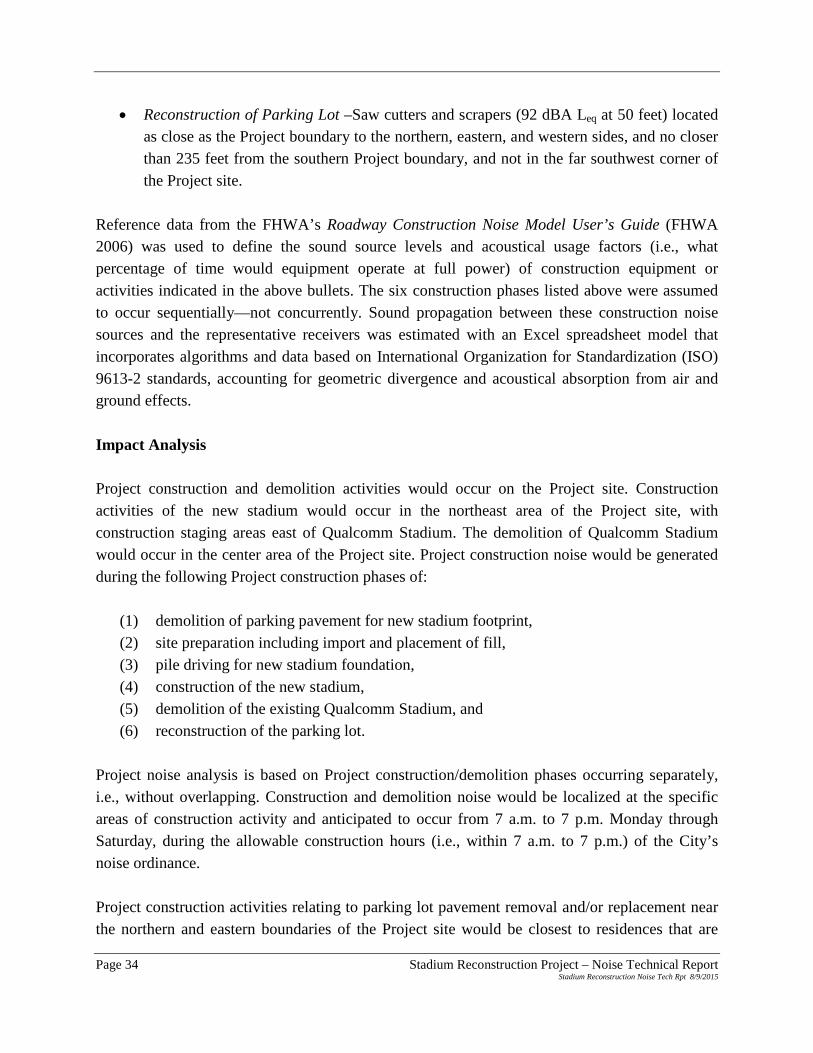
Stadium Reconstruction Project – Noise Technical Report Page 35 Stadium Reconstruction Stadium Reconstruction Noise Tech Rpt 8/9/2015
approximately 500 feet to the east (ST-1 and ST-2), approximately 600 feet to the northeast (ST-3), approximately 300 feet to the northwest (LT-3), and approximately 700 feet to the north (LT-2). Pile driving activities would be farther within the new Stadium footprint, and somewhat farther away from the nearest residences, resulting in distances from pile-driving as follows: approximately 1,050 feet to the east (ST-1); approximately 1,050 feet to the northeast (ST-3); and approximately 800 feet to the north (LT-2). Qualcomm Stadium Demolition Demolition of the existing Qualcomm Stadium would be initiated by implosion using explosives in one coordinated event. Implosion methods are very effective for bringing down tall structures that would be difficult to demolish with typical construction equipment, or are too expensive to demolish from the top downward. An implosion also reduces the length of time sensitive receptors are subject to the noise from a long duration of conventional demolition. Implosion methods use highly specialized explosives to undermine the supports of a structure so it collapses either within its own footprint or in a predetermined path. The implosion process is especially suited for high-rise buildings and special structures (e.g., stadiums, cooling towers, smokestacks, boilers, steel mill furnaces) (CEC 2014). Project-specific demolition methods and explosives for the demolition of the existing Qualcomm Stadium would be determined in a demolition plan prior to demolition. The purpose of a demolition plan is to establish methods and procedures to follow for a safe and resourceful demolition (DSI 2012). A demolition plan includes, but is not limited to:
• Structure description: dimensions, materials, and foundation.
• Demolition guidelines: permits required, utility companies notification; temporary perimeter fencing; structural survey; environmental survey (i.e., asbestos and lead-based paint); universal waste stream removal; pre-demolition meeting on-site; site security; blasting plan; dust suppression methods; and debris handing, sorting, reuse, stockpiling, transport, hauling, and disposal location at an appropriate landfill.
• Safety procedures: public protection, fire protection and prevention.
• Daily housekeeping procedures.
• Worker personal protective equipment.
• Waste streams collection: debris, masonry, metals, universal waste.

Page 36 Stadium Reconstruction Project – Noise Technical Report Stadium Reconstruction Noise Tech Rpt 8/9/2015
• Emergency procedures and contacts.
• Public notifications and complaint process.
• Applicable federal, state, and local laws and regulations. The noise level of the implosion event would be specific to the methods used and parameters such as charge weight, delay, and position that are not known at this time. However, implosion of concrete structures has resulted in maximum noise levels in the range of 120 to 135 dB at the source, which last only a brief period of time (typically less than 8 seconds), with human safety standoff distance of approximately 1,000 feet during the implosion (AED 2011). Since the implosion event would be under 1 minute; the 1-hour average daytime noise level (Leq) would not increase substantially due to the implosion event itself. Demolition noise levels would be predominantly from the continuous sorting, collecting, crushing, and hauling of demolished materials using heavy equipment, as previously calculated and discussed. Construction Vehicle Traffic Construction noise would be generated off-site by Project construction-related vehicle traffic trips to and from the job site on local roadways including daily worker commute vehicle trips and by heavy truck trips from construction equipment and materials deliveries, import of fill material (approximately 490,000 cy (24,500 truck trips)), export of excavated material from the new stadium footprint (approximately 920,000 cy [48,091 trips]), and export of demolished concrete from the Qualcomm Stadium and demolished asphalt from the parking lot (totaling approximately 54,000 cy [5,400 trips]). These hauling phases would not overlap; therefore, the export of excavated material (approximately 920,000 cy [48,091 trips]) would be the worst-case hauling scenario based on number of truck trips required within the required schedule and would equate to:
• Assuming a 16-week schedule to haul the import fill, 6 construction days per week, over an 8-hour day, equates to 125 truck roundtrips per hour.
• Adjusting 125 truck trips to equivalent passenger vehicles, results in approximately 375 equivalent passenger vehicles.
The proposed truck haul route would leave the Project site through the main gate of the Project site and travel east along Friars Road to its interchange with I-15. Vehicle traffic on Friars Road is approximately 41,800 annual average daily traffic (AADT) (SANDAG 2015) or 1,742 average hourly traffic volume, which would increase by 375 for a total increased volume of 2,117, or a

Stadium Reconstruction Project – Noise Technical Report Page 37 Stadium Reconstruction Stadium Reconstruction Noise Tech Rpt 8/9/2015
22 percent increase. Doubling of traffic volumes (i.e., a 100 percent increase) results in a 3 dB increase, which is barely perceptible to the human ear. The worse-case Project construction truck traffic increase of 22 percent during the hauling of excavated material would result in a 0.9 dBA Leq increase in noise levels along, i.e., Friars Road, which is not a perceivable change in noise level. Construction Impact Summary Ambient Noise Levels Estimated construction noise levels for each phase were calculated at each receptor and logarithmically added to the measured existing ambient noise levels (from Table 7). These log-summed ambient-plus-construction noise levels were then compared to the measured existing ambient noise levels to determine the net increase ambient noise levels at each receptor due to construction noise. The net increase was then compared to the threshold for a substantial temporary increase in ambient noise levels of 10 dBA Leq or greater. The temporary net increase in ambient noise levels at each receptor for a weekday is shown in Table 9.
Table 9 Temporary Net Increase in Ambient Noise Levels, Weekday
Receptor Location ID
Increase over Existing Ambient, per Phase, on weekdayy Daytime Phase 1
Demolish Parking Area for
New Stadium
Phase 2 Site Prep for New Stadium
Phase 3 Pile Driving
for New Stadium
Phase 4 Construct New
Stadium
Phase 5 Demolish
Qualcomm Stadium (excludes blasting)
Phase 6 Construct
New Stadium Parking
LT-2 2 4 2 3 1 3 LT-3 1 2 1 1 2 15 LT-4 0 0 0 0 0 0 ST-1 3 3 1 4 3 8 ST-2 0 0 0 0 0 1 ST-3 0 1 0 1 0 2 ST-4 2 3 1 3 2 5 ST-5 2 4 1 2 4 22 ST-7 3 5 1 3 5 13
All increase values expressed as dBA Leq Exceedance is shown in bold. As shown in Table 9, daytime construction noise levels resulted in substantial predicted increases in ambient noise levels during the daytime on a weekday at locations LT-3, ST-5 and ST-7.

Page 38 Stadium Reconstruction Project – Noise Technical Report Stadium Reconstruction Noise Tech Rpt 8/9/2015
As shown in Table 10, daytime construction noise levels resulted in substantial predicted increases in ambient noise levels during the daytime on Saturday at locations LT-3, ST-1 and ST-5. Detailed spreadsheet calculations are provided in Appendix A.
Table 10 Temporary Net Increase in Ambient Noise Levels, Saturdays
Receptor Location ID
dBA Increase over Existing Ambient, per Phase, on Saturday Daytime Phase 1
Demolish Parking Area for
New Stadium
Phase 2 Site Prep for New Stadium
Phase 3 Pile Driving
for New Stadium
Phase 4 Construct New
Stadium
Phase 5 Demolish
Qualcomm Stadium (excludes blasting)
Phase 6 Construct
New Stadium Parking
LT-2 2 4 2 3 1 4 LT-3 0 1 0 1 1 10 LT-4 0 0 0 0 0 0 ST-1 4 4 2 5 4 10 ST-2 0 0 0 0 0 2 ST-3 0 1 0 1 0 2 ST-4 3 5 2 5 4 8 ST-5 1 2 0 1 2 17 ST-7 0 1 0 0 1 4
All increase values expressed as dBA Leq Exceedance is shown in bold. In summary, project construction noise levels would result in a substantial temporary net increase in ambient noise levels during Project construction activities at some noise-sensitive receptors in proximity to construction activities as shown in Tables 9 and 10. This is a significant impact. The increase in traffic volume due to Project construction-related traffic would result in a less than 1 dBA Leq increase in noise levels along adjacent roadways, which is not considered a perceivable change in noise level. This is a less than significant impact. Noise Standards Project construction noise impacts would also be significant if the Project would exceed the City’s noise ordinance limits for construction noise levels of 75 dBA Leg at the affected residential property line during the allowable construction hours of 7 a.m. to 7 p.m. Monday through Saturday. Project construction activities at the northeastern boundary of the new stadium site would be closest to the residences located approximately 500 feet to the east (ST-1 and

Stadium Reconstruction Project – Noise Technical Report Page 39 Stadium Reconstruction Stadium Reconstruction Noise Tech Rpt 8/9/2015
ST-2); approximately 600 feet to the northeast (ST-3); approximately 300 feet to the northwest (LT-3); and approximately 700 feet to the north (LT-2). Daytime construction noise levels for each construction phase were calculated at each receptor, as shown in Table 11, and compared to the City’s construction noise level limit of 75 dBA Leg at affected residential property lines during the allowable construction hours of 7 a.m. to 7 p.m. Monday through Saturday.
Table 11 Construction Noise Levels at Receptors
Receptor Location
ID
Construction Noise (dBA Leg) at Receptor, per Phase Phase 1
Demolish Parking Area
for New Stadium
Phase 2 Site Prep for
New Stadium
Phase 3 Pile Driving
for New Stadium
Phase 4 Construct
New Stadium
Phase 5 Demolish
Qualcomm Stadium (excludes
blasting)
Phase 6 Construct
New Stadium Parking
LT-2 61 64 59 62 57 64 LT-3 53 57 50 55 57 74 LT-4 49 52 44 51 53 53 ST-1 60 61 56 63 60 68 ST-2 57 57 53 61 59 67 ST-3 59 61 57 61 58 67 ST-4 53 57 52 57 55 61 ST-5 55 59 49 55 58 79 ST-7 50 54 45 51 54 64
All noise levels expressed as dBA Leg Exceedance is shown in bold. As shown in Table 11 daytime construction noise levels would not exceed City’s construction noise level limit of 75 dBA Leg at all receptors during all construction phases. The only exception is ST-5 during Phase 6. This would be a significant impact. Detailed calculations are provided in as Appendix A. 6.2 VIBRATION Potential vibration impacts may occur from Project construction activities including pavement demolition, site excavation and surface grading, new stadium construction, and demolition of the existing Qualcomm Stadium. Although it is possible for vibrations from construction projects to cause building damage, the vibrations from construction activities are almost never of sufficient amplitude to cause more than minor cosmetic damage to buildings (FTA 2006). Groundborne vibration generated by construction projects is usually highest during pile driving, soil

Page 40 Stadium Reconstruction Project – Noise Technical Report Stadium Reconstruction Noise Tech Rpt 8/9/2015
compacting, jackhammering, and demolition-related activities. Table 12 shows typical vibration levels for various pieces of construction equipment that generate high vibration levels (FTA 2006).
Table 12 Construction Equipment Vibration Levels
Equipment PPV
at 25 Feet (in/sec)
Pile Driver (impact) Upper range 1.518 Typical 0.644
Pile Driver (sonic) Upper range 0.734 Typical 0.170
Hydromill (slurry wall) Soil 0.008 Rock 0.017
Clam Shovel Drop (slurry wall) 0.202 Vibratory Roller 0.210 Hoe Ram 0.089 Large Bulldozer 0.089 Caisson Drilling 0.089 Loaded Trucks 0.076 Jackhammer 0.035 Small Bulldozer 0.003
Source: FTA 2006 As shown in Table 12, vibration levels at 25 feet from construction equipment, with the exception of pile drivers, are at or below the threshold of risk of structural damage (0.2 ppv in/sec). At distances beyond 65 feet, vibration levels would be below the threshold of risk of structural damage and below the threshold for human perception (0.1 ppv in/sec) beyond 80 feet. Structures in proximity to the Project are located approximately 400 feet or greater from where major construction activities would occur. The KMEP MVT on the north side of San Diego Mission Road is located 400 feet from where the nearest pile driving would occur. At this distance, vibration from pile driving (approximately 1.5 in/sec ppv at 25 feet) would attenuate to 0.02 in/sec ppv, which is substantially below the vibration threshold of 0.12 in/sec ppv for structural damage (FTA 2006). Therefore, groundborne vibration generated by construction of the Project would not be perceptible at nearby people or houses and would not result in cosmetic or structural damage to nearby structures. Vibration from Project construction would not expose people or structures to excessive vibration levels that would result in structural damage or human annoyance. This is a less than significant impact.
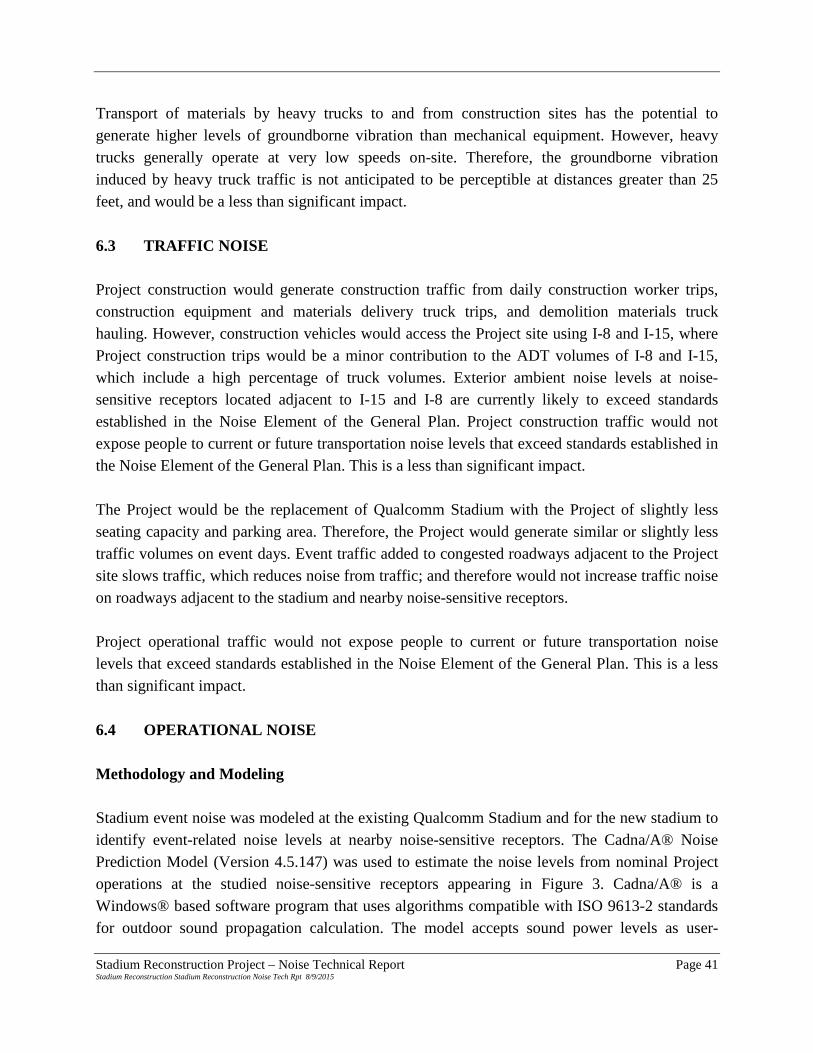
Stadium Reconstruction Project – Noise Technical Report Page 41 Stadium Reconstruction Stadium Reconstruction Noise Tech Rpt 8/9/2015
Transport of materials by heavy trucks to and from construction sites has the potential to generate higher levels of groundborne vibration than mechanical equipment. However, heavy trucks generally operate at very low speeds on-site. Therefore, the groundborne vibration induced by heavy truck traffic is not anticipated to be perceptible at distances greater than 25 feet, and would be a less than significant impact. 6.3 TRAFFIC NOISE Project construction would generate construction traffic from daily construction worker trips, construction equipment and materials delivery truck trips, and demolition materials truck hauling. However, construction vehicles would access the Project site using I-8 and I-15, where Project construction trips would be a minor contribution to the ADT volumes of I-8 and I-15, which include a high percentage of truck volumes. Exterior ambient noise levels at noise-sensitive receptors located adjacent to I-15 and I-8 are currently likely to exceed standards established in the Noise Element of the General Plan. Project construction traffic would not expose people to current or future transportation noise levels that exceed standards established in the Noise Element of the General Plan. This is a less than significant impact. The Project would be the replacement of Qualcomm Stadium with the Project of slightly less seating capacity and parking area. Therefore, the Project would generate similar or slightly less traffic volumes on event days. Event traffic added to congested roadways adjacent to the Project site slows traffic, which reduces noise from traffic; and therefore would not increase traffic noise on roadways adjacent to the stadium and nearby noise-sensitive receptors. Project operational traffic would not expose people to current or future transportation noise levels that exceed standards established in the Noise Element of the General Plan. This is a less than significant impact. 6.4 OPERATIONAL NOISE Methodology and Modeling Stadium event noise was modeled at the existing Qualcomm Stadium and for the new stadium to identify event-related noise levels at nearby noise-sensitive receptors. The Cadna/A® Noise Prediction Model (Version 4.5.147) was used to estimate the noise levels from nominal Project operations at the studied noise-sensitive receptors appearing in Figure 3. Cadna/A® is a Windows® based software program that uses algorithms compatible with ISO 9613-2 standards for outdoor sound propagation calculation. The model accepts sound power levels as user-

Page 42 Stadium Reconstruction Project – Noise Technical Report Stadium Reconstruction Noise Tech Rpt 8/9/2015
defined input parameters for sources of sound emission. The software’s calculations account for classical sound wave geometric divergence, plus attenuation factors resulting from air absorption, basic ground effects, and barrier/shielding. To account for terrain effects, available topographical data was incorporated into Cadna/A® as part of the three-dimensional (3D) model space. In the case of this operational noise analysis, the existing Qualcomm Stadium and the new stadium were both rendered as a tall, round barrier with three stacked decks of horizontal area sources within, each pitched to resemble the existing seating area architecture and arrangement. For four typical events studied, as listed below, each seating area was populated with shouting attendees at a density reflecting actual or average attendance (from publicly available online sources) including:
• NFL – San Diego Chargers home football game (average 2014 season attendance = 65,432) (ESPN 2015)
• College – SDSU Aztecs football game (average 2014 season attendance = 32,294) (SDSU 2015)
• AMA SX event (2014 attendance = 56,828) (San Diego Supercross 2015)
• Concert (using recent July 9, 2015 One Direction event attendance = 52,831) (San Diego Union Tribune 2015)
For an NFL game, a college football game, and an SX event, Cadna/A-modeled crowd noise was calibrated with “crow’s nest” location measurement data from an NFL game at Candlestick Park as appearing in Appendix K of the 49ers Santa Clara Stadium Project Draft EIR (City of Santa Clara 2009). This information was used because it provides a representative noise venue. This measurement data from the Candlestick Park noise study includes acoustical contribution from fireworks, cheering (with notable rises in sound level during touchdowns), and nominal stadium audio/visual system operation. Such calibrated crowd noise was also applied to the prediction model of noise emission from an SX event, to which the noise from motorcycles on a closed-circuit track within the Stadium was added. Sound measurements taken within the stadium during the One Direction concert (CV-1, CV-2, and CV-3) provided data to help calibrate the Cadna/A model of crowd noise and amplified music for such an event. The concert model also accounted for the partial seating deck usage and the addition of a floor-level attendee area. Cadna/A-modeled predictions of noise, without contribution of nearby roadway traffic, were then logarithmically added to representative time

Stadium Reconstruction Project – Noise Technical Report Page 43 Stadium Reconstruction Stadium Reconstruction Noise Tech Rpt 8/9/2015
periods of measured traffic noise levels, so that Project-plus-traffic ambient sound levels can be compared between two categories of cases: (1) events at the existing Qualcomm stadium, and (2) potential future events at the new stadium. Impact Analysis Ambient Noise Levels Project operation would generate operational noise levels similar to those from the exiting Qualcomm Stadium. However, the new stadium would be located in the northeast corner of the existing Qualcomm Stadium parking lot, closer to noise-sensitive receptors located to the east (ST-1), northeast (ST-3), and north (LT-2). For all of the event scenarios modeled at the existing Qualcomm Stadium and the new stadium, the net increase in ambient noise levels at all of the ambient monitoring locations (i.e., residences) was less than the significance threshold of a 3 dBA Leq or greater increase for a significance permanent increase in ambient noise levels, except at LT-2 from a concert event at the new stadium, which results in a 4 dBA Leq increase. Based on this operations noise analysis, this 4 dBA Leq increase at the noise-sensitive receiver represented by LT-2 is a significant and unavoidable noise impact. In addition to evaluating Project impacts based on the 1-hour average (Leq ), an analysis was performed based on day-night average (CNEL) and a significant permanent increase is defined as a direct Project-related permanent ambient increase of 3 dBA or greater, where exterior noise levels would already exceed the City’s significant threshold (i.e., 65 dBA CNEL daytime for single-family residential land uses) (City of San Diego 2011). In this case, the predicted operations noise from the existing Qualcomm Stadium and the Project were considered with respect to an entire diurnal cycle and not merely the anticipated duration of a typical event in progress. At all nine nearby representative locations (LT-2, LT-3, LT-4, ST-1, ST-2, ST-3, ST-4, ST-5, ST-7), the net increase in CNEL is expected to be less than 3 dBA and would be considered less than significant for all four types of studied events (NFL game, SDSU Aztecs game, SX, concert). While both operation noise impact assessment methods predictively evaluate the net outdoor ambient increment due to the Project, this noise analysis recommends adoption of Leq metric usage as a more conservative approach to determining potential impacts and potential noise mitigation need. Hence, the net ambient noise increment involving Project operation predicted at LT-2 is a significant impact and unavoidable impact. Noise Standards

Page 44 Stadium Reconstruction Project – Noise Technical Report Stadium Reconstruction Noise Tech Rpt 8/9/2015
The City’s noise ordinance limits operational noise levels at and beyond property lines for various land uses by time of day for noise generated by on-site sources associated with Project operation (Table 4) (e.g., 50 dBA Leg for single-family residential from 7 a.m. to 7 p.m., and 45 dBA Leg from 7 p.m. to 10 p.m.). Based on ambient noise levels measured for the Project (Table 7), ambient noise levels at noise-sensitive receptors to the east (ST-1 and ST-2), northeast (ST-3), and north (LT-2) currently exceed the sound level limits of the City’s Noise Ordinance (Table 4). In addition, as discussed above in the Ambient Noise Levels section, under all of the event scenarios modeled at the existing Qualcomm Stadium and at the new stadium, the net increase in ambient noise levels at all of the ambient monitoring locations (i.e., residences) resulted in a less than significant increase in ambient noise levels (i.e., less than a 3 dBA Leq increase), except at LT-2 where a 4 dBA Leq increase was predicted to occur from a concert event at the Project site. Therefore, Project operational noise levels (i.e., during stadium events) would exceed the operational noise levels of the City’s noise ordinance at a residential property line by time of day for noise generated by on-site sources associated with Project operation. This is a significant impact. Noise Level Contours To help illustrate the anticipate potential changes in the outdoor ambient sound environment in the vicinity of the Project, Figures 4 and 5 provide modeled noise level contours at the existing Qualcomm Stadium and at the nearest residences in the surrounding area for non-event and event days, respectively. The depiction of noise contours in Figure 4 represents only the predicted acoustical contribution of nearby road traffic noise and does not account for other sources in the outdoor ambient environment. However, based on available AADT volumes (Caltrans 2015; SANDAG 2015) this traffic noise was modeled to yield Leq values that are within ±3 dBA of the measured values at the long-term locations from the field survey of existing ambient noise. Figure 5 depicts the added acoustical contribution of the typical NFL game to the traffic-only noise of Figure 4. The noise contours of Figure 6 present the predicted acoustical combination of modeled road traffic and noise during a typical NFL game from the new stadium position.

Page x-xx
#*
#*
#*
#*
")
")
")
")
")
")
$+
$+
$+
")
!"a$
!"_$
%&s(
80dB
A
60dBA
50d
BA
80dBA
80dBA
60dBA
60d
BA
60dBA
80d
BA
60d
BA
80dBA
60dB
A
60dBA
80dBA
80dB
A
80dBA
80dB
A
80dBA
60dB
A50
dB
A
80dB
A
80dBA
50d
BA
80dBA
80dBA
80dBA
60dBA
80dBA
80d
BA
60dB
A
80dBA
60dBA
80d
BA
60dB
A
ST-7
CV-3
CV-2
CV-1
ST-4
ST-6
ST-5
ST-3
ST-2
ST-1
LT-4
LT-3
LT-2
LT-1
Friars
Rd
CAMIN
O Del
Rio
San Diego Mission Rd
Ra
nc
ho
Mi s
sio
n R
d
Fenton Pky
No
rth
sid
e D
r
Rio San Diego Dr
Ronda Ave
Mis
sio
n V
il lag
e D
r
Wa
rd R
d
Bartel St
River R
un Dr
Caminito Cascara
Mission
City P
ky
Palisades Rd
Mel
bourne
Dr M
on
ette Dr
Old
Qua
rry
Rd
R R
un D
r
Eileen Dr
Ha
rco
urt D
r
Ca
min
ito
Yu
ca
tan
Caminito Cuervo
Mobley St
Ray
mel
l Dr
Scheidler Way
Ca
min
ito
Ele
ga
nte
CAMINO Del R
io
Friars
Rd
Rio
San
Die
go D
r
Source: NAIP 2014.
Scale: 1 = 8,400; 1 inch = 700 feet
Figure 4Predicted Daytime Ambient
Noise Level Contours
700 0 700350 Feet
IStadium Reconstruction Project - Noise Technical Report
LEGEND
Project Site
Measurement Locations
$+ Concert Venue (CV)
#* Long-Term (LT)
") Short-Term (ST)
Predicted Noise Level Contours
50 dBA
60 dBA
70 dBA
80 dBA
Intermediate Contour
Path
: P:\_
6043
\604
3188
5_SD
_Sta
dium
EIR\
900-
CAD
-GIS
\920
GIS
\922
_Map
s\N
oise
\Fig
4_St
adiu
m_N
oise
Con
tour
s.m
xd,
7/27
/201
5, D
anie
l_Ar
ella
no

Page 46 Stadium Reconstruction Project – Noise Technical Report Stadium Reconstruction Noise Tech Rpt 8/9/2015
This page intentionally left blank.

Page x-xx
#*
#*
#*
#*
")
")
")
")
")
")
$+
$+
$+
")
!"a$
!"_$
%&s(
80d
BA
70dB
A
60d
BA
50d
BA
60dBA
80dBA
60dB
A
70dBA
70dBA
60dB
A
80dB
A
60dB
A
60dB
A
50d
BA
5 0d
BA
70dBA
50dB
A
70dB
A
80dBA
70dBA
80dB
A
80dBA
80d
BA
70dB
A
60dB
A
70dBA
70dBA
70dBA
70d
BA
60dBA
70dBA
60dBA
60dBA
ST-7
CV-3
CV-2
CV-1
ST-4
ST-6
ST-5
ST-3
ST-2
ST-1
LT-4
LT-3
LT-2
LT-1
Friars
Rd
CAMIN
O Del
Rio
San Diego Mission Rd
Ra
nc
ho
Mi s
sio
n R
d
Fenton Pky
No
rth
sid
e D
r
Rio San Diego Dr
Ronda Ave
Mis
sio
n V
il lag
e D
r
Wa
rd R
d
Bartel St
River R
un Dr
Caminito Cascara
Mission
City P
ky
Palisades Rd
Mel
bourne
Dr M
on
ette Dr
Old
Qua
rry
Rd
R R
un D
r
Eileen Dr
Wils
hir
e D
r
Ha
rco
urt D
r
Ca
min
ito
Yu
ca
tan
Caminito Cuervo
Mobley St
Ray
mel
l Dr
Scheidler Way
Ca
min
ito
Ele
ga
nte
Friars
Rd
CAMINO Del R
io
Rio
San
Die
go D
r
Source: NAIP 2014.
Scale: 1 = 8,400; 1 inch = 700 feet
Figure 5Predicted Daytime Ambient plus Typical NFL Game Event Existing Location
Noise Level Contours
700 0 700350 Feet
IStadium Reconstruction Project - Noise Technical Report
LEGEND
Project Site
Measurement Locations
$+ Concert Venue (CV)
#* Long-Term (LT)
") Short-Term (ST)
Predicted Noise Level Contours
50 dBA
60 dBA
70 dBA
80 dBA
Intermediate Contour
Path
: P:\_
6043
\604
3188
5_SD
_Sta
dium
EIR\
900-
CAD
-GIS
\920
GIS
\922
_Map
s\N
oise
\Fig
5_St
adiu
m_N
oise
Con
tour
s_N
FLex
istin
g.m
xd,
7/27
/201
5, D
anie
l_Ar
ella
no

Page 48 Stadium Reconstruction Project – Noise Technical Report Stadium Reconstruction Noise Tech Rpt 8/9/2015
This page intentionally left blank.

Page x-xx
#*
#*
#*
#*
")
")
")
")
")
")
$+
$+
$+
")
!"a$
!"_$
%&s(
80d
BA
70dBA
60dB
A
50d
BA
60dBA
80d
BA
60 dB
A
70dBA
60dBA
80dB
A
60dB
A 70d
BA
60dBA
60dBA
50d
BA
5 0d
BA
70dBA
50dB
A
70dBA
80d
BA
70dBA
80dB
A
80dBA
80d
BA
70dBA
60d
BA
70dBA
70dBA
70dB
A
70dB
A
60dB
A
70dBA
60dBA
ST-7
CV-3
CV-2
CV-1
ST-4
ST-6
ST-5
ST-3
ST-2
ST-1
LT-4
LT-3
LT-2
LT-1
Friars
Rd
CAMIN
O Del
Rio
San Diego Mission Rd
Ra
nc
ho
Mi s
sio
n R
d
Fenton Pky
No
rth
sid
e D
r
Rio San Diego Dr
Ronda Ave
Mis
sio
n V
il lag
e D
r
Wa
rd R
d
Bartel St
River R
un Dr
Caminito Cascara
Mission
City P
ky
Palisades Rd
Mel
bourn
e Dr M
on
ette Dr
Old
Qua
rry
Rd
R R
un D
r
Eileen Dr
Ha
rco
urt D
r
Ca
min
ito
Yu
ca
tan
Caminito Cuervo
Mobley St
Ray
mel
l Dr
Scheidler Way
Ca
min
ito
Ele
ga
nte
Friars
Rd
CAMINO Del R
io
Rio
San
Die
go D
r
Source: NAIP 2014.
Scale: 1 = 8,400; 1 inch = 700 feet
Figure 6Predicted Daytime Ambient plus Typical NFL Game Event Proposed Location
Noise Level Contours
700 0 700350 Feet
IStadium Reconstruction Project - Noise Technical Report
LEGEND
Project Site
Measurement Locations
$+ Concert Venue (CV)
#* Long-Term (LT)
") Short-Term (ST)
Predicted Noise Level Contours
50 dBA
60 dBA
70 dBA
80 dBA
Intermediate Contour
Path
: P:\_
6043
\604
3188
5_SD
_Sta
dium
EIR\
900-
CAD
-GIS
\920
GIS
\922
_Map
s\N
oise
\Fig
6_St
adiu
m_N
oise
Con
tour
s_N
FLpr
opos
ed.m
xd,
7/27
/201
5, D
anie
l_Ar
ella
no

Page 50 Stadium Reconstruction Project – Noise Technical Report Stadium Reconstruction Noise Tech Rpt 8/9/2015
This page intentionally left blank.

Stadium Reconstruction Project – Noise Technical Report Page 51 Stadium Reconstruction Stadium Reconstruction Noise Tech Rpt 8/9/2015
7.0 MITIGATION MEASURES 7.1 MITIGATION MEASURES The noise reduction measures provided below are for the purpose of reducing and minimizing Project operation and construction noise. 7.1.1 Operation The following operation noise reduction measure is required to reduce and minimize noise levels during Project operation associated with an event in progress.
• NOI-1 (Implement Sound Amplification Controls) – Incorporate electronic controls or limits into the final design of the new stadium’s audio/visual sound system, as well as tie-ins from hosted performers to control amplified speech and music noise at the source, and thus offer some degree of expected sound-level reduction at the potentially affected receiver position.
7.1.2 Construction Noise Reduction Measures The following typical construction noise reduction measures are required to reduce and minimize noise levels during construction, including, but not limited to:
• NOI-2 (Implement Noise Complaint Reporting) – The Project (via construction contractor) would establish a telephone hot-line for use by the public to report any significant adverse noise conditions associated with the construction and operation of the Project. If the telephone is not staffed 24 hours per day, the contractor shall be required to include an automatic answering feature, with date and time stamp recording, to answer calls when the phone is unattended. This hot-line telephone number shall be posted at the Project site during construction in a manner visible to passersby. This telephone number shall be maintained until the Project has been considered commissioned and ready for operation.
• NOI-3 (Implement Noise Complaint Investigation) – Throughout the construction of the Project, the contractor shall be required to document, investigate, evaluate, and attempt to resolve all Project-related noise complaints. The contractor or its authorized agent shall be required to:

Page 52 Stadium Reconstruction Project – Noise Technical Report Stadium Reconstruction Noise Tech Rpt 8/9/2015
o Use a Noise Complaint Resolution Form to document and respond to each noise complaint;
o Contact the person(s) making the noise complaint within 24 hours;
o Conduct an investigation to attempt to determine the source of noise related to the complaint; and
o Take all reasonable measures to reduce the noise at its source.
• NOI-4 (Implement Construction Practices) – The following are typical field techniques for reducing noise from construction activities, with the purpose of reducing aggregate construction noise levels at nearby noise-sensitive receivers:
o To the extent practical and unless safety provisions require otherwise, adjust all audible back-up alarms downward in sound level, reflecting locations that have expected lower background level, while still maintaining adequate signal-to-noise ratio for alarm effectiveness. Consider signal persons and strobe lights, or alternative safety equipment and/or processes as allowed, for reducing reliance on high-amplitude sonic alarms.
o Place stationary noise sources, such as generators and air compressors, on the Project site away from affected noise-sensitive receivers. Place non-noise-producing mobile equipment such as trailers in the direct sound pathways between suspected major noise-producing sources and sensitive receivers.
• NOI-5 (Implement Equipment Noise Reduction) – The following are typical practices for construction equipment selection (or preferences) and expected function that can help reduce noise.
o Use concrete crushers or pavement saws rather than impact devices such as jackhammers, pavement breakers, and hoe rams for tasks such as concrete or asphalt demolition and removal.
o Pneumatic impact tools and equipment used at the construction site shall have intake and exhaust mufflers recommended by the manufacturers thereof, to meet relevant noise limitations.
o Provide impact noise producing equipment (i.e., jackhammers and pavement breaker[s]) with noise attenuating shields, shrouds or portable barriers or enclosures, to reduce operating noise.

Stadium Reconstruction Project – Noise Technical Report Page 53 Stadium Reconstruction Stadium Reconstruction Noise Tech Rpt 8/9/2015
o Line or cover hoppers, storage bins, and chutes with sound-deadening material (e.g., apply wood or rubber liners to metal bin impact surfaces).
o Provide upgraded mufflers, acoustical lining, or acoustical paneling for other noisy equipment, including internal combustion engines.
o Use alternative procedures of construction and select a combination of techniques that generate the least overall noise and vibration.
o Use construction equipment manufactured or modified to reduce noise and vibration emissions, such as:
Electric instead of diesel-powered equipment.
Hydraulic tools instead of pneumatic tools.
Electric saws instead of air- or gasoline-driven saws.

Page 54 Stadium Reconstruction Project – Noise Technical Report Stadium Reconstruction Noise Tech Rpt 8/9/2015
This page intentionally left blank.

Stadium Reconstruction Project – Noise Technical Report Page 55 Stadium Reconstruction Stadium Reconstruction Noise Tech Rpt 8/9/2015
8.0 REFERENCES AECOM, Inc. 2015a. Biological Technical Report, City of San Diego Stadium Reconstruction
Project, City of San Diego, California. July. AECOM, Inc. 2015b. Draft Traffic Impact Analysis Report, Stadium Replacement EIR, City of
San Diego, California. July. Advanced Explosives Demolition (AED). 2011. Community Notice: Implosion of Keystone
Towers, Indianapolis, Indiana. August 28. Available at http://www.indy.gov/ eGov/City/DMD/Documents/CD/Community%20Notice-Keystone%20Towers.pdf.
California Department of Transportation (Caltrans). 2002. Transportation Related Earthborne
Vibrations (Caltrans Experiences). February 20. California Department of Transportation (Caltrans). 2011. Traffic Noise Analysis Protocol for
New Highway and Reconstruction Projects, including Technical Noise Supplement. May. Available at http://www.dot.ca.gov/hq/env/noise/pub/ca_tnap_may2011.pdf.
California Department of Transportation (Caltrans). 2013. Technical Noise Supplement to the
Traffic Noise Analysis Protocol. Table 2-5 Typical Noise Levels, page 2-20. September. Available at http://www.dot.ca.gov/hq/env/noise/pub/TeNS_Sept_2013B.pdf.
California Department of Transportation (Caltrans). 2015. Annual Daily Traffic Volumes. July.
Available at http://traffic-counts.dot.ca.gov/. California Energy Commission (CEC). 2014. ACE Project Decommissioning Plan. November
25. Available at http://www.energy.ca.gov/business_meetings/2015_packets/2015-06-10/Item_04_Argus_Cogeneration_Expansion/ACE_Decommissioning_Plan.pdf
City of San Diego. 2008. City of San Diego General Plan, Noise Element. March. Available at
http://www.sandiego.gov/planning/genplan/pdf/generalplan/adoptednoiseelem.pdf. City of San Diego. 2010. San Diego Municipal Code, Chapter 5, Article 9.5, Division 4, Noise
Ordinance. July. Available at http://docs.sandiego.gov/municode/MuniCodeChapter05/ Ch05Art9.5Division04.pdf.

Page 56 Stadium Reconstruction Project – Noise Technical Report Stadium Reconstruction Noise Tech Rpt 8/9/2015
City of San Diego. 2011. California Environmental Quality Act (CEQA) Significance Determination Thresholds, Development Services Department. January. Available at http://www.sandiego.gov/development-services/pdf/news/sdtceqa.pdf.
City of Santa Clara. 2009. Draft Environmental Impact Report, 49ers Santa Clara Stadium
Project. Appendix K: 49ers Stadium Project Environmental Noise Assessment. July. Available at http://santaclaraca.gov/modules/showdocument.aspx?documentid=12782.
Demolition Services, Inc. (DSI). 2012. Demolition and Disposal Plan, 4825 Glenbrook Road, NW,
Washington, D.C. February 17. Available at http://www.nab.usace.army.mil/Portals/63/ docs/SpringValley/Glenbrook_Rd._Demolition_and_Disposal_Plan.pdf.
ESPN. 2015. Available at http://espn.go.com/nfl/attendance. Last accessed July 17, 2015. Federal Highway Administration (FHWA). 2006. Roadway Construction Noise Model User’s
Guide, FHWA-HEP-05-054. Available at http://www.fhwa.dot.gov/environment/noise/ construction_noise/rcnm/rcnm.pdf. Last accessed July 17, 2015.
Federal Transit Administration (FTA). 2006. Transit Noise and Vibration Impact Assessment.
Washington, D.C. May. Available at http://www.fta.dot.gov/documents/FTA_Noise_and_ Vibration_Manual.pdf.
International Organization for Standardization (ISO). 1996. Acoustics – Attenuation of sound
during propagation outdoors – Part 2: General method of calculation. ISO 9613-2:1996(E).
Ldn Consulting, Inc. 2011. Noise Assessment University District Rock Crusher, Conditional Use
Permit, City of San Marcos. August 2011. Available at http://www.ci.san-marcos.ca.us/ Modules/ShowDocument.aspx?documentid=4516.
San Diego Association of Governments (SANDAG). 2015. Average Daily Traffic Volumes.
Available at http://www.sandag.org/resources/demographics_and_other_data/ transportation/adtv/index.asp. Last accessed July 17, 2015.
San Diego Chargers. 2015. San Diego Chargers website, gameday information. Available at
http://www.chargers.com/gameday/attending-a-home-game.

Stadium Reconstruction Project – Noise Technical Report Page 57 Stadium Reconstruction Stadium Reconstruction Noise Tech Rpt 8/9/2015
San Diego County Regional Airport Authority (SDCRAA). 2010. Montgomery Field Airport, Airport Land Use Compatibility Plan. December 20. Available at http://www.san.org/DesktopModules/Bring2mind/DMX/Download.aspx?EntryId=2985&Command=Core_Download&language=en-US&PortalId=0&TabId=307.
San Diego County Regional Airport Authority (SDCRAA). 2014. San Diego International
Airport, Airport Land Use Compatibility Plan. May 1. Available at http://www.san.org/ DesktopModules/Bring2mind/DMX/Download. aspx?EntryId=2990&Command=Core_ Download&language=en-US&PortalId=0&TabId=180.
San Diego State University (SDSU). 2015. Available at http://www.goaztecs.com/sports/m-
footbl/spec-rel/sdsu-m-footbl-CumulativeStats. html.
San Diego Supercross. 2015. Available at http://www.race-dezert.com/forum/threads/san-diego-
supercross-2015.118771/. Last accessed July 17, 2015. San Diego Union Tribune. 2015. Available at http://www.sandiegouniontribune.com/news/2015/
jul/10/one-direction-tour-debut-concert-review/. Last accessed July 17, 2015. Thalheimer, Erich. 2000. Construction Noise Control Program and Mitigation Strategy as the
Central Artery/Tunnel Project. Noise Control Engineering Journal 48(5) September/ October.

Page 58 Stadium Reconstruction Project – Noise Technical Report Stadium Reconstruction Noise Tech Rpt 8/9/2015
This page intentionally left blank.

APPENDIX A
NOISE DATA


Phase 1Demolish
Parking Area for Stadium
Reconstruction
Phase 2Site Preparation
for Stadium Reconstruction
Phase 3Pile Driving for
Stadium Reconstruction
Phase 4Stadium
Reconstruction
Phase 5Demolish
Qualcomm Stadium (excludes blasting)
Phase 6Construct Parking for
Stadium Reconstruction
Phase 1Demolish
Parking Area for Stadium
Reconstruction
Phase 2Site Preparation
for Stadium Reconstruction
Phase 3Pile Driving for
Stadium Reconstruction
Phase 4Stadium
Reconstruction
Phase 5Demolish
Qualcomm Stadium (excludes blasting)
Phase 6Construct Parking for
Stadium Reconstruction
LT-2 63 65 67 65 66 64 66 2 4 2 3 1 3
LT-3 59 60 61 60 60 61 74 1 2 1 1 2 15
LT-4 67 67 67 67 67 67 67 0 0 0 0 0 0
ST-1 61 64 64 62 65 64 69 3 3 1 4 3 8
ST-2 71 71 71 71 71 71 72 0 0 0 0 0 1
ST-3 69 69 70 69 70 69 71 0 1 0 1 0 2
ST-4 57 59 60 58 60 59 62 2 3 1 3 2 5
ST-5 57 59 61 58 59 61 79 2 4 1 2 4 22
ST-7 51 54 56 52 54 56 64 3 5 1 3 5 13
Phase 1Demolish
Parking Area for Stadium
Reconstruction
Phase 2Site Preparation
for Stadium Reconstruction
Phase 3Pile Driving for
Stadium Reconstruction
Phase 4Stadium
Reconstruction
Phase 5Demolish
Qualcomm Stadium (excludes blasting)
Phase 6Construct Parking for
Stadium Reconstruction
Phase 1Demolish
Parking Area for Stadium
Reconstruction
Phase 2Site Preparation
for Stadium Reconstruction
Phase 3Pile Driving for
Stadium Reconstruction
Phase 4Stadium
Reconstruction
Phase 5Demolish
Qualcomm Stadium (excludes blasting)
Phase 6Construct Parking for
Stadium Reconstruction
LT-2 62 64 66 64 65 63 66 2 4 2 3 1 4
LT-3 64 64 65 64 65 65 74 0 1 0 1 1 10
LT-4 67 67 67 67 67 67 67 0 0 0 0 0 0
ST-1 59 63 63 61 64 63 69 4 4 2 5 4 10
ST-2 70 70 70 70 70 70 72 0 0 0 0 0 2
ST-3 69 69 70 69 70 69 71 0 1 0 1 0 2
ST-4 54 57 59 56 59 58 62 3 5 2 5 4 8
ST-5 62 63 64 62 63 64 79 1 2 0 1 2 17
ST-7 62 62 63 62 62 63 66 0 1 0 0 1 4
Receiver Location ID
Existing Ambient
Noise w/out Project
Per Phase, Construction Noise Plus Existing Ambient Per Phase, Increase over Existing Ambient
Weekday Daytime Predicted Hourly Construction Noise Levels (dBA)
Receiver Location ID
Existing Ambient
Noise w/out Project
Per Phase, Construction Noise Plus Existing Ambient Per Phase, Increase over Existing Ambient
Saturday Daytime Predicted Hourly Construction Noise Levels (dBA)

Qualcomm Stadium
Stadium Reconstruction
Project Project
IncreaseQualcomm
Stadium
Stadium Reconstruction
Project Project
IncreaseQualcomm
Stadium
Stadium Reconstruction
Project Project
IncreaseQualcomm
Stadium
Stadium Reconstruction
Project Project
IncreaseLT-2 62 64 1 63 63 1 62 64 2 66 69 4
LT-3 58 58 0 64 64 0 58 58 0 61 60 -1
LT-4 67 67 0 67 67 0 66 66 0 65 63 -2
ST-1 59 60 1 59 59 0 58 59 1 59 60 1
ST-2 69 69 0 70 70 0 69 69 0 67 66 -1
ST-3 68 68 0 69 69 0 68 68 0 66 67 1
ST-4 58 59 1 56 57 1 56 58 2 65 66 1
ST-5 56 55 -1 62 62 0 57 56 -1 61 59 -2
ST-7 N/A1 N/A1 N/A1 62 62 0 61 61 0 58 56 -2
1. ST-7 represents Mission Valley Library, which is closed on Sundays and thusly considered nonsensitve on this day.
Stadium Event Noise Level ComparisonMeasured Existing Ambient + Predicted Event Noise
NFL Football GameSunday Daytime
Collegiate Football GameSaturday Daytime
Motorsports (Supercross) EventSaturday Evening
Live Music / Concert EventWeekday Night
Receiver Location ID
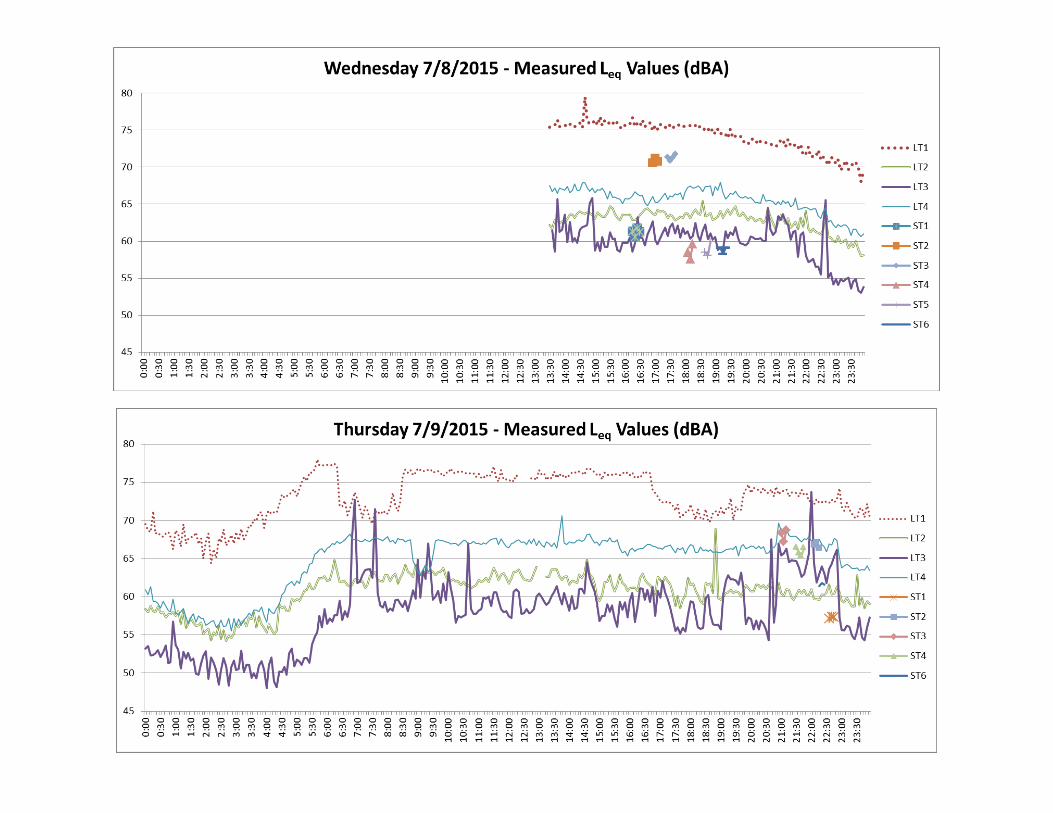


Qualcomm Stadium Replacement Noise Survey PHOTOGRAPHIC LOG
Date: 7/8/15 Photograph 1 Site: LT-1 Measurement: I-15 fence line behind Bella Posta Apartments (View W)
Date: 7/8/15 Photograph 2 Site: LT-1 Measurement: I-15 fence line behind Bella Posta Apartments (View N)

Qualcomm Stadium Replacement Noise Survey PHOTOGRAPHIC LOG
Date: 7/8/15 Photograph 3 Site: LT-2 Measurement: 9477 Goodwick Court San Diego, CA 92123 (View SW)
Date: 7/8/15 Photograph 4 Site: LT-2 Measurement: 9477 Goodwick Court San Diego, CA 92123 (View E)

Qualcomm Stadium Replacement Noise Survey PHOTOGRAPHIC LOG
Date: 7/8/15 Photograph 5 Site: LT-3 Measurement: 9225 Questor Pl Apt 3302 San Diego, CA 92108 (View SE)
Date: 7/8/15 Photograph 6 Site: LT-3 Measurement: 9225 Questor Pl Apt 3302 San Diego, CA 92108 (View E)

Qualcomm Stadium Replacement Noise Survey PHOTOGRAPHIC LOG
Date: 7/8/15 Photograph 7 Site: LT-4 Measurement: 5262 Cromwell Ct San Diego CA 92116 (View N)
Date: 7/8/15 Photograph 8 Site: LT-4 Measurement: 5262 Cromwell Ct San Diego CA 92116 (View E)

Qualcomm Stadium Replacement Noise Survey PHOTOGRAPHIC LOG
Date: 7/8/15 Photograph 9 Site: ST-1 Measurement: Bella Posta Apartments (View WNW)
Date: 7/8/15 Photograph 10 Site: ST-1 Measurement: Bella Posta Apartments (View N)

Qualcomm Stadium Replacement Noise Survey PHOTOGRAPHIC LOG
Date: 7/8/15 Photograph 12 Site: ST-2 Measurement: 209 Rancho Mission Villas (View NE)
Date: 7/8/15 Photograph 11 Site: ST-2 Measurement: 209 Rancho Mission Villas (View S)

Qualcomm Stadium Replacement Noise Survey PHOTOGRAPHIC LOG
Date: 7/8/15 Photograph 12 Site: ST-3 Measurement: Mission Terrace Apt #7 (View WSW)
Date: 7/8/15 Photograph 13 Site: ST-3 Measurement: Mission Terrace Apt #7 (View NE)

Qualcomm Stadium Replacement Noise Survey PHOTOGRAPHIC LOG
Date: 7/8/15 Photograph 15 Site: ST-4 Measurement: 9391 Broadview Ave San Diego, CA 92123 (View SSE)
Date: 7/8/15 Photograph 16 Site: ST-4 Measurement: 9391 Broadview Ave San Diego, CA 92123 (View N)

Qualcomm Stadium Replacement Noise Survey PHOTOGRAPHIC LOG
Date: 7/8/15 Photograph 17 Site: ST-5 Measurement: 2365 Northside Dr San Diego, CA 92108 (View ESE)
Date: 7/8/15 Photograph 18 Site: ST-5 Measurement: 2365 Northside Dr San Diego, CA 92108 (View NNE)
Qualcomm Stadium Replacement Noise Survey PHOTOGRAPHIC LOG
Date: 7/8/15 Photograph 19 Site: ST-6 Measurement: Southern Manhole Cover at stadium parking lot at treeline (View N)
Date: 7/8/15 Photograph 20 Site: ST-6 Measurement: Southern Manhole Cover at stadium parking lot at treeline (View S)

Qualcomm Stadium Replacement Noise Survey PHOTOGRAPHIC LOG
Date: 7/10/15 Photograph 21 Site: ST-7 Measurement: Mission Valley Library 2123 Fenton Pkwy San Diego, CA 92108 (View NE)
Date: 7/10/15 Photograph 22 Site: ST-7 Measurement: Mission Valley Library 2123 Fenton Pkwy San Diego, CA 92108 (View SE)

Qualcomm Stadium Replacement Noise Survey PHOTOGRAPHIC LOG
Date: 7/16/15 Photograph 23 Site: CV-1 Measurement: Qualcomm Stadium Interior One Direction Concert (View NE)
Date: 7/16/15 Photograph 24 Site: CV-1 Measurement: Qualcomm Stadium Interior One Direction Concert (View NE-SE)