Embed Size (px)
Citation preview
Noise Resistant Graph Ranking for Improved Web Image Search
Wei Liu† Yu-Gang Jiang† Jiebo Luo‡ Shih-Fu Chang††Electrical Engineering Department, Columbia University, New York, NY, USA
{wliu,yjiang,sfchang}@ee.columbia.edu‡Kodak Research Laboratories, Eastman Kodak Company, Rochester, NY, USA
Abstract
In this paper, we exploit a novel ranking mechanism thatprocesses query samples with noisy labels, motivated bythe practical application of web image search re-rankingwhere the originally highest ranked images are usuallyposed as pseudo queries for subsequent re-ranking. Avail-ing ourselves of the low-frequency spectrum of a neigh-borhood graph built on the samples, we propose a graph-theoretical framework amenable to noise resistant ranking.The proposed framework consists of two components: spec-tral filtering and graph-based ranking. The former lever-ages sparse bases, progressively selected from a pool ofsmooth eigenvectors of the graph Laplacian, to reconstructthe noisy label vector associated with the query sample setand accordingly filter out the query samples with less au-thentic positive labels. The latter applies a canonical graphranking algorithm with respect to the filtered query sam-ple set. Quantitative image re-ranking experiments carriedout on two public web image databases bear out that ourre-ranking approach compares favorably with the state-of-the-arts and improves web image search engines by a largemargin though we harvest the noisy queries from the top-ranked images returned by these search engines.
1. Introduction
Nowadays, image search has become an indispensablefeature of all popular web search engines such as Google,Yahoo! and Bing as well as most photo sharing websitessuch as Flickr, Photobucket and ImageShack. However,these image search engines are not sufficiently effective be-cause images are too complicated to handle. On accountof the remarkable success of text retrieval for searchingweb pages, most of the search engines still return imagessolely based on the associated or surrounding text on theweb pages containing the images, and visual content analy-sis is rarely explored so far.
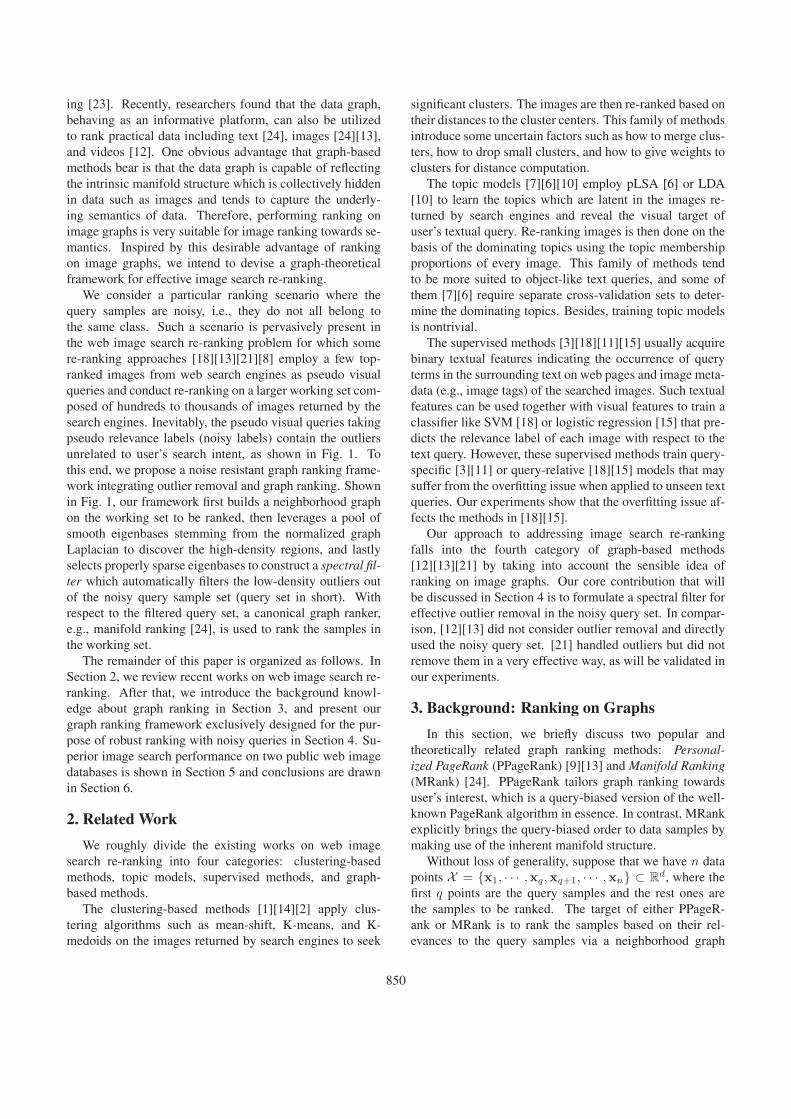
image graph construction
spectral filter
spectraldecomposition
smooth eigenbasis
filtered visual query set
graph ranker
re-ranked search result list
pseudo visual query set
…
…
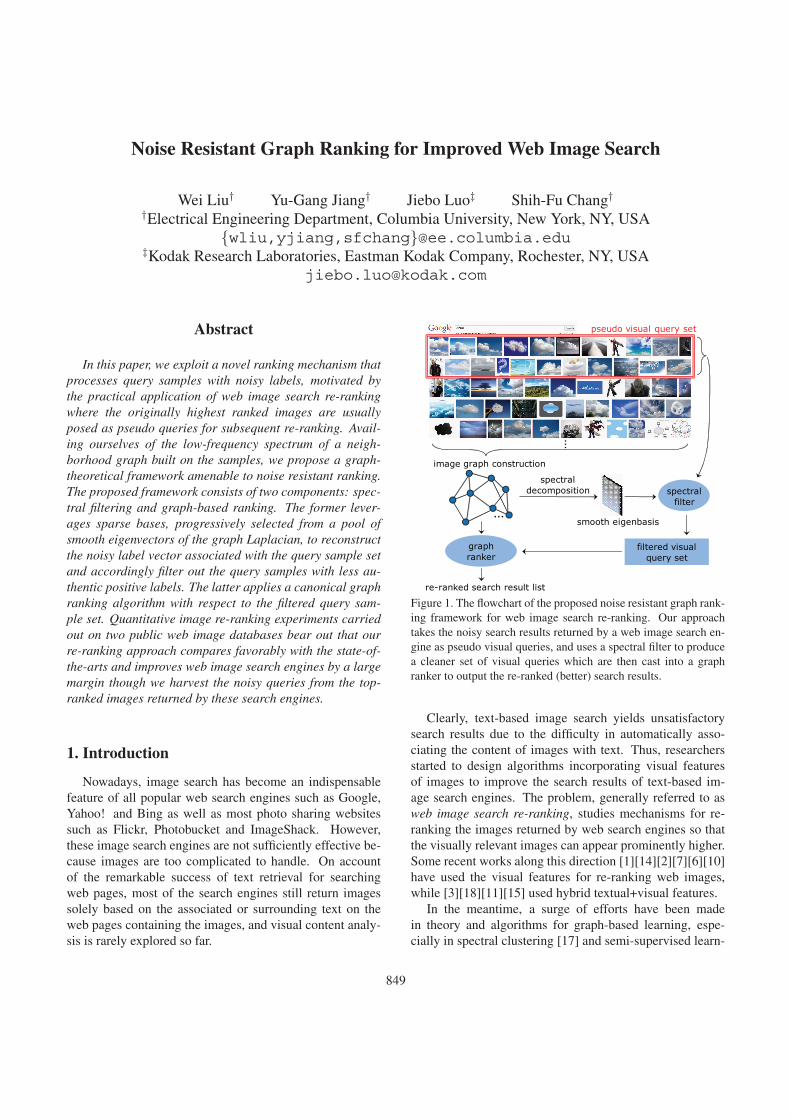
Figure 1. The flowchart of the proposed noise resistant graph rank-ing framework for web image search re-ranking. Our approachtakes the noisy search results returned by a web image search en-gine as pseudo visual queries, and uses a spectral filter to producea cleaner set of visual queries which are then cast into a graphranker to output the re-ranked (better) search results.
Clearly, text-based image search yields unsatisfactorysearch results due to the difficulty in automatically asso-ciating the content of images with text. Thus, researchersstarted to design algorithms incorporating visual featuresof images to improve the search results of text-based im-age search engines. The problem, generally referred to asweb image search re-ranking, studies mechanisms for re-ranking the images returned by web search engines so thatthe visually relevant images can appear prominently higher.Some recent works along this direction [1][14][2][7][6][10]have used the visual features for re-ranking web images,while [3][18][11][15] used hybrid textual+visual features.
In the meantime, a surge of efforts have been madein theory and algorithms for graph-based learning, espe-cially in spectral clustering [17] and semi-supervised learn-
849
ing [23]. Recently, researchers found that the data graph,behaving as an informative platform, can also be utilizedto rank practical data including text [24], images [24][13],and videos [12]. One obvious advantage that graph-basedmethods bear is that the data graph is capable of reflectingthe intrinsic manifold structure which is collectively hiddenin data such as images and tends to capture the underly-ing semantics of data. Therefore, performing ranking onimage graphs is very suitable for image ranking towards se-mantics. Inspired by this desirable advantage of rankingon image graphs, we intend to devise a graph-theoreticalframework for effective image search re-ranking.
We consider a particular ranking scenario where thequery samples are noisy, i.e., they do not all belong tothe same class. Such a scenario is pervasively present inthe web image search re-ranking problem for which somere-ranking approaches [18][13][21][8] employ a few top-ranked images from web search engines as pseudo visualqueries and conduct re-ranking on a larger working set com-posed of hundreds to thousands of images returned by thesearch engines. Inevitably, the pseudo visual queries takingpseudo relevance labels (noisy labels) contain the outliersunrelated to user’s search intent, as shown in Fig. 1. Tothis end, we propose a noise resistant graph ranking frame-work integrating outlier removal and graph ranking. Shownin Fig. 1, our framework first builds a neighborhood graphon the working set to be ranked, then leverages a pool ofsmooth eigenbases stemming from the normalized graphLaplacian to discover the high-density regions, and lastlyselects properly sparse eigenbases to construct a spectral fil-ter which automatically filters the low-density outliers outof the noisy query sample set (query set in short). Withrespect to the filtered query set, a canonical graph ranker,e.g., manifold ranking [24], is used to rank the samples inthe working set.
The remainder of this paper is organized as follows. InSection 2, we review recent works on web image search re-ranking. After that, we introduce the background knowl-edge about graph ranking in Section 3, and present ourgraph ranking framework exclusively designed for the pur-pose of robust ranking with noisy queries in Section 4. Su-perior image search performance on two public web imagedatabases is shown in Section 5 and conclusions are drawnin Section 6.
2. Related Work
We roughly divide the existing works on web imagesearch re-ranking into four categories: clustering-basedmethods, topic models, supervised methods, and graph-based methods.
The clustering-based methods [1][14][2] apply clus-tering algorithms such as mean-shift, K-means, and K-medoids on the images returned by search engines to seek
significant clusters. The images are then re-ranked based ontheir distances to the cluster centers. This family of methodsintroduce some uncertain factors such as how to merge clus-ters, how to drop small clusters, and how to give weights toclusters for distance computation.
The topic models [7][6][10] employ pLSA [6] or LDA[10] to learn the topics which are latent in the images re-turned by search engines and reveal the visual target ofuser’s textual query. Re-ranking images is then done on thebasis of the dominating topics using the topic membershipproportions of every image. This family of methods tendto be more suited to object-like text queries, and some ofthem [7][6] require separate cross-validation sets to deter-mine the dominating topics. Besides, training topic modelsis nontrivial.
The supervised methods [3][18][11][15] usually acquirebinary textual features indicating the occurrence of queryterms in the surrounding text on web pages and image meta-data (e.g., image tags) of the searched images. Such textualfeatures can be used together with visual features to train aclassifier like SVM [18] or logistic regression [15] that pre-dicts the relevance label of each image with respect to thetext query. However, these supervised methods train query-specific [3][11] or query-relative [18][15] models that maysuffer from the overfitting issue when applied to unseen textqueries. Our experiments show that the overfitting issue af-fects the methods in [18][15].
Our approach to addressing image search re-rankingfalls into the fourth category of graph-based methods[12][13][21] by taking into account the sensible idea ofranking on image graphs. Our core contribution that willbe discussed in Section 4 is to formulate a spectral filter foreffective outlier removal in the noisy query set. In compar-ison, [12][13] did not consider outlier removal and directlyused the noisy query set. [21] handled outliers but did notremove them in a very effective way, as will be validated inour experiments.
3. Background: Ranking on Graphs
In this section, we briefly discuss two popular andtheoretically related graph ranking methods: Personal-ized PageRank (PPageRank) [9][13] and Manifold Ranking(MRank) [24]. PPageRank tailors graph ranking towardsuser’s interest, which is a query-biased version of the well-known PageRank algorithm in essence. In contrast, MRankexplicitly brings the query-biased order to data samples bymaking use of the inherent manifold structure.
Without loss of generality, suppose that we have 𝑛 datapoints 𝒳 = {x1, ⋅ ⋅ ⋅ ,x𝑞,x𝑞+1, ⋅ ⋅ ⋅ ,x𝑛} ⊂ ℝ
𝑑, where thefirst 𝑞 points are the query samples and the rest ones arethe samples to be ranked. The target of either PPageR-ank or MRank is to rank the samples based on their rel-evances to the query samples via a neighborhood graph
850
𝐺 = (𝑉,𝐸,𝑊 ). 𝑉 is a vertex set composed of 𝑛 verticesrepresenting 𝑛 raw data points, 𝐸 ⊆ 𝑉 × 𝑉 is an edge setconnecting nearby data points, and 𝑊 ∈ ℝ
𝑛×𝑛 is a ma-trix measuring the strength of edges. For convenience, weassume the graph is connected, which is satisfied if an ad-equate number of edges are included in 𝐸. The (sparse)weight matrix of the widely used 𝑘NN graph is defined by
𝑊𝑖𝑗 =
⎧⎨⎩ exp(−𝑑(x𝑖,x𝑗)
2
𝜎2), 𝑖 ∈ 𝑁𝑗 or 𝑗 ∈ 𝑁𝑖
0, otherwise(1)
where 𝑑(, ) is a distance measure in ℝ𝑑, e.g., Euclidean dis-
tance, 𝑁𝑖 ⊂ [1 : 𝑛] consists of 𝑘 indexes of 𝑘 nearest neigh-bors of x𝑖 in 𝒳 , and 𝜎 > 0 is the bandwidth parameter.Let 𝐷 = diag(𝑊1) be a degree matrix whose diagonal ele-ments are 𝐷𝑖𝑖 =
∑𝑛𝑗=1𝑊𝑖𝑗 .
For the query-based ranking problem, we define a queryindicator vector (query vector in short) y ∈ ℝ
𝑛 with 𝑦𝑖 = 1if 𝑖 ∈ 𝑄 (𝑄 = [1 : 𝑞] denotes the query index set) and𝑦𝑖 = 0 otherwise. The 𝑞 query samples are supposed tocome from the same class, taking the ground-truth label 1.
The PPageRank algorithm defines a random walk on 𝐺using the stochastic transition matrix 𝑃 = 𝛼𝐷−1𝑊 + (1−𝛼)1y⊤/𝑞 (0 < 𝛼 < 1 is the bias parameter), and theresulting ranking scores constitute a stationary probabilitydistribution 𝜋 ∈ ℝ
𝑛 over 𝑉 decided by the linear system𝜋 = 𝑃⊤𝜋 from which PPageRank solves
𝜋 =1− 𝛼
𝑞(𝐼 − 𝛼𝑊𝐷−1)−1y. (2)
The MRank algorithm defines an iterative label diffusionprocess as follow
𝑓(𝑡+ 1) = 𝛼𝐷−1/2𝑊𝐷−1/2𝑓(𝑡) + (1− 𝛼)y, (3)
in which 𝑡 is the time stamp and 𝑓(𝑡) ∈ ℝ𝑛 receives the
diffused labels at time 𝑡. The solution of MRank at conver-gence is given by
𝑓 = (1− 𝛼)(𝐼 − 𝛼𝐷−1/2𝑊𝐷−1/2)−1y. (4)
Interestingly, when replacing 𝑊𝐷−1 with 𝐷−1/2𝑊𝐷−1/2
and ignoring the constant factors, PPageRank yields thesame analytic solution as MRank. Therefore, we unifyPPageRank and MRank into the single solution:
f = (𝐼 − 𝛼𝑆)−1y, (5)
where f saves the final rank scores, and matrix 𝑆 ∈ℝ
𝑛×𝑛 reveals the ranking type. 𝑆 = 𝑊𝐷−1 representsPPageRank whereas 𝑆 = 𝐷−1/2𝑊𝐷−1/2 corresponds toMRank. Actually, the ranking performance of PPageRankand MRank is very comparable, as will be shown in the laterexperiments.
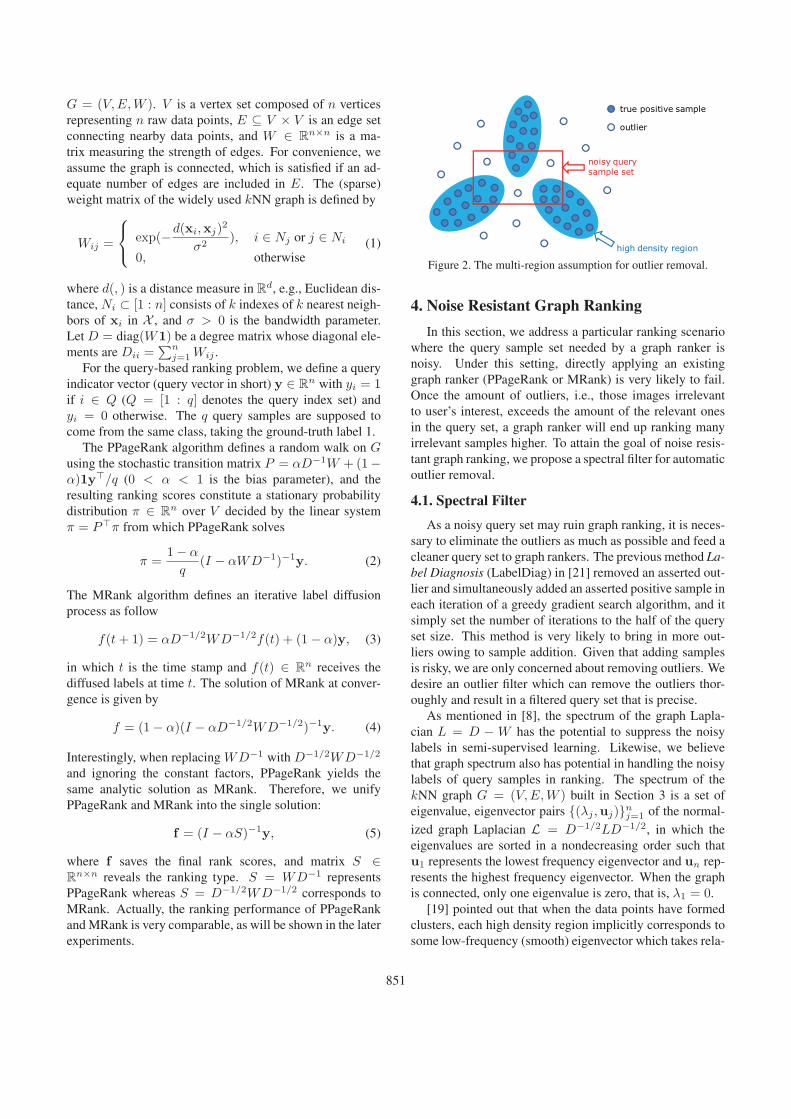
true positive sample
outlier
noisy query sample set
high density region
Figure 2. The multi-region assumption for outlier removal.
4. Noise Resistant Graph Ranking
In this section, we address a particular ranking scenariowhere the query sample set needed by a graph ranker isnoisy. Under this setting, directly applying an existinggraph ranker (PPageRank or MRank) is very likely to fail.Once the amount of outliers, i.e., those images irrelevantto user’s interest, exceeds the amount of the relevant onesin the query set, a graph ranker will end up ranking manyirrelevant samples higher. To attain the goal of noise resis-tant graph ranking, we propose a spectral filter for automaticoutlier removal.
4.1. Spectral Filter
As a noisy query set may ruin graph ranking, it is neces-sary to eliminate the outliers as much as possible and feed acleaner query set to graph rankers. The previous method La-bel Diagnosis (LabelDiag) in [21] removed an asserted out-lier and simultaneously added an asserted positive sample ineach iteration of a greedy gradient search algorithm, and itsimply set the number of iterations to the half of the queryset size. This method is very likely to bring in more out-liers owing to sample addition. Given that adding samplesis risky, we are only concerned about removing outliers. Wedesire an outlier filter which can remove the outliers thor-oughly and result in a filtered query set that is precise.
As mentioned in [8], the spectrum of the graph Lapla-cian 𝐿 = 𝐷 − 𝑊 has the potential to suppress the noisylabels in semi-supervised learning. Likewise, we believethat graph spectrum also has potential in handling the noisylabels of query samples in ranking. The spectrum of the𝑘NN graph 𝐺 = (𝑉,𝐸,𝑊 ) built in Section 3 is a set ofeigenvalue, eigenvector pairs {(𝜆𝑗 ,u𝑗)}𝑛𝑗=1 of the normal-ized graph Laplacian ℒ = 𝐷−1/2𝐿𝐷−1/2, in which theeigenvalues are sorted in a nondecreasing order such thatu1 represents the lowest frequency eigenvector and u𝑛 rep-resents the highest frequency eigenvector. When the graphis connected, only one eigenvalue is zero, that is, 𝜆1 = 0.
[19] pointed out that when the data points have formedclusters, each high density region implicitly corresponds tosome low-frequency (smooth) eigenvector which takes rela-
851
tively large absolute values for points in the region (cluster)and whose values are close to zero elsewhere. Note thatwe exclude the first eigenvector u1 because it is nearly con-stant and does not form clusters. We would assume thatthe true positive samples in the query set reside in multi-ple high-density regions. Note that this “multi-region” as-sumption makes sense for web image re-ranking since thein-class images matching user’s textual query may fall in afew categories due to polysemy. Fig. 2 gives a schematicillustration of the multi-region assumption.
We only consider𝑚 smooth eigenvectors u2, ⋅ ⋅ ⋅ ,u𝑚+1
associated with 𝑚 lowest eigenvalues wrapped in Λ =diag(𝜆2, ⋅ ⋅ ⋅ , 𝜆𝑚+1) to explore the high density regions.Let us inspect the noisy label vector y𝑞 = 1 that is de-fined on the noisy query set 𝑄 and contains the first 𝑞 en-tries in vector y. The desired outlier filter aims at refiningy𝑞 through pruning its unreliable 1 entries and then pro-ducing a smaller yet cleaner query set �� through pickingup the remained 1 entries. Ideally, the exact label vec-tor y∗
𝑞 takes 1 for the true positive samples whereas 0 forthe outliers. Within the label value space ℝ
𝑞 , we seek 𝑚smooth eigenbases u𝑞,2, ⋅ ⋅ ⋅ ,u𝑞,𝑚+1 each of which orig-inates from upper 𝑞 entries in each eigenvector u𝑗 . Ac-cording to the multi-region assumption, y∗
𝑞 should nearlylie in some subspace spanned by sparse eigenbases outof u𝑞,2, ⋅ ⋅ ⋅ ,u𝑞,𝑚+1 (wrap them in the matrix 𝑈𝑞 =[u𝑞,2, ⋅ ⋅ ⋅ ,u𝑞,𝑚+1] ∈ ℝ
𝑞×𝑚). Consequently, we formulatea Spectral Filter (SpecFilter) via sparse eigenbase fitting,that is, reconstructing the noisy label vector y𝑞 with sparseeigenbases:
mina∈ℝ𝑚
∥𝑈𝑞a− y𝑞∥2 + 𝜌∥a∥1 + 𝛾a⊤Λa, (6)
where a is the sparse coefficient vector, ∥a∥1 =∑𝑚
𝑗=1 ∣𝑎𝑗 ∣is the ℓ1-norm encouraging sparsity of a, and 𝜌 > 0, 𝛾 > 0are two regularization parameters. Note that the last termin eq. (6) is actually a weighted ℓ2-norm since a⊤Λa =∑𝑚
𝑗=1 𝜆𝑗+1𝑎2𝑗 , which imposes that the smoother eigenbases
with smaller 𝜆𝑗 are preferred in reconstruction of y𝑞.The nature of eq. (6) is a sparse linear regression model
Lasso [20] augmented by weighted ℓ2-regularization. Tocontrol the sparsity of a more conveniently, we converteq. (6) to the following equivalent problem as done forLasso:
mina∈ℝ𝑚
𝒥 (a,y𝑞) = ∥𝑈𝑞a− y𝑞∥2 + 𝛾a⊤Λa
s.t. ∥a∥1 ≤ 𝑧 (7)
where the sparsity level parameter 𝑧 > 0 maps to the pa-rameter 𝜌 in one-to-one correspondence. Eq. (7) is a con-vex optimization problem and can thus be solved accuratelyby the first-order optimization method Projected GradientDescent [4]. To exploit this method, we must handle the ℓ1
Algorithm 1 ℓ1-Ball Projection 𝔹𝑧()
Input: A vector a ∈ ℝ𝑚.
If∑𝑚
𝑗=1 ∣𝑎𝑗 ∣ ≤ 𝑧, a′ = a;else
sort ∣a∣ into v such that 𝑣1 ≥ 𝑣2 ≥ ⋅ ⋅ ⋅ ≥ 𝑣𝑚,find 𝑟 = max{𝑗 ∈ [1 : 𝑚] : 𝑣𝑗 − 1
𝑗(∑𝑗
𝑗′=1 𝑣𝑗′ − 𝑧) > 0},
compute 𝜃 = 1𝑟(∑𝑟
𝑗=1 𝑣𝑗−𝑧) and form a′ = [𝑎′1, ⋅ ⋅ ⋅ , 𝑎′
𝑚]⊤
such that 𝑎′𝑗 = sign(𝑎𝑗) ⋅max{∣𝑎𝑗 ∣ − 𝜃, 0} for 𝑗 ∈ [1 : 𝑚].
Output: A vector a′ ∈ ℝ𝑚.
constraint in eq. (7) via the ℓ1-ball projection operator
𝔹𝑧(a) = arg min∥b∥1≤𝑧
∥b− a∥ (8)
which has been implemented in 𝑂(𝑚 log𝑚) [5]. We de-scribe it in Algorithm 1. By leveraging the ℓ1-ball projec-tion operator, the iterative updating rule applied in projectedgradient descent is
a(𝑡+ 1) = 𝔹𝑧 (a(𝑡)− 𝛽𝑡∇a𝒥 (a(𝑡),y𝑞)) , (9)
where 𝑡 denotes the time stamp, 𝛽𝑡 > 0 denotes the ap-propriate step size, and ∇a𝒥 (a,y𝑞) denotes the gradientof the cost function 𝒥 with respect to a. To expedite theprojected gradient method, we offer it a good starting pointa(0) = (𝑈⊤
𝑞 𝑈𝑞 + 𝛾Λ)−1𝑈⊤𝑞 y𝑞 that is the globally optimal
solution to the unconstrained counterpart of eq. (7). Be-cause the dimension of the solution space 𝑚 is very low inpractice (no more than 40 in our all experiments), the pro-jected gradient method converges fast (no more than 100iterations throughout our experiments).
Now we are ready to filter out the outliers by pruning thereconstructed vector 𝑈𝑞a with a being the optimal solutionto eq. (7). We simply obtain the denoised label vector y𝑞 =𝑟𝑛𝑑(𝑈𝑞a) by the rounding function 𝑟𝑛𝑑 : ℝ𝑞 → {1, 0}𝑞defined as follows
(𝑟𝑛𝑑(v))𝑖 =
{1, 𝑣𝑖 ≥ 𝛿 ⋅max{v}0, otherwise
(10)
where the parameter 0 < 𝛿 < 1 is properly chosen to prunethe low-valued entries in 𝑈𝑞a which correspond to the unre-liable 1 entries (i.e., noisy labels) in y𝑞. In order to achievethorough outlier removal, we deploy SpecFilter in a consec-utive mode. Specifically, we generate a sequence of {y𝑗
𝑞}via successive filtering and seek the convergent one as theultimate denoised label vector y𝑞 . Setting y0
𝑞 = y𝑞 , welaunch a successive alternating updating process:given y𝑗
𝑞 , update a𝑗+1 by
a𝑗+1 = arg min∥a∥1≤𝑧
𝒥 (a,y𝑗𝑞), 𝑗 = 0, 1, 2, ⋅ ⋅ ⋅ ; (11)
and given a𝑗+1, update y𝑗+1𝑞 by
y𝑗+1𝑞 = 𝑟𝑛𝑑(𝑈𝑞a
𝑗+1), 𝑗 = 0, 1, 2, ⋅ ⋅ ⋅ . (12)
852
Algorithm 2 Spectral Filter (SpecFilter)Input: A noisy label vector y𝑞 ∈ ℝ
𝑞 and model parameters𝛾, 𝑧 > 0, 0 < 𝛿 < 1.Set 𝛽 = 0.5, 𝜂 = 0.01, 𝜖 = 10−4;define functions 𝒥 (a,y𝑞) = ∥𝑈𝑞a − y𝑞∥2 + 𝛾a⊤Λa and∇a𝒥 (a,y𝑞) = 2(𝑈⊤
𝑞 𝑈𝑞 + 𝛾Λ)a− 2𝑈⊤𝑞 y𝑞;
initialize y0𝑞 = y𝑞 and 𝑗 = 0;
repeatinitialize a(0) = (𝑈⊤
𝑞 𝑈𝑞 + 𝛾Λ)−1𝑈⊤𝑞 y𝑗
𝑞 ,for 𝑡 = 0, ⋅ ⋅ ⋅ do
a(𝑡+ 1) := 𝔹𝑧
(a(𝑡)− 𝛽𝑡∇a𝒥 (a(𝑡),y𝑗
𝑞))
where 𝛽𝑡 = 𝛽𝜔 such that 𝜔 is the smallest nonnega-tive integer satisfying 𝒥 (a(𝑡 + 1),y𝑗
𝑞) − 𝒥 (a(𝑡),y𝑗𝑞) ≤
𝜂(∇a𝒥 (a(𝑡),y𝑗
𝑞))⊤
(a(𝑡+ 1)− a(𝑡)),if ∣𝒥 (a(𝑡+ 1),y𝑗
𝑞)− 𝒥 (a(𝑡),y𝑗𝑞)∣ < 𝜖 then
a𝑗+1 := a(𝑡+ 1) and break,end if
end fory𝑗+1𝑞 := 𝑟𝑛𝑑(𝑈𝑞a
𝑗+1),𝑗 := 𝑗 + 1,
until y𝑗𝑞 converges;
Output: The denoised label vector y𝑞 = y𝑗𝑞 .
We detail the proposed SpecFilter encompassing solving thesparse eigenbase fitting problem eq. (7) and successive fil-tering eq. (11)(12) in Algorithm 2. In our experiments, Al-gorithm 2 achieves a convergent denoised label vector y𝑞 inabout 10 iterations, i.e., y𝑞
∼= y10𝑞 .
We remark SpecFilter for summary.Remarks: 1) The idea of sparse eigenbase fitting ex-
ploited by SpecFilter implements the multi-region assump-tion, and the sparsity of eigenbases naturally unveils multi-ple high-density regions which the true positive query sam-ples belong to. 2) SpecFilter removes the low-density out-liers that correspond to the low-valued entries in y𝑞’s recon-structed version 𝑈𝑞a. Hence, we are aware which and howmany outliers should be removed from the noisy query set.
4.2. Algorithmic Framework
So far, we can integrate the proposed spectral filter intoa noise resistant graph ranking framework which ranks thesamples with respect to the query samples of noisy labels.We outline this algorithmic framework, termed SpecFil-ter+MRank, in below.
1. Use eq. (1) to build a 𝑘NN graph 𝐺 = (𝑉,𝐸,𝑊 )on 𝑛 samples {x𝑖}𝑛𝑖=1 of which the first 𝑞 ones arequeries. Compute 𝑆 = 𝐷−1/2𝑊𝐷−1/2. Compute𝐼 − 𝐷−1/2𝑊𝐷−1/2 and its low-frequency eigenvec-tors 𝑈 = [u2, ⋅ ⋅ ⋅ ,u𝑚+1] corresponding to 𝑚 lowesteigenvalues Λ = diag(𝜆2, ⋅ ⋅ ⋅ , 𝜆𝑚+1) except 𝜆1 = 0.
2. Given the noisy label vector y𝑞 = 1 ∈ ℝ𝑞 , run Spec-
Filter (Algorithm 2) using 𝑈𝑞 and Λ to output the de-noised label vector y𝑞 ∈ ℝ
𝑞 .
3. Compute the rank score vector f = (𝐼−𝛼𝑆)−1y based
on the query vector y =
[y𝑞
0
]∈ ℝ
𝑛.
One can also acquire a slightly different framework Spec-Filter+PPageRank by substituting 𝑆 with 𝑊𝐷−1.
5. Experiments
We evaluate the proposed noise resistant ranking frame-work on two public web image databases: Fergus dataset[6] and INRIA dataset [15] in which there are 4,091 and71,478 web images, respectively. Given a text query, eachimage across the two datasets has an initial ranking scorefrom a web search engine and a ground-truth label indicat-ing whether it is relevant to the query.
For visual feature extraction of web images, we adoptLocality-constrained Linear Coding (LLC) [22] to obtainimage representations which have demonstrated state-of-the-art performance. In detail, we use the SIFT descrip-tors [16] which were computed from 16×16 pixel denselysampled image patches with a stepsize of 8 pixels. The im-ages were all preprocessed into gray scale, and a pre-trainedcodebook with 1024 bases1 was used to generate LLCcodes. Following the scheme of Spatial Pyramid Matching(SPM) [16], we used 1×1 and 2×2 sub-regions for LLC andmax-pooled the LLC codes for each sub-region. Finally,these pooled features from each sub-region were concate-nated and ℓ2-normalized as the final 1024 ∗ 5-dimensionalimage feature representation.
As the working set to be re-ranked for each text queryacross the two datasets has 1000 images at most, we keepa small number of eigenbases to run SpecFilter. Specifi-cally, we use 𝑚 = 40 eigenbases for Fergus dataset sinceits images are more diverse, and 𝑚 = 20 eigenbases forINRIA dataset. Accordingly, we set 𝛾 = 1, 𝑧 = 6, 𝛿 = 0.5for Fergus dataset and 𝛾 = 1, 𝑧 = 3, 𝛿 = 0.5 for theother. We build a 20NN graph on the working set for eachtext query with 𝑊 in eq. (1) defined by the Euclidean dis-tance. We compare six graph-based ranking methods in-cluding EigenFunc [8]2, LabelDiag [21], PPageRank [13],MRank [24], and our proposed SpecFilter+PPageRank andSpecFilter+MRank using the same LLC features. To com-pare them with the existing re-ranking methods, we followthe same evaluation settings and metrics as [6] and [15] onFergus dataset and INRIA dataset, respectively.
5.1. Fergus Dataset
On this benchmark, we calculate precision at 15%recall of raw search engine Google and ten re-rankingmethods for seven object categories in Table 1. All
1Courtesy of http://www.ifp.illinois.edu/ jyang29/LLC.htm2This is a graph-based semi-supervised learning method Eigenfunction.
Here we use its one-class version for ranking.
853
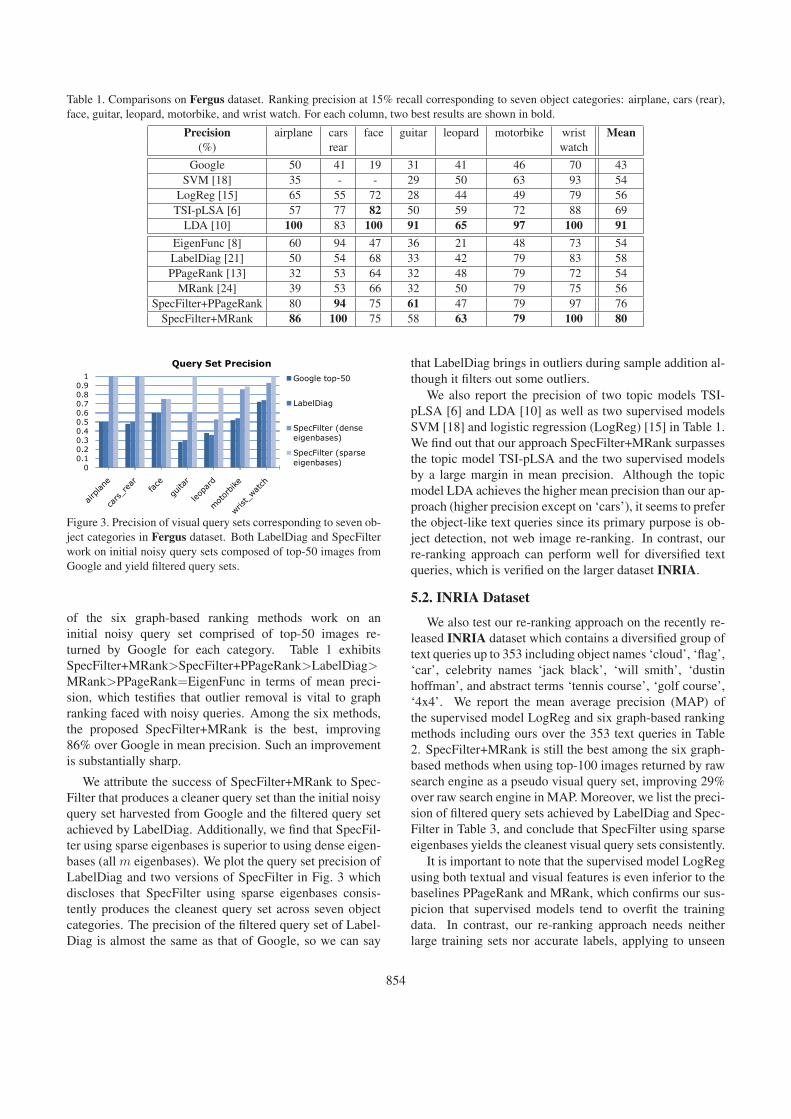
Table 1. Comparisons on Fergus dataset. Ranking precision at 15% recall corresponding to seven object categories: airplane, cars (rear),face, guitar, leopard, motorbike, and wrist watch. For each column, two best results are shown in bold.
Precision airplane cars face guitar leopard motorbike wrist Mean(%) rear watch
Google 50 41 19 31 41 46 70 43SVM [18] 35 - - 29 50 63 93 54
LogReg [15] 65 55 72 28 44 49 79 56TSI-pLSA [6] 57 77 82 50 59 72 88 69
LDA [10] 100 83 100 91 65 97 100 91
EigenFunc [8] 60 94 47 36 21 48 73 54LabelDiag [21] 50 54 68 33 42 79 83 58PPageRank [13] 32 53 64 32 48 79 72 54
MRank [24] 39 53 66 32 50 79 75 56SpecFilter+PPageRank 80 94 75 61 47 79 97 76
SpecFilter+MRank 86 100 75 58 63 79 100 80
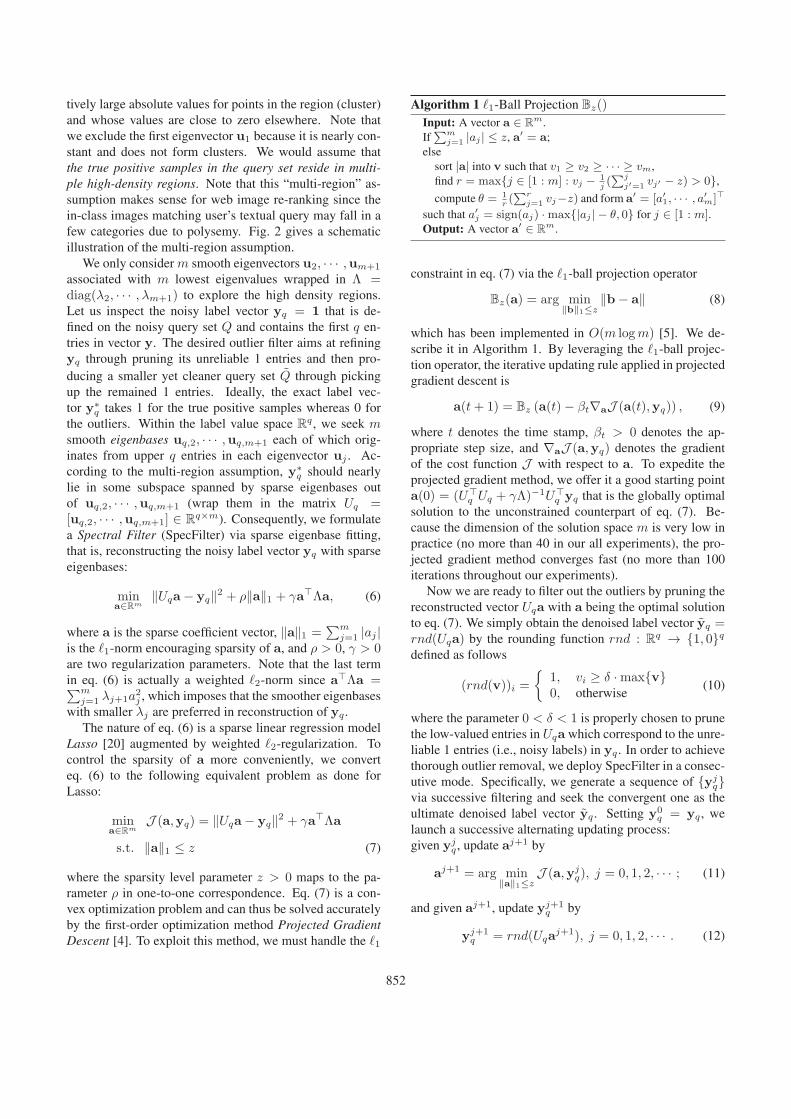
00.10.20.30.40.50.60.70.80.9
1
Query Set Precision
Google top-50
LabelDiag
SpecFilter (dense eigenbases)
SpecFilter (sparse eigenbases)
Figure 3. Precision of visual query sets corresponding to seven ob-ject categories in Fergus dataset. Both LabelDiag and SpecFilterwork on initial noisy query sets composed of top-50 images fromGoogle and yield filtered query sets.
of the six graph-based ranking methods work on aninitial noisy query set comprised of top-50 images re-turned by Google for each category. Table 1 exhibitsSpecFilter+MRank>SpecFilter+PPageRank>LabelDiag>MRank>PPageRank=EigenFunc in terms of mean preci-sion, which testifies that outlier removal is vital to graphranking faced with noisy queries. Among the six methods,the proposed SpecFilter+MRank is the best, improving86% over Google in mean precision. Such an improvementis substantially sharp.
We attribute the success of SpecFilter+MRank to Spec-Filter that produces a cleaner query set than the initial noisyquery set harvested from Google and the filtered query setachieved by LabelDiag. Additionally, we find that SpecFil-ter using sparse eigenbases is superior to using dense eigen-bases (all 𝑚 eigenbases). We plot the query set precision ofLabelDiag and two versions of SpecFilter in Fig. 3 whichdiscloses that SpecFilter using sparse eigenbases consis-tently produces the cleanest query set across seven objectcategories. The precision of the filtered query set of Label-Diag is almost the same as that of Google, so we can say
that LabelDiag brings in outliers during sample addition al-though it filters out some outliers.
We also report the precision of two topic models TSI-pLSA [6] and LDA [10] as well as two supervised modelsSVM [18] and logistic regression (LogReg) [15] in Table 1.We find out that our approach SpecFilter+MRank surpassesthe topic model TSI-pLSA and the two supervised modelsby a large margin in mean precision. Although the topicmodel LDA achieves the higher mean precision than our ap-proach (higher precision except on ‘cars’), it seems to preferthe object-like text queries since its primary purpose is ob-ject detection, not web image re-ranking. In contrast, ourre-ranking approach can perform well for diversified textqueries, which is verified on the larger dataset INRIA.
5.2. INRIA Dataset
We also test our re-ranking approach on the recently re-leased INRIA dataset which contains a diversified group oftext queries up to 353 including object names ‘cloud’, ‘flag’,‘car’, celebrity names ‘jack black’, ‘will smith’, ‘dustinhoffman’, and abstract terms ‘tennis course’, ‘golf course’,‘4x4’. We report the mean average precision (MAP) ofthe supervised model LogReg and six graph-based rankingmethods including ours over the 353 text queries in Table2. SpecFilter+MRank is still the best among the six graph-based methods when using top-100 images returned by rawsearch engine as a pseudo visual query set, improving 29%over raw search engine in MAP. Moreover, we list the preci-sion of filtered query sets achieved by LabelDiag and Spec-Filter in Table 3, and conclude that SpecFilter using sparseeigenbases yields the cleanest visual query sets consistently.
It is important to note that the supervised model LogRegusing both textual and visual features is even inferior to thebaselines PPageRank and MRank, which confirms our sus-picion that supervised models tend to overfit the trainingdata. In contrast, our re-ranking approach needs neitherlarge training sets nor accurate labels, applying to unseen
854
text queries adaptively. Remarkably, SpecFilter+MRankusing only visual features improves by 10% over LogRegusing hybrid textual+visual features in MAP.
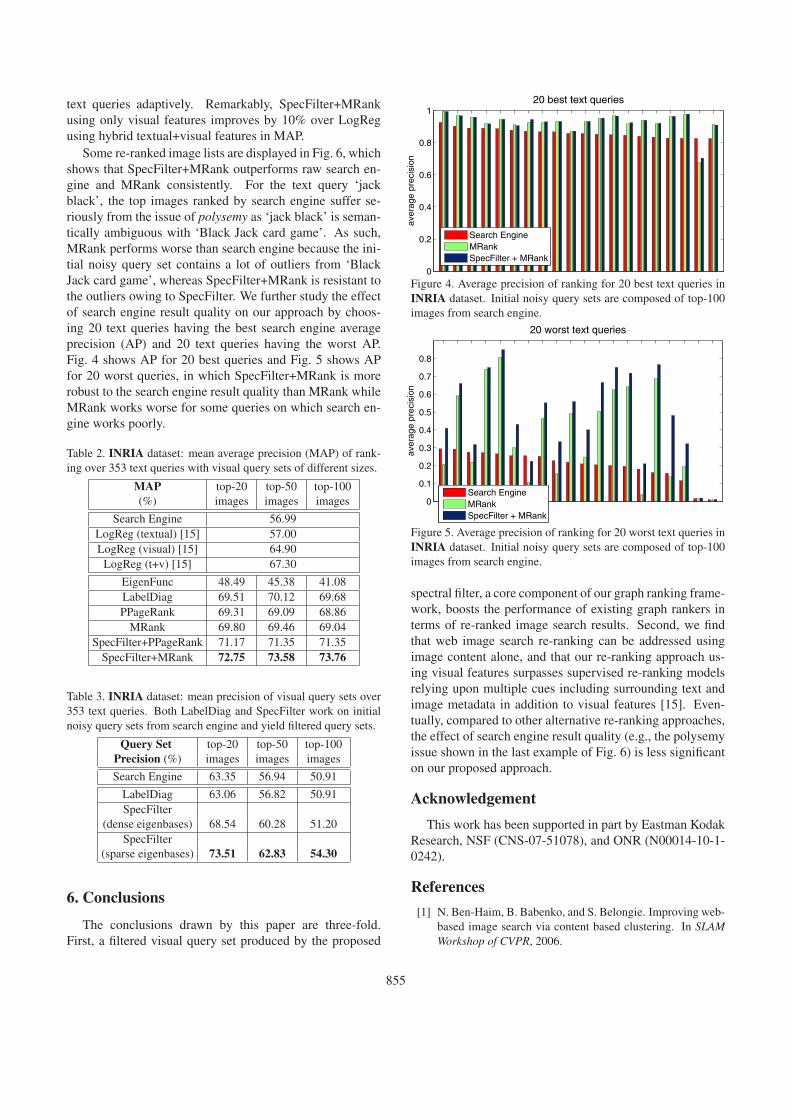
Some re-ranked image lists are displayed in Fig. 6, whichshows that SpecFilter+MRank outperforms raw search en-gine and MRank consistently. For the text query ‘jackblack’, the top images ranked by search engine suffer se-riously from the issue of polysemy as ‘jack black’ is seman-tically ambiguous with ‘Black Jack card game’. As such,MRank performs worse than search engine because the ini-tial noisy query set contains a lot of outliers from ‘BlackJack card game’, whereas SpecFilter+MRank is resistant tothe outliers owing to SpecFilter. We further study the effectof search engine result quality on our approach by choos-ing 20 text queries having the best search engine averageprecision (AP) and 20 text queries having the worst AP.Fig. 4 shows AP for 20 best queries and Fig. 5 shows APfor 20 worst queries, in which SpecFilter+MRank is morerobust to the search engine result quality than MRank whileMRank works worse for some queries on which search en-gine works poorly.
Table 2. INRIA dataset: mean average precision (MAP) of rank-ing over 353 text queries with visual query sets of different sizes.
MAP top-20 top-50 top-100(%) images images images
Search Engine 56.99LogReg (textual) [15] 57.00LogReg (visual) [15] 64.90
LogReg (t+v) [15] 67.30
EigenFunc 48.49 45.38 41.08LabelDiag 69.51 70.12 69.68PPageRank 69.31 69.09 68.86
MRank 69.80 69.46 69.04SpecFilter+PPageRank 71.17 71.35 71.35
SpecFilter+MRank 72.75 73.58 73.76
Table 3. INRIA dataset: mean precision of visual query sets over353 text queries. Both LabelDiag and SpecFilter work on initialnoisy query sets from search engine and yield filtered query sets.
Query Set top-20 top-50 top-100Precision (%) images images images
Search Engine 63.35 56.94 50.91
LabelDiag 63.06 56.82 50.91SpecFilter
(dense eigenbases) 68.54 60.28 51.20SpecFilter
(sparse eigenbases) 73.51 62.83 54.30
6. Conclusions
The conclusions drawn by this paper are three-fold.First, a filtered visual query set produced by the proposed
0
0.2
0.4
0.6
0.8
1
aver
age
prec
isio
n
20 best text queries
Search EngineMRankSpecFilter + MRank
Figure 4. Average precision of ranking for 20 best text queries inINRIA dataset. Initial noisy query sets are composed of top-100images from search engine.
0
0.1
0.2
0.3
0.4
0.5
0.6
0.7
0.8
aver
age
prec
isio
n
20 worst text queries
Search EngineMRankSpecFilter + MRank
Figure 5. Average precision of ranking for 20 worst text queries inINRIA dataset. Initial noisy query sets are composed of top-100images from search engine.
spectral filter, a core component of our graph ranking frame-work, boosts the performance of existing graph rankers interms of re-ranked image search results. Second, we findthat web image search re-ranking can be addressed usingimage content alone, and that our re-ranking approach us-ing visual features surpasses supervised re-ranking modelsrelying upon multiple cues including surrounding text andimage metadata in addition to visual features [15]. Even-tually, compared to other alternative re-ranking approaches,the effect of search engine result quality (e.g., the polysemyissue shown in the last example of Fig. 6) is less significanton our proposed approach.
Acknowledgement
This work has been supported in part by Eastman KodakResearch, NSF (CNS-07-51078), and ONR (N00014-10-1-0242).
References
[1] N. Ben-Haim, B. Babenko, and S. Belongie. Improving web-based image search via content based clustering. In SLAMWorkshop of CVPR, 2006.
855
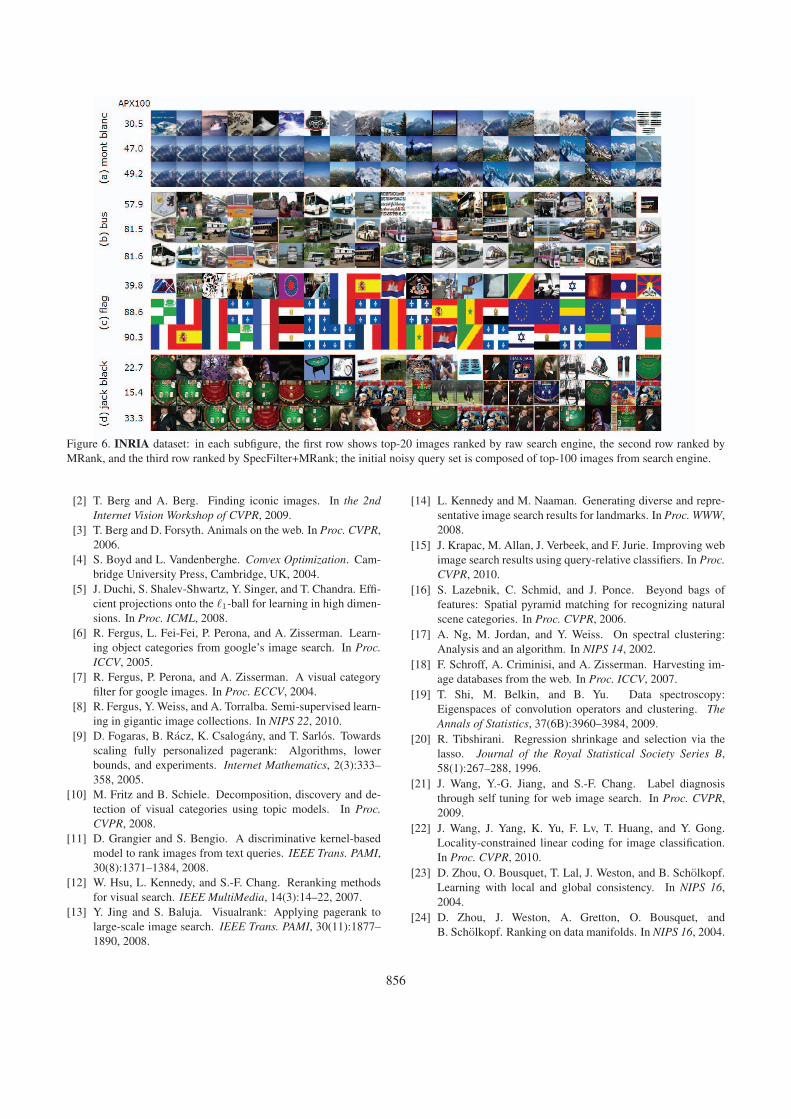
Figure 6. INRIA dataset: in each subfigure, the first row shows top-20 images ranked by raw search engine, the second row ranked byMRank, and the third row ranked by SpecFilter+MRank; the initial noisy query set is composed of top-100 images from search engine.
[2] T. Berg and A. Berg. Finding iconic images. In the 2ndInternet Vision Workshop of CVPR, 2009.
[3] T. Berg and D. Forsyth. Animals on the web. In Proc. CVPR,2006.
[4] S. Boyd and L. Vandenberghe. Convex Optimization. Cam-bridge University Press, Cambridge, UK, 2004.
[5] J. Duchi, S. Shalev-Shwartz, Y. Singer, and T. Chandra. Effi-cient projections onto the ℓ1-ball for learning in high dimen-sions. In Proc. ICML, 2008.
[6] R. Fergus, L. Fei-Fei, P. Perona, and A. Zisserman. Learn-ing object categories from google’s image search. In Proc.ICCV, 2005.
[7] R. Fergus, P. Perona, and A. Zisserman. A visual categoryfilter for google images. In Proc. ECCV, 2004.
[8] R. Fergus, Y. Weiss, and A. Torralba. Semi-supervised learn-ing in gigantic image collections. In NIPS 22, 2010.
[9] D. Fogaras, B. Racz, K. Csalogany, and T. Sarlos. Towardsscaling fully personalized pagerank: Algorithms, lowerbounds, and experiments. Internet Mathematics, 2(3):333–358, 2005.
[10] M. Fritz and B. Schiele. Decomposition, discovery and de-tection of visual categories using topic models. In Proc.CVPR, 2008.
[11] D. Grangier and S. Bengio. A discriminative kernel-basedmodel to rank images from text queries. IEEE Trans. PAMI,30(8):1371–1384, 2008.
[12] W. Hsu, L. Kennedy, and S.-F. Chang. Reranking methodsfor visual search. IEEE MultiMedia, 14(3):14–22, 2007.
[13] Y. Jing and S. Baluja. Visualrank: Applying pagerank tolarge-scale image search. IEEE Trans. PAMI, 30(11):1877–1890, 2008.
[14] L. Kennedy and M. Naaman. Generating diverse and repre-sentative image search results for landmarks. In Proc. WWW,2008.
[15] J. Krapac, M. Allan, J. Verbeek, and F. Jurie. Improving webimage search results using query-relative classifiers. In Proc.CVPR, 2010.
[16] S. Lazebnik, C. Schmid, and J. Ponce. Beyond bags offeatures: Spatial pyramid matching for recognizing naturalscene categories. In Proc. CVPR, 2006.
[17] A. Ng, M. Jordan, and Y. Weiss. On spectral clustering:Analysis and an algorithm. In NIPS 14, 2002.
[18] F. Schroff, A. Criminisi, and A. Zisserman. Harvesting im-age databases from the web. In Proc. ICCV, 2007.
[19] T. Shi, M. Belkin, and B. Yu. Data spectroscopy:Eigenspaces of convolution operators and clustering. TheAnnals of Statistics, 37(6B):3960–3984, 2009.
[20] R. Tibshirani. Regression shrinkage and selection via thelasso. Journal of the Royal Statistical Society Series B,58(1):267–288, 1996.
[21] J. Wang, Y.-G. Jiang, and S.-F. Chang. Label diagnosisthrough self tuning for web image search. In Proc. CVPR,2009.
[22] J. Wang, J. Yang, K. Yu, F. Lv, T. Huang, and Y. Gong.Locality-constrained linear coding for image classification.In Proc. CVPR, 2010.
[23] D. Zhou, O. Bousquet, T. Lal, J. Weston, and B. Scholkopf.Learning with local and global consistency. In NIPS 16,2004.
[24] D. Zhou, J. Weston, A. Gretton, O. Bousquet, andB. Scholkopf. Ranking on data manifolds. In NIPS 16, 2004.
856


![Deep Multi-Graph Clustering via Attentive Cross-Graph ...faculty.ist.psu.edu/xzz89/publications/wsdm20_dmgc.pdfto multi-graph setting, including the ranking problem [32], net-work](https://img.pdfslide.us/doc/110x75/5e8272c847d41d2fdd019999/deep-multi-graph-clustering-via-attentive-cross-graph-to-multi-graph-setting.jpg)