Embed Size (px)
Citation preview
Noise Removal in Magnetic Resonance Diffusion TensorImaging
Bin Chen1 and Edward W. Hsu1,2*
Although promising for visualizing the structure of ordered tis-sues, MR diffusion tensor imaging (DTI) has been hampered bylong acquisition time and low spatial resolution associated withits inherently low signal-to-noise ratio (SNR). Moreover, theuncertainty in the DTI measurements has a direct impact on theaccuracy of structural renderings such as fiber streamlinetracking. Noise removal techniques can be used to improve theSNR of DTI without requiring additional acquisitions, albeitmost low-pass filtering methods are accompanied by undesir-able image blurring. In the present study, a modified vector-based partial-differential-equation (PDE) filtering formalismwas implemented for smoothing DTI vector fields. Using animage residual-energy criterion to equate the degree ofsmoothing and error metrics empirically derived from DTI datato quantify the relative performances, the effectiveness in de-noising DTI data is compared among image-based and vector-based PDE and fixed and adaptive low-pass k-space filtering.The results demonstrate that the edge-preservation feature ofthe PDE approach can be highly advantageous in enhancingDTI measurements, particularly for vector-based PDE filteringin applications relying on DTI directional information. Thesefindings suggest a potential role for the postprocessing en-hancement technique to improve the practical utility ofDTI. Magn Reson Med 54:393–407, 2005. © 2005 Wiley-Liss,Inc.
Key words: diffusion tensor imaging; noise removal; PDE filter-ing; mouse brain; white matter structure
Magnetic resonance diffusion tensor imaging (DTI) (1) issensitive to the anisotropic diffusion of water exerted byits macromolecular environment and has been shown use-ful in characterizing structures of ordered tissues such asthe brain white matter (2,3), myocardium (4,5), and carti-lage (6). The principles of DTI involve the acquisition ofdiffusion-weighted images sensitized in various gradientdirections, with one or more encoding levels in each di-rection, followed by pixel-by-pixel calculation and diago-nalization of the diffusion tensor. The eigenvector of thelargest diffusion tensor eigenvalue (i.e., direction of fastestdiffusion) is generally taken as the local fiber orientation.In 3D, the diffusion tensor is a rank-2, symmetrical 3 � 3matrix, which consists of six independent variables. Incor-
porating the diffusion-independent signal intensity via anadditional variable, a unique solution to the multivariatesystem thus requires a minimum of seven image acquisi-tions.
Due to the signal-attenuation nature of diffusion encod-ing and the inadvertent T2 relaxation resulting from thelong TE necessary to accommodate the sensitization gra-dient pulses, the signal-to-noise ratio (SNR) of DTI is in-herently low. Moreover, because of the large data set sizeand the tradeoff between SNR and resolution, applicationsof DTI have been challenged by poor SNR and low spatialand temporal resolutions. Adverse impacts on DTI includeerrors in the estimation and sorting of the diffusion tensorand the derived anisotropy indices and fiber streamlinecomputations (7–10), which are aggravated by partial vol-ume (or volume-averaging) effects (11) and possible mis-registration due to motion during acquisition. Therefore,improved SNR is of vital importance in enhancing thepractical utility of DTI.
The simplest means to improve the effective SNR is byemploying more acquisition signal averaging, diffusionsensitization directions, encoding levels, or a combinationof these. Regardless of the strategy, the scan time is nec-essarily and proportionally lengthened. A potential ad-junct or alternative is to apply postprocessing noise-re-moval filtering, which is attractive because additional im-age acquisition becomes unnecessary. However, thisapproach is faced with two challenges. First, due to thelow-pass nature of most smoothing filters, the SNR en-hancement is often accompanied by spatial blurring,which may cause loss of fine structures and exacerbatepartial volume error at tissue borders. Second, while theeffects of image noise on DTI have been analyzed previ-ously, the specific effects of noise removal in DTI (e.g.,fiber orientation measurement accuracy) remain largelyuncharacterized, resulting in little guidance available forthe design, selection, and implementation of DTI noiseremoval filters.
The so-called partial-differential-equation (PDE) filter-ing (12,13) has recently gained much interest in imageprocessing. (The technique is also known as anisotropic ornonlinear diffusion filtering, but here it is referred to asPDE filtering to avoid confusion with the physical processthat is the subject of the current study.) By making thedegree of smoothing dependent on the local intensity dif-ference (e.g., less smoothing where the gradient is large),the method has been shown to be highly effective in re-moving or reducing image noise with the desirable featureof edge preservation. In DTI, PDE filtering has been em-ployed to enhance the input images used in diffusiontensor computation (14). However, uncertainties in thecomputed diffusion tensors intuitively originate not onlyfrom the effects of noise in the data images, but also from
1Department of Biomedical Engineering, Duke University, Durham, NorthCarolina, U.S.A.2Center for In Vivo Microscopy, Duke University Medical Center, Durham,North Carolina, U.S.A.Grant sponsor: Whitaker Foundation; Grant number: RG-01–0438; Grantsponsor: NIH/National Center for Research Resources; Grant number: P41RR05959.*Correspondence to: Edward W. Hsu, 136 Engineering Building, Departmentof Biomedical Engineering, Duke University, Durham, NC 27708-0281, U.S.A.E-mail: [email protected] 27 September 2004; revised 10 March 2005; accepted 11 March2005.DOI 10.1002/mrm.20582Published online in Wiley InterScience (www.interscience.wiley.com).
Magnetic Resonance in Medicine 54:393–407 (2005)
© 2005 Wiley-Liss, Inc. 393
errors arising from the multivariate fitting process due toany deficiency in the diffusion encoding scheme (15,16) orin modeling the underlying diffusion process by the tensorrepresentation (17,18). For applications requiring diffu-sion directional information, such as brain white matterstreamline tracking (19–21), rather than smoothing thedata images of the DTI data set, it may be preferable to usevector-based filtering to directly regularize the postdiago-nalization diffusion tensor eigenvector fields.
The goals of the current study are to extend the currentPDE filtering formalism to denoise or regularize DTI eig-envector fields and to examine its effectiveness in improv-ing the quality of DTI data, as well as the accuracy of tissuefiber orientation computation. To provide justification forusing these more computationally demanding methods,the performances of PDE filtering are compared to those ofcommon fixed and adaptive smoothing filters. The analy-sis is performed on high-resolution, mouse brain DTI data,where SNR is critical. Although vector-based PDE filteringhas previously been explored in color image smoothing(22,23), specific adaptations are necessary to smooth dif-fusion tensor eigenvector fields. For the sake of complete-ness, a brief description of the theory of vector-based PDEis included.
THEORY
Despite the fact that the specific implementations of PDEfilters can vary, the image (i.e., scalar intensity field) un-dergoing smoothing is generally represented as a time-varying function I(x,y,z,t) subject to the diffusion equation[12],
�I�t
� � � �r���I���I�. [1]
The degree of smoothing is controlled globally by thepseudo-time variable t and locally by the rate constantfunction r���I��, which in turn depends on the intensitygradient magnitude ��I�. The output (i.e., smoothed image)at a given time t is the solution to Eq. [1] satisfying theinitial condition that I(x,y,z,0) is equal to the input imageI0(x,y,z).
Spurred by the need for color image noise removal, PDEfiltering has recently been applied to vector data used todenote the red, green, and blue (RGB) color components(i.e., channels) of an image (22,23). The obvious means tosmooth a three-component vector field V � �v1,v2,v3�
T is toperform scalar filtering on the components separately, ac-cording to
�V�t
� ��v1
�t�v2
�t�v3
�t
� � � � � �r���v1���v1
� � �r���v2���v2
� � �r���v3���v3
�. [2]
The drawback of this simplistic approach is that intensitygradients among different components are often different,and applying differential smoothing in a pixel neighbor-
hood among different components would result in errorsmanifested in image or color distortions.
To circumvent this pitfall, smoothing processes amongthe individual components must be coupled by some uni-fied descriptor, preferably a scalar for convenience, of thevector-space geometry (i.e., the equivalence of the gradientfor a scalar field). This can be done via a differentialgeometrical norm (24) given by
�G� � ��m�1
3 ��vm
�x 2
� ��vm
�y 2
� ��vm
�z 2
. [3]
Substituting the geometrical norm into the argument of therate constant function in Eq. [2], the governing equation forvector-based PDE filtering becomes
�V�t
� ��v1
�t�v2
�t�v3
�t
� � � � � �r��G���v1
� � �r��G���v2
� � �r��G���v3
� � � � �r��G���V), [4]
which is in the general form of Eq. [1].For either scalar or vector-based PDE filtering, the be-
havior and performance of the smoothing process greatlydepends on the choice for the smoothing function r() (theargument denotes ��I� or �G). For edge preservation, theideal r() should decrease monotonically with respect to .To enhance smoothing in relatively homogeneous regionsand suppress it in highly heterogeneous regions domi-nated by noise, the smoothing function should take on asigmoidal shape with tapered slopes at both extremes ofthe axis. Moreover, r() should lead to a stable andunique solution of the governing equation. While the de-sign and evaluation of the smoothing function is beyondthe scope of the current study, one function reported tosatisfy the above criteria is the hypersurface function (25),
r�� �1
�1 � 2. [5]
Due to the nature of the data, extension of vector-spacePDE filtering to DTI requires some adaptation of the for-malism, to (a) accommodate anti-sense directional vectorsthat may result during tensor diagonalization and (b) pre-serve the unity magnitude of the eigenvectors. Anti-senseeigenvectors (identified, for example, by having negativeinner products with respect to their neighbors) will causeoverestimation of the angular gradient and need to beinverted. Although preservation of the unity magnitude ofthe tensor eigenvectors can be achieved by renormalizingthe vector magnitude during each iteration step, repeatedmagnitude normalization is prone to error amplificationfor small vectors. A better alternative is based on theprinciple that the magnitude of a vector acted upon by aforce perpendicular to its direction remains unchanged(e.g., in centripetal motion). As is done in the Gram–Schmidt procedure for constructing orthogonal base func-
394 Chen and Hsu
tion sets (26), the forcing term (i.e., the right hand side ofEq. [4]) can be made perpendicular by subtracting thecomponent parallel to the vector direction V. Accordingly,the governing equation for vector-based PDE filtering, in-corporating norm-conservation, becomes
�V�t
� � � �r���V) � V � �� � �r���V))V. [6]
The second term on the right-hand side of the equationcorresponds to the linear algebraic projection of the PDEforcing term along the V direction.
METHODS
Diffusion Tensor Imaging and Postprocessing
Retrospective computational experiments were performedusing MATLAB (Version 6.5, Mathworks, Inc., Natick,MA) and custom C programming on high-resolution fixed,whole mouse brain DTI data sets (N � 8) obtained from aseparate study (27). Briefly, DTI was cnducted on a 9.4-Tscanner and each data set consisted of a nonweighted b0(i.e., b 0) image and 12 diffusion-weighted images (stan-dard 3D spin echo sequence, 256 � 128 � 128 matrix size,25.6 � 12.8 � 12.8 mm FOV, 500 ms TR, 14.6 ms TE),encoded with b 1200 s/mm2 in an optimized set of12 gradient directions (16). The diffusion tensor D (withelements denoted by Dij, i, j � �x,y,z�) were computed foreach pixel via nonlinear least-squares curve-fitting, and asan overdetermined system (i.e., 13 measurements for 7unknowns), the uncertainties of the tensor elements ij
were estimated from the fitting SE covariance matrix (28).The diffusion tensor was diagonalized, and the eigenvec-tor of its largest eigenvalue was taken as the local fiberorientation. For the current study, DTI denoising was per-formed either at the point prior to tensor computation byk-space or scalar filtering of the data images or postdiago-nalization via vector-based smoothing of the fiber orienta-tions. The DTI data sets were visualized as computedfractional anisotropy (FA) (29) maps, as well as RGB color-coded fiber orientation maps (30).
Implementation of Smoothing Filters
The effectiveness of filtering for enhancing DTI data qual-ity was evaluated for both scalar and vector-based PDEsmoothing, as well for common fixed and adaptive filter-ing. Because of possible variations in k-space samplingand filter implementation, the specific filters used in thecurrent study are described below in generalized terms.
Fixed k-Space Filtering
Frequency-domain (i.e., k-space) filtering offers the advan-tages of computational simplicity and speed. The mostbasic fixed k-space filter is the step-Fermi (or Fermi forshort) filter, with a generalized 3D frequency responsegiven by
HSF�kx,ky,kz� � � 1,kx
2
��M�2 �ky
2
��N�2 �kz
2
��P�2 � 1,
0, otherwise[7]
where kx, ky, kz are the k-space coordinates, M, N, and Pare the half-widths of the respective dimensions, and � isthe fractional normalized cutoff frequency.
Adaptive k-Space Filtering
Unlike fixed k-space filtering, adaptive filtering has a fre-quency response that is input-specific. A filter that mini-mizes the mean-square error between the true (or noise-free) and reconstructed images is the Wiener filter, whichhas a frequency response satisfying
HWiener�kx,ky,kz� ��S�kx,ky,kz��2
�S�kx,ky,kz��2 � ��2, [8]
where �S�2 corresponds to the power spectrum of the noise-free image, �2 is the variance of the noise, and � is aconstant controlling the degree of filtering (31). For thepresent study, S was approximated by the image k-spacedata, and �2 was estimated from the signal at outer k-spaceregions.
Scalar PDE Filtering
According to Eq. [1], the scalar PDE filtering equation for a3D image I � I(x,y,z,t) can be alternatively written as
�I�t
��
�x� r���I���I�x �
�
�y� r���I���I�y �
�
�z� r���I���I�z . [9]
Replacing the variables x, y, z, and t with the discretespatial indices i, j, k, and iteration number n (i.e., x � i�x,y � j�y, z � k�z, and t � n�t) and making the step sizes inall directions equal to unity (i.e., �x � �y � �z � 1) leadto the difference equation,
In�1 � In�1 ��t2
�ri�1n � ri�1
n � rj�1n � rj�1
n � rk�1n � rk�1
n ���
�t2
�ri�1n Ii�1
n � ri�1n Ii�1
n � rj�1n Ij�1
n � rj�1n Ij�1
n � rk�1n Ik�1
n
� rk�1n Ik�1
n �. [10]
The superscripts denote the iteration number, the sub-scripts represent the spatial coordinates with respect to thecurrent location, and r is the abbreviation for r���I��. Forbetter stability during the numerical iterations, a smalltemporal step size �t � 0.1 was used.
To increase the rate of smoothing and hence the speed ofcomputation (32), a scaled gradient magnitude term, � �/c � ��I�/c, was used as the argument to the rate constantfunction in Eq. [5]. For each round of iteration, an empir-ically determined scaling factor c corresponding to 90% ofthe maximum value of was used.
Norm-conserved, Vector-Based PDE Filtering
The numerical implementation was similar to the afore-mentioned for scalar PDE filtering. The gradient argumentwas computed according to
DTI Noise Removal 395
�12��
m�1
3
�vmi�1 � vmi�1�2 � �vmj�1 � vmj�1�
2 � �vmk�1 � vmk�1�2,
[11]
which was used to solve the coupled Eq. [6] via the for-ward-time-centered-space differencing scheme (28). Thefinal difference equation for the mth (m � 1, 2, or 3) vectorcomponent thus becomes
vmn�1 � vm
n �1 ��t2 �
m�1
3
vmn � r
i�12
n�vmi�1
n � vmn � � r
i�12
n�vmi�1
n
� vmn � � r
j�12
n�vmj�1
n � vmn � � r
j�12
n�vmj�1
n � vmn �
� rk�
12
n�vmk�1
n � vmn � � r
k�12
n�vmk�1
n � vmn �
��t2
�ri�
12
n�vmi�1
n � vmn � � r
i�12
n�vmi�1
n � vmn � � r
j�12
n�vmj�1
n � vmn �
� rj�
12
n�vmj�1
n � vmn �
� rk�
12
n�vmk�1
n � vmn � � r
k�12
n�vmk�1
n � vmn ��, [12]
where the half-subscripts in, for example, ri�
12
n, is the short-
hand for �rin � ri�1
n �/2.
Metrics of Comparison
Due to the dissimilar natures and responses of the tech-niques, to ensure objectivity of the comparisons of theirperformances, it is necessary to first define both a basis forequating the level of filtering among the different filtersand quantitative metrics to gauge filtering effectiveness.Since noise removal (most intuitively in fixed k-spacefiltering) reduces the image energy, or the sum of intensitysquared according to Parseval’s theorem, the energy of theresultant image was used to quantify the degree of smooth-ing. To this end, the residual energy, as a fraction of theoriginal image energy, of the denoised b0 image was aver-aged (N � 8) and plotted as functions of the parameters �,�, and n controlling the level of smoothing for Fermi,Wiener, and scalar PDE filtering, respectively. Because theresidual energy for PDE filtering exhibited an asymptoticbehavior, the graph was empirically fitted to an exponen-tial decay. Without loss of generality, the residual energylevel pertaining to two decay constants (chosen for a rea-sonable smoothing-iteration time tradeoff) was used todetermine the corresponding parameters of the other filtersto achieve equivalent level of smoothing.
Although the image SNR (e.g., region-of-interest meandivided by background SD) is the most intuitive measure-ment of residual noise, it is not suitable for the presentstudy because (a) the SNR cannot adequately measure PDEfiltering improvement since the background (due to therelatively high gradient) is left largely unchanged, and (b)the SNR can preferentially and erroneously favor tech-niques that induce high degrees of blurring. Consequently,
alternative noise metrics are needed. For denoising on DTIdata images before diffusion tensor computation, the esti-mation uncertainties available in the ensuing multivariatefitting provide a convenient measure of noise remaining inthe data set. In addition, smoothing-induced blurring islikely to result in reduced cross-correlation with respect tothe original (or unfiltered) data. Combined, inverselyweighted by the cross-correlation cc to “penalize” blurringand by the magnitude of the diffusion tensor representedby its trace, a normalized magnitude of diffusion tensorerror (NMTE) index, defined as
NMTE �1cc
��i,j
εij2
trace(D), i,j � �x,y,z�, [13]
was used to assess the image-based DTI denoising.Since vector-based PDE filtering is performed on post-
diagonalization eigenvector fields, the NMTE metric isinappropriate to gauge its performance. However, notingthat fibers of ordered tissues in general undergo only grad-ual changes (i.e., no sharp turns), an average deviation-angle (ADA) index, computed with respect to the six or-thotropic neighbors, can instead be used to measure theremaining error and effect of blurring on vector fields,
ADA �1cc
��i�1 � ��i�1 � ��j�1 � ��j�1 � ��k�1 � ��k�1
6.
[14]
The subscripts follow the same convention used in thisstudy (e.g., ��i�1 � arc cos(�Vi, j,k � Vi�1,j,k�)).
To test the validity of the above indices for assessing thenoise level in the data, simulation DTI experiments wereperformed on a phantom field of uniform, known diffusiontensors with various amounts of Gaussian noise added.NMTE and ADA were computed (with cc set to 1.0) andplotted as functions of the b0 image SNR. As with anyestimate of error, the ideal noise-level metric should beinversely proportional to SNR.
Denoising Performance Evaluations
The relative effectiveness in DTI noise removal for thevarious filters was evaluated in three separate areas. Forcomparing among only the image-based filtering methods,NMTE, with cc computed from the FA maps, was calcu-lated over the whole brain volume for DTI datasets de-noised using each of the Fermi, Wiener, and scalar PDEfilters, plus the unfiltered data set as control. The errorestimates were compared via one-way, repeated-measure-ment analysis-of-variance (ANOVA) statistics, using anoverall significance threshold of P � 0.05 and the Bonfer-roni criterion in the post hoc comparisons. Moreover, toevaluate the relative performance of vector-based smooth-ing, ADA was computed over the brain white matter (i.e.,pixels with FA � 0.5) regions (excluding the relativelyisotropic gray matter whose “fibers” have largely randomorientations due to noise). The quantities were similarlycompared among the eigenvector fields generated without
396 Chen and Hsu
and with each of Fermi, Wiener, and scalar and vector-based PDE filtering.
Due to its susceptibility to propagation of errors, DTIdenoising is expected to have a significant impact on tis-sue fiber-streamline tracking (e.g., white matter “tractogra-phy”). In the absence of a noise-free “gold standard,”Monte Carlo experiments were conducted to simulate DTIof a 3D field of diffusion tensors (mean diffusivity of 1.0 �10�3 mm2/s, with FA randomly assigned by a Gaussiandistribution of 0.5 mean and 0.1 variance), all pointing inthe same direction. Gaussian noise corresponding to SNRof 50 (of the b0 image) was added. Fiber streamlines werecomputed on the same DTI data (except for different fil-tering applied), using the centers of “seed” pixels as start-ing coordinates and nearest-neighbor interpolation fornoninteger coordinates. The effect of noise removal on theaccuracy of computed streamlines was measured by theiroff-axis deviations at the end of each 100 pixels traversed.
RESULTS
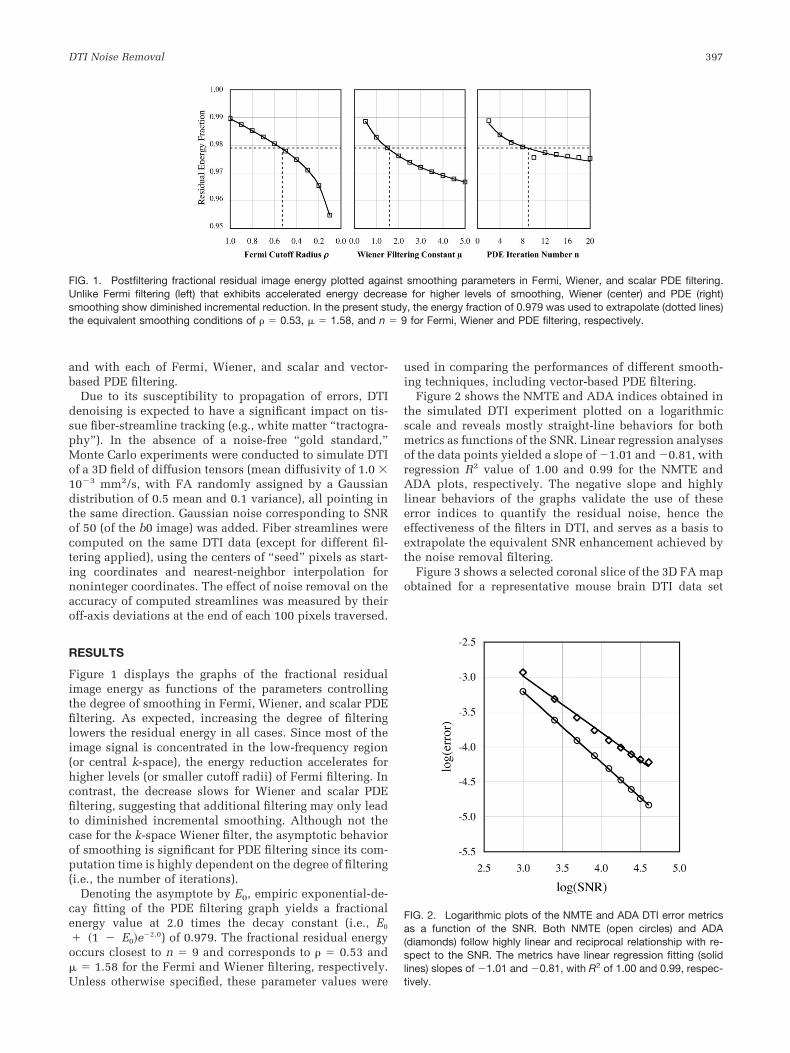
Figure 1 displays the graphs of the fractional residualimage energy as functions of the parameters controllingthe degree of smoothing in Fermi, Wiener, and scalar PDEfiltering. As expected, increasing the degree of filteringlowers the residual energy in all cases. Since most of theimage signal is concentrated in the low-frequency region(or central k-space), the energy reduction accelerates forhigher levels (or smaller cutoff radii) of Fermi filtering. Incontrast, the decrease slows for Wiener and scalar PDEfiltering, suggesting that additional filtering may only leadto diminished incremental smoothing. Although not thecase for the k-space Wiener filter, the asymptotic behaviorof smoothing is significant for PDE filtering since its com-putation time is highly dependent on the degree of filtering(i.e., the number of iterations).
Denoting the asymptote by E0, empiric exponential-de-cay fitting of the PDE filtering graph yields a fractionalenergy value at 2.0 times the decay constant (i.e., E0
� �1 � E0�e�2.0) of 0.979. The fractional residual energyoccurs closest to n � 9 and corresponds to � � 0.53 and� � 1.58 for the Fermi and Wiener filtering, respectively.Unless otherwise specified, these parameter values were
used in comparing the performances of different smooth-ing techniques, including vector-based PDE filtering.
Figure 2 shows the NMTE and ADA indices obtained inthe simulated DTI experiment plotted on a logarithmicscale and reveals mostly straight-line behaviors for bothmetrics as functions of the SNR. Linear regression analysesof the data points yielded a slope of �1.01 and �0.81, withregression R2 value of 1.00 and 0.99 for the NMTE andADA plots, respectively. The negative slope and highlylinear behaviors of the graphs validate the use of theseerror indices to quantify the residual noise, hence theeffectiveness of the filters in DTI, and serves as a basis toextrapolate the equivalent SNR enhancement achieved bythe noise removal filtering.
Figure 3 shows a selected coronal slice of the 3D FA mapobtained for a representative mouse brain DTI data set
FIG. 1. Postfiltering fractional residual image energy plotted against smoothing parameters in Fermi, Wiener, and scalar PDE filtering.Unlike Fermi filtering (left) that exhibits accelerated energy decrease for higher levels of smoothing, Wiener (center) and PDE (right)smoothing show diminished incremental reduction. In the present study, the energy fraction of 0.979 was used to extrapolate (dotted lines)the equivalent smoothing conditions of � � 0.53, � � 1.58, and n � 9 for Fermi, Wiener and PDE filtering, respectively.
FIG. 2. Logarithmic plots of the NMTE and ADA DTI error metricsas a function of the SNR. Both NMTE (open circles) and ADA(diamonds) follow highly linear and reciprocal relationship with re-spect to the SNR. The metrics have linear regression fitting (solidlines) slopes of �1.01 and �0.81, with R2 of 1.00 and 0.99, respec-tively.
DTI Noise Removal 397

subject to various image-based filtering. Results are dem-onstrated for both moderate (with Fermi cutoff � � 0.53,Wiener filtering � � 1.58, and PDE iteration n � 9, whichcorrespond to the same fractional residual image energy of0.979) and high (� � 0.25, � � 80.0, and n � 80, levelschosen arbitrarily and corresponding to mean residual en-ergies of 0.969 and 0.936, respectively, for Fermi and Wie-ner filtering, and 17 times the PDE decay constant) levelsof filtering. The FA map of the unfiltered data set exhibitsconspicuous noise-induced graininess, which to a varyingextent is reduced by each filtering method. Blurring isalready evident under moderate Fermi filtering, and asexpected, is exacerbated by increased filtering in both
Fermi and Wiener smoothing. In contrast, PDE-basedsmoothing resulted in little or no blurring and unalteredFA values, even under heavy filtering.
The dimensionless NMTE indices computed for individ-ual DTI data sets subject to various smoothing at equiva-lent filtering levels are listed in Table 1. The correspond-ing ANOVA results are summarized in Table 2. The errorestimates for the k-space filtering techniques (Fermi andWiener, with respective group means of 0.052 � 0.004 and0.053 � 0.005) are statistically unchanged from the unfil-tered case (0.053 � 0.005), indicating that whatever en-hancement gained by noise reduction has largely beenoffset by the blurring penalty. On the other hand, com-
FIG. 3. Comparison of pretensor computationfiltering of DTI data. Resultant FA maps (falsecolor-coded according to the color bar, singlecoronal slice from the 3D data set of specimen 1displayed) are shown for both moderate (top row,with Fermi cutoff � � 0.53, Wiener filtering � �1.58, and PDE iteration n � 9, which correspondto the same fractional residual image energy of0.979) and higher (bottom row, � � 0.25, � �80.0, and n � 80) levels of smoothing. Elevatedlevels of filtering are accompanied by increasedblurring in the fixed and adaptive k-space tech-niques, but not in PDE smoothing.
FIG. 4. Comparison of filteredDTI brain white matter fiber orien-tation maps. The fiber orientationmaps correspond to the sameslice and the same moderate (toprow) and heavy (bottom row) fil-tering levels as shown in Fig. 3.The principal DTI eigenvectorsare tri-color-coded (red, green,and blue colors representing thebrain left–right, rostral–caudal,and anterior–posterior axes, re-spectively) with the intensityweighted by the FA value. Be-cause vector-based PDE smooth-ing was performed subsequent totensor computation and diagonal-ization, an FA map was not avail-able and the FA map obtainedfrom corresponding scalar PDEfiltering was used instead.
398 Chen and Hsu
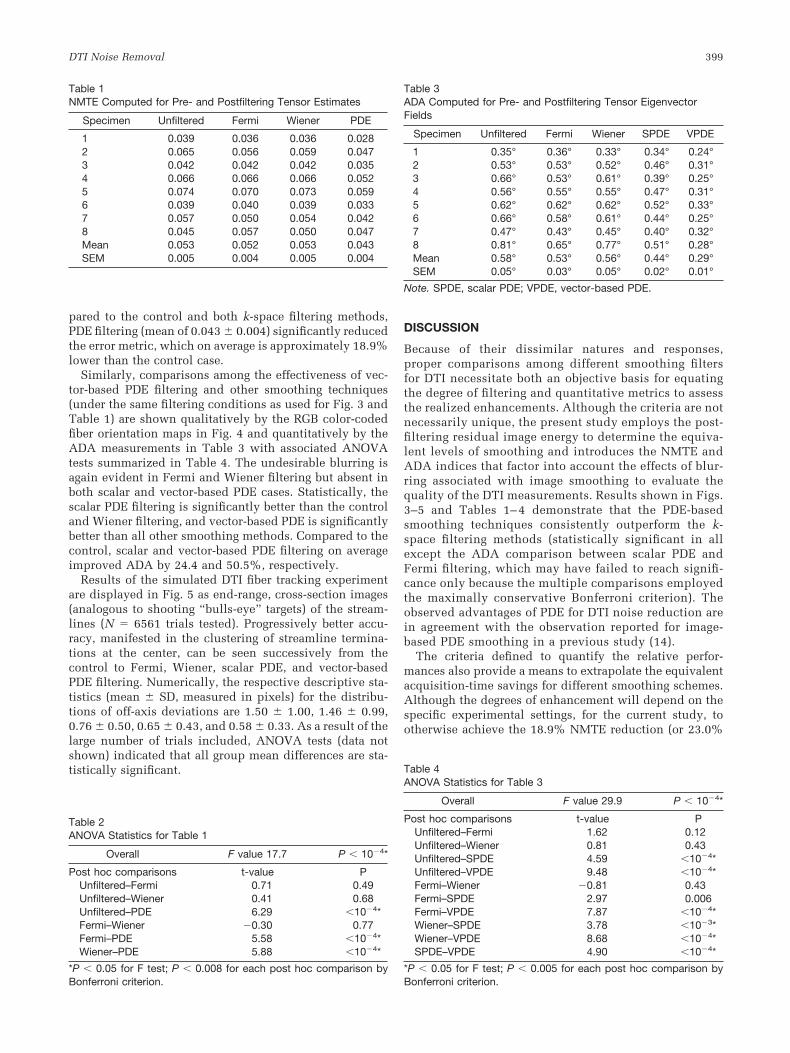
pared to the control and both k-space filtering methods,PDE filtering (mean of 0.043 � 0.004) significantly reducedthe error metric, which on average is approximately 18.9%lower than the control case.
Similarly, comparisons among the effectiveness of vec-tor-based PDE filtering and other smoothing techniques(under the same filtering conditions as used for Fig. 3 andTable 1) are shown qualitatively by the RGB color-codedfiber orientation maps in Fig. 4 and quantitatively by theADA measurements in Table 3 with associated ANOVAtests summarized in Table 4. The undesirable blurring isagain evident in Fermi and Wiener filtering but absent inboth scalar and vector-based PDE cases. Statistically, thescalar PDE filtering is significantly better than the controland Wiener filtering, and vector-based PDE is significantlybetter than all other smoothing methods. Compared to thecontrol, scalar and vector-based PDE filtering on averageimproved ADA by 24.4 and 50.5%, respectively.
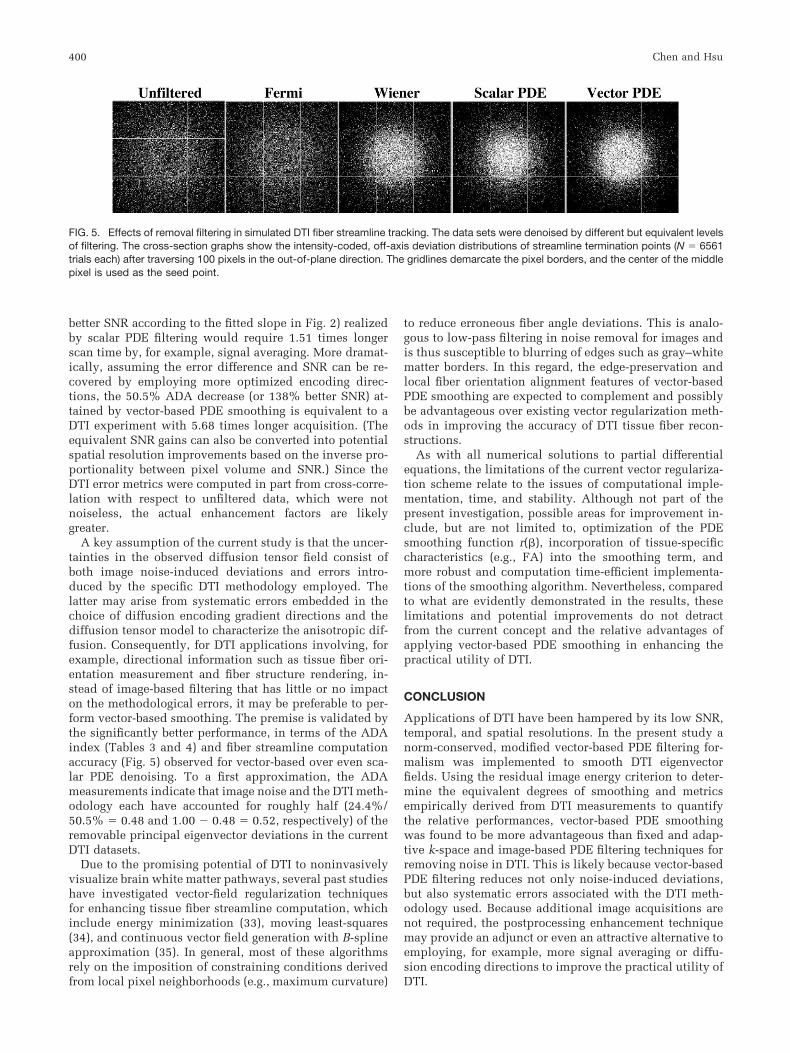
Results of the simulated DTI fiber tracking experimentare displayed in Fig. 5 as end-range, cross-section images(analogous to shooting “bulls-eye” targets) of the stream-lines (N � 6561 trials tested). Progressively better accu-racy, manifested in the clustering of streamline termina-tions at the center, can be seen successively from thecontrol to Fermi, Wiener, scalar PDE, and vector-basedPDE filtering. Numerically, the respective descriptive sta-tistics (mean � SD, measured in pixels) for the distribu-tions of off-axis deviations are 1.50 � 1.00, 1.46 � 0.99,0.76 � 0.50, 0.65 � 0.43, and 0.58 � 0.33. As a result of thelarge number of trials included, ANOVA tests (data notshown) indicated that all group mean differences are sta-tistically significant.
DISCUSSION
Because of their dissimilar natures and responses,proper comparisons among different smoothing filtersfor DTI necessitate both an objective basis for equatingthe degree of filtering and quantitative metrics to assessthe realized enhancements. Although the criteria are notnecessarily unique, the present study employs the post-filtering residual image energy to determine the equiva-lent levels of smoothing and introduces the NMTE andADA indices that factor into account the effects of blur-ring associated with image smoothing to evaluate thequality of the DTI measurements. Results shown in Figs.3–5 and Tables 1– 4 demonstrate that the PDE-basedsmoothing techniques consistently outperform the k-space filtering methods (statistically significant in allexcept the ADA comparison between scalar PDE andFermi filtering, which may have failed to reach signifi-cance only because the multiple comparisons employedthe maximally conservative Bonferroni criterion). Theobserved advantages of PDE for DTI noise reduction arein agreement with the observation reported for image-based PDE smoothing in a previous study (14).
The criteria defined to quantify the relative perfor-mances also provide a means to extrapolate the equivalentacquisition-time savings for different smoothing schemes.Although the degrees of enhancement will depend on thespecific experimental settings, for the current study, tootherwise achieve the 18.9% NMTE reduction (or 23.0%
Table 1NMTE Computed for Pre- and Postfiltering Tensor Estimates
Specimen Unfiltered Fermi Wiener PDE
1 0.039 0.036 0.036 0.0282 0.065 0.056 0.059 0.0473 0.042 0.042 0.042 0.0354 0.066 0.066 0.066 0.0525 0.074 0.070 0.073 0.0596 0.039 0.040 0.039 0.0337 0.057 0.050 0.054 0.0428 0.045 0.057 0.050 0.047Mean 0.053 0.052 0.053 0.043SEM 0.005 0.004 0.005 0.004
Table 2ANOVA Statistics for Table 1
Overall F value 17.7 P � 10�4*
Post hoc comparisons t-value PUnfiltered–Fermi 0.71 0.49Unfiltered–Wiener 0.41 0.68Unfiltered–PDE 6.29 �10�4*Fermi–Wiener �0.30 0.77Fermi–PDE 5.58 �10�4*Wiener–PDE 5.88 �10�4*
*P � 0.05 for F test; P � 0.008 for each post hoc comparison byBonferroni criterion.
Table 3ADA Computed for Pre- and Postfiltering Tensor EigenvectorFields
Specimen Unfiltered Fermi Wiener SPDE VPDE
1 0.35° 0.36° 0.33° 0.34° 0.24°2 0.53° 0.53° 0.52° 0.46° 0.31°3 0.66° 0.53° 0.61° 0.39° 0.25°4 0.56° 0.55° 0.55° 0.47° 0.31°5 0.62° 0.62° 0.62° 0.52° 0.33°6 0.66° 0.58° 0.61° 0.44° 0.25°7 0.47° 0.43° 0.45° 0.40° 0.32°8 0.81° 0.65° 0.77° 0.51° 0.28°Mean 0.58° 0.53° 0.56° 0.44° 0.29°SEM 0.05° 0.03° 0.05° 0.02° 0.01°
Note. SPDE, scalar PDE; VPDE, vector-based PDE.
Table 4ANOVA Statistics for Table 3
Overall F value 29.9 P � 10�4*
Post hoc comparisons t-value PUnfiltered–Fermi 1.62 0.12Unfiltered–Wiener 0.81 0.43Unfiltered–SPDE 4.59 �10�4*Unfiltered–VPDE 9.48 �10�4*Fermi–Wiener �0.81 0.43Fermi–SPDE 2.97 0.006Fermi–VPDE 7.87 �10�4*Wiener–SPDE 3.78 �10�3*Wiener–VPDE 8.68 �10�4*SPDE–VPDE 4.90 �10�4*
*P � 0.05 for F test; P � 0.005 for each post hoc comparison byBonferroni criterion.
DTI Noise Removal 399
better SNR according to the fitted slope in Fig. 2) realizedby scalar PDE filtering would require 1.51 times longerscan time by, for example, signal averaging. More dramat-ically, assuming the error difference and SNR can be re-covered by employing more optimized encoding direc-tions, the 50.5% ADA decrease (or 138% better SNR) at-tained by vector-based PDE smoothing is equivalent to aDTI experiment with 5.68 times longer acquisition. (Theequivalent SNR gains can also be converted into potentialspatial resolution improvements based on the inverse pro-portionality between pixel volume and SNR.) Since theDTI error metrics were computed in part from cross-corre-lation with respect to unfiltered data, which were notnoiseless, the actual enhancement factors are likelygreater.
A key assumption of the current study is that the uncer-tainties in the observed diffusion tensor field consist ofboth image noise-induced deviations and errors intro-duced by the specific DTI methodology employed. Thelatter may arise from systematic errors embedded in thechoice of diffusion encoding gradient directions and thediffusion tensor model to characterize the anisotropic dif-fusion. Consequently, for DTI applications involving, forexample, directional information such as tissue fiber ori-entation measurement and fiber structure rendering, in-stead of image-based filtering that has little or no impacton the methodological errors, it may be preferable to per-form vector-based smoothing. The premise is validated bythe significantly better performance, in terms of the ADAindex (Tables 3 and 4) and fiber streamline computationaccuracy (Fig. 5) observed for vector-based over even sca-lar PDE denoising. To a first approximation, the ADAmeasurements indicate that image noise and the DTI meth-odology each have accounted for roughly half (24.4%/50.5% � 0.48 and 1.00 � 0.48 � 0.52, respectively) of theremovable principal eigenvector deviations in the currentDTI datasets.
Due to the promising potential of DTI to noninvasivelyvisualize brain white matter pathways, several past studieshave investigated vector-field regularization techniquesfor enhancing tissue fiber streamline computation, whichinclude energy minimization (33), moving least-squares(34), and continuous vector field generation with B-splineapproximation (35). In general, most of these algorithmsrely on the imposition of constraining conditions derivedfrom local pixel neighborhoods (e.g., maximum curvature)
to reduce erroneous fiber angle deviations. This is analo-gous to low-pass filtering in noise removal for images andis thus susceptible to blurring of edges such as gray–whitematter borders. In this regard, the edge-preservation andlocal fiber orientation alignment features of vector-basedPDE smoothing are expected to complement and possiblybe advantageous over existing vector regularization meth-ods in improving the accuracy of DTI tissue fiber recon-structions.
As with all numerical solutions to partial differentialequations, the limitations of the current vector regulariza-tion scheme relate to the issues of computational imple-mentation, time, and stability. Although not part of thepresent investigation, possible areas for improvement in-clude, but are not limited to, optimization of the PDEsmoothing function r(), incorporation of tissue-specificcharacteristics (e.g., FA) into the smoothing term, andmore robust and computation time-efficient implementa-tions of the smoothing algorithm. Nevertheless, comparedto what are evidently demonstrated in the results, theselimitations and potential improvements do not detractfrom the current concept and the relative advantages ofapplying vector-based PDE smoothing in enhancing thepractical utility of DTI.
CONCLUSION
Applications of DTI have been hampered by its low SNR,temporal, and spatial resolutions. In the present study anorm-conserved, modified vector-based PDE filtering for-malism was implemented to smooth DTI eigenvectorfields. Using the residual image energy criterion to deter-mine the equivalent degrees of smoothing and metricsempirically derived from DTI measurements to quantifythe relative performances, vector-based PDE smoothingwas found to be more advantageous than fixed and adap-tive k-space and image-based PDE filtering techniques forremoving noise in DTI. This is likely because vector-basedPDE filtering reduces not only noise-induced deviations,but also systematic errors associated with the DTI meth-odology used. Because additional image acquisitions arenot required, the postprocessing enhancement techniquemay provide an adjunct or even an attractive alternative toemploying, for example, more signal averaging or diffu-sion encoding directions to improve the practical utility ofDTI.
FIG. 5. Effects of removal filtering in simulated DTI fiber streamline tracking. The data sets were denoised by different but equivalent levelsof filtering. The cross-section graphs show the intensity-coded, off-axis deviation distributions of streamline termination points (N � 6561trials each) after traversing 100 pixels in the out-of-plane direction. The gridlines demarcate the pixel borders, and the center of the middlepixel is used as the seed point.
400 Chen and Hsu
ACKNOWLEDGMENTS
The authors gratefully acknowledge editorial assistancefrom Ms. Sally Zimney.
REFERENCES
1. Basser PJ, Mattiello J, LeBihan D. MR diffusion tensor spectroscopyand imaging. Biophys J 1994;66:259–267.
2. Pierpaoli C, Jezzard P, Basser PJ, Barnett A, Di Chiro G. Diffusion tensorMR imaging of the human brain. Radiology 1996;201:637–648.
3. Neil JJ, Shiran SI, McKinstry RC, Schefft GL, Snyder AZ, Almli CR.Normal brain in human newborns: apparent diffusion coefficient anddiffusion anisotropy measured by using diffusion tensor MR imaging.Radiology 1998;209:57–66.
4. Reese TG, Weisskoff RM, Smith RN, Rosen BR, Dinsmore RE, WedeenVJ. Imaging myocardial fiber architecture in vivo with magnetic reso-nance. Magn Reson Med 1995;34:786–791.
5. Hsu EW, Muzikant AL, Matulevicius SA, Penland RC, Henriquez CS.Magnetic resonance myocardial fiber-orientation mapping with directhistological correlation. Am J Physiol 1998;274 (Heart Circ Physiol.43):H1627–H1634.
6. Hsu EW, Setton LA. Diffusion tensor microscopy of the intervertebraldisc anulus fibrosus. Magn Reson Med 1999;41:992–999.
7. Bastin ME, Armitage PA, Marshall I. A theoretical study of the effect ofexperimental noise on the measurement of anisotropy in diffusionimaging. Magn Reson Imaging 1998;16:773–785.
8. Basser PJ, Pajevic S. Statistical artifacts in diffusion tensor MRI (DT-MRI) caused by background noise. Magn Reson Med 2000;44:41–50.
9. Skare S, Li T, Nordell B, Ingvar M. Noise considerations in the deter-mination of diffusion tensor anisotropy. Magn Reson Imaging 2000;18:659–669.
10. Anderson AW. Theoretical analysis of the effects of noise on diffusiontensor imaging. Magn Reson Med 2001;46:1174–1188.
11. Alexander AL, Hasan KM, Lazar M, Tsuruda JS, Parker DL. Analysis ofpartial volume effects in diffusion-tensor MRI. Magn Reson Med 2001;45:770–780.
12. Perona P, Malik J. Scale-space and edge detection using anisotropicdiffusion. Pattern Anal Machine Intell IEEE Trans 1990;12:629–639.
13. You Y-L, Kaveh M. Fourth-order partial differential equations for noiseremoval. Image Processing IEEE Trans 2000;9:1723–1730.
14. Parker GJ, Schnabel JA, Symms MR, Werring DJ, Barker GJ. Nonlinearsmoothing for reduction of systematic and random errors in diffusiontensor imaging. J Magn Reson Imaging 2000;11:702–710.
15. Jones DK, Horsfield MA, Simmons A. Optimal strategies for measuringdiffusion in anisotropic systems by magnetic resonance imaging. MagnReson Med 1999;42:515–525.
16. Papadakis NG, Xing D, Huang CL, Hall LD, Carpenter TA. A compar-ative study of acquisition schemes for diffusion tensor imaging usingMRI. J Magn Reson 1999;137:67–82.
17. Frank LR. Characterization of anisotropy in high angular resolutiondiffusion-weighted MRI. Magn Reson Med 2002;47:1083–1099.
18. Ozarslan E, Mareci TH. Generalized diffusion tensor imaging andanalytical relationships between diffusion tensor imaging and highangular resolution diffusion imaging. Magn Reson Med 2003;50:955–965.
19. Conturo TE, Lori NF, Cull TS, Akbudak E, Snyder AZ, Shimony JS,McKinstry RC, Burton H, Raichle ME. Tracking neuronal fiber path-ways in the living human brain. Proc Natl Acad Sci USA 1999;96:10422–10427.
20. Mori S, Crain BJ, Chacko VP, van Zijl PC. Three-dimensional trackingof axonal projections in the brain by magnetic resonance imaging. AnnNeurol 1999;45:265–269.
21. Basser PJ, Pajevic S, Pierpaoli C, Duda J, Aldroubi A. In vivo fibertractography using DT-MRI data. Magn Reson Med 2000;44:625–632.
22. Tschumperle D, Deriche R. Diffusion PDEs on vector-valued images.Signal Processing Magazine, IEEE 2002;19:16–25.
23. Blomgren P, Chan TF. Color TV: total variation methods for restorationof vector-valued images. Image Proc IEEE Trans 1998;7:304–309.
24. Zenzo SDA. Note on the gradient of a multi-image. Comput Vis GraphImage Proc 1986;33:116–125.
25. Teboul S, Blanc-Feraud L, Aubert G, Barlaud M. Variational approachfor edge-preserving regularization using coupled PDEs. Image ProcIEEE Trans 1998;7:387–397.
26. Arfken GB, Weber H-J. Mathematical methods for physicists. SanDiego: Academic Press; 1995. xviii, 1029 p.
27. Hsu EW, Shih SK, Fubara B, Hedlund LW, Johnson GA. Diffusiontensor microscopy of “active-stained” mouse brains. In: Proceedings ofthe 10th Annual Meeting of ISMRM, Honolulu, 2002. p 1232.
28. Press WH, Teukolsky SA, Vetterling WT. Numerical Recipes in C: TheArt of Scientific Computing. Cambridge: Cambridge University Press;1993. 994 p.
29. Basser PJ, Pierpaoli C. Microstructural and physiological features oftissues elucidated by quantitative-diffusion-tensor MRI. J Magn ResonB 1996;111:209–219.
30. Pajevic S, Pierpaoli C. Color schemes to represent the orientation ofanisotropic tissues from diffusion tensor data: application to whitematter fiber tract mapping in the human brain. Magn Reson Med1999;42:526–540.
31. Gonzalez RC, Wintz PA. Digital image processing. Reading, MA:Addison-Wesley; 1987. xviii, 503 p.
32. Canny J. A Computational approach to edge detection. IEEE TransPattern Anal Machine Intell 1986;8:679–698.
33. Poupon C, Clark CA, Frouin V, Regis J, Bloch I, Le Bihan D, Mangin J.Regularization of diffusion-based direction maps for the tracking ofbrain white matter fascicles. Neuroimage 2000;12:184–195.
34. Zhukov L, Barr AH. Oriented tensor reconstruction: tracing neuralpathways from diffusion tensor MRI. In: IEEE Visualization Proceed-ings, Boston, 2002. p 387–394.
35. Pajevic S, Aldroubi A, Basser PJ. A continuous tensor field approxima-tion of discrete DT-MRI data for extracting microstructural and archi-tectural features of tissue. J Magn Reson 2002;154:85–100.
DTI Noise Removal 401