Embed Size (px)
Citation preview

Audio recordings are made of this meeting
NOISE OVERSIGHT COMMITTEESEPTEMBER 21, 2016

Item 1: Review and Approval of July 20, 2016 Meeting Minutes
NOISE OVERSIGHT COMMITTEESEPTEMBER 21, 2016

Item 2: Review of Operations Report Summary:
July and August 2016
NOISE OVERSIGHT COMMITTEESEPTEMBER 21, 2016

MSP COMPLAINTS
Item 2: Review of Operations Report Summary:
July and August 2016 JULY AUGUST
10,183 11,442
JULY AUGUST
695 593
2015 2016JULY 11,664 10,878
AUGUST 12,475 12,035
0
2,500
5,000
7,500
10,000
12,500
15,000
JAN
FE
B
MA
R
AP
R
MA
Y
JUN
JUL
AU
G
SE
P
OC
T
NO
V
DE
C
JAN
FE
B
MA
R
AP
R
MA
Y
JUN
JUL
AU
G
SE
P
OC
T
NO
V
DE
C
JAN
FE
B
MA
R
AP
R
MA
Y
JUN
JUL
AU
G
SE
P
OC
T
NO
V
DE
C
JAN
FE
B
MA
R
AP
R
MA
Y
JUN
JUL
AU
G
SE
P
OC
T
NO
V
DE
C
2013 2014 2015 2016
CO
MP
LA
INT
S

JULY AUGUST
639 595
MSP COMPLAINT LOCATIONS
JULY AUGUST
17 20
AVERAGE COMPLAINT PER LOCATION
Item 2: Review of Operations Report Summary:
July and August 2016
17
7
13
0
18
4 28
1 38
0
71
8
62
4
84
7
65
4
39
1
28
3
18
4
17
8
17
0
39
2
43
2
49
0 58
4 71
6 79
2
63
8
36
2
20
5
21
9
26
3
27
0 38
9
41
6 52
3
74
5 84
9
10
79
86
6
53
0
44
5
37
4
29
5 43
9
75
6
65
7
97
1
72
3
63
9
59
5
0
200
400
600
800
1000
1200
JAN
FE
B
MA
R
AP
R
MA
Y
JUN
JUL
AU
G
SE
P
OC
T
NO
V
DE
C
JAN
FE
B
MA
R
AP
R
MA
Y
JUN
JUL
AU
G
SE
P
OC
T
NO
V
DE
C
JAN
FE
B
MA
R
AP
R
MA
Y
JUN
JUL
AU
G
SE
P
OC
T
NO
V
DE
C
JAN
FE
B
MA
R
AP
R
MA
Y
JUN
JUL
AU
G
SE
P
OC
T
NO
V
DE
C
2013 2014 2015 2016
CO
MP
LA
INT
LO
CA
TIO
NS

TOTAL MSP AIRCRAFT OPERATIONS
2015 2016
271,177 276,724
YEAR – TO – DATE
Item 2: Review of Operations Report Summary:
July and August 2016
2015 2016JULY 37,132 37,880
AUGUST 36,885 37,887
31,371
29,033
35,119
32,68633,409
35,542
37,13236,885
32,88733,969
31,89632,356
31,597
30,020
34,966
33,29334,331
36,750
37,880 37,887
28,000
30,000
32,000
34,000
36,000
38,000
40,000
JAN FEB MAR APR MAY JUN JUL AUG SEP OCT NOV DEC
AIR
CR
AF
T O
PE
RA
TIO
NS
2015 2016
Source: Metropolitan Airports Commission’s Finance Department Monthly Passenger and Operations Reports
JUNE JULY
3,352,178 3,533,877
MSP PASSENGERS
Item 2: Review of Operations Report Summary:
June and July 2016
JUN102
JUL101
6 0
6 5
7 0
7 5
8 0
8 5
9 0
9 5
1 0 0
1 0 5
1 1 0
JAN
MA
R
MA
Y
JUL
SE
P
NO
V
JAN
MA
R
MA
Y
JUL
SE
P
NO
V
JAN
MA
R
MA
Y
JUL
SE
P
NO
V
JAN
MA
R
MA
Y
JUL
2 0 1 3 2 0 1 4 2 0 1 5 2 0 1 6
PA
SS
EN
GE
RS
MSP AIRLINE PASSENGERS
A V E R A G E P A S S E N G E R P E R F L I G H T

FLEET MIX COMPOSITIONJULY & AUGUST 2016
DAYTIME COMPOSITIONJULY & AUGUST 2016
Item 2: Review of Operations Report Summary:
July and August 2016
DAY70,16192.60%
NIGHT5,6067.40%
MANUFACTURED STAGE 3/441,183
59%
REGIONAL JET28,934
41%
Item 2: Review of Operations Report Summary:
July and August 2016
0
20
40
60
80
100
120
140
160
180
200
1 3 5 7 9
11
13
15
17
19
21
23
25
27
29
31 2 4 6 8
10
12
14
16
18
20
22
24
26
28
30
JULY AUGUST
OP
ER
AT
ION
S
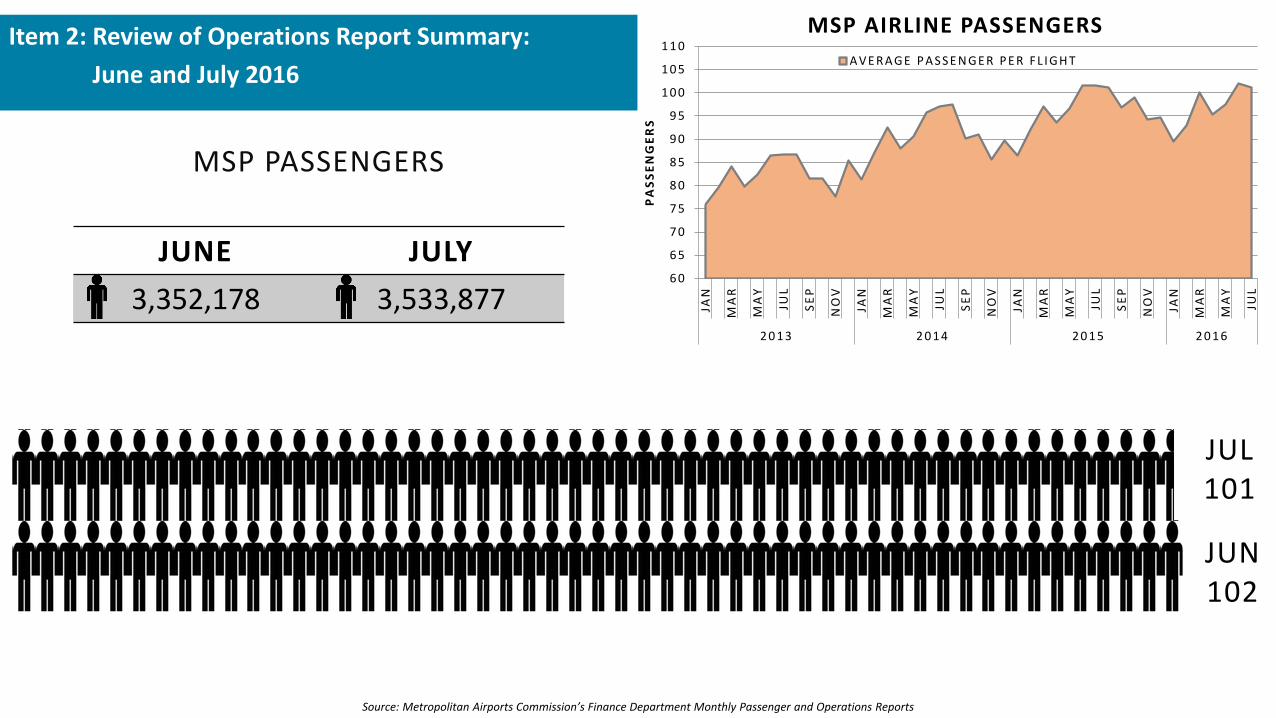
MSP NIGHT TIME OPERATIONS
(22:30 – 06:00)
SA
TU
RD
AY

JULY NIGHT TIME
Scheduled Actual
1,588 2,866
Item 2: Review of Operations Report Summary:
July and August 2016
A S A S A S A S A S A S A S A S
22:30 23:00 0:00 1:00 2:00 3:00 4:00 5:00
OTHER 254 126 82 20 5 3 136
AIR CARRIER 511 243 545 421 275 227 111 25 54 2 13 68 19 556 541
CARGO 3 1 15 8 36 37 52 65
0
200
400
600
800
1000

AUGUST NIGHT TIME
Scheduled Actual
1,478 2,530
Item 2: Review of Operations Report Summary:
July and August 2016
A S A S A S A S A S A S A S A S
22:30 23:00 0:00 1:00 2:00 3:00 4:00 5:00
OTHER 234 118 73 10 4 2 145
AIR CARRIER 456 251 519 443 252 198 69 6 36 14 61 6 414 464
CARGO 7 5 1 16 12 42 40 52 58
0
200
400
600
800
1000

RUNWAY 17 JULY AUGUST
CARRIER JET DEPARTURES (PROCEDURE COMPLIANCE)
6,199(99.4%)
6,423(99.3%)
Noise Abatement Procedures –
Runway 17 Departure
98.0%
98.5%
99.0%
99.5%
100.0%
JAN
MA
R
MA
Y
JUL
SE
P
NO
V
JAN
MA
R
MA
Y
JUL
SE
P
NO
V
JAN
MA
R
MA
Y
JUL
SE
P
NO
V
JAN
MA
R
MA
Y
JUL
SE
P
NO
V
JAN
MA
R
MA
Y
JUL
SE
P
NO
V
JAN
MA
R
MA
Y
JUL
SE
P
NO
V
2011 2012 2013 2014 2015 2016
RU
NW
AY
17
DE
PA
RT
UR
E
PR
OC
ED
UR
E C
OM
PL
IAN
CE

RUNWAYS 12L AND 12R JULY AUGUST
CARRIER JET DEPARTURES (PROCEDURE COMPLIANCE)
4,069(97.0%)
3,981(97.6%)
Noise Abatement Procedures –
Eagan-Mendota Heights Departure Corridor
80%
85%
90%
95%
100%
JAN
MA
R
MA
Y
JUL
SE
P
NO
V
JAN
MA
R
MA
Y
JUL
SE
P
NO
V
JAN
MA
R
MA
Y
JUL
SE
P
NO
V
JAN
MA
R
MA
Y
JUL
SE
P
NO
V
JAN
MA
R
MA
Y
JUL
SE
P
NO
V
JAN
MA
R
MA
Y
JUL
2011 2012 2013 2014 2015 2016
EAG
AN
-M
END
OTA
HEI
GH
TS
CO
RR
IDO
R C
OM
PLI
AN
CE

CROSSING USAGE JULY AUGUST
NIGHT TIME(23:00 – 06:00)
219(39%)
259(47%)
DAY TIME(06:00 – 23:00)
3,850(38%)
3,722(36%)
Noise Abatement Procedures –
Crossing-in-the-Corridor
10%
20%
30%
40%
50%
60%
70%
80%
JAN
MA
R
MA
Y
JUL
SE
P
NO
V
JAN
MA
R
MA
Y
JUL
SE
P
NO
V
JAN
MA
R
MA
Y
JUL
SE
P
NO
V
JAN
MA
R
MA
Y
JUL
SE
P
NO
V
JAN
MA
R
MA
Y
JUL
SE
P
NO
V
JAN
MA
R
MA
Y
JUL
SE
P
NO
V
2011 2012 2013 2014 2015 2016
EA
GA
N -
ME
ND
OTA
HE
IGH
TS
C
RO
SS
ING
PR
OC
ED
UR
E U
SA
GE
Cross Day Cross Night

Noise Abatement Procedures –
Runway Use System (RUS)
July Count Percent
Arrivals on 30L, 30R, and 35 9,640 25.45%
Departures on 12L, 12R, and 17 10,947 28.90%
Use of RUS High-Priority Runways 20,587 54.35%
August Count Percent
Arrivals on 30L, 30R, and 35 9,384 24.77%
Departures on 12L, 12R, and 17 11,256 29.71%
Use of RUS High-Priority Runways 20,640 54.48%
5,2
29
8,4
18
6,0
45
9,0
05
9,0
72
9,9
87
7,6
76
5,8
88
8,1
87
9,0
30
9,6
40
9,3
84
11
,65
6
9,1
75
10
,39
7
8,5
42
7,2
89
5,7
51
10
,46
3
11
,06
9
10
,36
9
10
,38
5
10
,94
7
11
,25
6
51.3% 51.8% 51.6%
54.2%
51.8%52.4% 51.9%
50.9%
54.1%52.8%
54.4% 54.5%
40%
42%
44%
46%
48%
50%
52%
54%
56%
0
5,000
10,000
15,000
20,000
25,000
30,000
SEP OCT NOV DEC JAN FEB MAR APR MAY JUN JUL AUG
2016
RU
S P
ER
CE
NTA
GE
MS
P O
PE
RA
TIO
NS
USE OF MSP RUS HIGH-PRIORITY RUNWAYS
ARRIVALS 30L, 30R, 35 DEPARTURES 12L, 12R, 17 RUS

Noise Abatement Procedures –Runway Use System (RUS)
JULY ARRIVALS2
2.8
%
26
.2%
26
.4%
21
.3%
3.3
%
27
.6%
19
.4% 2
5.2
%
27
.1%
19
.9%
29
.6%
27
.7%
22
.8%
17
.4%
26
.2%
33
.8%
22
.4%
0%
5%
10%
15%
20%
25%
30%
35%
40%
12L 12R 30L 30R 35
TOTAL MORNING TRANSITION EVENING TRANSITION NIGHT COUNT

Noise Abatement Procedures –Runway Use System (RUS)
JULY DEPARTURES
16
.5%
6.8
%
34
.5%
18
.2% 2
3.9
%
14
.7%
13
.0%
29
.4%
22
.2%
20
.6%
16
.7%
24
.8%
7.5
%
30
.7%
20
.3%25
.3%
22
.4%
6.8
%
22
.8%
22
.6%
0%
5%
10%
15%
20%
25%
30%
35%
40%
12L 12R 17 30L 30R
TOTAL MORNING TRANSITION EVENING TRANSITION NIGHT COUNT

Noise Abatement Procedures –Runway Use System (RUS)
AUGUST ARRIVALS
24
.3%
26
.2%
25
.7%
20
.6%
3.2
%
24
.3%
22
.7%
23
.4% 2
9.3
%
26
.6% 30
.6%
24
.5%
18
.3%
0.0
%
25
.8% 29
.9%
27
.4%
16
.9%
0%
5%
10%
15%
20%
25%
30%
35%
12L 12R 30L 30R 35
TOTAL MORNING TRANSITION EVENING TRANSITION NIGHT COUNT

Noise Abatement Procedures –Runway Use System (RUS)
AUGUST DEPARTURES1
7.0
%
6.3
%
36
.2%
16
.8% 2
3.6
%
16
.8%
14
.2%
34
.0%
16
.1%
19
.0%24
.6%
22
.9%
10
.4%
19
.8%
22
.2%2
9.7
%
29
.3%
6.4
%
19
.1%
15
.3%
0%
5%
10%
15%
20%
25%
30%
35%
40%
12L 12R 17 30L 30R
TOTAL MORNING TRANSITION EVENING TRANSITION NIGHT COUNT

Item 3: Aircraft Arrival Gear Extension
Gordon Goss – Chief Pilot Delta Air Lines
Timothy Bathke – Chief Pilot Sun Country Airlines
NOISE OVERSIGHT COMMITTEESEPTEMBER 21, 2016

LANDING GEAR EXTENSION DETERMINATES:
• STABILIZED APPROACH CRITERIA
• SLOW/FAST ATC SPEED ASSIGN
• SLAM DUNK APPROACHES
• LOW VISIBILITY/BAD WX
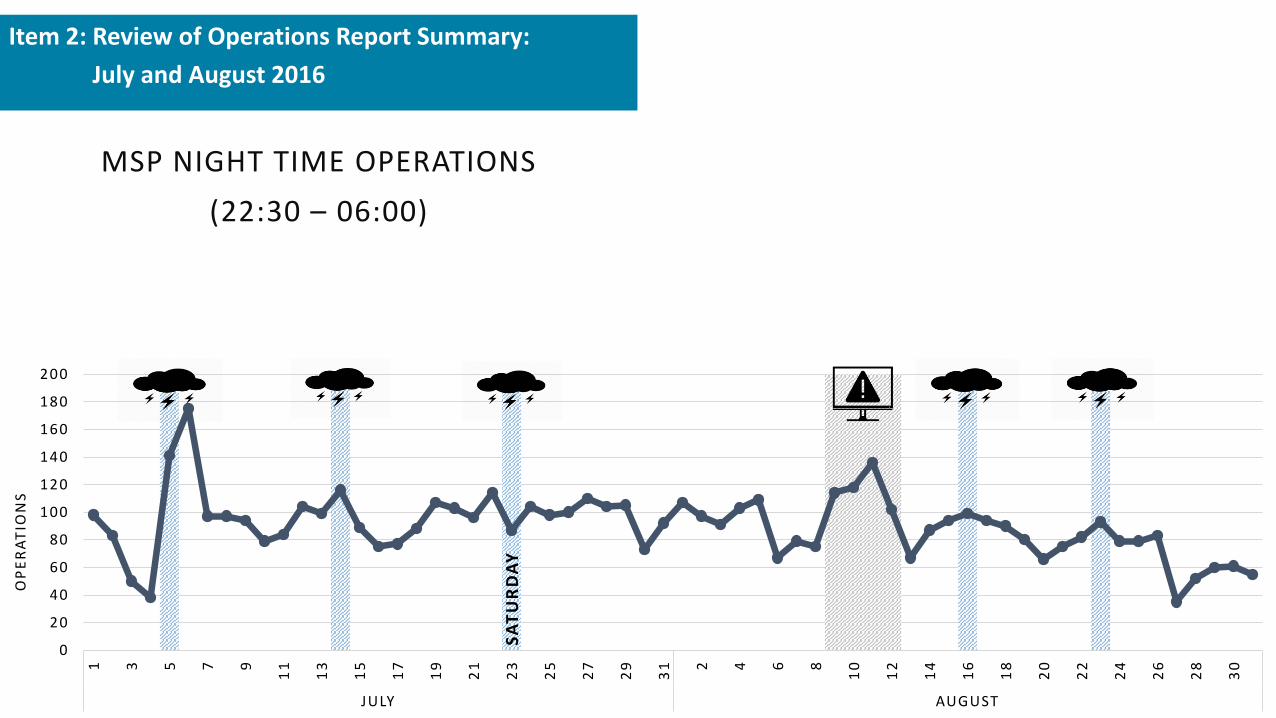
STABILIZED APPROACH DISCUSSION
• STABLE APPROACHES ARE ICAO/INDUSTRY STANDARD
• STABLE APPROACH = SLOW APPROACH = SAFE APPROACH
• GARAGE ANALOGY

STABILIZED APPROACH CRITERIA(By 1000’ AGL = Approx 3 nm)
Visual Conditions
• Landing Gear Down – not in transit
• Flaps set at a Landing Flaps position
– Relatively high lift and high drag
• Airspeed at Touchdown Speed + 15 KIAS(mph)
• On nominal 3 degree glideslope
• Engines “spooled up” ready for go-around (approximately cruise power setting)

LOW VISIBILITY/BAD WX
• AIRCRAFT STABLE CLOSER TO 5-6 nm vs 3-4nm
• MINIMIZE DISTRACTIONS
• MOST APPROACHES REQUIRE VISUAL FOR LANDING
• ALLOWS DETERMINATION OF AIRSPEED VARIATION
• USUALLY NOT NOTICED FROM GROUND

Approach Procedure Profile
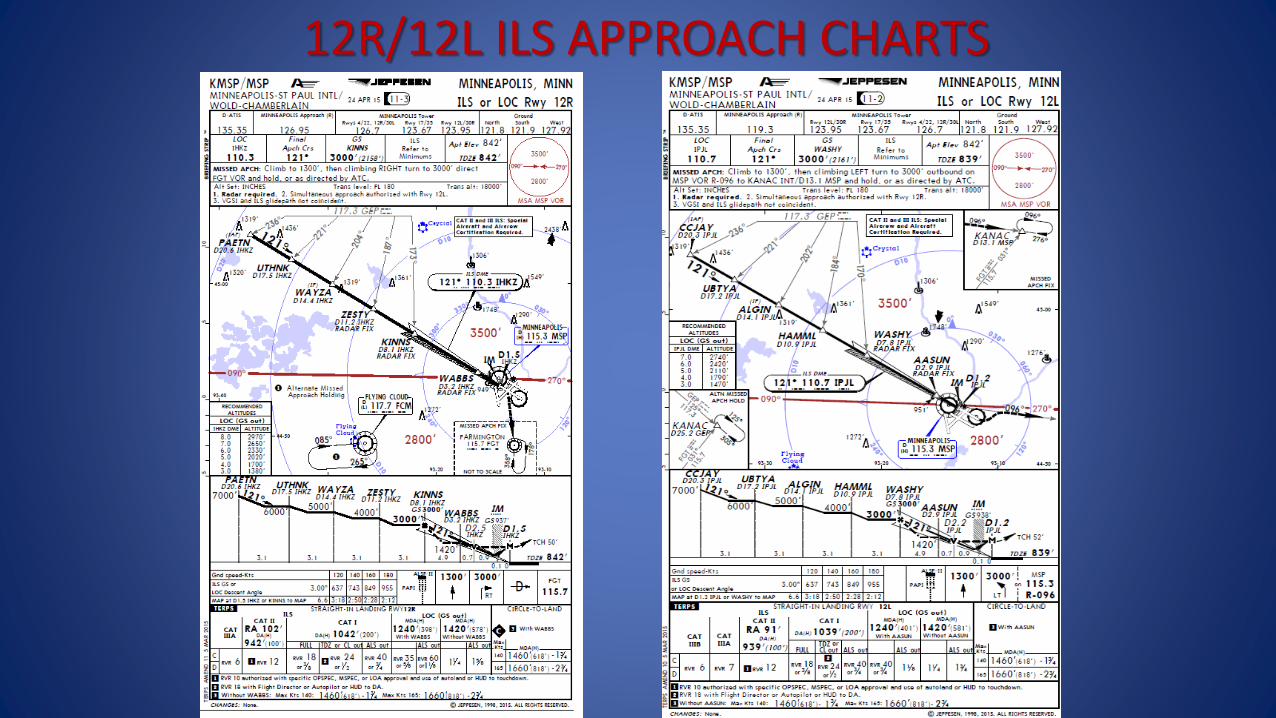
12R/12L ILS APPROACH CHARTS

SLOW SPEED ASSIGNMENT(> 6 NM from Rwy)
• Assigned speed 150 to 170 KIAS
– Speed MAY require Landing Flaps
– Aircraft type and weight dependent
• Landing Flap set with Landing Gear UP
– Landing Gear Warning Horn to prevent gear up landing
• Landing Gear Required to silence Warning

FAST SPEED ASSIGNMENT(180-190 KIAS to 5-6 NM)
• Less Prevalent Condition
• Higher Speed Carried Closer to Runway
• Aircraft Type Dependent
– DC-9/727 vs 757/A-320
• Landing Gear Used as Drag to Slow Quickly
SLAM DUNK APPROACHES
• AIRCRAFT BEGINS APPROACH HIGH AND FAST
• STABILIZED APPROACH CRITERIA STILL APPLIES
• AIRCRAFT IS ABOVE 3 DEGREE GLIDESLOPE
• LANDING GEAR USED WITH SPEEDBRAKES
• FLAP EXTENSION SPEED DEPENDENT

NOC QUESTIONS:What are Delta’s SOP re LANDING GEAR
EXTENSION?
• Fully extended no later than 1000 feet AGL. Given normal extension times usually start approximately 5-7 nm from Runway.
HAS THIS CHANGED RECENTLY?• No changes from Delta or even NWA
procedures

Q: ARE THERE GROUND LANDMARKS FOR GEAR EXTENSION?
A: No, A/C configuration is dependent upon the factors listed above, not a spot on the ground.
Q: DOES GEAR EXTENSION DIFFER FOR DIFFERENT RUNWAYS?
A: No. Except as listed above, the goal of approach standardization is to make all approaches as similar as
possible.
DISCUSSION OF RWY 12L/R APPROACH CONSIDERATIONS/QUESTIONS

Sun Country, Sun Country Airlines, Sun Country Vacations, the Compass logo, and Ufly are trademarks of MN Airlines, LLC d/b/a Sun Country Airlines.
MSP Base Chief PilotCaptain Timothy Bathke
NOC Presentation

Landing Procedure Considerations
• Safety driven– Internal data– Industry lessons learned
• Regulatory compliance– FAA Directive– Sun Country Policy
• Recent Stabilized Approach Emphasis

Procedural Considerations
– Safety• A decade long data driven initiative
– Stabilized Approach criteria met for each and every approach
• Positioning the airplane in the proper landing configuration (in addition to completing several other tasks) prior to 1000’ above the ground
• Approximately 4 miles from the runway

Sun Country Approach Profiles
• No significant changes in the past 2 years– Minor verbiage change– Approximately the same point over the
ground

“Standard” Operating Procedure
• Difficult to quantify– Multitude of variables
• Crew qualification• Weather conditions• Assigned approach speeds
– Number of Operations/Congestion– Direction of traffic flow
• Day vs. Night• Specific size of 737

Visual Weather Conditions
• Normally the landing gear is lowered approximately 5-7 miles from the runway
• This can vary with crew experience, flight conditions, weather, runway conditions, etc.
• The primary emphasis for our crews is the safety of our passengers and the community on the ground

SCA Approach Profiles

Instrument Weather Conditions
• Current procedure specifies lowering the landing gear 3 miles before the Final Approach Fix
• Conditions alter this slightly based primarily on aircraft weight and speed assigned by ATC
• The final approach point changes based on the specific runway in use

Approximate Final Approach Fix DistanceRunway 12R 7 nmRunway 12L 7 nmRunway 30L 6 nmRunway 30R 6 nm
Procedural Differences Between Runways
• The Sun Country profile for an Instrument approach is the same whether the runway is 12R or 35 in MSP, or any approach at any other airport
• Different types of instrument approaches can have slightly different profiles– The gear is lowered at essentially the same
distance from any runway

Ground based Reference Points
• Sun Country does not utilize ground based references

SE Ops versus NW Ops• Runways 12L/12R are typically used without the benefit of
35• Runways 30L/R/35 can handle a greater number of flights
– In a 2 runway configuration, there is an increased likelihood of congestion
– Slower speeds assigned further from the airport• Typically, once MSP Approach Control or MSP Tower assigns a
certain speed (170mph) we can only slow the airplane using landing gear – Doing so assures we maintain a stabilized and safe approach
• Depending on the distance from the airport, this could lead to level flight segments that potentially require higher power settings, thus increasing the noise.

Considerations
• Customer loyalty to the Hometown Airline is driving growth
• SCA Fleet Make-up – 2011
• 14 Aircraft– 2016
• 21 Aircraft (22 in March 2017, 23 and 24 in 2017)– Pilot Demographics
• 306 pilots• 60% increase in 5 years
– Increased training– Pilot candidate experience– Teaching and maintaining our high level of safety

Considerations
• RNAV STARs– There is not a negative impact on noise from
the implementation• Instrument approach procedures haven’t changed
as a result• Altitude at correlating navigation points is higher• 230 KIAS on downwind requires reduced engine
thrust settings, lowering noise footprint further– Shared benefits- reduced noise and a lower fuel
consumption

Questions?

MSP Base Chief Pilot Tim Bathke651-775-8973

Item 4: Study of MSP Runway 12L and 12R ArrivalsNOISE OVERSIGHT COMMITTEESEPTEMBER 21, 2016
In May, NOC directed MAC staff to conduct an analysis of MSP Runway 12L and 12R arrival activity over the cities to the northwest of the airport.
Direction was based on feedback from the 2nd Quarter Public Input Meeting in St. Louis Park

Item 4: Study of MSP Runway 12L and 12R ArrivalsM
ET
HO
DO
LOG
Y Collectively designed study objective and scope with residents.
Data analyzed from 2004 and 2013 through July 2016.
The following concerns were identified and evaluated:• Volume of arrival activity• Late-night and early-morning arrival activity• Arrival aircraft altitude trends• Frequency of arrival flights throughout the day• Arrival path changes
FIN
DIN
GS
• Increased arrival activity on Runways 12L and 12R between
2013 and 2015, although total number of arrivals to these
runways are lower than 2004
• Two factors leading to increases: southerly winds and new
separation standards for Converging Runway Operations
• Increased late-night and early-morning arrival activity
• There are peaks and valleys of activity throughout the day
• The peak hour of arrival activity occurs during the evening
• No substantive changes were found in aircraft altitudes
• Some spatial variations exist for flight segments prior to final
approach as a result of Area Navigation (RNAV) arrival
procedures
FIN
DIN
GS

Item 4: Study of MSP Runway 12L and 12R Arrivals
59
,72
0
40
,39
9
38
,66
4
45
,49
6
27
,79
0
58
,42
5
41
,92
1
41
,49
6
50
,88
8
32
,05
6
0%
10%
20%
30%
40%
50%
60%
0
10,000
20,000
30,000
40,000
50,000
60,000
2004 2013 2014 2015 2016*
AR
RIV
AL
PE
RC
EN
TA
GE
AR
RIV
AL
OP
ER
AT
ION
S
RUNWAY 12L AND 12R ARRIVAL USAGERUNWAY 12L RUNWAY 12R
1,5
46
1,7
06
1,9
23 2
,90
6
1,7
132
,60
7 3,6
08
4,1
38 4,8
81
3,1
02
0%
5%
10%
15%
20%
25%
30%
35%
0
1,000
2,000
3,000
4,000
5,000
6,000
2004 2013 2014 2015 2016*
AR
RIV
AL
PE
RC
EN
TA
GE
NIG
HT
TIM
E A
RR
IVA
L O
PE
RA
TIO
NS
RUNWAY 12L AND 12R NIGHTTIME ARRIVAL USAGERUNWAY 12L RUNWAY 12R
OPERATIONS

Item 4: Study of MSP Runway 12L and 12R Arrivals
0
2
4
6
8
1 0
1 2
1 4
1 6
1 8
2 0
2 2
JAN
FE
B
MA
R
AP
R
MA
Y
JUN
JUL
AU
G
SE
P
OC
T
NO
V
DE
C
JAN
FE
B
MA
R
AP
R
MA
Y
JUN
JUL
AU
G
SE
P
OC
T
NO
V
DE
C
JAN
FE
B
MA
R
AP
R
MA
Y
JUN
JUL
AU
G
SE
P
OC
T
NO
V
DE
C
JAN
FE
B
MA
R
AP
R
MA
Y
JUN
JUL
AU
G
SE
P
OC
T
NO
V
DE
C
JAN
FE
B
MA
R
AP
R
MA
Y
JUN
JUL
2 0 0 4 2 0 1 3 2 0 1 4 2 0 1 5 2 0 1 6
DA
YS
IN
SO
UT
H F
LO
W
DAYS IN A SOUTH OR STRAIGHT SOUTH FLOW
M A X C O N S E C U T I V E D A Y S T O T A L D A Y S
* * C O U N T S I N C L U D E D A Y S W H E R E S O U T H F L O W O R S T R A I G H T S O U T H F L O W W A S U S E D M O R E T H A N 8 H O U R S
SOUTH FLOW DAYS

Item 4: Study of MSP Runway 12L and 12R Arrivals
143 145153
184
116
173
210198
161
84
8 717 12
0
50
100
150
200
250
2004 2013 2014 2015 2016*
FLO
W D
AY
S
MSP RUNWAY CONFIGURATION FLOW DAYS
SOUTH NORTH MIXED A
* * N O R T H D E P I C T S B O T H N O R T H F L O W A N D S T R A I G H T N O R T H F L O W D A Y S* * S O U T H D E P I C T S B O T H S O U T H F L O W A N D S T R A I G H T S O U T H F L O W D A Y S
* * C O U N T S I N C L U D E D A Y S W H E R E T H E D O M I N A N T F L O W W A S U S E D A T L E A S T 8 H O U R S
SOUTH FLOW DAYS

Item 4: Study of MSP Runway 12L and 12R Arrivals
0
2 5 0
5 0 0
7 5 0
1 , 0 0 0
1 , 2 5 0
1 , 5 0 0
1 , 7 5 0
2 , 0 0 0
2 , 2 5 0
2 , 5 0 0
J M M J S N F A J A O D F A J A O D F A J A O D F A J
2 0 0 4 2 0 1 3 2 0 1 4 2 0 1 5 2 0 1 6
AL
TIT
UD
E (
FF
ET
)
12R AVERAGE ARRIVAL ALTITUDE
2 M I L E S 4 M I L E S 6 M I L E S 8 M I L E S
0
2 5 0
5 0 0
7 5 0
1 , 0 0 0
1 , 2 5 0
1 , 5 0 0
1 , 7 5 0
2 , 0 0 0
2 , 2 5 0
2 , 5 0 0
J F M A M J J A S O N D J F M A M J J A S O N D J F M A M J J A S O N D J F M A M J J A S O N D J F M A M J J
2 0 0 4 2 0 1 3 2 0 1 4 2 0 1 5 2 0 1 6
12L AVERAGE ARRIVAL ALTITUDE
2 M I L E S 4 M I L E S 6 M I L E S 8 M I L E S
ALTITUDE

Item 4: Study of MSP Runway 12L and 12R Arrivals
TYPICAL SOUTH FLOW DAY
3.7
1.8
0.9
0.9
1.4
10
.1
12
.6
31
.8 38
.4
49
.3
47
.2
39
.1
42
.5
51
.3
40
.4
51
.0
45
.4
58
.7
39
.1
49
.2
46
.8
25
.6
11
.0
8.0
0
10
20
30
40
50
60
70
80
MS
P A
RR
IVA
L O
PE
RA
TIO
NS
AVERAGE SOUTH FLOW ARRIVAL DAY IN 200412L 12R
4.4
1.3
0.9
1.2 2.3
10
.0
7.0
24
.3
40
.7
28
.1 36
.0
22
.3
34
.6
47
.9
31
.1
25
.6
49
.6
28
.0
54
.5
21
.8
38
.8
14
.0
13
.7
13
.1
0
10
20
30
40
50
60
70
80
MS
P A
RR
IVA
L O
PE
RA
TIO
NS
AVERAGE SOUTH FLOW ARRIVAL DAY IN 201412L 12R
6.2
2.4
1.4
1.4 3.1
12
.5
7.4
33
.2 39
.6
23
.9
33
.3
22
.2
34
.2 41
.4
32
.9
20
.8
50
.1
25
.5
59
.1
24
.2
36
.3
18
.9
12
.1 17
.1
0
10
20
30
40
50
60
70
80
MS
P A
RR
IVA
L O
PE
RA
TIO
NS
AVERAGE SOUTH FLOW ARRIVAL DAY IN 201612L 12R

Item 4: Study of MSP Runway 12L and 12R Arrivals
MSP WIND CONDITIONS
Percent of Time Wind
Favored these 2004 2013 2014 2015 2016
South Flow 39.6 38.5 38.7 42.5 41.2
North Flow 44.5 43.7 47.4 42.3 43.3
Calm 8.3 9.8 7.5 7.4 7.5
Crosswind 7.5 8.0 6.4 7.8 8.0
0 %
1 0 %
2 0 %
3 0 %
4 0 %
5 0 %
6 0 %
7 0 %
8 0 %
9 0 %
1 0 0 %
2 0 1 3 2 0 1 4 2 0 1 5 2 0 1 6 *
PE
RC
EN
T O
F T
IME
RUNWAY CONFIGURATION WHEN WINDS FAVOR SOUTH FLOW
S O U T H F L O W N O R T H F L O W M I X E D
0 %
1 0 %
2 0 %
3 0 %
4 0 %
5 0 %
6 0 %
7 0 %
8 0 %
9 0 %
1 0 0 %
2 0 1 3 2 0 1 4 2 0 1 5 2 0 1 6 *
PE
RC
EN
T O
F T
IME
RUNWAY CONFIGURATION WHEN WINDS FAVOR NORTH FLOW
S O U T H F L O W N O R T H F L O W M I X E D

Item 4: Study of MSP Runway 12L and 12R Arrivals
MSP WIND CONDITIONS
Percent of Time Wind
Favored these 2004 2013 2014 2015 2016
South Flow 39.6 38.5 38.7 42.5 41.2
North Flow 44.5 43.7 47.4 42.3 43.3
Calm 8.3 9.8 7.5 7.4 7.5
Crosswind 7.5 8.0 6.4 7.8 8.0
0%
10%
20%
30%
40%
50%
60%
2013 2014 2015 2016*
PE
RC
EN
T O
F T
IME
RUNWAY CONFIGURATION DURING CROSSWINDS
SOUTH FLOW NORTH FLOW
0%
10%
20%
30%
40%
50%
60%
2013 2014 2015 2016*
PE
RC
EN
T O
F T
IME
RUNWAY CONFIGURATION WHEN WINDS ARE CALM OR LIGHT
SOUTH FLOW NORTH FLOW

Item 4: Study of MSP Runway 12L and 12R Arrivals
MSP AREA NAVIGATION (RNAV)

Item 5: Update on the Impacts of Converging Runway Operations (CRO)
NOISE OVERSIGHT COMMITTEESEPTEMBER 21, 2016


Federal AviationAdministration
44September 21, 2016
MSP NOC Presentation
MSP ranked 16th busiest airport in the nation with over 400,000 operations per year.
Air Traffic Control primary duty is to provide a safe, orderly and expeditious flow of traffic to MSP and the surrounding airspace.
Safe – Ensuring aircraft separation and system safety in the air and on the ground
Orderly – Applying air traffic control rules to ensure system integrity –which in turn supports safety
Expeditious – Maintaining an efficient throughput of arrivals and departures, keeping demand and capacity in balance – again, this in turn supports safety
Noise Considerations - RUS Utilization
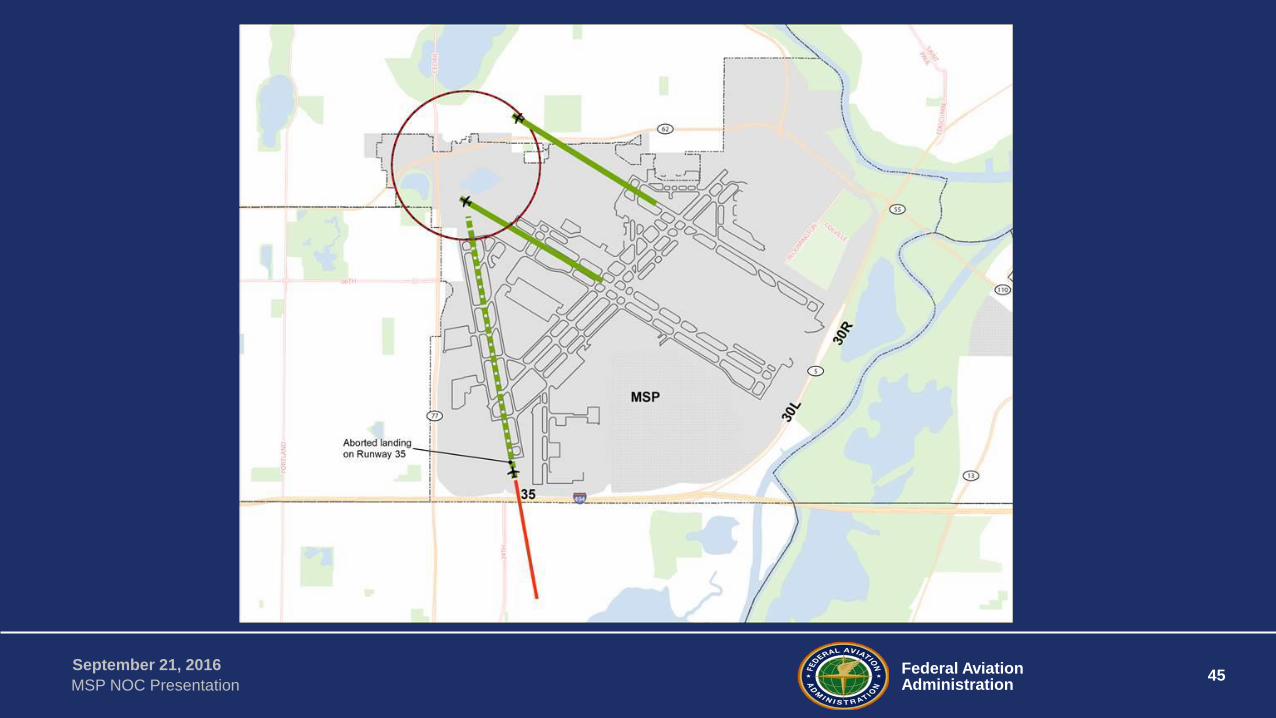
Federal AviationAdministration
45September 21, 2016
MSP NOC Presentation

Federal AviationAdministration
46September 21, 2016
MSP NOC Presentation46
Arrival Departure Window (ADW)
Depicted on radar maps to assist
controllers with departure decision
making criteria

Federal AviationAdministration
47September 21, 2016
MSP NOC Presentation47
Rwy 30L
“ADW”

Federal AviationAdministration
48September 21, 2016
MSP NOC Presentation48
Rwy 30L
“ADW”

Federal AviationAdministration
49September 21, 2016
MSP NOC Presentation
Land 30s & 35 Depart 30s

Federal AviationAdministration
50September 21, 2016
MSP NOC Presentation
Land 30s Depart 30s

Federal AviationAdministration
51September 21, 2016
MSP NOC Presentation
Land 12s Depart 12s and 17

Federal AviationAdministration
52September 21, 2016
MSP NOC Presentation
Land 30s Depart 30s & 17

Federal AviationAdministration
53September 21, 2016
MSP NOC Presentation
Land 35 Depart 12s

Federal AviationAdministration
54September 21, 2016
MSP NOC Presentation

Item 6: Update on Turboprop Departures over Mendota Heights
NOISE OVERSIGHT COMMITTEESEPTEMBER 21, 2016

Item 7: NextGen Standard Terminal Arrival Routes (STARs) Amendment Update
NOISE OVERSIGHT COMMITTEESEPTEMBER 21, 2016

Environmental Process for MSP Arrival
Procedure Amendments
September 21, 2016

Agenda
• National Environmental Policy Act (NEPA)• FAA environmental process• Process and status of environmental review for arrival
procedure amendments
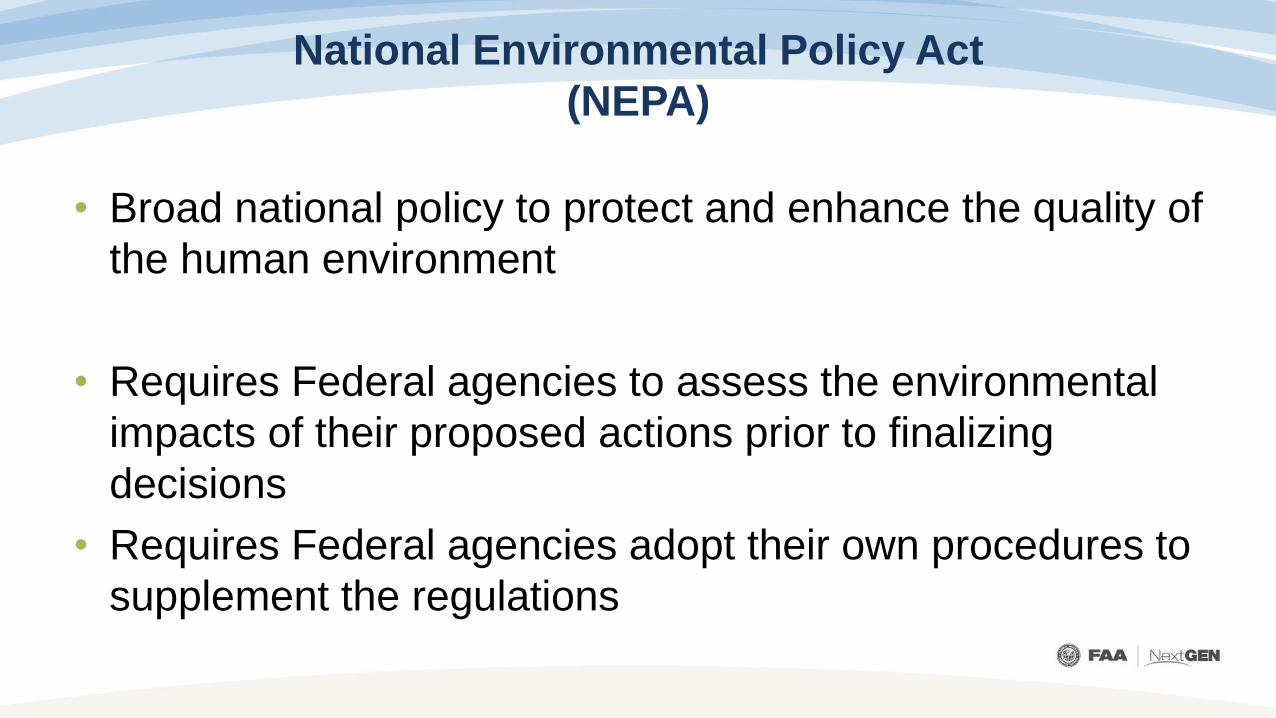
National Environmental Policy Act
(NEPA)
• Broad national policy to protect and enhance the quality of the human environment
• Requires Federal agencies to assess the environmental impacts of their proposed actions prior to finalizing decisions
• Requires Federal agencies adopt their own procedures to supplement the regulations

FAA Environmental Policy
• FAA Order 1050.1F Environmental Impacts: Policies and Procedures Order 7400.2K Procedures for Handling Airspace
Matters • Describes how the FAA is to implement NEPA
specifically for FAA actions• Defines impact categories that require analysis
Sets thresholds of significant levels
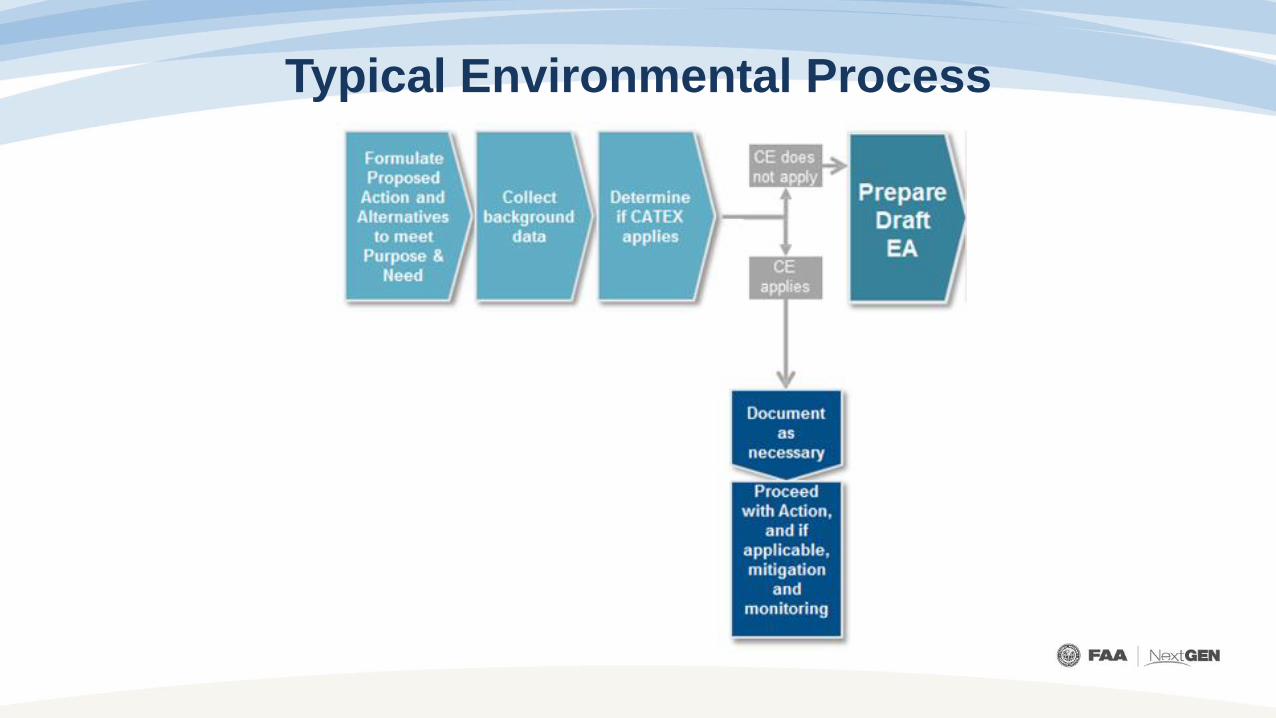
Typical Environmental Process

MSP Arrival Procedure Amendments

Environmental Review
• Air Traffic Initial Environmental Review (IER) Appendix 5 from Order 7400.2K Considers Extraordinary Circumstances Ensures NEPA compliance
• Noise Screen Looks at the possible change in noise from current conditions

Noise Screen Methodology
• 28 days of radar track data were selected for the MSP analysis
June 14 -20, 2015October 18 - 24, 2015
December 13 - 19, 2015March 13 - 19, 2016
• Aircraft fleet mix• Day/night traffic ratios• Lowest point of an altitude range was used

Noise Screen Methodology
• Aviation Environmental Design Tool (AEDT) Baseline and Alternative tracks are run for comparison Produces three outputs
• Baseline noise exposure• Alternative noise exposure• Noise impact

Environmental Findings
• Completed the IER and Noise Screen No extraordinary circumstances identified No significant or reportable noise identified
• Significant if 1.5 dB increase at the DNL 65 dB noise exposure level
• Qualifies for a CatEx under 5-6.5 i Air traffic control procedures conducted at or above 3,000 feet
AGL

Final Environmental Steps
• Categorical Exclusion package sent to Central Service Center for signature by the Director
• Available to the public

Thank you!

Item 8: Runway Use System (RUS) EvaluationNOISE OVERSIGHT COMMITTEESEPTEMBER 21, 2016
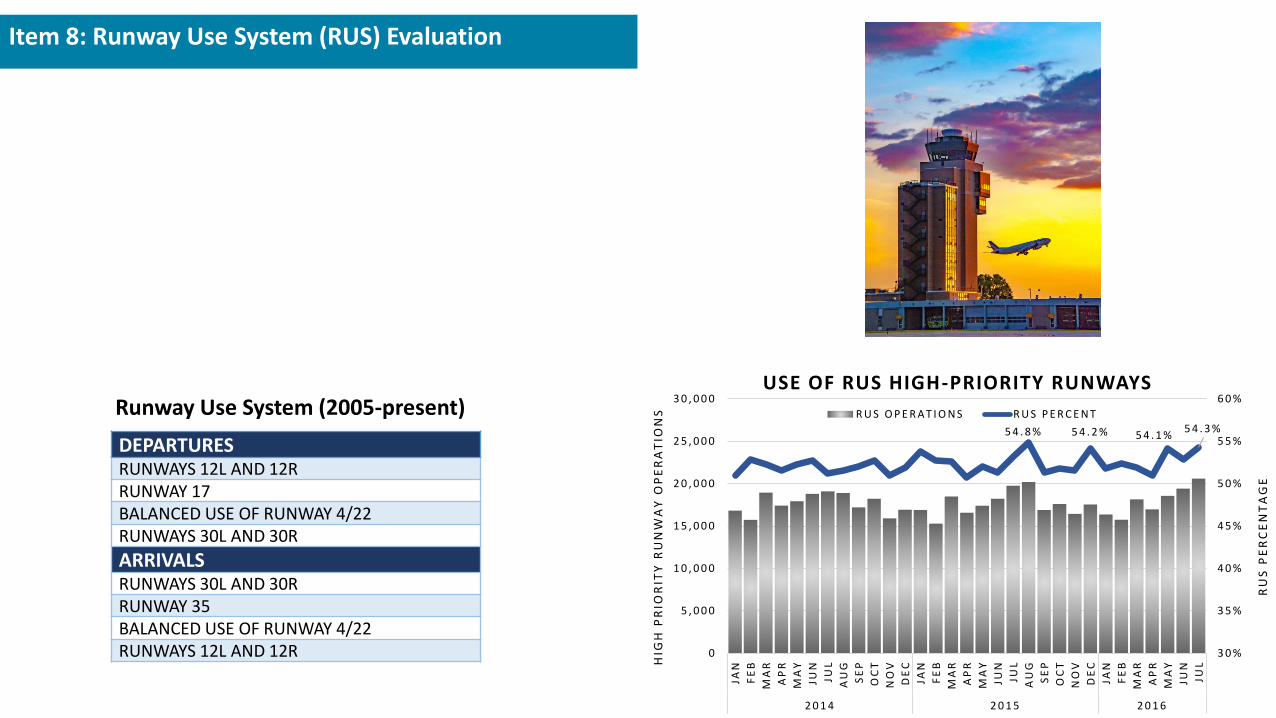
The 2016 NOC Work Plan includes an item to evaluate the use of the FAA Runway Use System (RUS).
The RUS prioritizes arrival and departure runways to promote flight activity over less-populated residential areas as much as possible.
Item 8: Runway Use System (RUS) Evaluation
DEPARTURESRUNWAYS 12L AND 12RRUNWAY 17BALANCED USE OF RUNWAY 4/22RUNWAYS 30L AND 30R
ARRIVALSRUNWAYS 30L AND 30RRUNWAY 35BALANCED USE OF RUNWAY 4/22RUNWAYS 12L AND 12R
Runway Use System (2005-present)5 4 . 8 % 5 4 . 2 % 5 4 . 1 %
5 4 . 3 %
3 0 %
3 5 %
4 0 %
4 5 %
5 0 %
5 5 %
6 0 %
0
5 , 0 0 0
1 0 , 0 0 0
1 5 , 0 0 0
2 0 , 0 0 0
2 5 , 0 0 0
3 0 , 0 0 0
JAN
FE
B
MA
R
AP
R
MA
Y
JUN
JUL
AU
G
SE
P
OC
T
NO
V
DE
C
JAN
FE
B
MA
R
AP
R
MA
Y
JUN
JUL
AU
G
SE
P
OC
T
NO
V
DE
C
JAN
FE
B
MA
R
AP
R
MA
Y
JUN
JUL
2 0 1 4 2 0 1 5 2 0 1 6
RU
S P
ER
CE
NT
AG
E
HIG
H P
RIO
RIT
Y R
UN
WA
Y O
PE
RA
TIO
NS
USE OF RUS HIGH-PRIORITY RUNWAYS
R U S O P E R A T I O N S R U S P E R C E N T

Item 8: Runway Use System (RUS) Evaluation
OPPOSITE FLOW
Maximizes RUS, however is used sparingly due to safety and capacity considerations.
0
2 0
4 0
6 0
8 0
1 0 0
1 2 0
JAN
FE
B
MA
R
AP
R
MA
Y
JUN
JUL
AU
G
SE
P
OC
T
NO
V
DE
C
JAN
FE
B
MA
R
AP
R
MA
Y
JUN
JUL
AU
G
SE
P
OC
T
NO
V
DE
C
JAN
FE
B
MA
R
AP
R
MA
Y
JUN
JUL
2 0 1 4 2 0 1 5 2 0 1 6
HO
UR
S I
N O
PP
OS
ITE
CO
NF
IGU
RA
TIN
ON
HOW OFTEN IS THE AIRPORT IN AN OPPOSITE FLOW CONFIGURATION?
0
10
20
30
40
50
60
70
80
90
100
0 1 2 3 4 5 6 7 8 9 10 11 12 13 14 15 16 17 18 19 20 21 22 23
CO
UN
T O
F H
OU
RS
IN O
PP
OSI
TE F
LOW
HOUR
WHEN IS THE AIRPORT IN AN OPPOSITE FLOW CONFIGURATION?Jan-August 2016

Item 8: Runway Use System (RUS) Evaluation
MIXED FLOW A
0
2 0
4 0
6 0
8 0
1 0 0
1 2 0
JAN
FE
B
MA
R
AP
R
MA
Y
JUN
JUL
AU
G
SE
P
OC
T
NO
V
DE
C
JAN
FE
B
MA
R
AP
R
MA
Y
JUN
JUL
AU
G
SE
P
OC
T
NO
V
DE
C
JAN
FE
B
MA
R
AP
R
MA
Y
JUN
JUL
2 0 1 4 2 0 1 5 2 0 1 6
HO
UR
S I
N M
IXE
D A
CO
NF
IGU
RA
TIN
ON
HOW OFTEN IS THE AIRPORT IN A 'MIXED A' CONFIGURATION?
0
5
10
15
20
25
30
35
40
45
50
0 1 2 3 4 5 6 7 8 9 10 11 12 13 14 15 16 17 18 19 20 21 22 23
CO
UN
T O
F H
OU
RS
IN A
MIX
ED A
HOUR
WHEN IS THE AIRPORT IN A 'MIXED A' CONFIGURATION?Jan-August 2016
Utilizes the top arrival runway priority (30L and 30R) and the 2nd departure runway priority (17) with limited departures on Runways 30L and 30R.

Item 9: Consent Decree Amendment UpdateNOISE OVERSIGHT COMMITTEESEPTEMBER 21, 2016
In May 2015, the FAA replaced the Integrated Noise Model (INM) with the Aviation Environmental Design Tool (AEDT).
Section 8.1(d) of the 2007 Consent Decree states:“By March 1 of each year, MAC shall develop and make available to the public a noise contour report using the FAA’s Integrated Noise Model to reflect noise conditions for the prior calendar year…”
MAC staff is working with the parties of the Consent Decree to update the language to allow the use of the FAA-approved noise modeling software.

Item 10: Draft 2017 NOC Work PlanNOISE OVERSIGHT COMMITTEESEPTEMBER 21, 2016
Item 10: Draft 2017 NOC Work Plan
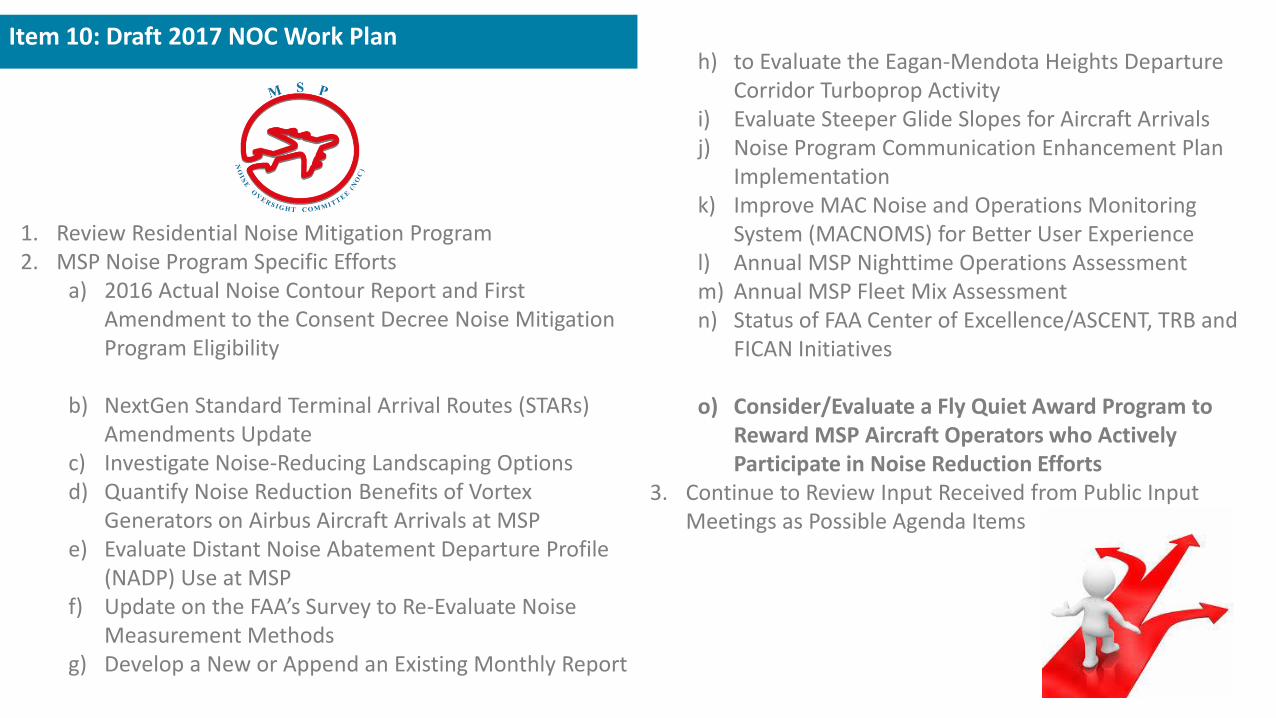
1. Review Residential Noise Mitigation Program2. MSP Noise Program Specific Efforts
a) 2016 Actual Noise Contour Report and First Amendment to the Consent Decree Noise Mitigation Program Eligibility
b) NextGen Standard Terminal Arrival Routes (STARs) Amendments Update
c) Investigate Noise-Reducing Landscaping Optionsd) Quantify Noise Reduction Benefits of Vortex
Generators on Airbus Aircraft Arrivals at MSPe) Evaluate Distant Noise Abatement Departure Profile
(NADP) Use at MSPf) Update on the FAA’s Survey to Re-Evaluate Noise
Measurement Methodsg) Develop a New or Append an Existing Monthly Report
h) to Evaluate the Eagan-Mendota Heights Departure Corridor Turboprop Activity
i) Evaluate Steeper Glide Slopes for Aircraft Arrivalsj) Noise Program Communication Enhancement Plan
Implementationk) Improve MAC Noise and Operations Monitoring
System (MACNOMS) for Better User Experiencel) Annual MSP Nighttime Operations Assessmentm) Annual MSP Fleet Mix Assessmentn) Status of FAA Center of Excellence/ASCENT, TRB and
FICAN Initiatives
o) Consider/Evaluate a Fly Quiet Award Program to Reward MSP Aircraft Operators who Actively Participate in Noise Reduction Efforts
3. Continue to Review Input Received from Public Input Meetings as Possible Agenda Items

Item 11: Review of July 27, 2016 Public Input MeetingNOISE OVERSIGHT COMMITTEESEPTEMBER 21, 2016
On July 27, 2016 MAC Noise Program Office staff conducted the 3rd
Quarter 2016 Public Input Meeting.
One resident attended the meeting and also submitted the Public InputMeeting website form.
MAC staff had a focused discussion with the resident covering informationabout the FAA’s decision-making and consideration of community impactfrom aircraft overflights and the difference between the impact on thecommunity from MSP and from Denver International Airport.
Representatives from the FAA and the airlines were in attendance andjoined in the discussion.
While the questions were answered in person, staff also responded inwriting and posted them on the website under For Our Neighbors – PublicInput Meetings.
The next quarterly public input meeting will be October 26,2016, 7:00 p.m., at the MAC General Offices – LindberghRoom
Item 12: Public CommentNOISE OVERSIGHT COMMITTEESEPTEMBER 21, 2016

Item 13: Announcements
Next NOC meeting
November 16, 2016 @ 1:30 PM
MAC General Offices – Lindbergh Room
4th Quarter Public Input Meeting
October 26, 2016 @ 7:00 PM
MAC General Offices – Lindbergh Room
NOISE OVERSIGHT COMMITTEESEPTEMBER 21, 2016