Embed Size (px)
Citation preview

No. 755
ISSUE BRIEFPharmaceutical Marketplace DynamicsWednesday, May 31, 2000Washington, DC
A background briefing featuring
Glenna M. Crooks, Ph.D.President and Chief Executive OfficerStrategic Health Policy InternationalFort Washington, Pennsylvania
Judith L. Wagner, Ph.D.Principal AnalystCongressional Budget Office
John M. Coster, Ph.D., R.Ph.Vice PresidentFederal and State ProgramsNational Association of Chain Drug Stores
Dan MendelsonManaging DirectorHealth Strategies ConsultancyWashington, D.C.
Patricia M. Danzon, Ph.D.Celia Moh ProfessorWharton SchoolUniversity of Pennsylvania
followed by a luncheon discussion featuring
John F. Hoadley, Ph.D.DirectorDivision of Health Financing PolicyOffice of the Assistant Secretary for Planning and EvaluationDepartment of Health and Human Services
2
ISSUE BRIEF/No. 755
Analyst/Writer: Robin J. Strongin
National Health Policy Forum2021 K Street, NW, Suite 800Washington, DC 20052202/872-1390202/862-9837 (fax)[email protected] (e-mail)www.nhpf.org (Web site)
Judith Miller Jones, DirectorKaren Matherlee, Co-DirectorJudith D. Moore, Co-DirectorMichele Black, Publications Director
NHPF is a nonpartisan education and informationexchange for federal health policymakers.
Rx Marketplace Dynamics
The pharmaceutical marketplace is a complex amal-gam of competing interests. There is no one specificpharmaceutical marketplace. There is no one price for aspecific drug product. There are multiple customers,multiple distribution channels, multiple prescription drugreimbursement systems, multiple purchasing arrange-ments, multiple pricing methodologies, multiple market-ing techniques, and multiple cost control tools. As historyhas shown, legislation, regulation, and market adjust-ments in one sector of the market often result in a chainreaction of intended and unintended consequencesthroughout the entire pharmaceutical marketplace.
Lawmakers considering how best to provide outpa-tient prescription drugs to Medicare beneficiaries arekeenly aware of these consequences. As the debatecontinues, numerous issues and questions have beenraised. The answers, however, are often cloaked inrhetoric and blanketed in politics. Terms meaning differ-ent things to different people are tossed around freely.The economics of the pharmaceutical marketplace areextremely complex: the companies themselves range insize from newly merged behemoths to very small one-product start-ups; some of the manufacturers are multina-tional, spanning the globe, while others are domestic andstill others are foreign companies seeking to do businessin America. Despite their differences, each company hasthe identical goal—to be profitable. Herein lies the rub.The prescription drug industry—the most profitable of allU.S. industries, based on revenue, equity and assets,according to Fortune Magazine—represents both thegreatest strengths and the greatest weaknesses of Amer-ican capitalism. “Hardly a day has gone by lately withoutsome new reflection of the tension between the commer-cial and scientific accomplishments of the drug compa-nies on the one hand, and the disparity in the spread of thebenefits from those accomplishments.”1
Much of today’s political dialogue revolves aroundthe notion of profitability and “public good.” Howmuch profit is too much? Who should decide? Profit-ability and price, patents and promise—all are at thecore of today’s congressional debates. Arguments flyaround Capitol Hill: on the one hand, many of theelderly upset with the high cost of drugs are delightedwhen their drug company stock dividends continue tosoar; on the other hand, those representing the low-income elderly argue that seniors should not have tochoose between necessities to be able to afford life-sustaining medication. Some groups claim that the only
way Medicare beneficiaries can afford their drugs is tobuy them in Canada or Mexico; others point out thatproblems are so great in the health care systems in thesecountries that Canadian and other citizens are comingby busloads into America to purchase care. Thesearguments hold for the non-elderly as well.
In an effort to get beyond the hype, the Forum hasorganized this background briefing. The session has beenstructured as a one-half day institute, a tutorial on pharma-ceutical marketplace dynamics. It will explain how themarketplace works by exploring a number of topics,including competition, generics, intellectual property,research and development, pricing, distribution, andcurrent federal programs such as the Department ofVeterans’ Affairs federal supply schedule and Medicaidrebates. Following this discussion will be a luncheonbriefing highlighting Prescription Drug Coverage,Spending, Utilization, and Prices, the April 2000 reportto the president from the Office of the Assistant Secretaryfor Planning and Evaluation (ASPE), Department ofHealth and Human Services (DHHS).
PHARMACEUTICAL INDUSTRYPROFILE
According to a new University of Maryland School ofPharmacy study sponsored by the BlueCross BlueShieldAssociation of America and reported in the April 24,
3
2000, issue of Medicine and Health, “U.S. pharmaceuti-cal spending in 2004 will total $212 billion—more thantwice last year’s total of $105 billion.” The study alsoreports that “prescription drug spending will rise 15-to-18percent annually over the next five years.”
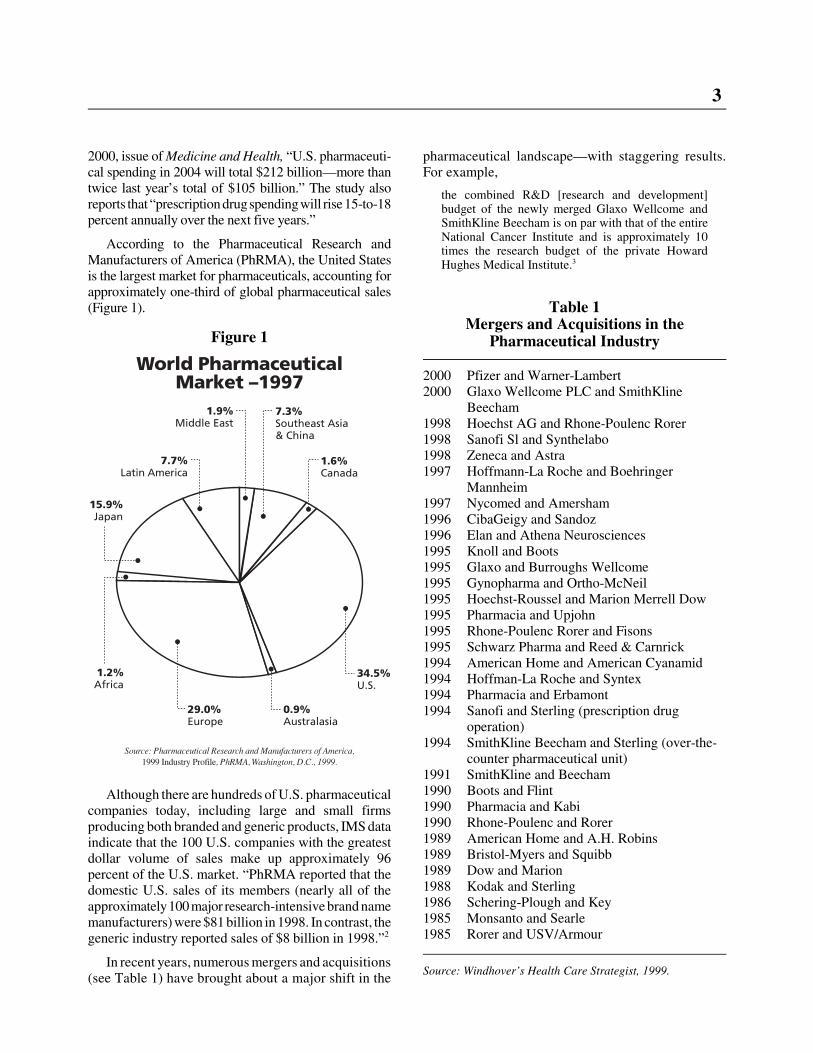
According to the Pharmaceutical Research andManufacturers of America (PhRMA), the United Statesis the largest market for pharmaceuticals, accounting forapproximately one-third of global pharmaceutical sales(Figure 1).
Although there are hundreds of U.S. pharmaceuticalcompanies today, including large and small firmsproducing both branded and generic products, IMS dataindicate that the 100 U.S. companies with the greatestdollar volume of sales make up approximately 96percent of the U.S. market. “PhRMA reported that thedomestic U.S. sales of its members (nearly all of theapproximately 100 major research-intensive brand namemanufacturers) were $81 billion in 1998. In contrast, thegeneric industry reported sales of $8 billion in 1998.”2
In recent years, numerous mergers and acquisitions(see Table 1) have brought about a major shift in the
pharmaceutical landscape—with staggering results.For example,
the combined R&D [research and development]budget of the newly merged Glaxo Wellcome andSmithKline Beecham is on par with that of the entireNational Cancer Institute and is approximately 10times the research budget of the private HowardHughes Medical Institute.3
Table 1Mergers and Acquisitions in the
Pharmaceutical Industry
2000 Pfizer and Warner-Lambert2000 Glaxo Wellcome PLC and SmithKline
Beecham1998 Hoechst AG and Rhone-Poulenc Rorer1998 Sanofi Sl and Synthelabo1998 Zeneca and Astra1997 Hoffmann-La Roche and Boehringer
Mannheim1997 Nycomed and Amersham1996 CibaGeigy and Sandoz1996 Elan and Athena Neurosciences1995 Knoll and Boots1995 Glaxo and Burroughs Wellcome1995 Gynopharma and Ortho-McNeil1995 Hoechst-Roussel and Marion Merrell Dow1995 Pharmacia and Upjohn1995 Rhone-Poulenc Rorer and Fisons1995 Schwarz Pharma and Reed & Carnrick1994 American Home and American Cyanamid1994 Hoffman-La Roche and Syntex1994 Pharmacia and Erbamont1994 Sanofi and Sterling (prescription drug
operation)1994 SmithKline Beecham and Sterling (over-the-
counter pharmaceutical unit)1991 SmithKline and Beecham1990 Boots and Flint1990 Pharmacia and Kabi1990 Rhone-Poulenc and Rorer1989 American Home and A.H. Robins1989 Bristol-Myers and Squibb1989 Dow and Marion1988 Kodak and Sterling1986 Schering-Plough and Key1985 Monsanto and Searle1985 Rorer and USV/Armour
Source: Windhover’s Health Care Strategist, 1999.
Figure 1

4
Industry officials argue that, although these newlymerged titans are vast, they hold a relatively small shareof the total drug market. The flip side, according tocritics, is that individual companies dominate specifictherapeutic markets. For example, “Schering-Ploughcontrols 40 percent of the market for allergy medicines;and Warner-Lambert controls 48 percent of the market forcholesterol drugs. Glaxo SmithKline, as the new companywill be called, will dominate the market for asthma,AIDS, and migraine drugs, as well as for vaccines.”4
Consumer advocates are worried that these mergerscould lead to fewer drug products and higher prices.Company spokespersons point out that merger andacquisitions ultimately benefit consumers by strength-ening their R&D pipelines.
RESEARCH AND DEVELOPMENT
Research and development in the pharmaceuticalarena is risky business. According to PhRMA,
� U.S. pharmaceutical companies will spend $26.4billion this year to discover and develop newmedicines.
� It costs an average of $500 million to discover anddevelop just one new medicine. It takes nearly 15years from the time a drug is discovered in thelaboratory until it gets to the drug store.
� The United States leads the world in developingnew medicines. Of the 152 major medicineslaunched worldwide over the last 20 years, U.S.companies developed nearly half.
� Pharmaceutical companies now put back $1 out ofevery $5 in revenues for R&D.
Over the years, the relationship between pharmaceu-tical R&D and profit—18.5 percent return on grossrevenues in 1998, among pharmaceutical firms in theFortune 500—have ignited heated discussions in andaround Capitol Hill. Studies have been commissioned,hearings have been held, and countless policy debateshave taken place. But, points of contention remain.
On the one hand, says Stephen Schondelmeyer, apharmacoeconomist and professor in the University ofMinnesota’s College of Pharmacy,
the drug companies give the impression that they needthose profits to fund R&D. But, no, that’s not true.The 18.5 percent profit is accounted for separatelyfrom the 20 percent they say they spend on R&D. . . .On average, for every $100 spent on a drug at themanufacturer’s level, the actual cost of making it isabout $10 to $15. A further $20 goes to R&D. About$15 goes to taxes and administrative costs. About $30
goes to advertising and marketing. And about $20 isprofit.5
When asked if the industry could afford to lower itsdrug prices, given its robust profit margins, the industryanswer is “Without reasonable returns on R&D invest-ments, companies will not attract the investment capitalneeded to fund ongoing research to discover anddevelop lifesaving, cost-effective medicines, of whichabout 600 are in the pipeline.”6 The president ofPhRMA, Alan F. Holmer, has reiterated in writtenstatements and in testimony that, should market dynam-ics and legislative action negatively affect prices andprofits, R&D activity would not come to a screechinghalt; rather, research cutbacks would ensue and priori-ties would shift, effectively placing some diseases onthe research “back burner.”
In many ways, companies are being forced to rethinktheir R&D portfolios as the very nature of R&D itselfis changing. As a result of sophisticated new tools, suchas computer modeling, 3-D computer-visualizationtechniques, combinational chemistry, and X-ray crystal-lography, the process of discovery, while still somewhatserendipitous, is much less haphazard than it was 20years ago.
As the biotechnology revolution advances and as theHuman Genome Project is completed, the very essenceof our understanding of disease and therapy is undergo-ing a profound shift. Scientists today now realize thatmany diseases are actually a collection of severaldifferent diseases, each with a unique molecular cause.
The idea, therefore, of identifying a magic bullet thatworks for all cancer or all heart disease seems increas-ingly naive. Not surprisingly, big drug companies areterrified by a future in which they must develop adifferent drug for each type of hypertension, ratherthan a single blockbuster product.7
These scientific advances could prove to be a double-edged sword for some pharmaceutical companies.
For big pharmaceutical companies, the inevitable lossof market share caused by niche drug production willbe offset both by the opportunity to intensify collabo-rations with thoughtful clinical investigators, and theability to discover, develop and market new drugsmore economically. The large R&D budgets affordedby the recent pharmaceutical mergers offer the oppor-tunity to set aside a fraction of these resources toexplore such an approach. If big drug companies don’tseize this moment, someone else will.8
Today, innovation and discovery are occurring notonly inside but also outside the large pharmaceuticalcompanies.
5
Drug mergers could create a crisis in innovation,turning today’s pharmaceutical giants into tomorrow’sdistribution centers, reliant on more creative outsideresearch firms. To avoid this, big companies will haveto divert some of their research money into new, moreeffective approaches to drug creation.9
The market will continue to reconfigure itself as the“race for the cures” continues.
Along these lines, the Wall Street Journal reported thefollowing in a February 9, 2000, article, “After Drug-FirmMergers, the Prescription Is on the Wall for More”:
Pharmaceutical companies have been scooping upbiotech concerns for their drug prospects. . . . But thatwas when biotech stocks were out of favor and drugstocks were strong. Due to the recent rise in biotechstocks, many trade at multiples greatly higher thantraditional pharmaceutical companies. This makesmany targets prohibitively expensive. . . . Though itseems far-fetched, one investor said he wouldn’t besurprised to see a major biotech company such asAmgen acquire a traditional pharmaceutical concernfor its sales and marketing.
It is clear that as the secrets of genomics aredemystified, promising new miracle products (drugsmay no longer be the correct term) will become avail-able. Financing and discovering these products are onlypart of the risk for a company. The ability to recoupR&D investments is another.
PATENTSPatent protection is essential for companies invest-
ing in pharmaceutical R&D. Unlike many other techno-logical advances, a drug product, once discovered, isrelatively easy to reproduce. Without the period ofmarket exclusivity that patents provide, companieswould not have the opportunity to recoup their R&Dinvestments. Some argue that patents provide a monop-oly, a barrier to market entry for competing products.The other side of that has been articulated by theCongressional Budget Office (CBO):
Patents do not grant complete monopoly power in thepharmaceutical industry. The reason is that companiescan frequently discover and patent several differentdrugs that use the same basic mechanism to treat anillness. The first drug using the new mechanism totreat that illness—the breakthrough drug—usually hasbetween one and six years on the market before atherapeutically similar patented drug (sometimescalled a ‘me-too’ drug) is introduced.10
As the future of medical research itself changes, patentpolicy will face interesting challenges. For example, thearea of genetic research has raised significant issues, such
as what is patentable (that is, are gene sequences bonafide inventions?).11 As reported in the February 21, 2000,American Medical News article “Gene Patents RaiseConcerns for Researchers, Clinicians,” by Vida Foubister:“The proliferation of patents for specific gene sequencesmay increase costs and decrease quality of diagnosticlaboratory testing, limiting access for patients and trainingopportunities for physicians.”
While the future of patenting and biotechnology isstill unfolding, past patent legislation and regulation arestill affecting today’s pharmaceutical market. This istrue both domestically and abroad, where patent piracycosts the industry hundreds of millions of dollars a year,despite various provisions agreed to in NAFTA (theNorth American Free Trade Agreement) and GATT(the General Agreement on Tariffs and Trade).
The 1984 Drug Price Competition andPatent Term Restoration Act
Domestically, the prescription drug market wasradically altered with the passage of the 1984 DrugPrice Competition and Patent Term Restoration Act(commonly referred to as the Hatch-Waxman Act afterits authors, Sen. Orrin G. Hatch [R-Utah] and Rep.Henry A. Waxman [D-Calif.]). The act was
intended to strike a balance between promotinginnovation (by guaranteeing makers of brand-namedrugs a certain number of patent years) and ensuringthat consumers have timely access to lower-costgeneric medicines (by guaranteeing makers of genericdrugs that those patents would eventually end).12
GENERICS
Since the 1980s, the use of generics has continued toincrease (see Table 2). Along with the passage of Hatch-Waxman, the passage of drug-product substitution laws(at the state level) allowing pharmacists to dispense ageneric, even in the case of a brand-name prescription,and the active promotion of generic substitution bygovernment health programs and private health planshave all spurred the increase in generic sales.
Some analysts, such as Elliot Wilbur, a securitiesanalyst with CIBC World Markets in Los Angeles, areof the opinion that
The coming bull market in generics’ stocks will befueled by a never-before-seen combination of surgingsupply and powerful demand. On the supply side,Wilbur points out that more than $30 billion worth ofbrand-name drugs will go off patent over the next fiveyears. That’s more than six times the dollar level that

6
Table 2Prescription Drugs Facts and Figures
1993 1994 1995 1996 1997 1998
Rx Sales (in billions of dollars)
Total 54.3 58.6 64.4 72.1 81.2 94.0
Brands 48.5 51.6 56.5 64.6 73.4 86.0
Generics 5.8 7.0 7.9 7.5 7.8 8.0
% of Total Rx Sales
Brands 89.4 88.1 87.8 89.6 90.4 91.4
Generics 10.6 11.9 12.2 10.4 9.6 8.6
No. of Prescriptions Sold (in billions)
Total NA 2.1 2.2 2.3 2.4 2.6
Brands NA 1.2 1.3 1.3 1.4 1.5
Generics NA 0.8 6 0.92 0.98 1.0 1.1
% of Total No. of Prescriptions Sold
Brands 61.4 59.1 58.0 57.5 58.0 58.7
Generics 38.6 40.9 42.0 42.5 42.0 41.3
Source: Generic Pharmaceutical Industry Association; accessed April 27, 2000, at http://www. gpia.org/edu_facts.html
has been available to the generic industry over the pastfour years. At the same time, says Wilbur, nearly halfof all HMOs now include generic compliance stipula-tions as part of their financial incentive packagesoffered to physicians. Wilbur anticipates that numberwill climb to 75 percent over the next five years.13
The opportunity for expansion of generic sales isfurther illustrated in Figure 2.
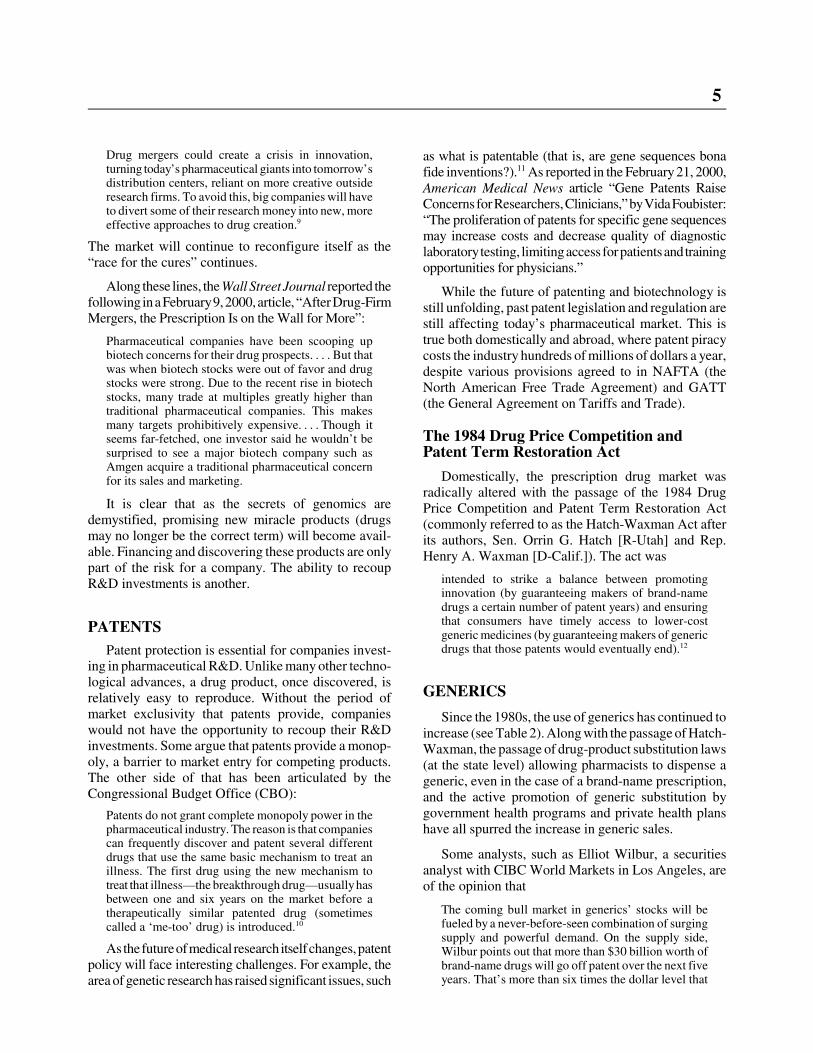
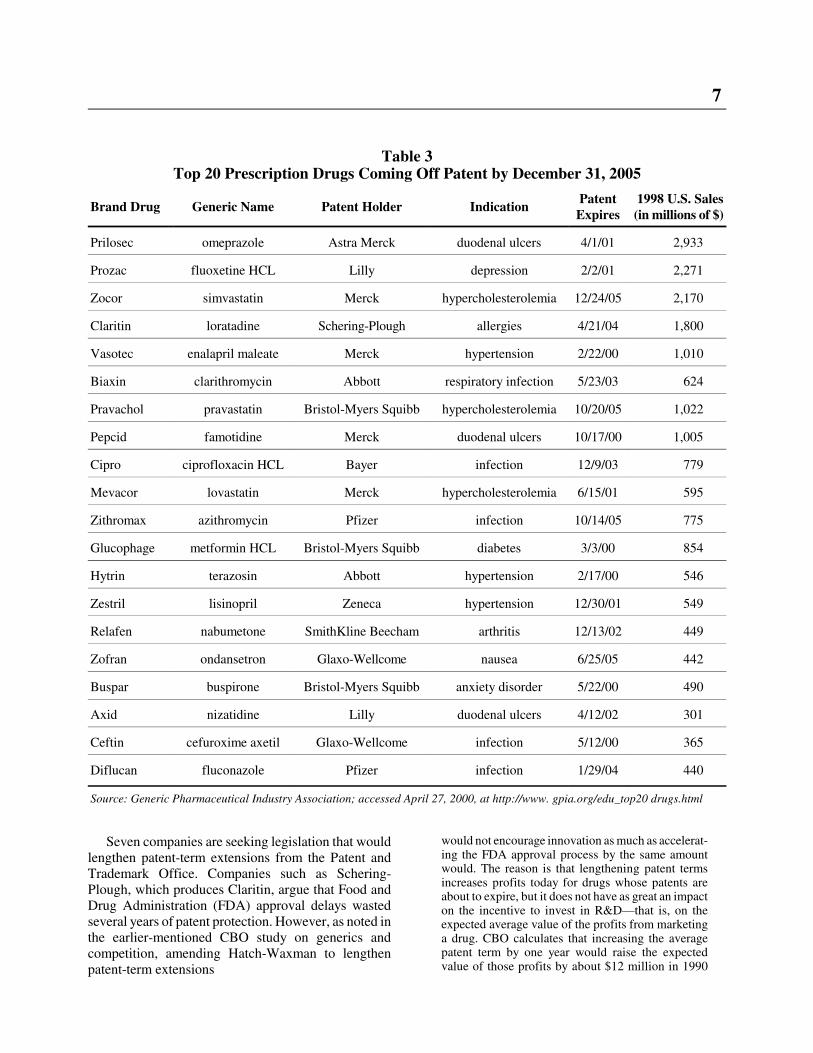
With a significant number of top-selling prescriptiondrugs coming off patent in the next few years (Table 3),brand-name research pharmaceutical companies areseeking ways to extend their patent protection. Oneoption has been to revise the 1984 Hatch-Waxman Act.While Waxman agrees that the market is different todayand recognizes the changing nature of the drug products,he has expressed concern over the motivations of someof the companies seeking legislative revisions. In arecent speech to an industry group, Waxman articulated
the need to stop—once and for all—the numerousefforts to obtain patent extensions benefitting a few atthe expense of many. I am talking about efforts tosecure special patent extensions and special exten-sions of market exclusivity, in direct contravention ofthe Waxman-Hatch Act and its underlying purpose.14
Figure 2
7
Table 3Top 20 Prescription Drugs Coming Off Patent by December 31, 2005
Brand Drug Generic Name Patent Holder IndicationPatentExpires
1998 U.S. Sales(in millions of $)
Prilosec omeprazole Astra Merck duodenal ulcers 4/1/01 2,933
Prozac fluoxetine HCL Lilly depression 2/2/01 2,271
Zocor simvastatin Merck hypercholesterolemia 12/24/05 2,170
Claritin loratadine Schering-Plough allergies 4/21/04 1,800
Vasotec enalapril maleate Merck hypertension 2/22/00 1,010
Biaxin clarithromycin Abbott respiratory infection 5/23/03 624
Pravachol pravastatin Bristol-Myers Squibb hypercholesterolemia 10/20/05 1,022
Pepcid famotidine Merck duodenal ulcers 10/17/00 1,005
Cipro ciprofloxacin HCL Bayer infection 12/9/03 779
Mevacor lovastatin Merck hypercholesterolemia 6/15/01 595
Zithromax azithromycin Pfizer infection 10/14/05 775
Glucophage metformin HCL Bristol-Myers Squibb diabetes 3/3/00 854
Hytrin terazosin Abbott hypertension 2/17/00 546
Zestril lisinopril Zeneca hypertension 12/30/01 549
Relafen nabumetone SmithKline Beecham arthritis 12/13/02 449
Zofran ondansetron Glaxo-Wellcome nausea 6/25/05 442
Buspar buspirone Bristol-Myers Squibb anxiety disorder 5/22/00 490
Axid nizatidine Lilly duodenal ulcers 4/12/02 301
Ceftin cefuroxime axetil Glaxo-Wellcome infection 5/12/00 365
Diflucan fluconazole Pfizer infection 1/29/04 440
Source: Generic Pharmaceutical Industry Association; accessed April 27, 2000, at http://www. gpia.org/edu_top20 drugs.html
Seven companies are seeking legislation that wouldlengthen patent-term extensions from the Patent andTrademark Office. Companies such as Schering-Plough, which produces Claritin, argue that Food andDrug Administration (FDA) approval delays wastedseveral years of patent protection. However, as noted inthe earlier-mentioned CBO study on generics andcompetition, amending Hatch-Waxman to lengthenpatent-term extensions
would not encourage innovation as much as accelerat-ing the FDA approval process by the same amountwould. The reason is that lengthening patent termsincreases profits today for drugs whose patents areabout to expire, but it does not have as great an impacton the incentive to invest in R&D—that is, on theexpected average value of the profits from marketinga drug. CBO calculates that increasing the averagepatent term by one year would raise the expectedvalue of those profits by about $12 million in 1990
8
dollars. Accelerating the FDA review period by oneyear would boost returns by much more—about $22million in 1990 dollars.
Generic Equivalents: Today and Tomorrow
According to the Generic Pharmaceutical IndustryAssociation, the FDA uses three terms to describegeneric drug products: pharmaceutical equivalence,bioequivalence, and therapeutic equivalence. Each isdiscussed below.
� Pharmaceutical equivalence—drug products areconsidered pharmaceutical equivalents if theyhave the same active ingredient(s), the samedosage form and are identical in strength as thebrand-name product. Even if a generic has adifferent color, a different taste, or comes in adifferent shape or package, the FDA considers theproduct to be equivalent if it meets the samestandards for strength, quality, purity and identityas the branded product.
� Bioequivalence—a generic drug is consideredbioequivalent if it is absorbed in the bloodstreamat the “same rate and extent” as the brand drug.
� Therapeutic equivalence—a generic drug isconsidered therapeutically equivalent to thecomparable brand when the FDA determines thegeneric is safe and effective, pharmaceuticallyequivalent, and bioequivalent.
Because biologics (for example, human growthhormone) are difficult to produce and because the FDAcurrently has no mechanism for measuring the equiva-lency of generic biotech-based drug products, produc-ing generics in the future will become more compli-cated. “For the forseeable future, generic manufacturersessentially have to repeat all the development andapproval steps that the patent producers do.”15 Theoverall effect of this on the market, on competition, andon price, sales, and expenditures remains to be seen.
DRUG EXPENDITURES
As reported in the March 2000 Kaiser Family Foun-dation white paper, “Medicare and Prescription Drugs,”
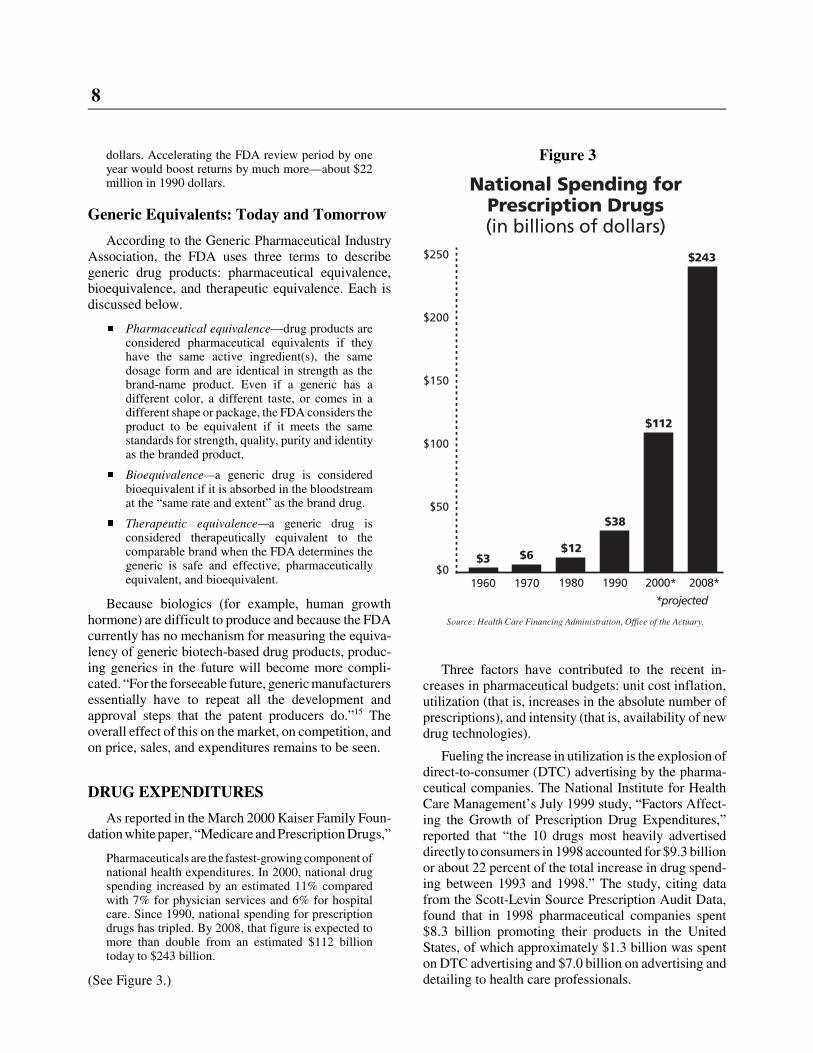
Pharmaceuticals are the fastest-growing component ofnational health expenditures. In 2000, national drugspending increased by an estimated 11% comparedwith 7% for physician services and 6% for hospitalcare. Since 1990, national spending for prescriptiondrugs has tripled. By 2008, that figure is expected tomore than double from an estimated $112 billiontoday to $243 billion.
(See Figure 3.)
Three factors have contributed to the recent in-creases in pharmaceutical budgets: unit cost inflation,utilization (that is, increases in the absolute number ofprescriptions), and intensity (that is, availability of newdrug technologies).
Fueling the increase in utilization is the explosion ofdirect-to-consumer (DTC) advertising by the pharma-ceutical companies. The National Institute for HealthCare Management’s July 1999 study, “Factors Affect-ing the Growth of Prescription Drug Expenditures,”reported that “the 10 drugs most heavily advertiseddirectly to consumers in 1998 accounted for $9.3 billionor about 22 percent of the total increase in drug spend-ing between 1993 and 1998.” The study, citing datafrom the Scott-Levin Source Prescription Audit Data,found that in 1998 pharmaceutical companies spent$8.3 billion promoting their products in the UnitedStates, of which approximately $1.3 billion was spenton DTC advertising and $7.0 billion on advertising anddetailing to health care professionals.
Figure 3
9
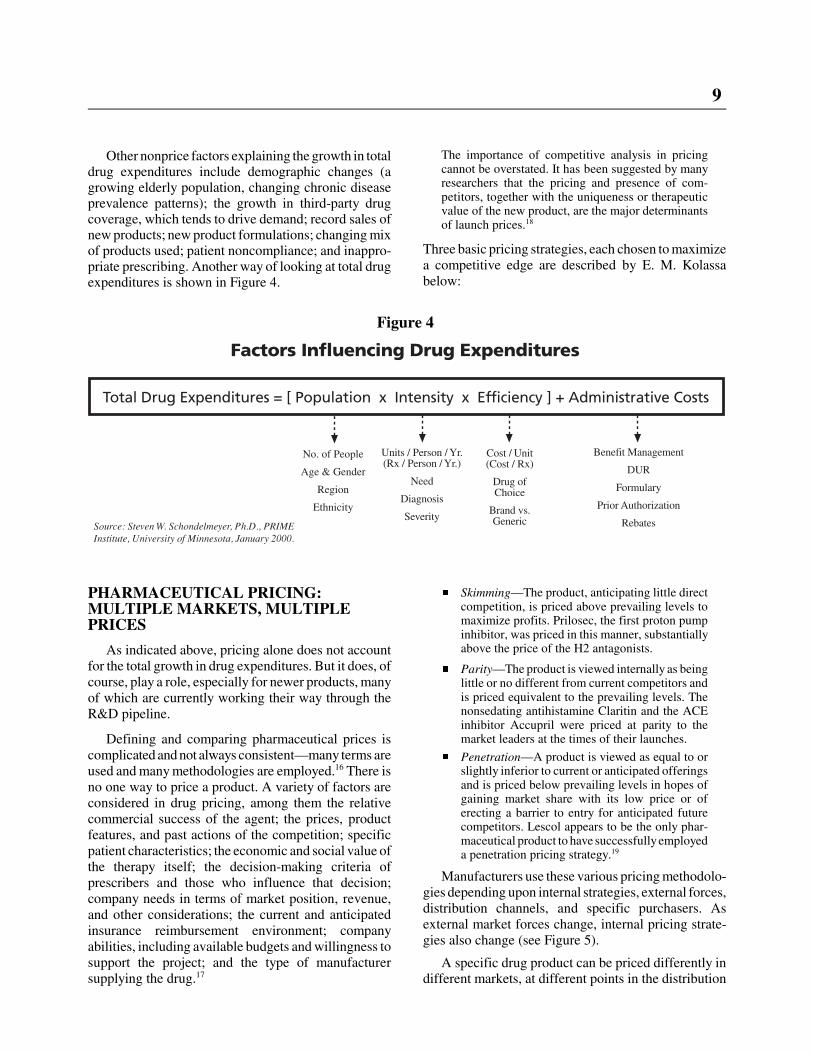
Other nonprice factors explaining the growth in totaldrug expenditures include demographic changes (agrowing elderly population, changing chronic diseaseprevalence patterns); the growth in third-party drugcoverage, which tends to drive demand; record sales ofnew products; new product formulations; changing mixof products used; patient noncompliance; and inappro-priate prescribing. Another way of looking at total drugexpenditures is shown in Figure 4.
PHARMACEUTICAL PRICING:MULTIPLE MARKETS, MULTIPLEPRICES
As indicated above, pricing alone does not accountfor the total growth in drug expenditures. But it does, ofcourse, play a role, especially for newer products, manyof which are currently working their way through theR&D pipeline.
Defining and comparing pharmaceutical prices iscomplicated and not always consistent—many terms areused and many methodologies are employed.16 There isno one way to price a product. A variety of factors areconsidered in drug pricing, among them the relativecommercial success of the agent; the prices, productfeatures, and past actions of the competition; specificpatient characteristics; the economic and social value ofthe therapy itself; the decision-making criteria ofprescribers and those who influence that decision;company needs in terms of market position, revenue,and other considerations; the current and anticipatedinsurance reimbursement environment; companyabilities, including available budgets and willingness tosupport the project; and the type of manufacturersupplying the drug.17
The importance of competitive analysis in pricingcannot be overstated. It has been suggested by manyresearchers that the pricing and presence of com-petitors, together with the uniqueness or therapeuticvalue of the new product, are the major determinantsof launch prices.18
Three basic pricing strategies, each chosen to maximizea competitive edge are described by E. M. Kolassabelow:
� Skimming—The product, anticipating little directcompetition, is priced above prevailing levels tomaximize profits. Prilosec, the first proton pumpinhibitor, was priced in this manner, substantiallyabove the price of the H2 antagonists.
� Parity—The product is viewed internally as beinglittle or no different from current competitors andis priced equivalent to the prevailing levels. Thenonsedating antihistamine Claritin and the ACEinhibitor Accupril were priced at parity to themarket leaders at the times of their launches.
� Penetration—A product is viewed as equal to orslightly inferior to current or anticipated offeringsand is priced below prevailing levels in hopes ofgaining market share with its low price or oferecting a barrier to entry for anticipated futurecompetitors. Lescol appears to be the only phar-maceutical product to have successfully employeda penetration pricing strategy.19
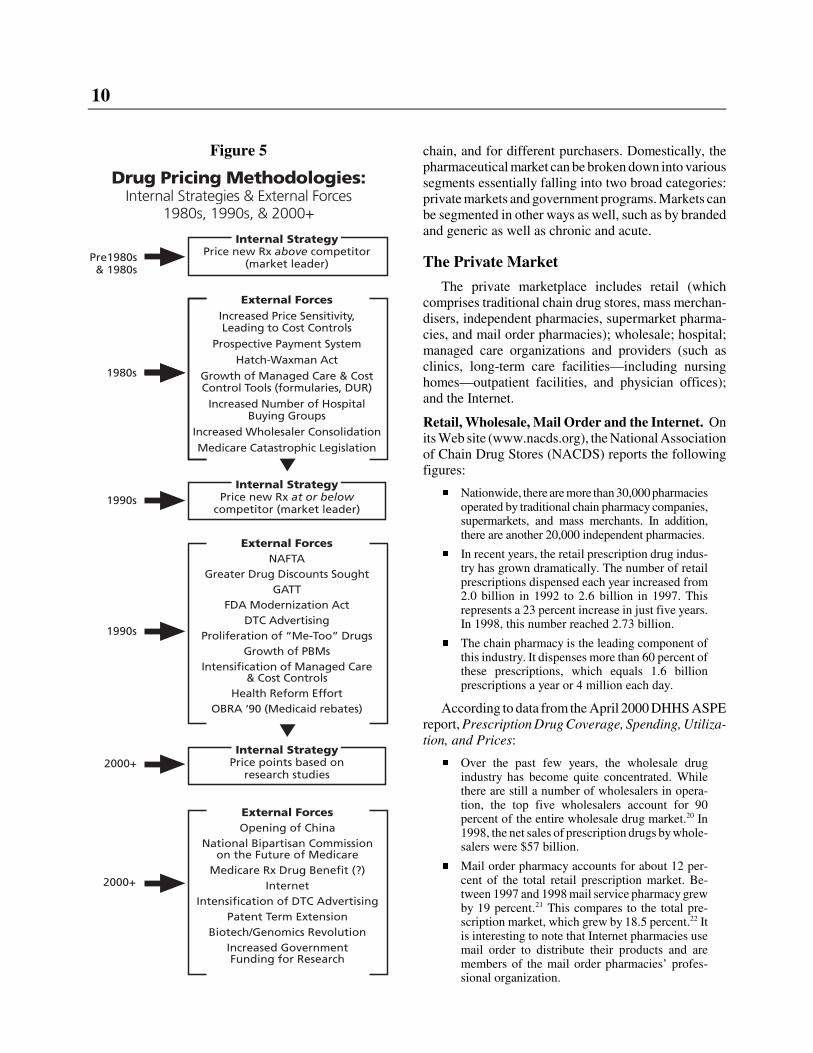
Manufacturers use these various pricing methodolo-gies depending upon internal strategies, external forces,distribution channels, and specific purchasers. Asexternal market forces change, internal pricing strate-gies also change (see Figure 5).
A specific drug product can be priced differently indifferent markets, at different points in the distribution
Figure 4
10
chain, and for different purchasers. Domestically, thepharmaceutical market can be broken down into varioussegments essentially falling into two broad categories:private markets and government programs. Markets canbe segmented in other ways as well, such as by brandedand generic as well as chronic and acute.
The Private Market
The private marketplace includes retail (whichcomprises traditional chain drug stores, mass merchan-disers, independent pharmacies, supermarket pharma-cies, and mail order pharmacies); wholesale; hospital;managed care organizations and providers (such asclinics, long-term care facilities—including nursinghomes—outpatient facilities, and physician offices);and the Internet.
Retail, Wholesale, Mail Order and the Internet. Onits Web site (www.nacds.org), the National Associationof Chain Drug Stores (NACDS) reports the followingfigures:
� Nationwide, there are more than 30,000 pharmaciesoperated by traditional chain pharmacy companies,supermarkets, and mass merchants. In addition,there are another 20,000 independent pharmacies.
� In recent years, the retail prescription drug indus-try has grown dramatically. The number of retailprescriptions dispensed each year increased from2.0 billion in 1992 to 2.6 billion in 1997. Thisrepresents a 23 percent increase in just five years.In 1998, this number reached 2.73 billion.
� The chain pharmacy is the leading component ofthis industry. It dispenses more than 60 percent ofthese prescriptions, which equals 1.6 billionprescriptions a year or 4 million each day.
According to data from the April 2000 DHHS ASPEreport, Prescription Drug Coverage, Spending, Utiliza-tion, and Prices:
� Over the past few years, the wholesale drugindustry has become quite concentrated. Whilethere are still a number of wholesalers in opera-tion, the top five wholesalers account for 90percent of the entire wholesale drug market.20 In1998, the net sales of prescription drugs by whole-salers were $57 billion.
� Mail order pharmacy accounts for about 12 per-cent of the total retail prescription market. Be-tween 1997 and 1998 mail service pharmacy grewby 19 percent.21 This compares to the total pre-scription market, which grew by 18.5 percent.22 Itis interesting to note that Internet pharmacies usemail order to distribute their products and aremembers of the mail order pharmacies’ profes-sional organization.
Figure 5
11
Government Programs
The federal market encompasses such governmentprograms as the Federal Employee Health Benefitprogram, the Department of Veterans Affairs (VA) andits federal supply schedule (FSS), Medicaid, andvarious public health service programs. Various govern-ment programs have legislated drug pricing and reim-bursement methodologies.
The VA Federal Supply Schedule. The VeteransHealth Care Act established a mandatory federal ceilingprice on a manufacturer’s sales of innovator medicinesto four federal agencies: the VA, the Department ofDefense, the Public Health Service (including theIndian Health Service), and the Coast Guard. Theformula establishes an upper limit on all procurementsby any of the four agencies equal to 76 percent of theweighted average nonfederal selling price for theproduct, limited to annual increases of no more than theincrease in the consumer price index-urban (CPI-U).The FSS generally limits annual increases in anypharmaceutical price over the life of a contract (typi-cally five years) to the increase in the CPI-U over thesame period.
Medicaid Rebates. The Omnibus Budget Reconcilia-tion Act of 1990 (OBRA) established the Medicaidrebate program. The basic formula requires that, inexchange for having their products reimbursed (that is,on the formulary), pharmaceutical manufacturers rebateto the states the greater of (a) 15.1 percent of theaverage manufacturer price (AMP)23 paid by wholesal-ers for brand-name drugs that Medicaid beneficiariespurchase as outpatients or (b) the difference betweenAMP and the manufacturer’s “best price.” The bestprice is the lowest price offered to any other customer,excluding FSS prices and prices to state pharmaceuticalassistance programs. Similarly, manufacturers pay arebate equal to 11 percent of the AMP on generic andover-the-counter drugs.
If a brand-name drug’s AMP increases faster than theinflation rate, an additional rebate is imposed so thatmanufacturers cannot offset the basic rebate by raisingtheir AMP. The additional rebate is equal to thedifference between the current AMP and a base-yearAMP increased by the inflation rate as measured bythe consumer price index.24
OBRA 93 changed the pricing schedule of single-source and innovator multiple-source drugs approvedby the FDA after October 1990.
In general, OBRA 93 had an impact on the computa-tion of the unit rebate amount for covered outpatientdrugs. The effective date for implementation of
OBRA 93 was October 1, 1993. Presently, more than500 manufacturers have rebate agreements with theFederal Government which, in turn, address approxi-mately 55,000 drug products.25
Medicaid—which accounted for over $2.2 billionworth of pharmaceutical manufacturer rebates in1997—is not alone in its use of rebates. As the numberof HMOs and PBMs increased, manufacturers beganto offer rebates in an effort to gain access to managedcare patients.26
These programs add another dimension to drugpricing variability. The price a manufacturer sets oftenchanges as it makes its way through the distributionchain and onto the negotiating table. It is not unusualfor one specific product to be priced differently indifferent markets (see Table 4).
Many cross-national drug pricing comparisons havebeen made over the years. While these findings aresignificant, they merit caution in how the comparisonsare made and in how the conclusions are drawn. Be-cause markets, demographics, and values vary, andbecause medical practices and economic circumstancesalso vary, it is difficult simply to transfer one country’spricing methods to another. Nevertheless, for manyreasons, price differentials between products purchasedin the U.S. and other countries are oftentimes substan-tial, leaving many to question why the gap is so wide aswell as whether and how it should be narrowed.
THE FORUM SESSION
This Forum session, designed as an institute provid-ing background information as well as raising policyissues, will begin with a discussion of the supply side ofthe market. Glenna M. Crooks, Ph.D., president andchief executive officer, Strategic Health Policy Interna-tional, will open with a discussion of “The Price ofInnovation: Internal R&D Decisions,” answeringquestions such as the following: How are R&D deci-sions made? Who makes them? How has the nature ofR&D changed over the past decade or two (for exam-ple, greater reliance on computers and government/academic funded research, fewer “hit and miss” scenar-ios, big companies as holding companies for innovationinvestments, and strategic alliances)? How is riskspread across classes of drugs? How is R&D in bigcompanies different from R&D in small companies?
Judith L. Wagner, Ph.D., principal analyst with theCongressional Budget Office, will provide a briefing on“Pharmaceutical Marketplace Dynamics,” covering amultitude of questions, including the following: How

12
Table 4Illustrative Example of Pricing for Brand Name Prescription Drugs
Cash Customers(No 3rd-Party
Payment atPoint of Sale)
Insurers andPBMs
HMO* MedicaidFederal Sup-ply Schedule
List price (AWP) $50
Manufacturer’s price (manufac-turer to wholesaler or other entity)
$40(AWP-20%)
$40**(AWP-20%)
$34(AWP-33%)
$40**$24
(AWP-52%)
Acquisition price(wholesaler to pharmacy)
$41 $41 n/a $41 n/a
Retail price at pharmacy (total ofamounts paid by customer and re-imbursed by 3rd-party payer)
$52(AWP+4%)
$46**(AWP-13%
+$2.50)n/a $41 +$2.50 n/a
Retail price, less typical manufac-turer rebate
n/a$30 to $44(5% to 35%
rebate)n/a
$30 to $37(15.1% to
30% rebate)n/a
Ultimate (net) amount paid by finalpurchaser and/or consumer
$52 $30 to $44 $34 (avg.)$30 to $37$34 (avg.)
$24
Source: Assistant Secretary for Planning and Evaluation, Report to the President: Prescription Drug Coverage, Spending,Utilization, and Prices, Department of Health and Human Services, April 2000, 98.n/a = not applicable* This column refers only to HMOs that buy directly from manufacturers.** without rebate
Notes: (1) Prices are based on a composite of several commonly prescribed brand-name drugs for a typical quantity of pills. For somecells in the table, the relative relationships have been calculated based on relationships reported in How Increased Competitionfrom Generic Drugs Has Affected Prices and Returns in the Pharmaceutical Industry (CBO, 1998) study and on otherrelationships widely reported by industry sources.(2) These prices are used for illustrative purposes only and do not represent any type of overall average.(3) Prices reported in this table include both amounts paid by third-party payers and amounts paid by the consumer as cost-sharing.
the market interacts with R&D decisions. How does themarket work? To whom do drug companies sell (indus-trial organization)? What is competition in this market?How do companies compete? Is competition compro-mised by recent mergers? What are the effects of gener-ics, intellectual property, PBMs and formularies, andDTC advertising on the marketplace? At what point(s)do the supply and demand sides of the market cometogether?
The program will continue with an overview of thedemand side of the market. John M. Coster, Ph.D.,R.Ph., vice president of federal and state affairs for theNational Association of Chain Drug Stores, will present“The Private Market,” describing dynamics in the retail
market—pharmacies, hospitals, managed care organiza-tions, mail order; across distribution channels—wholesalers, buying groups, prime vendors; and withinthe Internet.
Dan Mendelson, managing director of the HealthStrategies Consultancy, will present “The FederalMarket,” highlighting current government programs(FFHBP, Medicaid Rebates, VA FSS, PHS programs)and potential future government action, including theintended and unintended consequences of a Medicareprescription drug benefit and various price control bills.
Wrapping up the morning session will be Patricia M.Danzon, Ph.D., the Celia Moh professor in the health
13
care department at the University of Pennsylvania’sWharton School. Danzon will answer questions involving“The International Market,” including the following: Areinternational price comparisons valid? What can we learnfrom them? How and why do prices differ between theUnited States and other countries? For which products arethe differences greatest? Could the costs be more equita-bly distributed? What are the higher U.S. prices actuallyfunding (R&D versus marketing)? What have been theeffects of GATT and NAFTA? What does the opening ofChina mean for pharmaceutical markets?
The morning session will be followed immediatelyby a luncheon briefing highlighting the findings of therecently released DHHS report to the president, Pre-scription Drug Coverage, Spending, Utilization, andPrices. John F. Hoadley, Ph.D., director of the divi-sion of health financing policy in the office of theassistant secretary for planning and evaluation willprovide an overview of the study and its findings. Hewill be joined by other members of the research teamwho will be on hand to answer questions.
PHARMACEUTICAL PRICING TERMS27
Actual Acquisition Cost (AAC)—Retail pharmacy reim-bursement arrangements are often based on the AWP(see below) plus a fee. Knowing that retailers no longerpay the published AWP for prescription drugs, manypayers attempted to reduce the reimbursement by dis-counting the AWP by 5% to as much as 20%. Becausethis system penalized the pharmacies that are unable tosecure significant discounts from wholesalers, somepayers have instituted a payment schedule on the basisof actual acquisition cost plus a fee. Billing complexi-ties and schemes, however, make it difficult to ascertainthe actual acquisition cost.
Average Manufacturer’s Price (AMP)—This term wasdeveloped by the drafters of OBRA 90 and is used todescribe the average price received by a manufacturer,after discounts, for products sold to the retail class oftrade. The AMP is used for computing the rebates thatare paid to state Medicaid programs.
Average Wholesale Price (AWP)—Neither an averageprice nor a price charged by wholesalers, this figure isa vestige of earlier times. Few, if any, wholesalers evenconsider AWP today when pricing their prescriptionproducts. It is, however, commonly used by retailersand others who dispense medications as the basis formany pricing decisions. Due to its availability frommany sources, the AWP is often used as a surrogate for
actual prices when studying prescription price trends.Cash Discounts—Most pharmaceutical firms offer incen-tives to their customers for rapid payment of invoices. Themost common terms offered are a 2% discount if the fullbill is paid within 10 days of receiving the invoice. Thusa wholesaler that pays the regular ex-factory price actuallypays only 98% of that price if it pays within 10 days. Thewholesaler that sells at cost plus 3%, then, is actuallycharging a markup of roughly 5%.
Chargeback—This is the difference between the pricea wholesaler pays a manufacturer (see WAC) and alower contract price that has been negotiated by a hos-pital or managed care organization. Because of com-plexities of tracking products and some legal limita-tions, the chargeback system was developed as a meansfor discounted products to be sold through wholesalers.The wholesaler purchases the product at the normal listprice and sells the product to hospitals or other contractcustomers at the discount price. The difference is thenpaid as a rebate to the wholesaler by the manufacturer.This rebate is called the chargeback.
Class of Trade—Under federal law, all businesses thatsell to the same customer type must be eligible to re-ceive equal pricing consideration, such as discounts andspecial offers. To assure compliance with this law, mostpharmaceutical companies have developed lists of simi-lar customers and grouped them into different classes oftrade. Pricing schedules and tactics are then developedfor each class of trade.
Direct Price—The price paid by retailers, before dis-counts, for products from those manufacturers who selldirectly to nonwholesale accounts such as retailers, hos-pitals, private practice physicians, and public healthclinics is called the direct price.
Earned Margin—Earned margin is a term used by someretail pharmacists to describe the difference between theAWP and the actual product cost, as paid to the whole-saler or manufacturer.
Ex-Factory Price—This is the actual selling price, beforediscounts, charged by the manufacturer. (see WAC).
Gross Profit (Margin)—The difference between acquisi-tion or production cost of a product and its selling priceis known as the gross profit margin. The gross profitmargin does not include other costs of doing business.
Loss Leader—A loss leader is a retail promotional pricingtactic in which the retailer charges a price that is belowcost to entice customers into the store, hoping that thecustomers will make additional purchases while there. Inretail pharmacy, a loss leader is not always priced belowactual costs, but below AWP. It can, however, be argued
14
1. David E. Rosenbaum, “The Gathering Storm overPrescription Drugs,” The Nation: Pill Box, New York Times,November 14, 1999.
2. Office of the Assistant Secretary for Planning and Evalua-tion, Prescription Drug Coverage, Spending, Utilization, andPrices, Report to the President, Department of Health andHuman Services, Washington D.C., April 2000, 149.
3. David A. Shaywitz and Dennis A. Ausiello, “Can DrugGiants Survive the Biomedical Revolution?” Wall StreetJournal, February 8, 2000.
4. “Drug Mergers Change Health Landscape,” AmericanMedical News, January 31, 2000, 4.
5. Patricia Barry, “What’s Behind High Drug Prices inU.S.?” AARP Bulletin, 41, no. 4 (April 2000): 6–7.
6. Barry, “High Drug Prices,” 7.
7. Shaywitz and Ausiello, “Drug Giants.”
8. Shaywitz and Ausiello, “Drug Giants.”
9. Shaywitz and Ausiello, “Drug Giants.”
10. Congressional Budget Office, “How Increased Competi-tion from Generic Drugs Has Affected Prices and Returns inthe Pharmaceutical Industry,” Excerpts, Washington, D.C.,July 1998, xi.
11. The U.S. Patent and Trademark Office has deemed a genesequence can be patented if it meets a three-pronged test forutility: its utility must be specific to the gene sequence inquestion, not to genes in general; it must have a real worldsubstantial utility; and it must be credible to a person ofordinary skill in the art of sequencing.
12. Marilyn Werber Serafini, “No Easy Prescription on No-Name Drugs,” National Journal, February 19, 2000, 548.
13. Bonar Menninger, “Can Generics Turn It Around?”Healthcare Business, January/February 2000, 20.
14. Serafini, “No Easy Prescription,” 548.
15. Menninger, “Generics,” 51.
16. See “Pharmaceutical Pricing Terms” at the end of thisissue brief.
17. E. M. Kolassa, Elements of Pharmaceutical Pricing (NewYork: The Haworth Press, Inc., The Pharmaceutical ProductsPress, 1997), 33, 46.
18. Kolassa, Pharmaceutical Pricing, 49.
19. Kolassa, Pharmaceutical Pricing, 50.
20. National Wholesale Druggists’ Association, IndustryProfile and Health Care Fact Book, Addendum, 1999.
21. Anonymous, “Mail Order Drug Sales Leap 10 Percent,”American Druggist, July 1, 1999.
22. M. Glaser, “Boom Year,” Drug Topics, April 5, 1999,47–53.
that the transaction is indeed a loss when factoring in theprofessional time and services required to fill a prescrip-tion. Still, a pharmacy loss leader does not imply sellingthe product below acquisition cost.
MAC—The MAC is the maximum allowable cost,which is the federally set reimbursement rate for ge-neric drugs used in the Medicaid system. Many otherpayers use MAC systems as well. The federal MAC isalso called the FFP, which stands for federal financialparticipation. It is set at 150% of the lowest generallyavailable price for generics.
Manufacturer’s List Price—As the name implies, thelist price is a price that has been published by a manu-facturer. Many manufacturers make actual list pricesavailable only to wholesalers, providing a catalog thatcontains AWPs to the nonwholesale trade (see Ex-Fac-tory Price).
Net Price—Also known as “landed price,” this is theprice, or revenue, realized by a manufacturer after alldiscounts have been granted.
Net Profit (Margin)—Net profit margin is the differencein selling price and all costs associated with doing busi-ness, allocated on a per-unit basis.
OBRA 90—The Omnibus Budget Reconciliation Act of1990, a law drafted by the Senate Committee on Aging,requires manufactures to pay rebates to state and federalgovernments for products used by Medicaid recipients.
Rebate—A rebate is a retroactive discount that is paidto a customer after that customer has purchased theproduct from a wholesaler or retailer. The rebate al-lows the manufacturer to offer a lower price to somecustomers without taking on the burden of special dis-tribution mechanisms.
Standard Cost—The product costing system used bymost pharmaceutical firms is called “standard costing”or “fully absorbed cost.” With this system, in additionto the variable costs such as ingredients, packaging, anddirect labor, a portion of fixed cost (overhead) is allo-cated to each product and package. This cost is allo-cated on the basis of forecasts made at the beginning ofthe fiscal year. Such a system assures that, when unitvolume increases, the incremental cost of a unit willdecline, while the incremental cost of a product with adeclining sales trend will increase significantly. It is notuncommon for half or more of a product’s standardcosts to consist of this fixed cost allocation.
Wholesale Acquisition Price (WAC)—This term is usedby some publishers of pricing data to denote the ex-fac-tory charge, before discounts to the wholesaler.
ENDNOTES

15
23. Average manufacturer price is the weighted average priceto wholesalers for product distributed to the retail pharmacyclass of trade, where wholesaler is defined as any entity towhom the manufacturer sells (except relabelers) and whereretail pharmacy class of trade excludes hospitals and HMOs.
24. Congressional Budget Office, “How the Medicaid Rebateon Prescription Drugs Affects Pricing in the PharmaceuticalIndustry,” CBO Papers, January 1996, xi.
25. David K. Baugh, Penelope L. Pine, and Steven Blackwell,“Trends in Medicaid Prescription Drug Utilization andPayments, 1990-97,” Health Care Financing Review, 20, no.3 (Spring 1999), 80. (The figures in this quotation thatconcern the number of manufacturers with rebate agreementswith the federal government are derived from a personalcommunication to the authors from S. Gaston, Baltimore,March 11, 1999.)
26. For a more thorough explanation of PBMs, see Robin J.Strongin, The ABCs of PBMs, National Health Policy ForumIssue Brief No. 749, October 27, 1999.
27. Kolassa, Pharmaceutical Pricing, 30–33.