Embed Size (px)
Citation preview

Euler Hermes Economic Research Department
Economic Outlookwww.eulerhermes.us | no. 1191
no. 1191
Now where did global demand go?
Global Sector Outlook

2
Economic Outlook no.1191 | Global Sector Outlook Euler Hermes
Economic Outlook no.1191 | Global Sector Outlook
ContentsGlobal Sector Outlookno.1191
The Economic Outlook is published once a month by the Economic Research Department of Euler Hermes. It is also available on subscription for other businesses and
organisations. Reproduction is authorised, so long as mention of source is made. © Publication Director and Chief Economist: Ludovic Subran • Macroeconomic
Research: Maxime Lemerle (Manager), Mahamoud Islam, Ana Boata (Economists), Romeo Grill (Economist for Germany), Dan North (Economist for the USA),
Clément Bouillet (Junior Analyst) • Global Sector Research: Yann Lacroix (Manager), Bruno Goutard, Marc Livinec, Didier Moizo (Sector Economists) • Country Risk
Research: David Atkinson (Manager), Andrew Atkinson, Manfred Stamer (Economists) • Graphic Design: Claire Mabille • Editor: Martine Benhadj • Support: Valérie
Poulain, Mathilde Lavaud • Translation: 4T • For further information, contact: the Economic Research Department of Euler Hermes at 1, place des Saisons 92048 Paris
la Défense, France – Tel: +33 (0)1 84 11 50 46 – e-mail: [email protected] uEuler Hermes is a limited company with a Directoire and Supervisory Board, with a
capital of 14,451,032.64 euros • Photoengraving: Evreux Compo, Evreux, France – Permit January 2013; ISSN 1 162 – 2 881 © February 13, 2013
Subsidiariespage 30
page 4
Business sector forecastspage 5
Commoditiespage 8
Energypage10
Editorialpage 3
EH Americas United States . . . . . . . . . . . . . . . . . . . . . . Kevin McCannCanada . . . . . . . . . . . Kevin McCann, Dorothy VerweyMexico . . . . . . . . . . . . . . . . . . . . . . . . . . Roberto CórdovaBrazil . . . . . . . . . . . . . . . . . . . . . . . . . . . Marcelo OliveiraArgentina . . . . . . . . . . . . . . . . . . . . . . Federico PronzatiEH Asia-Pacific Japan . . . . . . . . . . . . . . . . . . . . . . . . . Keisuke MoriyamaChina . . . . . . . . . . . . . . . . . . Anne Simpson, Cherry XieIndia . . . . . . . . . . . . . . . Anne Simpson, Joydeep NondyIndonesia . . . . . . . . . . . . . . . . . . . . . . . Nilanthi WithanaSouth Korea . . . . . . . . . . . . . . . . . . . . . . . . . . . . Lena Lee
EH France France . . . . . . . . . . . . . . . . . . . . . . . . . . . . . . Yves LidomeEH DACH(*)
Germany . . . . . . . . . . . . . . . . . . . . . . . . . . . . .Romeo GrillAustria . . . . . . . . . . . . . . . . . . . . . . . . . . . . . . .Romeo GrillSwitzerland . . . . . . . . . . . . . . . . . . . . . . . . . . .Romeo GrillEH Mediterranean and Africa Italy . . . . . . . . . . . . . . . . . . . . . . . . . . . . . . . . . . Paolo CioniSpain . . . . . . . . . . . . . . . . . . . . . . . . . . . . . .Jochen WilmesPortugal . . . . . . . . . . . . . . . . . . . . . . . . . . . . . . Paulo VilelaGreece . . . . . . . . . . . . . . . . . . . . . . . . . . . . . . . . . Kis JanosTurkey . . . . . . . . . . . . . . . . . . . . . . . . . . . . . Ozlem Ozuner
EH Northern EuropeUnited Kingdom. . . . . . . . . . . . . . . . . . . . . . . Mark WyattIreland. . . . . . . . . . . . . . . . . . . . . . . . . . . . . . . . Mark WyattBelgium . . . . . . . . . . . . . . . . . . . . . . . . . . . Hubert LemanNetherlands. . . . . . . . . . . . . . . . . . . . . . . Valter ToememNorway . . . . . . . . . . . . . . . . . . . . . . . . . . . . . Paal BrantzegCzech Republic. . . . . . . . . . . . . . . . . . Miroslav IngeduldPoland. . . . . . . . . . . . . . . . . . . . . . . . . . . . . Tomasz Starus Sweden. . . . . . . . . . . . . . . . . . . . . . . . . .Anders BjörkmanSlovakia . . . . . . . . . . . . . . . . . . . . . . . . . . . . . . . Juraj Jan?iFinland . . . . . . . . . . . . . . . . . . . . . . . . . . . .Tiina BjörkqvistDenmark . . . . . . . . . . . . . . . . . . . .Hans Jørgen KnudsenRussia . . . . . . . . . . . . . . . . . . . . . . . . . . . . . Slawomir Bak_
Contributions
Sector analysispage 12
Food products & beverages uRisks and opportunities page 12
Pharmaceuticals u Overcoming the “patent cliff” page 14
Automobiles uThe importance of being a global player page 16
Automotive components uControlling costs and pursuing growth page 18
Aeronautics u2013: the moment of industrial truth page 20
Chemicals uToward a trend reversal? page 22
Construction uMarking time in the construction sector… page 24
Air transport uFlight plans needed page 26
Information and Communication Technologies uInnovation and services page 28
Economic OutlookSeriespage 32
(*) Germany - Austria - Switzerland
|
3
Economic Outlook no.1191 | Global Sector Outlook Euler Hermes
Editorial
In search of lost demand
With a genuine sigh of relief some would say that the crisis is over, that the Eurozone remains intact and that the markets are moving
forward again. In short, that the worst is now behind us. The problem lies in the long-term impact of three successive and unrelenting crises (the raw materials crisis, the financial crisis and the sovereign debt crisis) on the dynamics of certain industry sectors and corporate balance sheets. Higher production costs, financing problems and dented confidence combined with greater public policy volatility have obviously all left their mark. The pace of investment by companies (particularly in the Eurozone but also in the United States, China and Brazil) has suffered from these economic fluctuations. When all is said and done, the overcapacity in China, the lacklustre profitability of European companies or the massive deleveraging underway just about everywhere around the globe will influence credit management risks in 2013. However, looking beyond these short-term trends, a real sea change has been underway over the last five years. This has gone unnoticed and even today is difficult to document as its analysis is limited by the available data, but this is a radical change in global demand, in the factors which determine it and in its regional variations. The cause for this lies in demographic and behavioural changes (Generation Y does not necessarily want to buy an apartment or a car, but instead to travel and communicate more!), extreme public policies which artificially boost purchasing power one day and decimate it the next, and the emergence of middle classes within more robust and less interconnected regional blocs. It should come as no surprise to learn that the World Economic Forum is interested in income inequality. If the giants of the private sector have gathered in Switzerland, this is because over and above the impact of these inequalities on world growth, in purely business terms the market potentials have changed. As we announced in a previous issue, the year 2013 will be a year of resilience for the private sector, particularly affected by adverse economic conditions, but will also be the year in which a necessary adaptation gets underway. Corporate strategies must be tailored to a newly structured competitive environment (characterized by the effects of attrition on struggling companies and the arrival of new players in the market), but also and above all to demand indicators which are more difficult to decipher. Where is demand today? Who is it? What is it looking for? This adaptation period will necessarily have an impact on companies’ balance sheets._Ludovic Subran
◾Construction◾Air transport
◾Consumer electronics◾Automotive components◾Rail, maritime & aeronautics equipment◾Machinery◾Paper & pulp◾Manufacture of IT & telecoms equipment◾Steel◾Semiconductors & components◾Distribution◾Information & communication technologies
◾Food & bevarages◾Pharmaceuticals◾Automobiles◾Chemicals
International business sector forecasts
A
B
C
D
Global Sector Outlook

4
Economic Outlook no.1191 | Global Sector Outlook Euler Hermes
Overview
Now where did global demand go ?
demand from both households and companies. Consequently, unemploy-ment continues to rise and is having a major negative impact upon consumer confidence, with consumers reining in their expenditure. The construction sector is a good example, with business levels continuing to fall back, particu-larly in Spain, Italy, France and Great Britain but also a number of eastern European countries. The effect is also striking in the distribution sector due to the fall in household consumption, or the car market with car sales in Europe down by -8% in 2012 and the scale of the restructuring programs contributing to a general climate of apprehension for the future. With the decline of its main sales outlets (the car making and construction mar-kets), the steel industry is also weaken-ing under the effect of significant pro-duction overcapacity. Transport is also struggling with the high levels of oil prices. Unlike companies which are dependent upon their national mar-kets, the internationalized groups are taking advantage of world growth to offset the slowdown in Europe. As an example we should mention the healthy outlook for the chemical indus-try (which moreover is succeeding in imposing its own price levels) and the
automotive equipment manufacturers. Aeronautics is another growing sector benefiting as it does from remarkable long-term visibility with orders sched-uled for the next eight years. The phar-maceutical sector also remains highly profitable although two threats are now casting a shadow over its future, these being the expiry of patents and social deficits at a time of budgetary con-straints aimed at limiting public defi-cits. Finally, some sectors find them-selves at a crossroads, including the food industry whose volumes are hold-ing up overall but which is suffering from commodity price volatility, pack-aging whose business levels tend to fluctuate in line with the economy of the country concerned, and electronics or capital goods due to the low level of investments.
In the United States, the strong growth in the car market contrasts with the weary recovery of the construction sectorThe sharp continued upturn in the car market (with automotive production up 13% in 2012) contrasts with the timid recovery in the construction sector where volumes are still at extremely low levels. Certainly, stocks have continued to decrease, returning to an acceptable
A few clear patches but still cloudy We are seeing some positive green shoots although these are still too few and far between. The contrast between the European and American situations is the most striking example, including a car market down by -8% in Europe but surging by 13% in the United States. Similarly, although we are seeing some signs of a turnaround in the construc-tion sector in the United States, albeit at a very low level, this is certainly not the case in Europe, in particular in some southern or eastern countries where the crisis persists. As an alternative growth centre, the emerging nations also began to show some signs of weakness before recovering a little towards the end of the year with the sharp slowdown in global steel production being a perfect illustration of this. In this continued lacklustre environment, the high levels of commodity prices have continued to eat into the profitability of certain sec-tors, with transport in the forefront.
Europe is still trailing in far too many sectorsThe recession raging in southern Europe fuelled by the austerity pro-grams is gradually spreading to the whole economy due to the fall in u
Positive fundamentals& outlook
Signs of weaknesses
Structural weaknesses
Imminent or recognised crisis
Not available
uOur business sector forecasts are a rating system founded upon the microeconomic expertise of Euler Hermes group underwriters and analysts, who closely monitor risk in companies worldwide through our network of more than 50 local subsidiaries. This results in a qualitative assessment of the health and outlook of a sector. Generally, although not in every case, this assessment includes growth forecasts for a given sector. We focus more on the health of businesses (in terms of margins and solvency) than on their growth in turnover.
uStarting this year, the forecasts cover a large number of countries — 32 in total — spread across the six major zones as defined by Euler Hermes. The number of modalities under the ratings has been cut to 4, compared to 5 previously, to avoid arriving at an average level that is little representative of the realities. The category ‘Not available’ indicates a sector that is not present in a country or an aggregate that cannot be calculated. The sector forecast for a given zone is the weighted sum (by GDP) of the forecasts of the countries concerned._
Note
ANote
BNote
CNote
D
Keys to Symbols
—

5
Economic Outlook no.1191 | Global Sector Outlook Euler Hermes
Business sector forecastsInternational
Source: Euler Hermes
Food
pro
duct
s&
bev
erag
es
Cons
umer
el
ectro
nics
Phar
mac
eutic
als
Auto
mob
iles
Auto
mot
iveco
mpo
nent
s
Rail,
mar
itim
e &
ae
rona
utics
eq
uipm
ent
IT &
tele
com
eq
uipm
ent
Mac
hine
ry
Pape
r & p
ulp
Chem
icals
Stee
l
Sem
icond
ucto
rs&
com
pone
nts
Cons
truct
ion
Dist
ribut
ion
Air t
rans
port
IT &
tele
com
serv
ices
EH Americas United States Canada Mexico Brazil Argentina — EH Asia-Pacific Japan China India Indonesia South Korea EH France France EH DACH* Germany Switzerland — Austria — — EH Mediterranean Italy Spain Portugal Greece — — — —Turkey — EH Northern Europe United Kingdom Ireland — Belgium Netherlands — — Romania — Norway — — Czech Republic — — Poland — — Sweden — Slovakia — Finland — Denmark — — — Russia — World * Germany - Austria - Switzerland

6
Economic Outlook no.1191 | Global Sector Outlook Euler Hermes
demand, it also poses new threats. This is particularly the case for textiles, which was once a major growth driver for exports to Europe and the United States, and which is today suffering from competition from other emerging countries which still have a lower cost base. This is encouraging China to move into higher added value sectors, particularly in the aeronautical market. Apart from the BRICs, other Asian countries (Thailand, Malaysia and Indonesia) are now emerging and stimulating regional growth which will remain high over the years to come._YL
level of 1.6 million units, whereas they were more than double this at the peak of the crisis and property prices have increased moderately, but we should not lose sight of the fact that the default rate on property loans, although down, is well above its pre-crisis level, demon-strating that the shake-out of the prop-erty market is still not totally complete. Despite this, excluding transport due to the high oil prices and household equipment which is tied to the con-struction sector, American industry has turned the corner. The steelmakers and automotive equipment manufacturers have been buoyed by the strong recov-ery in the car market. Electronics are benefiting from the capacity for innova-tion of the American IT and telecommu-nications companies. With unemploy-ment no longer rising, distribution is also doing well. Despite the current problems with the 787, the American aeronautics sector (just like its European competitor) is enjoying an extremely favorable outlook thanks to strong global demand. Finally, we should also note the rise of shale gas extraction, which offers American industry the per-spective of an inexpensive energy sup-ply which will further enhance its com-petitiveness.
After a breather, the emerging nations are moving forward once againThe emerging nations have the means to finance their growth, through inter-nal demand in China, through reduced interest rates in India or through the financing of infrastructure programs in Brazil in preparation for the 2014 World Cup and the 2016 Olympic Games. Several key facts are worth mentioning, especially compared to the developed nations, including the promising out-look for the construction industry in almost all of the emerging economies, whether this concerns housing (with rapid urbanization) or infrastructure spending. This also holds true for distri-bution, with improvements in purchas-ing power and the emergence of a mid-dle-class. However, although the growth in purchasing power, particu-larly in China, is boosting domestic
In a nutshell
EH Asia-Pacific
•China's trade surpluses.•Predominance of Asia in the electronic components and products sectors.•A dominant position in the electronic components and consumer electronics sectors.•Property prices controlled in China.
•Renewed rivalry between Japan/China over the Senkaku Islands and conse-quences on the sale of Japanese prod-ucts in China.•A slowdown in growth, particularly in Europe, which will adversely affect ex-ports, particularly from China.•Chemicals and energy industries re-sponsible for environmental pollution that is becoming problematic.•Inflation in India and its consequences on interest rates that may inhibit credit purchases (housing, cars).
•Chemicals: being positioned fur up-stream in the value chain (thereby gener-ating lower added value) g greater sensitivity to variations in energy costs.•Pharmaceuticals: the varying and un-equal quality of drug refund programs.•Certain industries still insufficiently structured in China.•The policy of controlling property prices discourages investment in the building industry in China.
•Continuous growth in household spending power.•Increasing rise in the consumption of processed food products and changing consumption patterns (meat, dairy products).•Strong expansion in air transport (well managed in China, more difficult in India).•Implementation of a strategy to boost property in China.•Development of a civil aeronautics industry in China.
stre
ngt
hs
thre
ats O
ppOrtu
nities
weakn
esses
EH Americas•Historically strong positioning of the US in the IT and consumer electronics industries.•A strong presence in the worldwide ex-port markets for agricultural commodi-ties.•Energy and chemicals industries (re)vitalized by the exploitation of non-con-ventional gas reserves.•Strong growth in vehicle production in the US and Mexico.
•Risks of financial problems for the public Medicare/Medicaid programs.•The accumulation of public debt.•The future of housing still under threat of repossession in the US.
•Rising prices of raw materials in the building industry.•American aeronautics industry partially dependent on military activity and there-fore sensitive to Defence budget deci-sions.•Stagnation of sales in consumer elec-tronics in the US.•Pharmaceuticals: laboratories hard hit by the expiry of patents for blockbuster drugs.
•A need for infrastructure and housing in South America, exacerbated by the Football World Cup scheduled in Brazil.•Continued concentration and streamlining of performances of traditional US airlines.•Strong expansion in air transport in South America.•The “Obamacare” law providing access to healthcare for an additional 30 million Americans.•Reindustrialization in progress in the US, bringing opportunities in the capital goods sector.
stre
ngt
hs
thre
ats O
ppOrtu
nities
weakn
esses

Economic Outlook no.1191 | Global Sector Outlook Euler Hermes
7
EH France
EH Northern Europe
In a nutshell
EH Mediterranean
•Very low production costs in the coun-tries of north Africa, facilitating the ex-pansion of local industry.•A strong luxury goods industry in Italy for clothing, footwear and vehicles.
•2013 will be a year of multiple dangers for certain historical domestic air trans-porters, facing serious financial difficul-ties and weakened government shareholders. •Continuous decline in vehicle produc-tion in Italy and consequences for the sector.•Mutation in consumption patterns accel-erated by economic difficulties (dynamism of supermarket own-brand products to the detriment of equivalent branded products).
•The construction industry in Spain is being adversely affected by stocks of existing housing available for sale.•Lacklustre consumption and invest-ment, with austerity plans in Italy, Spain, Portugal and Greece.•The sharp deterioration in the build-ing industry in Italy in 2012.•Pharmaceuticals industry affected by late payments of several health insurance programs (Greece). •The economic expansion of the coun-tries of northern Africa (motorway pro-jects in Algeria).•The creation of a car industry in Mo-rocco and planned in Algeria.•The lowering of labour costs in Spain to encourage growth in industrial sec-tor.
stre
ngt
hs
thre
ats O
ppOrtu
nities
weakn
esses
•Pharmaceuticals industry that re-mains competitive.•The global notoriety of the luxury goods industry in textiles, leather goods and spirits.•A thriving aeronautics industry.•Construction groups among the world leaders in the industry.
•Air transport currently undergoing strategic reconfiguration and restruc-turing, still in the grip of adverse eco-nomic conditions.•The effectiveness of new measures in favor of construction.•Government measures to reduce the deficits of the health insurance that weighs heavily on drug prices.
•Sharp deterioration in construction industry.•Continuing decline in car production and major restructuring operations underway.•Overcapacity in the steel industry, with a downturn in demand.•Impoverishment of local industrial in-frastructure in the electronics industry.•Production infrastructure of the food industry still fragmented.
• Strong demand for aircraft (increase in production throughput and consist-ently healthy order levels).•Chemicals industry positioned in high added value markets.•Chronic deficit of more than 500,000 homes and potential importance of the renovation market to comply with environmental standards.
stre
ngt
hs
thre
ats O
ppOrtu
nities
weakn
esses
•The financial might of the City of Lon-don.•The recovery of the British automo-tive industry with large-scale foreign investments.•Dynamism of food producers on the worldwide export markets.•The United Kingdom’s monetary au-tonomy in comparison to the Euro-zone.
•Slow down in the growth of the still very volatile Russian vehicle market.•2013 will be a year of multiple dan-gers for certain historical domestic air transporters, facing serious financial difficulties and weakened government shareholders.
•Slowing down of the catch-up effect in the building industry in Eastern Eu-ropean countries.•Persistent difficulties for manufactur-ers of high-tech products, such as the Finnish Nokia.
•Requirement for renovation work in Russia, and implementation of the new European Structural Fund program for the 2014-2020 period.•Aeronautical construction: strong de-mand for aircraft (increase in produc-tion throughput and consistently healthy order levels).•Changes in food consumption pat-terns for the industrialists in the sector.
stre
ngt
hs
thre
ats OppO
rtunities
weakn
esses
EH DACH(*)
•An image of quality that facilitates worldwide exports.•A flourishing vehicle industry, gaining market share on all the continents.•High-end positioning in chemicals sup-ply related to the strong German com-panies (Basf, Bayer, Lanxess and Evonik).•Growth maintained in the construction industry.•Certain branches of the food industry (including pig farming) very competitive in exports.
•Air transport currently undergoing strategic reconfiguration and restruc-turing, still in the grip of adverse eco-nomic conditions.•Pharmaceuticals: measures to reduce the deficits of the health insurance pro-gram.•The electronics industry is dependent on investments from other countries in the Eurozone.
•Signs of property bubble in several re-gions in Switzerland.•The recession in the Eurozone is hitting German exports.•Chemicals industry subjected to rising costs of power supply (electricity).
• Strong demand for aircraft (increase in production throughput and consist-ently healthy order levels).•Success in worldwide exports, bene-fiting from the growth of the emerg-ing nations.•International positioning on the Algerian market (building of sports in-frastructure and roads).
stre
ngt
hs
thre
ats O
ppOrtu
nities
weakn
esses
(*) Germany, Austria, Switzerland

Risque global
A
Economic Outlook no.1191 | Global Sector Outlook
8
Euler Hermes
Commodities
Despite a slight fall in 2012, prices remain very high
anticipate a limited fall of -5% for cop-per and steel but an increase of 9% for iron ore, which will further erode the margins of the steelmakers, who are already experiencing difficulties in Europe due to falling volumes. The price of oil could see a downward correction of between -7 and -10%, unless a geo-political crisis occurs (as was the case in 2012 with Iran, Libya, Egypt and Syria) due to the abundance of this resource and the exploitation of non-conven-tional deposits in the United States. Under the guise of an adaptation of transport capacities, maritime freight saw sharp falls in 2012 and may bounce back by 9%, though still achieving levels below those of 2011. Finally, precious metals could see a slight downturn with a limited fall of -4% for gold, leaving many wondering if it had reached its peak at almost USD 1,700 per ounce, and by -10% for silver following a fall in demand in India._YL
viously grown by more than 7% in 2011, following a sharp slowdown in China where production rose by 3.6% in 2012 compared to almost 10% in 2011. Sharper price falls were seen for iron ore (-20%) and nickel, or even -40% for cot-ton (the price of which had surged by 65% in 2010 and 46% in 2011) and also maritime freight resulting from an over-capacity in supply and the slackening pace of global trade. Finally, moving on to precious metals, gold continued to play its traditional role as safe haven, ris-ing by +6% in 2012 whereas silver saw a fall of -12% in its market price.
Few major changes expected in 2013From a macro-economic point of view, global growth forecasts for 2013 remain at a fairly low level and are very close to 2012 at 2.5%. Subject to favorable cli-matic conditions for the coming har-vests, the prices of agricultural materials should fall by -10% for wheat and up to -20% for corn, relieving pressure not only on this sector but also on the food industry as a whole. For industrial raw materials, we also expect a slight down-turn in market prices due to lacklustre demand, particularly from Europe. We
A slight fall in prices in 2012, excluding oilIn 2012, despite a bullish economic cli-mate, with world growth reduced to 2.4% compared to 3% in 2011, global prices for the main raw materials remained very high but were neverthe-less slightly down compared to 2011. The Cyclope Rexecode raw material price index was showing a -2% fall in 2012, but above all a -9% reduction excluding oil, demonstrating a high degree of stability where annual varia-tions are concerned. To accurately assess the year 2012, we must separate the raw materials into two categories. Firstly, agricultural raw materials and particularly cereals, for which prices increased, with +6% for wheat and +5% for corn, following the droughts in the United States and Russia which limited harvests, thereby propagating inflation within the sector itself, particularly with regard to livestock. Secondly, we have industrial raw materials, all of which were subject to price falls of var-ying degrees, with -10% for copper, zinc and steel. Mirroring the industrial cli-mate, world steel production increased very slightly by 1.2% in 2012 having pre-

9
Economic Outlook no.1191 | Global Sector Outlook Euler Hermes
Commodities Prices
Sources: CyclOpe, Euler Hermes
Carbon
Palm oil
Corn
Soybean meal
Soybeans
Rubber
Wheat
Coking coal
Sugar
Soybean oil
Wheat, Europe (EUR)
Crude oil (Brent)
Silver
Cotton
Crude oil (WTI)
Palladium
Coffee
Platinum
Copper
Steel
Steam coal, Asia
Steam coal, Europe
Gold
Natural gas, Europe
Rice, Vietnam
Aluminium
Zinc
Nickel
Wool
Cocoa
Iron ore
Dry bulk freight
Lead
Tin
Natural gas, USA
-45%
-52,3%
-25%
-23%
-20%
-10%
-10%
-11%
-11%
-12%
-12%
-13%
-14%
-17%
-8%
-7%
-7%
-7%
-6%
-5%
-5%
-4%
-4%
-4%
-2%
-2%
-1%
+3%
+3%
+5%+5%
+9%
+9%
+12%
+18%
+25%
Commodities Prices Forecasts for 20132013 compared with 2012 annual average, in %
Sources: CyclOpe, Euler Hermes
CyclOpe Indicatorsbasis 1988=100
0
100
200
300
400
500 all commoditiesall commodities excluding petroleum and precious metal
12111009080706050403020100Sources: CyclOpe, Euler Hermes
dec. dec. 2011 2012
Soybean meal USD per tonne 281.52 459.49
Build timber 1,000 board feet 256.18 362.10
Soybeans USD per bushel 11.24 14.47
Bovine skins USD cents per pound 72.07 94.77
Barley USD per tonne 211.67 304.66
Scraps USD per tonne 596.1 554.52
Corn USD per bushel 6.13 7.31
Wheat USD per bushel 6.07 8.07
Tin USD per tonne 19,375.01 22,918.05
Platinum USD per once troy 1,454.59 1,579.91
Beef USD per pound 1.83 1.85
Gold USD per once troy 1,640.55 1,681.76
Zinc USD per tonne 1,908.32 2,038.41
Copper USD per tonne 7,569.59 7,945.19
Live adult cattle USD cents per pound 122.2 132.06
Palladium USD per once troy 645.04 693.20
Silver USD per once troy 30.59 31.73
Cocoa USD cents per tonne 2,216.75 2,436.11
Palm oil USD cents per tonne 972.86 715.48
Aluminium USD per tonne 2,018.73 2,082.39
Soja oil USD cents per pound 50.2 47.10
Lead USD per tonne 2,015.98 2,277.74
Crude oil USD per baril 108.11 109.29
Wool USD per kilo 9.54 8.90
Sugar USD cents per pound 23.13 19.31
Nickel USD per tonne 18,187.96 17,364.05
Rubber USD cents per pound 333.92 289.75
Coton USD cents per pound 94.94 83.59
Coffee cents per pound 189.39 130.79
Coconut oil USD cents per pound 65.7 35.61
Freight BFI/BDI index (1,000=1988) 1,839.09 818.38

Risque global
A
A growing sector Demand for energy is steadily rising due to world demographic and economic growth. Furthermore, it remains essen-tial for transport which is 94% depend-ant on fossil fuels for which there is cur-rently no mass substitute. Fossil fuels, with oil leading the pack, account for 80% of the world’s energy supply. Oil consumption in the Asia-Pacific which accounts for 26% of world demand has already exceeded Europe’s (19%) and is roughly equivalent to North America’s (25%). Although the crisis does not solve the long term issue of the sustain-ability of current levels of oil consump-tion, Europe remains the only part of the world where the energy dynamic is no longer as strong as elsewhere. Although it benefits from competitive electric power because of its nuclear supplies, the disaster at Fukushima in Japan in 2011 has slowed the pace of investment in new generating capacity. More worrying is the question of the viability of nuclear power in Germany and Belgium which has rattled the entire industry. Only France continues to promote electricity of nuclear origin. But it is accompanied by the revelation
Economic Outlook no.1191 | Global Sector Outlook
10
Euler Hermes
greenhouse gas emissions when the technology for capturing the carbon given off is not sufficiently mastered. Non-conventional gas resources, even though they appear to be considerable across the Atlantic, ultimately require massive investment in infrastructure that is not always easy to finance. Like Asia-Pacific, China is devouring energy to the point where it has become the top consumer ahead of the United States, as well as the top greenhouse gas emitter. Its growing needs mean that it is now a net importer of energy which goes hand in hand with a high degree of pollution. The construction in China of new nuclear reactors will change nothing, as their contribution will only account for 3% of its energy mix by 2020 (against 1.5% now), a long way from the share of carbon-based materials. Currently, an American uses on average 8 tons of oil a year, a European 4 and an Asian 1.6. So demand in emerging countries is very likely to grow, especially as they are steadily adopting a western lifestyle._ML
Energy
Whereas nuclear and solar are suffering, fossil fuels are doing well
of the true cost which includes the stor-ing of radioactive materials and the dis-mantling of reactors at the end of their life. Although in that respect a rise in the price of electricity looks inevitable in the future, it is currently being delayed due to the extension in the life cycle of some power stations.
North America and Asia fill up with energyThe shale gas boom has triggered an energy revolution in the United States. It has resulted in gas prices halving on the other side of the Atlantic and by renewed competitiveness for American industry which is able to buy cheap energy as a result. The exploitation of new-found supplies makes it look as if North America will soon be able to become independent in terms of overall energy supplies. However, exploitation of the Barnett shale field in Texas shows that, in the first years of extraction, gas comes in enormous quantity, which requires numerous wells to be opened. The environmental impact can turn out to be crucial if the effects of an opera-tion of this type are not properly meas-ured, without counting the escalation of

11
Economic Outlook no.1191 | Global Sector Outlook Euler Hermes
Renewables
Nuclear
Coal
Oil
Natural gas21%
33%
27%
6%
13%
24%
28%
23%
7%
18% Renewables
Nuclear
Coal
Oil
Natural gas
Sources: AIE, Cédigaz forecasts
[Source: companies, based on most recent accounts data]selon dernier bilan disponi
1 Exxon United States 251 5%
2 Shell United Kingdom 237 3%
3 BP United Kingdom 187 0.4%
4 Petrochina China 169 10%
5 Total France 129 2%
6 Chevron United States 119 -5%
7 Petrobras Brazil 72 2%
8 Gazprom Russia 72 -10%
The Ten Main Oil Producing Countries
[Source: AIEon dernier bilan disponi
Countries Production Share Mb/d (million barrels/day) 2010
Russia 10.5 13%
Saudi Arabia 10 12%
United States 7.8 9%
Iran 4.2 5%
China 4.1 5%
Canada 3.4 4%
Mexico 3 4%
United Arab Emirates 2.9 3%
Kuwait 2.5 3%
Venezuela 2.7 3%
Rest of world 32.5 39%
Total world 84 100%
Changes in the Demand for Oil by 2015 According to Geographic Area
[Sources: BP, AIE forecastselon dernier bilan disponi
2009 2015 Annual averageMbd growth
Europe (W+E) 19 20 0.2%
North America 23 24 0.8%
South America 6 6 0.7%
Asia Pacific 26 33 4.2%
Middle East 7 8 2.7%
Africa 3 3 0.6%
World 84 94 2%
20302009
Major World Companies
Rank Company Nationality
Turnover Change USD bn 06-2012] [06-2012/06-2011]
Long Term Change in World Energy MixMillion tons of oil equivalent

Risque global
A
To watch…
uThe prices of agricultural raw materials, packaging and energy.
uConsumption habits, which are changing very quickly following certain campaigns (targeting obesity, for example)._
A sector suffering continued disruptionAccording to IHS Global Insight, in 2012 the global food and beverages industry achieved sales of USD 5,500 billion. Price hikes for soya, corn and wheat last summer then filtered through to affect production costs during the second half of the year, eating into the profit margins of those sectors most exposed (mainly animal nutrition in addition to slaughtering and the processing of meat products). In 2013, growth in global production should be around +3% aided by demographic and economic developments while the trading prices of agricultural commodities should continue their new "normal" behavior, combining high price levels (with stocks generally limited) and volatility. Faced with this latter problem, each sector is considering the most appropriate combination of structural solutions, by examining futures contracts, contractual indexing that allows to pass on the variations of the prices or storage capacity for examples.
Economic Outlook no.1191 | Global Sector Outlook
12
Euler Hermes
Food products & beverages
Buoyant figures from AsiaThe planned share listing of the Japanese Suntory Beverage and Food Ltd, expected to be worth more than USD 6 billion, further demonstrates the ambitions of the Japanese producers to expand abroad, in quest of more dynamic markets. For 5 years now, the three main Japanese brewers have spent USD 26 billion abroad. When we consider the value of the investments currently underway (with the acquisi-tion of the Singaporean conglomerate Fraser and Neave Ltd by the owner of the Thai group Thai Beverage PCL for USD 11.2 billion ) or the transactions completed (including the takeover of the Spanish company Seda Solubles by Olam International Limited), we see that the Asian companies are now carving out a larger place for themselves in the global food and beverages industry._BG
Petra Foods’ ingredients division for USD Mn 950).
The importance of carefully watching the markets in the United StatesThe American food and beverages indus-try saw its production volume increase by +2.4% in 2012. The +8.1% rise achieved by the sugar sector stands in contrast to the -4.1% downturn suffered by the grain/milling companies and the stagnation experienced by the local heavyweight, the meat sector (+0.7%). Profitability in the industry after tax, which stood at +4.8% in the third quarter of 2012(2), has steadily improved since the low point reached a year earlier, but still remains below the performance lev-els achieved in 2007-2010. Product inno-vation and/or business model optimiza-tion (with vertical integration for Smithfield Foods Inc) are some of the strategies used by these companies to face up to the mediocre economic out-look. Furthermore, rapid changes in demand as a result of the economic crisis or new opinion-leader channels are a source of added uncertainty. In 2012, the historic fall of -4% in the sales of the main drinking milk segment(3) illustrated the new degree to which situations can change and can be considered a warning shot to the dairy groups. The ever-faster changes in demand for food and bever-age products (with the growing market share of the private labels) will almost certainly have an impact on the struc-tural aspects of the whole industry.
The food and beverages industries are affected by the European economic climateIn 2012, the industrial output(1) (exclud-ing drinks) of the European food sector began to slacken, with a contraction esti-mated at -0.5% (compared to +1.4% and +1.8% respectively in 2010 and 2011). The cost reduction plan worth €200 mil-lion over two years announced by Danone in December 2012 provides an insight into the impact of lacklustre con-sumption, particularly in southern Europe. In this climate, characterized by a long-term deterioration, it has now become necessary to adapt business models. With this in mind, the key players in the European dairy sector, (who are also facing heightened competitive pres-sure due to the end of the quota system scheduled for 2015), are introducing numerous initiatives including: concen-tration (with the merger of the dairy units of the French co-operatives Eurial and Agrial), an increased focus on world-wide exports and a shift towards higher added value product ranges, as is the case with the Scandinavian group Arla. An examination of the most recent initia-tives launched by the Swiss chocolate giant Barry Callebaut further highlights the range of possible solutions open to food and beverage companies such as: major strategic changes (the disposal of BtoC activities in order to refocus on the BtoB portfolio) and above all decisive acquisitions (with the acquisition of
Risks and opportunitiesWorld Grade
A
(1) EH sample including 19 of the 27 countries of the European Union(2) Source: US Census Bureau(3) Source: SymphonyIRI Group Inc.

13
Economic Outlook no.1191 | Global Sector Outlook Euler Hermes
Source: Euler Hermes
Business Sector Forecasts [Jan-13] Jul-12]
EH Americas United States Canada Mexico Brazil Argentina EH Asia-Pacific Japan China India Indonesia South Korea EH France France EH DACH* Germany Switzerland Austria EH Mediterranean Italy Spain Portugal Greece Turkey EH Northern Europe United Kingdom Ireland Belgium Netherlands Bulgaria Norway Czech Republic Poland Sweden Slovakia Finland Denmark Russia World
Major World Companies
! only food activitySource: companies, based on most recent accounts dataNB: Mondelēz International, Inc. and Kraft Foods Group, Inc. are not tentatively ranked.
Rank Company Nationality Turnover Change
USD bn 06-2012 06-2012/06-2011
1 Cargill United States 69 1.3%
2 Nestlé Switzerland 47.6 7.5%
3 ADM United States 45.3 19.2%
4 Pepsico United States 28.9 0.4%
5 AB InBev Belgium / Brazil / United States 19.2 5.4%
6 Coca-Cola United States 24.2 4.2%
7 SAB Miller United Kingdom 17.5 11.4%
8 Tyson Foods United States 16.6 6.3%
9 Unilever United Kingdom/Netherlands 16.5 7.0%
10 Mars United States N/A N/A
Food Production Growth, Selected Countries
by volume Change Change 2012/2011 2011/2010
Germany* -0.8% 1.2%
Brazil -1.8% -0.1%
United States 2.4% 2.3%
France 0.4% 4.0%
Japan* 0% -0.1%
*beverages and tobacco products includedSource: National statistics
*beverages and tobacco products includedSource: National statistics
Change in Food Products Price Index
basis 2005=100
90
100
110
120
130
140 United StatesItalyGermanyFrance
121110090807
* Germany - Austria - Switzerland

Risque global
AA healthy economic sectorEstimated to be worth approximately USD 930 billion in 2012, the global pharmaceuticals market has fared well in turbulent economic times. Stabilizing at a global level of between 4 and 5%, its annual growth rate has benefited from a number of contributing factors including demand for drugs from the emerging nations where a great deal still remains to be done to meet demand from the middle classes. To this should be added demand from the mature economies thanks to their rising life expectancy following improvements to medical technology, now making it possible to treat (or even cure) hitherto incurable diseases. The laboratories currently find themselves in stormy waters as they are facing the unstoppable rise of competition from generic drugs, spurred on by ever lower prices for such products, and the expiry of highly profitable blockbuster patents which have not been replaced due to a lack of pharmaceutical R&D matching previous levels of innovation.
Economic Outlook no.1191 | Global Sector Outlook
14
Euler Hermes
Pharmaceuticals
mer appeared to be a positive step for the sector as it provides access to health care for an additional 40 million Americans, who until now were denied this access. The surge in long-term spending anticipated by the Congress Budget Office (CBO) has led the federal state to take a greater interest in the set-ting of price levels for health care. The laboratories have been obliged to com-ply, by granting massive rebates (expected to total USD 3 billion for 2013 alone) off the price of their annual sales of drugs with the state-run health pro-grams. Keen to maintain their profita-bility levels, they are seeking to control their costs through concentration or by restructuring their sales teams handling the promotion of drugs which mean-while have entered the public domain. They are also having to deal with a tougher attitude adopted by the regula-tors, who today no longer hesitate to impose financial sanctions on laborato-ries guilty of marketing some of their drugs outside their authorized perime-ter.
Looking for growth in the emerging economiesDue to a lack of significant growth in the mature nations, the laboratories are now focusing on the emerging econo-mies to boost their sales of drugs. The problem here is that they are not expanding as quickly as anticipated. For the first half of 2012 for example, the
A reduction in pharmaceutical expenditure in EuropeThe business activity levels of the phar-maceutical laboratories were hampered in 2012 by the disappearance of patents for blockbuster drugs. All European states are looking to curtail the growth in their health expenditure. Following pressure from the financial markets to reduce their budgetary deficits, they are doing everything possible to keep rises to a minimum. With this in mind they are applying stricter criteria for the approval of innovative drugs requiring (where applicable) the setting of high sales prices. They are reducing the reim-bursement rates for drugs considered insufficiently effective. They are also showing a preference for generic prod-ucts to patented ones in identical thera-peutic fields. The laboratories are there-fore not enjoying the same financial health as they once did, even if overall they are performing well. In many cases they are adapting their workforce sizes while at the same time trying hard to improve the output of their stalled R&D programs.
Reducing the “cliff” for the American laboratories Although not of equal intensity on both sides of the Atlantic, the determination to rein in health expenditure is also beginning to make itself felt stateside despite the chiefly private financing method prevailing there. The voting of the ACA (Affordable Care Act) last sum-
Overcoming the “patent cliff”
To watch…
uThe expiry of patents for blockbuster drugs in 2012Problems financing public health insurance programs.
uDevelopments in the market for generic drugs within the mature economies.
World Grade
A
combined sales of the Big Pharma com-panies to the emerging nations grew by +7% on an annual basis compared to 12% in 2011. Even if this only has the effect of slowing an unavoidable trend, we are witnessing the consequences of difficulties in the Indian economy (for example) which is well positioned in the generic market. It also highlights price pressure on drugs sold in the emerging countries (with Turkey topping the list) aimed at improving access for the wid-est possible number of people, com-bined with their wish to promote national champions to the detriment of subsidiaries of foreign laboratories. At the same time, the Big Pharma compa-nies are pursuing active external growth policies locally, while taking care to pro-tect the sensitive national aspects of the potential targets concerned._ML

15
Economic Outlook no.1191 | Global Sector Outlook Euler Hermes
Major World Companies
Expiry of Drug Patents in the United States for 2012
[Source: companies], based on most recent accounts data
Rank Company Nationality Turnover Change USD bn 06-2012 06-2012/06-2011
1 Pfizer United States 30 -8%
2 Johnson & Johnson United States 33 -1%
3 Novartis Switzerland 28 -3%
4 Merk United States 24 1%
5 Roche Switzerland 24 -3%
6 Sanofi France 22 0%
7 GSK United Kingdom 21 -3%
8 Abbott United States 19 4%
9 AstraZeneca United Kingdom 14 -16%
10 Eli-Lilly United States 11 -7%
11 BMS United States 10 -7%
Sources: IHS Global Insight, Euler Hermes
Drug name Expiry Nationality Laboratory Blockbusterpatented month drug concerned Turnover 2011 USD bn
Seroquel March United Kingdom AstraZeneca 3
Plavix May USA BMS 6
Tricor July USA Abbott 1
Actos August Japan Takeda 3
Singulair August USA Merck 3
Diovan September Switzerland Novartis 5
Global Share of World Pharmaceutical Sales, 2012
Sources: IHS Global Insight, Euler HermesSource: Euler Hermes
Business Sector Forecasts [Jan-13] [Jul-12]
EH Americas United States Canada Mexico Brazil Argentina EH Asia-Pacific Japan China India Indonesia South Korea EH France France EH DACH* Germany Switzerland Austria EH Mediterranean Italy Spain Portugal Greece Turkey EH Northern Europe United Kingdom Ireland Belgium Netherlands Bulgaria Norway Czech Republic Poland Sweden Slovakia Finland Denmark Russia World
Rest of the world
Emerged countries (BRIC incl.)
Japan
Western Europe
North America
21%
36%
24%
12%
7%
* Germany - Austria - Switzerland

Risque global
AA global market up by 4% in 2012The global market confirmed its return to a steady pace in 2012 with a growth rate of 4%, which should be confirmed in 2013. Although growth slowed in the emerging nations, the global market benefited from sharp upturns in the American and Japanese markets in 2012, largely offsetting a significant new fall in the European market. In Europe, the situation for general purpose vehicle manufacturers has worsened still further, with producers finding themselves faced with a declining market, competition from low-cost car manufacturers and a tendency by the top of the range manufacturers to compete in lower range markets. The restructuring programs already underway are far from over. In the United States, this restructuring was undertaken during the 2008-2009 crisis, with the result being that the car industry has been hiring people again for the last two years.
Economic Outlook no.1191 | Global Sector Outlook
16
Euler Hermes
Automobiles
The American market takes off, with automotive employment risingIn the United States, the upturn in the automotive market which began in 2010 continued in 2012 with sales growth of 13% at almost 15 million units, after 15% in 2011 and 8% in 2010. For 2013, we esti-mate that the American market should continue to grow at 5 to 6% to a level of 15.7 million vehicles sold, as even at this pace it still remains below its pre-crisis level of between 16.5 and 17.5 million units sold per annum. This favorable outlook is naturally also having a posi-tive effect on production, which is approaching its pre-crisis level at more than 10 million vehicles produced, having fallen under the 5.5 million mark at the height of the crisis. After the sheer scale of the previous restructuring programs, this upturn is now fully benefiting the American producers, who have recov-ered decent profitability levels. A “tech-nical” upturn has also occurred in Japan with a growth rate of almost 30%, though resulting only from a very limited com-parable base effect related to the earth-quake and tsunami in 2011. However, the Japanese market had already started to nosedive in late 2012 and 2013 should see a fall of 10-15%.
Offsetting the slowdown in growth in the emerging nations without public support measuresWithout support, the emerging markets are running out of steam, which is the case in India where growth in 2012 was
The downturn continues in Europe, hitting general-purpose car manufacturers currently in the process of restructuringThe situation in the European market is becoming increasingly worrying. Apart from the temporary benefit of the vehi-cle scrapping premiums in 2010, the market is down for the fifth year. At 12.5 million units for private vehicles, it has contracted by -8%, far more than in 2011 when the fall was limited to -1.4%. For 2013, we still do not see any sign of recovery and the market should contract by a further -3%. It will then represent a volume of 12.3 million units, far from the 16 million units sold before the crisis. In addition to this loss of almost 4 million units, general purpose car manufactur-ers are also having to contend with heightened competition from low-cost vehicles, which have, in addition to the tendency of the German top of the range manufacturers to move down-range to secure sales. The obvious over-capacity resulting from this has been dealt with up until now by downsizing certain sites (reducing the number of production lines) and by a limited num-ber of site closures including Opel’s Antwerp factory in Belgium in 2010, Fiat’s Termini plant in Italy and the clo-sures scheduled for 2014 at Aulnay in France by PSA and Genk in Belgium by Ford. This restructuring has been made necessary in order to tackle the losses incurred in Europe by the general-pur-pose manufacturers.
The importance of being a global player
To watch…
uThe continued slide in sales in Europe and the consequences this may have on the profitability of the general-purpose car manufacturers.
uThe maintenance of public support measures in emerging markets where the scale of investments may lead to overcapacity.
uThe business outlook for hybrid and electric vehicles with their high development costs._
World Grade
A
limited to 4% and is estimated at just 3% in 2013. China achieved a growth rate of 7% supported by vehicle scrapping pre-miums, particularly in Beijing where the level of the premium is set to be fur-ther increased in 2013 (from €550 to €800) and applicable until late 2014. Similarly, the environmental protection office in Peking will pay bonuses of between €300 and €2000 to drivers scrapping a car dating from no later than 1995. These incentive packages will further support the market in 2013, which should also grow by 6%. Finally, Brazil, whose vehicle sales contracted in early 2012, has reduced or even scrapped taxes on industrial products until December 2012, allowing for an upturn in the market which grew by almost 8% in 2012. Without aid pack-ages, the market should grow at best by 3 to 4% in 2013._YL
17
Economic Outlook no.1191 | Global Sector Outlook Euler Hermes
The importance of being a global player
Major World Companies
[(1) Fiat with Chrysler]
*For the Japanese group, these are six-monthly figures to September 2012[Source: companies], based on most recent accounts data
Rank Company Nationality Turnover Change USD bn 06-2012 06-2012/06-2011
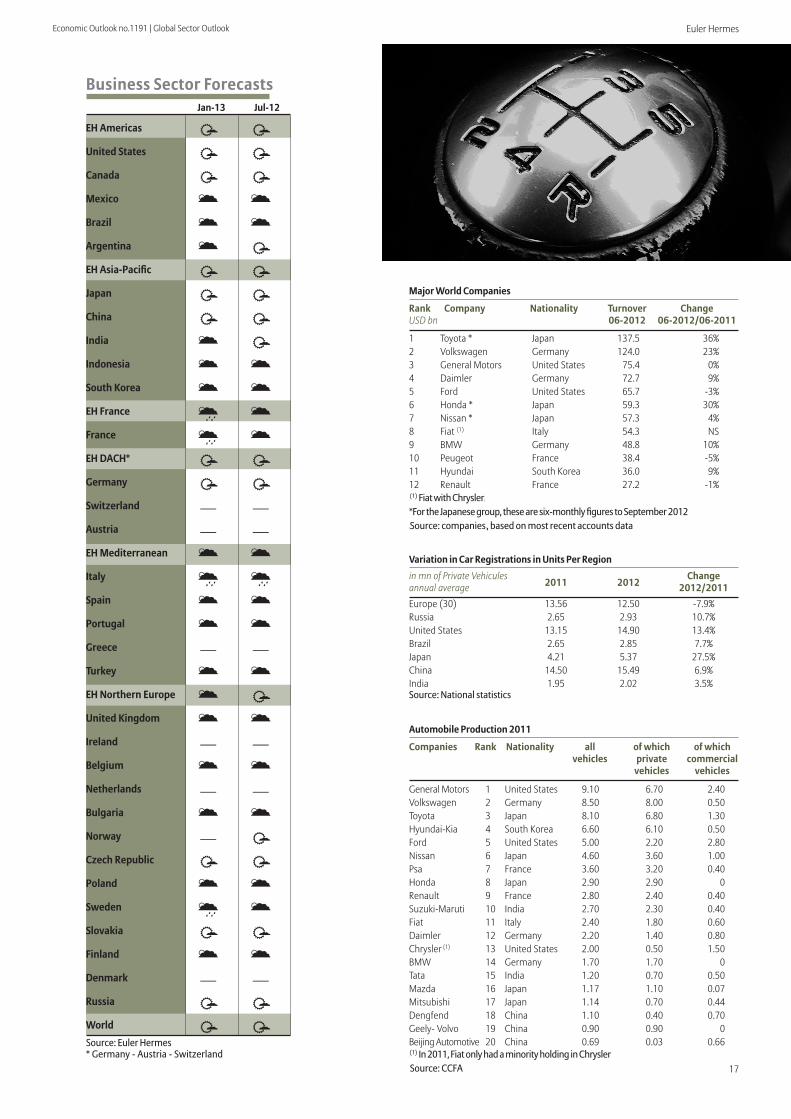
1 Toyota * Japan 137.5 36%2 Volkswagen Germany 124.0 23%3 General Motors United States 75.4 0%4 Daimler Germany 72.7 9%5 Ford United States 65.7 -3%6 Honda * Japan 59.3 30%7 Nissan * Japan 57.3 4%8 Fiat (1) Italy 54.3 NS9 BMW Germany 48.8 10%10 Peugeot France 38.4 -5%11 Hyundai South Korea 36.0 9%12 Renault France 27.2 -1%
Variation in Car Registrations in Units Per Region
Source: National statistics
in mn of Private Vehicules 2011 2012
Changeannual average 2012/2011Europe (30) 13.56 12.50 -7.9%Russia 2.65 2.93 10.7%United States 13.15 14.90 13.4%Brazil 2.65 2.85 7.7%Japan 4.21 5.37 27.5%China 14.50 15.49 6.9%India 1.95 2.02 3.5%
Source: Euler Hermes
Business Sector Forecasts [Jan-13] [Jul-12]
EH Americas United States Canada Mexico Brazil Argentina EH Asia-Pacific Japan China India Indonesia South Korea EH France France EH DACH* Germany Switzerland — —Austria — —EH Mediterranean Italy Spain Portugal Greece — —Turkey EH Northern Europe United Kingdom Ireland — —Belgium Netherlands — —Bulgaria Norway — Czech Republic Poland Sweden Slovakia Finland Denmark — —Russia World
Automobile Production 2011
[(1) In 2011, Fiat only had a minority holding in Chrysler[Source: CCFA]selon dernier bilan disponi
Companies Rank Nationality all of which of which vehicles private commercial vehicles vehicles
General Motors 1 United States 9.10 6.70 2.40Volkswagen 2 Germany 8.50 8.00 0.50Toyota 3 Japan 8.10 6.80 1.30Hyundai-Kia 4 South Korea 6.60 6.10 0.50Ford 5 United States 5.00 2.20 2.80Nissan 6 Japan 4.60 3.60 1.00Psa 7 France 3.60 3.20 0.40Honda 8 Japan 2.90 2.90 0Renault 9 France 2.80 2.40 0.40Suzuki-Maruti 10 India 2.70 2.30 0.40Fiat 11 Italy 2.40 1.80 0.60Daimler 12 Germany 2.20 1.40 0.80Chrysler (1) 13 United States 2.00 0.50 1.50BMW 14 Germany 1.70 1.70 0Tata 15 India 1.20 0.70 0.50Mazda 16 Japan 1.17 1.10 0.07Mitsubishi 17 Japan 1.14 0.70 0.44Dengfend 18 China 1.10 0.40 0.70Geely- Volvo 19 China 0.90 0.90 0Beijing Automotive 20 China 0.69 0.03 0.66
* Germany - Austria - Switzerland

Risque global
AAdapting to differing trends in the various regional markets The major automotive equipment manufacturers enjoying a global presence and a highly diverse clientele have benefited from the worldwide growth in the automotive sector. Despite this, an examination of the figures for changes in the production volumes of private vehicles per country between 2007 and 2012, (ranging from -55% in Italy to +145% in China) shows that it is more important than ever to adapt quickly, slashing costs in areas with negative growth and managing investments effectively in high-growth regions. These brutal changes in the markets are occurring at the same time as another necessity emerging over the last few years: the need to propose new, more environmentally friendly products or even fully electric-engined models which are totally CO2 neutral. These are all challenges which the manufacturers have successfully taken up and which have strengthened their negotiating position in dealings with their clients.
Economic Outlook no.1191 | Global Sector Outlook
18
Euler Hermes
Automotive components
duction should continue, with plans to open new sites to be better able to meet local demand, but also to be less dependent on volatile exchange rates which can harm the profitability of the manufacturers. Consequently, accord-ing to the Center for Automotive Industry Research, suppliers are expected to create 44,000 jobs this year in the United States to keep pace with rising car production and should once again exceed the levels achieved in 2008. Conversely, Japanese production suffered a downturn in the summer of 2012, and 2013 should bring confirma-tion of a more pronounced deteriora-tion due to a domestic market which should contract by between 10 and 15% in addition to difficult choices concern-ing production locations due to the high value of the yen in comparison with the dollar and the euro.
Controlling investment levels in the emerging economiesThe news from the emerging nations is that growth is running out of steam in certain countries, particularly in India. Slowing demand is also placing a ques-tion mark over the "10-year Auto Mission Plan" (AMP) project from the Indian government, aimed at increasing sales by the Indian automobile industry to 145 billion dollars by 2016, i.e. 10% of GDP. According to estimates, this target cannot be reached and the sales for this industry will actually stand at 111 billion
Dealing with negative growth in the European marketAlthough overall automotive production is declining in line with the fall in sales in Europe, despite this the situation is by no means comparable from one country to another. We have seen a collapse in southern Europe with production halved in Italy and France between 2007 and 2012, and a decline of -30% in Spain, while volumes in Germany and the United Kingdom have only contracted by -5 to -6%. Within Europe itself, auto-motive component manufacturers need to adapt their production resources. The European situation has certainly been particularly difficult for the last two months of 2012 and will remain so in 2013. However, thanks to the interna-tionalization and diversification of their customer base, automotive component manufacturers are able to take advan-tage of growth in other international markets. We are in a position to announce that the global turnover of the European automotive component manufacturers grew in 2012, but that their profitability may be slightly affected by the fall in activity in Europe even if this should remain at a very satis-factory level.
Benefiting from the clear upturn in the American car marketThe significant upturn witnessed in the North American car market benefits all stakeholders. And this growth in pro-
Controlling costs and pursuing growth
To watch…
uContinued decline in Europe and the necessary adaptation of production resources there.
uSlowing growth in certain emerging countries faced with the sheer scale of industrial investments already made.
uThe significant price pressure which certain loss-making manufacturers may be tempted to apply._
World Grade
B
dollars by this date. It will probably require an extra decade for India to reach the 145 billion dollar level. A num-ber of key players have made it known that they intend to be extremely cau-tious regarding their future investments as production overcapacity may already be appearing. This situation could also arise in China and Brazil, considered until very recently as new Eldorados, where the main players have invested massively over recent years. Nevertheless, these countries still offer excellent medium and long-term per-spectives due to a very low per capita car ownership rate and the emergence of a middle-class. Finally, it should be noted that the main players remain the major Western component manufactur-ers due to their global presence and their high levels of Research & Development, with the notable excep-tion of the South Korean company Mobis, which has benefited from the growth of its shareholder Hyundai-Kia._YL

19
Economic Outlook no.1191 | Global Sector Outlook Euler Hermes
in million units 2007 2011 variation 2011/2007
United States 10.47 10.04 -4.2%
Japan 9.94 8.68 -12.7%
China 6.40 15.70 145.3%
South Korea 4.09 4.58 12.1%
Germany 5.71 5.39 -5.6%
Spain 2.20 1.52 -30.6%
France* 3.02 1.40 -53.6%
Italy 0.91 0.41 -55.2%
United Kingdom 1.53 1.46 -4.5%
Major World Companies
* Financial statements to March 2012[Source: companies], based on most recent accounts data
Rank Company Nationality Turnover Change USD bn 06-2012 06-2012/06-2011
1 Bosch Germany n/d n/d
2 Johnson Controls United States 41.9 3%
3 Denso* Japan 22.5 23%
4 Aisin Seiki* Japan 16.8 27%
5 Magna Canada 15.4 6%
6 Mobis South Korea 15.6 18%
7 Faurecia France 11.4 8%
8 TRW United States 8.4 1%
9 Delphi United States 8.1 3%
10 Valéo France 7.8 12%
* Financial statements to March 2012Source: main quoted companies
Operating Margin
Operating profit/Turnover 2008 2009 2010 2011 2012
Europe 3.4% 2.1% 6.9% 7.1% 6.8%
United States 3.7% 1.4% 5.3% 5.8% 6.0%
Japan* 7.9% -0.8% 4.5% 6.0% 5.2%
Source: Euler Hermes
Business Sector Forecasts [Jan-13] [Jul-12]
EH Americas United States Canada Mexico Brazil Argentina EH Asia-Pacific Japan China India Indonesia South Korea EH France France EH DACH* Germany Switzerland Austria EH Mediterranean Italy Spain Portugal Greece — —Turkey EH Northern Europe United Kingdom Ireland Belgium Netherlands — —Bulgaria Norway Czech Republic Poland Sweden Slovakia Finland Denmark Russia World
* production in France does not include Toyota’s production at Valenciennes and Smart’s at Hambach in MoselleSources: OICA, Euler Hermes forecasts
Vehicles Production Per Region in 2011
* Germany - Austria - Switzerland
Risque global
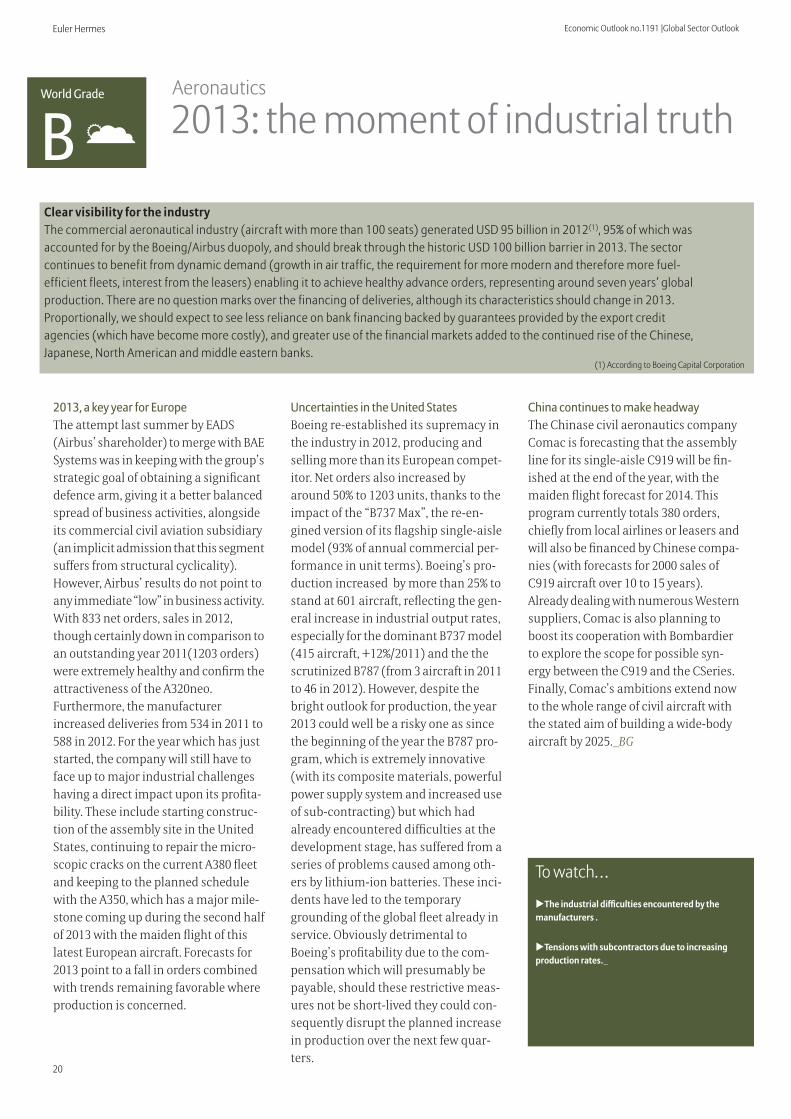
AClear visibility for the industryThe commercial aeronautical industry (aircraft with more than 100 seats) generated USD 95 billion in 2012(1), 95% of which was accounted for by the Boeing/Airbus duopoly, and should break through the historic USD 100 billion barrier in 2013. The sector continues to benefit from dynamic demand (growth in air traffic, the requirement for more modern and therefore more fuel-efficient fleets, interest from the leasers) enabling it to achieve healthy advance orders, representing around seven years’ global production. There are no question marks over the financing of deliveries, although its characteristics should change in 2013. Proportionally, we should expect to see less reliance on bank financing backed by guarantees provided by the export credit agencies (which have become more costly), and greater use of the financial markets added to the continued rise of the Chinese, Japanese, North American and middle eastern banks.
Economic Outlook no.1191 |Global Sector Outlook
20
Euler Hermes
Aeronautics
Uncertainties in the United StatesBoeing re-established its supremacy in the industry in 2012, producing and selling more than its European compet-itor. Net orders also increased by around 50% to 1203 units, thanks to the impact of the “B737 Max”, the re-en-gined version of its flagship single-aisle model (93% of annual commercial per-formance in unit terms). Boeing’s pro-duction increased by more than 25% to stand at 601 aircraft, reflecting the gen-eral increase in industrial output rates, especially for the dominant B737 model (415 aircraft, +12%/2011) and the the scrutinized B787 (from 3 aircraft in 2011 to 46 in 2012). However, despite the bright outlook for production, the year 2013 could well be a risky one as since the beginning of the year the B787 pro-gram, which is extremely innovative (with its composite materials, powerful power supply system and increased use of sub-contracting) but which had already encountered difficulties at the development stage, has suffered from a series of problems caused among oth-ers by lithium-ion batteries. These inci-dents have led to the temporary grounding of the global fleet already in service. Obviously detrimental to Boeing’s profitability due to the com-pensation which will presumably be payable, should these restrictive meas-ures not be short-lived they could con-sequently disrupt the planned increase in production over the next few quar-ters.
2013, a key year for EuropeThe attempt last summer by EADS (Airbus’ shareholder) to merge with BAE Systems was in keeping with the group’s strategic goal of obtaining a significant defence arm, giving it a better balanced spread of business activities, alongside its commercial civil aviation subsidiary (an implicit admission that this segment suffers from structural cyclicality). However, Airbus’ results do not point to any immediate “low” in business activity. With 833 net orders, sales in 2012, though certainly down in comparison to an outstanding year 2011(1203 orders) were extremely healthy and confirm the attractiveness of the A320neo. Furthermore, the manufacturer increased deliveries from 534 in 2011 to 588 in 2012. For the year which has just started, the company will still have to face up to major industrial challenges having a direct impact upon its profita-bility. These include starting construc-tion of the assembly site in the United States, continuing to repair the micro-scopic cracks on the current A380 fleet and keeping to the planned schedule with the A350, which has a major mile-stone coming up during the second half of 2013 with the maiden flight of this latest European aircraft. Forecasts for 2013 point to a fall in orders combined with trends remaining favorable where production is concerned.
2013: the moment of industrial truth
To watch…
uThe industrial difficulties encountered by the manufacturers .
uTensions with subcontractors due to increasing production rates._
World Grade
B
China continues to make headwayThe Chinase civil aeronautics company Comac is forecasting that the assembly line for its single-aisle C919 will be fin-ished at the end of the year, with the maiden flight forecast for 2014. This program currently totals 380 orders, chiefly from local airlines or leasers and will also be financed by Chinese compa-nies (with forecasts for 2000 sales of C919 aircraft over 10 to 15 years). Already dealing with numerous Western suppliers, Comac is also planning to boost its cooperation with Bombardier to explore the scope for possible syn-ergy between the C919 and the CSeries. Finally, Comac’s ambitions extend now to the whole range of civil aircraft with the stated aim of building a wide-body aircraft by 2025._BG
(1) According to Boeing Capital Corporation

21
Economic Outlook no.1191 | Global Sector Outlook Euler Hermes
Major World Companies
Rank Company Nationality Turnover Change USD bn 06-2012 06-2012/06-2011
1 Boeing Commercial Airplanes United States 22.8
42.7%
2 Airbus Commercial Netherlands 22.7 14.7%
3 Bombardier Aéronautique Canada 3.8 -11.9%
4 Embraer Brazil 2.3 -4.2%
5 Gulstream* United States n/c n/c
6 Cessna United States 1.4 18.5%
7 Dassault Aviation** France 1.4 72.0%
8 ATR France/Italy n/c n/c
9 Hawker Beechcraft United States n/c n/c[(*) Estimated/excluding services ] [
(**) Falcon range []
[Source: companies], based on most recent accounts data
Civil aviation
Airbus Boeing Bombardierin units Commercial Commercial Aerospace*
Airplanes
Net orders2012 833 1,203 138
Net orders 2011 1,419 805 54
Net Orders for 2012
* Excluding business jetsSource: constructors
2013f2012e201120102009
6,863 6,995
8,208
9,100 9,000
Total Order Books for the Main Manufacturersin units
e: estimates f: forecastsSource: constructorsSource: Euler Hermes
Business Sector Forecasts Jan-13] [Jul-12]
EH Americas United states Canada Mexico Brazil Argentina — —EH Asia-Pacific Japan China India Indonesia South Korea EH France France EH DACH* Germany Switzerland Austria EH Mediterranean Italy Spain Portugal Greece Turkey — —EH Northern Europe United Kingdom Ireland Belgium Netherlands Bulgaria — —Norway — —Czech Republic — —Poland — —Sweden Slovakia — —Finland — —Denmark — —Russia — —World * Germany - Austria - Switzerland

Risque global
AWell-prepared for difficult timesEstimated at USD 3,000 billion excluding pharmaceuticals, the global chemical market experienced mixed results for 2012. Although growth in the chemical sector looked promising until late spring of last year, from that point onwards the key players in the industry began to lower their sights. Being sensitive to GDP variations in the different parts of the world, chemical production suffered from the slowdown in industrial activity in Asia, the economic crisis in (southern) Europe and market developments in the United States following a surge in the supply of shale gas. Moreover, as chemical production is a basic industry, it has followed the trends of the other manufacturing sectors, but above all local growth in the demand for infrastructure. Only demand from a healthy global agricultural market helped to boost sales of fertilizer and phytosanitary products.
Economic Outlook no.1191 | Global Sector Outlook
22
Euler Hermes
Chemicals
compared to 80 cents per gallon a year ago. It is ethane that is used to produce ethylene which represents 40% of global trading volumes in the chemicals sector. The rise of shale gas has given a welcome shot in the arm to the American petrochemicals industry, with countless investment projects in steam crackers, with estimates of capacity increases from 33 to 40 MT per year by 2020. Despite this, the upstream dyna-mism of the American chemicals sector has not prevented restructuring further downstream among the speciality chemicals manufacturers such as Dow (3,300 jobs lost) or DuPont (-1,500 jobs).
A chain reaction in Asia and the Middle East Asia is keen not to be outdone by the renaissance of the American (petro) chemicals industry. Although it is not fortunate enough to be able to enjoy the bonanza of a cheap energy supply, it does benefit on the other hand from the continued dynamism of its outlets in both the automotive or electronics mar-kets or from a considerable requirement for infrastructure, in both India and China. The shift of focus by the chemical industry from west to east is well under-way. The chemical companies of the Middle East have demonstrated wisdom in their business choices, moving their attention away from their stagnating European clientele to zero in on the more promising Asian markets. They are
Europe is stuck in a rutAlthough the first quarter of 2012 was a dynamic one, the chemical production in Europe has still not recovered to its pre-crisis production levels. This could well continue if we factor in the prob-lems encountered by two of its major outlets which are the construction and automotive sectors. The crisis affecting southern Europe has accentuated the difficulties of these two sectors while at the same time reducing household con-sumption, which is having a non-negli-gible impact on the sale of hygiene products. The only good news for the European chemical industry is the main-tenance or even increase in the trade surplus, which owes less to increased demand outside Europe than it does to a sharp slowdown in imports.
Full speed ahead in North AmericaThe year gone by was something of a milestone for the American chemical industry. In addition to an upsurge in business, particularly in the automotive market, it also benefited from the indi-rect benefits of the shale gas revolution accompanied by improvements to its so-called horizontal drilling extraction technology. The result is that America has benefited from energy costs which are significantly more competitive than elsewhere. The supply costs for ethane, a raw material which competes with naphtha, is now lower in the United States than everywhere else, at 23 cents
Toward a trend reversal?
To watch…
u Changes in oil prices .
uThe crisis affecting the markets in southern Europe Gains achieved in the purchasing of energy in North America.
uThe number of external growth operations in the global chemical market._
raising their investments in joint ven-tures, with an example being the USD 20 billion deal signed last summer between the Saudi company Aramco and the American firm Dow for the con-struction of the “Sadara” plastics plant. Aware of the fact that they do not pos-sess the technological know-how for speciality chemicals, the chemical pro-ducers in the emerging nations are instead seeking to implement a vertical integration strategy aimed at making better use of their raw material. Just like the Indian company Reliance, the Saudi company Sabic or the Chinase company Sinochem, they are on the lookout for external growth opportunities in Europe (like the French company Arkema) enjoying a healthy financial position and positioned in high added value seg-ments of the chemical market._ML
World Grade
A

23
Economic Outlook no.1191 | Global Sector Outlook Euler Hermes
Major World Companies
[Source: companies], based on most recent accounts data
Rank Company Nationality Turnover Change USD bn 06-2012 06-2012/06-2011
1 BASF Germany 52 -2%
2 Dow Chemical United States 29 -5%
3 Sinopec China 21 12%
4 Lyondell Basell United States 23 -7%
5 SABIC Saudi Arabia 25 1%
6 Mitsubishi Chemical Japan 20 -4%
7 Dupont de Nemours United States 22 10%
8 Ineos United Kingdom 12 -10%
9 Bayer Germany 26 -0.3%
Annual Growth Rate of Chemical Production (in volume terms) Per Region
Sources: ICIS, Euler Hermes
Region 2011 2012
United States 2% 1.5%
Western Europe 3% 0.5%
Japan 0% 2.0%
Asia (excluding Japan) 9% 8.0%
World 5% 4.0%
Source: Euler Hermes
Business Sector Forecasts [Jan-13] [Jul-12]
EH Americas United States Canada Mexico Brazil Argentina EH Asia-Pacific Japan China India Indonesia South Korea EH France France EH DACH* Germany Switzerland Austria EH Mediterranean Italy Spain Portugal Greece Turkey EH Northern Europe United Kingdom Ireland Belgium Netherlands Bulgaria Norway Czech Republic Poland Sweden Slovakia Finland Denmark Russia World
Share of Global Chemical Sales
Sources: Cefic, Euler Hermes
Rest of world
Asia (excluding Japan)
Japan
Americas
European Union
46%
20%
6%
6%
23%
* Germany - Austria - Switzerland

Risque global
AAn industry subject to the growth in national wealth and the challenges of internationalization As the cornerstone of the infrastructure and housing industries, the construction sector is intrinsically linked to growth and demographics. The slowdown in wealth generation in numerous countries therefore heralds trouble for businesses in this sector. The deteriorating financial situation for both households and states and the contagious effect as difficulties spread between trading partners in a "chain reaction" have adversely affected the construction industry, which operated more as a group of national markets. The internationalization of this sector has also been accentuated by the competition raging between the major groups outside their national borders. For 2012, it can be estimated that the nominal value of the entire global construction market increased to 9100 billion dollars, i.e. a growth rate of 2.5%, indicating that various property bubbles are now deflating. The outlook for 2013 points to a similar performance with differing evolutions according to the countries in question and the extent to which recovery from crises coincides with the emergence of new difficulties.
Economic Outlook no.1191 | Global Sector Outlook
24
Euler Hermes
Construction
The low point has now been reached in North AmericaA market correction for previous excesses appears to be drawing to a close in the United States. Several indica-tors confirm this, even if the upturn is still a rather fragile one. The number of houses available for sale has climbed back to its long-term average level, with 1.6 million in late December 2012. After a drastic fall, house prices have stabilised (-0.6% at late October 2012 over 10 months). The value reached on this date was even ahead of October 2011. Finally, housing starts are up, compared to the low point of October 2011. In 2013, the pace of activity in the American market will be closely linked to the employment situation and the future of homes under the threat of repossession. The start of a trend reversal in the construction sector has already sparked a sharp increase in the prices of raw materials and particu-larly wood (+47% in 2012). This has therefore encouraged the Canadian pro-ducers to boost production, all the more so as housing starts in Canada increased by +11% in 2012 with significant dispari-ties according to the regions, although this trend should be attenuated in 2013.
The more moderate emerging nations remain sources of growth Property investments in China are now under control with stricter access to property ownership. The price of homes has therefore been contained at the risk
The weaknesses of the construction sector are felt all across EuropeThe European construction market is still experiencing difficulties. The bene-fits of stimulus packages have now faded and market activity levels are fall-ing due to a lack of investors despite the historically low interest rates. The situa-tion remains particularly tense in Spain, where despite the production of new homes falling by late 2012 to 10% of its peak of January 2007 and with prices down by -30%, there still remains a sur-plus of 650,000 homes available for sale. The outlook in this industry is also dete-riorating in France, where the effects of new public support packages are not yet measurable, and in the United Kingdom which benefited from an upturn through public investment. Recovery from the crisis is therefore not likely to occur before the second half of 2013 at best. What's more, we are seeing a slowdown in activity in the Eastern European countries, which have invested a great deal in their infrastruc-ture, although the effects of this wind-fall are disappearing with the reduced demand from their trading partners in the West. This is the case in Poland where housing starts were down by -7% by late October and road building pro-jects are under increasing pressure with European financing ever more limited and regulated.
Marking time in the construction sector…
To watch…
uSigns of recovery and renewed confidence.
uThe investment capacities of households and states.
uIncreases in the historically low interest rates.
uThe intensity of competition between operators._
World Grade
C
of harming local finances. In Beijing, their prices fell by -7.6% in 2012. The slowdown in growth has contributed to this price moderation despite upward price pressure due to increasing urbani-zation. The strategy of the new govern-ing team for 2013 is once again to favor the development of infrastructure. India also has a reservoir of potential produc-tion activity due to its pressing need for housing, a growing population and a bold dam-building policy on the Ganges. In Brazil, the requirement for infrastruc-ture (€70 billion per year) and real estate investments (€100 billion per year) remains considerable. The organization of the World Cup in 2014 (€7.5 billion) is an added bonus for this sector. Africa also has a considerable growth potential due to current underinvestment and demographic growth. What's more, this continent possesses raw materials neces-sary to the construction sector, such as iron._DM
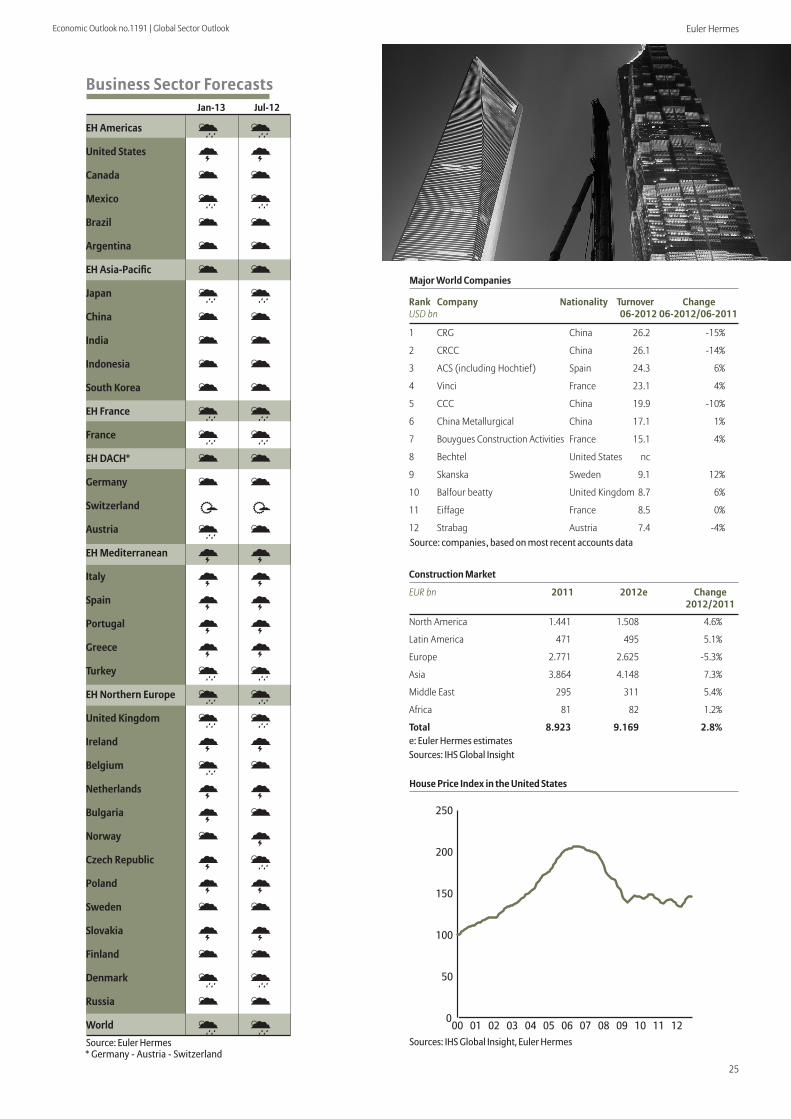
25
Economic Outlook no.1191 | Global Sector Outlook Euler Hermes
Marking time in the construction sector…
Major World Companies
[Source: companies], based on most recent accounts data
Rank Company Nationality Turnover ChangeUSD bn 06-2012 06-2012/06-2011
1 CRG China 26.2 -15%
2 CRCC China 26.1 -14%
3 ACS (including Hochtief) Spain 24.3 6%
4 Vinci France 23.1 4%
5 CCC China 19.9 -10%
6 China Metallurgical China 17.1 1%
7 Bouygues Construction Activities France 15.1 4%
8 Bechtel United States nc
9 Skanska Sweden 9.1 12%
10 Balfour beatty United Kingdom 8.7 6%
11 Eiffage France 8.5 0%
12 Strabag Austria 7.4 -4%
Construction Market
e: Euler Hermes estimatesSources: IHS Global Insight
EUR bn 2011 2012e Change 2012/2011
North America 1.441 1.508 4.6%
Latin America 471 495 5.1%
Europe 2.771 2.625 -5.3%
Asia 3.864 4.148 7.3%
Middle East 295 311 5.4%
Africa 81 82 1.2%
Total 8.923 9.169 2.8%
0
50
100
150
200
250
12111009080706050403020100
House Price Index in the United States
Sources: IHS Global Insight, Euler Hermes Source: Euler Hermes
Business Sector Forecasts [Jan-13] [Jul-12]
EH Americas United States Canada Mexico Brazil Argentina EH Asia-Pacific Japan China India Indonesia South Korea EH France France EH DACH* Germany Switzerland Austria EH Mediterranean Italy Spain Portugal Greece Turkey EH Northern Europe United Kingdom Ireland Belgium Netherlands Bulgaria Norway Czech Republic Poland Sweden Slovakia Finland Denmark Russia World * Germany - Austria - Switzerland

Risque global
ADiverging trendsThe turnover of the global air transport industry increased by more than 6% in 2012 to exceed USD 635 billion according to the International Air Transport Association (IATA). In fact, this increase hides two diverging trends. Globally, traffic and prices in the passenger segment have continued to rise, benefiting from regional expansions (respectively +5.3% and +3.0%) while freight suffered from difficult international trading conditions due among other things to the difficulties in Europe (-2.0% for both indicators). Global profit for the sector remained limited overall (at more than USD 6 billion according to IATA), once again adversely affected by market prices for jet fuel which were near record levels. Finally, although being a symbol of globalization, air transport is still very much subject to regional factors.
Economic Outlook no.1191 | Global Sector Outlook
26
Euler Hermes
Air transport
transport sector demonstrated the value of this model in 2012, in which pricing power is crucial to maintaining profitability in the sector faced with a lacklustre trading environment (with traffic up by +1.1% compared to 2011) and above all a period of high fuel costs (with companies being handicapped by their ageing fleets). Despite stability in performance terms being expected in 2013 and in response to demand levels which may just be showing the first signs of sensitivity to continued price hikes, the main airlines are now involved in the second phase of the "plan" intended to bring about a long-term return to profitability: i.e. replacing their aircraft, with huge orders for re-engined single-aisle planes. While the future of American Airlines will certainly be decided during 2013 (a merger with US Airways is still being discussed), recent strategic manoeuvres have demon-strated that the American operators have become ambitious once again with the acquisition of a shareholding by Delta Air Lines in the British airline Virgin Atlantic, following a similar oper-ation involving the Brazilian airline GOL in late 2011.
Supporting growth in Asia and the Middle East Although displaying some similarities with Europe (fragmentation, significant freight activity, intense competition, etc.), the the Asian legacy carriers are
The time for action has come in EuropeFor 2012, the traditional European air transport sector finished the year with a consolidated net loss. Still suffering from stiff competition from the low-cost and Middle Eastern airlines, the tradi-tional players have also had to deal with a deteriorating economic environment. As at the start of 2012 they had already made significant efforts to reduce costs and increase productivity , the second half of the year saw a number of major strategic realignment initiatives includ-ing the introduction and/or reinforce-ment of low-cost offers (Germanwings for Lufthansa and Transavia for Air France – KLM) and stronger ties with Gulf companies with an example being the integration of Qatar Airways within the Oneworld alliance and “code shar-ing” (operational cooperation on certain routes) between Etihad Airways and Air France – KLM. Although a return to equi-librium is expected for the entire tradi-tional air transport sector in 2013, a number of national, medium-sized air-lines are still facing serious difficulties and find themselves at a crossroads, with a choice between the closure of their businesses or acquisition by a com-petitor (after the financing of any possi-ble restructuring required).
The figures are looking strong for the United StatesContinuing its focus on strict capacity control, the traditional American air
Flight plans needed
To watch…
uOil prices.
uCargo traffic change._
World Grade
C
looking healthier, partly due to a more promising economic climate. The net average profitability of these players nevertheless fell by 50% in 2012 accord-ing to the Euler Hermes(1) sample, ham-pered by a certain degree of price pres-sure triggered by the massive arrival of capacity and performance in the cargo segment, affected by the low levels of worldwide trade. In 2013 we can expect to see an upturn in results and fresh progress in the realignment of business models, with the rollout of low-cost offers (Scoot for Singapore Airlines for example) and cooperation for the oper-ation of certain routes with the Gulf companies (Emirates and Qantas). Finally, according to the specialized consultancy companies CAPA and Innovata, 2013 should see the emer-gence of Emirates as the leading global airline in terms of capacity._BG
(1) Sample: Cathay Pacific, ANA, Singapore Airlines, Korean Airlines

27
Economic Outlook no.1191 | Global Sector Outlook Euler Hermes
Rate of Growth in Annual Air Traffic
Rank Company Nationality Turnover Change USD bn 06-2012 06-2012/06-2011
1 Lufthansa Germany 19.9 6.0%
2 United Continental Holdings United States 18.5 2.9%
3 Delta Airlines United States 18.1 7.4%
4 Air France-KLM France 16.7 5.1%
5 AMR / American Airlines United States 12.5 7.2%
6 IAG (British Airways + Iberia) UK / Spain 11.7 9.8%
7 All Nippon Airways Japan 9.5 6.9%
8 Emirates UAE 10.4 17.0%
9 Southwest + AirTran United States 8.6 18.9%
10 Qantas Australia 8.2 6.0%
11 Japan Airlines Japan 8.0 5.7%
Source: companies], based on most recent accounts data
passengers and cargo. in % 2011 2012e 2013f
Global 4.0 3.2 3.7
North America 1.7 0.2 0.4
Europe 6.7 2.8 2.2
Asia Pacific 2.4 2.3 4.4
Middle East 8.6 15.5 12.3
Latin America 9.8 6.5 6.4
Africa -0.7 6.9 6.2
e: estimates, f: forecastsSource: IATA
Major World Companies
Source: Euler Hermes
Business Sector Forecasts [Jan-13] [Jul-12]
EH Americas United States Canada Mexico Brazil Argentina EH Asia-Pacific Japan China India Indonesia South Korea EH France France EH DACH* Germany Switzerland Austria EH Mediterranean Italy Spain Portugal Greece Turkey EH Northern Europe United Kingdom Ireland Belgium Netherlands Bulgaria Norway Czech Republic Poland Sweden Slovakia Finland Denmark Russia World
0
1
2
3
4
5
Middle East
Latin AmericaEuropeAsia-PacificNorth America
2013f2012e
in percentage of turnover
e: estimates, f: forecastsSource: IATA
Cumulative Operating Earnings in the Main Regions
* Germany - Austria - Switzerland

Risque global
AThe mobile market is on cloud nineThe Information and Communication Technologies sector covers a huge range of subsectors, the perimeters of which can often overlap. It includes computer equipment and services and telecommunications, but also electronic consumer goods. Turnover for 2012, which was close to €3200 billion, is now mostly comprised of services (58%). Hardware manufacturers are often at the very forefront of innovation and provide fertile ground for the expansion of services. Consequently, the issue of telecommunications equipment and infrastructure opening the way to the deployment and use of 4G technology is set to emerge in a big way in 2013. The theme of cloud computing became commonplace in 2012, while awaiting the next big thing in innovation. The challenges today lie in keeping pace with personal mobility and ensuring the connectivity of products. In terms of geographical areas, Asia-Pacific, North America and Europe each represent around 30% of the market but their economic dynamics are very different.
Economic Outlook no.1191 | Global Sector Outlook
28
Euler Hermes
Information and Communication Technologies
the North America region is today faring better than Europe. It represents approx-imately 30% of business in this sector with a growth rate of 4%, twice that of Europe. It accounts for 23% of the num-ber of connected devices (tablets, smart-phones, laptop computers and TVs). This dynamism is amply demonstrated by the presence of 9 American companies among the world's 15 largest Information and Communication Technology firms. Some 50,000 software publishers are American and a quarter of patents registered in the world are American, which is decisive at a time when interfaces and services have become more important than the equip-ment and terminals and when an upturn is underway in the United States. Furthermore, this country is also a trail-blazer in the deployment of the fourth generation telephony network which it launched in late 2010, becoming the world's leading network in late 2012 with 16 million subscribers. The central role of mobile communications in the mass retail electronics sector was con-firmed at the recent annual electronics show in Las Vegas.
The emerging economies lead the wayThe emerging countries are major con-sumers of technology products but also leading producers of them too. The Asia-Pacific region continues to gain market share in the field of semiconductors in which it accounted for 56% of the global
Europe loses ground despite its best effortsThe Information and Communication Technology sector has held its ground in Europe with a growth of 1.5% in 2012. Despite this, its global market share is gradually contracting, a trend which should continue in 2013. Europe sup-ports its technologies in order to pro-mote the competitiveness of European companies with a number of programs aimed at boosting competitiveness and innovation (worth €156.5 million in 2013). In the mass consumer sector, the market is being driven mainly by smartphones and tablet computers, to the detriment of PCs. Although Europe has lost many of its mass consumer electronics manufacturers, where the production of components is con-cerned it maintains a modest position for specific products, accounting for 11% of global production. The deploy-ment of 4G is likely to be the main event of the year in 2013 in Europe, which is lagging behind the United States and Japan, and being rolled out in a rather haphazard way (having already been completed in Sweden and Portugal, underway on a town-by-town basis in France with several operators and implemented on a blanket basis with a single operator in Great Britain).
North America is ready to bounce backThough its domination was once being gradually eaten away, a trend exacer-bated by the economic crisis of 2008,
Innovation and services
To watch…
uThe pace at which the new networks are deployed.
uThe intensity of price pressure.
uHousehold consumption levels._
World Grade
B
market by late November 2012. This sec-tor should attract relatively little invest-ment in 2013, but already has sufficient production capacity to meet demand from structural growth. At the other end of the chain, the Korean and Chinase manufacturers were the stars of the Las Vegas show with the latest sign of their success being the transition currently underway from PCs to tablets. Conversely, India, a champion of the off-shoring of IT services, is experiencing a slowdown in this market, exacerbated by rising real estate and labor costs. At the same time, the state is seeking to boost technological infrastructure faced with demographic pressure and an increasingly urban population. In the short term, Brazil will need to invest in these fields to prepare for the major sporting events to be held there in 2014 and 2016, all the more so as its burgeon-ing middle class has an ever greater appetite for new technologies._DM

29
Economic Outlook no.1191 | Global Sector Outlook Euler Hermes
Major World Companies
Source: companies], based on most recent accounts data]
Rank Company Nationality Turnover Change USD bn 06-2012 06-2012/06-20111 Apple United States 86 66%2 Samsung South Korea 82 21.5%3 NTT Japan 65 1.6%4 AT&T United States 63 0.7%5 Verizon United States 57 4.2%6 IBM United States 50 -1.6%7 Panasonic Japan 45 -9%8 Sony Japan 39 2%9 Deutsche Telekom Germany 37 -0.9%10 Microsoft United States 36 -7.3%11 Dell United States 29 -5.8%12 Cisco United States 23 7.7%13 LG South Korea 22 -9%14 Oracle United States 20 2.1%15 HP Products et Services United States 19 -5.0%16 Nokia Finland 19 -24.3%17 Lenovo China 17 21.7%18 Ericsson Sweden 16 -1.3%
Source: Euler Hermes
Business Sector Forecasts [Jan-13] [Jul-12]]
EH Americas United States Canada Mexico Brazil Argentina EH Asia-Pacific Japan China India Indonesia South Korea EH France France EH DACH* Germany Switzerland Austria EH Mediterranean Italy Spain Portugal Greece — —Turkey EH Northern Europe United Kingdom Ireland Belgium Netherlands Bulgaria Norway —Czech Republic Poland Sweden Slovakia Finland Denmark Russia World
Sources: Idate, Euler Hermes
Electronic consumer goods
TV services
Computer hardware
Software & computer services
Telecoms equipment
Telecoms services
9%
20%
9%
24%
11%
11%
The Market for Information and Communication Technology
0
50
100
150
200
250
300
350
13110907050301999795
(e)(f)
e: estimates, f: forecast
World Semi-Conductor Market
Sources:WSTS, Euler Hermes
* Germany - Austria - Switzerland

u ArgentinaEuler Hermes Argentina S.A.Av. Corrientes 299 - 2° PisoC1043AAC CABA Buenos AiresTel.: +54 11 4320 7157/77
u AustraliaEuler Hermes Australia Pty Ltd.Level 9, Forecourt Building2 Market StreetSydney, NSW 2000Tel.: + 612 8258 5108
u AustriaPrisma Kreditversicherungs-AGHimmelpfortgasse 291010 ViennaTel.: + 43(0) 5 01 02-0
Euler Hermes Collections Gmbh,Zweigniederlassung OsterreichHandelskai 3881020 ViennaTel.: + 43 1 90 81 771
u BahrainPlease contact United Arab Emirates
u BelgiumEuler Hermes Europe S.A. (NV) Avenue des Arts - Kunstlaan 561000 BrusselsTel.: + 32 2 289 3111
u BrazilEuler Hermes Seguros de Crédito SAAvenida paulista, 2.421 - 3°andarJardim PaulistaSão Paulo /SP 01311-300Tel.: + 55 11 3065 2260
u CanadaEuler Hermes Services Canada Inc. 1155 René-Lévesque Blvd West Suite 1702Montréal (Québec) H3B 3Z7Tel.: + 1 514 876 9656
u ChileEuler Hermes Seguro de Crédito SAAve. Presidente Kennedy 5735Of.801, Torre PonienteLas CondesSantiagoTel.: + 56 2 246 1786
u ChinaEuler Hermes Consulting (Shangai) Co.,LtdUnit 2103,Taiping Finance Tower,N°488 Middle Yincheng Road, PudongNew Area, Shangai, 200120Tel.: + 86 21 6030 5900
u ColombiaEuler Hermes ColombiaCalle 72 6-44 Piso 3Edificio APABogotaTel.: + 571 326 4640
u Czech RepublicEuler Hermes Europe SAorganizacni slozka Molákova 576/11186 00 Prague 8Tel.: + 420 266 109 511
u DenmarkEuler Hermes Denmark filial of Euler Hermes Europe SA, BelgienAmerika Plads 192100 Copenhagen OTel.: + 45 88 33 3388
u EstoniaPlease contact Finland
u FinlandEuler Hermes Europe SASuomen sivuliikeMannerheimintie 10500280 HelsinkiTel.: + 358 10 8 50 8500
u FranceEuler Hermes France SA Euler Hermes CollectionEuler Hermes World Agency1, place des SaisonsF-92048 Paris la Défense CedexTel.: + 33 1 84 11 50 50
u GermanyEuler Hermes Deutschland AG Friedensallee 25422763 HamburgTel.: + 49 40 8834 0
Federal Export Credit GuaranteesFriedensallee 25422763 HamburgTel.: + 49 40 8834 9000
Euler Hermes Collections GmbH Zeppelinstr. 4814471 PostdamTel.: + 49 331 27890-000
u GreeceEuler Hermes Emporiki SA16 Laodikias Street & 1-3 Nymfeou Street 115 28 Athens Tel.: + 30 210 69 00 000
u Hong KongEuler Hermes Hong Kong Services Ltd.Suites 403-11, 4/FCityplaza 412 Taikoo Wan RoadIsland EastHong-KongTel.: + 852 2867 0061
u HungaryEuler Hermes Europe SAMagyarorszagi FioktelepeKiscelli u. 1041037 BudapestTel.: + 36 1 453 9000
u IndiaEuler Hermes India Pvt. Ltd.4th Floor, Voltas House23, J N Heredia MargBallard EstateMumbai 400 001Tel.: + 91 22 6623 2525
u IndonesiaPT Assuransi Allianz Utama IndonesiaSummitmas II. Building, 9 th floorJI. Jenderal Sudirman Kav 61-62Jakarta 12190Tel.: + 62 21 252 2470 ext 6100
u IrelandEuler Hermes Ireland Allianz HouseElm ParkMerrion RoadDublin 4Tel.: +353 (0)1 518 7900
u IsraelICIC, 2, Shenkar street68010 Tel AvivTel: + 97 23 796 2444
u ItalyEuler Hermes Europe S.A. Rappresentanza per l’ItaliaVia Raffaello Matarazzo, 1900139 RomeTel.: + 39 06 87001
u JapanEuler Hermes Deutschland AG Japan BranchKyobashi Nisshoku Bldg. 7F8-7 Kyobashi, 1-chome, Chuo-KuTokyo 104 0031Tel.: + 81 3 3538 5403
u KuwaitPlease contact United Arab Emirates
u LatviaPlease contact Poland
u LithuaniaPlease contact Poland
u MalaysiaEuler Hermes Singapore Services Pte Ltd.Malaysia BranchSuite 3A_13A Level 13A, Block 3APlaza Sentral, Jalan SentralJalan Stesen Sentral 550470 Kuala LumpurTél. : +603 2264 8556 (or 8599)
u MexicoEuler Hermes Seguro de Crédito S.A.Blvd. Manuel Avila Camacho #164,8° pisoCol. Lomas de BarrilacoDeleg. Miguel HidalgoMexico DF CP 11010Tel.: + 52 55 5201 7900
30
Economic Outlook no.1191 | Global Sector Outlook Euler Hermes
Subsidiaries
Registered Office : Euler Hermes Group — 1, place des saisons —92078 Paris La Défense — FranceTél. : + 33 (0) 1 84 11 53 77 — Fax : + 33 (0) 1 84 11 50 17 — www.eulerhermes.com

Economic Outlook no.1191 | Global Sector Outlook Euler Hermes
Siège social : Groupe Euler Hermes — 1, rue Euler —75008 Paris — FranceTél. : + 33 (0) 1 40 70 50 50 — Fax : + 33 (0) 1 40 70 50 17 — www.eulerhermes.com
u MoroccoEuler Hermes Acmar37, bd Abdelattif Ben Kaddour20050 CasablancaTel.: + 212 5 2279 0330
u The Netherlands Euler Hermes Nederland NVPettelaarpark 205216 PD’s-HertogenboschTel.: + 31 73 688 9999
u New ZealandEuler Hermes New Zealand LtdLevel 1, 152 Fanshawe StreetAuckland 1010Tel.: + 64 9 354 2995
u NorwayEuler Hermes Norge Holbergsgate 21 P.O. Box 6875 St. Olavs Plass0130 OsloTel.: + 47 23 25 6000
u OmanPlease contact Poland Arab Emirates
u PhilippinesPlease contact Singapore
u PolandTowarzystwo Ubezpieczen Euler Hermes S.A.ul. Domaniewska 50 B02-672 WarsawTel.: + 48 22 363 6363
u PortugalCOSEC - Companhia de Seguro de Créditos, S.A.Av. da República, nº 581069-057 Lisbon Tel.: + 351 21 791 3700
u QatarPlease contact United Arab Emirates
u RomaniaEuler Hermes Europe S.A.BruxellesSucursala BucurestiStr. Petru Maior, nr.6,Sector 1011264, BucarestTel.: + 40 21 302 03 00
u RussiaEuler Hermes Credit Management OOO Office C08, 4-th Dobryninskiy per.,8Moscow, 119049Tel.: + 7 495 98128 33 ext 4000
u Saudi ArabiaPlease contact United Arab Emirates
u SingaporeEuler Hermes Singapore Services Pte Ltd3 Temasek Avenue# 03-02 Centennial TowerSingapore 039190Tel.: + 65 6297 8802
u SlovakiaEuler Hermes Europe S.A, pobockapoist’ovne z ineho clenskeko statuPlynárenská 7/A821 09 BratislavaTel. : + 421 2 582 80 911
u South AfricaPlease contact Italy
u South KoreaEuler Hermes Hong Kong ServicesKorea Liaison OfficeRoom 1411, 14th Floor, Sayong Platinum Building156, Cheokseon-dongChongro-kuSeoul 110 052Tel.: + 82 2 733 8813
u SpainEuler Hermes Crédito,Sucursal en Españade Euler Hermes France-S.A.Paseo de la Castellana, 95 Planta 14Edificio Torre Europa28046 MadridTel.: + 34 91 417 77 67
u Sri LankaPlease contact Singapore
u SwedenEuler Hermes Sverige filialKlaraBergsviadukten 90P.O. Box 729 101 64 StockholmTel.: + 46 8 55 51 36 00
u SwitzerlandEuler Hermes Deutschland AG,Zweigniederlassung Zürich Tödistrasse 658002 ZürichTel.: + 41 44 283 6 5 65
Euler Hermes Reinsurance Tödistrasse 658002 ZürichTel.: + 41 44 283 65 85
u TaiwanPlease contact Hong Kong
u ThailandAllianz C.P. General Insurance Co, Ltd323 United Center Building30th FloorSilom RoadBangrack, Bangkok 10500Tel.: + 66 2638 9000
u TunisiaPlease contact Italy
u TurkeyEuler Hermes Sigorta A.sMaya Akar enterBuyukdere Cad. No:100k:7,34394, Esentepe/IstanbulTel. : + 90 212 290 76 10
u United Arab EmiratesEuler Hermesc/o Alliance Insurance (PSC) Warba Center, 4th FloorOffice 405 PO Box 183957DubaiTel.: + 971 4 211 6005
u United KingdomEuler Hermes UK 1 Canada SquareLondon E14 5DXTel.: + 44 20 7512 9333
u United StatesEuler Hermes North AmericaInsurance Company800 Red Brook BoulevardOwings Mills, MD 21117Tel.: +1 410 753 0753
Euler Hermes UMA Inc.(trade debt collection)600 South 7th StreetLouisville, KY 40201-1672Tel.: +1 800 237 9386
u VietnamPlease contact Singapore
Subsidiaries
Registered Office : Euler Hermes Group — 1, place des saisons —92078 Paris La Défense — FranceTél. : + 33 (0) 1 84 11 53 77 — Fax : + 33 (0) 1 84 11 50 17 — www.eulerhermes.com

Economic OutlookSeries
This document reflects the opinion of the Economic Research Department of Euler Hermes.The information, analyses and forecasts contained herein are based on the Department's current hypotheses and viewpoints and are of a prospective nature. In this regard, the Economic Research Department of Euler Hermes has no responsibility for the consequences hereof and no liability. Moreover, these analyses are subject to modification at any time.
Euler Hermes North America Insurance Company800 Red Brook Blvd, Owings Mills, MD 211171-877-883-3224 | www.eulerhermes.us
No. 1179 | January 2012 uGlobal Sectors ReviewLooking for growth where it can be found.
No. 1180 | February 2012 uBusiness Insolvency in France (only available in French)The overall decrease in French insolvencies hides several weaknesses
No. 1181| March 2012 uMacroeconomic, Risk and Insolvency OutlookA fog cannot be dispelled by a fan
No. 1182 | April 2012 uSpecial DossierPayment periods: between resistance and convergence
No. 1183-1184 | May-June 2012 uMacroeconomic, Risk and Insolvency OutlookToomuch timewasted saving time
No. 1185 | July 2012 uGlobal Sector OutlookEconomic sectors put to the test
No. 1186 | August 2012 uMacroeconomic, Risk and Insolvency OutlookIn 2013, we take the same and start again
No. 1187 | September 2012 uSpecial reportThe Reindustrialization of the United States
No. 1188 | October 2012 uSpecial reportTransport: a two-speedworld
No. 1189-1190 | Nov-Dec 2012 uMacroeconomic, Risk and Insolvency OutlookWorld heads for sixth year of crisis: something the Maya did not forecast!
No. 1191 | January 2013 uGlobal Sector OutlookNow where did global demand go ?
To come:
No. 1192 | February 2013 uSpecial reportTrade routes