Embed Size (px)
Citation preview

NNMB Technical Report No: 24
NATIONAL NUTRITION MONITORING BUREAU
��������������� ������������� ���������
���� �������� ������������ ���� �� ���������������
������ �� ����
NATIONAL INSTITUTE OF NUTRITION Indian Council of Medical Research
Hyderabad – 500 007 2006

NATIONAL NUTRITION MONITORING BUREAU Director : Dr. B. Sivakumar ( up to 30th September 2005)
Officer-in-charge: Dr. L. Singotamu (w.e.f. 1st October 2005 to March 2006) Director : Dr. B. Sesikeran ( w.e.f. April 2006)
SCIENTIFIC STAFF – CENTRAL REFERENCE LABORATORY
Name Designation
Dr. G. N. V. Brahmam Dy. Director (Sr. Grade) & HoD, Div. of Community Studies
Dr. A. Laxmaiah Assistant Director
Dr. R. Hari Kumar Senior Research Officer
Dr. N. Balakrishna Senior Research Officer
Dr. N. Arlappa Senior Research Officer
Mr. Ch. Gal Reddy Research Officer
Dr. K. Mallikharjuna Rao Research Officer
Ms. Maria Monica Research Officer
Mr. Sharad Kumar Technical Research Officer
Mr. M. Ravindranath Technical Research Officer
TECHNICAL STAFF - CENTRAL REFERENCE LABORATORY
Name Designation Name Designation
Mr. P. V. Parthasarathy Sr. Tech. Officer Mr. G. Govindarajulu Lab. Asst.
Mr. P. Venkateswara Rao Tech. Officer Mr. S.P.V. Prasad Lab. Asst.
Mr. V. Radhakrishna Rao Sr. Tech. Asst. Mr. K. Sreerama Krishna Lab. Asst.
Mr. U.D. Awasthi Tech. Asst. Ms. G. Madhavi Lab. Asst.
Mr. D.P.R. Vittal Tech. Asst. Mr. Ch. Shashidhar Reddy Comp. Asst
Mr. Ch. Nagambika Prasad Tech. Asst. Ms. B. Sreelatha Nutritionist
Mr. K. Nageswara Rao Tech. Asst. Mr. Santosh Kumar Sahu Comp. Asst
Mr. B. Pothuraju Tech. Asst. Ms. K. Sujeevanamma Nutritionist
Mr. N. Srinivasachary Tech. Asst. Secretarial Staff
Mr. Ch. Krishna Technician Mr. G. Hanumantha Rao Pers. Assistant
Mr. C. Saibabu Technician Mrs. G.Prashanthi Stenographer

STATE UNITS
State Officer-in-charge Medical Officer Nutritionist/ Social Worker
Andhra Pradesh
Dr. B. Siva Kumar, Dr. L. Singotamu, Dr. B. Sesikeran
Dr. J.Chalapathi Rao Mr. K.Raghu Prasad* Ms. D.E.Ragini, Ms. D.Vijayajyothi
Gujarat Dr. W.R.Hegan Ms. Rina D.Rensiya*
Ms. Priyanka Patel/ Mr. Nilesh A. Rajput*, Mr. Y.A.Solanki*, Mr. Vinaya Kalpesh*
Karnataka Dr. Rudrappa Dr. Tripuramba
Mr. M.S.R. Cariappa*, Ms. J yothi, Mr. Satish, Mr. A.B.Ramakrishna* Ms. Sowmya
Kerala Ms. Rasheeda Bai, Mr. Suresh Kumar
Mr. Santosh Kumar* Ms. M.G. Sreekumari
Madhya Pradesh
Dr. Tapas Chakma Dr. Rakesh Babu Ms. S. J. Khan Mr. S. Gajanan Dhore*
Maharashtra Dr. D.J. Dhande Dr. Dinesh V.Bhale Mr. S.R. Pakhale
Orissa Dr. S. K. Kar Dr. Sunil Kumar Das Ms. Sukhalatha Paikray Ms. Haraprava Sahu*
Tamil Nadu
Dr. Vasanthi,
Dr. Raja Sekhara Pandian, Dr. S. Elango
Mr. D. Gopalakrishnan*
Ms. K. Rajyalakshmi (Till May 2004) Ms. Mary J. Jeya* Ms. Bhagavathi Lavanya
Uttar Pradesh Dr. Arvind Pandey Dr. Sunil Varshney Mr. Neeraj Kumar*
West Bengal Dr. Roy Choudhary Dr. S. Bandyopadhyay, Dr. Ananya Ghosh
Ms. Sudeshna Maitra, Mr. Srimat Tudu*, Ms. Upasana Ghosh*, Ms. Sushimita Saha
* Assistant Research Officer/ Social Worker

CONTENTS Page Nos. ACKNOWLEDGEMENTS EXCUTIVE SUMMARY 1. INTRODUCTION 1
2. OBJECTIVES 1 2.1 General Objective 1 2.2 Specific Objectives 1
3. METHODOLOGY 2 - 9 3.1 Study Design 2 3.2 Sample Frame 2 3.3 Selection of villages 2 3.4 Sampling Procedure 3 3.5 Investigations 4
3.5.1 Household socio-economic and demographic particulars 4 3.5.2 Nutrition Assessment 4 3.5.3 History of Morbidity 4 3.5.4 Chronic Diet related morbidities 4
3.6 Data Analysis 5 3.6.1 Diet and Nutritional status 5
3.7 Training and Standardization of Investigators 9 3.8 Quality Control 9 3.9 Ethical Issues 9
4. RESULTS 9 - 47 4.1 Coverage 9 4.2 Household Socio-economic and demographic profile 10 4.3 Food and Nutrient Intakes 13 4.4 Nutritional Status 24 4.5 Prevalence of Anaemia 32 4.6 Prevalence of Morbidity 36 4.7 Diet Related Chronic Diseases 39
4.7.1 Mean Anthropometric Measurements 39 4.7.2 Prevalence of Abdominal Obesity According to Waist circumference 39 4.7.3 Prevalence of Abdominal Obesity According to Waist/Hip Ratio (WHR) 39 4.7.4 Prevalence of Obesity (BMI ≥25) 40 4.7.5 Hypertension 40 4.7.6 Prevalence of Diabetes Mellitus (DM) / Impaired Glucose Tolerance (IGT) 40 4.7.7 Awareness of Hypertension and Diabetes mellitus and use of Tobacco and Alcohol 41 4.7.8 Prevalence of HTN, DM and Obesity vs demographic & Socio- economic Variables 41 4.7.9 Association between Prevalence of hypertension and Obesity 45 4.7.10 Impaired Glucose Tolerance & Diabetes Mellitus vs abdominal obesity 45
5. DISCUSSION AND CONCLUSIONS 48 - 50
REFERENCES 51 - 52 TABLES 53 - 157 ANNEXURES (provided in separate booklet)

�
�
�
�
�
� ���� � !�" !# !�$��…
� �� % ��&� �� ������ �� �&��'�� �� # (� � (� ) ��'���&*���(������*�
�(� # (� ) ��&�����&���� ��� *� � ���(� � �����*��(� +(+(� # ��&�� *��(�
������&� � �����*� �(� # (�(� ���&�'�*� ������&� � ������ ���� # (�
���&����&�,�-�*�������������������&�����������&� �(���
� � ������&��'�� ����&����������# ����� ���� �� �&�� ������*�����
�&��������*��&����������� ������ �*�) � ���� ��� �.����������*���
�&���&� ������������������&���� �&�����������&�������(�
����-�������&�� ����*�% ����������� ����&���� � ���������&���
% & �&������ ������ ���� �������*� % ��&��� % &��&*� �&�� ������
% � �����&����-��������- �(��
�
� / $ � � ���

NNMB Rural Survey 2005-06 i Diet & Nutritional status, HTN, DM and IDA
�� ��� � �� �� � � � �
������� �&�� ���� 0112314*� �&�� ��# ,� ������ ��� ������� ��� �&�� �� �
�� � �������� �� ����� ������� ��5(*� ��� �*� ������'�*� $ �� � � ����*� � ��&�� �����&*�# �&���&��*� # ��&��� �����&*� " �6���*� � ����� ���� � ���� ,���� (� � $ &�� �� �����������-������ �������42�&������������ ��!7���������������*��� ����&����� � �� ��� �(� � +�� �������� �� ������ ����� ���� �������� ������� ���*� ���� ����� ��-������ �������� �� % ����� ����� ������� ���� � ����� � ��� ����*� � ���������� �������-����� # � ����� 8��� � ��&�� �����&� � �9� % ��� � �� ��������(� � ��� � -��� ��� ���� ��� ��� �� � ��� ������� � % � ��*� % &� % ��� ��� ������ �� ��� ��� # ��� ������*�% ���� ����������(��
�$ &������������������� ����*�� ������������������ ���&�������������� ���
������ ������&�� &���& ���8� � �9*��������� ����&�� ���*�� ����� ��7�� ����������������� �������������*�023&����� �� ��&��������������������������������������� ����'��� �� &���& ��� ���� ��������� �*� &����� �� � -������ ������ �&����������� :4� ����*� - �� ������� � ������ ���*� �������� - �� � ����� ��� �� 8���� ��&�������&9���������� �������� ��� � -��� ��� ���� ������ ��� �������% � ��(��
�� -��� 4:*;11� ��������� �� �� ��������� ����� �� � :2*04<� � � �� ��� ;:=� �� �����
% ����������������&�� ���*�� ����� ��7�� ��������������� �������� -�����(�+��� ��������������������������'��% ���� �������� �=1*022���������� ���� �;*1;>�&���& ��(�
�$ &����� ���������������� ����&������ �6�������&��� � ��������-� �������
� ����� � ����� 8>>? 9(� � -��� =;? � �� � � �� -� ����� �� -��'% ��� �� � �������*� % &� ��00? �-� ���������&��� ��������������::? �����&��� ���$ �-��(���� ���% 3�&�������&��&�����% ������ �3�����(�$ &������������ � ����5��% ���2 (@ (�� ���� ����% ����&��� �6� ��������� ��� �-��� �� A����� 804? 9� �� � � �*� % &� �� �-��� 22? � % ��� ���&������� ��� � 8:4? 9� � �&�� �-�� 80>? 9(� � % ���*� �-��� 2@? � �� �&�� � � �� ���� ���������� ���� ����� ��� � ���(� � -��� =0? � �� �&�� ��� �� � ��� ���� 2>? � % � ��� % ���� ������(�$ &���������� ��& ������������ ���� ��% �����(�<<1�����&���������� ��*�% &� �� 0@? � �� � � � &������ ��& �� ��� ������� ���� ���� �����&��� =11���(� ������(� � �� �6����% ������ ������ � ����8<2? 9*�% &� ��:>? ����&�% ������&���7���������� ����6������� � ���(�
�� -��� =@? � �� �&�� � � �� &��� ����� ��� ����� �� ���'���� % ���*� % &� �� ��� �-���
=4? *��&�����'����% ���������% �����-��% � �(�+������� *��-���0;? ����&��� � ��&����������� �����*� �-��� ;<? � �� �&�� � � �� ��������� �������� '���&��� ���� �-��� �% ��&�������&��&�����% ���� ��������(�
����� ���� � � ���� �� ��� �&�� -� '� �� �&�� �� � ��������(� # � ���� �����������
� �� �-��� :=? � �� �&�� ��� � ���� �� ����� ��*� ���� % ��� ����� ����� ��� ��� �������A���������� � �� �� ��� �&�� ������� �� " �6���*� # �&���&��*� ������'�� ���� # ��&���

NNMB Rural Survey 2005-06 ii Diet & Nutritional status, HTN, DM and IDA
�����&(�$ &������� �������� ������7��������������-���% ���-� % ��&����+����� � �&�� ���B��7B�&��� ���� � ����(� $ &�� ����� ����� �� ��������� ���� ���&� ����� ���*� " )*� � � '� ���� ������ % ��� ��� �� �����A����(� ����A���� �*� �&�� ����'��� ��� ��������������&� ��� ��*� ����� ��� � *��-� ����� ����� �������� % ��� ��� -� % � �&����� � ������ ��� ������ ��&����������(�� � �������&����&������& �������& ������&� ����% �������� �������������A�����������������������*��&����������% &��&�% ���&��&������� ��������8�-���=13<1? 9����������� ���8�-���;13>1? 9(�
��������&���&� ����������&��������4�������7&�-�������������'% ��&�'*�
% &� ���&������ �������� ���� ���% ����-���1 (:? (�$ &������ �������, ��������*����-6������������������� ���� �����������������&��������� ����� ������*��������������,3�� � �7� ����������*� % ��� �-��� 1 (<? � ���� 1 (>? � ��������� �� �� ��� �&�� ����& ��&� ���(� � � ��� �&�� ��& � ���� �&� ���*� �&�� �� � �� ����������� ������ ����� % �����6������� � 7����� 8:(@? 9*� , ���� ����� 8:(<? 9*� ���� �� ��� ������� 8:(@? 9C� �&������ ������������ �� �����% ���0? (��
�$ &��� ������&���&�������% ���&������&����� �������������% ����� ���- ����
4�&� ����� �� �� ���� �� ��� �� ��������� ��� �&�� :32 � ���� ���� ���� % &� �� �&��� % ��� % ������&�� �����������(�$ &������ �����������������������������% ���&���� ���� -�� +� �� � ������������ ������� �� �������� �&�� �� �� � �-��� 21? � ��� <3:0�� ��&�������������-���<1? ����:0302�� ��&���������������������-������&��� ��� ��� � <1�� ��&�(� $ &��� ���������� �&�� ������ �������� <3:>� � ��&�������*� % &��� �&�������������������&� ��������������������� ��-����� ��(��
�+������� *��&��������������& ��&� ����% ��&�����% ���&��8D# ������E�0�
��9�% ����-���44? *�% &� ���&���������������% ���&��8D# �����E=��9�% ���:>? (�$ &�������� �� ����3% ���&�� �� ��� D=� ���� �&� ���� % ��� �� ���- �� % ��&� �&�������������.� �30�����������&�������(�$ &���7����������������8D# �����E0��9�% ����-���40? *�% &� ���-���:4? �������& ��&� ����% ���% ������8D# �����E0��9(��� ������������ ������ ���������� �� % ��� -������ ��� �&�� ���� ����� �������������(� � � �������� ��� �&�� ���� ����� �� ����� % ���&�� 844? � ) �� <1? 9� ����% �������8:4? �) ��0=? 9�% ���-����������� ��������&��������������� �����# , �������� �� 011131:(� $ &�� ���� ����� �� ��������� &% ���� �� ������ ��� � �� 840? � ) ��2@? 9(���
�$ &�� ���� ����� �� ����% ���&�*� ��������� ���� % ������*� �������� �� �������
� � � ��&� ���% �&������������ ���13<1�� ��&���&� ����% ����-���21? *�24? �����01? � ��������� �(� $ &�� ���� ����� �� ��% ���&�B-������ 8, # +F� # �����G0��9� % ����-���0 (4? (�
�$ &�� ���� ����� �� ����% ���&�� ������� �� �������� �� � �-��� 2:? � �� ���
�&� �������<3@ ���������������=>? ����:13:=�����������&������ ��������-���=>? ����:23:;������������(�

NNMB Rural Survey 2005-06 iii Diet & Nutritional status, HTN, DM and IDA
$ &�� ���� ����� �� ��� � ������������ % ��� � ����� �� &��&�� �� ��� �&���&� ���� �� � ������ ���� �&��� -� ������ �� ��&��� ��� $ �-��(� $ &�� ������ ��� ������������������% ���&��% ���� ����� ��&��&������&����� ���� ������ � �������� ����&��� ������ ���'���&��&����(�$ &���7�����������% ���&����������� ��������% ��&� �������� ��� ������� � ��& �� ��� ������� ���� �� 8��+9*� �� � �-��� 2<? � ��� � � ��% ��&���+���H��(@11*���<1? ����� � ��% ��&���+���D���(=11 (�
�� ���&����������� ��� *��-���==? ����&��� � �������=<? ����&����� � ���&���
�&���������������������8,# +ID:> (49(�$ &������ ���������% ���&��% ���� ����� ��&��&�� �� ��� ��� � ��� 8:1 (@? 9� �&��� � � ��� 8; (>? 9(� $ &�� � ��� �� � �� �� �� ��� -���������� ���������������������% �������*����&��*�������������������������������������*��&������ �������% &��&��������� �0���:1? (�
�$ &�� � ���� � ��� � -��� ��� �� �� ��� ��� �� � ��� ������� � % � ��� 8≥01� ����9�
% ���-� % ��&�����3�������������������-��� � � ���������������� ��(�� -���44? ������ ��� �������;4? ������ �% � ���% ������������� ��(�$ &������ ���������� ���% ���&��&���� ��� �&��������� �� � ���� ,���� � 8� ��I� >2? C� % � ��I� @:? 9� �� ����� �� �&��������(���
�$ &����� ����� �������&����������8-��J���) ++�������9�% ����������-��
���� &��&� 04? � ���� 02? � �� ��� ��� �� � ��� ���� ��� � % � ��� ��������� �(� $ &������ �����% ���&��&��������&������������� ��8� ��I�4:? C�% � ��I�2;? 9��� ��������&�� ������(� � � �������� ���������� % ��� -������ -��% ���� ���� ����� ��&���������� ���� -�����*� � � � � ����� � (� � $ &������ ����� �����-����� ���� �� ������� ����� � ������ % ��� �-��� 2? � ���� 0? � ��������� �(� ���� ����� �� �# B+" $ � % �������������� ������������% ��&�-�����*�� � �*������ �(���
�� -��� �% � �&��� �� � ��� 8<< (4? 9� ���� % � ��� 8<1(4? 9� % ��� �% ��� ��
&���������*� �� �&�� � �-��� � �� 2? � �� �&�� � % ��� '�% �� &������������ ���� 03=? �% ��� �� ����� ���(� ��� � � �*� �-��� 4<? � � ��� ���� 2@? � % � ��� �% ��� �� ���-������ � ����*����&�� �� ���-���:30? �&���'�% �����-����������:? �% ���������� ���(��
�$ &������� �������������������������5���&���� � ���������������&���������
��������A���������-�����*�� $�������# ����������������&�� ��-����&�������������������������� ������� ��������������&�-���(�
�
�
�
�
�
�

NNMB Rural Survey 2005-06 Diet & Nutritional status, HTN, DM and IDA
1. INTRODUCTION The National Nutrition Monitoring Bureau (NNMB) carries out diet and nutrition surveys routinely once in every 5 years, and special studies during the intervening period. Accordingly, subsequent to the diet and nutrition survey (1999-2000), micronutrient deficiency (MND) survey was carried out in 8 NNMB States during the period 2002-03. The current survey was, therefore, initiated during 2004-05, to assess the diet and nutritional status among the rural communities in 10 States viz., Andhra Pradesh, Gujarat, Kerala, Karnataka, Madhya Pradesh, Maharashtra, Orissa, Tamil Nadu, Uttar Pradesh and West Bengal.
Several sporadic studies carried out in the developing countries, including India1 have been reporting a steady increase in the prevalence of diet related chronic diseases like obesity, hypertension, diabetes mellitus, etc. in urban as well as rural areas. However, no large-scale systematic studies have been carried out in India, especially among rural communities, to assess the prevalence of these disorders. Therefore, in the present survey, in addition to assessment of diet and nutrition status, prevalence of obesity and hypertension among adult men and women (≥20 years) was also investigated. Estimation of Haemoglobin from finger prick blood samples was also carried out among adult men and NPNL women, as these two groups were not covered in the MND survey carried out earlier. In the State of Andhra Pradesh, the assessment of prevalence of Diabetes Mellitus (DM)/ hyperglycemia was also carried out among adults. The study protocol was reviewed and approved by the Steering Committee of NNMB in its annual meeting held on 11th September 2003. 2. OBJECTIVES 2.1 General Objective
To assess the diet and nutritional status of the individuals, prevalence of obesity, hypertension, diabetes (only in Andhra Pradesh) among adults of ≥20 years of age and anaemia among adult men and NPNL women in the rural communities. 2.2 Specific Objectives
1. To assess the food and nutrient intake among different age/sex/physiological groups in the rural communities,
2. To assess the nutritional status of individuals in terms of anthropometry and prevalence of clinical signs of nutritional deficiencies,
3. To assess the prevalence of morbidity during previous fortnight, 4. To assess the prevalence of obesity among the adult men and women (≥20 years)
in terms of BMI, waist circumference and waist-hip ratio (WHR), 5. To assess the prevalence of anaemia among adult (≥ 18 years) men and non-
pregnant and non-lactating (NPNL) women 6. To assess the prevalence of hypertension among the adult (≥20 years) men and
women, and 7. To assess knowledge and practices about disorders such as hypertension and
diabetes mellitus among adults.

NNMB Rural Survey 2005-06 2 Diet & Nutritional status, HTN, DM and IDA
N Area I
Area II
Area III
Area IV
Division of a village in to 5 geographical areas
3. METHODOLOGY 3.1 Study design
It was a cross-sectional study, carried out by adopting multistage stratified random sampling procedure in 9 States, viz., Andhra Pradesh, Karnataka, Kerala, Madhya Pradesh, Maharashtra, Orissa, Gujarat, Tamil Nadu and West Bengal.
3.2 Sample Frame The villages covered by NSSO for its 54th round of consumer expenditure survey
carried out during 1998 formed the sample frame2. Based on agro-climatic criteria, NSSO divides each State into several strata; each stratum consisting of about 1.8 million rural populations. Districts with rural population of more than 1.8 million are divided in to two or more strata by grouping contiguous talukas/tehsils having similar cropping pattern and population density. It also adopts two stage stratified random sampling procedure, in which the villages formed the first stage units (FSUs), while the households (HHs) formed the Second Stage Units (SSUs). Keeping in view the manpower resources available with the NNMB, it was decided to cover 16 strata from each State.
3.3 Selection of villages In each selected stratum, five villages were randomly selected from the list of
villages covered by NSSO for the consumer expenditure survey. 3.3.1 Formation of geographical groups of HHs in the village
The households in each village were selected by adopting cluster-sampling procedure. For the purpose, the entire village was divided into 5 geographical areas based on natural groups of houses, streets or mohallas. Households belonging to SC/ST community, who generally live in a group, were considered as one of the five areas, as shown in the figure below. In each village, a total of 20 HHs were covered (@ 4 HHs per geographical area).
3.3.2 Selection of HHs within each geographical area
In each geographical area, the HHs were enumerated starting from northeast corner and by continuing in a serpentine order. In the case of a large village, where the number of HHs in a geographical area was more than 100, such area was subdivided into
Area V�(SC/ST)�

NNMB Rural Survey 2005-06 3 Diet & Nutritional status, HTN, DM and IDA
2 or more sub-areas, based on natural groups of HHs and from them one group was selected randomly for enumeration. The first HH (with random start) for survey was selected randomly using random number tables. Starting from this household, four consecutive HHs were covered for the survey. In case, the selected house was found locked, next adjacent HH was covered. Similar procedure was adopted for covering HHs in all the remaining geographical areas. Thus, in each village, a total of 20 HHs were covered. 3.4 Sampling Procedure 3.4.1. Socio-economic & demographic information of HHs Socio-economic and demographic particulars were collected from all the 20 HHs covered in each selected village. 3.4.2 Nutritional status
All the available individuals in the selected HHs were covered for anthropometry, clinical examination and collection of history of morbidity during previous fortnight. 3.4.3 Diet survey Twenty-four hour recall method of diet survey was carried out in a sub sample of 10 HHs (every alternate household covered for anthropometry) to assess the food and nutrient intake at the household as well as individual level. 3.4.4 Computation of sample size for diet related chronic diseases 3.4.4.1 Hypertension
Studies carried out in the past have shown that the overall prevalence of hypertension among the rural adults of 20 years and above was about 8-10%3. By assuming the prevalence of Hypertension as 8% and with 95% confidence interval and 20% relative precision, the sample size required for each State was computed as 1,104 adults for each gender. Therefore, from each village, a minimum of 15 adult men and women each were required to be covered for the measurement of blood pressure. However, all the available adults were covered for the purpose of the survey. 3.4.4.2 Fasting blood glucose levels
Earlier studies carried out in India have revealed that the overall prevalence of diabetes mellitus in the rural areas was about 5%4. Thus, assuming a prevalence of 5% of diabetes mellitus with 95% confidence interval and 20% relative precision, a sample of 1,825 adults of ≥ 20 years would be required for each gender for the estimation of fasting blood glucose levels. 3.4.4.3 Haemoglobin levels Assuming a prevalence of anaemia of 50% among adult men and NPNL women (≥ 20 years)5, 95% confidence interval and a relative precision of 10%, a sample size of about 400 individuals in each of the gender was arrived at, for the estimation of haemoglobin levels. Therefore, 5 adult men and women each in the age group of ≥ 20 years were covered for the purpose from every alternate HH covered for the diet survey.

NNMB Rural Survey 2005-06 4 Diet & Nutritional status, HTN, DM and IDA
3.5 Investigations 3.5.1 Household socio-economic and demographic particulars
Household demographic and socio-economic particulars, such as family size, type of dwelling, age/sex/occupation, income and literacy level of all the individuals, household possession of agricultural land, live stock, agricultural production, etc. were collected from all the 20 households selected for the survey. 3.5.2 Nutrition Assessment
All the available individuals from the 20-selected HHs in each village were covered for the assessment of the nutritional status in terms of anthropometry and clinical examination. 3.5.2.1 Anthropometry Anthropometric measurements such as height, weight, mid upper arm circumference and fat fold thickness at triceps were taken on all the individuals in the selected HHs by adopting standard procedures. In addition, waist and hip circumferences were also measured on adults of ≥20 years of age (excluding pregnant women). All the measurements were taken by using standard equipment and procedues6. 3.5.2.2 Clinical Examination
All the individuals covered for anthropometry were examined for presence of clinical signs of nutritional deficiencies. In addition, history of prevalence of symptoms such as night blindness was elicited from the subjects (from mothers of young children). 3.5.2.3 Estimation of Haemoglobin Procedure
20 µl of finger prick blood sample was collected using fixed volume Finn pipettes with disposable tip, by standard procedures and transferred into a test tube containing 5 ml of Drabkin’s reagent. The haemoglobin was estimated using a photoelectric digital colorimeter by cyanmethaemoglobin method7. Commercial Haemoglobin kits (of Dr. Reddy’s Laboratories or Glaxo Laboratories or Zydus Pathline) were used for the purpose. 3.5.2.4 Diet Survey Food intakes of the individuals were assessed by carrying out 24-hour recall method of diet survey in every alternate household (10 HHs) covered for nutrition assessment8. 3.5.3 History of Morbidity
Information on morbidity such as fever, dysentery, diarrhoea and acute respiratory infections during the preceding 15 days was collected among all the individuals covered for Nutrition Assessment. 3.5.4 Chronic Diet related morbidities 3.5.4.1 Measurement of blood pressure
Systolic and diastolic blood pressure was measured in recumbent posture using mercury sphygmomanometer on all the available adults of ≥ 20 years covered for

NNMB Rural Survey 2005-06 5 Diet & Nutritional status, HTN, DM and IDA
anthropometry and clinical examination. The measurements were made for three consecutive times, with a gap of 5 minutes between measurements. 3.5.4.2 Estimation of Fasting blood glucose levels
This investigation was carried out only in the State of Andhra Pradesh on a pilot basis. Fasting Blood glucose levels were measured after a 12 hours fast, using portable Glucometer (Boots) among the adults of ≥20 years covered for anthropometry and clinical examination. For this purpose, all the selected adults were contacted on the previous day, and were instructed to maintain 12 hours fasting before blood glucose level was estimated around 7 am on the next day. 3.5.4.3 Waist circumference
Waist circumference was measured with a fiber reinforced plastic tape at point mid way between the lowest margin of the ribs and the iliac crest. 3.5.4.4 Hip Circumference
Hip circumference was measured with the tape a point of maximum protuberance of buttocks.
3.6 Data Analysis 3.6.1 Diet and Nutritional status 3.6.1.1 Food and Nutrient Intakes of households / Individuals The average daily intakes of different foods by individuals were calculated according to different age/sex, physiological status (pregnant women of ≥ 12 weeks gestation and Lactating women of <12 months duration) and physical activity groups and were compared with the recommended least cost balanced diets provided in ‘Recommended dietary Intakes for Indians’ (1981)9. The average nutrient intakes were calculated by using food composition tables in ‘Nutritive value of Indian Foods’10. The median as well as mean±SD intakes of various nutrients were computed and compared with ‘Recommended Dietary Allowances for Indians’ (1991)11 suggested by the ICMR Expert Committee. In addition, the average intake of various foods and nutrients (per CU/day) at the household level was also computed. 3.6.1.2 Protein /Calorie Adequacy Status of Individuals
The individuals were categorized in to different groups based on the protein/calorie adequacy status according to age/sex/physiological groups and activity. The protein and energy requirement curves are assumed to follow Gaussian distribution, with a coefficient of variation of 15%. The Expert Committee of Indian Council of Medical Research (ICMR) has suggested “requirements” for energy as the “recommended allowances”, while in the case of protein, the “allowances” corresponded to Mean ± 2 SD of the “requirements”. Therefore, for defining the energy/protein adequacy status, 70% of requirements (Requirements-2SD)11 were used as cut-off points for different age/sex/physiological and activity groups.

NNMB Rural Survey 2005-06 6 Diet & Nutritional status, HTN, DM and IDA
3.6.1.2.1 Protein /Calorie Adequacy Status of households The households were categorized according to the protein/calorie adequacy status by considering average consumption of protein/calorie per Consumption Unit (the requirements of reference man is considered as one Unit) per day and by adopting similar procedure described above. However, the cut-off level used to define the adequacy status of a household was “Requirement-2 SE”, since the intakes at HH level are mean values, unlike in the case of individuals. It may also be mentioned here that the SE differ between HHs, since the total CUs for each of the HHs are variable.
3.6.1.3 Anthropometry Mean height, weight, mid-upper arm circumference and fat fold thickness at triceps were calculated according to age group and gender. Preschool Children
The <5-year children were categorized according to their nutritional status by different Classification as described below: Gomez Classification12
Weight for age
(% of NCHS Standard) Nutritional Grade
≥ 90 Normal 75 - 89.99 Grade I (Mild undernutrition) 60 - 74.99 Grade II (Moderate undernutrition)
< 60 Grade III (Severe undernutrition) The children were distributed according to Gomez grades by comparing with NCHS standards13, to facilitate comparison with earlier data of NNMB, wherein only Gomez classification was used, in seventies and early eighties. IAP Classification14
The 6-59 months children were distributed according to IAP classification as follows using Harvard standards6, to help comparison with ICDS data, in different States.
Weight for age
(% of Harvard Standard) Nutritional Grade
≥ 80 Normal 70 – 79.99 Grade I Undernutrition 60 – 69.99 Grade II Undernutrition 50 – 59.99 Grade III Undernutrition
< 50 Grade IV Undernutrition

NNMB Rural Survey 2005-06 7 Diet & Nutritional status, HTN, DM and IDA
Standard Deviation (SD) Classification15 The World Health Organization recommends use of SD classification to categorize
1-5 year children into different nutritional grades. Therefore, the percent distribution of preschool children according to weight for age, height for age and weight for height using NCHS reference values, was done as described below:
SD
Classification Weight for age Height for age Weight for height
≥ Median – 2SD Normal Normal Normal Median –2SD to
≥Median–3SD Moderate
undernutrition Moderate stunting Moderate wasting
< Median–3 SD Severe undernutrition Severe stunting Severe wasting
School age Children and Adolescents Children of 6-9, 10-13, and 14-17 year age groups were distributed according to Weight for age, Height for age and Weight for Height by SD classification using NCHS standards. In addition, 10-13 and 14-17 year age group of children were distributed according to nutritional status based on Body Mass Index (BMI) by using the NHANES age/gender specific BMI centile values, as mentioned below 16.
BMI Age centiles Nutritional grade < 5th centile Undernutrition
≥ 5th - < 85th centile Normal ≥ 85th - < 95th centile Overweight
≥ 95th centile Obesity Adults Body Mass Index (BMI) The nutritional status of adults was assessed according to BMI based on James et al17 and WHO classification18 as follows:
BMI Nutritional Grade Classification <16.0 III degree CED
16.0 – 17.0 II degree CED 17.0 – 18.5 I degree CED 18.5 – 20.0 Low Normal 20.0 – 25.0 Normal 25.0 – 30.0 Over weight
≥ 30 Obesity
James et al
20.0 – 23.0 Normal* 23.0 – 30.0 Over weight
30 – 35 Obesity I 35 – 40 Obesity II
≥ 40 Obesity III
WHO
CED: Chronic Energy Deficiency * For Asian Populations

NNMB Rural Survey 2005-06 8 Diet & Nutritional status, HTN, DM and IDA
Waist Circumference Adult men with waist circumference ≥ 102 cm and adult women with ≥88 cm were
considered as having abdominal obesity19. Waist hip ratio (WHR)
Adult men with waist hip ratio of ≥≥≥≥ 0.95 and women with ≥≥≥≥ 0.80 were considered as having abdominal obesity20
3.6.1.4 Anaemia The criteria suggested by the WHO21 were used to define the extent and degree of anaemia. The cut off values suggested for men and NPNL women (≥ 20 years) by the WHO are presented below:
Degree of Anaemia (g/dL) Gender Normal
Mild Moderate Severe Men ≥ 13 10 -13 7-10 <7 Women ≥ 12 10 -12 7-10 <7
3.6.1.5 Hypertension Subjects with systolic blood pressure of ≥140 mmHg and /or diastolic pressure of
≥90 mm Hg were considered as hypertensive (WHO-TRS 862, 199622 & JNC Criteria23 VII). In the present study, the average of these consecutive reading of blood pressure was considered to categorizing the individuals in the different grades of hypertension as follows:
Blood pressure (mm/Hg) Grades of Hypertension
Systolic Diastolic Normal < 120 < 80 Pre-hypertension 120 - 139 80 - 89 Stage 1 Hypertension 140 - 160 90 - 99 Stage 2 Hypertension ≥ 160 ≥ 100
3.6.1.6 Diabetes Mellitus The following ICMR/WHO cut-off levels were used to categorize individuals with Diabetes Mellitus/ Hyperglycaemia (DM/HG)24.
Category Fasting blood glucose
(mg/dl) Normal <110 Hyperglycemic 110 –125.99 Diabetes Mellitus ≥126

NNMB Rural Survey 2005-06 9 Diet & Nutritional status, HTN, DM and IDA
3.7 Training and Standardization of Investigators The Medical Officers, Nutritionists, Social Workers and Technicians of all the
NNMB Units were trained and standardized at the NIN for a period of three weeks, in various techniques of investigations, including diet surveys, anthropometry, identification of clinical signs of nutritional deficiencies, measurement of blood glucose, haemoglobin estimation, measurement of blood pressure, and administration of various questionnaires before the initiation of the survey. During the training, emphasis was given to achieve the maximum intra and inter-individual agreement in respect of all the measurements. During the training, the teams carried out mock surveys. 3.8 Quality Control To ensure quality control in the estimation of haemoglobin, every 10th sample was collected in duplicate by the investigators, while every alternate duplicate sample was analyzed by the NNMB team to ensure internal consistency; the remaining duplicate samples were collected on Whatman No.1 filter paper using glass haemoglobin pipettes. They were sent immediately by courier to NNMB CRL for analysis to ensure inter lab consistency.
In addition, anthropometric measurements, assessment of haemoglobin, blood glucose levels, and blood pressure were repeated in a sub-sample of individuals in the field during periodical visits by the staff of CRL as a quality control measure. In case of haemoglobin values, the intra-individual variation was less than ± 0.5 g/dl in 48% of duplicate samples, while it was 0.5 to 1.0 g/dl in 25% of the samples. During the survey, the intra class correlation was 0.81, indicating good agreement between the estimations of haemoglobin by NIN and field investigations. 3.9 Ethical Issues Clearance from Institutional ethical review board (IRB) was obtained before initiation of the study. Informed oral consent was obtained from all the subjects, who participated in the survey.
4. RESULTS 4.1 Coverage
The particulars of the coverage for various investigations are provided in Table 1. The coverage of villages was 100% of the target in all the States, except in West Bengal (91.3%), where 7 villages could not be covered due to un- approachability. In the State of Uttar Pradesh, the survey could not be completed due to frequent turn over of the staff. Since Uttar Pradesh could cover only 30 villages out of the targeted 80, the data could not be included in the compilation of final report. A total of 713 villages were covered from 9 States.
About 51,700 individuals of different age group and gender from 14,256 HHs were covered for anthropometry, clinical examination and prevalence of morbidity during the preceding 15 days. Information on food and nutrient intake was collected from 30,244 individuals from 7,078 HHs. A total of 3,391 adult men and 3,384 NPNL women of ≥ 20 year were covered for estimation of Haemoglobin, while measurement of blood pressure was done

NNMB Rural Survey 2005-06 10 Diet & Nutritional status, HTN, DM and IDA
on 11,927 men and 13,702 women of ≥ 20 years. A total of 25,242 individuals of ≥ 20 years were covered for the measurement of hip and waist circumference. Fasting blood glucose levels were assessed in 1803 adult men and 1883 women of ≥ 20 year in the State of Andhra Pradesh. 4.2 Household Socio-economic and demographic profile
The household socioeconomic and demographic particulars are provided in Tables 2.1 to 2.4 and Fig. 1.
4.2.1 Religion
A majority of the HHs (87.8%) belonged to Hindu religion, while the rest were Muslims (7.9%), Christians (2.5%) or others (1.8%). The proportion of Muslims was significantly higher (p<0.05) in the States of Kerala (25.9%) and West Bengal (21.6%), compared to other States.
4.2.2 Community
About 37% of the HHs, in general, belonged to backward communities, while 22% belonged to Scheduled Castes and 11% to Scheduled Tribes. The proportion of tribal HHs was maximum in Madhya Pradesh (24.1%) followed by Orissa (22.9%) and Gujarat (14.6%), while it was least in the States of Tamil Nadu (1.4%), Kerala (2%) and Andhra Pradesh (2.8%).
The proportion of Scheduled Caste HHs covered was higher in the States of West Bengal (40.5%) and Tamil Nadu (28.9%), while it was low in the States of Gujarat (13.6%), Kerala (14.4%) and Madhya Pradesh (15.6%). 4.2.3. Type of house The type of house is considered as an index of economic status of the HHs. A majority of HHs surveyed lived in semi-pucca houses (62%), followed by kutcha (22.3%) and pucca (15.8%). The proportion of HHs living in kutcha houses was highest in the States of Orissa (49.5%), followed by Gujarat (39.9%) and Tamil Nadu (27.4%), with least in Maharashtra (3.8%) 4.2.4. Type of family
A majority (63.5%) of the families were nuclear, followed by 18.4% each of extended nuclear and joint families. The proportion of nuclear families ranged from 56.7% in Gujarat to 73.6% in Tamil Nadu. The proportion of joint families was relatively higher in Karnataka (24.7%) and Orissa (21.6%) compared to the States of the Madhya Pradesh (12.2%) and Tamil Nadu (15.2%). 4.2.5 Family size
The average family size was 4.9. About 46% of the HHs had family size of 1-4 and 5-7 each, while 8% of the HHs had more than 8 members. A relatively higher proportion of HHs had less than 5 members in the States of Kerala (58.5%), Tamil Nadu (55.3%) and Andhra Pradesh (52.2%) compared to other States like Maharashtra (35.5%), Orissa (36.6%) and Gujarat (38.5%).

Diet & Nutritional status, HTN, DM and IDANNMB Rural Survey 2005-06
11.0
21.9
37.0
30.1
0
10
20
30
40
50
60
Per
cen
t
ScheduledTribe
ScheduledCaste
BackwardCaste
Others
22.3
61.9
15.8
0
10
20
30
40
50
60
70
Per
cen
t
Kutcha Semi-Pucca Pucca
1
1.1
22.6
28.2
15.3
7
8.9
6.7
9.2
0 10 20 30
Others
Business
Service
Artisan
Tenant Cultivator
Landlord
Owner Cultivator
Other Labour
Agriculture Labour
Per cent
Fig. 1 Distribution (%) of Households by Socio-economic Variables
By Community By Type of House
By Major Occupation of Head of HH
29.0
34.4
15.6
21.0
0
10
20
30
40
Per
cent
< 300 300 - 600 600 - 900 >= 900
By HH Per Capita Income (Rs./ Month)
11

NNMB Rural Survey 2005-06 12 Diet & Nutritional status, HTN, DM and IDA
4.2.6 Literacy status of adult men About 32% of adult men in the HHs surveyed were illiterate, the proportion of which
ranged from a high of about 46% in West Bengal and Andhra Pradesh to a low of about 8% in Kerala. About 14% had primary education; 24% had secondary education; 22% had higher secondary education, while only 6% had college education. 4.2.7 Literacy status of adult women
About half of the adult females (48%) in the HHs surveyed were illiterate, the proportion of which ranged from a high of 65% in Madhya Pradesh and Andhra Pradesh to a low of 12% in Kerala. About 12% had primary education; 21% had secondary education; 15% had higher secondary education, while only 2% had college education. 4.2.8 Major occupation of the head of the household In about 43% of the HHs in general, major occupation of the head of the household was agricultural labour (15%) or other labour (28%), while in about 23%, the head of the HHs was owner cultivator. The proportion of HHs engaged in labour activity was maximum (55%) in the State of Gujarat and least in the State of Kerala (38%).
The proportion of cultivators was highest in the State of Madhya Pradesh (46%) and least in Kerala (3%). About 18% of HHs in general, were engaged in either service (8.9%) or business (9.2%). Their proportion was highest in Kerala (34%) and least in Madhya Pradesh (10.7%). 4.2.9 Household Landholding
In general, about 49% of the HHs did not possess any agricultural land, the proportion of which ranged from a high 66.4% in Gujarat to a low 35.9% in Orissa. About 32% were marginal farmers, 9% were small and 10% were large farmers. The proportion of marginal farmers was maximum in the States of Orissa (49.1%) and Kerala (48.8%) and least in Gujarat (15.2%). The proportion of large farmers was maximum in the State of Maharashtra (19.7%) and least in Kerala (0.1%). 4.2.10 Per capita monthly Income The average monthly per capita income was Rs. 660/- at the current rupee value. Gujarat had highest average per capita monthly income of Rs.1057/-, while Orissa had lowest of Rs.330/-. In general, two thirds of HHs (63.4%) had monthly per capita income of either Rs.300/- or Rs.300-600, while one fifth (21%) had ≥ Rs.900/- month. The proportion of HHs with ≥ Rs.900/- per month was maximum in the State of Gujarat (45.3%) and lowest in Orissa (4.8%). 4.2.11 Household physical facilities and access to safe drinking water
In general, about 27% of the HHs had sanitary latrine the proportion of which was highest in Kerala (88.3%), and least in Madhya Pradesh (7.4%) and Orissa (8.6%). About three fourth of HHs (75.5%) had separate kitchen, the proportion of which was highest in Kerala (97.4%) and Tamil Nadu (92.1%) and lowest in Andhra Pradesh (47.4%).

NNMB Rural Survey 2005-06 13 Diet & Nutritional status, HTN, DM and IDA
About 86% of HHs in general used firewood as cooking fuel, followed by LPG (10%) and kerosene (0.9%). About 72% of houses were electrified, the proportion of which ranged from a high (95% each) in Gujarat and Andhra Pradesh to a low 26.8% in Orissa and 32.9% in West Bengal. About 39% of the HHs had protected water supply (tap), while rest of HHs had either tube well (35%) or open well (24%) as source of drinking water.
4.3 Food and Nutrient Intakes 4.3.1 Food and Nutrient intakes of Households 4.3.1.1 Household Food intakes The State-wise average daily consumption of foods (g/CU/day) is provided in Table 3 and Fig. 2. In general, cereals formed the bulk of the dietaries of the population surveyed. The millets intake was relatively higher in the States of Gujarat (maize, bajra), Maharashtra (Jowar), Karnataka (ragi) and Madhya Pradesh. The consumption of nuts and oil seeds was high in Kerala (coconuts), while the State of Gujarat had maximum intake of milk. Cereals & millets The average intake of cereals and millets was about 396 g/CU/day, which is about 86% of RDI. The Intakes ranged from a low of 320g in Kerala to a high of 477g in the State of West Bengal. Pulses& legumes The average intake of pulses & legumes was low (28 g/CU/day) in all the States and was about 70% of RDA. The intakes ranged from a low 18g in West Bengal to a maximum of 37g in Tamil Nadu and Karnataka. Green leafy vegetables The average consumption of green leafy vegetables (16g/CU/day) was much below the suggested levels of 40g in all the States, except in Orissa (43 g) and West Bengal (41 g). The intakes were very low in the States Andhra Pradesh (6 g), Kerala (7g), Karnataka (8 g) and Gujarat (9 g). Other vegetables
The average consumption of other vegetables was relatively better in all the States (49g/CU/day) and was 82% of the recommended level. The intakes ranged from a low of 23 g in Karnataka and a high 78 g in Gujarat.
Roots & tubers The intake of roots & tubers (60 g/CU/day) was higher than the suggested level of 50g at aggregate level. However, the intakes were lower than the suggested levels in the States of Maharashtra (20g), Andhra Pradesh (34g), Karnataka (40g) and Tamil Nadu (41g).

Diet & Nutritional status, HTN, DM and IDANNMB Rural Survey 2005-06
87
21
53
77
31
31
29
226
78
16
36
77
174
25
26
31
0 50 100 150 200 250 300
Sugar & Jaggery
Fats & Oils
Milk & Milk Products
Roots & Tubers
Other Vegetables
Leafy Vegetables
Pulses
Cereals
Per cent RDA
1 - 3 Yrs
4 - 6 Yrs
105
42
91
41
65
80
125
131
18
67
89
77
136
63
50
41
0 100 200
Sugar & Jaggery
Fats & Oils
Milk & Milk Products
Roots & Tubers
Other Vegetables
Leafy Vegetables
Pulses
Cereals
Per cent RDA
MalesFemales
82
40
70
86
70
47
55
120
0 50 100 150
Sugar & Jaggery
Fats & Oils
Milk & Milk Products
Roots & Tubers
Other Vege tables
Leafy Vege tables
Pulses
Cereals
Pe r cent RDA
Fig. 2 Average daily Intake of Food Stuffs as % of RDA
1-6 year Children Adults (Sedentary)
Households (CU/day)
14

NNMB Rural Survey 2005-06 15 Diet & Nutritional status, HTN, DM and IDA
Milk & milk products The average consumption of milk & milk products was about 82 g /CU/day. Except in the State of Gujarat (170 g), the consumption was less than the recommended level of 150 g in all the States. The intakes was lowest in the State of in Orissa 14 g followed by Madhya Pradesh (59 g), Kerala (66 g). Fats & Oils The average consumption of fats and oils (14g/CU/day) was less than the suggested levels of 20g, in all the States, barring the States of Maharashtra (22 g) and Gujarat (21 g). The average intake was least in Kerala (6 g), followed by Karnataka (9 g), Madhya Pradesh (9 g) and Orissa (10 g). Sugar & Jaggery The average consumption of sugar & jaggery was about 14g /CU/day, which was about 47% of recommended levels (30 g). The consumption levels ranged from a low of 7g in Orissa to a high of 29g in Maharashtra. 4.3.1.2 Household Nutrient intakes The median intake of nutrients at household level (CU/day) compared with RDA (ICMR 1991), are provided in Table 4 and Fig. 3. Protein The median intake of protein for the States pooled was 47 g. The intakes were less than RDI of 60g in all the States and ranged from a low 41g in Tamil Nadu to a maximum 53g in Gujarat. Total Fats The median intake of total fats ranged from a low 7g in the States of Orissa and West Bengal to a high 34g/CU/day in Kerala. Energy The overall median intake of energy was 1787kcals/CU/day, which was about 74% of recommended level. The intakes were less than the RDA in all the States and ranged from a low of 1594 kcals in Gujarat to a high of 2061kcals/CU/day in Andhra Pradesh. Calcium The median daily intake of calcium pooled for the States was 335 mg and was about 84% of RDA. The intakes were less than the RDA of 400 mg/CU/day in all the States, except in the State of Gujarat, ranged from a low of 239 mg in the State of Madhya Pradesh to a high 417mg in Gujarat. Iron The overall median intake of iron (12.3mg) was much below the RDA (28mg). The intakes were much lower than the RDA in all the States and ranged from a low 8.3mg in Andhra Pradesh to a maximum of 23mg/CU/day in Gujarat.

NNMB Rural Survey 2005-06 16 Diet & Nutritional status, HTN, DM and IDA
Vitamin A The overall median intake of vitamin A was 115 µg/CU/day, which is about 19% of the RDA. The intakes were much below the RDA of 600µg and ranged from a low of 80µg in Orissa and to a maximum of 170µg/CU/day in Gujarat. Thiamin The overall median intake of thiamin was about 1.1mg/CU/day, which is about 92% of the recommended level. The median intakes were comparable to RDA in all the States, except in Andhra Pradesh (0.6mg), Kerala (0.9mg), Madhya Pradesh (1.0mg) and Karnataka (1.1mg), where it was low. Riboflavin The median intake of riboflavin pooled for the States (0.6mg/CU/day) was less than the recommended level of 1.4mg. The intakes were well below RDA and ranged from a low of 0.5mg in the States of Kerala, Orissa and West Bengal and to a high of 0.9mg/CU/day in Gujarat. Niacin The overall median intake of niacin was 14mg/CU/day and was 88% of the recommended levels of 16mg. The intakes ranged from a low of 11mg/CU/day in Karnataka to a high 21mg in West Bengal. Vitamin C The median intake of Vitamin C pooled for the States was about 28mg/CU/day, which is about 78% of RDA. The intakes ranged from a low of 14mg in Maharashtra to a high of 50mg per CU/day in West Bengal. Free folic acid The overall median intake of free folic acid was 50µg/CU/day, and was half the suggested level of 100µg. The intakes were less than the RDA in all the Sates and ranged from a low of 40µg in Andhra Pradesh to a high of 64µg/CU/day in Gujarat.
4.3.2 Food and Nutrient intakes of Individuals 4.3.2.1 Food intakes of Individuals
The average daily intakes of food and nutrients among individuals of different age and sex groups are given in Tables 5.1 - 5.15. 1-3 year children
The average daily intake of cereals and millets among 1-3 year children was (135 g) about 77% of RDI. The intakes were lower than the RDI in all the States except in Andhra Pradesh (102% of RDI). The extent of deficit was highest in Kerala (42%), followed by Maharashtra (35%), Tamil Nadu (34%), Gujarat (30%), Karnataka (26%), West Bengal (20%), Orissa (19%) and Madhya Pradesh (7%). The mean intake of pulses and legumes (13 g) was about a third of the RDI (35 g). The consumption of green leafy vegetables, a rich source of

NNMB Rural Survey 2005-06 17 Diet & Nutritional status, HTN, DM and IDA
vitamin A, was negligible (6 g). The average daily intakes of other protective foods like milk and milk products (86 g) were less than a third of the recommended level of 300 g. The daily intake of fats and oils, an energy dense food was observed to be a fifth (5 g) of RDI (25 g) (Table 5.1 & Fig.2 ). 4-6 Year children The mean intake of cereals and millets among 4-6 year children was (209g) about 77% of the RDI (270 g). The intakes ranged from a low of about 164g in Gujarat and Kerala, to a high of about 250 g in the States of Madhya Pradesh and Andhra Pradesh. The intake of all other foodstuffs was less than the RDA, except for roots & tubers (Table 5.2 & Fig.2).
The intake of protective foods such as pulses and legumes was about a half of the
recommended levels, while that of milk and milk products was grossly inadequate. The consumption of green leafy vegetables was negligible (10 g). 7-9 year children
The mean intake of cereals and millets was 260 g, while that of the pulses and legumes was 22g. The levels of consumption of other foods such as GLV (12g), milk (62 ml), fats and oils (9 g) and sugar and jaggery (11 g) were very low (Table 5.3). The intakes of cereals & millets were lowest (190 g) in Kerala and maximum in Orissa (292 g). 10-12 year Boys The mean intakes of cereals & millets and pulses & legumes were 308g and 23g as against RDI of 420g and 45g respectively. The intake of all other foods, except roots and tubers was lower than the RDI (Table 5.4). The intake of cereals and millets was least (229 g) in Kerala and maximum in Andhra Pradesh (365 g). 10-12 year Girls As in the case of boys, the intake of cereals and millets among girls was also less (303 g) than the RDI (380 g). The intake of pulses, GLV, milk and sugar were grossly inadequate and was less than half the suggested levels (Table 5.5). The intake of staple food was lowest (214 g) in Kerala and maximum (372 g) in Andhra Pradesh. 13-15 year Boys The mean intake of cereals and millets was 362g, which ranged from a low of 282 g in the State of Kerala to a high 460 g in Andhra Pradesh. There was a wide variation in the mean intake of most of other foods among the States surveyed (Table 5.6). 13-15 year Girls The mean intake of cereals & millets among girls was 341 g, while that of pulses was 24 g. The intake of cereals & millets ranged from a low of 255 g in Kerala to a high of 412 g in West Bengal. The pulse intake was lowest in Gujarat (13 g) and maximum in the States of Tamil Nadu, Maharashtra and Karnataka (about 31 g) (Table 5.7).

NNMB Rural Survey 2005-06 18 Diet & Nutritional status, HTN, DM and IDA
16-17 year Boys The average daily intake of cereals & millets was 426 g, which ranged from a low 324 g in Gujarat to a high 604 g in West Bengal. The mean intake of pulses was 29 g while that of GLV was 14 g. The intake of GLV ranged from a low of 7g in Andhra Pradesh to a maximum of about 25g in West Bengal and Orissa. The consumption of milk and milk products ranged from a low 6 g in Orissa to a high 144 g in Gujarat (Table 5.8) 16-17 year Girls The average daily consumption of cereals and millets was 354g, while the pulses intake was 24g. The intake of all other foods was comparable with their male counterparts. (Table 5.9) Adult Men
The average intake of cereals and millets among adult men engaged in sedentary work (418g) was about 91% of the RDI (460 g). Barring other vegetables and roots & tubers, the intake of all other foods was lower than the suggested levels. However, the milk intake was higher than the recommended levels only in the State of Gujarat, while that of intake of oils & fats was higher than the recommended levels in the States of Maharashtra (26g), Gujarat (25g) and West Bengal (22g) (Table 5.10 & Fig.2.)
In case of adult males engaged in moderate activity, the average intake of cereals &millets (494 g) was less than the RDI of 520 g. Except for roots and tubers, the intake of all other foods was lower than the suggested levels (Table 5.11). Adult Women The average consumption of cereals & millets among NPNL women engaged in sedentary work (365 g) was about 90% of RDI (410 g). However, the intakes were marginally higher than the recommended levels in the States of West Bengal (432 g) and Orissa (435 g). Barring roots & tubers and other vegetables, the average intake of all the other foods was lower than the suggested levels. The extent of deficit was highest with respect to green leafy vegetables (82%) (Table 5.12 & Fig.2). Among those engaged in moderate activity, the average intake of cereals & millets (410g) was 93% of the RDI (440g). Barring other vegetables, the intake of all the other foods was lower than the suggested levels (Table 5.13). The average intake of cereals & millets among pregnant women (362g) was comparable to that observed among NPNL women, indicating inadequate intakes despite increased demand due to pregnancy. Similar pattern was observed in the intakes of cereals & millets with respect to Kerala, Gujarat and Orissa. The intake of milk and milk products was relatively higher than the suggested levels in the State of Gujarat (Table 5.14). Lactating Women The average consumption of cereals & millets among lactating women of less than one year was 406 g, against 410 g among NPNL women. Similarly, the intake of all the other foods was also comparable with that of NPNL women (Table 5.15).
NNMB Rural Survey 2005-06 19 Diet & Nutritional status, HTN, DM and IDA
4.3.2.2 Nutrient intakes of Individuals In view of large variation in the mean intakes of nutrients, the medians were considered for comparison with RDI. The median intakes of different nutrients according to age, sex, activity and physiological groups are given in Tables 6.1- 6.15. The means and standard deviation are also presented along with median intakes. 1-3 Year children In general, the median intakes of all the nutrients were less than RDA. The median intake of energy was less than RDA of 1240 kcals in all the States and ranged from a low 536 kcals in Gujarat to a high 876 kcals in Andhra Pradesh. The median intake of protein ranged from a low 16g in Kerala to a maximum of 21g in Madhya Pradesh and West Bengal as against RDA of 22g. The intakes of micronutrients such as vitamin A, Vitamin C, Calcium, iron and riboflavin (57%) were found to be grossly inadequate (Table 6.1 & Fig.3). 4-6 year children The median intakes of all the nutrients were below the RDA. The median intake of energy was less than RDA (1690 kcals) in all the States and ranged from a low 791 kcals in Gujarat to a maximum of 1107 kcals in Andhra Pradesh. The protein intake was below the recommended level, in the States of Kerala, Tamil Nadu, Karnataka, Andhra Pradesh, Gujarat, Orissa and West Bengal. As observed in 1-3 year children, the extent of deficit was high with respect to micronutrients such as vitamin A, riboflavin, Vitamin C and iron (Table 6.2 & Fig.3). 7-9 year children In general, the median intakes of all the nutrients were less than the RDA in all the States. The extent of deficit was relatively high with respect to intake of micronutrients (Table 6.3 ). 10-12 year Boys The consumption levels of all the nutrients were less than RDA in all the States. The intake of energy ranged from a low 1058 kcals in Gujarat to a high of 1623 kcals in Andhra Pradesh as against RDA of 2190 kcals. The diets were grossly deficient in micronutrients such as vitamin A, iron and riboflavin (Table 6.4). 10-12 year Girls As observed in the case of boys, the median intake of all the nutrients was less than the RDA. The intake of energy ranged from a low 1217 kcals in Tamil Nadu to a high of 1656 kcals in Andhra Pradesh as against RDA of 1970 kcals. The extent of deficit was much higher in case of micronutrients such as vitamin A, riboflavin and iron (Table 6.5). 13-15 year Boys In general, the median intake of all the nutrients was less than the RDA in all the States, except for thiamin in the States of Maharashtra, West Bengal and Gujarat and

Diet & Nutritional status, HTN, DM and IDANNMB Rural Survey 2005-06
65
37
30
67
17
37
50
58
88
59
31
59
43
67
14
36
40
85
67
55
0 100
Free Folic Acid
Vitamin C
Niacin
Riboflavin
Thiamin
Vitamin A
Iron
Calcium
Energy
Protein
Per cent RDA
1-3 Yrs
4-6 Yrs
38
85
91
90
55
83
96
50
108
22
50
99
70
89
18
122
45
112
47
72
0 100
Free Folic Acid
Vitamin C
Niacin
Riboflavin
Thiamin
Vitamin A
Iron
Calcium
Energy
Protein
Per cent RDA
MalesFemales
44
84
74
79
19
92
43
87
50
70
0 100
Free Folic Acid
Vitamin C
Niacin
Riboflavin
Thiamin
Vitamin A
Iron
Calcium
Energy
Protein
Per cent RDA
Fig. 3 Median Intake of Nutrients as % of RDA
1-6 Year Children Adults (Sedentary)
Households (CU/day)
20

NNMB Rural Survey 2005-06 21 Diet & Nutritional status, HTN, DM and IDA
niacin and vitamin C in West Bengal and Orissa. The median intakes of energy were least in Gujarat (1290 kcals) and maximum in Andhra Pradesh (1996 kcals) against RDA of 2450 kcals (Table 6.6). 13-15 year Girls The median intakes of all the nutrients except thiamin, were less than the RDA in all the States. The median intakes of energy were least in Gujarat (1307kcal) and maximum in Andhra Pradesh (1780kcal) as against RDA of 2060kcal. The intakes of vitamin A, riboflavin and iron were also grossly inadequate (Table 6.7). 16-17 year Boys In general, the median intakes of all the nutrients were less than the RDA. The intake of thiamin was above RDA in Maharashtra, Gujarat and West Bengal and was equivalent to RDA in Karnataka and Orissa. The intake of niacin and vitamin C was above RDA in Orissa and West Bengal. The intake of micronutrients such as vitamin A, riboflavin and iron were however, grossly inadequate (Table 6.8). 16-17 year Girls The median intake of energy was lower than the RDA of 2060 kcals in all the States. The median intakes of energy were least in Gujarat (1525kcal) and maximum in West Bengal (1872kcal). The intake of micronutrients such as iron, vitamin A, and riboflavin were not even meeting the 50% of the recommended levels (Table 6.9). Adult Men Barring Calcium, thiamin and niacin, the median intakes of all other nutrients among sedentary adult men were lower than RDA. The median intake of energy ranged from a low 1721 kcals in Maharashtra to a maximum of 2188 kcals in West Bengal, as against RDA of 2425 Kcal (Table 6.10 & Fig.3). In case of adult males engaged in moderate work, the median intake of energy (2118 kcals) was much below the RDA of 2875 kcals, which ranged from a low 1841kcals in Maharashtra to a high 2529 kcals in West Bengal. The intakes of vitamin A and riboflavin were grossly inadequate in all the states (Table 6.11). Adult Females Among adult females engaged in sedentary work, the median intakes of all the nutrients barring thiamin and niacin were below the recommended levels. The energy intake ranged from 1425 kcals in Maharashtra to 1910 kcals in Andhra Pradesh against RDA of 1875 kcal. Barring Gujarat, the median intake of protein was lower than the recommended level in all the States The intakes of iron, vitamin A, riboflavin and free folic acid were grossly deficient (Table 6.12 & Fig.3). In case of those engaged in moderate work, the median intakes of all the nutrients barring thiamin were below the recommended levels. The energy intake was least in Kerala (1547 kcal) and maximum in Andhra Pradesh (2096 kcals) as against RDA of 2225 kcal. The median protein intake was low in Kerala (38g), Tamil Nadu (38g) and Orissa

NNMB Rural Survey 2005-06 22 Diet & Nutritional status, HTN, DM and IDA
(42g), while it was comparable with RDA (50g) in other states. The intakes of iron, vitamin A, riboflavin and free folic acid were grossly deficient, as compared to RDA (Table 6.13). Among pregnant women, the median intake of energy was lower than the RDA in all the States, and was comparable with the intakes observed among NPNL women in the states of Tamil Nadu, Andhra Pradesh, Maharashtra, Gujarat and Madhya Pradesh. The intake of micronutrients such as free folic acid, vitamin A, iron, and riboflavin was grossly inadequate (Table 6.14). The median intakes of energy (1852kcals) and protein (47g) among lactating women were much below the recommended levels of 2425 kcals and 75g respectively. The intakes of micronutrients such as iron, calcium, vitamin A, riboflavin, free folic acid and vitamin C were much below the recommended levels (Table 6.15).
4.3.3 Protein calorie adequacy status 4.3.3.1 Households The distribution of HHs according to protein calorie energy adequacy status is presented in Table 7. About 30% of HHs consumed adequate amounts of both protein and calorie, while 26% of HHs consumed inadequate amounts of the same. The proportion of HHs consuming adequate amounts of protein and energy ranged from a low 15% in Gujarat to 52% in Andhra Pradesh. The proportion of HHs consuming inadequate amounts of both protein and calorie ranged from a low 17.6% in West Bengal to 39% in Tamil Nadu. About 69% of the HHs in general were consuming inadequate amounts of dietary energy, and the proportion ranged from a least 47% in Andhra Pradesh to a maximum of 85% in Gujarat. Similarly, about 27% of the HHs in general were consuming inadequate amounts of proteins, the proportion of which ranged from a least 18% in Gujarat & West Bengal to a maximum of 40% in Tamil Nadu. 4.3.3.2 Individuals The distribution of individuals according to protein calorie energy adequacy status is presented in Table 8.1 - 8.13. 1-3 year children Only about a third (30.1%) of 1-3 year children were consuming adequate amounts of both protein and energy, while about a fifth (22.5%) were consuming diets deficient in both the nutrients. About 47% of the children were consuming adequate amounts of protein, but inadequate amounts of calories. Thus, it was observed that the diets were predominantly deficient in calories than protein Table 8.1. The proportion of children consuming adequate amounts of both protein and energy ranged fro a low 19% in Kerala to a maximum of 52% in Andhra Pradesh. 4-6 Year children
About a fourth of children (24%) were consuming adequate amounts of both protein and calories, the proportion of which ranged from a low of about 11-12% in Gujarat and

NNMB Rural Survey 2005-06 23 Diet & Nutritional status, HTN, DM and IDA
Tamil Nadu to a high of 42% in Andhra Pradesh. About 65% of the children were consuming adequate amounts of protein, but inadequate amounts of calories. In general, 75% of children consuming inadequate amounts of calorie, the proportion of which ranged from a low 58% in Andhra Pradesh to a high of about 89% in Gujarat and Tamil Nadu Table 8.2. 7-9 Year children Only a fourth of the children (24%) were consuming adequate amounts of protein and calorie, the proportion of which ranged from a low 12% in Tamil Nadu to a high 43% in Andhra Pradesh. About 68% of the children were consuming adequate amounts of protein, but inadequate amounts of energy. The proportion of children, who are consuming inadequate amounts of protein, was only about 8%, while that of calorie inadequacy was about 76% (Table 8.3). 10-12 Year Boys and Girls About 22% of boys and 29% of girls were consuming adequate amounts of both protein and calories, while 9% boys and 11% girls were consuming inadequate amounts of both protein and calories (Tables 8.4 & 8.5.). In general, about 78% of boys and girls each were consuming inadequate amounts of energy, while about 10% were consuming inadequate amounts of protein. 13-15 Years Boys and Girls About 29% of boys and 38% girls were consuming adequate amounts of both protein and calories, while about 13% of boys and 6% girls were consuming inadequate amounts of both the nutrients (Tables 8.6 & 8.7). About 71% of the boys and 62% girls were consuming inadequate amounts of energy, while about 13% of boys and 6% of girls were consuming inadequate amounts of proteins. 16-17 Year Boys and Girls About 45% of boys and 61% of girls were consuming adequate amounts of protein and energy, while 28% of boys and 22% of girls were consuming inadequate amounts of both the nutrients (Table 8.8 & 8.9). About 51% of the boys and 35% girls were consuming inadequate amounts of energy, while about 31% of boys and 25% of girls were consuming inadequate amounts of proteins. Adult Men About two thirds of sedentary adult men (68%) were consuming adequate amounts of both protein and calories, while about 9% were consuming inadequate amounts of both the nutrients. The proportion of men consuming adequate amounts of both protein and calories was high in the State of Orissa (79%) and least in Maharashtra (51%) (Table 8.10).

NNMB Rural Survey 2005-06 24 Diet & Nutritional status, HTN, DM and IDA
Ault women About 80% of adult NPNL women were consuming adequate amounts of protein and calories, the proportion of which ranged from a low 59% in Maharashtra to a high 93% in Orissa. Only about 7% were consuming inadequate amounts of both the nutrients (Table 8.11). Among the pregnant women, 61% were consuming adequate amounts of both protein and calories, while about 23% were consuming inadequate amounts of both protein and calories. The proportion of pregnant women consuming adequate amounts both protein and calories ranged from a high of about 78% in the States of West Bengal and Orissa to low 39% in Maharashtra Table 8.12. About 60% of lactating women were consuming adequate amounts of protein and calories, while 18% were consuming inadequate amounts of both the nutrients. Only 15% of lactating women were consuming adequate amounts of protein, but inadequate amounts of energy. The proportion of lactating women consuming adequate amounts of both protein and calories was maximum in the State of Andhra Pradesh (74%) and least in Kerala and Maharashtra (about 50%) Table 8.13. 4.4 Nutritional Status 4.4.1 Clinical Examination Infants A total of 978 infants were examined for the presence of various nutritional deficiency signs. The prevalence of clinical cases of protein energy malnutrition such as kwashiorkor and marasmus were absent in all the States surveyed, except Tamil Nadu, where the prevalence of marasmus was reported to be 0.5% (Table 9.1-9.3). Preschool Children
About 4,859 preschool children were examined in 9 States during the present survey, of which about 6% exhibited one or more clinical signs of nutritional deficiencies. The prevalence of conjunctival xerosis and Bitot spots, the signs of vitamin A deficiency was reported in 0.9% and 0.6% of pre-school children respectively, with highest (1.3%) proportion of children having Bitot spots in the State of Maharashtra. The prevalence of Bitot spots, the objective sign of vitamin A deficiency was more than the WHO cut-off level (0.5%) in the States of Maharashtra, Tamil Nadu, Karnataka, Madhya Pradesh and Orissa. The prevalence of angular stomatitis, a sign of B-complex deficiency was observed in 0.8% of the preschool children, while the prevalence of dental caries was about 2.3% (Table 9.4 - 9.6). School Age Children
A total of 7697 school age children were examined for the presence of various nutritional deficiency signs. The prevalence of conjunctival xerosis and Bitot spots was observed among 1.9% and 1.6% of the children respectively. About 1.9% of children had angular stomatitis, 13% had dental caries, 2.3% had dental fluorosis and 1.4% had goitre (Table 9.7-9.9).

NNMB Rural Survey 2005-06 25 Diet & Nutritional status, HTN, DM and IDA
Adolescents About 5530 adolescents were examined clinically for the presence of various
nutritional deficiency signs. About 1.3% of adolescents had Bitot spots, with highest prevalence being in Tamil Nadu (6.2%). About 6.4% of adolescents had dental caries and 1.2% had angular stomatitis. The prevalence of total goiter was about 3.3% with the highest prevalence (13.7%) in the State of West Bengal fallowed by Kerala (5.5%) Maharashtra (4.3%) and Karnataka (3.3%) (Table 9.10 - 9.12). Adults
Of the 14,039 men and 18,603 women examined, 0.4% of men and 0.3% women had Bitot spots, with a relatively higher prevalence in the State of Tamil Nadu. About 1.5% men and 1.3% women had glossitis, while 0.5% men and 0.8% women had angular stomatitis. About 7% of men and 12% of women had dental caries. About 0.5% each had Dental fluorosis. About 2.3% women had goitre, while its prevalence was negligible among men (Tables 9.13 - 9.15). 4.4.2 Anthropometry 4.4.2.1 Under 5 year children Gomez Classification
The distribution of 1-5 year children according to Gomez classification is presented in Tables 10.1 & 10.2 and Fig.4). The overall proportion of children with moderate to severe undernutrition, who are considered as ‘at risk’ group from public health point of view, was observed to be 43% and ranged from a low 22% in Kerala to a high 54% in Madhya Pradesh.
The prevalence of severe undernutrition was maximum in the State of Gujarat (9.2%), followed by Madhya Pradesh (8.7%) and Orissa (5.3%), with lowest prevalence of 1% in Kerala. The prevalence of undernutrition (<75% of weight for age) was marginally higher in the age group 3-5 years (42.8%) compared to 1-3 year age group (41.6%). No significant sex differentials were observed in the prevalence of undernutrition. IAP Classification The distribution of 6-59 months children according to weight for age by IAP classification using Harvard standards is presented in Table 11. The overall prevalence of grade III & IV undernutrition among 6-60 months children was about 4%. It ranged from a low 1.3% in the State of Kerala, through 2-3% in Andhra Pradesh, Tamil Nadu, Maharashtra and West Bengal to a high 8% in Gujarat. The prevalence of undernutrition tended to increase steeply from 40% in 6-12 months age group to 59% in 12-24 months age group. It remained same up to 48 months and then increased to 61% in 48-60 months age group.
SD Classification The distribution of <5 year children according to weight for age, height for age, and weight for height by SD classification using NCHS standards, is presented in Tables 12.1-15.2 & Fig.4.

Diet & Nutritional status, HTN, DM and IDANNMB Rural Survey 2005-06
13.3 12.8
43.9 44.5
38.2 38.2
4.6 4.5
0
10
20
30
40
50
Normal Mild Moderate Severe
Boys
Girls
14.811.3
43.6 44.9
36.340.1
5.33.7
0
20
40
60
Normal Mild Moderate Severe
1-3 Years
3-5 Years
51.554.9
15.0
0
20
40
60
Stunting Underweight Wasting
Fig. 4 Distribution (%) of 1-5 Year Children According to Nutritional Grades
(Height for Age) (Weight for Age) (Weight for Height)
Gomez classification
(<Median –2SD)
Per
cen
t
Per
cen
t
Per
cen
t
By GenderBy Age Group
SD classification
26

NNMB Rural Survey 2005-06 27 Diet & Nutritional status, HTN, DM and IDA
Weight for Age The prevalence of overall underweight among infants (<1 yr old) was about 22%. The prevalence of underweight among 1-5 yr old children (Weight for age < Median –2SD) was observed to be 55%, while that of severe underweight (Weight for age < Median –3SD) was 18%. The prevalence of underweight ranged from a low 35% in Kerala, followed by 49.2% in Tamil Nadu, to a high 60-64% in the States of Orissa and Madhya Pradesh. Though the overall prevalence of underweight was comparable between age groups (about 55%), the prevalence of severe underweight was found to be relatively higher in 1-3 years (20.2%) compared to 3-5 years (14.9%). The prevalence of underweight was observed to be essentially similar between genders (boys: 54.8%; girls: 55.1%). Height for Age
The prevalence of overall stunting among infants was 19%. The prevalence of stunting among 1-5 yr old children (Height for age <Median –2SD) was observed to be 51%, while that of severe stunting (Height for age <Median –3SD) was 25%. The prevalence of stunting ranged from a low 33% in Kerala, to a high 73% in Madhya Pradesh. The overall prevalence of stunting was comparable between age groups (about 51%). However, the prevalence of severe stunting was found to be marginally higher in 1-3 year age group (26.5%) compared to 3-5 years (23.5%). The prevalence of stunting was observed to be marginally higher among girls (53%) compared to boys (50 %). Weight for Height
The prevalence of overall wasting among infants was about 13%. The prevalence of wasting among 1-5 yr old children (Weight for Height <Median –2SD) was observed to be 15%, while that of severe wasting (Weight for Height <Median –3SD) was 2.4%. The prevalence of wasting ranged from a low 11% in Kerala, to a high 24% in Gujarat. The overall prevalence of wasting was comparable between age groups, and gender (about 15%). SD Classification using WHO Child Growth standards The distribution of 0-60 months children according to weight for age, height for age, weight for height and BMI by SD classification using WHO (MGRS) standards, is presented in Tables 16. Weight for Age The overall prevalence of underweight (Weight for age < Median –2SD) was observed to be 40%, while that of severe underweight (Weight for age < Median –3SD) was 14%. The prevalence of underweight was relatively lower in < 6 months children compared to the children �6 months of age. It ranged from a low of 26.5% in the <6 months age group to a high of 53% in the 54-60 months age group. The prevalence of severe underweight was relatively higher among children aged 18 -24 month, 30-36 month and 54-60 month compared to other age groups.
NNMB Rural Survey 2005-06 28 Diet & Nutritional status, HTN, DM and IDA
Height for Age The overall prevalence of stunting (Height for age <Median –2SD) was observed to
be 45%, while that of severe stunting (Height for age <Median –3SD) was 20%. The prevalence of stunting was relatively lower in < 12 months children compared to the older age groups. The prevalence ranged from a low of 17% among <6 months children to a high of 56% among children in the age group of 18-24 months. The prevalence of severe stunting was also highest in the 18-24 month age group (29%) and lowest in the <6 months age group (6%).
Weight for Height The overall prevalence of wasting (Weight for Height <Median –2SD) was observed
to be 20%, while that of severe wasting (Weight for Height <Median –3SD) was 7%. The prevalence of wasting was observed to be relatively higher among <6 months children compared to older children. It ranged from a low of 17% in the 24-30 month age group to a high of 29% in the <6 months age group. The prevalence of severe wasting was also observed to be higher among younger children (<18 months age group) compared to the older age groups (18-60 months)
BMI The prevalence of overall undernutrition (BMI<Median –2SD) was observed to be
16%, while that of severe undernutrition (BMI<Median –3SD) was about 6%. A higher proportion of <6 months children had BMI<Median –2SD, compared to older children, which ranged from a low of 12% in the 42-48 month age group to a high of 31% in the <6 months age group. The overall prevalence of overweight/obesity (BMI > Median+2SD) was 2.5% and ranged from 2 to 3% in different age groups.
4.4.3 School age children and adolescents Weight for Age The overall prevalence of underweight (Weight for Age < Median –2SD) was marginally higher (41.3%) among 6-9 year age group, compared to 10-13 (38.5%) and 14-17 year (37.8%) age groups (Tables 17.1 & 17.2). In 6-9 year age group, the prevalence of underweight was higher among boys (46.7%) compared to girls (35.3%). Similar observation was made with respect to 14 -17 year age group (Boys: 45% Vs Girls: 32%). In 10–13 year age group, the prevalence was relatively higher among girls (45%) compared to 42% among boys. The prevalence of severe underweight was about 3-6% in different age groups.
Height for Age The overall prevalence of stunting (Height for Age < Median –2SD) tended to
increase with age 30.1% in 6-9 year age group, through 34.2% in 10-13 years to 36.8% in 14-17 year age group. About 8-9% of children in various age groups had severe stunting. In 6-9 year age group, the prevalence of stunting was relatively higher among boys (33%) compared to girls (28%). In 10–13 year age group, the prevalence was relatively higher among girls (35%) compared to 33% among boys. Among 14 -17 year age group 38% boys and 36% girls were stunted. The prevalence of stunting (Height for Age < Median –2SD) was higher among the age group of 14-17 years (36.8%) as compared to the age groups of 6-9 years (30.1%) and 10-13 years (34.2%). However, no significant gender differentials were observed among all the age groups (Tables 18.1 & 18.2).

NNMB Rural Survey 2005-06 29 Diet & Nutritional status, HTN, DM and IDA
Body Mass Index (BMI) The distribution of 10-13 and 14-17 year children according to nutritional status based on BMI compared with age/sex specific BMI centiles of NHANES is presented in Tables 19.1 & 19.2. The overall prevalence of underweight was about 57% among 10-13 year age group, which tended to decrease with age to 30% in 14-17 year age group.
The prevalence in the 10-13 years age group ranged from a low 48% in the State of Kerala to a high 69% in Maharashtra. Among 14-17 year children the prevalence ranged from a low 17% in Madhya Pradesh to a high 43% in Maharashtra. The prevalence was much higher among boys compared to girls in both 10-13 year (65% Vs 49%) and 14-17 year (45% Vs 18%) age groups. 4.4.4 Adults The distribution of adult men and women according to nutritional status based on BMI is given in Tables 20 & 21 and Figs. 5.1 and 5.2. The overall prevalence of Chronic Energy Deficiency (CED: BMI <18.5) was about 33% among men and 36% among women. The prevalence of CED among men was observed to be maximum in the State of Karnataka (42.4%) and lowest in Kerala (27.7%). Similarly, the prevalence of CED among women was maximum in the State of Orissa (47.6%) and least in Kerala (21.1%). The prevalence of overweight / obesity (≥ 25 BMI) was significantly higher among the women (10.9%) compared to men (7.8%). The prevalence was maximum in the State of Kerala (men: 14.5%; women: 24%) and least in Madhya Pradesh (men: 2.8%; women: 4.7%) and Orissa (men: 4.2%; women: 4.6%). WHO consultative group (2004) suggested that among Asian population, individuals with a BMI of ≥ 23 is a risk factor for coronary artery diseases. According to this, a higher proportion of men (17.2%) and women (19.9%) were found to be having overweight/obesity. 4.4.5 Nutritional status Vs Demographic & Socio-economic Variables 4.4.5.1 Preschool Children The results of the study of association between nutritional status of preschool children according to weight for age, height for age and weight for height by SD classification and household demographic and Socio-economic variables is presented in Table 22 and Fig. 6.
The prevalence of underweight among preschool children was found to be significantly associated with religion, community, type of house, monthly per capita income of household, major occupation of head of the household, parental literacy, electrification of house, source of drinking water, presence of sanitary latrine and type of cooking fuel used and prevalence of morbidity during previous fortnight.
Similarly, the prevalence of stunting was found to be significantly associated with community, type of house, monthly per capita income of household, major occupation of head of the household, parental literacy, electrification of house, source of drinking water, presence of sanitary latrine and type of cooking fuel used, and prevalence of morbidity during previous fortnight.
The prevalence of wasting was found to be significantly associated with religion, type of family, major occupation of head of the household, parental literacy and prevalence of morbidity during previous fortnight.
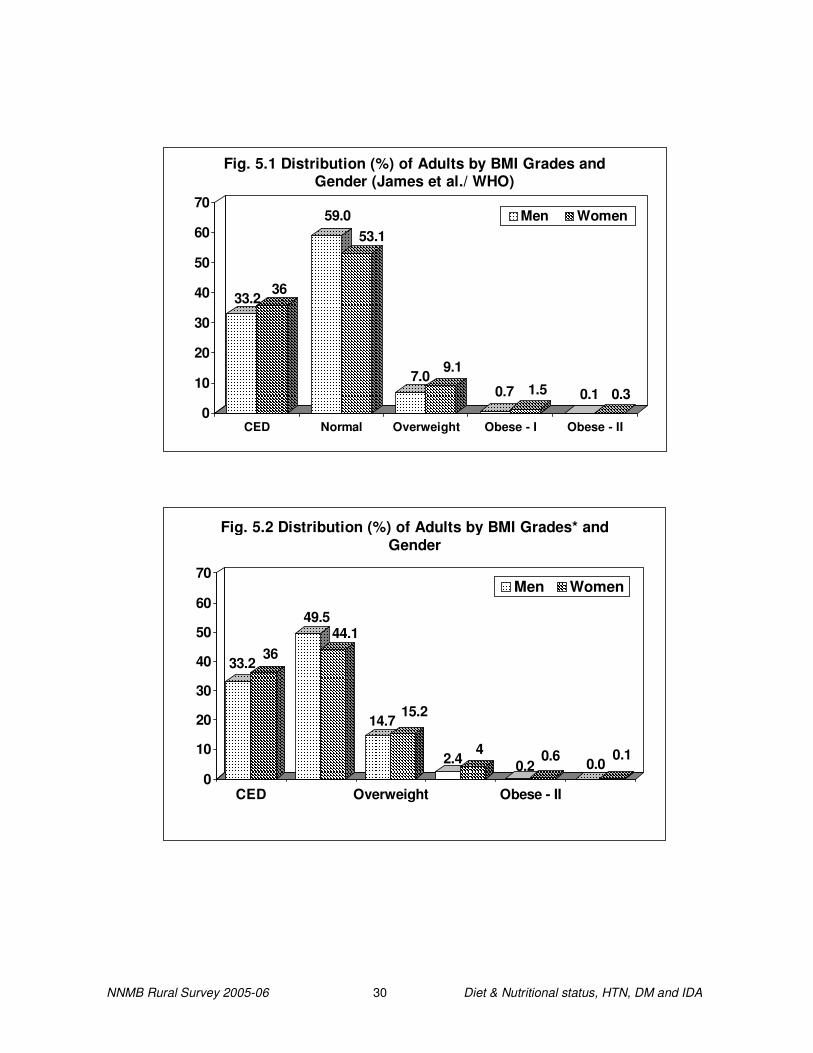
NNMB Rural Survey 2005-06 30 Diet & Nutritional status, HTN, DM and IDA
33.236
49.544.1
14.715.2
2.44
0.20.6 0.0
0.1
0
10
20
30
40
50
60
70
CED Overweight Obese - II
Fig. 5.2 Distribution (%) of Adults by BMI Grades* and Gender
Men Women
33.236
59.053.1
7.09.1
0.7 1.5 0.1 0.30
10
20
30
40
50
60
70
CED Normal Overweight Obese - I Obese - II
Fig. 5.1 Distribution (%) of Adults by BMI Grades and Gender (James et al./ WHO)
Men Women
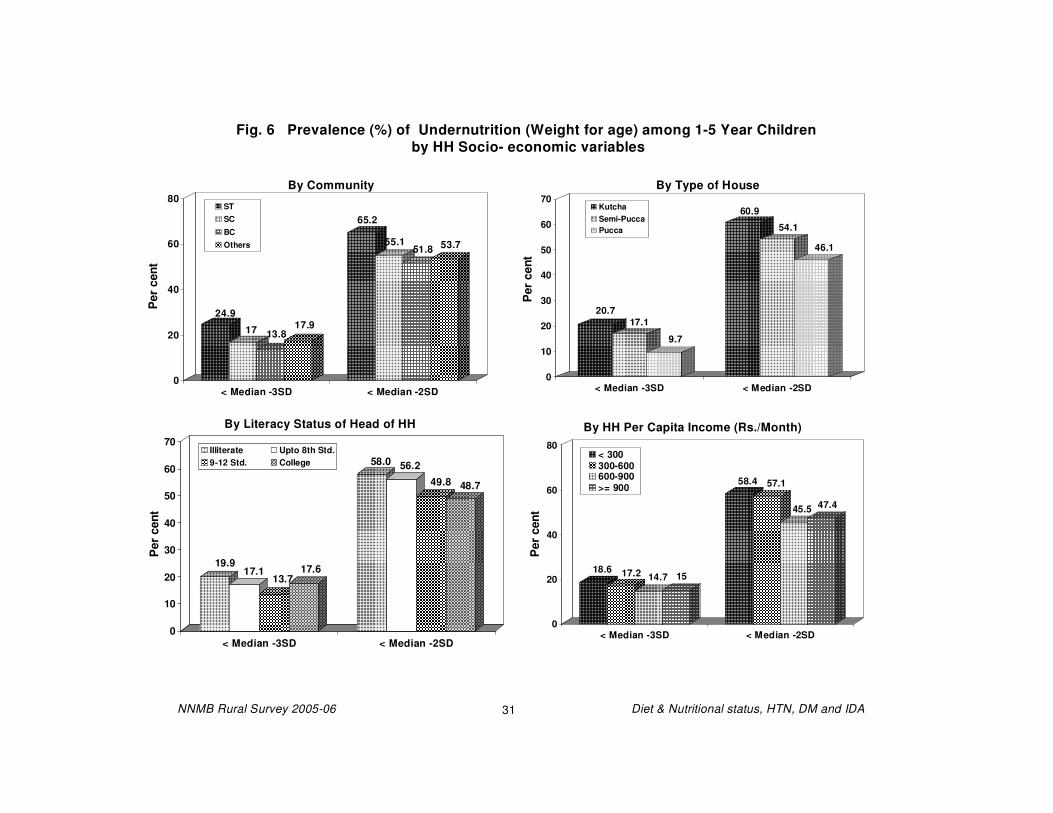
NNMB Rural Survey 2005-06 31 Diet & Nutritional status, HTN, DM and IDA Diet & Nutritional status, HTN, DM and IDANNMB Rural Survey 2005-06
24.9
17 13.817.9
65.2
55.151.8 53.7
0
20
40
60
80
< Median -3SD < Median -2SD
STSC
BCOthers
20.717.1
9.7
60.9
54.1
46.1
0
10
20
30
40
50
60
70
< Median -3SD < Median -2SD
KutchaSemi-PuccaPucca
18.6 17.2 14.7 15
58.4 57.1
45.5 47.4
0
20
40
60
80
< Median -3SD < Median -2SD
< 300300-600600-900>= 900
Fig. 6 Prevalence (%) of Undernutrition (Weight for age) among 1-5 Year Childrenby HH Socio- economic variables
By Community By Type of House
By HH Per Capita Income (Rs./Month)
19.917.1
13.717.6
58.0 56.2
49.8 48.7
0
10
20
30
40
50
60
70
< Median -3SD < Median -2SD
Illiterate Upto 8th Std.9-12 Std. College
By Literacy Status of Head of HH
Per
cen
tP
er c
ent
Per
cen
tP
er c
ent
31

NNMB Rural Survey 2005-06 32 Diet & Nutritional status, HTN, DM and IDA
4.4.5.2 Adults The results of the study of association between nutritional status of adults
according to nutritional status by BMI classification and household demographic and Socio-economic variables are presented in Table 23.
The distribution of adults by BMI was found to be significantly associated with religion, community, type of house, type of family, monthly per capita income of household, major occupation of head of the household, literacy status, size of land holding, family size, electrification of house, source of drinking water, presence of sanitary latrine and type of cooking fuel used and prevalence of morbidity during previous fortnight.
4.4.6 Diet and nutritional status comparison with earlier data The diet and nutritional status of the populations observed in the current study for
the States pooled is compared with that reported in NNMB surveys carried out during the year 200-01.
The daily average per CU intake of foodstuffs (as % recommended intakes) and median intake of nutrients (as % RDA) at two time periods is provided in the Figs.7 & 8. A marginal decline in the average daily intake of cereals & millets, green leafy vegetables, roots and tubers and sugar & jaggery was observed over period of five years (Fig. 7). An increase of about 10% of RDI was observed with respect to consumption of milk & milk Products and fats & oils, while the intake of pulses and legumes and other vegetables remained similar. The median intake of protein, energy, thiamine, riboflavin and niacin decreased marginally, over the period (Fig. 8). There was a marginal increase in the intake of micronutrients such as vitamin A, vitamin C and calcium while that of iron remained similar over the period.
The nutritional status of preschool children in a different time periods is provided in the Fig.9. There was a decrease in the overall prevalence of underweight (60% Vs 55%) and wasting (23% Vs 15%) over the period, while that of stunting increased marginally (49% Vs 52%). A decrease in the prevalence of chronic energy deficiency was observed among both men (37% Vs 33%) and women (39% Vs. 36%) (Fig.10.1 & 10.2). Concurrently, an increase in the prevalence of overweight/obesity was observed among men (6% Vs 8%) and women (8% Vs 11%).
4.5 Prevalence of Anaemia A total of 3,397 adult men and 3,329 NPNL women were covered for estimation of Haemoglobin. The mean Haemoglobin level was 12.6 g/dL among men and 10.7g/dL among women (Tables 24-25). The mean Haemoglobin levels among adult men tended to decrease with age from 12.9 g/dl in 20-30 year group to 11.1 g/dL in the age group of � 80 years, while it remained similar in females (Tables 26-27). The mean Haemoglobin levels among men ranged from a low 11.1 g/dL in West Bengal to a high of about 13.5 g /dL in Tamil Nadu and Andhra Pradesh. Among females it ranged from a very low 9.1 g/dL in Gujarat to a maximum of about 12g/dL in Tamil Nadu and Karnataka.

NNMB Rural Survey 2005-06 33 Diet & Nutritional status, HTN, DM and IDA
Fig.7 Average (% of RDI) Intake of Foodstuffs (g/CU/day) by Period of Survey
Fig.8 Average (% of RDA) Intake of Nutrients (g/CU/day) by Period of Survey
Percent of RDA
Percent of RDI
47
70
55
120
82
40
70
86
50
60
45
128
80
43
68
91
0 20 40 60 80 100 120 140
Sugar & Jagg.
Fats & Oils
Milk & Milk Prod
Roots & Tubers
Other Veg.
G L V
Pulses
Cereals & Millets 2000-012005-06
44
110
43
110
76
50
81
85
92
100
43
82
43
105
95
108
36
107
0 20 40 60 80 100 120
Iron
Vitamin C
Niacin
Riboflavin
Thiamin
Vitamin A
Calcium
Energy
Protein 2000-012005-06

NNMB Rural Survey 2005-06 34 Diet & Nutritional status, HTN, DM and IDA
60
21
55
18
0
10
20
30
40
50
60
70
Wt. for age <Median-2SD Wt. for age <Median-3SD
2000-01
2005-06
26
52
25
49
0
10
20
30
40
50
60
Ht. for age <Median-2SD Ht. for age <Median-3SD
2000-01
2005-06
23
3
15
2
0
5
10
15
20
25
Wt. for Ht.<Median-2SD Wt. for Ht. <Median-3SD
2000-01
2005-06
UNDERWEIGHT STUNTING
WASTING
Fig.9 Prevalence (%) of Undernutrition among 1-5 Year children according to SD Classification by Period of Survey

NNMB Rural Survey 2005-06 35 Diet & Nutritional status, HTN, DM and IDA
36
11
39
53
8
53
0
10
20
30
40
50
60
CED Normal Overweight / Obesity
2000-01
2005-06
37
6
59
8
57
33
0
10
20
30
40
50
60
70
CED Normal Overweight / Obesity
2000-01
2005-06
Fig. 10.1 Distribution (%) of Adult Males by BMI* Grades and Period of Survey
Fig. 10.2 Distribution (%) of Adult Females by BMI* Grades and Period of Survey
(BMI < 18.5) (BMI < 18.5-25) (BMI ≥25)
(BMI < 18.5) (BMI < 18.5-25) (BMI ≥25)

NNMB Rural Survey 2005-06 36 Diet & Nutritional status, HTN, DM and IDA
The overall prevalence of anaemia among adult men was about 55%, with 8% having moderate and 0.6% severe anaemia. Highest prevalence of anaemia was observed among the elderly (≥80 years) population (89%) compared to younger age (20-30 years) groups (48%). The prevalence of anaemia was maximum in West Bengal (84%), followed by Madhya Pradesh (68%), Kerala (68%), Gujarat (65%) and lowest observed in the States of Tamil Nadu (29%), Andhra Pradesh (35%) and Karnataka (44%) (Fig. 11).
The overall prevalence of anaemia among women was about 75%, with about 31% having moderate and 3% severe anaemia. The prevalence of anaemia among NPNL women was maximum in the State of Gujarat (95%), followed by West Bengal (91.5%), Kerala (89%) and Madhya Pradesh (87.4%), while it was least in the State of Tamil Nadu (49%) (Fig. 11).
4.5.1 Prevalence of anaemia Vs Socio-economic and demographic variables The results of study of association between prevalence of anaemia among adult men and NPNL women and demographic and socioeconomic variables are presented in the Table 28 & Fig. 12.
The prevalence of anaemia among adult men was found to be significantly associated with religion, community, type of house, major occupation of head of the household, literacy status, electrification of house, source of drinking water, and type of cooking fuel used. Similarly, the prevalence of anaemia among adult NPNL women was found to be significantly associated with religion, community, major occupation of head of the household, monthly per capita income of household, literacy status, electrification of house, and source of drinking water.
4.6 Prevalence of Morbidity The prevalence of morbidities such as fever, diarrhoea, dysentery and acute respiratory infections (ARI) during the preceding 15 days, according to physiological groups, age and gender are provided in Tables 29.1 - 29.3. About 8% of the infants reportedly suffered from fever, 4% had followed by acute Respiratory Infection (ARI) and 2.5% had diarrhoea. The prevalence of the morbidities was marginally higher among the boys compared to girls.
Among preschool children, about 10% reportedly had fever, 5.1% had ARI, 2.1% had diarrhoea and 0.4% had dysentery. No gender differentials were observed in the prevalence of these morbidities.
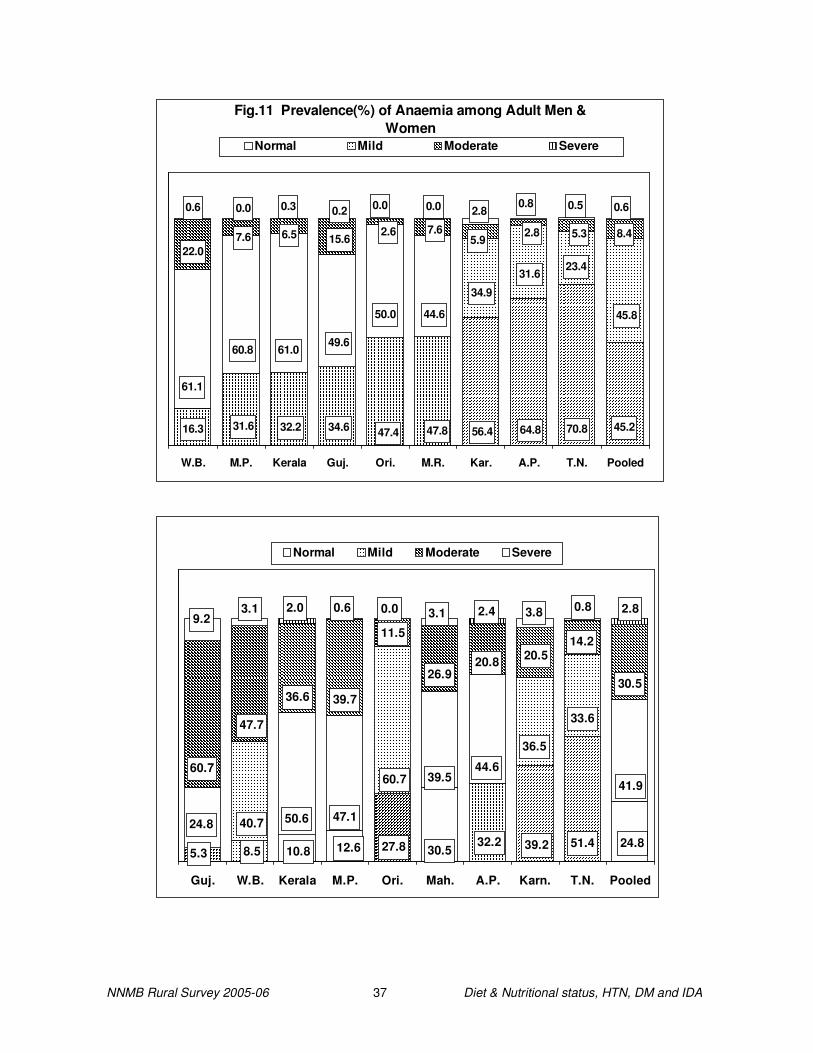
NNMB Rural Survey 2005-06 37 Diet & Nutritional status, HTN, DM and IDA
Fig.11 Prevalence(%) of Anaemia among Adult Men & Women
45.264.834.632.231.616.3 47.4 47.8 56.4 70.8
45.8
49.661.060.8
61.1
50.0 44.6
34.9
31.623.4
8.415.66.57.622.0
2.6 7.65.9
2.8 5.3
0.60.20.30.00.6 0.0 2.80.8 0.50.0
W.B. M.P. Kerala Guj. Ori. M.R. Kar. A.P. T.N. Pooled
Normal Mild Moderate Severe
24.832.230.512.610.88.55.3 27.8 39.2 51.4
41.9
47.150.640.724.8
60.7 39.544.6
36.5
33.6
30.539.736.6
47.7
60.7
11.5
26.920.8 20.5
14.2
2.80.62.03.19.2
0.0 2.4 3.8 0.83.1
Guj. W.B. Kerala M.P. Ori. Mah. A.P. Karn. T.N. Pooled
Normal Mild Moderate Severe

Diet & Nutritional status, HTN, DM and IDANNMB Rural Survey 2005-06
60.253.4
51.0
58.5
78.6 74.7 72.777.2
0
20
40
60
80
100
Men Women
ST SC BC Others
56.2 56.1
47.7
77.1 75.3 71.9
0
20
40
60
80
100
Men Women
Kutcha Semi-Pucca Pucca
5855 54
44.449.3
6257
7872
75
71.3
76.781
75
0
20
40
60
80
100
Men Women
Agri. Labours Other Labours Cultivators ArtisansService Business Others
54.1 56.4
75.1 75.3
0
20
40
60
80
100
Men Women
Illiterate Literate
Fig. 12 Prevalence (%) of Anaemia among Adults by HH Socio-economic Variables
By Community By Type of House
By Literacy Status of Head of HH
Per
cen
t
(<13 g/dL) (<12 g/dL)
Per
cen
tP
er c
ent
Per
cen
t
(<13 g/dL) (<12 g/dL)
(<13 g/dL) (<12 g/dL)(<13 g/dL) (<12 g/dL)
By Major Occupation of Head of HH
38

NNMB Rural Survey 2005-06 39 Diet & Nutritional status, HTN, DM and IDA
Among the school age children, about 7% reportedly had fever, 2.8% had ARI, 0.8% had diarrhoea and 0.1% had dysentery. The prevalence was observed to be similar among boys and girls. About 4% of the adolescents had fever and 1.5% had acute respiratory infection, while less than 1% had diarrhoea or dysentery. No gender differences were observed in the incidence of morbidities. The morbidities reported among adult males and females were fever (5%), respiratory infection (1.4%), diarrhoea (0.5%) and dysentery (0.1%).
4.7 Diet Related Chronic Diseases A total of 25,242 adults of ≥ 20 years were covered for the anthropometry viz.,
measurement of height, weight, waist and hip circumference.
4.7.1 Mean Anthropometric Measurements
The mean age of the men covered for the various investigations was 41.3 years, while that of women was 39.6 years. The mean weight and height of the adult men and women was 54.2 Kg & 163.4 cm and 46.9 Kg and 151.1cm respectively. The mean BMI of men was 20.3 kg/m2 and 20.5 kg/m2 for women. The mean waist and hip circumferences for men and women were 75.1 cm & 82.6 cm and 69.9 cm and 83 cm respectively (Table 30). The mean waist and hip circumferences among men and women tended to increase with age up to 60 years.
4.7.2 Prevalence of Abdominal Obesity According to Waist circumference
The overall prevalence of abdominal obesity (WC �102 Cm) was about 1% among men, and 7% among women (WC � 88Cm).
The prevalence of abdominal obesity among men ranged from a low of 0.4% in
West Bengal to a maximum of 2% in Andhra Pradesh. In case women, the prevalence ranged from a low 0.6% in Madhya Pradesh to a high of 20% in Kerala. The prevalence in case of male tended to increase with age from 0.2% in 20-30 year age group to 2.9% in 70-80 years, and in females from 2.4% in 20-30 years age group to 13.9% in 70-80 years age group (Tables 31, 42 & 43).
4.7.3 Prevalence of Abdominal Obesity According to Waist/Hip Ratio (WHR)
The prevalence of obesity according to WHR was about 25% among men (WHR � 0.95) and 69% among women (WHR � 0.80). The prevalence among men ranged from a low 8.7% in 20-30 year age group to a high of 39.3% in 70-80 years. Similarly, the prevalence in women ranged from a low 60.5% in 20-30 years to a high of 77.6% in 70-80 years. The prevalence among men was observed to be least in the State of Madhya Pradesh (10.1%) and highest in Kerala (40.4%), while in case of women, it was highest in Kerala (91.8%) and least in Maharashtra (36.7%) (Tables 31, 42 & 43).

NNMB Rural Survey 2005-06 40 Diet & Nutritional status, HTN, DM and IDA
4.7.4 Prevalence of Obesity (BMI ≥≥≥≥ 25) Prevalence of overweight and obesity (BMI ≥≥≥≥ 25) was about 8.5% and 12.7% among men and women respectively. The highest prevalence of overweight and obesity was observed among men and women in the State of Kerala and lowest in the States of Orissa and Madhya Pradesh (3-5%) Tables 42 & 43 .
4.7.5 Hypertension Mean blood pressure levels Among men, the mean systolic blood pressure was 126 mm and diastolic 79 mm of Hg. In case of women it was 125 mm and 78 mm of Hg respectively. The mean blood pressure levels tended to increase with age from 20 years in both men and women (Tables 32 & 33).
Prevalence of hypertension (HTN) About 25% men and 24% women had hypertension (≥140 mm of Hg SBP and /or ≥
90 mm of Hg DBP). The prevalence of HTN was maximum in the State of Kerala (men: 50.9%; women: 46.8%) and lowest in Gujarat (men: 14.2%; women: 10.3%) (Tables 34 & 35).
According to JNC-VII criteria, the prevalence of stage II HTN ( SBP ≥ 160 mm Hg
and/or DBP ≥ 100 mm Hg) was about 7% each among men and women (Tables 36 & 37). The prevalence among men and women ranged from a low of about 1% in Gujarat to about 18% in Kerala. The prevalence tended to increase from a low 13.6% in 20-30 years age group to a high 56.4% among ≥ 80 years. In case of women, it ranged from a low 9% in the age group of 20-30 years to high of 66.2% in ≥80 years (Tables 38 & 39). The prevalence of stage II HTN among men tended to increase from a low 1.6 % in 20-30 years to 31.7% in ≥80 years age group (Tables 40 & 41). In case of women, the prevalence tended to increase from a low 1.2 % in 20-30 years to 32.5% in ≥80 years age group.
4.7.6 Prevalence of Diabetes Mellitus (DM) / Impaired Glucose Tolerance (IGT) About 2% each of adult men and women examined in the State of Andhra Pradesh had impaired glucose tolerance (Fasting blood glucose level ≥110 -126mg/dL) while 4% men and 3% women were found to be having diabetes mellitus (Fasting blood glucose level ≥126mg/dL). The prevalence in men tended to increase with age from 20-30 years (DM: 0.4%; IGT: 0.4%) up to 80 years (IGT: 3.8%; DM: 9.4%;). Similar trends were observed in case of women (Table 44 - 45).

NNMB Rural Survey 2005-06 41 Diet & Nutritional status, HTN, DM and IDA
4.7.7 Awareness of Hypertension and Diabetes mellitus and use of Tobacco and Alcohol
Hypertension The particulars of knowledge and practices of adults on hypertension and diabetes
mellitus are provided in Table 46 - 49. Nearly two thirds of men (66.5%) and women (60.5%) were aware of hypertension. About 4% of men and women each were known hypertensives, while 3% men and 2% of women were on treatment. The proportion of known hypertensives was maximum in the age group of ≥ 70 years among men (about12%) and women (17%). The signs and symptoms of hypertension as perceived by the adult men and women were nausea/vomiting (5%), giddiness (40%), and palpitation and headache (15%).
Diabetes About 56% men and 49% women were aware of diabetes mellitus, while about 1-2%
was known diabetics. The proportion of known diabetics increased with age from about 0.1% 20-30 years age group to about 6% in 70-80 years. About 55% men and 18% women were smokers. The proportion of smokers was maximum in the age group of 40-80 years. About 52% of men and 26% of women were smoking ≥10 cigarettes/beedis per day. Among the smokers, 75% men and 80% women were reportedly smoking for more than 10 years. Delayed wound healing (22-26%), frequent urination (7-11%), tiredness (20%), loss of weight (5-9%) and increased thirst and hunger were some of the signs and symptoms of diabetes, as reported by men and women interviewed.
Tobacco use About 2% each of men and women were snuffing tobacco. Of them, about 60-65% of them were using snuff for ≥10 years. About 28% men and 15% women were reportedly chewing tobacco and of these, about 55% in men and 67% women were doing so for ≥10 years. Consumption of Alcoholic Beverages
About 31% men and 2% women reportedly were consuming alcohol respectively. The proportion of men consuming alcohol was maximum in the age group of 30-50 years (37%). About 4% men and 0.1% women were consuming alcohol, every day.
4.7.8 Prevalence of HTN, DM and Obesity Vs Demographic & Socio- economic Variables
Results of study on association between prevalence of hypertension, diabetes mellitus, obesity and use of tobacco and alcohol among adults and household demographic and socio-economic variables are presented in Tables 50 & 51 & Figs. 13-15.

Diet & Nutritional status, HTN, DM and IDANNMB Rural Survey 2005-06
11.3
13.3
19.7
23.1
15.9
21.5
27.326.4
0
5
10
15
20
25
30
>= 23.0 BMI >=0.95 WHR
ST SC BC Others
11.816
25.3 26.6
67.3 67.2
72.9
66.2
0
20
40
60
80
>= 23.0 BMI >=0.80 WHR
ST SC BC Others
14.317.3
29.1
18.5
22.1 22.5
36.1
24.6
0
10
20
30
40
>= 23.0 BMI >=0.95 WHR
Kutcha Semi-Pucca
Pucca Pooled
17.120.8
35.7
22.5
67.8 67.974.9
69.1
0
20
40
60
80
100
>= 23.0 BMI >=0.80 WHR
Kutcha Semi-Pucca
Pucca Pooled
Per
cen
t
Per
cen
t
Per
cen
t
Per
cen
t
Fig. 13 Prevalence (%) of Obesity according to BMI and WHR among Adult Men & Women by HH Socio-economic Variables
By Community – Adult Men By Community – Adult Women
By Type of House – Adult Men By Type of House – Adult Women
42

Diet & Nutritional status, HTN, DM and IDANNMB Rural Survey 2005-06
11.4
18.9
30.1
18.8
24.1
35.0
0
10
20
30
40
50
>= 23.0 BMI >= 0.95 WHR
Agr.+Oth. Lab. cultiv.+Artisan Ser.+Busi+Oths
16.421.4
33.3
67.1 66.8
74.7
0
20
40
60
80
100
>= 23.0 BMI >=0.80 WHR
Agr.+Oth. Lab. cultiv.+Artisan Ser.+Busi+Oths
18.9 18.2 18.6
25.123.7
26.4
0
10
20
30
40
>= 23.0 BMI >=0.95 WHR
<=4 5-7 >=8
23.9 21 24.1
71.167.6 68.4
0
20
40
60
80
>= 23.0 BMI >=0.80 WHR
<=4 5-7 >=8
Fig. 14 Prevalence (%) of Obesity according to BMI and WHR among Adults by HH Socio-economic Variables
Per
cen
t
Per
cen
t
Per
cen
t
Per
cen
tBy Occupation – Adult Men By Occupation – Adult Women
By Family Size – Adult Men By Family Size – Adult Women
43

Diet & Nutritional status, HTN, DM and IDANNMB Rural Survey 2005-06
Fig. 15 Prevalence (%) of Hypertension (WHO) among Adults by HH Socio-economic Variables
23.3 23.425.8 25.8 25
19.6 20.3
25.424.9
23.6
0
10
20
30
40
Men Women
ST SC BCOthers Pooled
22.724.9
28.6
25
22.0 22.9
28.2
23.6
0
10
20
30
40
Men Women
Kutcha Semi-Pucca
Pucca Pooled
17.6
24.5
22.8
28.431.1
32.3
33
25
13.8
24.4
21.5
25.1 26.8
31.7 30.4
23.6
0
10
20
30
40
50
60
Men Women
Agri. Labours Other Labours Cultivators
Artisans Service BusinessOthers Pooled
Per
cen
t
Per
cen
t
Per
cen
t
By Community By Type of House
SBP ≥≥≥≥ 140 and/or DBP ≥≥≥≥ 90
SBP ≥≥≥≥ 140 and/or DBP ≥≥≥≥ 90SBP ≥≥≥≥ 140 and/or DBP ≥≥≥≥ 90
By Major Occupation of Head of HH
44

NNMB Rural Survey 2005-06 45 Diet & Nutritional status, HTN, DM and IDA
The prevalence of hypertension was significantly associated with religion,
community, major occupation of head of the household, per capita monthly income of HH, family size, and type of house and literacy status.
Similarly, the prevalence of IGT and DM in the State of Andhra Pradesh was significantly associated with major occupation of head of the household, per capita monthly income of HH, type of house and literacy status (Fig 16.1 & 16.2).
The prevalence of overweight/Obesity (by BMI as well WHR) was significantly associated with religion, community, major occupation of head of the household, per capita monthly income of HH, type of house, literacy status.
4.7.9 Association between Prevalence of hypertension and Obesity Among the adult men, the prevalence of hypertension was significantly (p<0.001) higher among those having abdominal obesity as indicated by higher Waist Circumference (55% Vs 25%), Waist Hip Ratio (40% Vs 20%) and those who were obese (BMI ≥25) (48% Vs 26%) (Tables 52 - 54).
Among the women, the prevalence of hypertension was significantly (p<0.001) higher among those having abdominal obesity as indicated by higher Waist Circumference (55% Vs 21%), Waist Hip Ratio (28% Vs 15%) and those who were obese (BMI ≥25) (45% Vs 24%) (Tables 55 - 57). The study revealed that the risk of having hypertension was 2 to 4 times higher among these having higher WC, WHR and BMI among both men and women.
4.7.10 Impaired Glucose Tolerance & Diabetes Mellitus Vs abdominal Obesity Among the adult men, the prevalence of Impaired Glucose Tolerance (IGT) & Diabetes Mellitus was significantly (p<0.001) higher among those having abdominal obesity as indicated by higher Waist Circumference (27.7% Vs 5.6%), Waist Hip Ratio (14.6% Vs 3.9% ) and those who were obese (BMI ≥25) (12.3% Vs 5.9%) (Tables 58 - 60).
Among the women, the prevalence of IGT & Diabetes Mellitus was significantly (p<0.001) higher among those having abdominal obesity as indicated by higher Waist Circumference (23.2% Vs 4.2%), Waist Hip Ratio (5.8% Vs 3.8%) and those who were obese (BMI ≥25) (13.5% Vs 4.7%) (Table 61 - 63).
The study revealed that the risk of having IGT & Diabetes Mellitus was 7 times higher among those having higher WC, 2-4 times higher among those having higher WHR and 3-4 times higher among those with BMI ≥25.

NNMB Rural Survey 2005-06 46 Diet & Nutritional status, HTN, DM and IDA Diet & Nutritional status, HTN, DM and IDANNMB Rural Survey 2005-06
2.0
0.3
2.12.5
1.8 2.0
4.3
3.7
5.3
4.2
0
1
2
3
4
5
6
IFG Diabetes
STSCBCOthersPooled
Fig. 16.1 Prevalence (%) of Impaired Fasting Glucose (IFG) and Diabetes among Adults by HH Socio-economic Variables – Andhra Pradesh
0.0
1.5
2.72.9
2.4
0.0
1.3
2.5
4.8
2.8
0
1
2
3
4
5
6
IFG Diabetes
STSCBCOthersPooled
2.3
1.31.9
6.7
3.2
4.6
1.9
2.7
0.8
2.7
1.1
3.8 4.0
5.3
0
1
2
3
4
5
6
7
8
IFG Diabetes
LL Ag.LabourOther LabourCultivatorArtisansServiceBusinessOthers
0.51.1
2.1
1.0
2.93.3
1.52 2.2
4.5
5.2 5.35.0
6.9
0
1
2
3
4
5
6
7
8
IFG Diabetes
Landless Agri. LabourOther LabourCultivatorArtisansServiceBusinessOthers
(FBS ≥≥≥≥ 126 µµµµg/dL)(FBS ≥≥≥≥ 110 - <126 µµµµg/dL) (FBS ≥≥≥≥ 126 µµµµg/dL)(FBS ≥≥≥≥ 110 - <126 µµµµg/dL)
By Community – Adult Men By Community – Adult Women
(FBS ≥≥≥≥ 126 µµµµg/dL)(FBS ≥≥≥≥ 110 - <126 µµµµg/dL) (FBS ≥≥≥≥ 126 µµµµg/dL)(FBS ≥≥≥≥ 110 - <126 µµµµg/dL)
By Major Occupation of Head of HH – Adult Men
By Major Occupation of Head of HH– Adult Women
Per
cen
t
Per
cen
t
Per
cen
t
Per
cen
t
46

Diet & Nutritional status, HTN, DM and IDANNMB Rural Survey 2005-06
1.4
2.1
3.2
5.1
0
1
2
3
4
5
6
IFG Diabetes
IlliterateLiterate
Fig. 16.2 Prevalence (%) of Impaired Fasting Glucose (IFG) and Diabetes among Adults by HH Socio-economic Variables – Andhra Pradesh
Per
cen
t
1.8
3
1.8
3.7
0
1
2
3
4
IFG Diabetes
IlliterateLiterate
1
1.92.1
2.8
3.6
6.1
0
1
2
3
4
5
6
7
IFG Diabetes
KutchaSemi-PuccaPucca
1.9
2.4
2.9
2.22.4
3.9
0
1
2
3
4
5
IFG Diabetes
Kutcha
Semi-Pucca
Pucca
By Literacy Status – Adult Men By Literacy Status - Adult Women
(FBS ≥≥≥≥ 126 µµµµg/dL)(FBS ≥≥≥≥ 110 - <126 µµµµg/dL) (FBS ≥≥≥≥ 126 µµµµg/dL)(FBS ≥≥≥≥ 110 - <126 µµµµg/dL)
(FBS ≥≥≥≥ 126 µµµµg/dL)(FBS ≥≥≥≥ 110 - <126 µµµµg/dL) (FBS ≥≥≥≥ 126 µµµµg/dL)(FBS ≥≥≥≥ 110 - <126 µµµµg/dL)
Per
cen
t
Per
cen
tP
er c
ent
By Type of House – Adult Men By Type of House – Adult Women
47

NNMB Rural Survey 2005-06 48 Diet & Nutritional status, HTN, DM and IDA
5. DISCUSSION AND CONCLUSIONS Diet and Nutritional Status of rural population
The present survey was carried out during 2004-06, to assess the current diet and nutritional status of rural population, 5 years after the earlier survey carried out in 2000-01. For the first time, investigations to assessment of prevalence of abdominal obesity, hypertension, and diabetes mellitus (in Andhra Pradesh) among adults were included in the study. The survey was carried out in the rural areas of 9 States viz., Kerala, Tamil Nadu, Karnataka, Andhra Pradesh, Maharashtra, Gujarat, Madhya Pradesh, Orissa and West Bengal.
A total of 14,256 households were covered from 713 villages (out of the target of
720) in nine States. Twenty-four hour recall method of diet survey was carried out in a sub-sample of 10 households covered for nutrition assessment in each village, to assess food and nutrient intakes at household and individual levels. All the available individuals were covered for anthropometry.
The study revealed that about 33% of the households surveyed belonged to
scheduled caste/scheduled tribe communities and about 22% were living in kutcha houses. The average family size was 4.9, with about 46% of the households having 4 or fewer members. About 32% of men and 48% women were illiterate. About 49% of the households did not possess any land, while another 32% were marginal farmers.
The dietary surveys revealed that cereals and millets formed the bulk of the diets,
with millets constituting 13%. The intake of protective / income elastic foods such as green leafy vegetables, milk and milk products (barring Gujarat), and fats & oils was well below the recommended levels both at household as well as individual levels. The inadequacy was more among younger age groups. It was also revealed that deficiency in the intakes of dietary energy was more pronounced, compared to that of proteins, reiterating that fact that, it is essentially ‘food gap’. The intakes of various micronutrients, specifically that of iron, vitamin A, riboflavin and folic acid was grossly inadequate, which is in consonance with poor quality of diets observed. A decline in the average energy intakes by about 110 kcals/CU/day was observed, in the present survey, compared to that reported in 2000-01 surveys.
The current prevalence of underweight and wasting among preschool children was
relatively less 55% and 15% respectively compared to that reported during 2000-01 survey (NNMB 2002). However, the prevalence of stunting remained similar (51%vs 49%). There was a marginal decrease in the prevalence of chronic energy deficiency over the period, both among men (37% Vs 33%) and women (39% Vs 36%). There was a concomitant marginal increase in the prevalence of overweight, among men (5.3% Vs 7.8%) and women (8.7% Vs 10.9%).
The study revealed that about 55% of adult men and 75% of NPNL women were
had anaemia, with 9% males and 34% females having moderate to severe anaemia. The

NNMB Rural Survey 2005-06 49 Diet & Nutritional status, HTN, DM and IDA
prevalence of Bitot spots among 1-5 year children was more that the WHO cut-off level of 0.5%, in the States of Maharashtra, Tamil Nadu, Karnataka, Madhya Pradesh and Orissa. It may be mentioned here that the prevalence in Orissa is showing the increasing trend after registering a low prevalence during NNMB-MND survey carried out during 2003 (0.3% to 1.0%).
Diet related chronic diseases It has been reported that India is experiencing a rapid health transition, with rising
burden of chronic diseases, which estimated to account for 53% of all deaths and 44% of disability adjusted life years (DALY) in 200525. Hypertension is directly responsible for 57% of all stroke deaths and 24% of all coronary heart disease deaths in India3. Several community based surveys revealed that hypertension is rapidly emerging as major public health problem even in developing countries26. A study carried out during 2005 in different parts of India revealed that the prevalence of hypertension increased by about 30 times among urban communities and 10 times among the rural inhabitants during the past four decades27.
For the first time, the prevalence of hypertension was assessed in adults in the rural
population by NNMB in nine States, covering a large population and using JNC VII Criteria. It was observed that the prevalence of hypertension was as high 25% among both men and women.
The prevalence of diabetes and impaired glucose tolerance was about 4% and 2%
respectively among women and men in rural Andhra Pradesh. It was significantly associated with higher waist circumference, WHR and general obesity. The study also revealed that the risk of having IGT and DM was several times higher among those who were obese.
The overall prevalence of abdominal obesity as indicated by waist circumference
was 1% in men and 7% in women. However, by the criteria of WHR, the prevalence was observed to be much higher (25% in men and 69% in women). About 17% men and 20% women had BMI levels of ≥ 23, a cut-off level suggested for the Asian population by the WHO consultative group, indicating risk of developing chronic degenerative disorders.
Cross sectional, as well as prospective observational cohort studies, have
consistently demonstrated a positive relation between age and blood pressure28. The present study also revealed that prevalence of hypertension was significantly associated with higher waist circumference, WHR and general obesity. It was also observed that the risk of having hypertension was 2-4 times higher among the obese.
In societies that are in transitional (India) or pre-transitional phase, a higher
prevalence of hypertension has been reported, especially among upper socio-economic groups. Of all the States studied, the prevalence of hypertension in Kerala was maximum (about 50%), where the prevalence of various types of obesity was also very high. It is

NNMB Rural Survey 2005-06 50 Diet & Nutritional status, HTN, DM and IDA
consistent with other studies, where overweight is associated with 2-6 fold increase in the risk of developing hypertension29.
About two-thirds of men (66.5%) and women (60.5%) were aware of hypertension,
but very few (about 4%) could state the associated signs and symptoms. Similarly, about half the men and women were aware of diabetes mellitus.
The study revealed that the food and nutrient intake levels in general, were
relatively lower in Kerala compared to other States. Contrary to this, the prevalence of undernutrition among young children was low and prevalence of obesity and hypertension was markedly high among adults.
Therefore, there is need to carry out in depth studies to assess the lifestyle
practices and other associated factors contributing to these disorders. There is also an urgent need to sensitize the community regarding the causes and consequences of obesity, HTN and DM and to educate them about the need for adopting appropriate life styles and dietary habits.
-o0o-

NNMB Rural Survey 2005-06 51 Diet & Nutritional status, HTN, DM and IDA
REFERENCES 1. Mohan, V. prevalence of Diabetes and Hypertension in South Indian population –
The Chennai Urban Epidemiology (CURS). The Asian Journal of Diabetology 2003; 5: 29-30.
2. National Sample Survey 54Th round sample list. (1998), Ministry of statistics & Programme Implementation. National Sample Survey Organization, Government of India, New Delhi.
3. Gupta R., Trends in hypertension Epidemiology in India. J. Hum. Hypertens2004; 18 (2):73-78.
4. The DECAODA Study Group: Age and Sex specific prevalence of diabetes and impaired glucose regulation in 11 Asian cohorts. Diabetes Care 2003: 26: 1770-1781.
5. National Family Health Survey II (1998), International Institute for Population Sciences, Bombay.
6. Jelliffee, D.B. (1966). Assessment of the Nutritional Status of the Community, WHO Monograph Series No.53.
7. Measurement of Iron status. A Report of the International Nutritional Anaemia Consultative Group (INACG). Nutrition Foundation, Inc. 1126, 16th Street, N.W. Washington, DC, 20036 (USA), p4, 1985.
8. Thimmayamma, BVS and Rao, DH. A Comparative study of oral questionnaire method with actual observation of the dietary intake of preschool children. J. Nutr. Dietet. 1969; 6: 177-181.
9. Expert Group of ICMR, Recommended Dietary Intakes for Indians, ICMR (1981). 10. Gopalan, C., Ramasastry, B.V. Balasubramanyam, S.C. Narasinga Rao, B.S.,
Deosthale, Y.G. and Panth, K.C. (1990). Nutritive Value of Indian Foods, NIN, ICMR, Hyderabad, India.
11. Report of the Expert Group of the Indian Council of Medical Research (1990), Nutrient Requirements and Recommended Dietary Allowances for Indians, ICMR, and New Delhi.
12. Gomez, F., Galvan, R., Frank, S., Cravioto, J., Chavez, R. and Vasquiz, J. (1956). Mortality in Second and Third Degree Malnutrition, Journal of Trop. Paediatr. 2, 77.
13. Hamill, P.V.V., Drizd, T.A., Johnson, C.L., Reed, R.B., Roche, A.F. and Moore, W.M. (1979). Physical Growth: National Centre for Health Statistics Percentiles, American J. Clin. Nutr. 32, pp 607-629.
14. Indian Academy of Paediatrics. Report of Nutrition Sub-Committee (1974). Ind. Paed. 9: 360.
15. WHO (1983). Measuring Changes in Nutritional Status, Geneva, WHO 16. Must, A., Dallal, GE., Dietz, WH. Reference data for obesity. 85th and 95th percentiles
of Body Mass Index (BMI) and Triceps skinfold thickness. Am J Clin Nutri. 1991; 53: 839 – 846.
17. James, W.P.T., Anna Ferro-Lyzzi and Waterlow, J.C. (1988). Definition of Chronic Energy Deficiency in Adults. European Jour. of Clin. Nutr. 42, 969-981.
18. World Health Organization (WHO 2000). Obesity: Preventing managing the Global Epidemic, WHO Technical Report Series 894, WHO, Geneva.

NNMB Rural Survey 2005-06 52 Diet & Nutritional status, HTN, DM and IDA
19. Han TS., Van Leer EM., Seidell JC and Lean MEJ. Waist Circumference action levels in the identification of cardiovascular risk factors; Prevalence study in random sample. BMJ 1995; 311: 1401.
20. Willett WC., Dietz WH and Colditz GA. Guide lines for healthy weight. N Engl J Med 1999; 341: 427.
21. Preventing and controlling Iron Deficiency Anaemia through Primary Health Care – a guide for health administrators and programmers, WHO, 1989.
22. World Health Organization (1996). Hypertension control, WHO Technical Report Series 862, Report of a WHO Expert Committee, WHO, Geneva.
23. The Joint National Committee (JNC II) on Prevention, Detection, Evaluation and Treatment of high blood pressure (1997); The Sixth Report of the Joint National Committee on Prevention, Detection, Evaluation and Treatment of high blood pressure. Ach. Intern. Med. 157, 2413-2446.
24. Indian Council of Medical Research (ICMR) – WHO. Guidelines for measurement of Type II diabetes, ICMR, 2003.
25. K. Sreenath Reddy, Bela Shah, Cherian Vergese and Anbumani Ramadoss. Responding to the threat of chronic diseases in India, The Lancet, October 2005, published online DOI; 10.1016/50140-6736(05) 67341-2.
26. Hypertension Study Group. Prevalence, awareness, treatment and control of hypertension among elderly in Bangladesh and India: a multicentric study. Bulletin of World Health Organization, 2001, 79 (6): 490-500.
27. Shyamal Kumar Das, Kalyan Sanyal and Arindam Basu. Study of urban community survey in India: growing trend of high prevalence of hypertension in a developing country. Int J med Sci 2005; 2: 70-78.
28. Whelton PK. Epidemiology of hypertension. Lancet, 1994, 344: 101-106. 29. Mc Mahon S et al. Obesity and hypertension: epidemiological and clinical issues.
European Heart Journal, 1987, 8: 57-70.
-o0o-
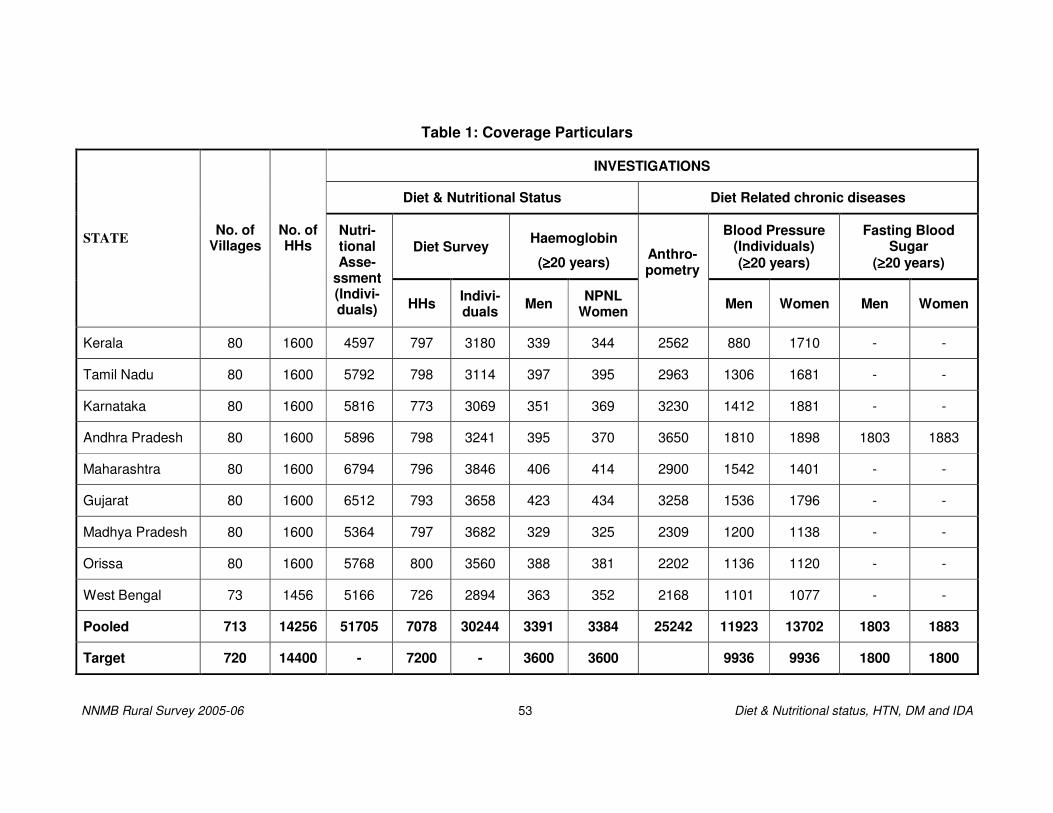
NNMB Rural Survey 2005-06 53 Diet & Nutritional status, HTN, DM and IDA
Table 1: Coverage Particulars
INVESTIGATIONS
Diet & Nutritional Status Diet Related chronic diseases
Diet Survey Haemoglobin
(≥≥≥≥20 years)
Blood Pressure (Individuals) (≥≥≥≥20 years)
Fasting Blood Sugar
(≥≥≥≥20 years)
STATE No. of Villages
No. of HHs
Nutri-tional Asse-
ssment (Indivi-duals) HHs Indivi-
duals Men NPNL Women
Anthro-pometry
Men Women Men Women
Kerala 80 1600 4597 797 3180 339 344 2562 880 1710 - -
Tamil Nadu 80 1600 5792 798 3114 397 395 2963 1306 1681 - -
Karnataka 80 1600 5816 773 3069 351 369 3230 1412 1881 - -
Andhra Pradesh 80 1600 5896 798 3241 395 370 3650 1810 1898 1803 1883
Maharashtra 80 1600 6794 796 3846 406 414 2900 1542 1401 - -
Gujarat 80 1600 6512 793 3658 423 434 3258 1536 1796 - -
Madhya Pradesh 80 1600 5364 797 3682 329 325 2309 1200 1138 - -
Orissa 80 1600 5768 800 3560 388 381 2202 1136 1120 - -
West Bengal 73 1456 5166 726 2894 363 352 2168 1101 1077 - -
Pooled 713 14256 51705 7078 30244 3391 3384 25242 11923 13702 1803 1883
Target 720 14400 - 7200 - 3600 3600 9936 9936 1800 1800

NNMB Rural Survey 2005-06 54 Diet & Nutritional status, HTN, DM and IDA
Table 2.1: Distribution (%) of Households by Socio-economic and Demographic profile
STATES Socio Economic Parameters Kerala Tamil
Nadu Karna-
taka Andhra Pradesh
Maha-rashtra Gujarat Madhya
Pradesh Orissa West Bengal
Pooled
n 1600 1600 1600 1600 1600 1600 1600 1600 1456 14256 Religion
Hindu 61.8 91.1 91.4 97.3 82.4 93.4 97.6 96.9 77.5 87.8
Muslim 25.9 3.3 6.0 2.1 3.4 6.1 2.3 1.4 21.6 7.9
Christian 12.3 5.6 1.7 .6 .1 .1 .0 1.7 .8 2.5
Others .0 .0 .9 .0 14.2 .5 .1 .0 .0 1.8 Community
Scheduled Tribes 2.0 1.4 10.4 2.8 11.5 14.6 24.1 22.9 8.9 11.0
Scheduled Castes 14.4 28.9 19.3 22.3 22.2 13.6 15.6 21.9 40.5 21.9
Other Backward Castes 60.3 69.0 23.9 48.4 25.4 21.6 42.7 35.8 3.6 37.0
Others 23.3 .7 46.4 26.5 40.9 50.3 17.6 19.5 47.0 30.1
Type of House Kutcha 6.4 27.4 14.2 22.2 3.8 39.9 14.4 49.5 22.6 22.3
Semi Pucca 60.1 43.6 80.8 48.3 90.4 49.5 85.3 35.8 64.0 61.9
Pucca 33.6 28.9 5.1 29.5 5.8 10.6 .3 14.7 13.4 15.8 Type of Family
Nuclear 67.6 73.6 58.3 63.3 56.8 56.7 69.9 58.1 67.6 63.5
Joint 18.4 15.2 24.7 19.1 19.1 17.8 12.2 21.6 17.0 18.4
Extended Nuclear 14.0 11.3 17.0 17.6 24.2 25.5 17.9 20.3 15.5 18.2

NNMB Rural Survey 2005-06 55 Diet & Nutritional status, HTN, DM and IDA
Table 2.2: Distribution (%) of Households by Socio-Economic and Demographic profile
STATES Socio Economic
Parameters Kerala Tamil Nadu
Karna-taka
Andhra Pradesh
Maha-rashtra Gujarat Madhya
Pradesh Orissa West Bengal
Pooled
n 1600 1600 1600 1600 1600 1600 1600 1600 1456 14256
Family Size
1-4 58.5 55.3 46.9 52.2 35.5 38.5 40.6 36.6 48.7 45.8
5-7 36.2 41.9 44.0 42.3 51.5 51.4 49.2 50.4 45.9 45.9
≥≥≥≥8 5.3 2.9 9.1 5.5 13.0 10.1 10.2 13.0 5.4 8.3
Average 4.5 4.5 4.9 4.6 5.4 5.2 5.1 5.4 4.8 4.9 Literacy Status of Adult men
Illiterate 7.7 26.0 38.5 46.1 22.4 22.3 39.2 38.3 45.5 31.6
Read & Write .5 .3 1.5 2.1 .3 11.6 .8 .7 4.7 2.5
1-4 std. 23.9 12.3 12.0 8.3 20.1 19.5 7.3 14.6 9.3 14.2
5-8 std. 23.1 35.9 21.0 21.3 21.3 22.9 30.5 22.6 20.6 24.4
9-12 std. 40.4 21.1 20.5 18.3 30.1 18.1 13.1 18.0 15.7 21.8
College 4.3 4.4 6.5 4.0 5.8 5.7 9.1 5.8 4.3 5.5
Literacy Status of Adult Women
Illiterate 11.5 40.6 51.7 64.1 43.6 39.0 64.9 60.4 56.8 48.0
Read & Write .3 .2 1.2 1.3 .4 12.9 .5 .1 4.5 2.4
1-4 std. 20.1 9.3 11.5 5.1 14.8 18.9 6.3 9.3 9.1 11.6
5-8 std. 18.4 31.5 18.5 18.9 21.7 17.9 21.2 19.0 17.6 20.5
9-12 std. 44.6 16.9 15.0 9.2 17.9 9.4 4.7 9.1 11.1 15.4
College 5.3 1.6 2.1 1.4 1.6 1.8 2.4 2.1 .9 2.1

NNMB Rural Survey 2005-06 56 Diet & Nutritional status, HTN, DM and IDA
Table 2.3: Distribution (%) of Households by Socio-Economic and Demographic profile
STATES Socio Economic Parameters
Kerala Tamil Nadu
Karna-taka
Andhra Pradesh
Maha-rashtra
Gujarat Madhya Pradesh
Orissa West
Bengal Pooled
n 1600 1600 1600 1600 1600 1600 1600 1600 1456 14256
Occupation of Head of Household
Agri. Labour .0 8.8 21.3 11.8 26.6 40.9 1.1 3.1 24.6 15.3
Other Labour 38.3 37.3 25.3 21.9 11.6 14.4 35.9 50.8 17.0 28.2
Owner Cultivation 2.4 13.4 21.0 30.0 34.9 15.9 43.6 17.9 24.5 22.6
Land Lord .0 .1 4.0 .9 .1 1.6 2.3 .5 .9 1.1
Tenant Cultivation .1 .1 .8 2.9 1.1 .3 .2 1.6 2.5 1.0
Artisan 13.1 18.8 5.1 5.3 3.8 1.5 4.6 6.1 4.3 7.0
Service 8.9 8.1 10.3 9.8 10.2 10.1 7.1 8.8 6.9 8.9
Business 25.1 7.1 7.6 7.1 5.6 4.2 3.6 8.2 15.1 9.2
Others 12.1 6.4 4.6 10.5 6.2 11.1 1.7 3.1 4.1 6.7
Land Ownership (Acres)
No land 50.6 61.6 39.6 41.9 42.7 66.4 46.6 35.9 57.4 49.1
Marginal farmers (<2.5) 48.8 26.4 32.3 34.4 23.8 15.2 21.6 49.1 34.3 31.7
Small farmers (2.5 - 5.0) .5 7.0 12.8 11.3 13.9 5.1 14.0 8.4 6.3 8.8
Large farmers (≥≥≥≥ 5) .1 4.9 15.4 12.5 19.7 13.4 17.8 6.6 2.0 10.4
Monthly Per Capita Income (Rs.)
< 300 21.0 16.0 44.3 22.4 42.9 4.6 30.6 64.4 13.0 29.0
300-600 31.6 40.1 31.6 38.5 32.6 24.3 45.8 25.3 40.9 34.4
600-900 17.8 20.8 10.3 17.1 11.3 25.8 12.4 5.6 20.1 15.6
≥≥≥≥900 29.7 23.1 13.9 21.9 13.3 45.3 11.2 4.8 26.1 21.0
Average PCI (Rs./Month) 776 718 531 713 536 1057 533 330 751 660

NNMB Rural Survey 2005-06 57 Diet & Nutritional status, HTN, DM and IDA
Table 2.4: Distribution (%) of Households by Socio-Economic and Demographic profile
STATES Socio Economic
Parameters Kerala Tamil Nadu
Karna-taka
Andhra Pradesh
Maha-rashtra Gujarat Madhya
Pradesh Orissa West Bengal
Pooled
n 1600 1600 1600 1600 1600 1600 1600 1600 1456 14256
Source of Drinking Water
Open well 81.9 1.5 10.7 10.1 18.9 5.6 55.7 23.7 6.0 24.0
Tube well 1.8 15.9 17.8 32.9 30.3 24.8 38.1 70.6 87.9 35.0
Tap 15.6 82.2 67.9 56.2 50.2 64.3 4.9 2.0 5.8 39.1
Pond/ Tank .3 .4 3.2 .6 .1 4.0 .1 1.2 .0 1.1
Stream/ River/ Canal .4 .0 .4 .3 .6 1.3 1.1 2.5 .2 .8
Amenities Present
Sanitary Latrine 88.3 16.1 20.5 25.7 16.4 32.0 7.4 8.6 31.9 27.4
Electrification 84.6 87.6 87.8 94.5 80.1 94.6 56.9 26.8 32.9 72.1
Separate Kitchen 97.4 92.1 84.4 47.4 72.2 83.6 51.6 70.0 81.5 75.5
Type of cooking fuel
Fire wood 85.8 85.2 90.6 74.6 78.1 88.7 97.9 97.8 98.9 88.5
Kerosene .3 1.9 .6 .6 2.8 1.1 .3 .7 .3 .9
Bio-gas .1 .6 1.0 .3 1.4 .5 .7 .4 .0 .6
LPG 13.8 12.3 7.8 24.5 17.6 9.8 1.1 1.1 .8 10.0

NNMB Rural Survey 2005-06 58 Diet & Nutritional status, HTN, DM and IDA
Table 3: Average Household consumption of Food stuffs (g/CU/day)
FOODS
STATE Cereals Millets
Cereals &
Millets
Pulses &
Legumes
Green Leafy Veg.
Other Veg.
Roots & Tubers
Fruits Fish Other Flesh Foods
Milk & Milk
Prod.
Fats &
oils
Sugar &
Jaggery Mean 320 0 320 23 7 56 53 38 56 8 66 6 18 Kerala
(N=797) SD 71 1 72 28 25 69 57 49 61 33 78 6 9
Mean 383 3 386 37 10 46 41 42 9 2 102 12 11 Tamil nadu (N=798) SD 87 23 110 29 27 49 41 32 34 12 111 9 13
Mean 354 75 429 37 8 23 40 36 2 3 84 9 19 Karnataka (N=773) SD 171 130 301 31 20 42 39 41 15 21 103 9 17
Mean 433 16 449 30 6 38 34 49 5 14 112 18 10 Andhra Pradesh (N=798) SD 125 53 178 32 17 50 38 64 23 38 122 13 11
Mean 197 132 329 33 10 26 20 15 4 4 77 22 29 Maharashtra (N=796) SD 142 139 281 27 24 38 23 36 19 19 98 14 18
Mean 133 200 333 20 9 78 53 15 2 3 170 21 11 Gujarat (N=793) SD 122 171 293 30 32 75 57 32 18 20 168 15 10
Mean 366 32 398 29 16 35 59 13 2 2 59 9 10 Madhya Pradesh (N=797) SD 148 96 244 33 37 53 54 26 14 15 120 12 12
Mean 443 1 444 29 43 73 99 20 9 2 14 10 7 Orissa (N=800) SD 77 22 99 31 65 79 75 39 28 15 40 7 10
Mean 477 0 477 18 41 71 144 14 33 14 49 18 10 West Bengal (N=726) SD 146 7 153 25 74 89 95 56 50 44 94 11 19
Mean 344 52 396 28 16 49 60 27 13 6 82 14 14 SD 164.9 115.6 280.5 30.4 42.4 65.4 66.6 45.1 37.3 26.5 116.6 12.2 15.2
Total (N=7078)
RDA 460 40 40 60 50 - - - 150 20 30

NNMB Rural Survey 2005-06 59 Diet & Nutritional status, HTN, DM and IDA
Table 4 : Average household Intake of Nutrients (CU/day)
STATE Protein (g)
Total Fat (g)
Energy (Kcal)
Calcium (mg)
Iron (mg)
Vit. -A (µg)
Thiamin (mg)
Riboflavin (mg)
Niacin (mg)
Vit.-C (mg)
Free Folic Acid (µg)
Median 47.5 34.0 1774 399 11.5 91 0.9 0.5 13.9 28 47.2 Mean 49.1 36.3 1799 477 12.5 162 1.0 0.6 14.2 41 50.4 Kerala
(N=797) SD 16.2 19.5 375 341 6.1 271 0.3 0.2 3.5 38 18.1
Median 41.3 15.2 1740 322 8.8 132 1.2 0.6 16.1 31 55.5 Mean 43.3 17.6 1772 393 10.2 199 1.2 0.6 16.2 45 58.2 Tamil Nadu
(N=798) SD 12.3 11.3 367 284 5.6 253 0.3 0.2 4.2 43 17.9
Median 48.0 15.9 1865 380 12.1 131 1.1 0.7 10.9 23 43.4 Mean 49.8 19.3 1912 569 13.9 178 1.2 0.7 11.7 28 47.4 Karnataka
(N=773) SD 17.3 13.0 589 500 8.8 194 0.6 0.3 4.7 24 22.0
Median 48.0 26.3 2061 333 8.3 123 0.6 0.6 11.3 27 39.8 Mean 50.1 31.1 2113 414 9.2 245 0.7 0.6 11.9 35 43.6
Andhra Pradesh (N=798) SD 15.9 18.5 503 288 4.0 357 0.3 0.2 3.9 33 18.6
Median 47.8 21.0 1597 304 16.5 114 1.4 0.7 12.4 14 49.9 Mean 49.0 24.9 1647 384 17.3 198 1.4 0.7 13.1 22 50.9 Maharashtra
(N=796) SD 14.6 17.5 424 272 7.3 240 0.5 0.3 4.7 24 19.0
Median 52.5 24.3 1594 417 22.8 170 1.6 0.9 11.9 31 63.7 Mean 53.5 27.8 1614 526 24.6 207 1.6 0.9 12.3 43 68.2 Gujarat
(N=793) SD 15.6 16.5 454 331 13.2 272 0.5 0.3 3.9 38 28.1
Median 48.3 11.0 1655 239 14.0 85 1.0 0.6 12.3 19 34.7 Mean 50.9 15.6 1715 317 15.5 184 1.2 0.6 13.3 32 38.6
Madhya Pradesh (N=797) SD 16.4 18.7 475 293 8.9 340 0.7 0.3 4.8 40 23.7
Median 43.5 6.7 1854 273 11.9 80 1.2 0.5 19.4 49 53.5 Mean 45.3 9.5 1888 377 14.7 523 1.3 0.5 19.0 76 55.5 Orissa
(N=800) SD 12.4 7.9 336 322 9.0 1017 0.4 0.2 4.7 79 18.9
Median 51.6 7.1 2032 372 13.0 94 1.3 0.5 20.6 50 54.3 Mean 54.3 11.5 2071 505 15.0 431 1.4 0.6 20.9 77 58.4 West Bengal
(N=726) SD 19.1 11.2 539 476 8.0 899 0.4 0.3 6.5 75 25.8
Median 47.4 17.0 1787 335 12.3 115 1.1 0.6 13.9 28 49.6 Mean 49.4 21.6 1834 439 14.8 257 1.2 0.6 14.7 44 52.3
SD 16.0 17.6 485 360 9.3 525 0.5 0.3 5.5 51 23.1 Total (N=7078)
RDA 60 - 2425 400 28 600 1.2 1.4 16 40 100

NNMB Rural Survey 2005-06 60 Diet & Nutritional status, HTN, DM and IDA
Table 5.1: Average consumption of Foodstuffs (g/day) among 1-3 year Boys and Girls
STATE Cereals Millets Cereals &
MIllets Pulses & Legumes
Green Leafy Veg.
Other Vege-tables
Roots & Tubers
Nuts & Oil
seeds
Condi-ments & Spices
Fruits Fish Other Flesh Foods
Milk & Milk
Prod.
Fats &
oils
Sugar & Jaggery
Mean 101 * 101 8 2 14 13 16 6 22 20 3 65 2 11 Kerala (n=170) SD 46 * 46 11 10 24 18 15 4 37 25 14 77 3 8
Mean 114 1 115 13 5 19 14 2 5 14 2 3 152 4 12 Tamil Nadu (n=250) SD 57 4 61 12 20 24 18 4 7 13 9 9 213 5 22
Mean 116 13 129 15 2 7 13 4 4 14 1 1 70 3 13 Karnataka (n=165) SD 67 30 97 15 9 16 16 9 3 16 4 6 84 4 14
Mean 174 4 178 12 1 11 12 1 5 33 2 4 81 7 8 Andhra Pradesh (n=176) SD 92 14 106 15 6 19 19 6 5 60 7 11 105 8 10
Mean 77 36 113 19 2 6 6 2 4 10 1 1 107 7 15 Maharashtra (n=266) SD 65 61 126 23 10 13 10 4 5 32 7 8 146 7 13
Mean 44 78 122 7 3 16 16 * 3 5 * 1 103 6 4 Gujarat (n=165) SD 54 95 149 13 9 28 25 1 5 12 * 12 122 6 6
Mean 151 12 163 14 6 15 26 * 4 6 1 1 47 4 8 Madhya Pradesh (n=329) SD 92 44 136 17 16 28 29 3 4 15 7 10 89 6 12
Mean 141 * 141 15 19 30 45 * 4 8 3 1 17 4 5 Orissa (n=241) SD 64 4 68 14 32 38 42 1 3 25 11 6 52 3 7
Mean 139 * 139 6 13 20 56 * 3 8 17 7 146 5 7 West Bengal (n=186) SD 69 3 72 11 36 41 57 1 4 41 32 24 205 5 18
Mean 120 15 135 13 6 16 23 2 4 12 4 2 86 5 9
SD 79 47 126 16 20 28 33 7 5 31 16 12 140 6 14 Pooled
(n=1948) RDI 175 35 40 20 10 - - - - - 300 25 30
* Indicates <1g

NNMB Rural Survey 2005-06 61 Diet & Nutritional status, HTN, DM and IDA
Table 5.2: Average consumption of Foodstuffs (g/day) among 4-6 year Boys and Girls
STATE Cereals Millets Cereals &
MIllets
Pulses &
Legumes
Green Leafy Veg.
Other Vege-tables
Roots & Tubers
Nuts & Oil
seeds
Condi-ments & Spices
Fruits Fish Other Flesh Foods
Milk & Milk
Prod.
Fats & oils
Sugar & Jaggery
Mean 164 * 164 15 3 25 23 27 8 32 31 8 50 4 14 Kerala (n=173) SD 54 * 54 19 13 34 26 22 5 51 35 28 74 5 8
Mean 190 1 191 22 6 30 22 3 10 19 4 3 79 6 10 Tamil Nadu (n=210) SD 64 10 74 13 24 32 24 6 12 14 15 11 96 4 12
Mean 168 31 199 21 5 13 17 7 6 19 1 1 68 5 16 Karnataka (n=182) SD 82 54 136 17 13 26 17 11 4 19 11 5 82 4 13
Mean 243 6 249 18 3 19 17 2 8 34 2 7 77 9 8 Andhra Pradesh (n=178) SD 101 27 128 18 10 29 22 5 6 59 8 17 91 6 12
Mean 138 59 197 26 4 12 11 5 6 16 4 3 75 13 20 Maharashtra (n=272) SD 103 85 188 24 13 19 15 10 5 44 18 16 126 10 14
Mean 59 104 163 9 5 35 27 1 6 8 1 1 104 11 7 Gujarat (n=254) SD 90 108 198 16 16 45 33 1 7 13 8 8 104 11 8
Mean 230 20 250 23 9 22 38 * 6 8 1 1 46 6 8 Madhya Pradesh (n=324) SD 113 64 177 23 23 35 39 1 4 19 9 12 93 8 10
Mean 222 1 223 19 31 42 59 * 5 9 4 1 8 5 5 Orissa (n=233) SD 68 13 81 19 45 48 46 1 4 17 13 8 31 4 8
Mean 229 * 229 12 25 37 95 1 5 7 26 9 53 10 8 West Bengal (n=214) SD 74 * 74 16 50 51 63 5 5 33 41 31 118 8 18
Mean 181 28 209 19 10 26 35 4 7 15 7 3 62 8 10
SD 105 68 173 20 29 38 43 11 6 34 23 17 99 8 13 Pooled (n=2040)
RDI - - 270 35 50 30 20 - - - - - 250 25 40
* Indicates <1g

NNMB Rural Survey 2005-06 62 Diet & Nutritional status, HTN, DM and IDA
Table 5.3: Average consumption of Foodstuffs (g/day) among 7-9 year Boys and Girls
STATE Cereals Millets Cereals &
Millets
Pulses &
Legumes
Green Leafy Veg.
Other Vege-tables
Roots & Tubers
Nuts & Oil
seeds
Condi-ments & Spices
Fruits Fish Other Flesh Foods
Milk & Milk
Prod.
Fats & oils
Sugar & Jaggery
Mean 190 * 190 22 4 27 34 29 10 31 30 6 51 4 14 Kerala (n=163) SD 57 * 57 23 14 40 49 21 6 45 32 26 73 6 8
Mean 234 * 234 27 7 32 23 3 14 23 5 2 77 8 10 Tamil Nadu (n=202) SD 68 * 68 18 26 33 24 5 16 22 16 8 84 6 10
Mean 223 40 263 28 6 14 22 9 7 20 * 2 63 6 15 Karnataka (*n=171) SD 101 68 169 19 17 25 25 13 5 24 4 10 93 5 14
Mean 295 12 307 22 4 22 21 2 11 39 2 9 78 12 6 Andhra Pradesh (n=215)
SD 120 38 158 24 14 33 25 7 7 62 15 25 106 11 9
Mean 160 84 244 26 6 17 12 6 7 16 3 2 73 15 23 Maharashtra (n=246) SD 119 100 219 28 17 24 14 9 4 45 16 11 117 11 15
Mean 76 127 203 12 8 44 33 1 8 7 1 1 128 12 7 Gujarat (n=228) SD 76 131 207 16 25 42 37 1 6 13 7 10 137 9 7
Mean 266 31 297 28 11 26 50 * 6 10 1 2 36 7 9 Madhya Pradesh (n=304)
SD 129 87 216 29 27 42 45 1 4 19 8 13 70 8 11
Mean 290 2 292 22 35 45 75 1 6 12 6 1 8 6 5 Orissa (n=239) SD 77 22 99 21 53 53 57 3 5 25 18 8 25 4 8
Mean 283 * 283 10 27 44 118 * 6 16 24 13 52 11 8 West Bengal (n=196) SD 100 1 101 16 53 60 81 2 5 70 40 35 114 7 17
Mean 225 35 260 22 12 30 43 5 8 19 7 4 62 9 11 Pooled (n=1964 ) SD 121 83 204 23 33 42 54 12 7 41 22 18 101 9 13
* Indicates <1g
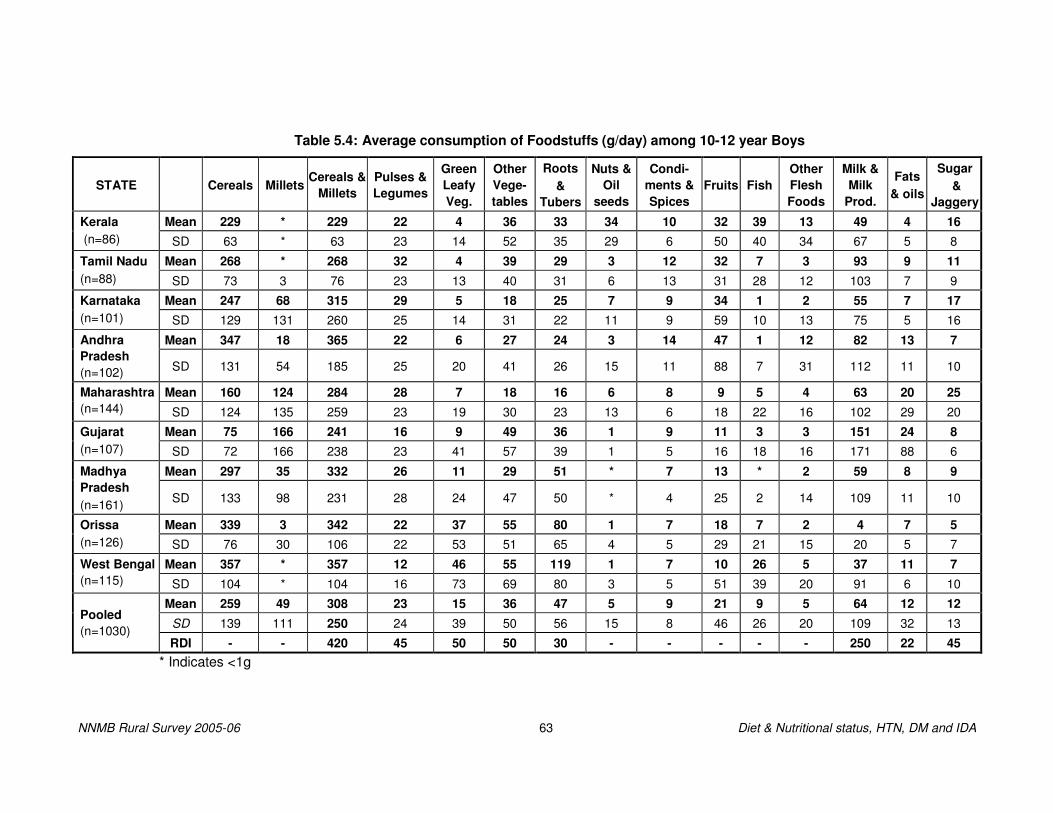
NNMB Rural Survey 2005-06 63 Diet & Nutritional status, HTN, DM and IDA
Table 5.4: Average consumption of Foodstuffs (g/day) among 10-12 year Boys
STATE Cereals Millets Cereals &
Millets Pulses & Legumes
Green Leafy Veg.
Other Vege-tables
Roots &
Tubers
Nuts & Oil
seeds
Condi-ments & Spices
Fruits Fish Other Flesh Foods
Milk & Milk
Prod.
Fats & oils
Sugar &
Jaggery
Mean 229 * 229 22 4 36 33 34 10 32 39 13 49 4 16 Kerala (n=86) SD 63 * 63 23 14 52 35 29 6 50 40 34 67 5 8
Mean 268 * 268 32 4 39 29 3 12 32 7 3 93 9 11 Tamil Nadu (n=88) SD 73 3 76 23 13 40 31 6 13 31 28 12 103 7 9
Mean 247 68 315 29 5 18 25 7 9 34 1 2 55 7 17 Karnataka (n=101) SD 129 131 260 25 14 31 22 11 9 59 10 13 75 5 16
Mean 347 18 365 22 6 27 24 3 14 47 1 12 82 13 7 Andhra Pradesh (n=102) SD 131 54 185 25 20 41 26 15 11 88 7 31 112 11 10
Mean 160 124 284 28 7 18 16 6 8 9 5 4 63 20 25 Maharashtra (n=144) SD 124 135 259 23 19 30 23 13 6 18 22 16 102 29 20
Mean 75 166 241 16 9 49 36 1 9 11 3 3 151 24 8 Gujarat (n=107) SD 72 166 238 23 41 57 39 1 5 16 18 16 171 88 6
Mean 297 35 332 26 11 29 51 * 7 13 * 2 59 8 9 Madhya Pradesh (n=161) SD 133 98 231 28 24 47 50 * 4 25 2 14 109 11 10
Mean 339 3 342 22 37 55 80 1 7 18 7 2 4 7 5 Orissa (n=126) SD 76 30 106 22 53 51 65 4 5 29 21 15 20 5 7
Mean 357 * 357 12 46 55 119 1 7 10 26 5 37 11 7 West Bengal (n=115) SD 104 * 104 16 73 69 80 3 5 51 39 20 91 6 10
Mean 259 49 308 23 15 36 47 5 9 21 9 5 64 12 12
SD 139 111 250 24 39 50 56 15 8 46 26 20 109 32 13 Pooled (n=1030)
RDI - - 420 45 50 50 30 - - - - - 250 22 45 * Indicates <1g

NNMB Rural Survey 2005-06 64 Diet & Nutritional status, HTN, DM and IDA
Table 5.5: Average consumption of Foodstuffs (g/day) among 10-12 year Girls
STATE Cereals Millets Cereals &
Millets Pulses & Legumes
Green Leafy Veg.
Other Vege-tables
Roots & Tubers
Nuts & Oil seeds
Condi-ments & Spices
Fruits Fish Other Flesh Foods
Milk & Milk
Prod.
Fats &
oils
Sugar & Jaggery
Mean 214 * 214 23 3 38 38 34 9 26 25 11 47 5 15 Kerala (n=66) SD 53 * 53 22 11 48 55 25 6 40 36 33 76 6 9
Mean 270 4 274 29 8 35 22 2 16 26 5 * 47 8 7 Tamil Nadu (n=88) SD 86 33 119 20 16 34 28 4 19 22 17 1 59 7 8
Mean 247 52 299 27 7 14 28 12 8 24 * 5 48 7 14 Karnataka (n=91) SD 127 95 222 32 14 25 29 15 5 54 1 31 77 7 14
Mean 362 10 372 25 4 24 26 3 14 51 3 10 83 12 6 Andhra Pradesh (n=106) SD 131 38 169 25 10 39 28 7 9 73 19 24 112 9 8
Mean 178 108 286 28 7 17 16 5 8 16 4 1 50 16 26 Maharashtra (n=119) SD 141 137 278 24 17 28 17 8 4 58 20 5 90 11 18
Mean 79 161 240 12 5 48 40 1 17 9 * 3 129 14 9 Gujarat (n=110) SD 86 165 251 18 18 42 41 1 78 12 * 23 124 8 10
Mean 288 42 330 26 13 29 53 * 6 11 1 2 36 6 6 Madhya Pradesh (n=139) SD 137 108 245 31 31 41 51 1 4 21 6 14 80 7 9
Mean 331 * 331 21 38 47 79 * 7 17 4 2 8 7 5 Orissa (n=115) SD 63 * 63 22 62 58 59 1 4 33 13 14 23 5 6
Mean 337 1 338 15 31 52 123 * 8 20 26 14 43 13 8 West Bengal (n=108) SD 121 6 127 31 69 74 93 1 6 71 40 41 105 9 12
Mean 258 45 303 23 13 34 49 5 10 21 7 5 54 10 10
SD 141 106 247 26 38 47 60 13 28 49 22 24 94 9 13 Pooled (n= 942)
RDI - - 380 45 50 50 30 - - - - 250 22 45
* Indicates <1g

NNMB Rural Survey 2005-06 65 Diet & Nutritional status, HTN, DM and IDA
Table 5.6: Average consumption of Foodstuffs (g/day) among 13-15 year Boys
STATE Cereals Millets Cereals & Millets
Pulses & Legumes
Green Leafy Veg.
Other Vege-tables
Roots & Tubers
Nuts & Oil seeds
Condi-ments
& Spices
Fruits Fish Other Flesh Foods
Milk & Milk
Prod.
Fats & oils
Sugar & Jaggery
Mean 281 * 281 21 8 48 44 49 13 36 40 8 59 5 17 Kerala (n=91)
SD 85 3 88 29 24 54 60 37 8 52 48 36 71 5 9
Mean 330 1 331 36 7 33 39 4 17 34 11 1 55 10 9 Tamil Nadu (n=97)
SD 100 5 105 24 21 39 44 7 14 24 31 4 64 7 11
Mean 288 75 363 29 4 17 35 9 13 29 3 4 57 7 17 Karnataka (n=100)
SD 149 135 284 25 8 31 34 14 33 30 18 21 82 6 20
Mean 440 20 460 23 9 30 30 5 16 38 6 16 71 14 6 Andhra Pradesh (n=97) SD 164 57 221 25 28 36 28 25 11 53 22 41 96 8 7
Mean 187 148 335 30 10 27 20 7 10 16 5 4 65 21 27 Maharashtra (n=122)
SD 141 158 299 27 26 38 28 14 6 60 24 18 105 12 23
Mean 125 161 286 18 7 62 37 1 11 10 2 3 143 16 8 Gujarat (n=108)
SD 188 148 336 25 22 65 46 1 7 15 14 23 141 9 6
Mean 326 48 374 23 13 24 50 * 7 13 3 2 70 8 10 Madhya Pradesh (n=145) SD 164 116 280 23 33 39 54 * 4 25 33 13 134 10 11
Mean 413 * 413 20 30 64 97 1 7 19 10 1 10 8 6 Orissa (n=105)
SD 88 * 88 23 42 64 57 1 6 37 29 13 40 6 9
Mean 435 * 435 19 46 61 117 1 7 9 24 9 37 16 8 West Bengal (n=78)
SD 144 * 144 29 74 77 95 6 5 23 40 30 90 10 14
Mean 307 55 362 25 14 39 50 8 11 22 10 5 64 12 12 Pooled (n=943) SD 174 117 26 36 53 59 21 14 40 32 24 105 10 15
* Indicates <1g

NNMB Rural Survey 2005-06 66 Diet & Nutritional status, HTN, DM and IDA
Table 5.7: Average consumption of Foodstuffs (g/day) among 13-15 year Girls
STATE Cereals Millets Cereals & Millets
Pulses & Legumes
Green Leafy Veg.
Other Vege-tables
Roots & Tubers
Nuts & Oil seeds
Condi-ments & Spices
Fruits Fish Other Flesh Foods
Milk & Milk Prod.
Fats &
oils
Sugar &
Jaggery
Mean 255 * 255 20 5 41 47 42 12 29 39 9 52 5 17 Kerala (n=97)
SD 62 * 62 27 19 56 53 31 7 34 47 30 75 4 9
Mean 310 7 317 32 6 35 32 5 16 32 4 2 65 9 9 Tamil Nadu (n=90)
SD 74 41 115 22 17 37 32 13 13 27 22 8 80 7 9
Mean 252 83 335 31 10 15 31 8 9 33 1 2 79 7 23 Karnataka (n=94)
SD 124 147 271 29 19 28 31 14 6 59 10 13 122 5 29
Mean 377 22 399 24 4 29 22 5 16 58 1 8 82 14 9 Andhra Pradesh (n=89) SD 124 53 177 25 12 41 25 20 10 80 6 23 95 10 12
Mean 173 145 318 31 8 21 19 7 9 13 4 7 50 19 25 Maharashtra (n=136)
SD 140 155 295 25 20 33 26 11 4 42 14 32 73 12 17
Mean 88 196 284 13 9 49 33 1 10 8 3 3 168 16 8 Gujarat (n=92)
SD 92 163 255 16 26 51 39 1 8 11 19 19 199 17 5
Mean 345 13 358 21 16 43 60 * 7 15 1 * 63 10 10 Madhya Pradesh (n=106) SD 131 62 193 26 37 60 54 4 4 26 7 3 117 12 12
Mean 396 * 396 22 41 63 87 * 6 16 5 1 7 7 6 Orissa (n=133)
SD 70 * 70 23 59 64 63 1 3 28 18 10 20 4 8
Mean 412 * 412 20 37 63 116 * 8 5 27 10 32 13 9 West Bengal (n=76)
SD 156 * 156 34 65 83 73 * 7 15 46 31 93 8 14
Mean 287 54 341 24 15 40 49 8 10 23 9 4 63 11 13 Pooled (n=913) SD 151 119 270 26 38 54 55 19 8 43 27 22 112 11 16
* Indicates <1g

NNMB Rural Survey 2005-06 67 Diet & Nutritional status, HTN, DM and IDA
Table 5.8: Average consumption of Foodstuffs (g/day) among 16-17 year Boys
STATE Cereals Millets Cereals & Millets
Pulses & Legumes
Green Leafy Veg.
Other Vege-tables
Roots &
Tubers
Nuts & Oil seeds
Condi-ments & Spices
Fruits Fish Other Flesh Foods
Milk &
Milk Prod.
Fats &
oils
Sugar &
Jaggery
Mean 336 * 336 30 9 42 58 46 17 31 63 4 63 6 16 Kerala (n=58)
SD 100 * 100 31 31 49 59 28 10 39 58 17 76 5 8
Mean 386 4 390 33 12 45 41 3 17 45 3 4 63 9 8 Tamil Nadu (n=53)
SD 106 20 126 26 26 46 38 6 15 36 18 13 95 6 10
Mean 350 118 468 34 10 21 30 9 10 37 * 5 93 8 16 Karnataka (n=52)
SD 179 184 363 36 15 42 28 13 7 45 * 39 149 8 14
Mean 510 12 522 37 7 48 44 5 19 45 5 23 106 23 9 Andhra Pradesh (n=47) SD 164 47 211 55 16 54 52 12 11 55 17 45 94 22 10
Mean 271 138 409 33 11 25 29 6 12 17 5 13 69 23 24 Maharashtra (n=82)
SD 172 186 358 30 23 34 38 12 6 52 19 47 118 17 16
Mean 122 202 324 19 10 75 43 1 11 10 2 2 144 17 9 Gujarat (n=92)
SD 106 174 280 25 32 73 49 1 5 14 15 18 149 8 7
Mean 377 46 423 34 22 35 55 * 7 18 1 * 67 7 8 Madhya Pradesh (n=65) SD 173 140 313 47 43 50 53 * 4 29 9 * 161 10 13
Mean 484 * 484 28 24 68 103 1 8 17 14 2 6 10 7 Orissa (n=54)
SD 103 * 103 35 40 65 78 1 8 34 33 11 19 6 10
Mean 604 * 604 19 25 102 167 2 8 22 39 20 60 23 7 West Bengal (n=44)
SD 285 * 285 27 56 96 121 8 6 82 54 61 147 19 11
Mean 353 73 426 29 14 50 59 8 12 25 13 8 79 14 12 Pooled (n=547) SD 209 148 357 36 33 63 70 18 9 45 35 33 128 14 13
* Indicates <1g

NNMB Rural Survey 2005-06 68 Diet & Nutritional status, HTN, DM and IDA
Table 5.9: Average consumption of Foodstuffs (g/day) among 16-17 year Girls
STATE Cereals Millets Cereals
& Millets
Pulses &
Legumes
Green Leafy Veg.
Other Vege-tables
Roots &
Tubers
Nuts & Oil seeds
Condi-ments & Spices
Fruits Fish Other Flesh Foods
Milk &
Milk Prod.
Fats &
oils
Sugar &
Jaggery
Mean 280 * 280 17 4 35 38 47 14 47 55 4 50 5 16 Kerala (n=66)
SD 83 3 86 23 17 51 50 30 9 68 50 20 56 7 8
Mean 353 4 357 34 5 32 32 4 15 32 15 * 76 10 8 Tamil Nadu (n=49)
SD 85 26 111 25 18 37 31 6 7 26 40 2 98 9 7
Mean 305 71 376 23 6 18 38 12 9 32 2 1 74 7 14 Karnataka (n=63)
SD 181 116 297 20 13 32 40 18 5 26 14 7 82 6 16
Mean 380 15 395 28 5 25 30 2 16 42 2 8 63 14 6 Andhra Pradesh (n=57) SD 161 39 200 32 18 42 28 5 12 52 10 21 89 11 7
Mean 163 143 306 30 15 23 18 10 10 17 3 3 43 19 30 Maharashtra (n=80)
SD 160 149 309 27 41 39 23 14 7 67 19 13 62 10 24
Mean 82 221 303 22 1 61 43 1 9 12 * * 177 15 9 Gujarat (n=81)
SD 92 161 253 33 8 64 50 1 5 16 * * 171 8 12
Mean 357 33 390 24 24 30 56 * 8 12 * 4 80 9 12 Madhya Pradesh (n=57) SD 163 104 267 26 43 42 66 1 5 24 * 18 118 10 17
Mean 429 * 429 23 36 72 99 1 8 25 7 2 11 10 6 Orissa (n=65)
SD 69 * 69 24 59 74 64 4 8 43 27 13 41 7 9
Mean 415 * 415 15 55 85 100 * 7 21 32 7 30 15 10 West Bengal (n=39)
SD 151 * 151 20 81 81 81 1 5 77 41 19 66 8 18
Mean 288 66 354 24 15 41 48 9 11 26 12 3 71 12 13 Pooled (n=557) SD 176 127 303 27 41 57 56 20 8 50 32 14 108 10 16
* Indicates <1g

NNMB Rural Survey 2005-06 69 Diet & Nutritional status, HTN, DM and IDA
Table 5.10: Average consumption of Foodstuffs (g/day) among adult men ≥≥≥≥18 year - Sedentary Workers
STATE Cereals Millets Cereals
& Millets
Pulses &
Legumes
Green Leafy Veg.
Other Vege-tables
Roots &
Tubers
Nuts & Oil seeds
Condi-ments & Spices
Fruits Fish Other Flesh Foods
Milk & Milk Prod.
Fats & oils
Sugar & Jaggery
Mean 340 * 340 26 9 74 60 63 18 38 61 9 68 7 17 Kerala (n=515)
SD 92 * 92 30 28 78 62 42 12 48 68 36 74 7 8
Mean 421 2 423 47 11 49 54 8 18 45 12 5 122 14 11 Tamil Nadu (n=236)
SD 124 25 149 35 26 59 51 14 10 37 44 19 122 11 10
Mean 388 80 468 37 7 26 46 13 15 35 1 4 93 10 20 Karnataka (n=317)
SD 204 142 346 32 15 48 45 19 40 34 12 21 112 9 17
Mean 426 11 437 32 7 41 39 5 17 44 6 14 139 20 10 Andhra Pradesh (n=343) SD 155 43 198 34 19 57 45 12 12 58 24 39 130 16 12
Mean 225 127 352 35 15 37 24 11 11 14 3 8 88 26 28 Maharashtra (n=311)
SD 163 153 316 32 32 49 28 17 5 36 19 32 118 17 21
Mean 180 214 394 25 11 93 61 2 16 15 4 4 183 25 12 Gujarat (n=381)
SD 141 193 334 41 40 90 72 1 11 34 25 24 165 14 11
Mean 420 29 449 34 27 40 73 1 9 17 2 * 73 13 15 Madhya Pradesh (n=154) SD 203 91 294 49 52 58 61 4 6 30 10 5 124 18 15
Mean 468 4 472 34 42 100 116 1 9 19 13 2 21 12 10 Orissa (n=304)
SD 113 45 158 28 66 89 72 3 6 34 34 13 46 7 12
Mean 509 * 509 21 38 80 154 1 9 12 45 16 45 22 13 West Bengal (n=286)
SD 195 4 199 25 68 93 97 5 7 39 56 49 103 13 26
Mean 363 55 418 31 17 63 68 16 14 27 20 7 94 16 15
SD 185 128 313 34 43 77 72 31 17 43 47 31 123 14 16 Pooled (n=2847)
RDI - - 460 40 40 60 50 - - - - - 150 20 30

NNMB Rural Survey 2005-06 70 Diet & Nutritional status, HTN, DM and IDA
Table 5.11: Average consumption of Foodstuffs (g/day) among adult men (≥≥≥≥18 Years) - Moderate Workers
STATE Cereals Millets Cereals
& Millets
Pulses &
Legumes
Green Leafy Veg.
Other Vege-tables
Roots &
Tubers
Nuts & Oil seeds
Condi-ments & Spices
Fruits Fish Other Flesh Foods
Milk & Milk
Prod.
Fats & oils
Sugar &
Jaggery
Mean 380 * 380 24 7 59 58 59 19 38 61 6 50 6 18 Kerala (n=464)
SD 102 2 104 32 26 76 70 40 12 52 68 34 65 6 10
Mean 500 5 505 42 12 55 48 5 19 53 12 2 78 14 10 Tamil Nadu (n=673)
SD 136 33 169 34 33 59 48 10 10 41 40 10 100 10 12
Mean 429 112 541 40 9 32 46 13 14 40 2 5 84 9 18 Karnataka (n=639)
SD 230 196 426 34 20 54 44 20 8 49 16 25 115 10 17
Mean 545 25 570 32 7 42 37 5 19 51 5 18 104 19 9 Andhra Pradesh (n=702) SD 186 78 264 37 19 58 44 18 13 73 25 51 134 13 13
Mean 227 177 404 35 10 32 23 8 12 15 5 5 62 24 29 Maharashtra (n=832)
SD 193 190 383 31 26 49 28 14 6 36 24 24 88 16 27
Mean 154 273 427 24 12 89 64 2 16 17 2 3 184 24 12 Gujarat (n=861)
SD 155 225 380 34 40 94 70 3 17 38 19 24 177 16 12
Mean 440 43 483 33 16 38 64 1 9 13 1 2 62 10 9 Madhya Pradesh (n=892) SD 188 125 313 39 37 64 62 18 6 28 9 17 141 13 14
Mean 518 1 519 29 44 76 95 1 9 21 11 2 10 10 7 Orissa (n=762)
SD 93 21 114 34 65 82 75 3 7 40 31 17 36 6 11
Mean 633 1 634 19 48 79 162 1 10 12 30 13 33 18 9 West Bengal (n=647)
SD 231 15 246 28 90 100 114 5 12 50 47 44 79 11 17
Mean 415 79 494 31 18 56 65 8 14 27 12 6 77 15 13
SD 231 166 397 35 48 76 75 22 11 48 36 30 125 14 17 Pooled (n=6472)
RDI - - 520 50 40 70 60 45 - - - - 200 20 35
* Indicates <1g

NNMB Rural Survey 2005-06 71 Diet & Nutritional status, HTN, DM and IDA
Table 5.12: Average consumption of Foodstuffs (g/day) among adult women ≥18 year - NPNL Sedentary Workers
STATE Cereals Millets Cereals & Millets
Pulses &
Legumes
Green Leafy Veg.
Other Vege-tables
Roots & Tubers
Nuts & Oil seeds
Condi-ments & Spices
Fruits Fish Other Flesh Foods
Milk & Milk Prod.
Fats & oils
Sugar & Jaggery
Mean 298 * 298 21 7 53 47 51 15 32 53 7 56 6 17 Kerala (n=1083)
SD 78 1 79 26 24 67 51 35 10 42 57 30 68 6 8
Mean 351 2 353 36 10 42 41 5 15 41 9 2 105 12 11 Tamil Nadu (n=613)
SD 97 20 117 32 30 49 42 10 9 32 32 11 114 9 13
Mean 345 62 407 34 8 26 38 14 11 32 2 4 92 9 18 Karnataka (n=670)
SD 181 118 299 33 18 45 36 19 19 38 14 24 110 8 17
Mean 383 11 394 30 6 37 36 5 16 45 6 14 135 18 11 Andhra Pradesh (n=531) SD 128 42 170 32 18 50 38 13 12 63 27 32 127 14 13
Mean 181 101 282 30 11 30 20 10 10 13 3 5 68 22 31 Maharashtra (n=468)
SD 130 124 254 29 25 39 23 15 5 29 18 21 85 14 23
Mean 140 168 308 21 10 70 47 2 13 10 2 2 181 20 12 Gujarat (n=596)
SD 118 153 271 31 34 69 55 7 8 16 20 17 163 17 12
Mean 337 42 379 30 23 38 63 1 8 16 1 * 66 11 12 Madhya Pradesh (n=237) SD 164 124 288 40 49 59 57 3 5 28 10 7 116 15 12
Mean 433 2 435 30 40 76 105 1 9 19 11 2 16 10 8 Orissa (n=765)
SD 91 27 118 30 62 75 68 2 6 40 29 12 44 6 11
Mean 431 1 432 18 42 74 144 1 8 14 34 14 39 18 10 West Bengal (n=719)
SD 157 9 166 26 75 90 97 5 10 54 49 46 86 11 21
Mean 328 37 365 27 18 52 63 14 12 26 18 6 80 13 14
SD 157 97 254 31 45 67 69 26 11 43 41 27 112 12 16 Pooled (n=5682)
RDI - - 410 40 100 40 50 - - - - - 100 20 35
* Indicates <1g

NNMB Rural Survey 2005-06 72 Diet & Nutritional status, HTN, DM and IDA
Table 5.13: Average consumption of Foodstuffs (g/day) among adult women (≥≥≥≥ 18 Years) - NPNL Moderate Workers
STATE Cereals Millets Cereals & Millets
Pulses &
Legumes
Green Leafy Veg.
Other Vege-tables
Roots &
Tubers
Nuts & Oil seeds
Condi-ments & Spices
Fruits Fish Other Flesh Foods
Milk & Milk
Prod.
Fats & oils
Sugar & Jaggery
Mean 316 * 316 16 4 32 52 33 15 31 32 1 20 4 17 Kerala (n=61)
SD 77 * 77 23 16 45 57 32 10 42 45 4 42 5 7
Mean 393 7 400 30 9 41 39 3 15 41 8 1 58 10 9 Tamil Nadu (n=331)
SD 100 38 138 28 29 46 39 6 8 34 36 7 88 7 11
Mean 355 107 462 35 8 17 39 10 13 38 3 2 55 8 18 Karnataka (n=351)
SD 201 170 371 32 20 32 38 16 8 42 20 18 83 6 18
Mean 457 24 481 25 6 39 31 3 17 49 5 13 84 16 9 Andhra Pradesh (n=500) SD 153 67 220 31 19 53 36 11 12 68 26 45 118 11 11
Mean 167 167 334 32 10 26 20 8 10 13 4 4 62 20 31 Maharashtra (n=649)
SD 150 164 314 27 26 40 26 14 5 32 20 18 93 14 23
Mean 112 225 337 19 7 74 52 2 13 15 1 3 144 19 10 Gujarat (n=464)
SD 123 176 299 26 25 79 52 9 14 28 11 19 153 11 9
Mean 387 33 420 28 15 36 60 1 9 12 1 2 55 9 8 Madhya Pradesh (n=645) SD 169 99 268 29 35 55 57 17 6 26 11 19 119 10 10
Mean 471 * 471 21 48 57 67 1 8 22 6 1 5 8 5 Orissa (n=295)
SD 74 * 74 27 63 72 64 4 7 36 22 10 21 5 9
Mean 533 * 533 14 47 58 117 1 8 6 16 8 9 14 5 West Bengal (n=131)
SD 184 * 184 22 82 77 87 7 8 19 34 30 33 10 11
Mean 327 83 410 27 14 41 46 4 12 24 4 4 66 13 14
SD 201 147 348 29 37 58 52 14 9 42 23 24 112 11 17 Pooled (n=3427)
RDI - - 440 45 100 40 50 25 - - - - 150 20 20
* Indicates <1g

NNMB Rural Survey 2005-06 73 Diet & Nutritional status, HTN, DM and IDA
Table 5.14: Average consumption of Foodstuffs (g/day) among Pregnant women ≥18 year - Sedentary Workers
STATE Cereals Millets Cereals & Millets
Pulses & Legu-
mes
Green Leafy Veg.
Other Vege-tables
Roots & Tubers
Nuts & Oil seeds
Condi-ments & Spices
Fruits Fish Other Flesh Foods
Milk & Milk
Prod.
Fats & oils
Sugar & Jaggery
Mean 280 * 280 24 11 56 55 56 14 26 48 9 62 5 16 Kerala (n=25)
SD 65 * 65 28 38 74 60 34 7 44 50 29 86 3 9
Mean 366 7 373 35 12 47 48 3 17 41 13 * 127 15 13 Tamil Nadu (n=23)
SD 78 18 96 27 33 45 51 6 9 26 60 * 127 12 11
Mean 325 82 407 36 8 31 33 10 12 31 * 3 75 10 16 Karnataka (n=29)
SD 171 115 286 25 14 47 37 17 7 35 * 14 88 21 13
Mean 401 11 412 14 14 47 33 7 18 58 6 31 141 14 9 Andhra Pradesh (n=21) SD 149 35 184 29 27 44 43 12 14 80 21 69 198 8 11
Mean 209 95 304 25 10 26 19 5 10 13 12 * 68 22 26 Maharashtra (n=28)
SD 139 130 269 21 20 37 17 7 6 19 33 * 89 12 15
Mean 134 146 280 20 19 58 102 1 13 6 7 * 177 27 12 Gujarat (n=22)
SD 100 129 229 30 41 67 296 1 7 14 31 * 127 19 12
Mean 403 * 403 31 22 116 19 * 8 3 * * 22 8 13 Madhya Pradesh (n=8) SD 96 * 96 27 40 121 25 * 6 9 * * 26 6 7
Mean 411 13 424 25 38 65 99 * 9 11 14 14 22 9 5 Orissa (n=22)
SD 123 61 184 29 56 66 56 * 7 20 32 64 56 6 7
Mean 490 * 490 35 20 38 114 1 9 23 11 51 28 11 12 West Bengal (n=9)
SD 196 * 196 33 59 53 66 1 8 67 22 87 66 7 19
Mean 314 48 362 27 16 49 55 11 13 25 13 9 87 14 14 Pooled (n=187) SD 160 98 258 28 36 61 113 23 9 42 37 40 119 15 13
* Indicates <1g

NNMB Rural Survey 2005-06 74 Diet & Nutritional status, HTN, DM and IDA
Table 5.15: Average consumption of Foodstuffs (g/day) among Lactating women ≥≥≥≥18 year - Sedentary Workers
STATE Cereals Millets Cereals & Millets
Pulses &
Legumes
Green Leafy Veg.
Other Vege-tables
Roots & Tubers
Nuts & Oil seeds
Condi-ments & Spices
Fruits Fish Other Flesh Foods
Milk & Milk
Prod.
Fats & oils
Sugar & Jaggery
Mean 317 * 317 25 8 60 36 62 16 30 57 10 78 6 17 Kerala (n=52)
SD 57 * 57 27 26 68 31 36 10 37 61 46 84 6 10
Mean 425 2 427 41 8 47 44 4 16 46 8 3 84 12 11 Tamil Nadu (n=87)
SD 109 20 129 28 22 50 41 6 8 32 31 11 113 6 13
Mean 332 82 414 39 6 24 36 11 9 27 5 2 68 7 15 Karnataka (n=33)
SD 145 108 253 39 18 36 32 11 5 32 14 6 68 5 13
Mean 413 16 429 30 7 44 42 6 18 41 6 17 143 25 9 Andhra Pradesh (n=42) SD 142 50 192 33 19 52 48 12 9 50 26 39 166 13 9
Mean 176 168 344 30 9 28 19 9 10 6 4 6 66 21 33 Maharashtra (n=49)
SD 164 163 327 27 20 50 26 13 5 15 20 41 73 15 32
Mean 127 213 340 25 10 75 41 1 13 12 * 4 217 20 11 Gujarat (n=48)
SD 140 152 292 31 34 71 60 1 7 26 * 19 163 11 7
Mean 410 32 442 36 27 40 52 * 9 7 * * 41 8 10 Madhya Pradesh (n=18) SD 181 98 279 37 51 65 51 1 6 12 * * 61 6 10
Mean 465 5 470 26 36 84 103 1 8 15 6 1 9 9 7 Orissa (n=84)
SD 98 47 145 26 65 91 81 1 5 31 24 7 25 6 10
Mean 442 * 442 21 36 65 183 2 8 14 39 7 38 18 9 West Bengal (n=41)
SD 106 * 106 27 79 89 109 13 8 35 55 25 108 11 19
Mean 355 51 406 30 17 56 63 11 12 24 14 5 80 14 13 Pooled (n=454) SD 168 114 282 30 44 70 75 24 8 35 38 26 119 11 17
* Indicates <1g

NNMB Rural Survey 2005-06 75 Diet & Nutritional status, HTN, DM and IDA
Table 6.1: Average Intake of Nutrients (per day) among 1-3 year Boys and Girls
STATE Protein (g)
Total Fat (g)
Energy (Kcal)
Calcium (mg)
Iron (mg)
Vit.-A (µg)
Thiamin (mg)
Riboflavin (mg)
Niacin (mg)
Vit.-C (mg)
Free Folic Acid (µg)
Median 16.3 12.8 607 184 3.5 49 .3 .2 4.3 9 16.0 Mean 18.1 14.0 653 223 4.4 69 .3 .3 4.6 13 17.5
Kerala (n=170) SD 9.1 8.8 262 176 3.4 78 .2 .2 2.3 16 9.4
Median 17.4 8.6 691 198 3.1 79 .4 .3 4.9 13 23.1 Mean 17.9 11.7 680 283 3.7 144 .4 .4 5.1 18 26.2
Tamil Nadu (n=250) SD 8.0 10.2 254 265 3.1 169 .2 .4 2.4 20 14.6
Median 16.9 8.2 653 164 3.3 60 .3 .2 3.6 8 14.5 Mean 18.1 9.6 681 220 3.9 78 .4 .3 3.9 11 16.7
Karnataka (n=165) SD 8.5 6.7 300 199 2.9 70 .2 .2 2.2 14 9.6
Median 19.6 11.9 876 172 3.3 53 .3 .3 4.5 8 15.4 Mean 21.6 15.1 917 237 3.8 130 .3 .3 4.8 16 18.2
Andhra Pradesh (n=176) SD 10.6 12.1 423 215 2.5 270 .2 .2 2.7 29 12.1
Median 20.4 10.6 694 185 4.8 59 .4 .3 3.9 4 17.5 Mean 20.9 12.9 699 277 6.0 113 .5 .3 4.4 7 19.1
Maharashtra (n=266) SD 11.1 10.0 327 262 5.1 164 .3 .2 2.9 8 12.9
Median 17.8 10.0 536 194 6.5 64 .4 .3 3.3 7 18.7 Mean 20.7 12.6 627 272 8.6 97 .6 .4 4.2 11 24.8
Gujarat (n=165) SD 14.3 10.9 416 253 7.7 129 .4 .3 3.1 13 18.9
Median 20.9 5.7 717 129 6.4 46 .5 .3 5.5 7 13.9 Mean 22.5 8.0 756 171 7.2 80 .6 .3 6.0 14 16.2
Madhya Pradesh (n=329)
SD 11.6 9.4 370 175 5.1 134 .5 .2 3.5 20 12.0 Median 17.1 2.7 661 115 5.1 32 .4 .2 6.3 18 18.6 Mean 17.8 4.8 677 185 6.6 230 .5 .2 6.4 31 20.7
Orissa (n=241) SD 8.5 4.5 266 212 5.1 542 .2 .2 3.0 42 11.7
Median 21.4 6.6 738 298 4.7 93 .5 .3 6.6 19 21.8 Mean 23.0 10.4 776 382 6.2 220 .5 .4 6.6 28 24.7
West Bengal (n=186)
SD 11.7 10.0 299 361 6.4 405 .2 .4 3.3 34 16.4 Median 18.6 7.9 687 161 4.3 56 .4 .3 4.7 9 17.7 Mean 20.2 10.7 719 245 5.7 129 .5 .3 5.2 17 20.3
SD 10.7 9.9 336 246 5.1 272 .3 .3 3.0 25 13.7 Pooled (n=1948)
RDA 22 - 1240 400 12 400 0.6 0.7 8 30 30

NNMB Rural Survey 2005-06 76 Diet & Nutritional status, HTN, DM and IDA
Table 6.2: Average Intake of Nutrients (per day) among 4-6 year Boys and Girls
STATE Protein (g)
Total Fat (g)
Energy (Kcal)
Calcium (mg)
Iron (mg)
Vit.-A (µg)
Thiamin (mg)
Riboflavin (mg)
Niacin (mg)
Vit.-C (mg)
Free Folic Acid (µg)
Median 26.8 18.2 963 220 6.1 53 .5 .3 6.8 13 24.4 Mean 28.3 20.7 989 290 7.1 102 .5 .3 7.4 20 26.5
Kerala (n=173) SD 11.8 13.1 268 223 4.5 176 .2 .2 2.8 20 12.5
Median 23.5 9.5 944 204 4.5 90 .6 .3 8.2 18 32.6 Mean 23.8 10.7 945 246 5.3 136 .6 .4 8.2 25 33.3
Tamil Nadu (n=210) SD 7.2 6.6 249 192 2.8 169 .2 .2 2.7 23 12.1
Median 24.8 9.8 951 216 5.8 73 .5 .3 5.7 11 22.6 Mean 25.8 11.8 974 267 6.7 104 .6 .4 6.0 15 24.6
Karnataka (n=182) SD 9.7 7.7 328 199 4.6 92 .3 .2 2.7 15 12.8
Median 26.8 15.4 1107 205 4.5 67 .4 .3 6.1 12 21.2 Mean 28.3 17.3 1201 249 5.1 168 .4 .4 6.6 22 25.1
Andhra Pradesh (n=178)
SD 10.3 10.0 409 190 2.8 333 .2 .2 2.7 36 14.3 Median 29.6 13.5 1008 203 8.7 68 .7 .4 7.0 8 27.6 Mean 31.8 16.3 1062 298 10.2 131 .8 .4 7.7 13 29.0
Maharashtra (n=272) SD 14.8 14.0 410 307 5.8 206 .4 .3 3.6 17 15.5
Median 25.4 13.7 791 235 9.5 87 .7 .4 4.9 13 29.0 Mean 27.0 16.9 832 305 12.1 115 .8 .5 5.9 20 34.0
Gujarat (n=254) SD 14.7 12.7 425 221 9.5 126 .5 .3 4.1 21 21.7
Median 32.6 7.5 1064 169 9.1 56 .7 .4 7.9 11 21.3 Mean 33.8 10.2 1106 219 10.6 112 .8 .4 8.8 19 24.4
Madhya Pradesh (n=324)
SD 12.5 10.9 376 199 6.0 212 .5 .2 3.8 25 16.0 Median 24.2 3.1 950 180 7.1 43 .6 .3 9.5 27 28.3 Mean 24.9 5.1 983 243 8.9 380 .7 .3 9.5 46 30.2
Orissa (n=233) SD 8.5 4.3 269 222 5.9 765 .2 .2 3.2 47 13.3
Median 28.1 4.2 1041 219 7.3 64 .7 .3 10.7 33 27.4 Mean 30.8 7.8 1090 341 8.3 250 .7 .4 10.7 50 31.6
West Bengal (n=214)
SD 13.9 8.6 325 312 5.0 551 .3 .3 3.6 55 16.2 Median 26.5 9.7 978 202 6.8 66 .6 .3 7.4 15 26.1 Mean 28.7 12.7 1020 272 8.6 166 .7 .4 7.9 25 28.8
SD 12.5 11.4 365 238 6.2 370 .4 .2 3.7 34 15.9 Pooled (n=2040)
RDA 30 - 1690 400 18 400 0.9 1 11 40 40

NNMB Rural Survey 2005-06 77 Diet & Nutritional status, HTN, DM and IDA
Table 6.3: Average Intake of Nutrients (per day) among 7-9 year Boys and Girls
STATE Protein (g)
Total Fat (g)
Energy (Kcal)
Calcium (mg)
Iron (mg)
Vit.-A (µg)
Thiamin (mg)
Riboflavin (mg)
Niacin (mg)
Vit.-C (mg)
Free Folic Acid (µg)
Median 30.6 20.6 1106 269 7.3 54 .6 .3 8.0 15 27.3 Mean 31.3 21.8 1131 313 7.7 102 .6 .4 8.4 24 30.2
Kerala (n=163) SD 10.5 12.6 279 239 3.7 152 .2 .2 2.6 25 11.9
Median 27.3 9.9 1110 221 5.6 91 .7 .4 10.2 22 38.0 Mean 28.1 11.6 1129 251 6.5 132 .7 .4 10.1 28 38.3
Tamil Nadu (n=202) SD 8.1 6.5 264 180 3.1 172 .2 .2 2.9 23 11.4
Median 31.7 10.7 1205 239 7.1 74 .7 .4 7.4 13 27.6 Mean 31.9 13.2 1225 313 8.3 103 .7 .4 7.7 17 30.0
Karnataka (n=171) SD 10.8 9.3 388 249 4.9 100 .3 .2 3.0 20 14.0
Median 31.4 16.7 1354 219 5.6 77 .5 .4 7.5 16 26.7 Mean 33.8 20.3 1432 264 6.2 207 .5 .4 8.1 26 30.5
Andhra Pradesh (n=215)
SD 13.1 14.3 470 191 3.1 372 .3 .2 3.2 34 15.6
Median 34.3 16.3 1212 210 11.5 81 .9 .5 9.0 9 35.3 Mean 35.9 18.9 1240 306 12.4 160 1.0 .5 9.3 14 36.6
Maharashtra (n=246) SD 12.9 13.8 389 260 6.5 232 .4 .2 3.9 15 15.8
Median 30.2 16.6 901 259 12.5 100 .9 .5 6.5 19 35.5 Mean 33.0 19.1 1006 360 15.3 137 1.0 .6 7.3 26 40.7
Gujarat (n=228)
SD 13.7 11.5 412 287 11.7 161 .4 .3 3.2 22 20.9 Median 38.7 8.2 1261 194 11.4 69 .8 .4 9.5 15 28.4 Mean 40.2 11.3 1298 237 12.4 137 1.0 .5 10.3 25 31.4
Madhya Pradesh (n=304)
SD 14.9 9.7 417 207 7.6 221 .6 .2 4.2 30 19.4
Median 29.5 4.6 1248 191 7.9 50 .8 .3 12.8 33 36.9 Mean 30.5 6.8 1262 262 10.5 429 .8 .3 12.6 53 38.0
Orissa (n=239) SD 8.5 5.6 278 199 6.9 885 .3 .2 3.6 57 15.6
Median 33.5 5.5 1251 254 8.4 69 .8 .3 12.4 36 32.8 Mean 35.3 8.4 1303 349 9.7 357 .8 .4 12.9 52 36.8
West Bengal (n=196)
SD 13.9 7.7 381 324 5.6 797 .3 .3 4.4 48 18.6 Median 31.5 10.9 1199 224 8.2 75 .8 .4 9.2 18 32.6 Mean 33.8 14.4 1230 291 10.2 199 .8 .4 9.7 29 34.9
SD 12.7 11.7 392 243 7.2 457 .4 .2 4.0 36 16.9 Pooled (n=1964)
RDA 41 - 1950 400 26 600 1.0 1.2 13 40 60

NNMB Rural Survey 2005-06 78 Diet & Nutritional status, HTN, DM and IDA
Table 6.4: Average Intake of Nutrients (per day) among 10-12 year Boys
STATE Protein
(g) Total Fat
(g) Energy (Kcal)
Calcium (mg)
Iron (mg)
Vit.-A (µg)
Thiamin (mg)
Riboflavin (mg)
Niacin (mg)
Vit.-C (mg)
Free Folic Acid (µg)
Median 34.6 22.7 1188 290 7.8 71 .6 .4 9.1 17 33.9 Mean 37.3 25.0 1306 319 8.6 128 .7 .4 9.7 26 36.4
Kerala (n=86) SD 13.0 15.5 336 196 4.5 170 .2 .2 2.8 23 15.2
Median 32.1 11.6 1259 257 6.4 100 .9 .4 11.9 23 43.4 Mean 32.6 13.6 1289 296 7.4 159 .9 .5 11.6 30 44.9
Tamil Nadu (n=88) SD 9.7 8.6 300 195 3.6 151 .2 .2 3.3 22 13.5
Median 34.8 11.8 1365 282 8.4 99 .8 .5 8.1 19 31.5 Mean 37.7 14.1 1425 353 10.6 162 .9 .5 9.2 22 36.8
Karnataka (n=101) SD 16.3 8.9 502 261 8.5 363 .5 .3 4.5 20 22.5
Median 37.0 21.8 1623 251 6.6 95 .6 .5 9.1 21 34.2 Mean 39.6 23.7 1684 306 7.7 230 .6 .5 9.5 32 37.3
Andhra Pradesh (n=102) SD 15.5 16.2 532 212 5.1 411 .3 .3 3.6 40 18.7
Median 41.2 17.2 1372 224 14.3 80 1.0 .5 10.3 10 39.5 Mean 42.0 20.4 1400 312 14.5 143 1.1 .6 11.0 16 43.0
Maharashtra (n=144) SD 15.7 16.5 436 274 7.4 181 .6 .3 4.6 20 20.4
Median 34.7 19.4 1058 306 14.8 132 1.0 .6 7.4 21 42.9 Mean 40.4 23.8 1209 437 19.5 153 1.1 .7 8.4 34 48.7
Gujarat (n=107) SD 18.2 17.8 523 431 17.7 107 .5 .4 3.5 33 25.9
Median 45.0 10.1 1442 218 13.2 90 .9 .5 11.4 16 32.9 Mean 44.4 13.3 1442 269 13.5 154 1.1 .5 11.4 25 34.7
Madhya Pradesh (n=161) SD 14.4 14.1 429 221 7.0 193 .6 .2 4.2 27 19.9
Median 34.4 4.6 1454 195 8.9 60 .9 .4 14.6 37 41.5 Mean 34.9 7.0 1450 314 11.5 469 1.0 .4 14.5 60 42.7
Orissa (n=126) SD 9.2 5.6 266 302 8.2 1096 .3 .2 3.8 58 14.7
Median 40.0 4.8 1523 340 10.3 53 1.0 .4 15.6 42 38.1 Mean 39.7 8.2 1552 393 11.7 364 1.0 .4 15.8 69 42.9
West Bengal (n=115)
SD 12.4 8.1 402 339 6.6 730 .3 .3 4.7 78 19.9 Median 36.6 12.3 1387 247 9.6 90 .9 .5 10.7 21 38.1 Mean 39.2 16.2 1423 330 12.0 221 .9 .5 11.4 35 40.7
SD 14.5 14.6 442 285 9.2 513 .5 .3 4.6 44 19.9 Pooled (n=1030)
RDA 54 - 2190 600 34 600 1.1 1.3 15 40 70

NNMB Rural Survey 2005-06 79 Diet & Nutritional status, HTN, DM and IDA
Table 6.5: Average Intake of Nutrients (per day) among 10-12 year Girls
STATE Protein (g)
Total Fat (g)
Energy (Kcal)
Calcium (mg)
Iron (mg)
Vit.-A (µg)
Thiamin (mg)
Riboflavin (mg)
Niacin (mg)
Vit.-C (mg)
Free Folic Acid (µg)
Median 30.7 22.1 1224 235 6.8 51 .7 .3 9.4 18 32.6 Mean 33.8 24.5 1242 292 8.2 118 .7 .4 9.5 24 33.9
Kerala (n=66) SD 12.3 16.6 299 219 5.0 204 .2 .2 2.6 22 13.7
Median 29.7 9.9 1217 218 6.5 86 .8 .4 10.8 22 38.5 Mean 30.2 11.0 1246 247 7.8 116 .8 .4 11.5 27 40.6
Tamil Nadu (n=88) SD 8.8 7.9 326 190 4.3 119 .2 .1 3.4 20 13.4
Median 34.4 12.5 1311 227 7.7 83 .7 .4 8.5 15 28.0 Mean 36.2 14.4 1359 361 10.0 153 .8 .5 8.7 17 32.0
Karnataka (n=91) SD 14.4 9.1 464 351 7.7 365 .5 .2 3.8 12 16.7
Median 36.5 19.5 1656 233 7.2 86 .5 .5 9.6 22 31.3 Mean 39.6 22.2 1700 286 7.4 251 .6 .5 9.7 29 34.2
Andhra Pradesh (n=106) SD 13.0 12.8 497 201 3.0 434 .3 .2 3.5 33 15.3
Median 38.8 13.1 1316 205 13.0 73 1.1 .5 10.4 9 40.2 Mean 39.8 17.0 1371 291 14.3 132 1.1 .6 10.7 16 41.4
Maharashtra (n=119) SD 14.0 12.0 430 245 7.1 156 .5 .2 4.2 20 16.7
Median 34.7 20.6 1059 299 14.2 118 1.0 .6 7.8 20 41.4 Mean 38.3 22.2 1192 385 18.0 132 1.1 .7 8.5 29 46.6
Gujarat (n=110) SD 17.0 12.6 501 245 14.7 65 .5 .4 3.7 26 24.6
Median 39.3 7.5 1354 171 10.1 66 .8 .4 9.9 15 28.8 Mean 42.2 11.0 1393 240 12.6 160 1.0 .5 11.0 26 34.2
Madhya Pradesh (n=139)
SD 15.6 9.9 428 244 7.8 303 .7 .3 4.5 34 23.1 Median 33.0 5.8 1390 217 8.6 58 .9 .3 14.3 34 41.0 Mean 33.8 7.3 1408 275 10.6 381 .9 .4 14.0 62 43.6
Orissa (n=115) SD 8.5 5.6 241 206 6.5 705 .3 .1 3.5 76 16.8
Median 39.6 5.2 1515 295 10.7 63 1.0 .4 15.5 38 40.9 Mean 42.1 8.2 1515 399 11.5 353 1.0 .5 15.5 60 44.8
West Bengal (n=108)
SD 16.9 7.1 448 333 5.5 699 .4 .3 5.2 70 22.9 Median 35.1 11.3 1337 228 9.2 79 .9 .4 10.5 20 36.7 Mean 37.8 14.8 1389 307 11.5 205 .9 .5 11.1 33 39.3
SD 14.3 12.1 440 259 8.3 425 .5 .3 4.5 45 19.6 Pooled (n=942)
RDA 57 - 1970 600 19 600 1.0 1.2 13 40 70

NNMB Rural Survey 2005-06 80 Diet & Nutritional status, HTN, DM and IDA
Table 6.6: Average Intake of Nutrients (per day) among 13-15 year Boys
STATE Protein
(g) Total Fat
(g) Energy (Kcal)
Calcium (mg)
Iron (mg)
Vit.-A (µg)
Thiamin (mg)
Riboflavin (mg)
Niacin (mg)
Vit.-C (mg)
Free Folic Acid (µg)
Median 38.4 27.3 1566 323 9.3 75 .8 .5 11.7 26 42.4 Mean 41.6 31.9 1592 382 10.5 177 .8 .5 12.2 36 46.3
Kerala (n=91) SD 15.4 17.2 385 247 5.7 303 .3 .2 3.7 31 21.2
Median 35.8 12.7 1476 257 7.9 94 1.0 .4 14.4 28 45.5 Mean 37.3 14.6 1524 312 8.9 179 1.0 .5 14.3 38 48.6
Tamil Nadu (n=97) SD 10.5 9.2 406 242 4.8 297 .3 .2 4.6 41 15.5
Median 40.8 13.2 1627 300 9.4 103 .8 .5 9.7 19 34.7 Mean 41.9 15.7 1610 438 12.3 121 1.0 .6 10.1 22 39.5
Karnataka (n=100) SD 14.7 10.4 514 434 9.0 83 .6 .3 4.2 13 20.8
Median 45.6 21.9 1996 275 7.6 98 .6 .5 11.4 27 36.2 Mean 48.5 25.8 2042 356 8.5 212 .7 .6 11.5 33 41.0
Andhra Pradesh (n=97) SD 19.4 16.4 686 269 4.5 349 .5 .2 4.5 34 21.5
Median 46.2 18.7 1596 272 17.7 104 1.5 .7 13.3 11 50.7 Mean 48.4 22.7 1618 357 17.6 213 1.4 .7 13.2 21 51.6
Maharashtra (n=122) SD 16.1 16.3 460 287 7.7 291 .6 .3 5.5 25 20.6
Median 42.2 19.1 1290 308 15.3 132 1.3 .7 9.4 21 54.0 Mean 45.3 21.4 1343 422 19.6 150 1.3 .8 10.7 33 56.0
Gujarat (n=108) SD 23.0 13.6 635 284 13.1 116 .9 .4 7.5 32 29.0
Median 46.0 10.7 1531 209 13.3 93 1.0 .5 12.2 13 35.4 Mean 48.0 14.3 1583 311 14.6 188 1.2 .6 12.4 24 39.1
Madhya Pradesh (n=145)
SD 17.6 13.9 482 334 7.7 347 .7 .3 4.9 33 22.8 Median 38.3 8.0 1766 206 9.6 57 1.1 .4 18.5 42 49.5 Mean 40.2 9.4 1740 312 11.6 372 1.2 .4 17.8 61 51.8
Orissa (n=105) SD 11.4 7.7 347 353 6.0 687 .3 .2 4.1 52 15.8
Median 45.6 4.9 1748 367 12.3 94 1.2 .5 18.4 48 50.2 Mean 47.9 9.6 1859 412 13.4 354 1.3 .5 19.3 80 54.5
West Bengal (n=78)
SD 14.2 10.6 488 314 7.3 627 .5 .2 6.2 87 24.8 Median 42.4 14.6 1611 266 11.0 95 1.0 .5 12.6 23 44.1 Mean 44.6 18.3 1645 363 13.3 215 1.1 .6 13.3 37 47.3
SD 16.8 14.9 531 316 8.6 390 .6 .3 5.8 45 22.5 Pooled (n=943)
RDA 70 - 2450 600 41 600 1.2 1.5 16 40 100

NNMB Rural Survey 2005-06 81 Diet & Nutritional status, HTN, DM and IDA
Table 6.7: Average Intake of Nutrients (per day) among 13-15 year Girls
STATE Protein
(g) Total Fat
(g) Energy (Kcal)
Calcium (mg)
Iron (mg)
Vit.-A (µg) Thiamin
(mg) Riboflavin
(mg) Niacin (mg)
Vit.-C (mg)
Free Folic Acid (µg)
Median 37.9 25.9 1424 268 8.3 63 .7 .4 10.6 22 38.0 Mean 39.8 27.7 1439 365 9.8 112 .8 .4 11.2 31 40.2
Kerala (n=97) SD 14.8 16.0 313 297 5.4 168 .2 .2 3.0 29 17.8
Median 32.7 12.4 1465 208 7.2 90 1.0 .4 14.0 26 47.1 Mean 34.6 14.2 1449 263 8.4 139 1.0 .4 13.8 34 47.6
Tamil Nadu (n=90) SD 11.0 9.6 318 195 4.2 186 .3 .2 4.0 30 12.9
Median 38.2 13.1 1527 327 10.2 122 .9 .6 8.5 19 32.0 Mean 40.5 15.0 1536 425 12.0 204 1.0 .6 9.5 23 39.9
Karnataka (n=94)
SD 17.8 10.2 563 322 9.0 376 .6 .3 4.5 24 25.9 Median 41.2 21.8 1780 253 7.2 106 .6 .5 10.6 25 33.1 Mean 42.5 24.9 1835 311 8.2 271 .7 .5 10.7 31 35.4
Andhra Pradesh (n=89) SD 12.6 15.4 496 215 3.9 510 .4 .2 3.9 28 15.9
Median 44.9 17.8 1484 224 15.5 92 1.2 .6 11.0 11 45.3 Mean 45.8 21.2 1526 297 16.2 167 1.3 .6 12.2 19 48.5
Maharashtra (n=136)
SD 16.3 14.4 462 214 7.6 225 .5 .2 4.9 20 21.2 Median 44.6 23.8 1307 334 17.1 165 1.2 .8 9.6 21 50.6 Mean 45.3 26.4 1362 466 22.6 201 1.2 .8 9.6 30 54.1
Gujarat (n=92) SD 16.4 14.7 431 318 13.8 271 .4 .3 2.9 28 27.2
Median 45.2 12.7 1532 243 13.0 101 .9 .5 11.6 23 33.5 Mean 45.7 16.6 1569 297 14.4 181 1.1 .6 12.6 35 37.9
Madhya Pradesh (n=106)
SD 15.6 17.0 446 218 7.5 308 .7 .3 5.2 40 24.5 Median 37.4 5.6 1646 237 9.9 74 1.1 .4 17.0 45 46.7 Mean 37.9 7.4 1647 309 12.2 625 1.1 .4 16.7 68 49.6
Orissa (n=133) SD 8.2 5.1 261 255 7.1 1148 .3 .1 3.8 68 17.5
Median 44.0 4.8 1638 290 10.8 56 1.1 .4 16.9 40 44.0 Mean 45.8 8.1 1764 376 11.9 251 1.2 .5 17.6 66 49.8
West Bengal (n=76)
SD 15.8 10.2 579 314 5.4 542 .4 .2 6.4 67 22.6 Median 39.8 13.7 1533 261 10.7 94 1.0 .5 12.1 23 41.9 Mean 42.0 17.8 1566 341 13.0 251 1.0 .5 12.7 37 45.0
SD 14.9 14.8 453 268 8.6 559 .5 .3 5.1 44 21.8
Pooled (n=913)
RDA 65 - 2060 600 28 600 1.0 1.2 14 40 100
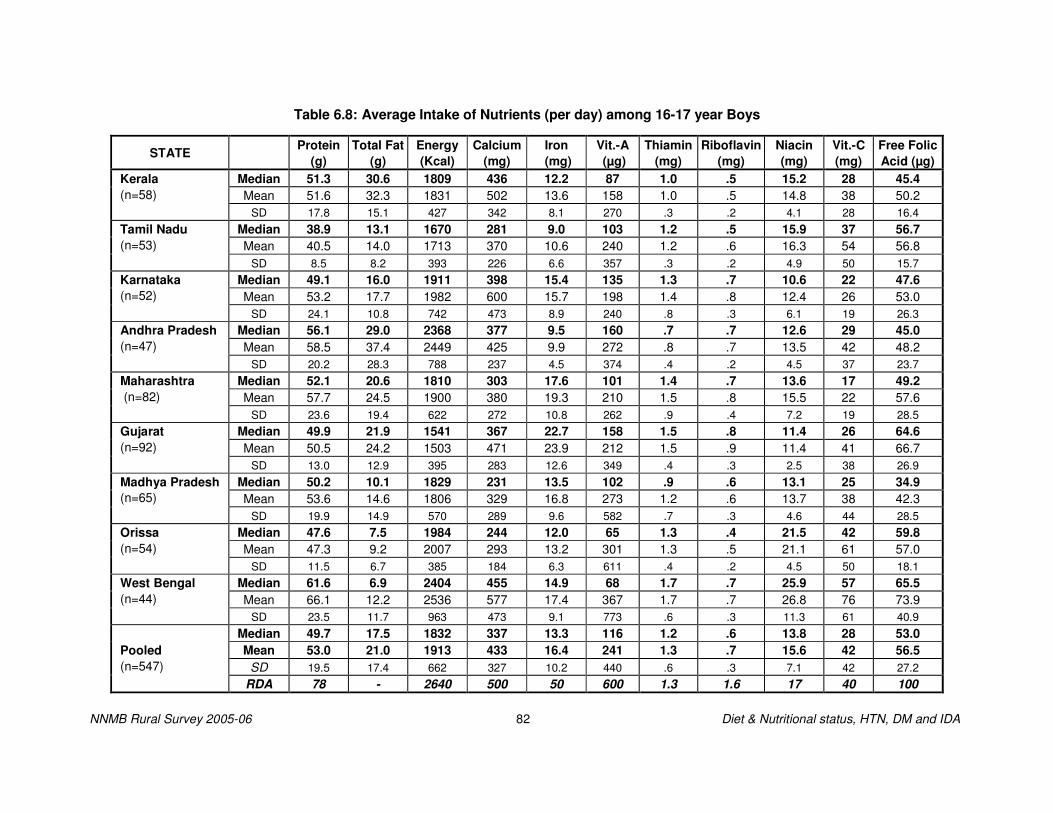
NNMB Rural Survey 2005-06 82 Diet & Nutritional status, HTN, DM and IDA
Table 6.8: Average Intake of Nutrients (per day) among 16-17 year Boys
STATE Protein (g)
Total Fat (g)
Energy (Kcal)
Calcium (mg)
Iron (mg)
Vit.-A (µg)
Thiamin (mg)
Riboflavin (mg)
Niacin (mg)
Vit.-C (mg)
Free Folic Acid (µg)
Median 51.3 30.6 1809 436 12.2 87 1.0 .5 15.2 28 45.4 Mean 51.6 32.3 1831 502 13.6 158 1.0 .5 14.8 38 50.2
Kerala (n=58) SD 17.8 15.1 427 342 8.1 270 .3 .2 4.1 28 16.4
Median 38.9 13.1 1670 281 9.0 103 1.2 .5 15.9 37 56.7 Mean 40.5 14.0 1713 370 10.6 240 1.2 .6 16.3 54 56.8
Tamil Nadu (n=53) SD 8.5 8.2 393 226 6.6 357 .3 .2 4.9 50 15.7
Median 49.1 16.0 1911 398 15.4 135 1.3 .7 10.6 22 47.6 Mean 53.2 17.7 1982 600 15.7 198 1.4 .8 12.4 26 53.0
Karnataka (n=52) SD 24.1 10.8 742 473 8.9 240 .8 .3 6.1 19 26.3
Median 56.1 29.0 2368 377 9.5 160 .7 .7 12.6 29 45.0 Mean 58.5 37.4 2449 425 9.9 272 .8 .7 13.5 42 48.2
Andhra Pradesh (n=47) SD 20.2 28.3 788 237 4.5 374 .4 .2 4.5 37 23.7
Median 52.1 20.6 1810 303 17.6 101 1.4 .7 13.6 17 49.2 Mean 57.7 24.5 1900 380 19.3 210 1.5 .8 15.5 22 57.6
Maharashtra (n=82) SD 23.6 19.4 622 272 10.8 262 .9 .4 7.2 19 28.5
Median 49.9 21.9 1541 367 22.7 158 1.5 .8 11.4 26 64.6 Mean 50.5 24.2 1503 471 23.9 212 1.5 .9 11.4 41 66.7
Gujarat (n=92) SD 13.0 12.9 395 283 12.6 349 .4 .3 2.5 38 26.9
Median 50.2 10.1 1829 231 13.5 102 .9 .6 13.1 25 34.9 Mean 53.6 14.6 1806 329 16.8 273 1.2 .6 13.7 38 42.3
Madhya Pradesh (n=65) SD 19.9 14.9 570 289 9.6 582 .7 .3 4.6 44 28.5
Median 47.6 7.5 1984 244 12.0 65 1.3 .4 21.5 42 59.8 Mean 47.3 9.2 2007 293 13.2 301 1.3 .5 21.1 61 57.0
Orissa (n=54) SD 11.5 6.7 385 184 6.3 611 .4 .2 4.5 50 18.1
Median 61.6 6.9 2404 455 14.9 68 1.7 .7 25.9 57 65.5 Mean 66.1 12.2 2536 577 17.4 367 1.7 .7 26.8 76 73.9
West Bengal (n=44)
SD 23.5 11.7 963 473 9.1 773 .6 .3 11.3 61 40.9 Median 49.7 17.5 1832 337 13.3 116 1.2 .6 13.8 28 53.0 Mean 53.0 21.0 1913 433 16.4 241 1.3 .7 15.6 42 56.5
SD 19.5 17.4 662 327 10.2 440 .6 .3 7.1 42 27.2 Pooled (n=547)
RDA 78 - 2640 500 50 600 1.3 1.6 17 40 100

NNMB Rural Survey 2005-06 83 Diet & Nutritional status, HTN, DM and IDA
Table 6.9: Average Intake of Nutrients (per day) among 16-17 year Girls
STATE Protein (g)
Total Fat (g)
Energy (Kcal)
Calcium (mg)
Iron (mg)
Vit.-A (µg)
Thiamin (mg)
Riboflavin (mg)
Niacin (mg)
Vit.-C (mg)
Free Folic Acid (µg)
Median 39.1 28.8 1539 343 9.8 68 .8 .4 11.9 19 39.6 Mean 42.0 30.5 1572 372 10.6 140 .8 .5 12.2 29 41.1
Kerala (n=66) SD 12.7 17.1 347 189 4.7 240 .2 .2 3.3 28 11.5
Median 40.0 13.2 1593 307 8.3 99 1.1 .5 14.4 24 51.4 Mean 40.3 14.6 1604 347 9.3 132 1.1 .5 14.6 35 48.8
Tamil Nadu (n=49) SD 11.8 8.6 358 208 3.9 214 .3 .2 4.2 42 13.1
Median 39.6 13.5 1577 296 9.1 110 .8 .6 8.9 20 39.2 Mean 41.4 16.8 1634 472 11.3 151 1.0 .6 9.7 25 42.6
Karnataka (n=63) SD 15.1 11.1 572 571 7.7 120 .7 .3 3.6 19 18.0
Median 41.9 19.7 1782 215 7.2 97 .6 .5 10.2 26 35.8 Mean 41.4 23.4 1785 287 7.5 193 .6 .5 10.1 31 38.1
Andhra Pradesh (n=57) SD 13.5 14.8 573 204 2.9 309 .2 .2 3.4 28 17.8
Median 44.7 18.9 1536 231 16.0 106 1.2 .6 11.9 11 46.7 Mean 44.6 20.8 1509 319 16.6 212 1.3 .6 12.3 22 48.5
Maharashtra (n=80) SD 16.7 11.4 492 260 7.9 344 .5 .3 5.1 31 20.9
Median 47.6 22.5 1525 319 20.5 163 1.4 .9 10.0 22 63.1 Mean 48.2 25.0 1448 472 21.6 172 1.4 .9 10.1 29 59.4
Gujarat (n=81) SD 13.3 13.6 415 322 10.6 87 .4 .3 2.6 24 22.1
Median 48.3 12.0 1676 254 13.3 98 .9 .6 11.6 19 37.3 Mean 48.3 16.2 1686 310 14.9 211 1.1 .6 12.6 36 39.1
Madhya Pradesh (n=57) SD 16.4 14.9 523 212 9.3 331 .7 .3 4.8 43 21.3
Median 42.1 8.1 1804 226 10.1 92 1.2 .4 19.2 43 50.3 Mean 42.5 9.2 1815 325 12.2 488 1.2 .5 18.7 83 53.6
Orissa (n=65) SD 9.8 7.7 261 353 5.8 902 .3 .2 3.6 95 15.2
Median 45.5 6.8 1872 400 11.4 169 1.1 .6 16.1 47 48.2 Mean 44.6 7.8 1769 446 12.9 891 1.1 .6 17.7 70 53.1
West Bengal (n=39)
SD 12.0 5.1 544 287 6.5 1559 .5 .3 7.2 68 26.4 Median 43.1 15.9 1618 281 11.2 106 1.0 .5 11.9 24 45.4 Mean 43.9 19.1 1630 373 13.5 261 1.1 .6 12.8 38 47.5
SD 14.0 14.1 474 320 8.4 593 .5 .3 5.1 50 20.1 Pooled (n=557)
RDA 63 - 2060 500 30 600 1.0 1.2 14 40 100

NNMB Rural Survey 2005-06 84 Diet & Nutritional status, HTN, DM and IDA
Table 6.10: Average Intake of Nutrients (per day) among adult men (≥≥≥≥18 years) - Sedentary Workers
STATE Protein (g)
Total Fat (g)
Energy (Kcal)
Calcium (mg)
Iron (mg)
Vit.-A (µg)
Thiamin (mg)
Riboflavin (mg)
Niacin (mg)
Vit.-C (mg)
Free Folic Acid (µg)
Median 51.1 38.4 1937 427 12.6 101 1.0 .6 14.9 34 51.8 Mean 52.9 41.1 1935 519 13.7 176 1.1 .6 15.3 49 55.7
Kerala (n=515) SD 18.1 20.7 472 394 6.4 281 .3 .2 4.3 42 20.7
Median 48.9 18.1 1995 386 10.2 164 1.3 .7 17.8 34 65.7 Mean 50.7 22.1 1995 462 12.4 224 1.3 .7 18.3 51 67.8
Tamil Nadu (n=236) SD 17.3 14.6 517 428 8.4 258 .4 .3 6.0 48 23.1
Median 50.7 17.4 2011 441 13.6 138 1.2 .7 11.5 23 48.0 Mean 53.4 21.5 2071 642 15.9 181 1.3 .8 12.5 27 52.0
Karnataka (n=317) SD 19.9 14.7 745 540 11.0 157 .7 .3 5.4 20 25.8
Median 49.0 29.4 2079 386 8.3 146 .7 .6 11.2 28 39.6 Mean 50.8 34.6 2128 479 9.3 246 .7 .6 11.9 34 44.5
Andhra Pradesh (n=343)
SD 18.1 20.9 635 341 4.3 324 .3 .2 4.4 28 20.7 Median 52.6 23.4 1721 335 18.2 121 1.4 .7 14.1 18 53.2 Mean 53.8 29.7 1791 428 18.7 240 1.5 .8 14.8 30 56.4
Maharashtra (n=311) SD 19.6 22.8 577 300 8.5 308 .7 .3 6.3 33 23.1
Median 61.0 26.0 1839 508 28.4 188 1.8 1.1 15.2 36 72.1 Mean 63.2 30.7 1880 594 29.2 285 1.9 1.1 15.1 49 80.2
Gujarat (n=381) SD 18.7 19.0 521 309 13.1 501 .6 .4 4.8 43 36.2
Median 54.2 14.2 1881 284 15.5 126 1.2 .6 14.7 24 45.1 Mean 58.0 20.8 1989 372 17.8 305 1.4 .7 15.3 47 48.2
Madhya Pradesh (n=154) SD 23.1 23.7 671 268 10.8 542 .8 .3 6.3 53 28.5
Median 51.2 7.9 2052 318 15.2 98 1.4 .5 21.4 58 59.6 Mean 51.1 11.3 2049 428 18.2 441 1.4 .6 21.0 82 60.2
Orissa (n=304) SD 13.0 9.5 423 357 11.2 751 .4 .2 5.3 76 18.0
Median 57.7 8.4 2188 458 14.9 86 1.4 .6 21.5 57 58.6 Mean 59.9 13.8 2233 572 16.0 386 1.5 .6 22.3 82 63.3
West Bengal (n=286)
SD 20.6 13.2 706 486 7.8 722 .6 .3 8.2 76 30.7 Median 53.3 21.9 1964 398 14.1 132 1.3 .7 15.3 33 55.3 Mean 54.8 26.9 2000 511 16.9 267 1.3 .7 16.1 50 59.1
SD 19.0 20.7 595 399 10.8 463 .6 .3 6.5 52 27.6 Pooled (n=2847)
RDA 60 - 2425 400 28 600 1.2 1.4 16 40 100

NNMB Rural Survey 2005-06 85 Diet & Nutritional status, HTN, DM and IDA
Table 6.11: Average Intake of Nutrients (per day) among adult men (≥≥≥≥18 Years) - Moderate Workers
STATE Protein (g)
Total Fat (g)
Energy (Kcal)
Calcium (mg)
Iron (mg)
Vit.-A (µg)
Thiamin (mg)
Riboflavin (mg)
Niacin (mg)
Vit.-C (mg)
Free Folic Acid (µg)
Median 52.4 35.7 1997 378 12.4 82 1.1 .5 16.2 28 52.2 Mean 54.0 37.6 2026 492 14.1 164 1.1 .6 16.6 42 55.8
Kerala (n=464) SD 18.9 19.2 463 383 7.8 352 .3 .2 4.6 41 20.9
Median 50.8 16.7 2214 330 10.7 131 1.5 .6 21.1 36 68.2 Mean 52.5 19.0 2208 426 12.4 219 1.5 .7 20.8 55 70.6
Tamil Nadu (n=673) SD 14.8 11.8 530 301 6.6 322 .4 .3 6.0 53 22.4
Median 56.6 18.0 2256 447 15.1 147 1.4 .8 13.2 26 52.3 Mean 60.3 21.5 2317 701 17.2 191 1.5 .9 14.3 33 57.8
Karnataka (n=639) SD 23.8 14.0 804 689 11.2 189 .9 .4 6.5 30 30.3
Median 57.4 28.8 2516 327 9.8 124 .7 .6 13.8 30 46.3 Mean 60.2 32.6 2564 435 11.1 255 .9 .7 14.7 39 51.5
Andhra Pradesh (n=702) SD 22.1 19.4 742 347 5.7 392 .5 .3 5.5 36 24.4
Median 55.7 22.3 1841 316 19.7 117 1.6 .8 14.8 14 59.4 Mean 57.8 27.4 1922 394 21.2 206 1.7 .8 15.8 24 61.4
Maharashtra (n=832) SD 20.7 19.7 604 295 10.3 266 .8 .3 6.5 28 26.1
Median 63.3 27.6 1879 480 28.2 197 1.9 1.1 14.6 35 78.0 Mean 65.9 32.3 1987 586 31.3 223 2.0 1.1 15.2 52 84.3
Gujarat (n=861) SD 21.0 19.0 635 348 18.7 193 .7 .5 5.5 53 35.7
Median 56.8 11.9 1960 263 15.8 95 1.1 .6 14.4 19 38.5 Mean 59.8 16.9 2026 344 17.8 187 1.4 .7 15.6 33 43.7
Madhya Pradesh (n=892) SD 20.3 20.6 593 327 10.0 338 .9 .3 5.8 43 27.9
Median 48.4 6.3 2129 294 12.4 82 1.4 .5 22.3 48 60.9 Mean 50.0 9.1 2136 394 15.0 513 1.4 .5 21.5 75 62.2
Orissa (n=762) SD 13.0 6.9 364 323 8.9 1003 .4 .2 5.3 76 21.2
Median 61.8 7.0 2529 366 15.1 84 1.7 .6 26.6 55 67.4 Mean 64.6 10.5 2604 494 17.8 438 1.7 .7 26.9 84 71.2
West Bengal (n=647)
SD 24.6 9.7 841 420 10.5 927 .6 .3 9.4 87 31.6 Median 55.6 17.6 2118 350 14.5 121 1.4 .7 16.7 30 59.1 Mean 58.6 22.6 2184 468 18.1 267 1.5 .8 17.8 48 62.2
SD 20.8 18.9 676 403 12.4 536 .7 .4 7.4 56 30.0 Pooled (n=6472)
RDA 60 - 2875 400 28 600 1.4 1.6 18 40 100

NNMB Rural Survey 2005-06 86 Diet & Nutritional status, HTN, DM and IDA
Table 6.12 : Average Intake of Nutrients (per day) among adult women (≥≥≥≥18 years) - NPNL Sedentary Workers
STATE Protein (g)
Total Fat (g)
Energy (Kcal)
Calcium (mg)
Iron (mg)
Vit.-A (µg)
Thiamin (mg)
Riboflavin (mg)
Niacin (mg)
Vit.-C (mg)
Free Folic Acid (µg)
Median 43.7 31.1 1655 363 10.7 82 .9 .5 12.8 26 43.9 Mean 45.1 33.2 1659 433 11.5 145 .9 .5 13.2 39 46.2
Kerala (n=1083) SD 15.4 17.4 371 329 5.4 250 .3 .2 3.5 37 16.5
Median 38.9 14.7 1629 306 8.1 124 1.1 .5 15.1 30 51.9 Mean 41.1 17.4 1653 385 9.7 191 1.1 .6 15.0 46 54.4
Tamil Nadu (n=613) SD 13.3 11.6 416 313 6.1 281 .4 .3 4.5 47 18.9
Median 45.4 17.3 1782 396 11.6 130 1.0 .6 10.0 21 39.6 Mean 47.7 20.3 1839 599 13.3 177 1.1 .7 10.8 27 45.7
Karnataka (n=670) SD 19.0 13.5 643 538 8.8 197 .7 .3 4.8 25 22.6
Median 46.0 27.3 1910 362 7.8 128 .6 .6 10.5 24 37.6 Mean 46.9 31.9 1940 425 8.5 248 .7 .6 10.8 32 41.4
Andhra Pradesh (n=531) SD 15.0 19.8 530 265 3.8 375 .3 .2 3.7 33 18.6
Median 41.4 18.6 1425 284 13.6 107 1.1 .6 11.0 15 42.8 Mean 43.2 24.4 1479 352 15.1 187 1.2 .6 11.8 23 44.7
Maharashtra (n=468) SD 16.4 18.6 501 266 8.1 229 .6 .3 5.2 24 20.8
Median 50.8 23.6 1534 421 22.1 159 1.5 .8 11.6 28 62.3 Mean 50.7 26.8 1524 529 23.2 208 1.5 .9 11.8 40 64.3
Gujarat (n=596) SD 15.0 19.8 438 312 11.9 312 .5 .3 4.0 36 27.3
Median 48.1 11.5 1563 264 14.2 98 1.2 .6 12.3 20 40.0 Mean 50.3 17.8 1687 357 17.1 240 1.3 .7 13.2 38 43.2
Madhya Pradesh (n=237) SD 17.0 20.2 531 294 11.9 425 .7 .3 5.1 46 27.2
Median 44.0 6.8 1874 264 11.7 77 1.3 .5 19.5 54 53.7 Mean 45.1 9.5 1870 357 14.8 470 1.3 .5 19.2 78 55.4
Orissa (n=765) SD 11.6 7.6 348 290 9.1 871 .3 .2 4.4 75 18.5
Median 48.5 6.5 1878 365 12.7 78 1.2 .5 18.9 51 51.1 Mean 50.8 10.9 1904 479 14.0 406 1.3 .5 19.3 78 55.4
West Bengal (n=719)
SD 19.8 11.6 575 437 7.5 830 .5 .3 6.8 78 27.1 Median 45.2 17.3 1703 342 11.4 109 1.1 .5 13.4 29 47.2 Mean 46.5 21.8 1738 443 13.8 254 1.1 .6 14.2 47 50.6
SD 16.2 17.8 504 365 8.9 512 .5 .3 5.7 53 22.7 Pooled (n=5682)
RDA 50 - 1875 400 30 600 0.9 1.1 12 40 100

NNMB Rural Survey 2005-06 87 Diet & Nutritional status, HTN, DM and IDA
Table 6.13: Average Intake of Nutrients (per day) among adult women (≥≥≥≥18 Years) - NPNL Moderate Workers
STATE Protein (g)
Total Fat (g)
Energy (Kcal)
Calcium (mg)
Iron (mg)
Vit.-A (µg)
Thiamin (mg)
Riboflavin (mg)
Niacin (mg)
Vit.-C (mg)
Free Folic Acid (µg)
Median 37.5 21.1 1547 196 8.4 53 .9 .4 13.1 20 39.3 Mean 38.6 21.7 1571 285 10.3 98 .9 .4 13.5 27 42.1
Kerala (n=61) SD 14.3 13.0 393 210 8.2 197 .3 .2 3.6 32 14.9
Median 38.1 12.4 1721 255 8.0 102 1.1 .5 16.0 27 52.2 Mean 40.3 14.3 1734 328 9.6 180 1.2 .5 16.3 42 54.6
Tamil Nadu (n=331) SD 12.7 8.5 393 231 5.0 281 .3 .2 4.5 45 16.4
Median 48.4 14.2 1947 332 13.2 120 1.2 .7 11.3 23 43.9 Mean 51.3 17.0 1969 574 14.8 155 1.3 .7 12.3 27 49.7
Karnataka (n=351) SD 19.1 11.2 670 544 8.5 146 .7 .3 5.4 22 24.9
Median 46.7 23.1 2096 283 8.3 102 .6 .5 11.6 28 39.4 Mean 49.5 26.4 2132 357 9.0 231 .7 .6 12.3 36 42.9
Andhra Pradesh (n=500) SD 18.6 16.0 606 363 4.4 391 .4 .2 4.6 33 18.7
Median 45.9 19.2 1574 262 16.3 106 1.4 .6 12.1 13 49.6 Mean 48.5 23.3 1632 346 17.8 192 1.4 .7 13.0 21 52.4
Maharashtra (n=649) SD 17.6 16.7 500 281 8.8 243 .6 .3 5.2 24 22.6
Median 51.8 23.5 1581 367 21.3 163 1.6 .8 11.6 28 65.3 Mean 52.2 25.4 1576 459 24.0 178 1.6 .9 11.8 41 67.5
Gujarat (n=464) SD 15.5 14.2 472 267 14.0 138 .5 .4 3.7 39 27.3
Median 49.9 10.7 1698 238 13.6 87 1.0 .6 12.6 19 34.8 Mean 52.3 14.5 1773 317 15.4 173 1.2 .6 13.6 32 38.2
Madhya Pradesh (n=645) SD 17.6 16.1 527 303 9.0 314 .7 .3 5.1 40 23.0
Median 42.1 5.6 1859 300 10.6 85 1.2 .4 19.5 43 51.6 Mean 42.7 8.1 1892 398 13.7 649 1.2 .5 18.3 67 53.2
Orissa (n=295) SD 10.1 6.5 300 329 9.2 1173 .3 .2 5.0 76 18.8
Median 47.9 4.6 2051 215 12.4 58 1.4 .5 22.5 44 52.6 Mean 50.1 6.6 2117 360 14.5 423 1.4 .5 22.7 75 58.6
West Bengal (n=131)
SD 15.1 7.0 645 308 9.3 813 .5 .2 7.5 89 26.4 Median 46.5 15.0 1752 280 12.4 106 1.1 .6 12.8 23 47.5 Mean 48.8 18.9 1808 383 15.2 234 1.2 .6 13.9 37 50.4
SD 17.0 15.3 554 341 10.1 477 .6 .3 5.6 45 24.1 Pooled (n=3427)
RDA 50 - 2225 400 30 600 1.1 1.3 14 40 100

NNMB Rural Survey 2005-06 88 Diet & Nutritional status, HTN, DM and IDA
Table 6.14: Average Intake of Nutrients (per day) among Pregnant women (≥≥≥≥18 years) - Sedentary Workers
STATE Protein (g)
Total Fat (g)
Energy (Kcal)
Calcium (mg)
Iron (mg)
Vit.-A (µg)
Thiamin (mg)
Riboflavin (mg)
Niacin (mg)
Vit.-C (mg)
Free Folic Acid (µg)
Median 41.6 32.6 1586 417 9.4 69 .8 .4 11.8 26 42.4 Mean 44.7 34.9 1631 449 10.1 240 .8 .5 12.9 43 48.8
Kerala (n=25)
SD 12.3 16.1 348 362 4.2 571 .2 .3 3.5 55 23.0 Median 40.6 14.9 1665 387 9.3 150 1.0 .6 14.5 38 49.1 Mean 42.7 18.6 1749 581 13.2 281 1.1 .7 15.5 49 56.3
Tamil Nadu (n=23) SD 14.2 12.8 398 877 13.4 472 .3 .3 4.6 45 19.2
Median 44.2 11.9 1735 338 10.9 93 1.1 .6 10.4 18 43.4 Mean 46.9 16.9 1785 524 14.7 176 1.2 .6 11.1 27 44.3
Karnataka (n=29) SD 14.2 13.1 525 456 15.1 198 .6 .3 4.6 32 20.5
Median 48.4 23.7 2193 287 7.1 175 .6 .6 12.4 31 32.2 Mean 49.6 32.1 1995 473 8.1 339 .7 .6 12.9 43 37.7
Andhra Pradesh (n=21) SD 18.5 19.3 562 435 3.7 426 .3 .2 5.0 28 17.6
Median 43.3 22.0 1474 248 15.0 118 1.3 .5 11.6 16 44.2 Mean 43.6 24.2 1509 363 14.3 172 1.2 .6 11.6 21 44.6
Maharashtra (n=28) SD 14.3 17.0 376 277 5.9 176 .6 .2 4.1 15 19.0
Median 47.2 28.6 1490 566 22.9 154 1.4 .8 11.1 38 57.4 Mean 48.9 32.5 1544 569 21.7 194 1.4 .8 11.4 59 63.7
Gujarat (n=22)
SD 13.6 20.0 498 262 9.1 123 .6 .3 5.6 64 26.1 Median 45.0 8.5 1807 270 16.5 85 .6 .6 12.0 38 41.8 Mean 48.3 13.0 1705 312 16.6 519 1.2 .6 13.3 47 53.7
Madhya Pradesh (n=8) SD 20.9 11.6 432 225 9.3 1231 1.0 .3 6.3 43 42.6
Median 42.4 5.3 1737 385 13.0 60 1.3 .5 18.6 31 50.8 Mean 46.9 8.5 1787 354 14.4 349 1.3 .5 18.4 63 52.9
Orissa (n=22) SD 19.7 6.3 333 206 8.6 626 .3 .2 4.9 70 19.3
Median 61.1 6.3 1998 238 13.7 60 1.4 .5 21.0 25 46.5 Mean 60.1 6.6 2110 289 15.7 361 1.4 .5 23.4 47 62.2
West Bengal (n=9)
SD 25.1 3.6 656 230 6.8 801 .4 .2 9.5 54 32.9 Median 44.9 19.0 1654 352 11.9 111 1.0 .5 12.4 26 47.7 Mean 46.8 22.5 1726 456 14.0 261 1.1 .6 13.7 42 50.3
SD 16.2 17.5 475 443 10.0 487 .5 .3 5.8 48 23.6 Pooled (n=187)
RDA 65 - 2175 1000 38 600 1.1 1.3 14 40 400

NNMB Rural Survey 2005-06 89 Diet & Nutritional status, HTN, DM and IDA
Table 6.15: Average Intake of Nutrients (per day) among Lactating women (≥≥≥≥18 years) - Sedentary Workers
STATE Protein (g)
Total Fat (g)
Energy (Kcal)
Calcium (mg)
Iron (mg)
Vit.-A (µg)
Thiamin (mg)
Riboflavin (mg)
Niacin (mg)
Vit.-C (mg)
Free Folic Acid (µg)
Median 44.2 36.5 1763 334 11.0 97 .9 .5 13.8 26 48.6 Mean 49.1 39.7 1810 480 11.9 180 .9 .5 14.2 44 54.0
Kerala (n=52) SD 16.9 19.7 324 344 5.8 287 .2 .2 3.8 44 19.6
Median 44.6 14.3 1869 288 8.9 122 1.2 .6 16.6 28 56.3 Mean 45.9 16.1 1895 397 10.8 186 1.3 .6 17.0 42 60.7
Tamil Nadu (n=87) SD 13.7 10.3 435 309 5.7 243 .4 .3 5.0 38 23.3
Median 48.5 13.5 1807 355 11.2 116 1.1 .6 11.1 18 44.6 Mean 47.4 15.8 1807 500 12.2 131 1.1 .7 11.0 24 45.0
Karnataka (n=33) SD 13.1 8.2 428 406 5.0 113 .5 .2 3.5 24 16.6
Median 49.1 37.9 2134 368 8.8 161 .7 .6 11.7 29 44.8 Mean 52.2 40.8 2151 515 9.6 238 .8 .6 12.0 36 47.2
Andhra Pradesh (n=42) SD 18.0 20.1 551 386 3.6 280 .3 .2 3.2 25 20.4
Median 47.0 20.7 1703 302 19.6 119 1.4 .7 13.1 12 50.1 Mean 51.5 26.7 1708 358 19.7 182 1.5 .7 14.1 19 51.5
Maharashtra (n=49) SD 15.9 21.4 418 219 8.4 216 .6 .3 5.5 23 20.6
Median 56.3 33.1 1713 484 25.5 185 1.6 1.0 11.9 28 72.7 Mean 56.0 31.5 1685 616 26.3 238 1.6 1.0 12.2 35 72.4
Gujarat (n=48) SD 15.9 16.9 473 348 15.0 312 .5 .3 4.5 31 26.3
Median 49.4 10.3 1693 264 15.4 84 1.0 .6 12.1 15 30.4 Mean 55.5 13.0 1861 279 16.3 347 1.1 .6 13.6 26 37.5
Madhya Pradesh (n=18)
SD 19.6 9.7 641 115 8.6 643 .6 .3 5.3 27 37.7 Median 42.5 5.6 1926 265 11.7 67 1.3 .5 19.5 45 55.9 Mean 45.3 9.3 1955 384 15.0 475 1.3 .5 19.4 63 55.7
Orissa (n=84)
SD 11.8 7.7 357 405 9.8 986 .4 .2 5.0 61 18.2 Median 49.0 8.0 1915 279 12.2 56 1.4 .5 18.3 58 48.3 Mean 53.2 11.6 1982 510 12.7 162 1.3 .5 19.6 100 53.0
West Bengal (n=41)
SD 17.7 11.1 408 729 4.6 382 .4 .2 5.6 112 21.2 Median 46.7 16.5 1852 320 11.8 107 1.2 .6 14.4 28 52.5 Mean 49.6 22.1 1878 447 14.7 249 1.2 .6 15.5 46 55.2
SD 15.6 18.5 448 399 9.5 513 .5 .3 5.6 55 23.2
Pooled (n=454)
RDA 75 - 2425 1000 30 950 1.2 1.4 16 80 150

NNMB Rural Survey 2005-06 90 Diet & Nutritional status, HTN, DM and IDA
Table 7: Percent Distribution of Households according to Protein Calorie Adequacy Status
STATE n P- C- P- C+ P+ C- P+ C+
Kerala 797 28.4 .4 44.0 27.2 Tamil Nadu 798 39.2 .3 36.3 24.2 Karnataka 773 25.4 .0 37.3 37.3 Andhra Pradesh 798 24.3 .8 23.3 51.6 Maharashtra 796 26.0 .0 58.2 15.8 Gujarat 793 17.7 .0 67.2 15.1 Madhya Pradesh 797 22.7 .0 58.0 19.3 Orissa 800 35.3 .5 35.3 28.9 West Bengal 726 17.6 .1 33.3 49.0 Pooled 7078 26.4 .2 43.8 29.6
P −: Protein Inadequate P+: Protein Adequate C − : Calorie Inadequate C+: Calorie Adequate
Table 8.1: Distribution (%) of 1-3 year Children by
Protein - Calorie Adequacy Status
STATE n P- C- P+ C- P+ C+ Kerala 170 25.3 55.3 19.4 Tamil Nadu 250 21.2 55.2 23.2 Karnataka 165 26.7 47.9 25.5 Andhra Pradesh 176 18.2 29.5 52.3 Maharashtra 266 27.1 42.1 30.8 Gujarat 165 30.3 45.5 24.2 Madhya Pradesh 329 15.5 50.8 33.7 Orissa 241 26.6 48.5 24.9 West Bengal 186 15.6 47.3 37.1 Pooled 1948 22.5 47.3 30.1
P −: Protein Inadequate P+: Protein Adequate C− : Calorie Inadequate C+ : Calorie Adequate

NNMB Rural Survey 2005-06 91 Diet & Nutritional status, HTN, DM and IDA
Table 8.2: Distribution (%) of 4-6 year Children by Protein - Calorie Adequacy Status
STATE n P- C- P+ C- P+ C+
Kerala 173 12.1 67.1 20.8 Tamil Nadu 210 14.8 72.8 12.4 Karnataka 182 12.1 68.1 19.8 Andhra Pradesh 178 6.7 51.2 42.1 Maharashtra 272 10.7 61.8 27.6 Gujarat 254 22.0 66.6 11.4 Madhya Pradesh 324 5.2 60.8 34.0 Orissa 233 14.2 69.1 16.7 West Bengal 214 5.6 66.8 27.6
Pooled 2040 11.4 64.8 23.8 P −: Protein Inadequate P+: Protein Adequate C− : Calorie Inadequate C+ : Calorie Adequate
Table 8.3: Distribution (%) of 7-9 year Children by Protein - Calorie Adequacy Status
STATE n P- C- P+ C- P+ C+
Kerala 163 9.8 77.9 12.3 Tamil Nadu 202 10.9 79.2 9.9 Karnataka 171 8.8 67.2 24.0 Andhra Pradesh 215 7.4 49.8 42.8 Maharashtra 246 7.3 67.5 25.2 Gujarat 228 9.6 76.8 13.6 Madhya Pradesh 304 4.3 60.8 34.9 Orissa 239 3.8 76.1 20.1 West Bengal 196 8.2 61.7 30.1 Pooled 1964 7.5 68.1 24.4
P −: Protein Inadequate P+: Protein Adequate C− : Calorie Inadequate C+ : Calorie Adequate

NNMB Rural Survey 2005-06 92 Diet & Nutritional status, HTN, DM and IDA
Table 8.4: Distribution (%) of 10-12 year Boys by Protein - Calorie Adequacy Status
STATE n P- C- P+ C- P+ C+
Kerala 86 10.5 74.4 15.1 Tamil Nadu 88 14.8 76.1 9.1 Karnataka 101 12.9 64.3 22.8 Andhra Pradesh 102 4.9 53.9 41.2 Maharashtra 144 8.3 68.8 22.9 Gujarat 107 10.3 74.7 15.0 Madhya Pradesh 161 6.2 67.7 26.1 Orissa 126 7.1 75.4 17.5 West Bengal 115 6.1 66.1 27.8 Pooled 1030 8.6 69.0 22.4
P −: Protein Inadequate P+: Protein Adequate C− : Calorie Inadequate C+ : Calorie Adequate
Table 8.5: Distribution (%) of 10-12 year Girls by
Protein - Calorie Adequacy Status
STATE n P- C- P+ C- P+ C+ Kerala 66 13.6 77.3 9.1 Tamil Nadu 88 23.9 68.1 8.0 Karnataka 91 18.7 59.3 22.0 Andhra Pradesh 106 5.7 49.0 45.3 Maharashtra 119 11.8 63.0 25.2 Gujarat 110 8.2 78.2 13.6 Madhya Pradesh 139 5.0 72.0 23.0 Orissa 115 7.8 80.9 11.3 West Bengal 108 6.5 63.0 30.5 Pooled 942 10.5 67.8 21.7
P −: Protein Inadequate P+: Protein Adequate C− : Calorie Inadequate C+ : Calorie Adequate

NNMB Rural Survey 2005-06 93 Diet & Nutritional status, HTN, DM and IDA
Table 8.6: Distribution (%) of 13-15 year Boys by
Protein - Calorie Adequacy Status
STATE n P- C- P+ C- P+ C+ Kerala 91 20.9 59.3 19.8
Tamil Nadu 97 19.6 62.9 17.5
Karnataka 100 16.0 55.0 29.0
Andhra Pradesh 97 9.3 32.0 58.7
Maharashtra 122 9.0 63.9 27.1
Gujarat 108 15.7 74.1 10.2
Madhya Pradesh 145 11.0 59.3 29.7
Orissa 105 13.3 54.3 32.4
West Bengal 78 .0 60.3 39.7
Pooled 943 12.8 58.2 29.0
P −: Protein Inadequate P+: Protein Adequate C− : Calorie Inadequate C+ : Calorie Adequate
Table 8.7: Distribution (%) of 13-15 year Girls by
Protein - Calorie Adequacy Status
STATE n P- C- P+ C- P+ C+ Kerala 97 12.4 60.8 26.8
Tamil Nadu 90 5.6 70.0 24.4
Karnataka 94 18.1 43.6 38.3
Andhra Pradesh 89 5.6 30.3 64.1
Maharashtra 136 2.2 63.2 34.6
Gujarat 92 2.2 75.0 22.8
Madhya Pradesh 106 7.5 54.8 37.7
Orissa 133 .8 51.8 47.4
West Bengal 76 2.6 48.7 48.7
Pooled 913 6.0 55.8 38.2 P −: Protein Inadequate P+: Protein Adequate C− : Calorie Inadequate C+ : Calorie Adequate

NNMB Rural Survey 2005-06 94 Diet & Nutritional status, HTN, DM and IDA
Table 8.8: Distribution (%) of 16-17 year Boys by
Protein - Calorie Adequacy Status
STATE n P- C- P- C+ P+ C- P+ C+ Kerala 58 25.9 5.2 25.9 43.0 Tamil Nadu 53 52.9 7.5 11.3 28.3 Karnataka 52 32.7 1.9 7.7 57.7 Andhra Pradesh 47 10.6 4.3 10.6 74.5 Maharashtra 82 26.8 .0 26.8 46.4 Gujarat 92 30.4 .0 55.5 14.1 Madhya Pradesh 65 27.7 1.5 26.2 44.6 Orissa 54 22.2 14.8 7.4 55.6 West Bengal 44 13.6 .0 11.4 75.0 Pooled 547 27.6 3.5 23.6 45.3
P −: Protein Inadequate P+: Protein Adequate C− : Calorie Inadequate C+ : Calorie Adequate
Table 8.9: Distribution (%) of 16-17 year Girls by Protein - Calorie Adequacy Status
STATE n P- C- P- C+ P+ C- P+ C+
Kerala 66 22.7 6.1 19.7 51.5 Tamil Nadu 49 28.6 .0 6.1 65.3 Karnataka 63 33.3 3.2 7.9 55.6 Andhra Pradesh 57 26.3 3.5 1.8 68.4 Maharashtra 80 26.3 2.5 18.8 52.4 Gujarat 81 16.0 .0 28.4 55.6 Madhya Pradesh 57 17.5 .0 17.5 65.0 Orissa 65 4.6 10.8 3.1 81.5 West Bengal 39 20.5 2.6 12.8 64.1 Pooled 557 21.5 3.2 13.8 61.5
P −: Protein Inadequate P+: Protein Adequate C− : Calorie Inadequate C+ : Calorie Adequate

NNMB Rural Survey 2005-06 95 Diet & Nutritional status, HTN, DM and IDA
Table 8.10: Distribution (%) of Adult Men (Sedentary) by Protein-Calorie Adequacy Status
STATE n P- C- P- C+ P+ C- P+ C+
Kerala 515 8.7 1.0 21.7 68.6 Tamil Nadu 236 11.4 .0 18.6 70.0 Karnataka 317 13.9 .0 19.2 66.9 Andhra Pradesh 343 14.6 .3 13.1 72.0 Maharashtra 311 11.6 .0 37.6 50.8 Gujarat 381 3.7 .0 34.1 62.2 Madhya Pradesh 154 7.8 .0 27.9 64.3 Orissa 304 7.9 .0 13.2 78.9 West Bengal 286 5.6 .7 16.1 77.6 Pooled 2847 9.4 .3 22.4 67.9
P −: Protein Inadequate P+: Protein Adequate C− : Calorie Inadequate C+ : Calorie Adequate
Table 8.11: Distribution (%) of Adult Women (NPNL- Sedentary)
by Protein-Calorie Adequacy Status
STATE n P- C- P- C+ P+ C- P+ C+ Kerala 1083 7.8 3.1 10.5 78.6 Tamil Nadu 613 9.8 .8 8.8 80.6 Karnataka 670 10.0 .1 9.7 80.2 Andhra Pradesh 531 7.0 .6 4.7 87.7 Maharashtra 468 12.0 .2 28.6 59.2 Gujarat 596 4.9 .0 25.3 69.8 Madhya Pradesh 237 5.5 .0 16.9 77.6 Orissa 765 2.4 .4 4.1 93.1 West Bengal 719 6.1 1.0 8.1 84.8 Pooled 5682 7.2 1.0 11.8 80.0
P −: Protein Inadequate P+: Protein Adequate C − : Calorie Inadequate C+: Calorie Adequate

NNMB Rural Survey 2005-06 96 Diet & Nutritional status, HTN, DM and IDA
Table 8.12: Distribution (%) of Adult Women (Pregnant-Sedentary)
by Protein- Calorie Adequacy Status
STATE n P- C- P- C+ P+ C- P+ C+ Kerala 25 16.0 .0 28.0 56.0 Tamil Nadu 23 26.1 13.0 4.3 56.6 Karnataka 29 24.1 .0 3.4 72.5 Andhra Pradesh 21 19.0 .0 4.8 76.2 Maharashtra 28 39.3 .0 21.4 39.3 Gujarat 22 13.6 .0 40.9 45.5 Madhya Pradesh 8 37.5 .0 .0 62.5 Orissa 22 13.6 4.5 4.5 77.4 West Bengal 9 11.1 11.1 .0 77.8 Pooled 187 22.4 2.7 13.9 61.0
P −: Protein Inadequate P+: Protein Adequate C − : Calorie Inadequate C+: Calorie Adequate
Table 8.13: Distribution (%) of Adult Women (Lactating- Sedentary) by Protein-Calorie Adequacy Status
STATE n P- C- P- C+ P+ C- P+ C+
Kerala 52 19.2 9.6 21.2 50.0 Tamil Nadu 87 23.0 8.0 9.2 59.8 Karnataka 33 30.3 3.0 9.1 57.6 Andhra Pradesh 42 16.7 7.1 2.4 73.8 Maharashtra 49 20.4 2.0 26.6 51.0 Gujarat 48 10.4 .0 35.4 54.2 Madhya Pradesh 18 16.7 .0 27.8 55.5 Orissa 84 14.3 20.2 2.4 63.1 West Bengal 41 14.6 .0 14.6 70.8 Pooled 454 18.3 7.5 14.5 59.7
P −: Protein Inadequate P+: Protein Adequate C − : Calorie Inadequate C+: Calorie Adequate

NNMB Rural Survey 2005-06 97 Diet & Nutritional status, HTN, DM and IDA
Table 9.1: Prevalence (%) of Nutritional Deficiency Signs among Infants - Boys
STATE Nutritional Deficiency
Signs Kerala Tamil Nadu Karnataka Andhra Pradesh
Maha- rashtra Gujarat Madhya
Pradesh Orissa West Bengal Pooled
n 55 100 43 53 52 77 40 69 13 502
NAD 100.0 99.0 100.0 100.0 100.0 98.7 100.0 100.0 100.0 99.6
Marasmus .0 1.0 .0 .0 .0 .0 .0 .0 .0 .2
Table 9.2: Prevalence (%) of Nutritional Deficiency Signs among Infants - Girls
STATE Nutritional Deficiency
Signs Kerala Tamil Nadu Karnataka Andhra Pradesh
Maha- rashtra Gujarat Madhya
Pradesh Orissa West Bengal Pooled
n 51 99 43 50 60 58 39 60 16 476
NAD 100.0 100.0 100.0 100.0 100.0 98.3 100.0 100.0 100.0 99.8
Oedema .0 .0 .0 .0 .0 1.7 .0 .0 .0 .2
Table 9.3: Prevalence (%) of Nutritional Deficiency Signs among Infants - Boys + Girls Pooled
STATE Nutritional Deficiency
Signs Kerala Tamil Nadu Karnataka Andhra Pradesh
Maha- rashtra Gujarat Madhya
Pradesh Orissa West Bengal Pooled
n 106 199 86 103 112 135 79 129 29 978
NAD 100.0 99.5 100.0 100.0 100.0 98.5 100.0 100.0 100.0 99.7
Oedema .0 .0 .0 .0 .0 .7 .0 .0 .0 .1
Marasmus .0 .5 .0 .0 .0 .0 .0 .0 .0 .1

NNMB Rural Survey 2005-06 98 Diet & Nutritional status, HTN, DM and IDA
Table 9.4 : Prevalence (%) of Nutritional Deficiency Signs: 1-5 year Children - Boys
STATE Nutritional Deficiency
Signs Kerala Tamil Nadu Karnataka Andhra
Pradesh Maha-rashtra Gujarat Madhya
Pradesh Orissa West Bengal Pooled
n 200 344 258 228 373 291 253 294 217 2458
NAD 94.0 92.4 91.9 94.3 92.0 94.5 95.7 98.0 91.2 93.7
Moon Face .0 .0 .0 .0 .0 .0 .4 .0 .0 *
Emaciation .0 .0 .0 .0 .5 .0 .0 .0 .0 .1
Marasmus .0 .0 .0 .0 .3 .0 .0 .0 .0 *
Night Blindness (XN) .0 .0 .4 .0 .5 .0 .0 .3 .0 .2
Conjuctival Xerosis (XIA) .0 1.7 1.6 .0 1.3 .7 2.8 1.0 2.3 1.3
Bitot Spots (XIB) .0 .9 1.2 .4 2.4 .3 .4 1.0 .9 .9
Angular Stomatitis .0 1.7 .4 .9 .3 .7 .0 .3 2.3 .7
Glossitis .0 .0 .0 .0 .0 .0 .0 .0 .5 *
Phrynoderma .0 .0 .0 .0 .0 2.7 .0 .0 .0 .3
Gums-Spongy bleeding .0 .0 .0 .0 .3 .0 .0 .0 .0 *
Dental - Caries 6.0 3.5 5.4 1.8 1.9 1.0 .0 .3 1.4 2.3
Thyroid Gland Palpable .0 .0 .4 .0 .0 .0 .0 .0 .0 *
Others .0 .6 .8 2.2 1.6 .0 .0 .0 1.8 .8
* Indicates <0.1

NNMB Rural Survey 2005-06 99 Diet & Nutritional status, HTN, DM and IDA
Table 9.5: Prevalence (%) of Nutritional Deficiency Signs: 1-5 year Children - Girls
STATE Nutritional Deficiency
Signs Kerala Tamil Nadu Karnataka Andhra
Pradesh Maha-rashtra Gujarat Madhya
Pradesh Orissa West Bengal Pooled
n 196 331 256 203 329 274 252 331 229 2401
NAD 98.0 89.7 94.9 98.5 92.7 97.1 95.2 97.3 94.3 95.0
Hair Discoloured .0 .0 .0 .0 .6 .0 .0 .0 .9 .2
Moon Face .0 .0 .0 .0 .3 .0 .0 .0 .0 *
Emaciation .0 .0 .0 .0 .9 .0 .0 .0 .0 .1
Night Blindness (XN) .0 .0 .0 .0 .9 .0 .4 .0 .0 .2
Conjuctival Xerosis (XIA) .0 .0 .0 .0 .3 .0 4.0 .3 .0 .5
Bitot Spots (XIB) .0 .6 .0 .0 .0 .0 .8 .3 .0 .2
Angular Stomatitis .0 3.6 .0 .0 .3 .0 .0 .3 3.5 .9
Phrynoderma .0 .0 .0 .0 .0 1.1 .0 .0 .0 .1
Dental - Caries 2.0 6.0 4.3 .0 1.8 .7 .0 2.1 1.7 2.2
Others .0 .0 .8 1.5 2.4 .0 .0 .3 .4 .6

NNMB Rural Survey 2005-06 100 Diet & Nutritional status, HTN, DM and IDA
Table 9.6: Prevalence (%) of Nutritional Deficiency Signs: 1-5 year Children – Boys and Girls Pooled
STATE Nutritional Deficiency
Signs Kerala Tamil Nadu Karnataka Andhra
Pradesh Maha-rashtra Gujarat Madhya
Pradesh Orissa West Bengal Pooled
n 396 675 514 431 702 565 505 625 446 4859
NAD 96.0 91.1 93.4 96.3 92.3 95.8 95.4 97.6 92.8 94.4
Hair Sparse .0 .0 .0 .0 .0 .0 .2 .2 .0 *
Hair Discoloured .0 .0 .0 .2 .4 .0 .4 .2 .9 .2
Moon Face .0 .0 .0 .0 .1 .0 .2 .0 .0 *
Emaciation .0 .0 .0 .0 .7 .0 .0 .0 .0 .1
Marasmus .0 .0 .0 .0 .1 .0 .0 .0 .0 *
Night Blindness (XN) .0 .0 .2 .0 .7 .0 .2 .2 .0 .2
Conjuctival Xerosis (XIA) .0 .9 .8 .0 .9 .4 3.4 .6 1.1 .9
Bitot Spots (XIB) .0 .7 .6 .2 1.3 .2 .6 .6 .4 .6
Angular Stomatitis .0 2.7 .2 .5 .3 .4 .0 .3 2.9 .8
Glossitis .0 .0 .0 .0 .0 .0 .0 .0 .2 *
Phrynoderma .0 .0 .0 .0 .0 1.9 .0 .0 .0 .2
Gums-Spongy bleeding .0 .0 .0 .0 .1 .0 .0 .0 .0 *
Dental - Caries 4.0 4.7 4.9 .9 1.9 .9 .0 1.3 1.6 2.3
Thyroid Gland Palpable .0 .0 .2 .0 .0 .0 .0 .0 .0 *
Others .0 .3 .8 1.9 2.0 .0 .0 .2 1.1 .7
• Indicates <0.1

NNMB Rural Survey 2005-06 101 Diet & Nutritional status, HTN, DM and IDA
Table 9.7: Prevalence (%) of Nutritional Deficiency Signs : 5-12 year Children - Boys
STATE Nutritional Deficiency Signs
Kerala Tamil Nadu Karnataka Andhra
Pradesh Maha-rashtra Gujarat Madhya
Pradesh Orissa West Bengal Pooled
n 261 429 374 369 560 551 551 498 431 3883
NAD 72.8 63.2 70.3 75.9 75.7 85.1 92.7 84.3 73.8 77.6
Night Blindness (XN) .0 .0 .0 .0 1.3 .0 .2 .2 .2 .3
Conjuctival Xerosis (XIA) .0 1.2 2.9 1.4 1.8 3.1 3.9 1.8 3.7 2.3
Bitot Spots (XIB) .0 3.3 2.9 1.6 2.5 1.3 1.7 2.0 .7 1.9
Angular Stomatitis .0 4.0 2.1 2.2 .7 .4 .5 2.4 6.0 2.0
Glossitis .0 .0 .0 .0 .2 .0 .2 .4 2.3 .4
Phrynoderma 1.1 .7 .8 .5 .4 3.6 .0 1.2 .5 1.1
Knock - Kness/ Bow legs .0 .0 .0 .0 .2 .2 .0 .0 .0 .1
Dental - Caries 26.4 24.5 20.9 12.5 16.1 4.9 .2 10.6 9.3 13.1
Dental - Fluorosis .0 7.2 1.1 7.0 .5 3.6 1.2 .0 .7 2.4
Thyroid Gland Palpable .0 .2 .8 .0 2.1 .0 .0 .0 4.4 .9
Thyroid Gland Visible .0 .0 .0 .0 .4 .0 .0 .0 .0 .1
Others .0 .7 .5 .8 1.6 .0 .0 .0 1.4 .6
* Indicates <0.1

NNMB Rural Survey 2005-06 102 Diet & Nutritional status, HTN, DM and IDA
Table 9.8: Prevalence (%) of Nutritional Deficiency Signs : 5-12 year Children - Girls
STATE Nutritional Deficiency
Signs Kerala Tamil Nadu Karnataka Andhra
Pradesh Maha-rashtra Gujarat Madhya
Pradesh Orissa West Bengal Pooled
n 253 401 464 398 476 512 384 478 448 3814
NAD 70.8 60.8 72.0 80.9 73.9 89.5 91.7 84.1 70.3 77.6
Night Blindness (XN) .0 .0 .2 .0 1.1 .0 .8 .0 .0 .2
Conjuctival Xerosis (XIA) .0 1.0 1.3 1.0 .8 1.4 3.9 1.0 2.2 1.4
Bitot Spots (XIB) .0 3.0 1.1 1.3 2.5 .4 1.6 1.0 1.1 1.4
Corneal Scar (XS) .0 .0 .0 .0 .2 .0 .0 .0 .0 *
Angular Stomatitis .0 3.5 .4 2.0 1.3 .6 .5 2.5 5.4 1.9
Glossitis .0 .0 .0 .3 .0 .0 .0 .2 2.5 .3
Phrynoderma 1.2 1.7 1.3 .0 .0 2.1 .0 .6 .4 .8
Gums-Spongy bleeding .0 .0 .0 .0 .0 .2 .0 .0 .0 *
Dental - Caries 27.7 26.2 22.4 9.5 18.1 3.9 .8 11.7 9.2 13.7
Dental - Fluorosis .0 7.2 1.1 5.0 1.7 2.5 1.6 .0 1.6 2.3
Thyroid Gland Palpable 1.2 .7 1.3 .0 2.9 .0 .0 .2 8.7 1.7
Thyroid Gland Visible .4 .0 .4 .0 .2 .0 .0 .2 .7 .2
Others .0 .2 .4 2.0 .4 .0 .0 .0 2.0 .6

NNMB Rural Survey 2005-06 103 Diet & Nutritional status, HTN, DM and IDA
Table 9.9: Prevalence (%) of Nutritional Deficiency Signs: 5-12 year Children – Boys and Girls Pooled
STATE Nutritional Deficiency
Signs Kerala Tamil Nadu Karnataka Andhra
Pradesh Maha-rashtra Gujarat Madhya
Pradesh Orissa West Bengal Pooled
n 514 830 838 767 1036 1063 794 976 879 7697
NAD 71.8 62.0 71.2 78.5 74.9 87.2 92.2 84.2 72.0 77.6
Night Blindness (XN) .0 .0 .1 .0 1.2 .0 .5 .1 .1 .2
Conjuctival Xerosis (XIA) .0 1.1 2.0 1.2 1.4 2.3 3.9 1.4 3.0 1.9
Bitot Spots (XIB) .0 3.1 1.9 1.4 2.5 .8 1.6 1.5 .9 1.6
Corneal Scar (XS) .0 .0 .0 .0 .1 .0 .0 .0 .0 *
Photophobia .0 .0 .0 .0 .1 .0 .0 .0 .0 *
Angular Stomatitis .0 3.7 1.2 2.1 1.0 .5 .5 2.5 5.7 1.9
Glossitis .0 .0 .0 .1 .1 .0 .1 .3 2.4 .4
Phrynoderma 1.2 1.2 1.1 .3 .2 2.9 .0 .9 .5 .9
Gums-Spongy bleeding .0 .0 .0 .0 .0 .1 .0 .0 .0 *
Knock - Kness/ Bow legs .0 .0 .0 .0 .1 .1 .0 .0 .0 *
Dental - Caries 27.0 25.3 21.7 11.0 17.0 4.4 .5 11.2 9.2 13.4
Dental - Fluorosis .0 7.2 1.1 6.0 1.1 3.1 1.4 .0 1.1 2.3
Thyroid Gland Palpable .6 .5 1.1 .0 2.5 .0 .0 .1 6.6 1.3
Thyroid Gland Visible .2 .0 .2 .0 .3 .0 .0 .1 .3 .1
Others .0 .5 .5 1.4 1.1 .0 .0 .0 1.7 .6
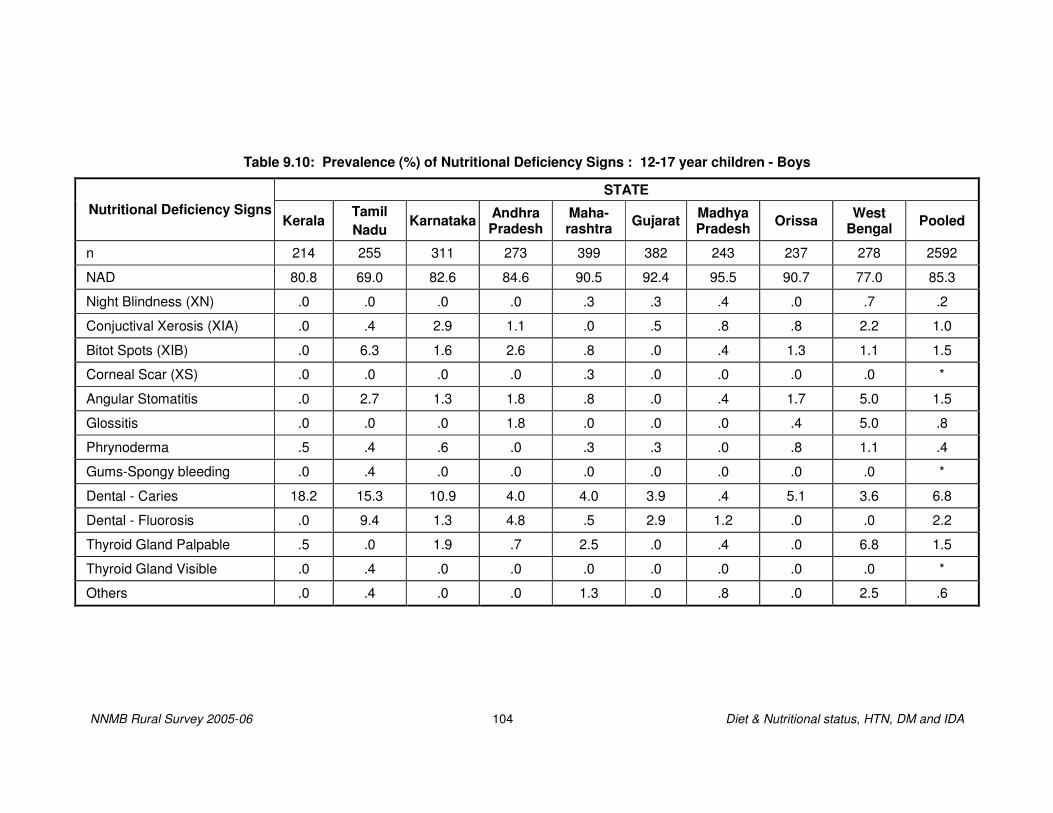
NNMB Rural Survey 2005-06 104 Diet & Nutritional status, HTN, DM and IDA
Table 9.10: Prevalence (%) of Nutritional Deficiency Signs : 12-17 year children - Boys
STATE Nutritional Deficiency Signs
Kerala Tamil Nadu
Karnataka Andhra Pradesh
Maha- rashtra Gujarat Madhya
Pradesh Orissa West Bengal Pooled
n 214 255 311 273 399 382 243 237 278 2592
NAD 80.8 69.0 82.6 84.6 90.5 92.4 95.5 90.7 77.0 85.3
Night Blindness (XN) .0 .0 .0 .0 .3 .3 .4 .0 .7 .2
Conjuctival Xerosis (XIA) .0 .4 2.9 1.1 .0 .5 .8 .8 2.2 1.0
Bitot Spots (XIB) .0 6.3 1.6 2.6 .8 .0 .4 1.3 1.1 1.5
Corneal Scar (XS) .0 .0 .0 .0 .3 .0 .0 .0 .0 *
Angular Stomatitis .0 2.7 1.3 1.8 .8 .0 .4 1.7 5.0 1.5
Glossitis .0 .0 .0 1.8 .0 .0 .0 .4 5.0 .8
Phrynoderma .5 .4 .6 .0 .3 .3 .0 .8 1.1 .4
Gums-Spongy bleeding .0 .4 .0 .0 .0 .0 .0 .0 .0 *
Dental - Caries 18.2 15.3 10.9 4.0 4.0 3.9 .4 5.1 3.6 6.8
Dental - Fluorosis .0 9.4 1.3 4.8 .5 2.9 1.2 .0 .0 2.2
Thyroid Gland Palpable .5 .0 1.9 .7 2.5 .0 .4 .0 6.8 1.5
Thyroid Gland Visible .0 .4 .0 .0 .0 .0 .0 .0 .0 *
Others .0 .4 .0 .0 1.3 .0 .8 .0 2.5 .6

NNMB Rural Survey 2005-06 105 Diet & Nutritional status, HTN, DM and IDA
Table 9.11: Prevalence (%) of Nutritional Deficiency Signs : 12-17 year children - Girls
STATE Nutritional Deficiency Signs
Kerala Tamil Nadu
Karnataka Andhra Pradesh
Maha- rashtra Gujarat Madhya
Pradesh Orissa West Bengal Pooled
n 225 277 385 309 445 441 235 351 269 2937
NAD 76.0 69.3 80.0 81.9 86.3 94.6 97.0 90.0 69.5 83.6
Night Blindness (XN) .0 .0 .0 .0 .9 .0 .0 .3 .0 .2
Conjuctival Xerosis (XIA) .0 .0 1.0 .3 .9 1.1 .9 .6 1.1 .7
Bitot Spots (XIB) .0 6.1 .3 .3 1.6 .7 .4 .9 .0 1.1
Angular Stomatitis .4 2.2 .5 .6 .7 .0 .9 2.3 .7 .9
Cheilosis .0 .0 .0 .3 .0 .0 .0 .0 .0 *
Glossitis .0 .0 .0 .3 .4 .0 .0 .6 2.6 .4
Phrynoderma .9 1.4 1.3 .0 .2 .2 .0 .9 1.9 .7
Koilonychia .0 .0 .0 .0 .0 .0 .0 .0 .4 *
Gums-Spongy bleeding .0 .0 .3 .0 .2 .0 .0 .0 .0 .1
Dental - Caries 13.3 16.6 11.4 5.2 3.4 2.0 .0 3.7 1.9 6.1
Dental - Fluorosis .0 6.1 .8 6.1 .7 2.3 .0 .0 .0 1.8
Thyroid Gland Palpable 8.4 2.2 3.4 1.6 4.9 .0 1.3 1.1 18.6 4.2
Thyroid Gland Visible 1.8 .4 1.0 .0 .9 .0 .0 .6 2.2 .7
Others .0 1.1 1.3 4.5 1.1 .0 .0 .6 3.3 1.3

NNMB Rural Survey 2005-06 106 Diet & Nutritional status, HTN, DM and IDA
Table 9.12: Prevalence (%) of Nutritional Deficiency Signs : 12-17 year children – Boys and Girls Pooled
STATE Nutritional Deficiency
Signs Kerala Tamil Nadu
Karnataka Andhra Pradesh
Maha- rashtra Gujarat Madhya
Pradesh Orissa West Bengal Pooled
n 439 532 696 582 844 823 478 588 547 5529
NAD 78.4 69.2 81.2 83.2 88.3 93.6 96.2 90.3 73.3 84.4
Night Blindness (XN) .0 .0 .0 .0 .6 .1 .2 .2 .4 .2
Conjuctival Xerosis (XIA) .0 .2 1.9 .7 .5 .9 .8 .7 1.6 .8
Bitot Spots (XIB) .0 6.2 .9 1.4 1.2 .4 .4 1.0 .5 1.3
Corneal Scar (XS) .0 .0 .0 .0 .1 .0 .0 .0 .0 *
Angular Stomatitis .2 2.4 .9 1.2 .7 .0 .6 2.0 2.9 1.2
Cheilosis .0 .0 .0 .2 .0 .0 .0 .0 .0 *
Glossitis .0 .0 .0 1.0 .2 .0 .0 .5 3.8 .6
Phrynoderma .7 .9 1.0 .0 .2 .2 .0 .9 1.5 .6
Koilonychia .0 .0 .0 .0 .0 .0 .0 .0 .2 *
Gums-Spongy bleeding .0 .2 .1 .0 .1 .0 .0 .0 .0 .1
Dental - Caries 15.7 16.0 11.2 4.6 3.7 2.9 .2 4.3 2.7 6.4
Dental - Fluorosis .0 7.7 1.0 5.5 .6 2.6 .6 .0 .0 2.0
Thyroid Gland Palpable 4.6 1.1 2.7 1.2 3.8 .0 .8 .7 12.6 2.9
Thyroid Gland Visible .9 .4 .6 .0 .5 .0 .0 .3 1.1 .4
Others .0 .8 .7 2.4 1.2 .0 .4 .3 2.9 1.0

NNMB Rural Survey 2005-06 107 Diet & Nutritional status, HTN, DM and IDA
Table 9.13: Prevalence (%) of Nutritional Deficiency Signs: Adult Men
STATE Nutritional Deficiency
Signs Kerala Tamil Nadu Karnataka Andhra
Pradesh Maha- rashtra Gujarat Madhya
Pradesh Orissa West Bengal Pooled
n 1006 1443 1521 1845 1851 1710 1719 1432 1512 14039
NAD 80.9 78.1 85.9 86.6 98.0 91.5 93.0 95.7 91.5 89.6
Night Blindness (XN) .0 .1 .0 .0 .0 .8 .1 .0 .0 .1
Conjuctival Xerosis (XIA) .0 .1 .3 .1 .0 .6 .0 .0 .0 .1
Bitot Spots (XIB) .0 2.6 .4 .0 .3 .4 .0 .0 .0 .4
Corneal Scar (XS) .0 .0 .0 .0 .1 .1 .0 .0 .1 *
Angular Stomatitis .0 .7 .3 .3 .0 .1 .9 1.0 1.1 .5
Cheilosis .0 .0 .0 .0 .0 .0 .0 .0 .1 *
Glossitis .0 .1 .0 6.1 .1 .0 2.6 .1 3.2 1.5
Phrynoderma .1 .0 .1 .0 .1 .0 .0 .0 .5 .1
Gums-Spongy bleeding .0 .0 .1 .0 .0 .1 .0 .0 .0 *
Knock - Kness/ Bow legs .0 .0 .0 .1 .0 .0 .0 .0 .0 *
Dental - Caries 18.6 18.8 12.0 4.1 .2 4.7 3.4 2.3 1.5 6.5
Dental - Fluorosis .0 .8 .2 .5 .0 2.3 .1 .0 .0 .5
Thyroid Gland Palpable .2 .0 .1 .2 .1 .1 .0 .0 .6 .1
Thyroid Gland Visible .3 .0 .1 .0 .0 .0 .1 .0 .1 *
Others .1 .5 .6 2.3 1.2 .1 1.1 .9 1.9 1.0

NNMB Rural Survey 2005-06 108 Diet & Nutritional status, HTN, DM and IDA
Table 9.14: Prevalence (%) of Nutritional Deficiency Signs: Adult Women
STATE Nutritional Deficiency
Signs Kerala Tamil Nadu Karnataka Andhra
Pradesh Maha- rashtra Gujarat Madhya
Pradesh Orissa West Bengal Pooled
n 2136 2113 2161 2168 2249 2216 1789 2018 1753 18603
NAD 62.3 65.5 77.2 74.4 95.9 90.7 86.5 85.7 75.0 79.3
Night Blindness (XN) .0 .0 .0 .0 .1 1.0 .2 .0 .0 .2
Conjuctival Xerosis (XIA) .0 .0 .1 .0 .0 .4 .0 .1 .1 .1
Bitot Spots (XIB) .0 1.4 .3 .0 .0 .4 .0 .1 .1 .3
Corneal Scar (XS) .0 .0 .0 .0 .1 .0 .1 .0 .0 *
Angular Stomatitis .0 1.3 .4 .6 .1 .0 3.1 1.1 1.3 .8
Cheilosis .0 .0 .0 .0 .0 .0 .0 .0 .1 *
Glossitis .0 .1 .2 1.1 .2 .0 6.4 .1 1.9 1.0
Phrynoderma 2.9 .1 1.1 .0 .0 .1 .0 .8 7.2 1.3
Koilonychia .0 .1 .2 .0 .1 .0 .0 .0 .1 .1
Gums-Spongy bleeding .0 .0 .1 .0 .1 .2 .0 .0 .0 *
Dental - Caries 31.9 31.1 16.5 7.2 .3 5.1 3.6 5.6 1.9 11.7
Dental - Fluorosis .0 .9 .2 1.1 .1 2.4 .7 .0 .0 .6
Thyroid Gland Palpable 3.0 .9 .5 .3 1.4 .0 .7 1.1 6.2 1.5
Thyroid Gland Visible 2.7 .6 .6 .4 .7 .0 .7 .4 1.6 .8
Others .0 .6 3.3 16.2 1.2 .0 1.9 6.5 8.1 4.1

NNMB Rural Survey 2005-06 109 Diet & Nutritional status, HTN, DM and IDA
Table 9.15: Prevalence (%) of Nutritional Deficiency Signs: Adults– Men and Women Pooled
STATE Nutritional Deficiency
Signs Kerala Tamil Nadu Karnataka Andhra
Pradesh Maha- rashtra
Gujarat Madhya Pradesh Orissa West
Bengal Pooled
n 3142 3556 3682 4013 4100 3926 3508 3450 3265 32642
NAD 68.3 70.6 80.8 80.0 96.8 91.1 89.7 89.9 82.7 83.7
Night Blindness (XN) .0 .0 .0 .0 .0 .9 .2 .0 .0 .1
Conjuctival Xerosis (XIA) .0 .1 .2 .0 .0 .5 .0 .1 .0 .1
Bitot Spots (XIB) .0 1.9 .3 .0 .1 .4 .0 .1 .1 .3
Corneal Scar (XS) .0 .0 .0 .0 .1 .0 .0 .0 .0 *
Angular Stomatitis .0 1.1 .3 .4 .1 .0 2.0 1.0 1.2 .7
Cheilosis .0 .0 .0 .0 .0 .0 .0 .0 .1 *
Glossitis .0 .1 .1 3.4 .1 .0 4.5 .1 2.5 1.2
Phrynoderma 2.0 .1 .7 .0 .0 .1 .0 .5 4.1 .8
Koilonychia .0 .1 .1 .0 .0 .0 .0 .0 .1 *
Gums-Spongy bleeding .0 .0 .1 .0 .0 .2 .0 .0 .0 *
Dental - Caries 27.7 26.1 14.7 5.8 .2 4.9 3.5 4.2 1.7 9.5
Dental - Fluorosis .0 .8 .2 .8 .0 2.4 .4 .0 .0 .6
Thyroid Gland Palpable 2.1 .6 .3 .2 .8 .0 .3 .7 3.6 .9
Thyroid Gland Visible 1.9 .3 .4 .2 .4 .0 .4 .3 .9 .5
Others .1 .5 2.2 9.8 1.2 .0 1.5 4.2 5.2 2.8

NNMB Rural Survey 2005-06 110 Diet & Nutritional status, HTN, DM and IDA
Table 10.1: Distribution (%) of 1-5 years Children according to Nutritional Status
(Weight for Age) by Gender - Gomez Classification
Nutrition Grades* STATE Gender n
Normal Mild Moderate Severe
Boys 200 26.5 57.0 16.0 .5
Girls 196 20.9 51.5 26.0 1.5 Kerala
Pooled 396 23.7 54.3 21.0 1.0
Boys 344 12.5 51.2 33.4 2.9
Girls 331 11.8 52.9 33.2 2.1 Tamil Nadu
Pooled 675 12.1 52.0 33.3 2.5
Boys 258 11.2 48.1 36.4 4.3
Girls 256 14.5 45.3 35.5 4.7 Karnataka
Pooled 514 12.8 46.7 36.0 4.5
Boys 228 12.7 46.5 38.6 2.2
Girls 203 9.4 43.3 44.8 2.5 Andhra Pradesh
Pooled 431 11.1 45.0 41.5 2.3
Boys 373 11.5 43.2 42.9 2.4
Girls 329 10.6 47.4 37.7 4.3 Maharashtra
Pooled 702 11.1 45.2 40.5 3.3
Boys 291 15.1 32.3 43.0 9.6
Girls 274 21.2 34.7 35.4 8.8 Gujarat
Pooled 565 18.1 33.5 39.3 9.2
Boys 253 9.9 33.2 49.4 7.5
Girls 252 13.9 34.1 42.1 9.9 Madhya Pradesh
Pooled 505 11.9 33.7 45.7 8.7
Boys 294 11.9 42.2 40.1 5.8
Girls 331 7.6 43.8 43.8 4.8 Orissa
Pooled 625 9.6 43.0 42.1 5.3
Boys 217 11.5 45.2 37.8 5.5
Girls 229 8.3 46.7 44.1 .9 West Bengal
Pooled 446 9.9 46.0 41.0 3.1
Boys 2458 13.3 44.0 38.2 4.6
Girls 2401 12.8 44.5 38.2 4.5 Pooled
Pooled 4859 13.0 44.2 38.2 4.5
* : NCHS Standards

NNMB Rural Survey 2005-06 111 Diet & Nutritional status, HTN, DM and IDA
Table 10.2: Distribution (%) of 1-5 years Children according to Nutritional Status (Weight for Age) by age group - Gomez Classification
Nutrition Grades* STATE
Age (Years)
n Normal Mild Moderate Severe
1-3 219 23.7 55.3 19.6 1.4
3-5 177 23.7 53.1 22.6 .6 Kerala
Pooled 396 23.7 54.3 21.0 1.0
1-3 343 15.7 51.9 30.3 2.0
3-5 332 8.4 52.1 36.4 3.0 Tamil Nadu
Pooled 675 12.1 52.0 33.3 2.5
1-3 256 15.2 48.8 30.5 5.5
3-5 258 10.5 44.6 41.5 3.5 Karnataka
Pooled 514 12.8 46.7 36.0 4.5
1-3 229 14.8 46.7 36.2 2.2
3-5 202 6.9 43.1 47.5 2.5 Andhra Pradesh
Pooled 431 11.1 45.0 41.5 2.3
1-3 352 11.1 44.0 40.9 4.0
3-5 350 11.1 46.3 40.0 2.6 Maharashtra
Pooled 702 11.1 45.2 40.5 3.3
1-3 264 15.9 33.7 37.9 12.5
3-5 301 19.9 33.2 40.5 6.3 Gujarat
Pooled 565 18.1 33.5 39.3 9.2
1-3 265 14.0 32.1 43.4 10.6
3-5 240 9.6 35.4 48.3 6.7 Madhya Pradesh
Pooled 505 11.9 33.7 45.7 8.7
1-3 286 12.2 37.1 44.4 6.3
3-5 339 7.4 48.1 40.1 4.4 Orissa
Pooled 625 9.6 43.0 42.1 5.3
1-3 216 13.0 42.6 40.7 3.7
3-5 230 7.0 49.1 41.3 2.6 West Bengal
Pooled 446 9.9 46.0 41.0 3.1
1-3 2430 14.8 43.5 36.3 5.3
3-5 2429 11.3 45.0 40.1 3.7 Pooled
Pooled 4859 13.0 44.2 38.2 4.6
* : NCHS Standards

NNMB Rural Survey 2005-06 112 Diet & Nutritional status, HTN, DM and IDA
Table 11a : Distribution (%) of 6-60 Months Children according to Nutritional Status (Weight for Age) by age group - IAP Classification*
Nutrition Grades
STATE Age (Months) n
Normal Grade I Grade II Grade III Grade IV
6-12 56 73.2 23.2 1.8 1.8 0.0 12-24 106 57.5 33.0 9.4 0.0 0.0 24-36 113 59.3 30.1 8.8 0.9 0.9 36-48 99 63.6 29.3 7.1 0.0 0.0 48-60 78 53.8 30.8 11.5 3.8 0.0
Kerala
Pooled 452 60.6 29.9 8.2 1.1 0.2 6-12 102 70.6 22.5 3.9 2.9 0.0 12-24 176 48.3 38.1 11.9 1.7 0.0 24-36 167 43.1 41.3 13.2 1.8 0.6 36-48 159 39.0 44.0 13.8 3.1 0.0 48-60 173 39.9 39.3 15.6 5.2 0.0
Tamil Nadu
Pooled 777 46.3 38.2 12.4 3.0 0.1 6-12 61 70.5 19.7 3.3 6.6 0.0 12-24 146 43.8 37.0 13.0 5.5 0.7 24-36 110 49.1 32.7 13.6 4.5 0.0 36-48 130 44.6 36.9 16.2 1.5 0.8 48-60 128 37.5 39.1 20.3 3.1 0.0
Karnataka
Pooled 575 46.4 34.8 14.4 4.0 0.3 6-12 67 58.2 28.4 11.9 1.5 0.0 12-24 104 43.3 36.5 19.2 1.0 0.0 24-36 125 40.8 40.8 16.8 1.6 0.0 36-48 117 38.5 38.5 22.2 0.9 0.0 48-60 85 25.9 47.1 21.2 5.9 0.0
Andhra Pradesh
Pooled 498 40.6 38.8 18.7 2.0 0.0 6-12 95 56.8 29.5 9.5 3.2 1.1 12-24 174 33.9 42.0 20.1 3.4 0.6 24-36 178 34.3 42.1 23.0 0.6 0.0 36-48 162 44.4 34.6 18.5 2.5 0.0 48-60 188 30.3 43.6 24.5 1.6 0.0
Maharashtra
Pooled 797 38.0 39.4 20.2 2.1 0.3 *: By Using Harvard Standards

NNMB Rural Survey 2005-06 113 Diet & Nutritional status, HTN, DM and IDA
Table 11b : Distribution (%) of 6-60 Months Children according to Nutritional Status (Weight for Age) by age group - IAP Classification*
Nutrition Grades STATE Age
(Months) n Normal Grade I Grade II Grade III Grade IV
6-12 82 40.2 22.0 23.2 7.3 7.3
12-24 119 39.5 23.5 22.7 10.9 3.4
24-36 145 51.0 26.2 15.9 5.5 1.4
36-48 164 45.7 26.2 24.4 1.8 1.8
48-60 137 51.8 24.8 19.0 3.6 0.7
Gujarat
Pooled 647 46.4 24.9 20.9 5.4 2.5
6-12 43 67.4 30.2 2.3 0.0 0.0
12-24 155 35.5 29.0 29.0 5.2 1.3
24-36 110 37.3 33.6 23.6 5.5 0.0
36-48 141 36.2 42.6 16.3 4.3 0.7
48-60 99 33.3 28.3 34.3 4.0 0.0
Madhya Pradesh
Pooled 548 38.1 33.4 23.5 4.4 0.5
6-12 68 48.5 29.4 19.1 2.9 0.0
12-24 155 33.5 35.5 27.7 2.6 0.6
24-36 131 32.1 38.9 22.1 6.9 0.0
36-48 186 44.6 37.6 15.1 2.2 0.5
48-60 153 39.2 35.9 22.9 2.0 0.0
Orissa
Pooled 693 39.0 36.2 21.4 3.2 0.3
6-12 23 65.2 30.4 0.0 4.3 0.0
12-24 101 41.6 33.7 19.8 4.0 1.0
24-36 115 40.9 34.8 19.1 5.2 0.0
36-48 114 35.1 47.4 16.7 0.9 0.0
48-60 116 42.2 32.8 23.3 1.7 0.0
West Bengal
Pooled 469 41.2 36.9 18.8 3.0 0.2
6-12 597 60.1 25.6 9.5 3.5 1.2
12-24 1236 41.3 34.7 19.4 3.8 0.8
24-36 1194 42.6 36.1 17.5 3.4 0.3
36-48 1272 43.2 37.3 17.0 2.0 0.5
48-60 1157 39.0 36.2 21.4 3.3 0.1
Pooled
Pooled 5456 43.6 35.0 17.8 3.2 0.5
*: By using Harvard Standards

NNMB Rural Survey 2005-06 114 Diet & Nutritional status, HTN, DM and IDA
Table 12.1: Distribution (%) of Undernutrition among infants (< 1 year) according to SD classification by Age (months)
Weight for Age Height for Age Weight for Height Age (in completed
months) n
< -3SD -3SD to – 2SD ≥≥≥≥ – 2SD < -3SD -3SD to – 2SD ≥≥≥≥ – 2SD < -3SD -3SD to – 2SD ≥≥≥≥ – 2SD
1 64 4.7 10.9 84.4 3.2 3.2 93.6 13.1 14.8 72.1
2 60 .0 5.0 95.0 3.3 5.0 91.7 3.4 13.6 83.0
3 83 1.2 2.4 96.4 1.2 3.6 95.2 4.8 6.0 89.2
4 83 1.2 10.8 88.0 2.4 8.5 89.1 8.5 6.1 85.4
5 91 2.2 11.0 86.8 5.5 12.1 82.4 1.1 12.1 86.8
6 110 2.7 10.0 87.3 4.5 6.4 89.1 3.6 4.6 91.8
7 95 7.4 7.4 85.2 4.2 8.4 87.4 5.3 8.4 86.3
8 107 9.3 26.2 64.5 7.5 24.5 68.0 2.8 9.4 87.8
9 100 6.0 24.0 70.0 6.0 13.0 81.0 2.0 10.0 88.0
10 109 8.3 30.3 61.4 8.3 22.0 69.7 3.7 7.3 89.0
11 76 23.7 31.6 44.7 15.8 27.6 56.6 3.9 6.6 89.5
Pooled 978 6.1 16.2 77.7 5.7 12.8 81.5 4.4 8.7 86.9

NNMB Rural Survey 2005-06 115 Diet & Nutritional status, HTN, DM and IDA
Table 12.2: Prevalence (%) of undernutrition among 1-5 year children According to SD Classification* by Age groups
STATE Age (Yrs) n
Underweight (Wt/Age
<Med. – 2SD)
Stunting (Ht/Age
<Med. – 2SD)
Wasting (Wt/Ht
<Med. – 2SD) <1 106 9.4 12.3 7.5 1-3 219 37.0 35.2 10.5 3-5 177 32.2 29.9 10.7
Kerala
1-5 396 34.8 32.8 10.6 <1 199 8.5 5.0 5.0 1-3 343 47.2 39.9 8.7 3-5 332 51.2 42.5 15.1
Tamil Nadu
1-5 675 49.2 41.2 11.9 <1 86 24.4 17.4 7.0 1-3 256 50.0 48.8 12.5 3-5 258 55.8 51.6 12.4
Karnataka
1-5 514 52.9 50.2 12.5 <1 103 23.3 20.4 2.9 1-3 229 54.1 43.7 16.2 3-5 202 57.9 53.5 15.8
Andhra Pradesh
1-5 431 55.9 48.3 16.0 <1 112 30.4 34.8 4.5 1-3 352 58.0 53.4 10.5 3-5 350 57.4 46.3 17.1
Maharashtra
1-5 702 57.7 49.9 13.8 <1 135 40.7 27.3 40.9 1-3 264 62.9 52.7 22.9 3-5 301 52.8 45.3 24.7
Gujarat
1-5 565 57.5 48.8 23.8 <1 79 12.7 10.1 26.6 1-3 265 63.4 75.1 18.9 3-5 240 64.6 70.4 14.6
Madhya Pradesh
1-5 505 64.0 72.9 16.8 <1 129 31.8 19.4 15.0 1-3 286 62.6 57.3 18.9 3-5 339 58.4 64.3 13.0
Orissa
1-5 625 60.3 61.1 15.7 <1 29 20.7 48.3 3.4 1-3 216 59.7 54.6 13.0 3-5 230 55.7 58.7 13.0
West Bengal
1-5 446 57.6 56.7 13.0 <1 978 22.3 18.6 13.1 1-3 2430 54.8 51.3 14.5 3-5 2429 55.1 51.7 15.5
Pooled
1-5 4859 54.9 51.5 15.0
* : NCHS Standards

NNMB Rural Survey 2005-06 116 Diet & Nutritional status, HTN, DM and IDA
Table 12.3 Prevalence (%) of undernutrition among 1-5 year children According to SD Classification* by Gender
STATE Gender n Underweight
(Wt/Age <Med. – 2SD)
Stunting (Ht/Age
<Med. – 2SD)
Wasting (Wt/Ht
<Med. – 2SD)
Boys 200 29.5 30.0 9.5 Girls 196 40.3 35.7 11.7 Kerala
Pooled 396 34.8 32.8 10.6 Boys 344 48.0 41.3 12.2 Girls 331 50.5 41.1 11.5 Tamil Nadu
Pooled 675 49.2 41.2 11.9 Boys 258 54.3 47.3 14.3 Girls 256 51.6 53.1 10.5 Karnataka
Pooled 514 52.9 50.2 12.5 Boys 228 53.9 43.4 17.5 Girls 203 58.1 53.7 14.3
Andhra Pradesh
Pooled 431 55.9 48.3 16.0 Boys 373 57.4 49.3 14.7 Girls 329 58.1 50.5 12.8 Maharashtra
Pooled 702 57.7 49.9 13.8 Boys 291 62.5 52.4 26.9 Girls 274 52.2 44.9 20.6 Gujarat
Pooled 565 57.5 48.8 23.8 Boys 253 67.2 71.9 17.0 Girls 252 60.7 73.8 16.7
Madhya Pradesh
Pooled 505 64.0 72.9 16.8 Boys 294 58.8 58.8 15.6 Girls 331 61.6 63.1 15.7 Orissa
Pooled 625 60.3 61.1 15.7 Boys 217 55.3 54.4 13.4 Girls 229 59.8 59.0 12.7 West Bengal
Pooled 446 57.6 56.7 13.0 Boys 2458 54.8 50.1 15.8 Girls 2401 55.1 52.9 14.1 Pooled
Pooled 4859 54.9 51.5 15.0
* : NCHS Standards

NNMB Rural Survey 2005-06 117 Diet & Nutritional status, HTN, DM and IDA
Table13.1: Distribution (%) of 1-5 years Children according to Weight for Age - Standard Deviation (SD) Classification: by Age groups
Weight for Age*
STATE Age (Yrs) n < Median
-3SD
Median -3SD to
Median-2SD
Median -2SD to
Median -1SD
Median -1SD to Median
≥≥≥≥ Median
<1 106 2.8 6.6 19.8 24.5 46.2 1-3 219 6.4 30.6 38.8 17.4 6.8 3-5 177 6.2 26.0 40.1 20.9 6.8
Kerala
1-5 396 6.3 28.5 39.4 18.9 6.8 <1 199 2.5 6.0 29.1 32.2 30.2 1-3 343 9.9 37.3 35.0 12.8 5.0 3-5 332 10.8 40.4 35.8 11.7 1.2
Tamil Nadu
1-5 675 10.4 38.8 35.4 12.3 3.1 <1 86 5.8 18.6 31.4 24.4 19.8 1-3 256 18.0 32.0 33.2 12.5 4.3 3-5 258 12.8 43.0 31.4 9.3 3.5
Karnataka
1-5 514 15.4 37.5 32.3 10.9 3.9 <1 103 3.9 19.4 35.9 24.3 16.5 1-3 229 16.2 38.0 30.6 11.4 3.9 3-5 202 15.3 42.6 32.7 8.4 1.0
Andhra Pradesh
1-5 431 15.8 40.1 31.6 10.0 2.6 <1 112 6.3 24.1 23.2 29.5 17.0 1-3 352 21.3 36.6 30.4 9.1 2.6 3-5 350 11.7 45.7 30.0 11.1 1.4
Maharashtra
1-5 702 16.5 41.2 30.2 10.1 2.0 <1 135 20.7 20.0 23.7 16.3 19.3 1-3 264 32.6 30.3 18.9 12.5 5.7 3-5 301 19.9 32.9 25.6 16.6 5.0
Gujarat
1-5 565 25.8 31.7 22.5 14.7 5.3 <1 79 0.0 12.7 32.9 27.8 26.6 1-3 265 32.5 30.9 22.3 7.9 6.4 3-5 240 21.3 43.3 24.6 7.5 3.3
Madhya Pradesh
1-5 505 27.1 36.8 23.4 7.7 5.0 <1 129 5.4 26.4 27.1 30.2 10.9 1-3 286 23.8 38.8 23.8 10.1 3.5 3-5 339 18.6 39.8 32.4 8.3 0.9
Orissa
1-5 625 21.0 39.4 28.5 9.1 2.1 <1 29 3.4 17.2 37.9 31.0 10.3 1-3 216 20.8 38.9 25.9 11.1 3.2 3-5 230 15.2 40.4 36.1 5.2 3.0
West Bengal
1-5 446 17.9 39.7 31.2 8.1 3.1 <1 978 6.1 16.2 27.9 26.7 23.1 1-3 2430 20.2 35.0 28.8 11.5 4.5 3-5 2429 14.9 39.9 31.7 10.9 2.7
Pooled
1-5 4859 17.5 37.4 30.3 11.2 3.6 * : NCHS Standards

NNMB Rural Survey 2005-06 118 Diet & Nutritional status, HTN, DM and IDA
Table 13.2: Distribution (%) of 1-5 years Children according to Weight for Age - Standard Deviation (SD) Classification: by Gender
Weight for Age*
STATE Gender n < Median -3SD
Median -3SD to Median-
2SD
Median -2SD to Median
-1SD
Median -1SD to Median
≥≥≥≥ Median
Boys 200 4.0 25.5 43.5 20.5 6.5
Girls 196 8.7 31.6 35.2 17.3 7.1 Kerala
Pooled 396 6.3 28.5 39.4 18.9 6.8
Boys 344 9.6 38.4 36.0 13.4 2.6
Girls 331 11.2 39.3 34.7 11.2 3.6 Tamil Nadu
Pooled 675 10.4 38.8 35.4 12.3 3.1
Boys 258 15.5 38.8 31.4 10.5 3.9
Girls 256 15.2 36.3 33.2 11.3 3.9 Karnataka
Pooled 514 15.4 37.5 32.3 10.9 3.9
Boys 228 12.3 41.7 31.6 11.0 3.5
Girls 203 19.7 38.4 31.5 8.9 1.5 Andhra Pradesh
Pooled 431 15.8 40.1 31.6 10.0 2.6
Boys 373 16.1 41.3 30.6 10.5 1.6
Girls 329 17.0 41.0 29.8 9.7 2.4 Maharashtra
Pooled 702 16.5 41.2 30.2 10.1 2.0
Boys 291 27.1 35.4 19.9 13.7 3.8
Girls 274 24.5 27.7 25.2 15.7 6.9 Madhya Pradesh
Pooled 565 25.8 31.7 22.5 14.7 5.3
Boys 253 26.1 41.1 22.1 6.7 4.0
Girls 252 28.2 32.5 24.6 8.7 6.0 Gujarat
Pooled 505 27.1 36.8 23.4 7.7 5.0
Boys 294 20.7 38.1 27.9 10.9 2.4
Girls 331 21.1 40.5 29.0 7.6 1.8 Orissa
Pooled 625 21.0 39.4 28.5 9.1 2.1
Boys 217 20.7 34.6 31.3 9.7 3.7
Girls 229 15.3 44.5 31.0 6.6 2.6 West Bengal
Pooled 446 17.9 39.7 31.2 8.1 3.1
Boys 2458 17.1 37.7 30.2 11.7 3.3
Girls 2401 18.0 37.2 30.4 10.6 3.9 Pooled
Pooled 4859 17.5 37.4 30.3 11.2 3.6
* : NCHS Standards

NNMB Rural Survey 2005-06 119 Diet & Nutritional status, HTN, DM and IDA
Table 14.1: Distribution (%) of 1-5 years Children according to Height for Age - Standard Deviation (SD) Classification : by Age groups
Height for Age*
STATE Age
group (yrs) n < Median
-3SD
Median -3SD to Median-
2SD
Median -2SD to Median
-1SD
Median -1SD to Median
≥≥≥≥ Median
<1 106 6.6 5.7 21.7 24.5 41.5 1-3 219 11.0 24.2 24.2 21.9 18.7 3-5 177 11.3 18.6 30.5 25.4 14.1
Kerala
1-5 396 11.1 21.7 27.0 23.5 16.7 <1 199 2.0 3.0 24.1 31.2 39.7 1-3 343 13.4 26.5 30.3 19.8 9.9 3-5 332 14.5 28.0 36.4 18.1 3.0
Tamil Nadu
1-5 675 13.9 27.3 33.3 19.0 6.5 <1 86 2.3 15.1 20.9 40.7 20.9 1-3 256 21.1 27.7 25.0 15.6 10.5 3-5 258 24.4 27.1 28.3 11.2 8.9
Karnataka
1-5 514 22.8 27.4 26.7 13.4 9.7 <1 103 3.9 16.5 36.9 32.0 10.7 1-3 229 18.3 25.3 24.5 22.7 9.2 3-5 202 20.3 33.2 31.7 10.9 4.0
Andhra Pradesh
1-5 431 19.3 29.0 27.8 17.2 6.7 <1 112 11.6 23.2 36.6 21.4 7.1 1-3 352 26.1 27.3 26.1 13.1 7.4 3-5 350 19.1 27.1 32.3 16.3 5.1
Maharashtra
1-5 702 22.6 27.2 29.2 14.7 6.3 <1 79 5.1 5.1 16.5 27.8 45.6 1-3 262 34.0 18.7 13.7 21.4 12.2 3-5 300 24.7 20.7 28.0 16.0 10.7
Madhya Pradesh
1-5 562 29.0 19.8 21.4 18.5 11.4 <1 135 12.1 15.2 14.4 19.7 38.6 1-3 265 48.3 26.8 13.6 7.2 4.2 3-5 240 44.2 26.3 17.1 9.2 3.3
Gujarat
1-5 505 46.3 26.5 15.2 8.1 3.8 <1 129 3.9 15.5 32.6 26.4 21.7 1-3 286 31.8 25.5 21.0 14.3 7.3 3-5 339 26.0 38.3 22.7 9.4 3.5
Orissa
1-5 625 28.6 32.5 21.9 11.7 5.3 <1 29 3.4 44.8 24.1 24.1 3.4 1-3 216 36.1 18.5 26.9 11.6 6.9 3-5 230 27.4 31.3 24.8 10.4 6.1
West Bengal
1-5 446 31.6 25.1 25.8 11.0 6.5 <1 978 5.7 12.8 25.5 27.6 28.3 1-3 2428 26.5 24.8 23.0 16.3 9.4 3-5 2428 23.5 28.2 28.2 14.0 6.2
Pooled
1-5 4856 25.0 26.5 25.6 15.1 7.8
* : NCHS Standards

NNMB Rural Survey 2005-06 120 Diet & Nutritional status, HTN, DM and IDA
Table 14.2: Distribution (%) of 1-5 years Children according to Height for Age - Standard Deviation (SD) Classification : by Gender
Height for Age*
STATE Gender n < Median
-3SD
Median -3SD to Median
-2SD
Median -2SD to Median
-1SD
Median -1SD to Median
≥≥≥≥ Median
Boys 200 10.0 20.0 28.5 23.0 18.5
Girls 196 12.2 23.5 25.5 24.0 14.8 Kerala
Pooled 396 11.1 21.7 27.0 23.5 16.7
Boys 344 13.7 27.6 33.1 19.2 6.4
Girls 331 14.2 26.9 33.5 18.7 6.6 Tamil Nadu
Pooled 675 13.9 27.3 33.3 19.0 6.5
Boys 258 22.1 25.2 27.5 15.1 10.1
Girls 256 23.4 29.7 25.8 11.7 9.4 Karnataka
Pooled 514 22.8 27.4 26.7 13.4 9.7
Boys 228 15.8 27.6 27.2 21.1 8.3
Girls 203 23.2 30.5 28.6 12.8 4.9 Andhra Pradesh
Pooled 431 19.3 29.0 27.8 17.2 6.7
Boys 373 21.7 27.6 27.6 16.6 6.4
Girls 329 23.7 26.7 31.0 12.5 6.1 Maharashtra
Pooled 702 22.6 27.2 29.2 14.7 6.3
Boys 290 31.0 21.4 20.3 17.9 9.3
Girls 272 26.8 18.0 22.4 19.1 13.6 Madhya Pradesh
Pooled 562 29.0 19.8 21.4 18.5 11.4
Boys 253 43.9 28.1 16.6 7.5 4.0
Girls 252 48.8 25.0 13.9 8.7 3.6 Gujarat
Pooled 505 46.3 26.5 15.2 8.1 3.8
Boys 294 28.2 30.6 22.8 12.9 5.4
Girls 331 29.0 34.1 21.1 10.6 5.1 Orissa
Pooled 625 28.6 32.5 21.9 11.7 5.3
Boys 217 31.3 23.0 29.0 9.7 6.9
Girls 229 31.9 27.1 22.7 12.2 6.1 West Bengal
Pooled 446 31.6 25.1 25.8 11.0 6.5
Boys 2457 24.1 26.0 26.0 15.9 8.0
Girls 2399 25.9 27.0 25.2 14.3 7.6 Pooled
Pooled 4856 25.0 26.5 25.6 15.1 7.8
* : NCHS Standards

NNMB Rural Survey 2005-06 121 Diet & Nutritional status, HTN, DM and IDA
Table 15.1: Distribution (%) of 1-5 years Children according to Weight for Height - Standard Deviation (SD) Classification: by Age groups
Weight for Height*
STATE Age
group (yrs)
n < Median -3SD
Median -3SD to Median
-2SD
Median -2SD to Median
-1SD
Median -1SD to Median
≥≥≥≥ Median
<1 106 0.0 7.5 28.3 32.1 1-3 219 1.8 8.7 43.4 33.3 12.8 3-5 177 1.1 9.6 37.9 35.6 15.8
Kerala
1-5 396 1.5 9.1 40.9 34.3 14.1 <1 199 1.5 3.5 22.1 51.8 21.1 1-3 343 .9 7.9 50.7 32.1 8.5 3-5 332 .9 14.2 42.5 34.6 7.8
Tamil Nadu
1-5 675 .9 11.0 46.7 33.3 8.1 <1 86 3.5 3.5 31.4 43.0 18.6 1-3 256 1.6 10.9 41.4 33.6 12.5 3-5 258 1.9 10.5 50.4 24.0 13.2
Karnataka
1-5 514 1.8 10.7 45.9 28.8 12.8 <1 103 0.0 2.9 29.4 39.2 28.4 1-3 229 3.1 13.1 48.5 28.4 7.0 3-5 202 1.5 14.4 49.0 29.7 5.4
Andhra Pradesh
1-5 431 2.3 13.7 48.7 29.0 6.3 <1 112 0.0 4.5 17.0 42.9 35.7 1-3 352 .9 9.7 50.6 32.4 6.5 3-5 350 .0 17.1 44.6 34.0 4.3
Maharashtra
1-5 702 .4 13.4 47.6 33.2 5.4 <1 79 6.3 20.3 24.1 31.6 17.7 1-3 262 10.3 12.6 34.4 22.9 19.8 3-5 300 7.3 17.3 29.0 27.3 19.0
Madhya Pradesh
1-5 562 8.7 15.1 31.5 25.3 19.4 <1 135 22.0 18.9 19.7 23.5 15.9 1-3 265 1.5 17.4 35.8 26.4 18.9 3-5 240 2.9 11.7 32.1 32.5 20.8
Gujarat
1-5 505 2.2 14.7 34.1 29.3 19.8 <1 129 2.4 12.6 27.6 42.5 15.0 1-3 286 1.4 17.5 42.7 29.7 8.7 3-5 339 1.5 11.5 36.9 38.1 12.1
Orissa
1-5 625 1.4 14.2 39.5 34.2 10.6 <1 29 0.0 3.4 13.8 37.9 44.8 1-3 216 3.7 9.3 40.3 32.9 13.9 3-5 230 2.6 10.4 37.4 34.3 15.2
West Bengal
1-5 446 3.1 9.9 38.8 33.6 14.6 <1 978 4.4 8.6 24.1 39.4 23.5 1-3 2428 2.6 11.8 43.6 30.2 11.7 3-5 2428 2.2 13.3 39.9 32.4 12.2
Pooled
1-5 4856 2.4 12.6 41.7 31.3 12.0

NNMB Rural Survey 2005-06 122 Diet & Nutritional status, HTN, DM and IDA
Table 15.2: Distribution (%) of 1-5 years Children according to Weight for Height - Standard
Deviation (SD) Classification : by Gender
Weight for Height*
STATE Gender n < Median -3SD
Median -3SD to Median
-2SD
Median -2SD to Median
-1SD
Median -1SD to Median
≥≥≥≥ Median
Boys 200 1.0 8.5 38.0 39.0 13.5
Girls 196 2.0 9.7 43.9 29.6 14.8 Kerala
Pooled 396 1.5 9.1 40.9 34.3 14.1
Boys 344 .6 11.6 46.5 33.1 8.1
Girls 331 1.2 10.3 46.8 33.5 8.2 Tamil Nadu
Pooled 675 .9 11.0 46.7 33.3 8.1
Boys 258 1.6 12.8 48.1 27.5 10.1
Girls 256 2.0 8.6 43.8 30.1 15.6 Karnataka
Pooled 514 1.8 10.7 45.9 28.8 12.8
Boys 228 3.1 14.5 46.1 30.3 6.1
Girls 203 1.5 12.8 51.7 27.6 6.4 Andhra Pradesh
Pooled 431 2.3 13.7 48.7 29.0 6.3
Boys 373 .5 14.2 48.5 31.6 5.1
Girls 329 .3 12.5 46.5 35.0 5.8 Maharashtra
Pooled 702 .4 13.4 47.6 33.2 5.4
Boys 290 8.3 18.6 32.4 23.8 16.9
Girls 272 9.2 11.4 30.5 26.8 22.1 Madhya Pradesh
Pooled 562 8.7 15.1 31.5 25.3 19.4
Boys 253 2.8 14.2 37.9 26.5 18.6
Girls 252 1.6 15.1 30.2 32.1 21.0 Gujarat
Pooled 505 2.2 14.7 34.1 29.3 19.8
Boys 294 1.7 13.9 37.8 38.1 8.5
Girls 331 1.2 14.5 41.1 30.8 12.4 Orissa
Pooled 625 1.4 14.2 39.5 34.2 10.6
Boys 217 3.7 9.7 37.3 35.0 14.3
Girls 229 2.6 10.0 40.2 32.3 14.8 West Bengal
Pooled 446 3.1 9.9 38.8 33.6 14.6
Boys 2457 2.5 13.3 41.8 31.5 10.8
Girls 2399 2.3 11.8 41.6 31.1 13.2 Pooled
Pooled 4856 2.4 12.6 41.7 31.3 12.0
* : NCHS Standards

NNMB Rural Survey 2005-06 123 Diet & Nutritional status, HTN, DM and IDA
Table 16: Prevalence (%) of Undernutrition among 0-60 months children according to SD classification using WHO Child Growth standards*
Weight for Age Height for Age Weight for Height BMI for Age
Age (Months) n <Median
-3SD
Median -3SD to Median -2SD
�Median -2SD
<Median -3SD
Median -3SD to Median -2SD
�Median -2SD
<Median -3SD
Median -3SD to Median -2SD
�Median -2SD
<Median -3SD
Median -3SD to Median -2SD
Median -2SD to
Median+2SD
�Median +2SD
<6 381 10.8 15.7 73.5 6.3 11.1 82.6 19.3 10.1 70.6 16.1 15.0 66.2 2.7
6-12 597 11.6 18.8 69.6 10.7 17.3 72.0 10.2 10.6 79.2 11.4 10.4 75.0 3.2
12-18 662 13.4 20.7 65.9 20.7 22.7 56.6 7.4 14.2 78.4 11.3 9.7 79.5 3.5
18-24 574 18.6 25.8 55.6 28.5 27.4 44.1 8.0 12.6 79.4 5.8 8.9 83.3 2.0
24-30 649 11.7 28.2 60.1 19.3 29.9 50.8 4.8 12.6 82.6 4.8 8.9 83.4 2.9
30-36 545 19.8 26.6 53.6 23.3 28.1 48.6 5.9 12.8 81.3 5.1 8.1 84.6 2.2
36-42 819 12.2 27.2 60.6 20.9 22.9 56.2 5.4 12.5 82.1 4.9 10.4 81.7 3.0
42-48 453 13.0 33.6 53.4 20.1 32.5 47.4 3.1 14.8 82.1 2.4 9.3 86.3 2.0
48-54 770 13.2 30.8 56.0 20.5 26.7 52.8 4.3 13.8 81.9 3.3 11.3 83.3 2.1
54-60 387 18.6 34.1 47.3 20.0 32.2 47.8 4.9 16.1 79.0 2.6 11.9 84.7 0.8
0-60 5837 14.1 26.2 59.7 19.5 25.1 55.4 6.9 13.0 80.1 6.1 10.2 81.2 2.5
* : Geneva: WHO, April 2006

NNMB Rural Survey 2005-06 124 Diet & Nutritional status, HTN, DM and IDA
Table 17.1: Distribution (%) of 6-17 years Children according to Weight for Age – Standard Deviation (SD) Classification by age group
Weight for Age* Age
Group (yrs)
STATE n < Median -3SD
Median -3SD to Median -2SD
Median -2SD to Median -1SD
Median -1SD to Median ≥≥≥≥ Median
Kerala 290 2.8 21.0 36.6 22.8 16.9 Tamil Nadu 518 6.9 40.5 40.7 9.5 2.3 Karnataka 491 5.9 36.7 42.4 11.6 3.5 Andhra Pradesh 461 5.4 35.6 38.0 15.6 5.4 Maharashtra 597 5.4 37.9 38.9 14.2 3.7 Gujarat 632 9.0 29.1 32.0 20.7 9.2 Madhya Pradesh 452 7.3 35.2 36.1 13.7 7.7 Orissa 563 7.5 35.0 40.0 13.0 4.6 West Bengal 503 5.6 38.0 37.0 14.1 5.4
6 - 9
Pooled 4507 6.4 34.9 37.9 14.8 6.0 Kerala 306 1.3 25.2 41.5 19.6 12.4 Tamil Nadu 395 2.5 48.1 39.2 7.8 2.3 Karnataka 490 2.9 37.8 42.4 13.3 3.7 Andhra Pradesh 436 .7 32.6 44.5 17.0 5.3 Maharashtra 578 2.2 41.7 43.6 10.2 2.2 Gujarat 533 4.3 35.8 29.1 17.6 13.1 Madhya Pradesh 372 3.8 37.9 39.8 15.3 3.2 Orissa 506 2.0 29.8 48.4 15.6 4.2 West Bengal 450 2.2 32.0 42.9 18.7 4.2
10-13
Pooled 4066 2.5 36.0 41.2 14.8 5.5 Kerala 271 1.1 26.2 46.5 21.8 4.4 Tamil Nadu 354 9.0 39.0 38.1 11.0 2.8 Karnataka 421 4.0 39.0 39.9 14.7 2.4 Andhra Pradesh 334 4.8 29.6 47.9 14.7 3.0 Maharashtra 536 6.5 39.2 41.2 11.4 1.7 Gujarat 561 7.8 29.8 36.2 23.4 2.9 Madhya Pradesh 295 4.7 24.7 48.1 21.0 1.4 Orissa 343 3.8 25.1 52.5 16.3 2.3 West Bengal 329 3.3 33.1 44.7 16.4 2.4
14-17
Pooled 3444 5.4 32.4 43.0 16.6 2.5
Table 17.2: Distribution (%) of 6-17 years Children according to Weight for Age – Standard Deviation (SD) Classification : By Gender (States Pooled)
Weight for Age* Age
Group (yrs)
Gender n < Median
-3SD Median -3SD to
Median -2SD Median -2SD to
Median -1SD Median -1SD to
Median ≥≥≥≥ Median
Boys 2267 8.5 38.2 35.0 13.0 5.3 Girls 2240 4.3 31.5 40.8 16.6 6.7 6-9 Pooled 4507 6.4 34.9 37.9 14.8 6.0 Boys 2013 3.1 38.6 40.0 12.7 5.7 Girls 2053 1.9 33.4 42.5 17.0 5.3 10-13 Pooled 4066 2.5 36.0 41.2 14.8 5.5 Boys 1554 8.6 36.4 36.7 15.8 2.4 Girls 1890 2.7 29.2 48.3 17.3 2.6 14-17 Pooled 3444 5.4 32.4 43.0 16.6 2.5
* : NCHS Standards

NNMB Rural Survey 2005-06 125 Diet & Nutritional status, HTN, DM and IDA
Table 18.1 : Distribution (%) of 6-17 years Children according to Height for Age – Standard Deviation (SD) Classification by age group
Height for Age* Age Group
(yrs) STATE n < Median
-3SD Median -3SD to
Median -2SD Median -2SD to
Median -1SD Median -1SD
to Median ≥≥≥≥ Median
Kerala 290 1.0 7.6 34.5 34.1 22.8 Tamil Nadu 518 8.9 26.8 39.0 19.1 6.2 Karnataka 491 5.5 19.8 38.5 25.5 10.8 Andhra Pradesh 461 5.6 20.6 30.8 26.9 16.1 Maharashtra 597 4.9 18.6 38.2 28.0 10.4 Gujarat 631 11.7 20.4 27.9 28.4 11.6 Madhya Pradesh 452 13.7 30.8 26.5 19.2 9.7 Orissa 563 9.4 23.3 33.2 22.2 11.9 West Bengal 502 10.0 24.7 32.1 20.1 13.1
6 - 9
Pooled 4505 8.2 21.9 33.4 24.6 11.9 Kerala 306 2.9 16.7 36.6 30.7 13.1 Tamil Nadu 395 7.8 34.7 37.0 16.7 3.8 Karnataka 490 7.3 25.1 37.3 21.6 8.6 Andhra Pradesh 436 4.4 18.1 37.8 30.5 9.2 Maharashtra 578 6.4 24.2 40.5 23.2 5.7 Gujarat 533 13.3 25.0 25.9 21.0 14.8 Madhya Pradesh 372 17.5 36.0 28.5 14.5 3.5 Orissa 506 8.5 23.7 36.8 23.1 7.9 West Bengal 450 11.8 24.0 35.1 19.6 9.6
10-13
Pooled 4066 9.0 25.2 35.1 22.2 8.5 Kerala 271 3.3 20.3 40.6 29.2 6.6 Tamil Nadu 354 9.6 33.3 35.9 20.1 1.1 Karnataka 421 5.5 29.2 34.9 24.2 6.2 Andhra Pradesh 334 3.0 21.0 43.4 25.4 7.2 Maharashtra 536 6.9 27.2 39.7 21.1 5.0 Gujarat 561 20.5 23.0 28.3 24.4 3.7 Madhya Pradesh 295 13.9 33.2 36.9 13.9 2.0 Orissa 343 8.5 29.7 38.5 20.1 3.2 West Bengal 329 8.5 30.4 40.1 17.3 3.6
14-17
Pooled 3444 9.5 27.3 37.0 21.9 4.3
Table 18.2: Distribution (%) of 6-17 years Children according to Height for Age - Standard Deviation (SD) Classification : By Gender (States Pooled)
Height for Age* Age Group
(yrs) Gender n < Median
-3SD Median -3SD to
Median-2SD Median -2SD to
Median -1SD Median -1SD to
Median ≥≥≥≥ Median
Boys 2266 9.8 22.8 32.4 23.3 11.7 Girls 2239 6.6 21.0 34.4 25.8 12.2 6-9 Pooled 4505 8.2 21.9 33.4 24.6 11.9 Boys 2013 7.1 26.1 34.7 22.7 9.4 Girls 2053 10.8 24.3 35.5 21.8 7.5 10-13 Pooled 4066 9.0 25.2 35.1 22.2 8.5 Boys 1554 10.9 27.2 33.0 22.7 6.2 Girls 1890 8.3 27.4 40.3 21.2 2.8 14-17 Pooled 3444 9.5 27.3 37.0 21.9 4.3
* : NCHS Standards

NNMB Rural Survey 2005-06 126 Diet & Nutritional status, HTN, DM and IDA
Table 19.1: Distribution (%) of 10-17 years Children according to BMI age and Gender specific centiles* - by age group
Nutritional Grades Age
Group (yrs)
STATE n Undernutrition (<5th Centile)
Normal (5th-85th Cent.)
Overweight (85th-95th Cent.)
Obese (≥≥≥≥ 95th Centile)
Kerala 306 47.7 50.7 1.6 .0
Tamil Nadu 395 67.3 31.6 .8 .3
Karnataka 490 62.7 36.3 .6 .4
Andhra Pradesh 436 60.8 39.2 .0 .0
Maharashtra 578 69.4 30.1 .3 .2
Gujarat 533 49.3 48.0 2.3 .4
Madhya Pradesh 372 49.7 47.6 1.9 .8
Orissa 506 51.6 48.4 .0 .0
West Bengal 450 50.4 47.8 .9 .9
10-13
Pooled 4066 57.1 41.7 .9 .3
Kerala 271 25.8 72.7 1.5 .0
Tamil Nadu 354 38.7 60.7 .3 .3
Karnataka 421 35.9 63.4 .7 .0
Andhra Pradesh 334 36.8 62.3 .9 .0
Maharashtra 536 42.9 56.5 .4 .2
Gujarat 561 22.8 75.4 1.4 .4
Madhya Pradesh 295 17.3 81.7 1.0 .0
Orissa 343 20.1 79.0 .6 .3
West Bengal 329 23.1 75.4 1.5 .0
14-17
Pooled 3444 30.1 68.9 .9 .1
Table 19.2: Distribution (%) of 10-17 years Children according to BMI age and Gender specific centiles* - by Gender (States Pooled)
Nutritional Grades Age Group (yrs)
Gender n Undernutrition (<5th Centile)
Normal (5th -85th Cent.)
Overweight (85th -95th Cent.)
Obese (≥≥≥≥ 95th Cent.)
Boys 2013 65.3 33.4 1.0 .3
Girls 2053 49.0 49.9 .8 .3 10-13
Pooled 4066 57.1 41.7 .9 .3
Boys 1554 44.8 54.4 .5 .3
Girls 1890 17.9 80.8 1.2 .0 14-17
Pooled 3444 30.1 68.9 .9 .1
* : NHANES References

NNMB Rural Survey 2005-06 127 Diet & Nutritional status, HTN, DM and IDA
Table20: Distribution (%) of Adult Men (≥≥≥≥ 18 years) according to BMI*
BMI Grades*
Over Weight/ Obesity
STATE
n < 16
(CED III) 16-17
(CED II) 17-18.5 (CED I)
18.5-20 (Low Wt. Normal)
20-25 (Normal)
25-30 (Obese I)
≥ 30 (Obese II)
Chronic Energy
Deficiency (<18.5)
Normal (18.5-25)
(≥25) (≥23)
Kerala 1006 5.7 6.6 15.4 18.9 39.0 13.1 1.4 27.7 57.8 14.5 26.7
Tamil Nadu 1443 5.7 7.1 17.0 18.9 40.1 10.6 .6 29.8 59.0 11.2 22.5
Karnataka 1521 8.5 10.5 23.4 20.9 29.5 6.8 .5 42.4 50.3 7.3 14.9
Andhra Pradesh 1845 5.9 7.6 18.8 20.9 36.9 8.3 1.7 32.3 57.7 10.0 20.5
Maharashtra 1851 5.6 9.5 23.1 21.1 33.1 6.8 1.0 38.2 54.0 7.8 17.1
Gujarat 1710 6.3 6.8 13.7 15.8 48.0 8.7 .8 26.8 63.7 9.5 23.6
Madhya Pradesh 1719 3.9 6.0 18.7 27.2 41.4 2.5 .3 28.6 68.6 2.8 9.4
Orissa 1432 5.7 9.8 22.9 26.9 30.4 3.6 .6 38.4 57.4 4.2 10.3
West Bengal 1512 4.5 7.1 22.4 24.0 37.2 4.8 .1 34.0 61.1 4.9 12.6
Pooled 14039 5.7 7.9 19.6 21.7 37.3 7.0 .8 33.2 59.0 7.8 17.2
*BMI : Body Mass Index, using James et al classification

NNMB Rural Survey 2005-06 128 Diet & Nutritional status, HTN, DM and IDA
Table 21: Distribution (%) of Adult Women (≥ 18 years) according to BMI*
BMI Grades*
Over Weight/ Obesity
STATE
n < 16
(CED III) 16-17
(CED II) 17-18.5 (CED I)
18.5-20 (Low Wt. Normal)
20-25 (Normal)
25-30 (Obese I)
≥ 30 (Obese II)
Chronic Energy
Deficiency (<18.5)
Normal (18.5-25)
(≥25) (≥23)
Kerala 2136 4.6 5.5 11.0 13.5 41.3 20.4 3.6 21.1 54.9 24.0 39.3
Tamil Nadu 2113 6.5 8.7 17.3 18.5 33.7 12.2 3.1 32.5 52.2 15.3 25.1
Karnataka 2161 10.8 11.1 20.5 18.1 30.8 7.5 1.3 42.4 48.8 8.8 17.0
Andhra Pradesh 2168 10.2 10.1 20.1 16.9 30.9 9.6 2.2 40.4 47.8 11.8 20.7
Maharashtra 2249 9.9 10.6 20.7 19.8 30.1 7.3 1.5 41.2 50.0 8.8 16.4
Gujarat 2216 6.5 7.6 16.1 17.6 40.4 9.7 2.0 30.2 58.1 11.7 22.4
Madhya Pradesh 1789 4.6 6.4 19.8 22.5 41.9 3.9 .8 30.8 64.5 4.7 10.7
Orissa 2018 10.6 12.0 25.0 21.7 26.1 3.9 .7 47.6 47.8 4.6 10.1
West Bengal 1753 7.5 8.6 21.3 20.2 35.7 6.0 .7 37.4 55.9 6.7 14.7
Pooled 18603 8.0 9.0 19.0 18.7 34.4 9.1 1.8 36.0 53.1 10.9 19.9
*BMI : Body Mass Index, using James et al classification

NNMB Rural Survey 2005-06 129 Diet & Nutritional status, HTN, DM and IDA
Table 22 a: Distribution (%) of 1-5 year children according to Nutritional Status (Standard Deviation Classification) by Socio-Economic and Demographic characteristics
Wt. For Age Ht. For Age Wt. For Ht.
Particulars n Under weight
Normal χχχχ2 Stunting Normal χχχχ2 Wasting Normal χχχχ2
Religion Hindu 4214 55.6 44.4 51.7 48.3 15.7 84.3 Muslim 430 47.2 52.8 48.8 51.2 8.6 91.4 Christian 89 47.2 52.8 43.8 56.2 13.5 86.5 Others 122 63.9 36.1 58.2 41.8 13.9 86.1 Pooled 4855 54.9 45.1
17.3; p<.001
51.5 48.5
5.604; NS
15.0 85.0
15.64; p<.001
Community Scheduled Tribe
642 62.7 37.3 57.6 42.4 17.9 82.1
Scheduled Caste
1181 57.1 42.9 55.0 45.0 15.4 84.6
Backward Caste
1756 52.0 48.0 48.0 52.0 14.3 85.7
Others 1276 53.1 46.9 49.9 50.1 14.0 86.0 Pooled 4855 54.9 45.1
25.7; p<0.001
51.5 48.5
25.5; p<0.001
15.0 85.0
6.06; NS
Type of Family Nuclear 2593 56.4 43.6 52.7 47.3 16.0 84.0 Extended Nuclear
961 54.5 45.5 50.5 49.5 12.4 87.6
Joint 1301 52.5 47.5 49.9 50.1 14.9 85.1 Pooled 4855 54.9 45.1
5.44; NS
51.5 48.5
3.2; NS
15.0 85.0
7.08; p<0.05
Type of House Kutcha 1180 60.0 40.0 55.1 44.9 16.4 83.6 Semi Pucca 3038 54.8 45.2 52.3 47.7 14.9 85.1 Pucca 637 46.0 54.0 41.1 58.9 12.4 87.6 Pooled 4855 54.9 45.1
32.9; p<0.001
51.5 48.5
34.2; p<0.001
15.0 85.0
5.3; NS
Land Holding No land 2517 55.4 44.6 52.6 47.4 15.7 84.3 Marginal Farmers
1415 54.7 45.3 49.1 50.9 14.5 85.5
Small Farmers
417 56.4 43.6 54.2 45.8 14.4 85.6
Large Farmers
506 52.0 48.0 50.6 49.4 13.2 86.8
Pooled 4855 54.9 45.1
2.4; NS
51.5 48.5
5.74; NS
15.0 85.0
2.59; NS
Per Capita Income (Rs./Month) <300 1829 59.8 40.2 56.9 43.1 14.2 85.8 300-600 1738 55.8 44.2 52.0 48.0 15.9 84.1 600-900 618 47.3 52.7 46.8 53.2 15.4 84.6 ≥900 670 46.5 53.5 39.7 60.3 14.3 85.7 Pooled 4855 54.9 45.1
51.6; p<0.001
51.5 48.5
64.6; p<0.001
15.0 85.0
25.5; NS

NNMB Rural Survey 2005-06 130 Diet & Nutritional status, HTN, DM and IDA
Table 22b : Distribution (%) of 1-5 year children according to Nutritional Status (Standard Deviation Classification) by Socio-Economic and Demographic characteristics
Wt. For Age Ht. For Age Wt. For Ht.
Particulars n Under
weight Normal χχχχ2 Stunting Normal χχχχ2 Wasting Normal χχχχ2
Occupation of HH
Landless Agri.
Labourer 779 60.0 40.0 52.8 47.2 19.9 80.1
Other Labourer 1505 57.5 42.5 55.6 44.4 16.9 83.1
Owner
Cultivator 1032 54.8 45.2 52.6 47.4 13.4 86.6
Landlord 40 50.0 50.0 45.0 55.0 10.0 90.0
Tenant
Cultivator 50 48.0 52.0 40.0 60.0 8.0 92.0
Artisans 397 51.4 48.6 48.6 51.4 11.3 88.7
Service 427 51.4 48.6 44.5 55.5 13.3 86.7
Business 425 46.2 53.8 45.9 54.1 8.7 91.3
Others 200 52.5 47.5 46.5 53.5 16.5 83.5
Pooled 4855 54.9 45.1
31.03;
p<0.001
51.5 48.5
31.62;
p<0.001
15.0 85.0
42.3;
p<0.001
Literacy Status of Father
Illiterate 1456 59.9 40.1 58.2 41.8 15.9 84.1
Read & Write 92 60.2 39.8 52.2 47.8 19.6 80.4
1-4 std. 621 55.5 44.5 54.6 45.4 17.2 82.8
5-8 std. 1249 54.4 45.6 48.6 51.4 15.3 84.7
9-12 std. 1186 50.4 49.6 45.9 54.1 12.1 87.9
College 251 46.6 53.4 45.8 54.2 13.9 86.1
Pooled 4855 54.9 45.1
32.6;
p<0.001
51.5 48.5
50.86;
p<0.001
15.0 85.0
12.84;
p<0.05
Literacy Status of Mother
Illiterate 2229 60.1 39.9 57.2 42.8 16.9 83.1
Read & Write 86 48.8 51.2 49.4 50.6 17.6 82.4
1-4 std. 542 54.2 45.8 50.9 49.1 13.7 86.3
5-8 std. 1059 53.3 46.7 50.0 50.0 14.8 85.2
9-12 std. 850 46.5 53.5 41.1 58.9 11.4 88.6
College 93 37.6 62.4 33.3 66.7 7.5 92.5
Pooled 4859 54.9 45.1
62.62;
p<0.001
51.5 48.5
79.35;
p<0.001
15.0 85.0
20.39;
p<0.001
Family Size
1-4 1403 53.1 46.9 50.1 49.9 15.5 84.5
5-7 2613 56.0 44.0 51.9 48.1 14.8 85.2
≥≥≥≥8 839 54.8 45.2 52.4 47.6 14.7 85.3
Pooled 4855 54.9 45.1
3.08;
p<0.05
51.5 48.5
1.56;
NS
15.0 85.0
.387;
NS
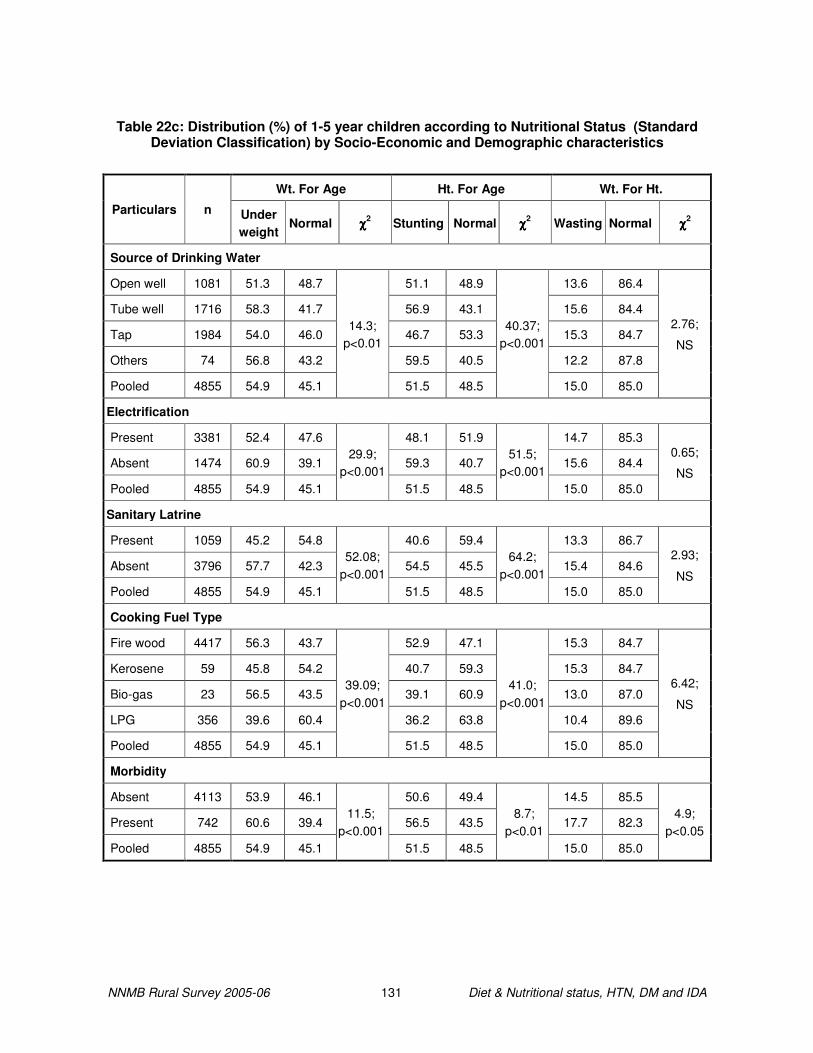
NNMB Rural Survey 2005-06 131 Diet & Nutritional status, HTN, DM and IDA
Table 22c: Distribution (%) of 1-5 year children according to Nutritional Status (Standard Deviation Classification) by Socio-Economic and Demographic characteristics
Wt. For Age Ht. For Age Wt. For Ht.
Particulars n Under weight
Normal χχχχ2 Stunting Normal χχχχ2 Wasting Normal χχχχ2
Source of Drinking Water
Open well 1081 51.3 48.7 51.1 48.9 13.6 86.4
Tube well 1716 58.3 41.7 56.9 43.1 15.6 84.4
Tap 1984 54.0 46.0 46.7 53.3 15.3 84.7
Others 74 56.8 43.2 59.5 40.5 12.2 87.8
Pooled 4855 54.9 45.1
14.3; p<0.01
51.5 48.5
40.37; p<0.001
15.0 85.0
2.76;
NS
Electrification
Present 3381 52.4 47.6 48.1 51.9 14.7 85.3
Absent 1474 60.9 39.1 59.3 40.7 15.6 84.4
Pooled 4855 54.9 45.1
29.9; p<0.001
51.5 48.5
51.5; p<0.001
15.0 85.0
0.65;
NS
Sanitary Latrine
Present 1059 45.2 54.8 40.6 59.4 13.3 86.7
Absent 3796 57.7 42.3 54.5 45.5 15.4 84.6
Pooled 4855 54.9 45.1
52.08; p<0.001
51.5 48.5
64.2; p<0.001
15.0 85.0
2.93;
NS
Cooking Fuel Type
Fire wood 4417 56.3 43.7 52.9 47.1 15.3 84.7
Kerosene 59 45.8 54.2 40.7 59.3 15.3 84.7
Bio-gas 23 56.5 43.5 39.1 60.9 13.0 87.0
LPG 356 39.6 60.4 36.2 63.8 10.4 89.6
Pooled 4855 54.9 45.1
39.09; p<0.001
51.5 48.5
41.0; p<0.001
15.0 85.0
6.42;
NS
Morbidity
Absent 4113 53.9 46.1 50.6 49.4 14.5 85.5
Present 742 60.6 39.4 56.5 43.5 17.7 82.3
Pooled 4855 54.9 45.1
11.5; p<0.001
51.5 48.5
8.7; p<0.01
15.0 85.0
4.9; p<0.05

NNMB Rural Survey 2005-06 132 Diet & Nutritional status, HTN, DM and IDA
Table 23a: Distribution (%) of Adults (≥≥≥≥18 years) according to BMI Grades
by Socio-Economic and Demographic characteristics
BMI* Grades
Particulars n Chronic Energy Deficiency (<18.5)
Normal (18.5 – 25)
Overweight (≥≥≥≥ 25) χχχχ2
Religion
Hindu 28831 35.6 55.6 8.8 Muslim 2438 27.6 55.8 16.6 Christian 740 21.2 57.2 21.6 Others 633 39.8 54.0 6.2 Pooled 32642 34.8 55.6 9.6
350.4 P<0.001
Community Scheduled Tribe 3275 41.9 54.6 3.5 Scheduled Caste 7033 38.4 55.3 6.3 Backward Caste 11972 34.2 54.5 11.3 Others 10362 30.8 57.4 11.8 Pooled 32642 34.8 55.6 9.6
424.3 P<0.001
Type of House Kutcha 7134 38.3 55.3 6.3 Semi Pucca 20222 35.8 55.6 8.6 Pucca 5286 26.2 56.1 17.7 Pooled 32642 34.8 55.6 9.6
604.8 P<0.001
Type of Family Nuclear 17418 34.0 56.1 9.9 Extended Nuclear 6588 37.6 53.1 9.3 Joint 8636 34.2 56.7 9.1 Pooled 32642 34.8 55.6 9.6
33.4 P<0.001
Occupation of Head of Household
Landless Agri. Labourer 4853 42.1 52.3 5.5 Other Labourer 8258 38.5 55.4 6.1 Owner Cultivator 8326 34.8 57.8 7.4 Landlord 482 27.4 54.1 18.5 Tenant Cultivator 363 36.4 57.9 5.8 Artisans 2198 33.1 54.6 12.3 Service 2823 27.3 56.9 15.8 Business 2961 25.3 55.3 19.4 Others 2378 30.3 55.2 14.6 Pooled 32642 34.8 55.6 9.6
1034.2 P<0.001

NNMB Rural Survey 2005-06 133 Diet & Nutritional status, HTN, DM and IDA
Table 23b: Distribution (%) of Adults (≥≥≥≥18 years) according to BMI Grades by Socio-Economic and Demographic characteristics
BMI* Grades Particulars n Chronic Energy
Deficiency (<18.5) Normal
(18.5 – 25) Overweight
(≥≥≥≥ 25) χχχχ2
Literacy status of Males
Illiterate 4356 40.1 56.5 3.4 Read & Write 401 31.4 60.3 8.2 1-4 Standard 2088 33.9 59.4 6.8 5-8 Standard 3421 31.9 59.8 8.3 9-12 Standard 2940 28.5 59.0 12.5 College 833 19.0 67.0 14.0 Pooled 14039 33.2 59.0 7.8
385.4 P<0.001
Literacy status of Females
Illiterate 8730 41.9 51.6 6.5 Read & Write 452 31.0 58.4 10.6 1-4 Standard 2194 32.8 55.0 12.2 5-8 Standard 3812 32.4 54.0 13.6 9-12 Standard 2992 28.6 53.2 18.2 College 423 19.6 58.4 22.0 Pooled 18603 36.0 53.1 10.9
575.8; p<0.001
Per Capita Income (Rs./Month) < 300 8999 43.2 51.7 5.1 300-600 11218 36.9 55.4 7.7 600-900 5229 31.6 58.0 10.4
≥900 7196 23.4 59.1 17.6
Pooled 32642 34.8 55.6 9.6
1239.9 P<0.001
Land Holding (Acres) No Land 14917 34.3 55.7 10.0 Marginal farmers 10273 36.8 54.2 9.0 Small farmers 3281 36.1 55.4 8.5 Large farmers 4171 30.6 59.0 10.5 Pooled 32642 34.8 55.6 9.6
62.2 P<0.001
Family Size 1-4 12569 33.7 55.7 10.7 5-7 15928 35.5 55.8 8.7
≥8 4145 35.5 55.0 9.6
Pooled 32642 34.8 55.6 9.6
34.7 P<0.001

NNMB Rural Survey 2005-06 134 Diet & Nutritional status, HTN, DM and IDA
Table 23c: Distribution (%) of Adults (≥≥≥≥18 years) according to BMI Grades by Socio-Economic and Demographic characteristics
BMI* Grades Particulars n Chronic Energy
Deficiency (<18.5) Normal
(18.5 – 25) Overweight
(≥≥≥≥ 25) χχχχ2
Electrification
Present 24332 32.1 56.4 11.6
Absent 8310 42.7 53.5 3.8
Pooled 32642 34.8 55.6 9.6
605.2 P<0.001
Source of Drinking Water
Open well 7445 31.1 57.4 11.5
Tube well 11496 36.7 56.0 7.3
Tap 13108 35.2 54.2 10.6
Others 594 35.5 57.2 7.2
Pooled 32642 34.8 55.6 9.6
157.4 P<0.001
Sanitary Latrine
Present 9234 24.4 57.4 18.3
Absent 23408 38.9 54.9 6.2
Pooled 32642 34.8 55.6 9.6
1420.8 P<0.001
Type of Cooking Fuel
Fire wood 28548 36.8 55.5 7.6
Kerosene 304 33.9 53.3 12.8
Bio-gas 237 24.5 59.5 16.0
LPG 3553 19.1 56.3 24.6
Pooled 32642 34.8 55.6 9.6
1255.4 P<0.001

NNMB Rural Survey 2005-06 135 Diet & Nutritional status, HTN, DM and IDA
Table 24: Distribution (%) of adult men according to prevalence of Anaemia
Anaemia
STATE n Normal
(≥≥≥≥ 13 g/dL) Mild (10 –13 g/dL)
Moderate (7 – 10 g/dL)
Severe (≤≤≤≤ 7 g/dL)
Mean (Hb g/dL)
SD
Kerala 339 32.2 61.0 6.5 0.3 12.1 1.56
Tamil Nadu 397 70.8 23.4 5.3 0.5 13.7 2.12
Karnataka 358 56.4 34.9 5.9 2.8 13.3 2.71
Andhra Pradesh 395 64.8 31.6 2.8 0.8 13.5 2.06
Maharashtra 406 47.8 44.6 7.6 0.0 12.8 1.86
Gujarat 422 34.6 49.6 15.6 0.2 11.9 2.08
Madhya Pradesh 329 31.6 60.8 7.6 0.0 12.2 1.45
Orissa 388 47.4 50.0 2.6 0.0 12.6 1.45
West Bengal 363 16.3 61.1 22.0 0.6 11.1 1.79
Pooled 3397 45.2 45.8 8.4 0.6 12.6 2.09
Table 25: Prevalence (%) of Aneamia among adult NPNL women – By State
Anaemia
STATE n Normal
(≥≥≥≥ 12 g/dL) Mild (10 –12 g/dL)
Moderate (7 – 10 g/dL)
Severe (≤≤≤≤ 7 g/dL)
Mean (Hb g/dL)
SD
Kerala 344 10.8 50.6 36.6 2.0 10.2 1.45
Tamil Nadu 395 51.4 33.6 14.2 0.8 11.9 1.94
Karnataka 370 39.2 36.5 20.5 3.8 11.6 2.68
Andhra Pradesh 370 32.2 44.6 20.8 2.4 11.1 1.82
Maharashtra 413 30.5 39.5 26.9 3.1 10.8 1.93
Gujarat 379 5.3 24.8 60.7 9.2 9.1 1.68
Madhya Pradesh 325 12.6 47.1 39.7 0.6 10.3 1.58
Orissa 381 27.8 60.7 11.5 0.0 11.1 1.27
West Bengal 352 8.5 40.7 47.7 3.1 9.9 1.61
Pooled 3329 24.8 41.9 30.5 2.8 10.7 1.99

NNMB Rural Survey 2005-06 136 Diet & Nutritional status, HTN, DM and IDA
Table 26: Prevalence (%) of Anaemia among Adult Men by Age group
Age group (Years) Category
20-30 30-40 40-50 50-60 60-70 70-80 ≥≥≥≥ 80 Pooled
n 789 1036 859 400 223 83 7 3397
Haemoglobin Level (g/dL) Mean ± (SD)
12.9 (1.97)
12.8 (1.99)
12.6 (2.03)
12.2 (2.32)
11.9 (2.24)
11.3 (2.49)
11.1 (1.30)
12.6 (2.09)
Normal (≥ 13 g/dL) 52.4 49.6 43.0 40.2 26.9 20.5 14.3 45.2
Mild Anaemia (10 –13 g/dL) 42.3 43.1 48.8 45.0 58.8 49.4 71.4 45.8
Moderate Anaemia (7 – 10 g/dL) 4.9 7.0 7.9 13.5 13.0 27.7 14.3 8.4
Severe Anaemia (≤ 7g/dL) .4 .3 .3 1.3 1.3 2.4 0.0 0.6
Table 27: Prevalence (%) of Anaemia among Adult NPNL Women by Age group
Age group (Years) Category
20-30 30-40 40-50 50-60 60-70 70-80 ≥≥≥≥ 80 Pooled
n 1054 1209 784 203 69 9 1 3329
Haemoglobin Level (g/dL) Mean ± (SD)
10.7 (2.01)
10.7 (2.08)
10.6 (1.92)
10.5 (1.74)
10.6 (1.86)
10.5 (1.53) 11.0 10.7
(1.99)
Normal (≥ 12 g/dL) 27.4 25.2 21.7 21.2 24.6 33.3 .0 24.8
Mild Anaemia (10 –12 g/dL) 39.9 41.2 45.0 41.8 46.4 22.2 100.0 41.9
Moderate Anaemia (7- 10 g/dL) 30.2 30.4 30.2 35.5 26.1 44.5 .0 30.5
Severe Anaemia (≤ 7g/dL) 2.5 3.2 3.1 1.5 2.9 .0 .0 2.8

NNMB Rural Survey 2005-06 137 Diet & Nutritional status, HTN, DM and IDA
Table 28: Prevalence (%) of Anaemia among adult men and women (NPNL)
by Socio-Economic and Demographic characteristics
Prevalence (%) of Anaemia Adult Men Adult Women (NPNL) Particulars
n % χχχχ2 n % χχχχ2 Religion
Hindu 2999 54.0 2962 74.6 Muslim 257 69.6 229 83.4 Christian 76 42.1 72 65.3 Others 65 50.8 66 80.3 Pooled 3397 54.8
29.12; p<0.001
3329 75.2
13.46; p<0.05
Community
Scheduled Tribe 364 60.2 351 78.6 Scheduled Caste 756 53.4 724 74.7 Backward Caste 1234 51.0 1226 72.7 Others 1043 58.5 1028 77.2 Pooled 3397 54.8
17.81; p<0.001
3329 75.2
8.77; p<0.05
Type of Family
Nuclear 2214 55.5 2201 75.0 Extended Nuclear 568 55.3 626 76.7 Joint 615 52.0 502 73.9 Pooled 3397 54.8
2.35; NS
3329 75.2
1.22; NS
Type of House
Kutcha 747 56.2 725 77.1 Semi Pucca 2117 56.1 2073 75.3 Pucca 533 47.7 531 71.9 Pooled 3397 54.8
13.08; p<0.001
3329 75.2
4.44; NS
Land Holdings (Acres) No land 1617 54.8 1669 75.9 Marginal Farmers 1100 56.1 1042 75.0 Small Farmers 312 55.1 291 75.3 Large Farmers 368 50.8 327 72.2 Pooled 3397 54.8
3.11; NS
3329 75.2
2.20; NS
Per Capita Income (Rs./Month) <300 942 53.4 938 72.3 300-600 1151 55.5 1174 75.0 600-900 561 57.0 524 78.4
≥900 743 53.8 693 76.8
Pooled 3397 54.8
2.4; NS
3329 75.2
8.1; P<0.05
Contd…

NNMB Rural Survey 2005-06 138 Diet & Nutritional status, HTN, DM and IDA
Table 29 : Prevalence (%) of Anaemia among adult men and women (NPNL) by Socio-Economic Parameters (Contd..)
Prevalence (%) of Anaemia
Adult Men Adult Women (NPNL) Particulars
n % χχχχ2 n % χχχχ2
Occupational Category
Landless Agri. Labourer 542 58.3 540 78.0
Other Labourer 915 55.0 934 72.4
Owner Cultivator 821 53.7 767 75.0
Landlord 39 64.1 33 75.8
Tenant Cultivator 44 54.5 35 74.3
Artisans 248 44.4 216 71.3
Service 270 49.3 335 76.7
Business 300 62.0 290 80.7
Others 218 56.9 179 74.9
Pooled 3397 54.8
25.38; p<0.001
3329 75.2
13.1; NS
Literacy Status
Illiterate 1001 56.4 1522 74.6
Read & Write 95 61.1 73 89.0
1-4 std. 511 59.7 368 78.0
5-8 std. 849 50.8 754 72.7
9-12 std. 754 54.8 547 76.1
College 187 48.1 65 78.5
Pooled 3397 54.8
16.45; p<0.05
3329 75.2
12.49; p<0.05
Family Size
1-4 1609 56.7 1637 75.3
5-7 1535 53.1 1500 74.7
≥≥≥≥8 253 53.0 192 78.1
Pooled 3397 54.8
4.60; NS
3329 75.2
1.1; NS
Contd…

NNMB Rural Survey 2005-06 139 Diet & Nutritional status, HTN, DM and IDA
Table 30: Prevalence (%) of Anaemia among adult men and women (NPNL) by Socio-Economic Parameters (Contd..)
Prevalence (%) of Anaemia
Adult Men Adult Women (NPNL) Particulars
n % χχχχ2 n % χχχχ2
Electrification
Present 2485 51.3 2428 74.1
Absent 912 64.3 901 78.0
Pooled 3397 54.8
44.86; p<0.001
3329 75.2
5.43; p<0.05
Source of Drinking Water
Open well 777 61.3 756 82.3
Tube well 1182 60.9 1191 79.8
Tap 1373 45.9 1331 66.9
Others 65 55.4 51 74.5
Pooled 3397 54.8
75.0; p<0.001
3329 75.2
82.67; p<0.001
Sanitary Latrine
Present 922 55.4 917 78.8
Absent 2475 54.6 2412 73.8
Pooled 3397 54.8
0.190; NS
3329 75.2
9.21; p<0.05
Cooking Fuel Type
Fire wood 2971 56.4 2927 75.8
Kerosene 33 33.3 39 61.5
Bio-gas 24 54.2 23 78.3
LPG 369 44.2 340 71.2
Pooled 3397 54.8
25.95; p<0.001
3329 75.2
7.48; NS

NNMB Rural Survey 2005-06 140 Diet & Nutritional status, HTN, DM and IDA
Table 30.1: Prevalence (%) of Morbidity according to Physiological Groups – Males
Age Group
Morbidity Infants (<1 Yr.)
Pre School children (1-5 Yr.)
School age children (5-12 Yr.)
Adolescents (12-17 Yr.)
Adults (≥≥≥≥ 18 Yr.)
n 502 2458 3883 2592 14039
NAD 88.2 84.3 90.0 93.8 93.7 Fever 7.6 10.2 7.4 4.4 4.6
Diarrhoea 3.0 2.3 .8 .5 .5
Dysentery .4 .4 .1 .0 .1 Acute Resp.Infection 4.4 5.3 2.7 1.7 1.5
Table 30.2: Prevalence (%) of Morbidity according to Physiological Groups – Females
Age Group
Morbidity Infants (<1 Yr.)
Pre School children (1-5 Yr.)
School age children (5-12 Yr.)
Adolescents (12-17 Yr.)
Adults (≥≥≥≥ 18 Yr.)
n 476 2401 3814 2937 18603 NAD 90.3 85.0 90.8 94.5 93.0
Fever 5.9 10.4 6.2 4.2 5.6
Diarrhoea 1.9 1.9 .8 .3 .6 Dysentery .2 .3 .1 .2 .1
Acute Resp.Infection 3.6 4.8 2.8 1.4 1.3
Table 30.3: Prevalence (%) of Morbidity according to Physiological Groups – Males & Females Pooled
Age Group
Morbidity Infants (<1 Yr.)
Pre School children (1-5 Yr.)
School age children (5-12 Yr.)
Adolescents (12-17 Yr.)
Adults (≥≥≥≥ 18 Yr.)
n 978 4859 7697 5529 32642
NAD 89.3 84.7 90.4 94.1 93.3 Fever 6.7 10.3 6.8 4.3 5.2
Diarrhoea 2.5 2.1 .8 .4 .5
Dysentery .3 .4 .1 .1 .1 Acute Resp.Infection 4.0 5.1 2.8 1.5 1.4

NNMB Rural Survey 2005-06 141 Diet & Nutritional status, HTN, DM and IDA
Table 31: Mean Anthropometric measurements of Adult Men and Women (≥≥≥≥20 Years) by age group
Age groups (Years)
Anthropometry 20-30 30-40 40-50 50-60 60-70 70-80 ≥≥≥≥ 80 Pooled
Men
n 2778 3144 2490 1673 1094 446 97 11722
Mean 53.8 55.5 55.3 54.1 51.5 49.8 48.5 54.2 Weight (kg)
SD 8.72 9.77 10.26 10.70 10.35 10.36 9.72 9.98
Mean 164.6 164.0 163.4 162.4 161.2 160.4 159.5 163.4 Height (cm)
SD 6.34 6.31 6.31 6.57 6.60 6.12 6.45 6.49
Mean 19.8 20.6 20.7 20.5 19.7 19.3 19.0 20.3 BMI (kg/m2)
SD 2.76 3.14 3.33 3.51 3.46 3.56 3.27 3.23
Mean 71.7 75.2 76.8 77.1 75.8 76.0 75.3 75.1 Waist Circumference (cm) SD 8.02 9.59 10.26 10.81 11.30 11.75 10.89 10.06
Mean 81.9 83.0 83.3 83.0 81.9 81.5 81.8 82.6 Hip Circumference (cm) SD 6.93 7.42 7.62 7.47 7.53 7.25 7.14 7.38
Women
n 3565 3896 2913 1732 1008 335 71 13520
Mean 45.3 47.3 48.6 47.9 45.6 43.7 39.5 46.9 Weight (kg)
SD 8.13 9.41 10.21 10.59 10.37 10.40 7.96 9.64
Mean 152.0 151.7 151.2 150.1 148.6 147.5 145.0 151.1 Height (cm)
SD 5.78 5.92 6.00 5.78 6.12 6.50 6.14 6.04
Mean 19.6 20.5 21.2 21.2 20.6 20.0 18.7 20.5 BMI (kg/m2)
SD 3.16 3.72 4.46 4.38 4.23 4.14 3.41 3.95
Mean 66.6 69.5 72.2 72.9 71.7 71.2 68.3 69.9 Waist Circumference (cm) SD 8.95 10.36 11.15 11.99 11.84 12.66 10.95 10.85
Mean 80.9 83.1 84.6 84.7 83.0 81.2 79.1 83.0 Hip Circumference (cm) SD 7.60 8.53 9.08 9.67 9.33 9.57 6.73 8.78

NNMB Rural Survey 2005-06 142 Diet & Nutritional status, HTN, DM and IDA
Table 32: Prevalence (%) of Abdominal Obesity among adults
Age groups (Years) Anthropometric Indicators 20-30 30-40 40-50 50-60 60-70 70-80 ≥≥≥≥ 80 Pooled
Men
n 2823 3191 2533 1696 1123 453 101 11921
Waist circumference (> 102 cm) .2 .8 1.3 2.2 2.0 2.9 .0 1.1
Waist Hip Ratio
(WHR ≥ 0.95) 8.7 22.2 30.6 35.4 34.6 39.3 32.7 24.6
Women
n 3606 3937 2948 1760 1027 352 77 13707
Waist circumference (> 88 cm) 2.4 5.4 8.8 11.5 10.2 13.9 6.5 6.7
Waist Hip Ratio
(WHR ≥ 0.80) 60.5 66.8 74.6 76.1 76.3 77.6 76.6 69.1
Table 33: Mean Blood Pressure (mm Hg) among adult men and women by States
Kerala Tamil Nadu
Karna-taka
Andhra Pradesh
Maha-rashtra Gujarat Madhya
Pradesh Orissa West Bengal
Pool- ed
n 880 1306 1412 1810 1542 1536 1200 1136 1101 11923
Mean 135.1 122.1 125.0 124.9 130.1 123.8 119.6 126.9 126.0 125.7 Syst-olic SD 22.04 16.61 16.64 17.02 18.10 10.43 12.91 18.63 16.85 17.03
Mean 85.3 76.1 75.6 77.9 79.1 76.2 78.6 85.2 81.7 79.0
Men
Dias-tolic SD 12.96 11.46 12.20 9.91 12.53 7.06 9.05 11.58 9.38 11.22
n 1710 1681 1881 1898 1401 1796 1138 1120 1077 13702
Mean 135.6 122.6 125.6 125.1 121.4 122.2 118.2 128.2 122.5 124.9 Syst-olic SD 22.50 17.69 19.58 17.98 15.94 11.17 16.06 19.80 17.95 18.50
Mean 83.2 77.4 77.0 77.3 72.8 75.7 77.4 85.1 79.8 78.2
Wom
en
Dias-tolic SD 12.62 10.53 11.50 9.68 11.00 6.95 10.23 11.76 10.18 11.08

NNMB Rural Survey 2005-06 143 Diet & Nutritional status, HTN, DM and IDA
Table 34: Mean Blood Pressure (mm Hg) levels among adult men and women by age group
Age group (Years) Blood Pressure
20-30 30-40 40-50 50-60 60-70 70-80 ≥≥≥≥ 80 Pooled
Men
n 2823 3194 2533 1696 1123 453 101 11923
Systolic Blood Pressure
121.4 (11.6)
121.9 (12.6)
125.0 (15.7)
129.2 (19.8)
136.2 (22.8)
138.7 (24.9)
143.3 (25.3)
125.7 (17.0)
Diastolic Blood Pressure
75.8 (10.4)
78.6 (10.4)
80.5 (11.3)
81.4 (12.1)
81.1 (11.8)
79.3 (11.9)
81.3 (12.3)
79.0 (11.2)
Women
n 3604 3934 2947 1761 1028 351 77 13702
Systolic Blood Pressure
117.4 (11.5)
120.5 (13.9)
126.3 (17.7)
133.8 (21.2)
139.9 (24.7)
145.3 (24.9)
149.0 (22.8)
124.9 (18.5)
Diastolic Blood Pressure
74.0 (9.4)
77.3 (10.3)
80.3 (11.1)
82.2 (11.9)
81.9 (12.0)
81.5 (12.9)
81.9 (11.7)
78.2 (11.1)
(Figures in parenthesis show SD)

NNMB Rural Survey 2005-06 144 Diet & Nutritional status, HTN, DM and IDA
Table 35: Distribution (%) of Adult Male (≥≥≥≥ 20 Yrs) according to Type of Hypertension (WHO Criteria)
Hypertension
STATES n Normal Diastolic Hyper-tension
Systolic Hyper-tension
Diastolic and Systolic
Hypertension
Any Type of
HTN
Kerala 880 49.1 15.0 12.5 23.4 50.9
Tamil Nadu 1306 82.2 4.7 5.4 7.7 17.8
Karnataka 1412 79.9 4.7 8.3 7.1 20.1
Andhra Pradesh 1810 78.9 6.8 6.1 8.2 21.1
Maharashtra 1542 68.6 6.5 12.7 12.2 31.4
Gujarat 1536 85.8 5.0 7.3 1.9 14.2
Madhya Pradesh 1200 82.3 9.2 1.1 7.4 17.7
Orissa 1136 59.1 21.3 3.5 16.1 40.9
West Bengal 1101 76.7 6.6 6.0 10.7 23.3
Pooled 11923 75.0 8.3 7.0 9.7 25.0
Table 36: Distribution (%) of Adult Female (≥≥≥≥ 20 Yrs) according to Type of Hypertension (WHO Criteria)
Hypertension
STATES n Normal Diastolic Hyper-tension
Systolic Hyper-tension
Diastolic and Systolic
Hypertension
Any Type of
HTN
Kerala 1710 53.2 7.9 13.9 25.0 46.8
Tamil Nadu 1681 81.6 3.5 5.9 9.0 18.4
Karnataka 1881 78.2 4.0 8.3 9.5 21.8
Andhra Pradesh 1898 76.9 5.1 8.7 9.2 23
Maharashtra 1401 86.3 1.9 6.7 5.1 13.7
Gujarat 1796 89.6 2.8 5.4 2.2 10.4
Madhya Pradesh 1138 81.4 8.3 .9 9.5 18.7
Orissa 1120 57.6 18.8 4.8 18.8 42.4
West Bengal 1077 79.9 4.7 4.7 10.7 20.1
Pooled 13702 76.4 5.8 7.1 10.8 23.7

NNMB Rural Survey 2005-06 145 Diet & Nutritional status, HTN, DM and IDA
Table 37: Distribution (%) of Adult Men (≥≥≥≥ 20 Yrs) according to
Type of Hypertension (JNC VII Classification)
Hypertension STATE n Normal
Pre HTN Stage I Stage II n
% of known HTN
Kerala 880 14.9 34.2 33.2 17.7 77 8.8 Tamil Nadu 1306 42.5 39.7 13.2 4.7 30 2.3 Karnataka 1412 35.6 44.3 13.8 6.3 29 2.1 Andhra Pradesh 1810 32.0 46.9 14.9 6.2 80 4.4 Maharashtra 1542 23.7 44.9 20.8 10.6 47 3.0 Gujarat 1536 30.5 55.3 13.4 .8 18 1.2 Madhya Pradesh 1200 40.3 42.1 16.3 1.4 8 0.7 Orissa 1136 18.1 40.9 29.1 11.8 41 3.6 West Bengal 1101 25.1 51.7 16.4 6.8 112 10.2 Pooled 11923 29.9 45.1 18.1 6.9 442 3.7
Table 38: Distribution (%) of Adult Women (≥≥≥≥ 20 Yrs) according to
Type of Hypertension (JNC VII Classification)
Hypertension STATE n Normal
Pre HTN Stage I Stage II n
% of known HTN
Kerala 1710 20.1 33.0 28.3 18.5 178 10.4 Tamil Nadu 1681 43.0 38.6 12.4 5.9 55 3.3 Karnataka 1881 37.7 40.5 13.3 8.5 65 3.5 Andhra Pradesh 1898 36.4 40.5 16.4 6.7 91 4.8 Maharashtra 1401 51.1 35.2 9.6 4.1 36 2.6 Gujarat 1796 37.0 52.6 9.4 .9 26 1.4 Madhya Pradesh 1138 50.4 30.9 16.4 2.2 8 0.7 Orissa 1120 20.0 37.6 28.2 14.2 64 5.7 West Bengal 1077 38.3 41.6 13.8 6.3 76 7.1 Pooled 13702 36.9 39.4 16.1 7.5 599 4.4
Normal SBP <120 mm Hg and/or DBP <80 mm Hg
Pre Hypertension SBP : 120 –139 mm Hg and/or DBP : 80-90 mm Hg
Stage I HTN SBP : 140 – 159 mm Hg and/or DBP: 90 – 99 mm Hg
Stage II HTN SBP : ≥ 160 mm Hg and/or DBP : ≥ 100 mm Hg

NNMB Rural Survey 2005-06 146 Diet & Nutritional status, HTN, DM and IDA
Table 39: Distribution (%) of Adult Men by Type of Hypertension (WHO Criteria)
by Age group
Age group (Years) Category
BP Cut Off levels
(mmHg) 20-30 30-40 40-50 50-60 60-70 70-80 ≥≥≥≥ 80 Pooled
n 2823 3194 2533 1696 1123 453 101 11923
Normal SBP < 140 & DBP < 90 86.4 80.5 73.9 67.5 55.9 54.1 43.6 75.0
Diastolic Hypertension
SBP <140 & DBP >90 6.3 10.8 9.9 8.0 5.4 2.9 2.0 8.3
Systolic Hypertension
SBP >140 & DBP <90 3.5 3.1 4.4 8.1 20.1 28.4 32.6 7.0
Diastolic & Systolic Hypertension
SBP >140 & DBP >90 3.8 5.6 11.8 16.4 18.6 14.8 21.8 9.7
Any HTN 13.6 19.5 26.1 32.5 44.1 46.9 56.4 25.0
Table 40: Distribution (%) of Adult Women by Type of Hypertension (WHO Criteria) by Age group
Age group (Years)
Category BP Cut Off
levels (mmHg) 20-30 30-40 40-50 50-60 60-70 70-80 ≥≥≥≥ 80 Pooled
n 3604 3934 2947 1761 1028 351 77 13702
Normal SBP < 140 & DBP < 90 91.0 83.6 72.0 60.3 52.8 40.2 33.8 76.4
Diastolic Hypertension
SBP <140 & DBP >90 4.4 7.1 7.9 4.9 2.8 3.4 2.6 5.8
Systolic Hypertension
SBP >140 & DBP <90 2.4 2.8 5.8 12.8 22.1 32.8 37.8 7.1
Diastolic & Systolic Hypertension
SBP >140 & DBP >90 2.2 6.5 14.3 22.0 22.3 23.6 26.0 10.7
Any HTN 9.0 16.4 28.0 39.7 47.2 59.8 66.2 23.6

NNMB Rural Survey 2005-06 147 Diet & Nutritional status, HTN, DM and IDA
Table 41: Distribution (%) of Adult Men according to Type of Hypertension
(JNC VII Criteria) by Age group
Age group (Years) Category BP Cut-off levels
(mmHg) <30 30-40 40-50 50-60 60-70 70-80 ≥≥≥≥ 80 Pooled
n 2823 3194 2533 1696 1123 453 101 11923
Normal SBP < 120 and/or DBP < 80 36.0 32.8 30.4 25.0 18.7 19.2 11.9 29.9
Pre Hypertension
SBP :120-139 and/or DBP 80-89 50.3 47.7 43.5 42.5 37.2 34.9 31.7 45.1
Stage I Hypertension
SBP :140-159 and/or DBP 90-99 12.0 16.3 19.1 22.0 27.2 24.7 24.8 18.1
Stage II Hypertension
SBP ≥ 160 and/or DBP ≥ 100
1.6 3.2 7.0 10.6 16.8 21.2 31.7 6.9
Stage I + II Hypertension
SBP ≥ 140 and/or DBP ≥ 90
13.6 19.5 26.1 32.6 44.0 45.9 56.5 25.0
Table 42: Distribution (%) of Adult Women according to Type of Hypertension (JNC VII Criteria) by Age group
Age group (Years) Category BP Cut-off levels
(mmHg) <30 30-40 40-50 50-60 60-70 70-80 ≥≥≥≥ 80 Pooled
n 3604 3934 2947 1761 1028 351 77 13702
Normal SBP < 120 and/or DBP < 80 52.2 42.2 31.3 21.1 17.0 12.3 6.5 36.9
Pre Hypertension
SBP :120-139 and/or DBP 80-89 38.8 41.4 40.7 39.1 35.8 27.9 27.3 39.4
Stage I Hypertension
SBP :140-159 and/or DBP 90-99 7.7 12.9 20.3 24.9 24.7 31.1 33.8 16.1
Stage II Hypertension
SBP ≥ 160 and/or DBP ≥ 100
1.2 3.6 7.7 14.8 22.5 28.8 32.5 7.5
Stage I + II Hypertension
SBP ≥ 140 and/or DBP ≥ 90
8.9 16.5 28 39.7 47.2 59.9 66.3 23.6

NNMB Rural Survey 2005-06 148 Diet & Nutritional status, HTN, DM and IDA
Table 43: Distribution (%) of Adult Men (≥≥≥≥20 Years) according to HTN and Risk factors
Abdominal Adiposity STATE n Hypertension
Overweight/ Obesity
(BMI) Waist Circ.
Waist hip ratio
Kerala 872 50.9 15.3 0.9 40.4 Tamil Nadu 1292 17.9 11.8 1.6 39.0 Karnataka 1382 20.0 7.5 1.3 24.8 Andhra Pradesh 1767 21.2 10.1 2.0 20.4 Maharashtra 1517 31.5 8.7 1.2 22.0 Gujarat 1501 14.3 10.1 .9 22.2 Madhya Pradesh 1186 17.6 3.1 .7 10.1 Orissa 1109 40.8 4.2 .5 28.0 West Bengal 1096 23.3 5.0 .4 20.4 Pooled 11722 25.0 8.5 1.1 24.6
Table 44: Distribution (%) of Adult Women (≥≥≥≥20 Years) according to HTN and Risk factors
Abdominal Adiposity STATE n Hypertension
Overweight/ Obesity
(BMI) Waist Circ.
Waist hip ratio
Kerala 1690 46.6 26.0 20.0 91.8 Tamil Nadu 1671 18.4 16.9 7.5 76.3 Karnataka 1848 21.7 9.6 4.7 55.9 Andhra Pradesh 1883 23.0 13.0 6.0 74.7 Maharashtra 1383 13.5 10.4 3.7 36.7 Gujarat 1757 10.1 13.3 5.7 80.9 Madhya Pradesh 1123 18.4 5.3 5.7 82.8 Orissa 1093 42.3 5.1 .6 44.1 West Bengal 1072 20.1 7.4 2.1 68.5 Pooled 13520 23.5 12.7 6.7 69.1

NNMB Rural Survey 2005-06 149 Diet & Nutritional status, HTN, DM and IDA
Table 45: Distribution (%) of Adult Men according to Fasting Blood glucose levels– Andhra Pradesh
Age group (Years) Category
Fasting Blood
Glucose 20-30 30-40 40-50 50-60 60-70 70-80 ≥≥≥≥ 80 Pooled
Mean Age 24.4 33.9 43.6 53.4 62.7 72.2 82.9 40.7
n 478 447 326 279 203 53 17 1803
Normoglycemia < 110 99.2 97.8 91.4 88.2 87.7 86.8 94.1 94.0
Impaired Fasting Glucose 110 - 126 .4 1.1 1.8 2.9 4.4 3.8 .0 1.8
Diabetes Mellitus ≥ 126 .4 1.1 6.7 9.0 7.9 9.4 5.9 4.2
Table 46: Distribution (%) of Adult Women according to Fasting Blood glucose levels– Andhra Pradesh
Age group (Years) Category
Fasting Blood
Glucose 20-30 30-40 40-50 50-60 60-70 70-80 ≥≥≥≥ 80 Pooled
Mean Age 24.4 34.3 43.9 53.3 62.6 71.7 81.2 39.4
N 544 474 403 250 146 52 14 1883
Normoglycemia < 110 98.5 97.7 95.3 89.6 82.9 84.6 85.7 94.7
Impaired Fasting Glucose 110 - 126 1.1 1.5 3.0 4.0 4.8 5.8 7.1 2.4
Diabetes Mellitus ≥ 126 .4 .8 1.7 6.4 12.3 9.6 7.1 2.8
* ICMR-WHO Guide lines for Management of Type II Diabetes 2003.

NNMB Rural Survey 2005-06 150 Diet & Nutritional status, HTN, DM and IDA
Table 47: Distribution (%) of Adult Men According to their Knowledge and Practices about Hypertension, Diabetes and consumption of Tobacco, Alcoholic Beverages
Age group (Years)
Variables 20-30 30-40 40-50 50-60 60-70 70-80 ≥≥≥≥ 80 Pooled
n 2826 3195 2534 1698 1123 453 101 11930
Aware of hypertension (%) 65.8 66.9 66.8 68.8 65.5 63.8 51.5 66.5
Previous history of hypertension (%) .9 1.5 3.1 6.8 9.8 11.7 12.9 3.7
On treatment for hypertension (%) .2 .4 1.7 4.6 6.7 8.6 10.9 2.2
Aware of Diabetes Mellitus (%)
57.6 56.1 55.8 57.7 55.7 51.4 40.6 56.3
Previous history of diabetes (%) .1 .3 2.0 3.8 5.9 6.4 2.0 1.9
On treatment for Diabetes (%) 0 .2 1.6 3.4 5.2 5.7 2.0 1.6
Smoke Tobacco (%) 38.7 55.6 62.5 63.3 61.6 56.7 44.6 54.7
Smoking 10 Cigarettes/ Cigars, beedies /day (%) 40.8 53.6 56.4 52.7 48.6 46.8 38.1 51.7
Duration of
Smoking ≥ 10 years (%) 32.4 64.5 81.4 91.7 93.0 95.2 90.5 74.6
Use Tobacco snuff (%) 0.8 1.1 2.3 3.5 2.5 4.6 3.0 1.9
Duration of Tobacco Snuffing ≥ 10 years (%)
33.3 50.0 70.7 69.0 85.7 68.2 100.0 65.1
Tobacco chewing (%) 25.1 30.1 29.4 25.6 28.7 29.6 25.7 27.9
Duration of Tobacco chewing ≥ 10 years (%)
19.2 42.5 70.8 78.0 84.1 89.6 84.6 54.7
Consume Alcoholic Beverages (%)
24.2 36.7 36.7 31.3 25.9 19.4 9.9 31.1
Consume Alcoholic Beverages (daily) (%) 1.3 3.8 5.1 5.2 4.4 3.1 3.0 3.7

NNMB Rural Survey 2005-06 151 Diet & Nutritional status, HTN, DM and IDA
Table 48: Distribution of Adult Women By their Knowledge and Practices about Hypertension, Diabetes and consumption of Tobacco, Alcoholic Beverages
Age group (Years) Variables
20-30 30-40 40-50 50-60 60-70 70-80 ≥≥≥≥ 80 Pooled
n 3606 3937 2949 1761 1028 353 77 13711
Aware of hypertension (%) 62.9 61.6 58.2 63.5 55.0 49.0 41.6 60.5
Previous history of hypertension (%) .7 1.5 4.0 10.6 13.4 17.0 16.9 4.4
On treatment for hypertension (%) .1 .8 2.5 6.9 10.4 15.3 15.6 3.0
Aware of Diabetes Mellitus (%)
51.6 50.6 45.8 49.6 42.8 38.8 26.0 48.7
Previous history of diabetes (%) .1 .2 .8 3.6 4.5 5.9 5.2 1.2
On treatment for Diabetes (%) .1 .2 .8 3.1 3.6 5.7 5.2 1.1
Smoke Tobacco (%) 6.8 14.4 21.5 30.2 31.7 35.7 35.1 17.9
Smoking 10 Cigarettes/ Cigars, beedies /day (%) 36.4 15.2 28.6 32.1 31.8 14.3 33.3 26.0
Duration of
Smoking ≥ 10 years (%) 75.0 61.3 78.1 84.6 95.2 92.9 100.0 80.0
Use Tobacco snuff (%) 0.6 2.2 3.4 3.7 3.4 4.2 2.6 2.4
Duration of Tobacco Snuffing ≥ 10 years (%)
14.3 54.7 62.0 76.9 62.9 73.3 50.0 60.5
Tobacco chewing (%) 6.0 11.9 18.3 26.3 26.8 29.2 28.6 15.3
Duration of Tobacco chewing ≥ 10 years (%)
37.3 55.1 65.1 78.9 83.9 89.3 100.0 67.1
Consume Alcoholic Beverages (%)
1.4 2.1 2.5 2.7 1.8 3.1 .0 2.0
Consume Alcoholic Beverages (daily) (%) .1 .1 .1 .1 .4 .3 .0 .1

NNMB Rural Survey 2005-06 152 Diet & Nutritional status, HTN, DM and IDA
Table 49: Distribution (%) of Adults (≥≥≥≥ 20 years) according to their knowledge about symptoms of Hypertension
Variable Men Women
n 7935 8300
Do not Know 41.4 43.4
Head ache 17.0 14.3
Nausea/vomiting 5.0 5.3
Giddiness 41.1 42.5
Palpitation 16.1 14.4
Others 16.8 10.7
* Multiple responses
Table 50: Distribution (%) of Adults (≥≥≥≥ 20 years) according to their Knowledge about symptoms of Diabetes
Variable Men Women
n 6715 6675
Do not Know 54.0 56.1
Polydypsia 3.9 2.8
Polyphagia 4.0 2.9
Polyurea 11.7 7.4
Loss of weight 9.0 5.2
Tiredness 19.8 18.7
Delay in wound healing 26.4 22.0
Others 6.7 6.5
* Multiple responses

NNMB Rural Survey 2005-06 153 Diet & Nutritional status, HTN, DM and IDA
Table 51: Prevalence (%) of Hypertension, Diabetes, Overweight/ Obesity and WHR among Men by Household Socio-Economic Variables and Exercise, use of Tobacco/ Alcohol
Hypertension Diabetes Overweight/
Obesity (BMI≥≥≥≥23)
Waist Hip Ratio Socio Economic
Particulars n % χ2 n % χ2 % χ2
Hindu 10654 24.4 1751 6.1 18.1 24.2
Muslim 777 27.4 37 0 21.8 26.3
Christian 243 39.1 15 6.7 32.2 43.2 Religion
Others 249 28.1
104.3 p<0.001
0 0
2.4 NS
14.6
39.6 p<0.001
17.3
54.8 p<0.001
ST 1197 23.3 51 3.9 11.3 15.9
SC 2611 23.4 399 4.5 13.3 21.5
OBC 4317 25.8 867 5.8 19.7 27.3 Community
Others 3798 25.8
42.3 p<0.001
486 7.8
4.9 NS
23.1
141.9 p<0.001
26.4
85.6 p<0.001
Labourers 4812 21.9 565 3.2 11.4 18.8
Cultivators +Artisans 4279 23.8 745 6.7 18.9 24.1
Occupation Service + Business + Others
2831 32.1
105.4 p<0.001
497 8.2
13.0 p<0.01
30.1
405.2 p<0.001
35.0
252.1 p<0.001
<300 3189 26.7 385 3.4 10.1 19.6
300-600 4125 24.0 693 4.9 14.6 21.5
600-900 1973 23.1 309 6.1 21.4 26.4 PCI (Rs./ Month)
≥ 900 2635 25.9
12.0 p<0.01
420 19.5
19.5 p<0.01
32.7
544.2 p<0.001
34.0
192.7 p<0.001
≤ 4 4860 24.6 823 6.8 18.9 25.1
5 - 7 5701 25.3 826 5.3 18.2 23.7 Family Size
≥ 8 1362 25.2
13.7 p<0.001
154 5.2
1.8 NS
18.6
0.7 NS
26.4
5.6 NS
Kutcha 2656 22.7 391 3.8 14.3 22.1
Semi Pucca 7358 24.9 852 5.5 17.2 22.5 Type of
House
Pucca 1909 28.6
35.3 p<0.001
560 8.2
8.5 p<0.05
29.1
175.7 p<0.001
36.1
161.8 p<0.001
Literate 8224 26.6 957 7.2 22.3 27.6 Literacy Status Illiterate 3698 21.4
37.5 p<0.001 846 4.6
5.4 p<0.05 10.2
241.4 p<0.001 17.8
72.0 p<0.001
Yes 382 35.6 34 29.4 41.6 38.5 Physical Exercise No 11540 24.7
23.6 p<0.001
1769 5.5
33.8 p<0.00
1 17.8 136.5
p<0.001 24.1 41.3
p<0.001
Yes 6521 25.8 775 7.9 13.9 23.6 Consume Tobacco No 5401 24.0
5.1 p<0.05 1028 4.6
8.5 p<0.01 24.2
206.5 p<0.001 25.7
7.0 p<0.01
Yes 3707 25.7 829 5.7 16.2 23.9 Consume Alcohol No 8215 24.7
1.3 NS 974 6.3
0.3 NS 19.6
19.6 p<0.001 24.9
1.4 NS

NNMB Rural Survey 2005-06 154 Diet & Nutritional status, HTN, DM and IDA
Table 52 : Prevalence (%) of Hypertension, Diabetes, Overweight/ Obesity and WHR among Women by Household Socio-Economic Variables and Exercise, use of Tobacco/ Alcohol
Hypertension Diabetes Overweight/
Obesity (BMI≥23)
Waist Hip Ratio Socio Economic
Particulars n % χ2 n % χ2 % χ2 % χ2
Hindu 12055 22.6 1826 5.1 20.9 68.1
Muslim 1071 30.9 45 11.1 34.7 81.4
Christian 340 41.8 12 8.3 44.3 86.8 Religion
Others 236 18.2
31.2 p<0.001
0 0
3.4 NS
18.3
201.2 p<0.001
39.4
229.0 p<0.001
ST 1291 19.6 47 0 11.8 67.3
SC 2808 20.3 395 2.8 16.0 67.2
OBC 5225 25.4 915 5.2 25.3 72.9 Community
Others 4378 24.9
8.3 p<0.05
526 7.6
13.3 p<0.01
26.6
213.1 p<0.001
66.2
58.9 p<0.001
Labourers 5598 20.6 599 3.2 16.4 67.1
Cultivators +Artisans 4413 22.5 739 5.3 21.4 66.8
Occupation Service + Business + Others
3691 29.6
105.7 p<0.001
546 7.7
11.6 p<0.01
33.3
365.0 p<0.001
74.7
76.4 p<0.001
<300 3669 25.3 437 4.6 13.9 58.6
300-600 4694 21.5 728 4.3 19.0 68.2
600-900 2227 23.5 316 5.4 25.3 73.9 PCI (Rs./ Month)
≥ 900 3112 25.0
20.9 p<0.001
403 7.9
7.6 NS
36.1
518.4 p<0.001
79.2
364.4 p<0.001
≤ 4 5697 25.1 826 5.3 23.9 71.1
5 - 7 6589 22.3 902 5.0 21.0 67.5 Family Size
≥ 8 1416 23.9
0.6 NS
155 6.5
0.6 NS
24.1
16.8 p<0.001
68.4
18.7 p<0.001
Kutcha 2940 22.0 417 4.1 17.1 67.8
Semi Pucca 8418 22.9 908 4.8 20.8 67.9 Type of
House
Pucca 2344 28.2
20.7 p<0.001
558 6.8
4.2 NS
35.7
293.4 p<0.001
74.9
44.8 p<0.001
Literate 7407 25.6 677 5.6 28.8 71.3 Literacy Status Illiterate 6295 21.3
34.5 p<0.001 1206 5.1
0.3 NS 15.2
355.9 p<0.001 66.5
36.3 p<0.001
Yes 39 53.8 4 0.0 62.2 84.6 Physical Exercise No 13663 23.6
19.8 p<0.001 1879 5.3
0.2 NS 22.4
33.4 p<0.001 69.0
4.4 p<0.05
Yes 2456 32.2 173 4.0 14.4 57.9 Consume Tobacco No 11246 21.8
122.6 p<0.001 1710 5.4
0.6 NS 24.3
111.4 p<0.001 71.5
174.2 p<0.001
Yes 281 33.8 48 6.3 9.5 69.4 Consume Alcohol No 13421 23.4
16.4 p<0.001 1835 5.2
0.1 NS 22.8
27.5 p<0.001 69.1
0.0 NS

NNMB Rural Survey 2005-06 155 Diet & Nutritional status, HTN, DM and IDA
Table 53: Prevalence (%) of Hypertension among men by Waist Circumference
Category Cut-off level (Cm)
n Normal Hyper-tension
Normal < 102 11781 75.3 24.7
Abdominal adiposity � 102 134 44.8 55.2
Total 11915 75.0 25.0
χ2 =65.91: p < 0.001 OR=3.8 (CI: 2.7- 5.3)
Table 54: Prevalence (%) of by hypertension among adult men By Waist Hip Ratio
Category Cut-off level
(WHR) n Normal Hyper-
tension
Normal < 0.95 8987 79.7 20.3
Abdominal adiposity ≥ 0.95 2928 60.4 39.6
Total 11915 75.0 25.0
χ2 =441.0: p < 0.001 OR=2.6 (CI: 2.4- 2.8)
Table 55: Prevalence (%) of hypertension among Adult men by BMI nutritional Grades
Category Cut-off level n Normal Hyper-
tension
CED < 18.5 3795 82.0 18.0
Normal 18.5 – 25.0 6937 74.4 25.6
Overweight & Obesity � 25 990 52.0 48.0
Total 11722 75.0 25.0
χ2 =378.3: p < 0.001 OR=3.1 (CI: 2.7- 3.5)

NNMB Rural Survey 2005-06 156 Diet & Nutritional status, HTN, DM and IDA
Table 56: Prevalence (%) of hypertension among
Adult women by abdominal adiposity
Category Cut-off level (Cm)
n Normal Hypertension
Normal < 88 12778 78.6 21.4
Abdominal adiposity � 88 921 44.6 55.4
Total 13699 76.4 23.6
χ2 =550.7: p < 0.001 OR=4.6 (CI: 4.0- 5.2)
Table 57: Prevalence (%) of hypertension among
Adult Women by Abdominal Obesity (WHR)
Category Cut-off level
(WHR) n Normal Hypertension
Normal < 0.80 4240 85.1 14.9
Abdominal Obesity ≥ 0.80 9459 72.4 27.6
Total 13699 76.4 23.6
χ2 =258.3: p < 0.001 OR=2.2 (CI: 2.0 - 2.4)
Table 58: Prevalence (%) of hypertension Among Adult Women by BMI nutritional grades
Category Cut-off level n Normal Hypertension
Chronic energy deficiency < 18.5 4663 84.3 15.7
Normal 18.5 – 25.0 7135 76.5 23.5
Overweight & Obesity � 25 1717 55.2 44.8
Total 13515 76.5 23.5
χ2 =588.8: p < 0.001 OR=3.2 (CI: 2.8 – 3.5)

NNMB Rural Survey 2005-06 157 Diet & Nutritional status, HTN, DM and IDA
Table 59: Prevalence (%) of Hyperglycemia among Men by abdominal adiposity (WC) : Andhra Pradesh
Hyperglycemia Category
Cut-off level (Cm)
n Normal Impaired FBG
Diabetes mellitus
Normal < 102 1768 94.4 1.6 4.0
Abdominal adiposity � 102 36 72.2 8.3 19.4
Total 1804 94.0 1.8 4.3
χ2 =30.6: p < 0.001 OR=6.5 (CI: 3.1 – 13.9)
Table 60: Prevalence (%) of Hyperglycemia among Men by abdominal obesity (WHR) : Andhra Pradesh
Hyperglycemia Category
Cut-off level
(WHR) n Normal Impaired
FBG Diabetes mellitus
Normal < 0.95 1433 96.2 1.5 2.4
Abdominal Obesity ≥ 0.95 371 85.4 3.0 11.6
Total 1804 94.0 1.8 4.3
χ2 =66.0: p < 0.001 OR=4.4 (CI: 2.9 – 6.5)
Table 61: Prevalence (%) of Hyperglycemia among Men by BMI nutritional grades : Andhra Pradesh
Hyperglycemia Category Cut-off
level n Normal Impaired FBG
Diabetes mellitus
CED < 18.5 559 95.7 1.4 2.9
Normal 18.5 – 25.0 1024 94.1 1.7 4.2
Over Weight � 25 179 87.7 2.8 9.5
Total 1762 94.0 1.7 4.3
χ2 =16.3 : p < 0.01 OR=2.5 (CI: 1.5 – 4.2)
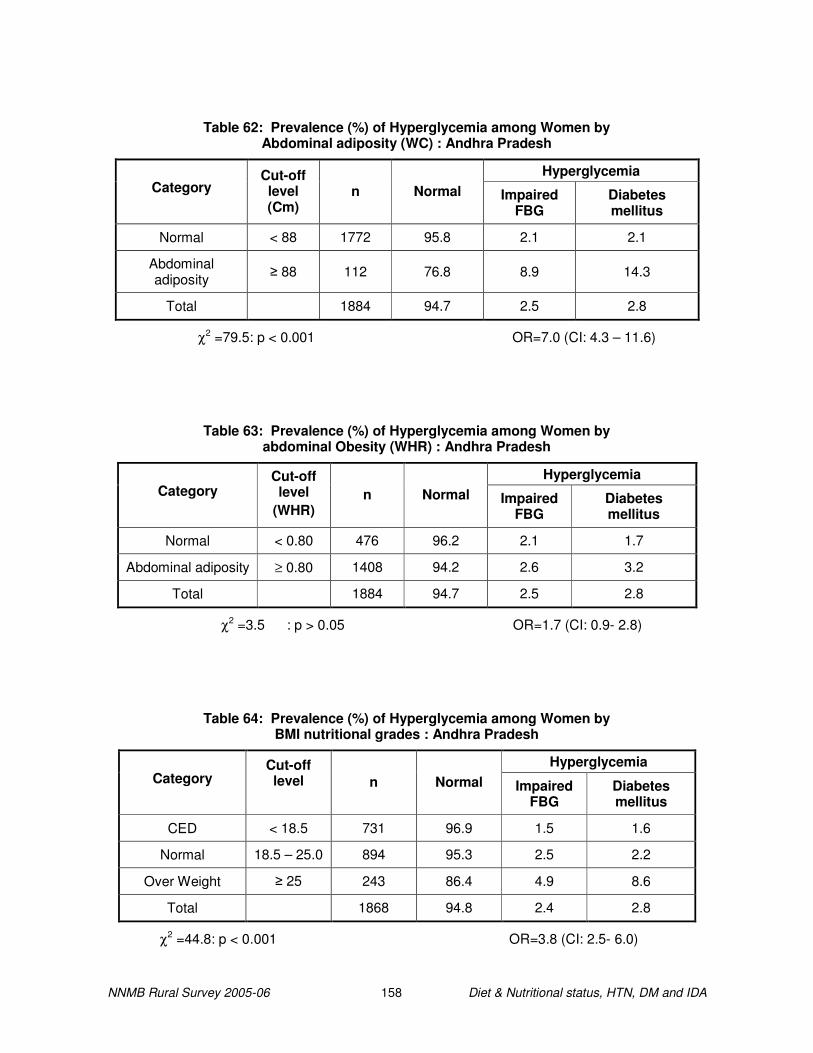
NNMB Rural Survey 2005-06 158 Diet & Nutritional status, HTN, DM and IDA
Table 62: Prevalence (%) of Hyperglycemia among Women by Abdominal adiposity (WC) : Andhra Pradesh
Hyperglycemia Category
Cut-off level (Cm)
n Normal Impaired FBG
Diabetes mellitus
Normal < 88 1772 95.8 2.1 2.1
Abdominal adiposity � 88 112 76.8 8.9 14.3
Total 1884 94.7 2.5 2.8
χ2 =79.5: p < 0.001 OR=7.0 (CI: 4.3 – 11.6)
Table 63: Prevalence (%) of Hyperglycemia among Women by abdominal Obesity (WHR) : Andhra Pradesh
Hyperglycemia Category
Cut-off level
(WHR) n Normal Impaired
FBG Diabetes mellitus
Normal < 0.80 476 96.2 2.1 1.7
Abdominal adiposity ≥ 0.80 1408 94.2 2.6 3.2
Total 1884 94.7 2.5 2.8
χ2 =3.5 : p > 0.05 OR=1.7 (CI: 0.9- 2.8)
Table 64: Prevalence (%) of Hyperglycemia among Women by BMI nutritional grades : Andhra Pradesh
Hyperglycemia Category
Cut-off level
n Normal Impaired
FBG Diabetes mellitus
CED < 18.5 731 96.9 1.5 1.6
Normal 18.5 – 25.0 894 95.3 2.5 2.2
Over Weight � 25 243 86.4 4.9 8.6
Total 1868 94.8 2.4 2.8
χ2 =44.8: p < 0.001 OR=3.8 (CI: 2.5- 6.0)