Embed Size (px)
Citation preview
1
Nuclear Magnetic Resonance Spectroscopy
Presented By
Uttam Prasad Panigrahy
2
•Nuclear magnetic resonance spectroscopy is a powerful analytical technique used to characterize organic molecules by identifying carbon-hydrogen frameworks within molecules.
•Two common types of NMR spectroscopy are used to characterize organic structure: 1H NMR is used to determine the type and number of H atoms in a molecule; 13C NMR is used to determine the type of carbon atoms in the molecule.
•The source of energy in NMR is radio waves which have long wavelengths, and thus low energy and frequency.
•When low-energy radio waves interact with a molecule, they can change the nuclear spins of some elements, including 1H and 13C.
Introduction to NMR Spectroscopy
3
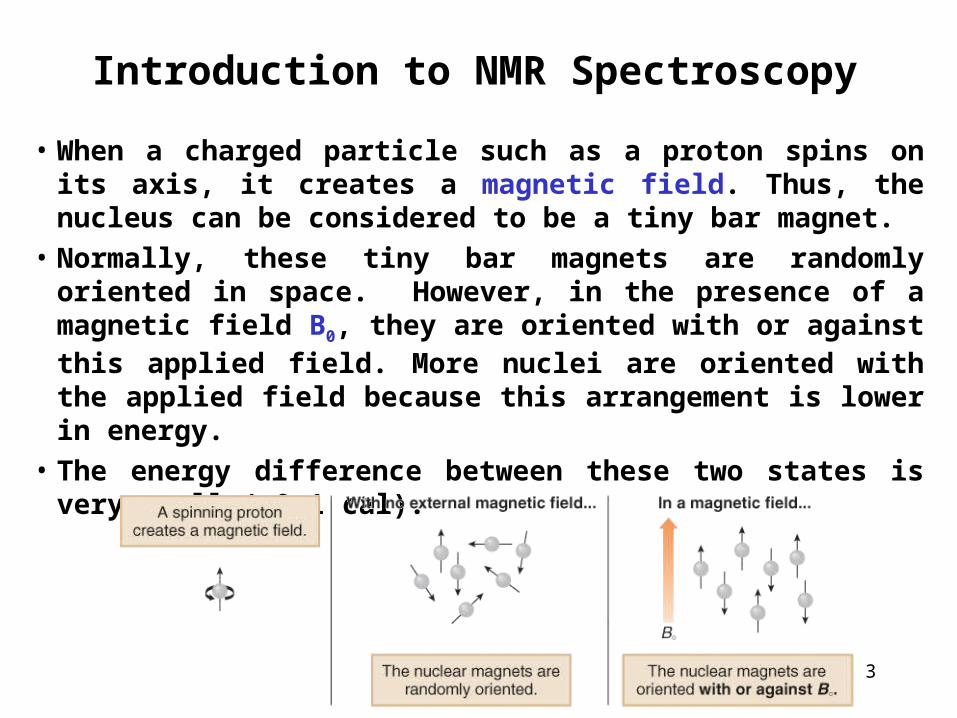
• When a charged particle such as a proton spins on its axis, it creates a magnetic field. Thus, the nucleus can be considered to be a tiny bar magnet.
• Normally, these tiny bar magnets are randomly oriented in space. However, in the presence of a magnetic field B0, they are oriented with or against this applied field. More nuclei are oriented with the applied field because this arrangement is lower in energy.
• The energy difference between these two states is very small (<0.1 cal).
Introduction to NMR Spectroscopy
4
Nuclear Magnetic Resonance Spectroscopy
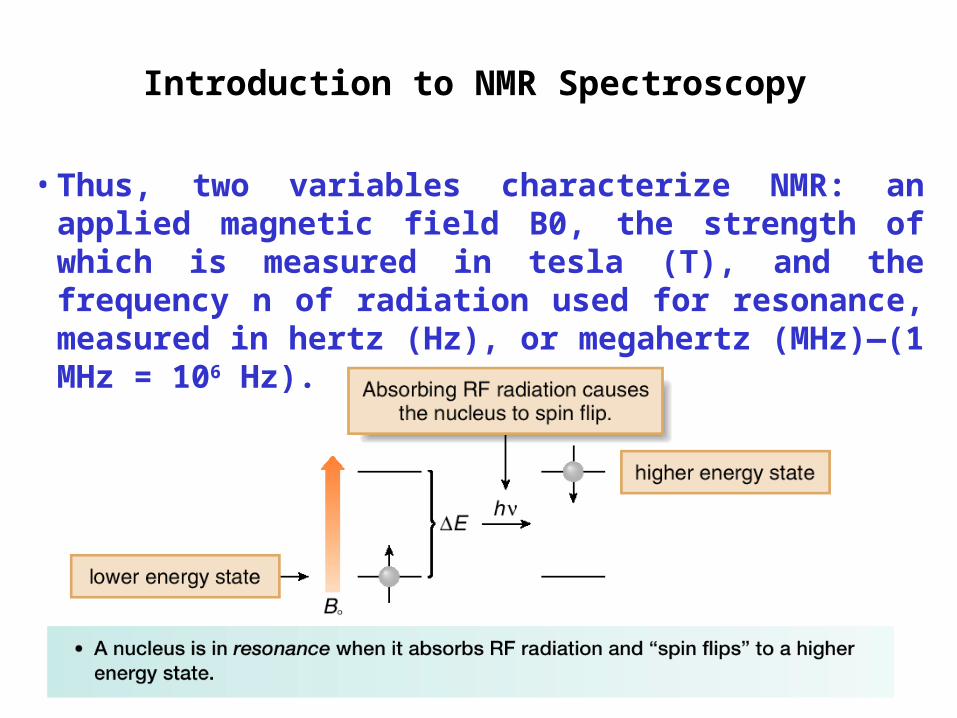
• In a magnetic field, there are now two energy states for a proton: a lower energy state with the nucleus aligned in the same direction as B0, and a higher energy state in which the nucleus aligned against B0.
•When an external energy source (hn) that matches the energy difference (DE) between these two states is applied, energy is absorbed, causing the nucleus to “spin flip” from one orientation to another.
•The energy difference between these two nuclear spin states corresponds to the low frequency RF region of the electromagnetic spectrum.
Introduction to NMR Spectroscopy
5
•Thus, two variables characterize NMR: an applied magnetic field B0, the strength of which is measured in tesla (T), and the frequency n of radiation used for resonance, measured in hertz (Hz), or megahertz (MHz)—(1 MHz = 106 Hz).
Introduction to NMR Spectroscopy
6
Nuclear Magnetic Resonance Spectroscopy
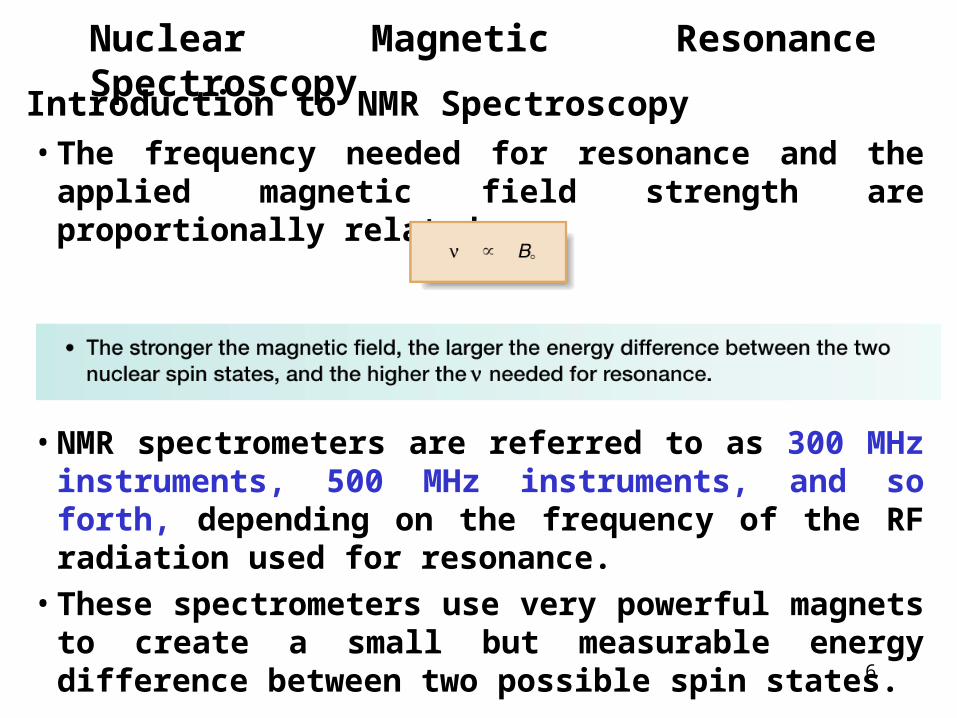
•The frequency needed for resonance and the applied magnetic field strength are proportionally related:
•NMR spectrometers are referred to as 300 MHz instruments, 500 MHz instruments, and so forth, depending on the frequency of the RF radiation used for resonance.
•These spectrometers use very powerful magnets to create a small but measurable energy difference between two possible spin states.
Introduction to NMR Spectroscopy
7
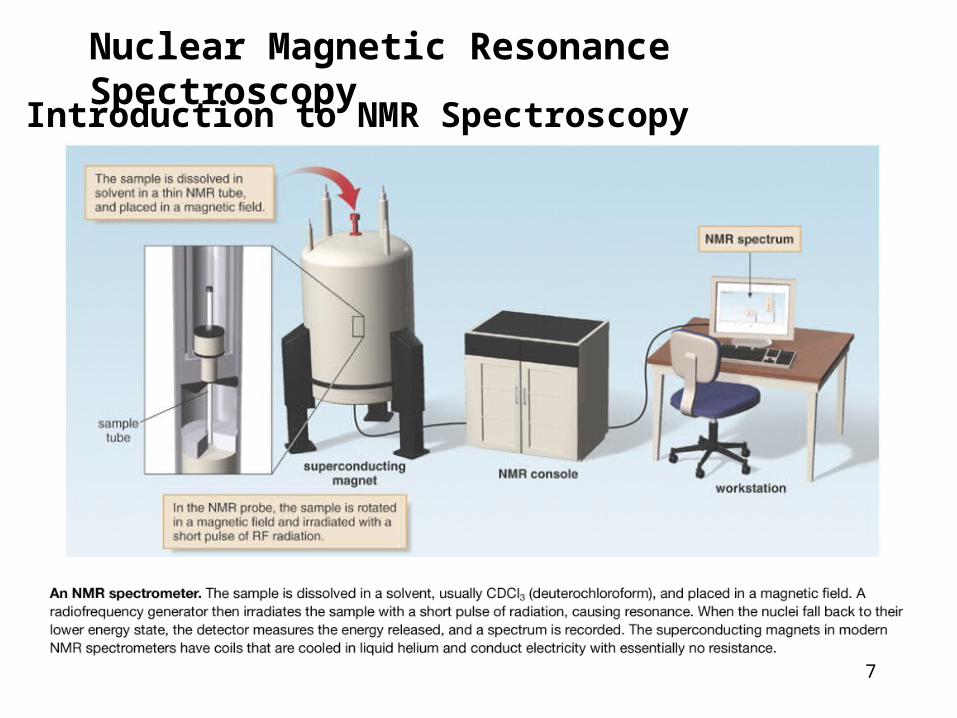
Nuclear Magnetic Resonance Spectroscopy
Introduction to NMR Spectroscopy
8
Nuclear Magnetic Resonance Spectroscopy
• Protons in different environments absorb at slightly different frequencies, so they are distinguishable by NMR.
• The frequency at which a particular proton absorbs is determined by its electronic environment.
• The size of the magnetic field generated by the electrons around a proton determines where it absorbs.
• Modern NMR spectrometers use a constant magnetic field strength B0, and then a narrow range of frequencies is applied to achieve the resonance of all protons.
• Only nuclei that contain odd mass numbers (such as 1H, 13C, 19F and 31P) or odd atomic numbers (such as 2H and 14N) give rise to NMR signals.
Introduction to NMR Spectroscopy
9
Nuclear Magnetic Resonance Spectroscopy
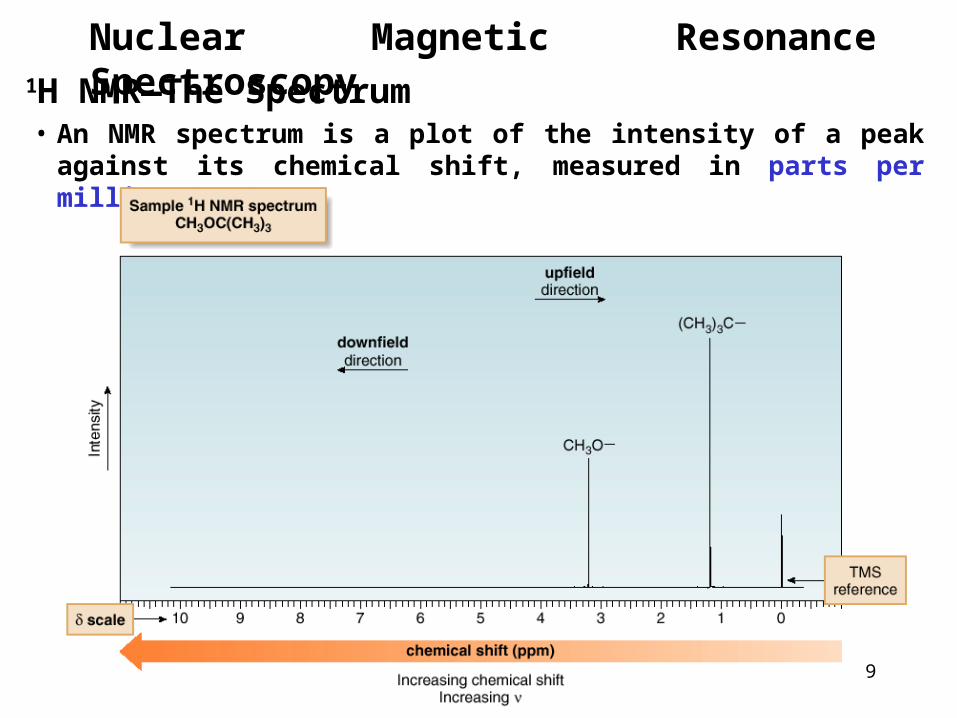
• An NMR spectrum is a plot of the intensity of a peak against its chemical shift, measured in parts per million (ppm).
1H NMR—The Spectrum
10
Nuclear Magnetic Resonance Spectroscopy
•NMR absorptions generally appear as sharp peaks.
• Increasing chemical shift is plotted from left to right.
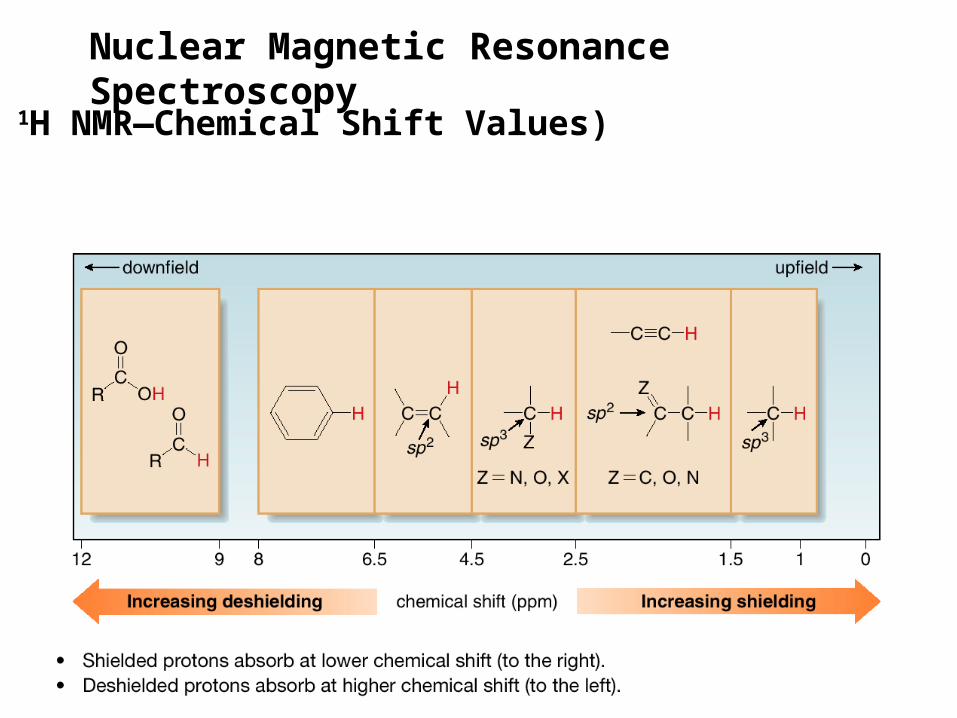
•Most protons absorb between 0-10 ppm. •The terms “upfield” and “downfield” describe
the relative location of peaks. Upfield means to the right. Downfield means to the left.
•NMR absorptions are measured relative to the position of a reference peak at 0 ppm on the d scale due to tetramethylsilane (TMS). TMS is a volatile inert compound that gives a single peak upfield from typical NMR absorptions.
1H NMR—The Spectrum
11
Nuclear Magnetic Resonance Spectroscopy
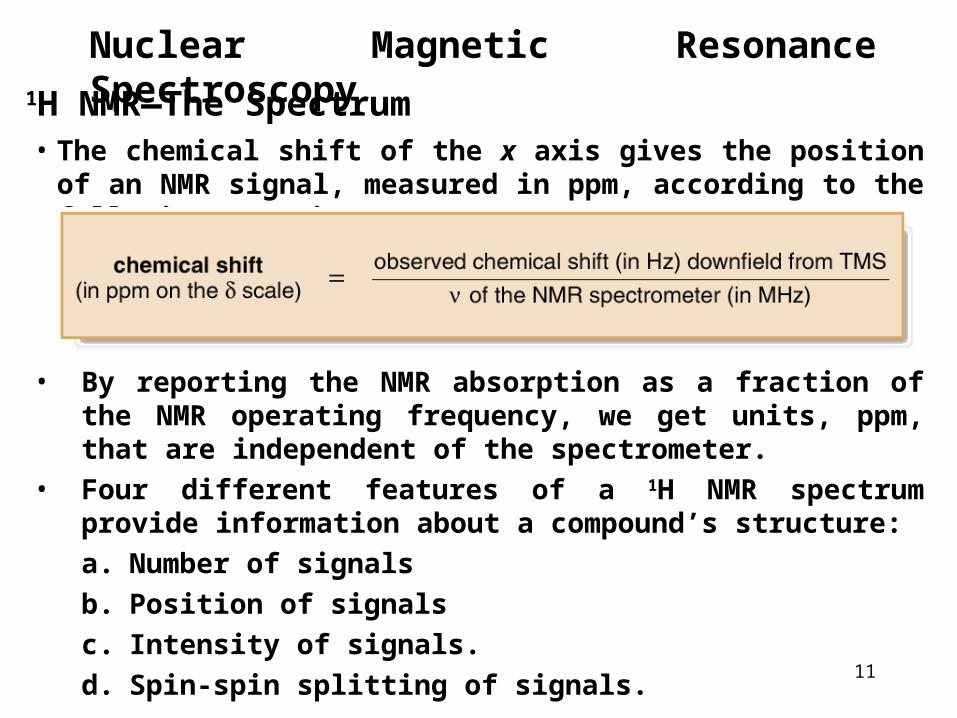
• The chemical shift of the x axis gives the position of an NMR signal, measured in ppm, according to the following equation:
1H NMR—The Spectrum
• By reporting the NMR absorption as a fraction of the NMR operating frequency, we get units, ppm, that are independent of the spectrometer.
• Four different features of a 1H NMR spectrum provide information about a compound’s structure:a. Number of signalsb. Position of signalsc. Intensity of signals.d. Spin-spin splitting of signals.
12
Nuclear Magnetic Resonance Spectroscopy
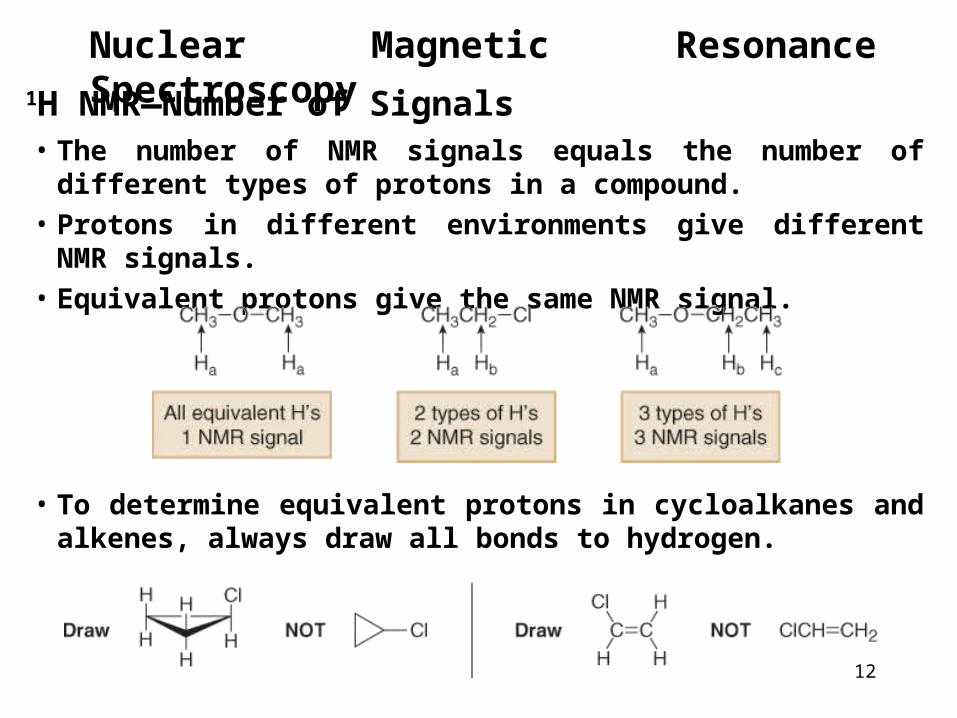
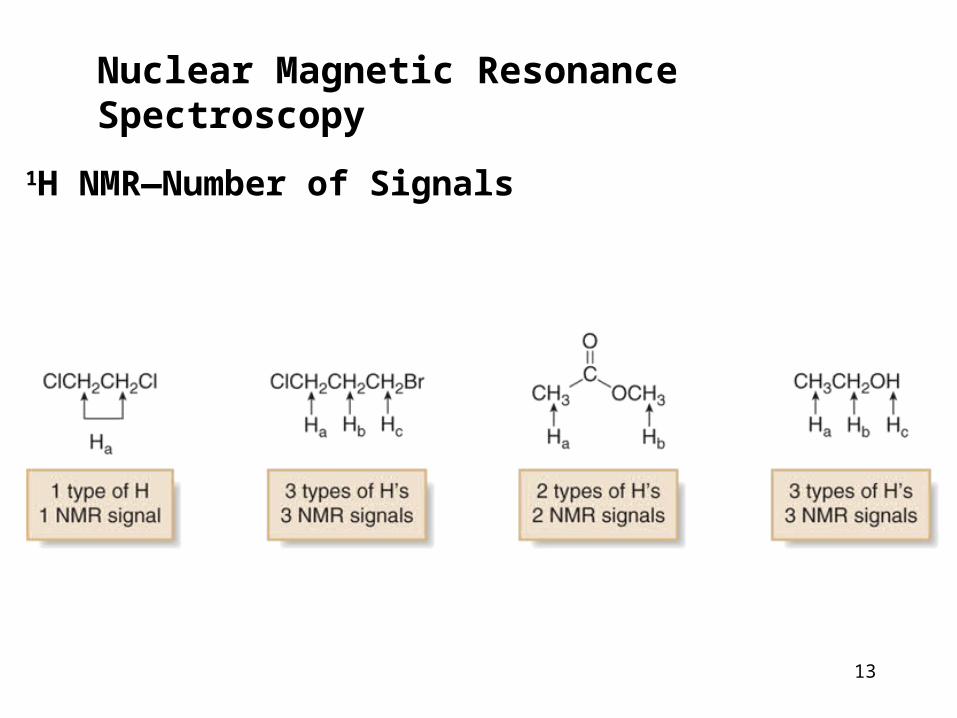
• The number of NMR signals equals the number of different types of protons in a compound.
• Protons in different environments give different NMR signals.
• Equivalent protons give the same NMR signal.
1H NMR—Number of Signals
• To determine equivalent protons in cycloalkanes and alkenes, always draw all bonds to hydrogen.
13
Nuclear Magnetic Resonance Spectroscopy
1H NMR—Number of Signals
14
Nuclear Magnetic Resonance Spectroscopy
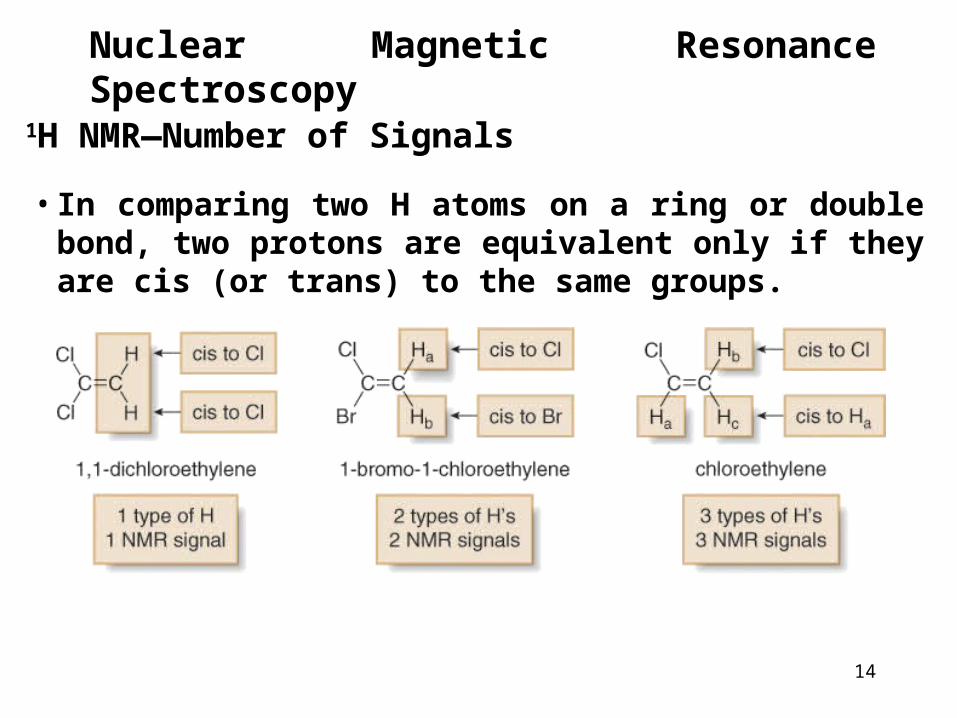
• In comparing two H atoms on a ring or double bond, two protons are equivalent only if they are cis (or trans) to the same groups.
1H NMR—Number of Signals
15
Nuclear Magnetic Resonance Spectroscopy
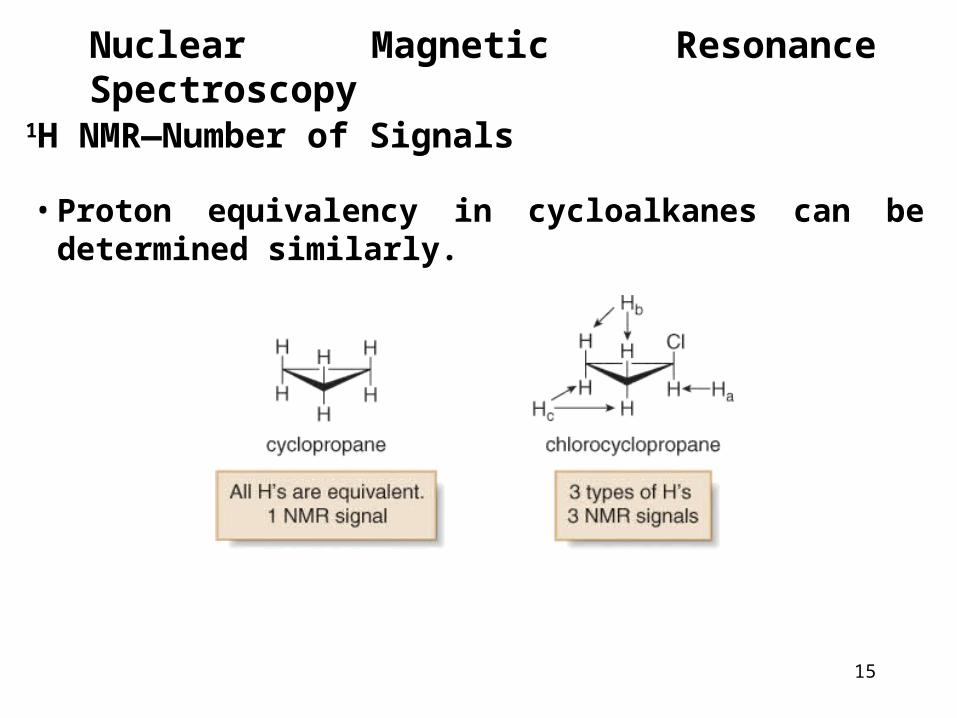
• Proton equivalency in cycloalkanes can be determined similarly.
1H NMR—Number of Signals
16
Nuclear Magnetic Resonance Spectroscopy
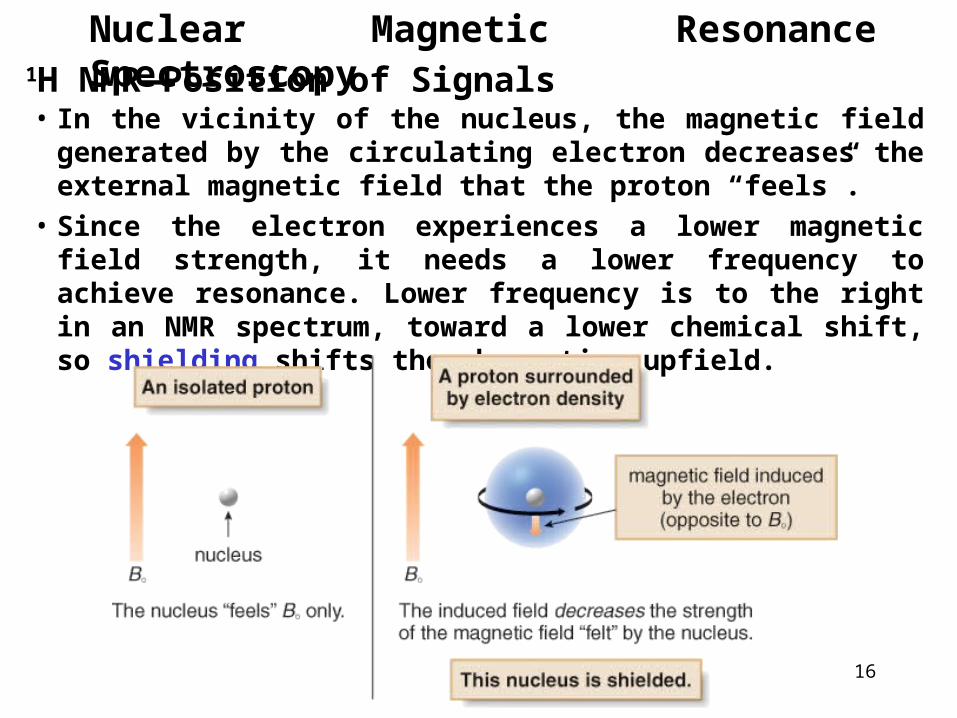
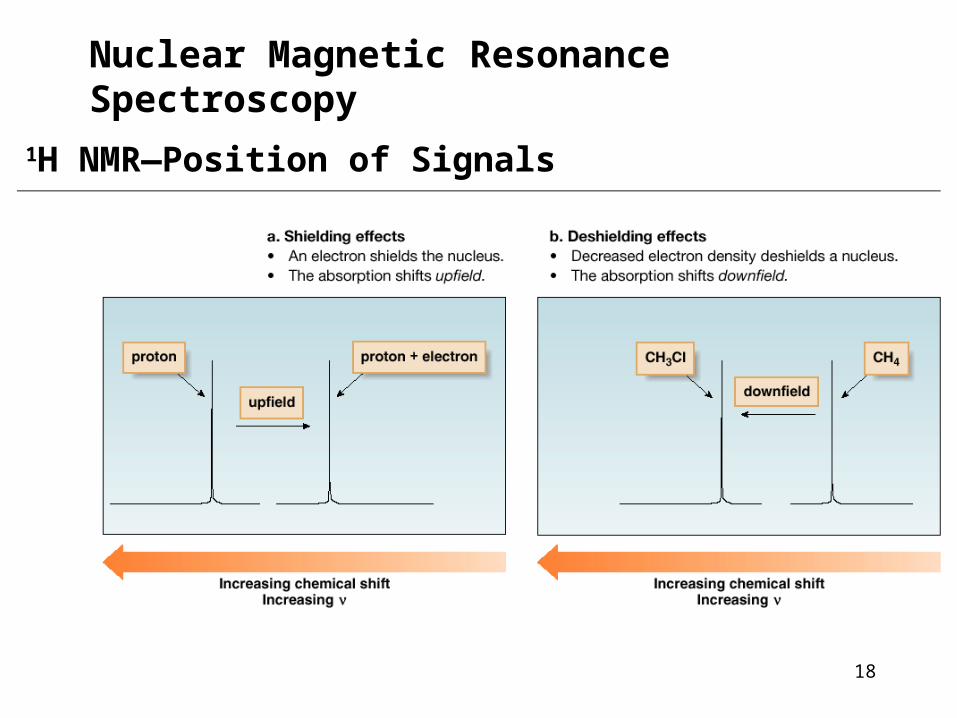
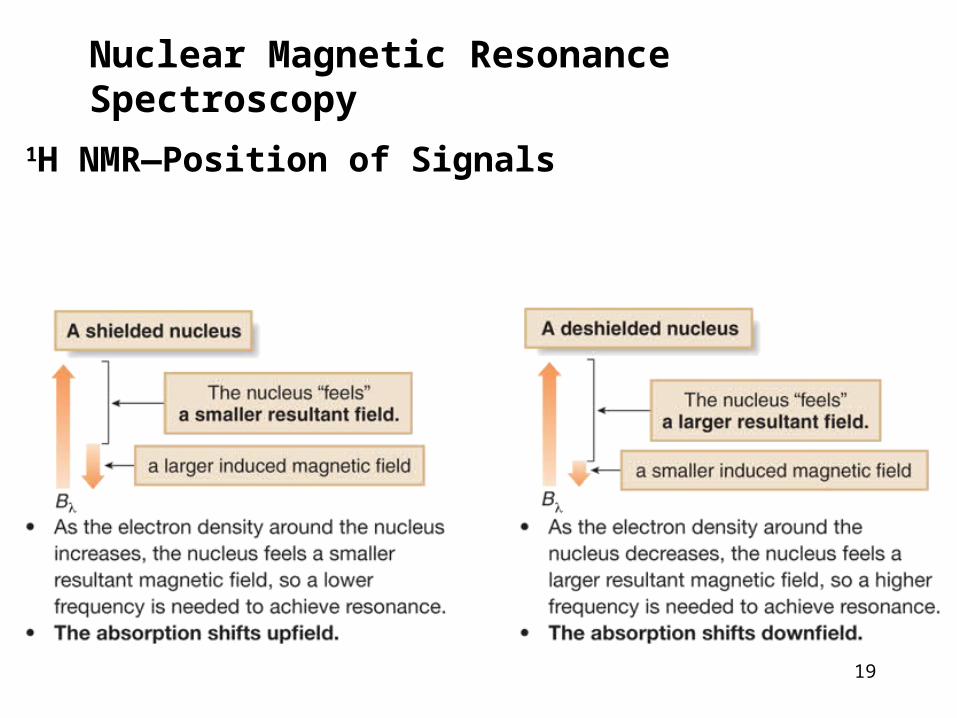
• In the vicinity of the nucleus, the magnetic field generated by the circulating electron decreases the external magnetic field that the proton “feels”.
• Since the electron experiences a lower magnetic field strength, it needs a lower frequency to achieve resonance. Lower frequency is to the right in an NMR spectrum, toward a lower chemical shift, so shielding shifts the absorption upfield.
1H NMR—Position of Signals
17
Nuclear Magnetic Resonance Spectroscopy
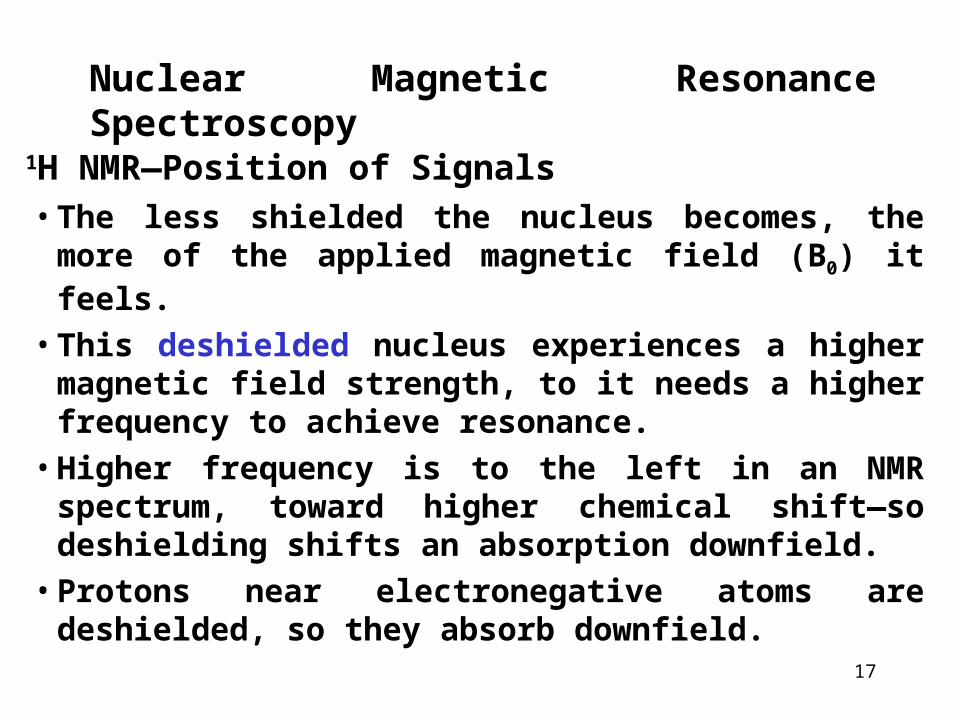
•The less shielded the nucleus becomes, the more of the applied magnetic field (B0) it feels.
•This deshielded nucleus experiences a higher magnetic field strength, to it needs a higher frequency to achieve resonance.
•Higher frequency is to the left in an NMR spectrum, toward higher chemical shift—so deshielding shifts an absorption downfield.
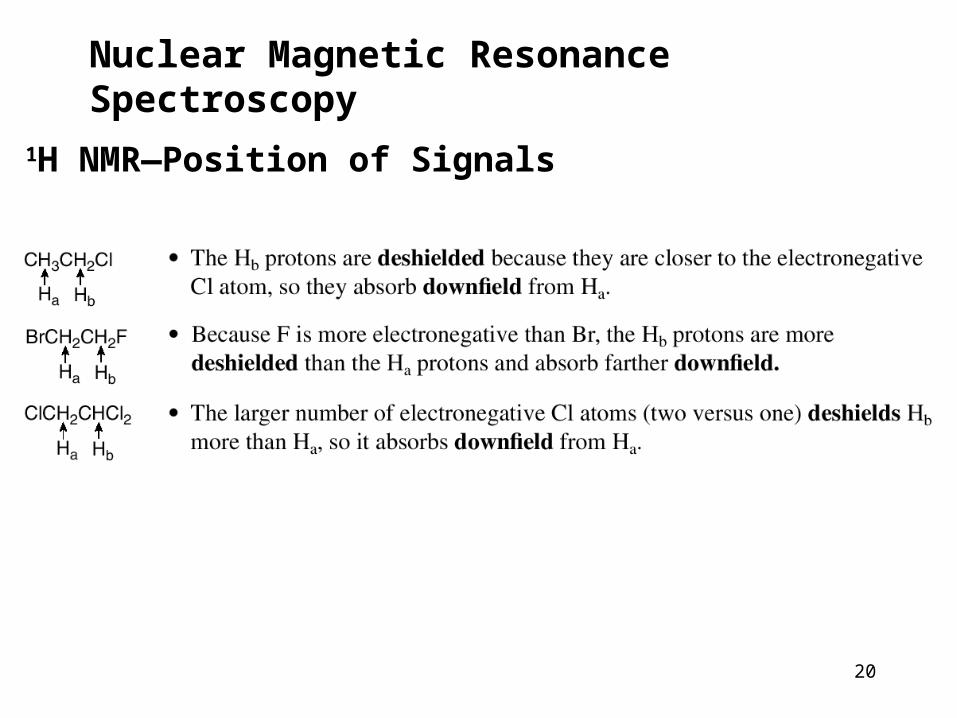
•Protons near electronegative atoms are deshielded, so they absorb downfield.
1H NMR—Position of Signals
18
Nuclear Magnetic Resonance Spectroscopy
1H NMR—Position of Signals
19
Nuclear Magnetic Resonance Spectroscopy
1H NMR—Position of Signals
20
Nuclear Magnetic Resonance Spectroscopy
1H NMR—Position of Signals
21
Nuclear Magnetic Resonance Spectroscopy
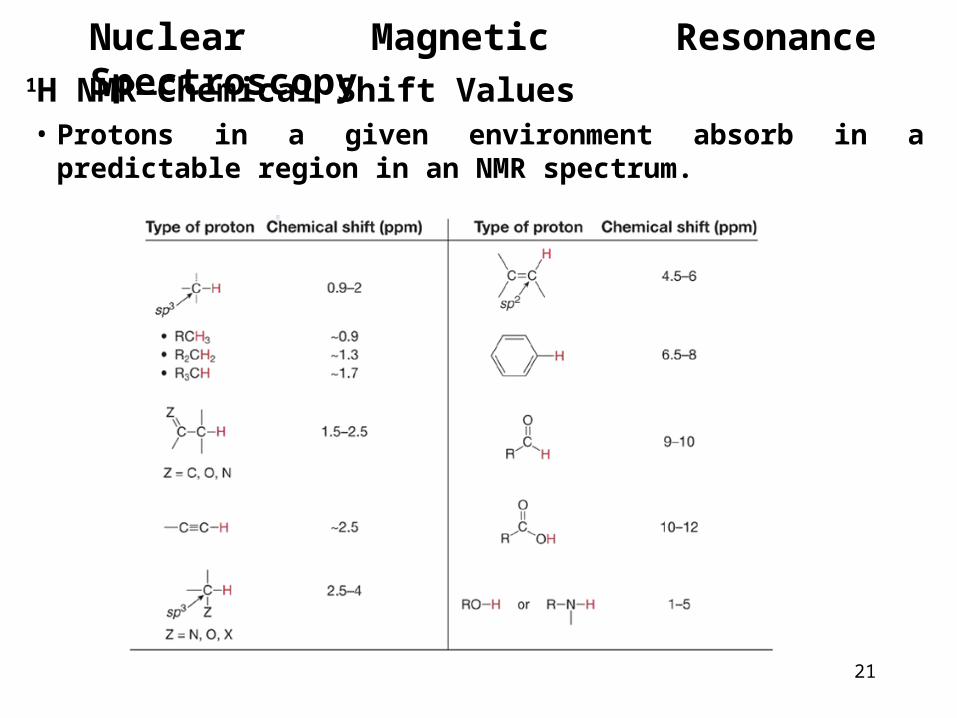
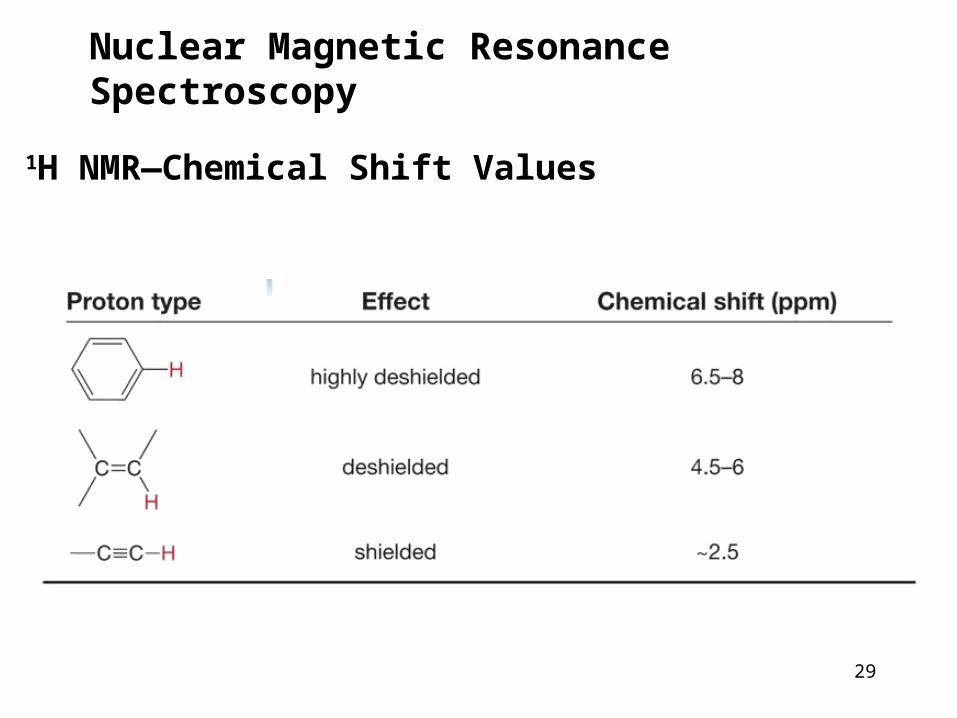
• Protons in a given environment absorb in a predictable region in an NMR spectrum.
1H NMR—Chemical Shift Values
22
Nuclear Magnetic Resonance Spectroscopy
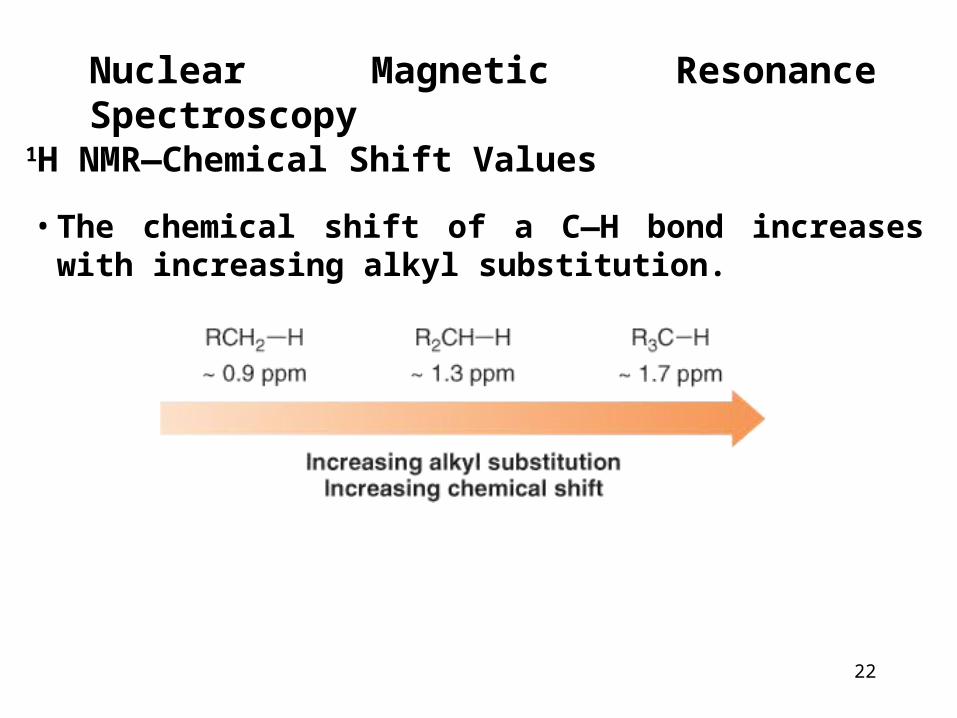
• The chemical shift of a C—H bond increases with increasing alkyl substitution.
1H NMR—Chemical Shift Values
23
Nuclear Magnetic Resonance Spectroscopy
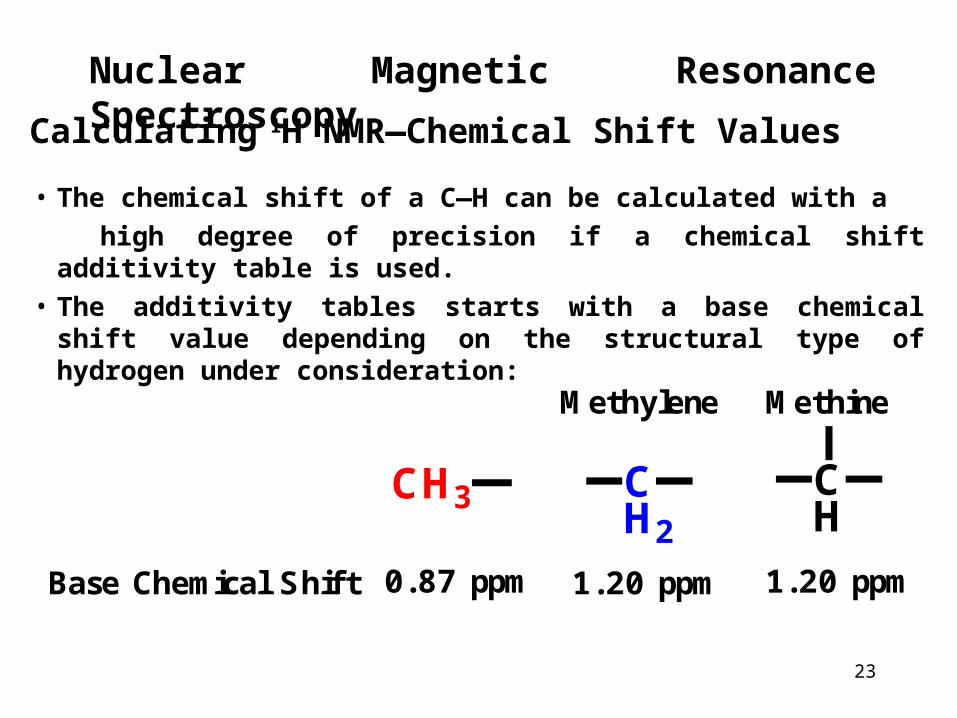
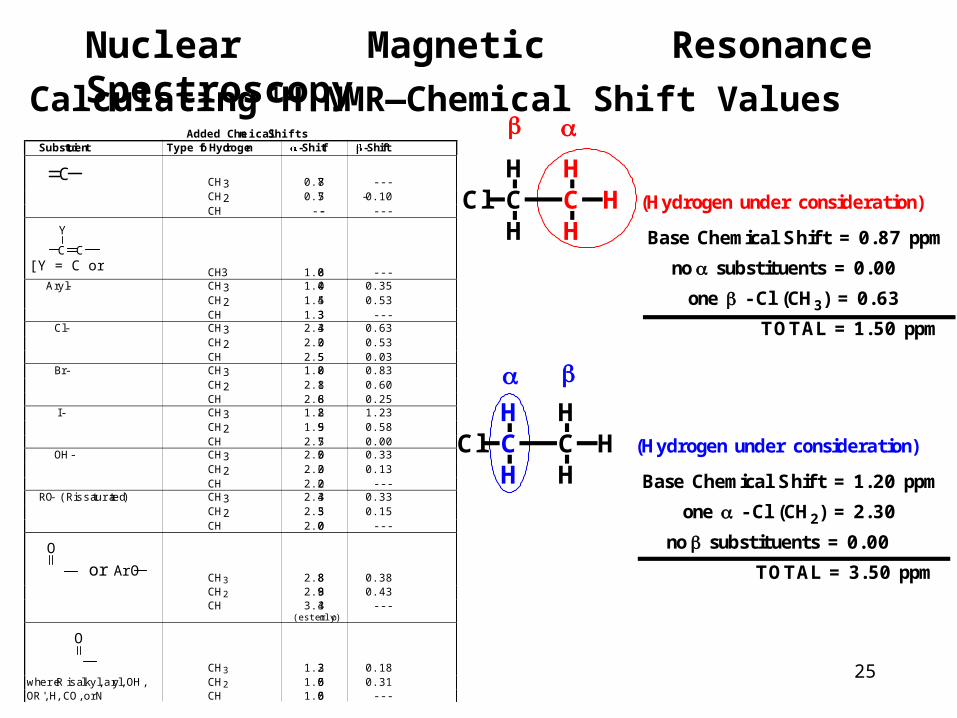
• The chemical shift of a C—H can be calculated with a high degree of precision if a chemical shift additivity
table is used.• The additivity tables starts with a base chemical shift value
depending on the structural type of hydrogen under consideration:
Calculating 1H NMR—Chemical Shift Values
CH3 CH2
CH
Methylene Methine
0.87 ppm 1.20 ppm 1.20 ppmBase Chemical Shift
24
Nuclear Magnetic Resonance Spectroscopy
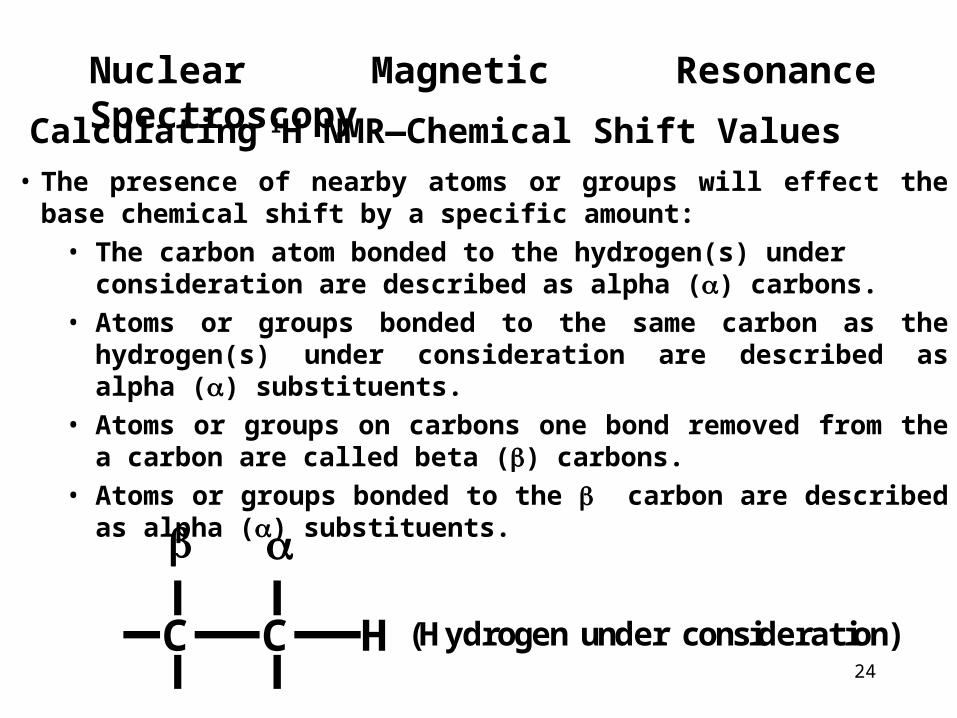
• The presence of nearby atoms or groups will effect the base chemical shift by a specific amount:
• The carbon atom bonded to the hydrogen(s) under consideration are described as alpha () carbons.
• Atoms or groups bonded to the same carbon as the hydrogen(s) under consideration are described as alpha () substituents.
• Atoms or groups on carbons one bond removed from the a carbon are called beta () carbons.
• Atoms or groups bonded to the carbon are described as alpha () substituents.
Calculating 1H NMR—Chemical Shift Values
(Hydrogen under consideration)C C H
25
Nuclear Magnetic Resonance SpectroscopyCalculating 1H NMR—Chemical Shift Values
Added Chemical Shifts Substituent Type of Hydrogen -Shift -Shift
C C CH3 0.78 --- CH2 0.75 -0.10 CH --- ---
RC C C
Y
[Y = C or O] CH3 1.08 --- Aryl- CH3 1.40 0.35 CH2 1.45 0.53 CH 1.33 --- Cl- CH3 2.43 0.63
CH2 2.30 0.53 CH 2.55 0.03 Br- CH3 1.80 0.83 CH2 2.18 0.60 CH 2.68 0.25 I- CH3 1.28 1.23 CH2 1.95 0.58 CH 2.75 0.00 OH- CH3 2.50 0.33 CH2 2.30 0.13 CH 2.20 --- RO- (R is saturated) CH3 2.43 0.33 CH2 2.35 0.15 CH 2.00 ---
R–CO
O
or ArO CH3 2.88 0.38 CH2 2.98 0.43 CH 3.43 --- (ester only)
R–C
O
CH3 1.23 0.18 where R is alkyl, aryl, OH, CH2 1.05 0.31 OR', H, CO, or N CH 1.05 ---
(Hydrogen under consideration)C C HH
H
H
HCl
Base Chemical Shift = 0.87 ppm
no substituents = 0.00
one - Cl (CH3) = 0.63
TOTAL = 1.50 ppm
(Hydrogen under consideration)C C HH
H
H
HCl
Base Chemical Shift = 1.20 ppm
one - Cl (CH2) = 2.30
no substituents = 0.00
TOTAL = 3.50 ppm
26
Nuclear Magnetic Resonance Spectroscopy
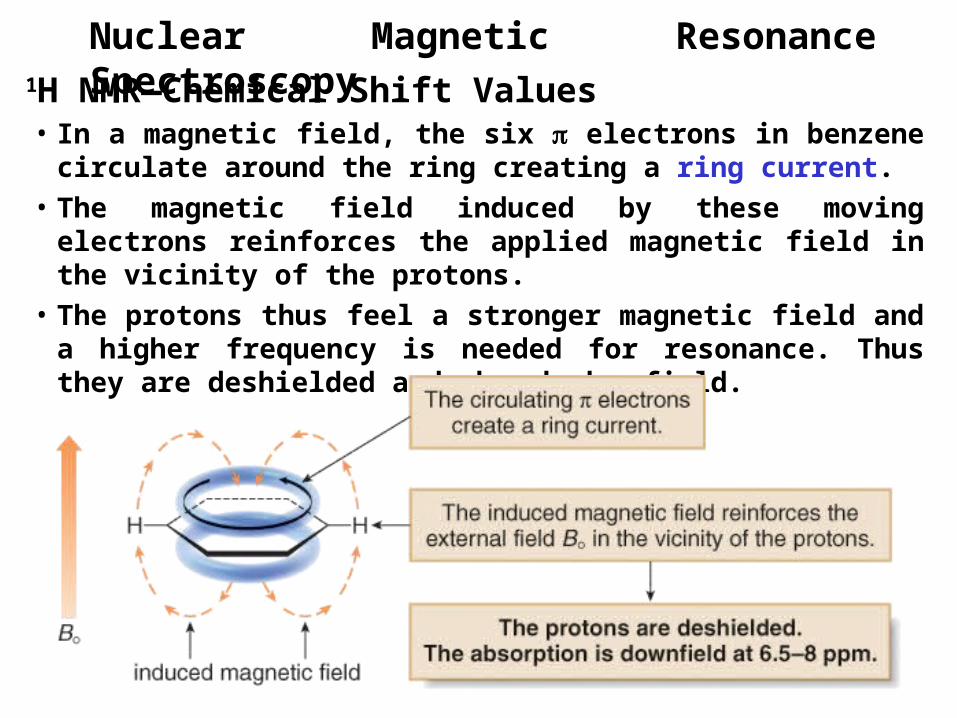
• In a magnetic field, the six electrons in benzene circulate around the ring creating a ring current.
• The magnetic field induced by these moving electrons reinforces the applied magnetic field in the vicinity of the protons.
• The protons thus feel a stronger magnetic field and a higher frequency is needed for resonance. Thus they are deshielded and absorb downfield.
1H NMR—Chemical Shift Values
27
Nuclear Magnetic Resonance Spectroscopy
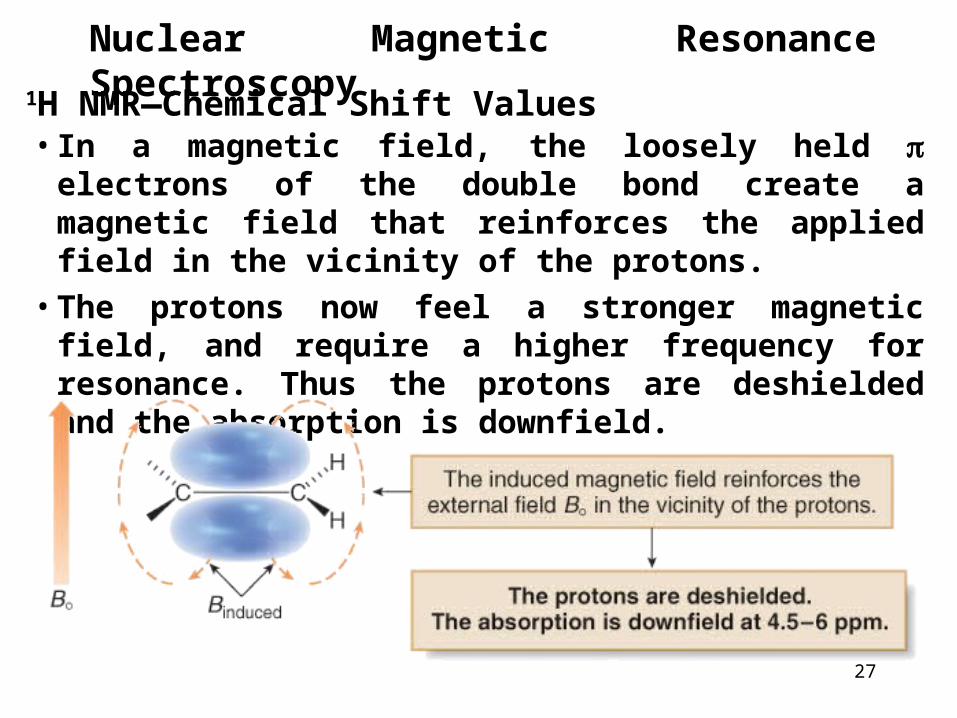
• In a magnetic field, the loosely held electrons of the double bond create a magnetic field that reinforces the applied field in the vicinity of the protons.
• The protons now feel a stronger magnetic field, and require a higher frequency for resonance. Thus the protons are deshielded and the absorption is downfield.
1H NMR—Chemical Shift Values
28
Nuclear Magnetic Resonance Spectroscopy
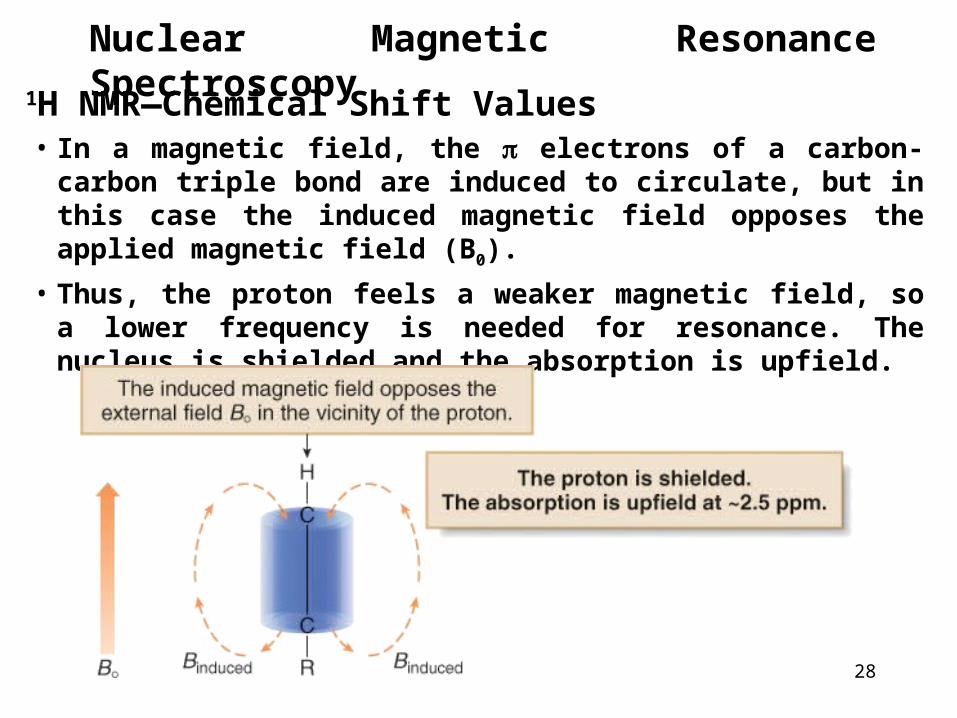
• In a magnetic field, the electrons of a carbon-carbon triple bond are induced to circulate, but in this case the induced magnetic field opposes the applied magnetic field (B0).
• Thus, the proton feels a weaker magnetic field, so a lower frequency is needed for resonance. The nucleus is shielded and the absorption is upfield.
1H NMR—Chemical Shift Values
29
Nuclear Magnetic Resonance Spectroscopy
1H NMR—Chemical Shift Values
30
Nuclear Magnetic Resonance Spectroscopy
1H NMR—Chemical Shift Values)
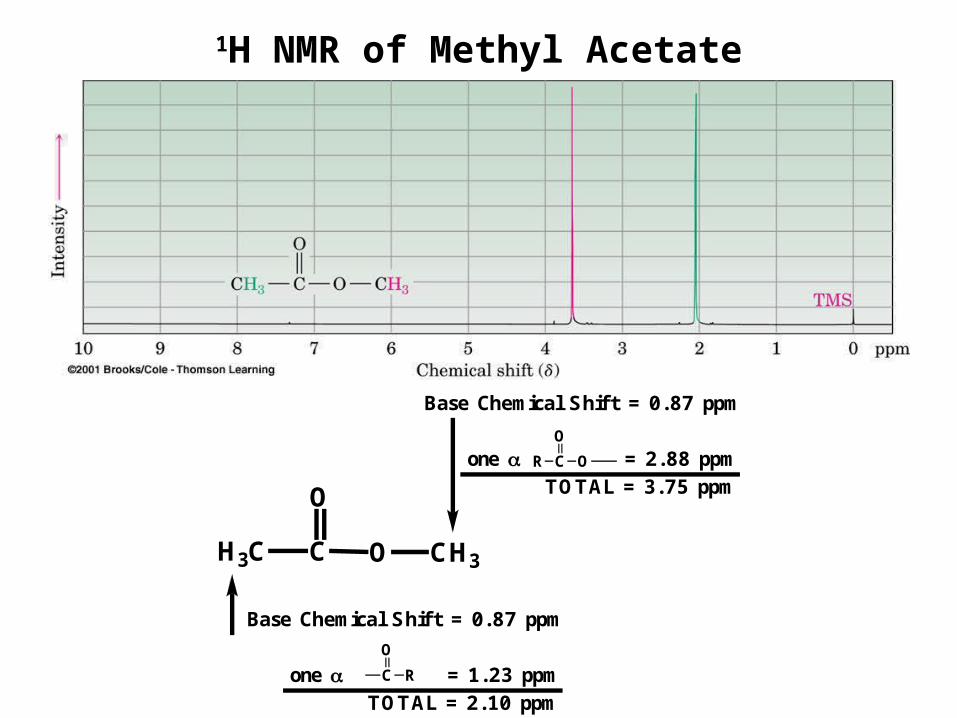
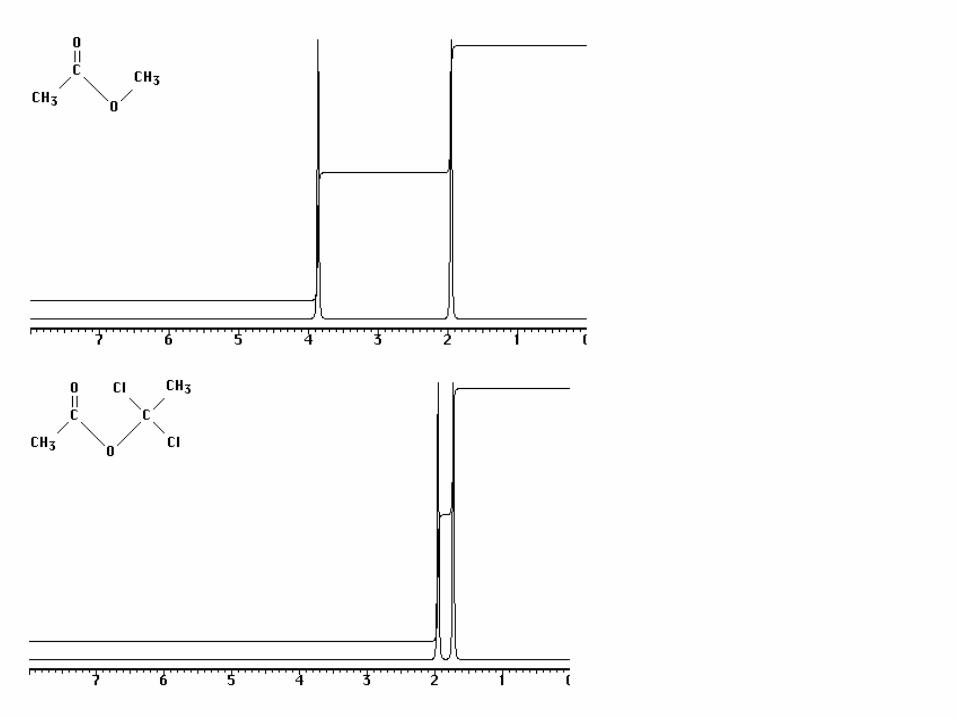
1H NMR of Methyl Acetate
C
O
R O
H3C C O
Base Chemical Shift = 0.87 ppm one = 2.88 ppm TOTAL = 3.75 ppmO
CH3
C
O
R
Base Chemical Shift = 0.87 ppm one = 1.23 ppm TOTAL = 2.10 ppm
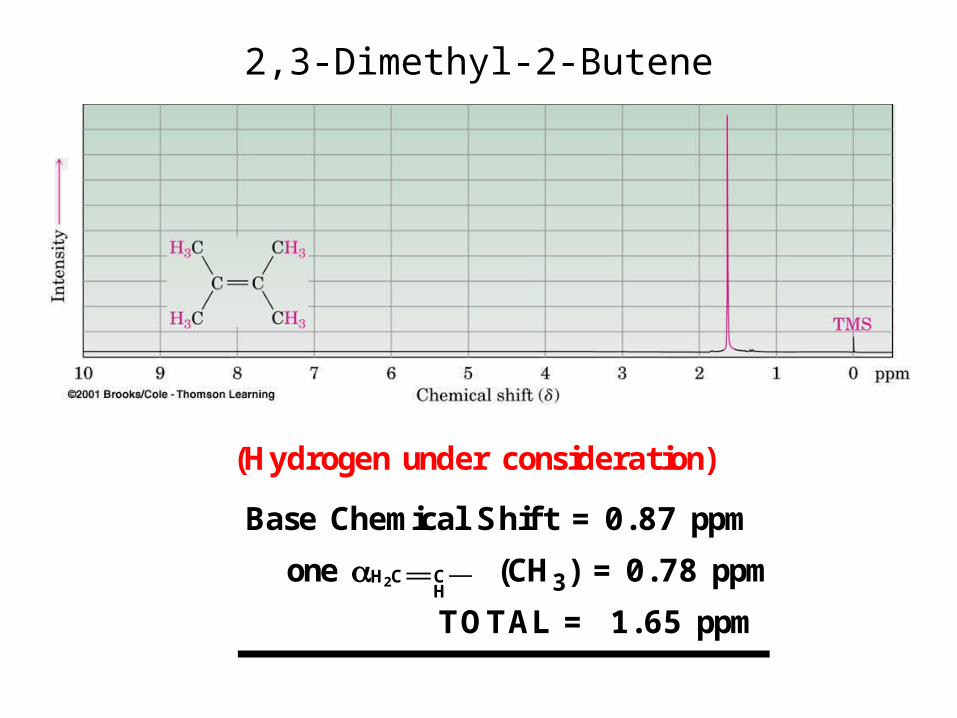
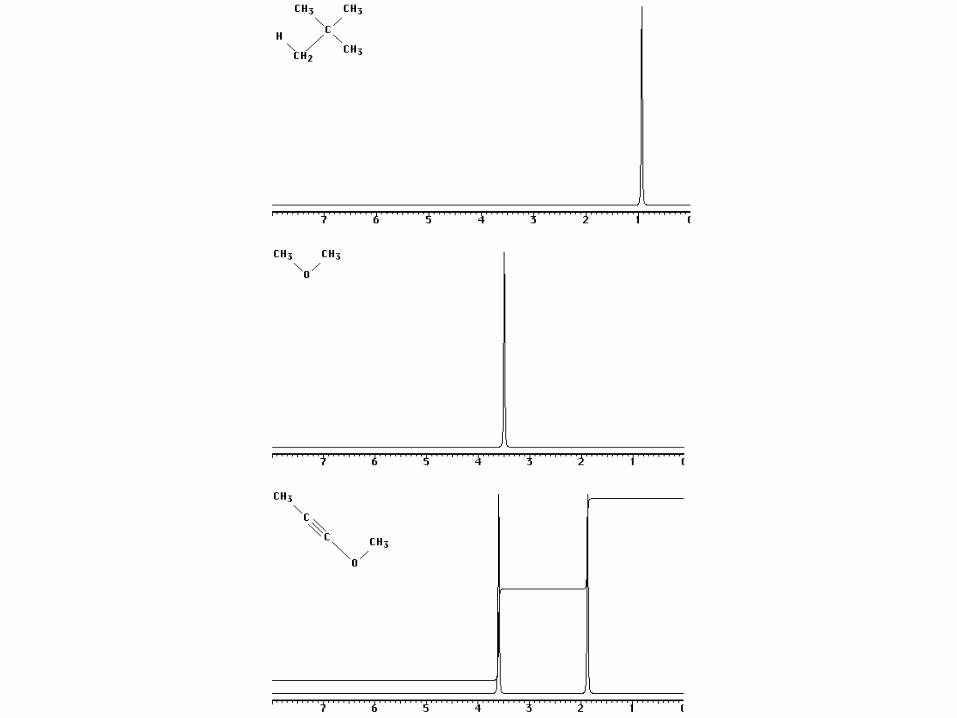
2,3-Dimethyl-2-Butene
(Hydrogen under consideration)
Base Chemical Shift = 0.87 ppm
one (CH3) = 0.78 ppm
TOTAL = 1.65 ppm
H2C CH
33
Nuclear Magnetic Resonance Spectroscopy
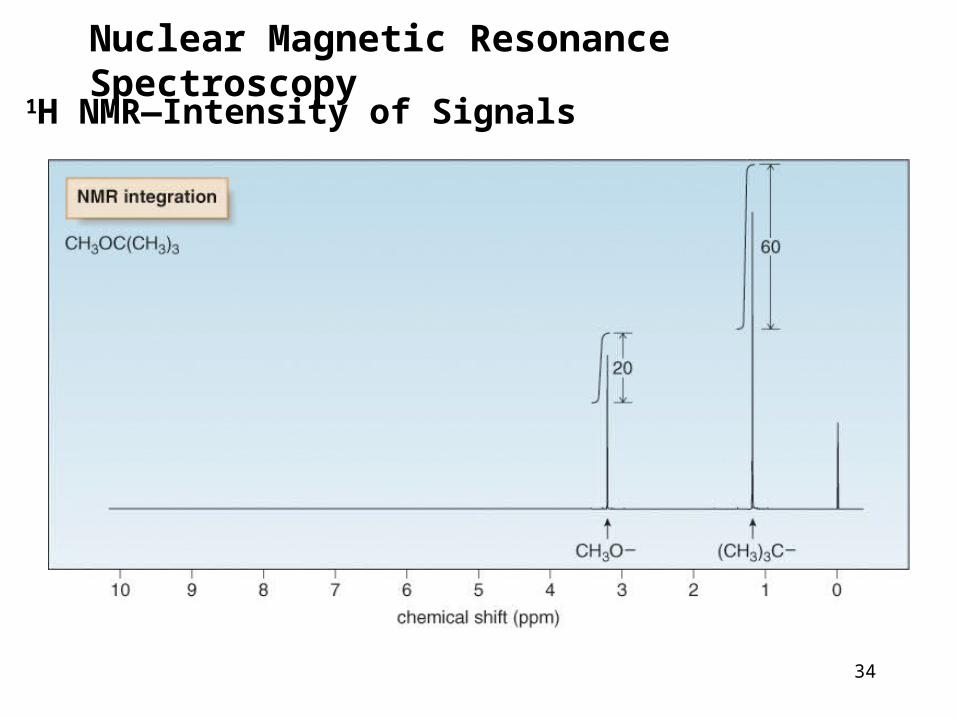
• The area under an NMR signal is proportional to the number of absorbing protons.
• An NMR spectrometer automatically integrates the area under the peaks, and prints out a stepped curve (integral) on the spectrum.
• The height of each step is proportional to the area under the peak, which in turn is proportional to the number of absorbing protons.
• Modern NMR spectrometers automatically calculate and plot the value of each integral in arbitrary units.
• The ratio of integrals to one another gives the ratio of absorbing protons in a spectrum. Note that this gives a ratio, and not the absolute number, of absorbing protons.
1H NMR—Intensity of Signals
34
Nuclear Magnetic Resonance Spectroscopy
1H NMR—Intensity of Signals
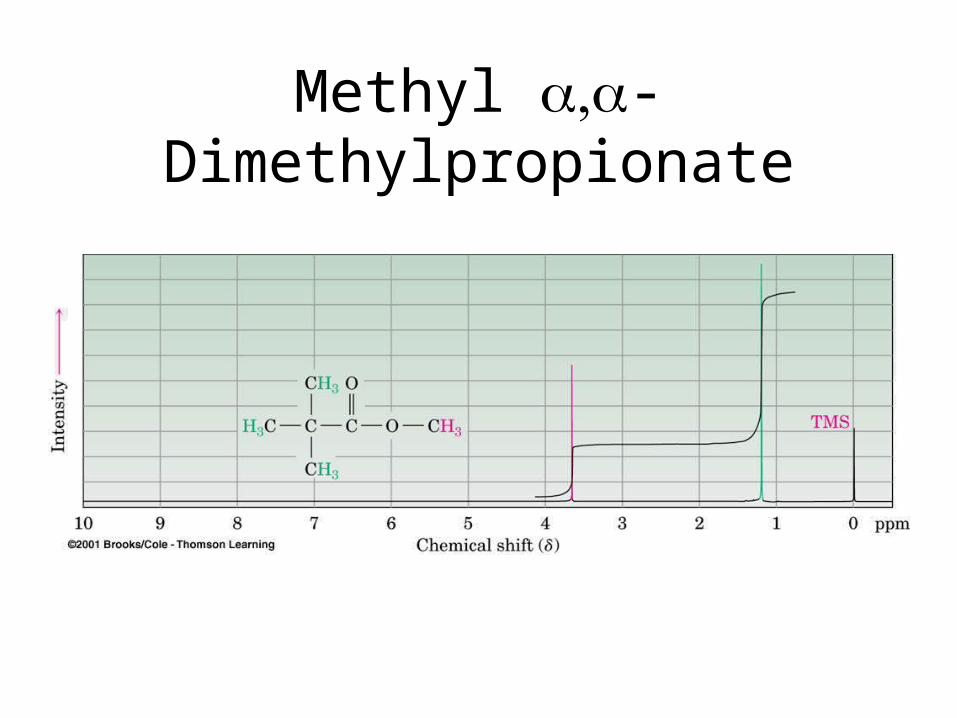
Methyl -Dimethylpropionate
36
39
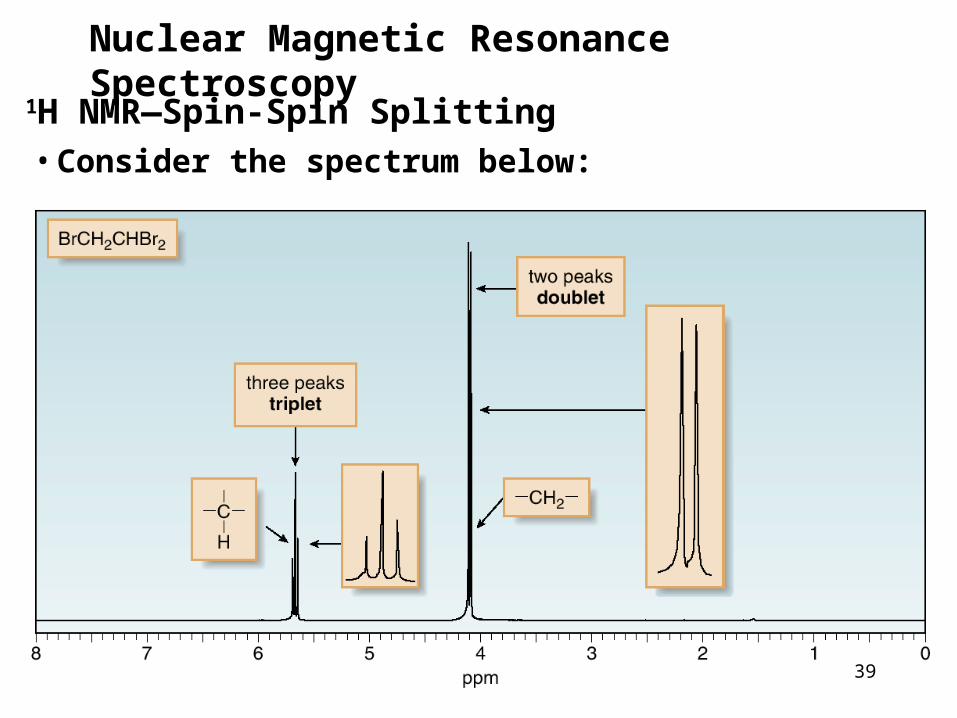
Nuclear Magnetic Resonance Spectroscopy
• Consider the spectrum below:
1H NMR—Spin-Spin Splitting
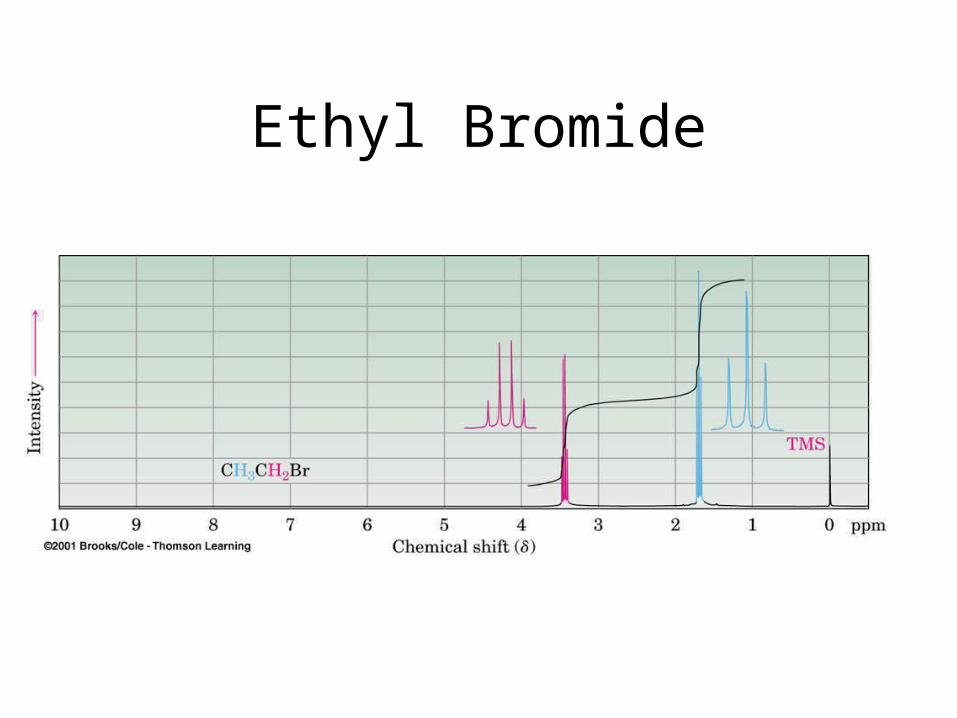
Ethyl Bromide
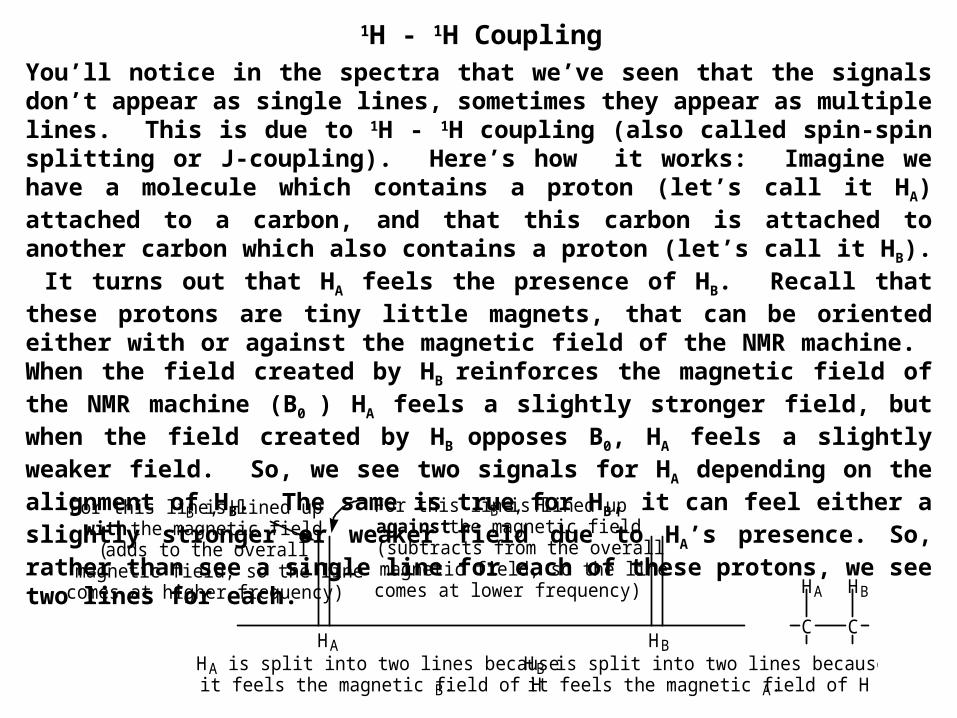
1H - 1H CouplingYou’ll notice in the spectra that we’ve seen that the signals don’t appear as single lines, sometimes they appear as multiple lines. This is due to 1H - 1H coupling (also called spin-spin splitting or J-coupling). Here’s how it works: Imagine we have a molecule which contains a proton (let’s call it HA) attached to a carbon, and that this carbon is attached to another carbon which also contains a proton (let’s call it HB). It turns out that HA feels the presence of HB. Recall that these protons are tiny little magnets, that can be oriented either with or against the magnetic field of the NMR machine. When the field created by HB
reinforces the magnetic field of the NMR machine (B0 ) HA feels a slightly stronger field, but when the field created by HB opposes B0, HA feels a slightly weaker field. So, we see two signals for HA depending on the alignment of HB. The same is true for HB, it can feel either a slightly stronger or weaker field due to HA’s presence. So, rather than see a single line for each of these protons, we see two lines for each.
C C
HBHA
HA HBHA is split into two lines because it feels the magnetic field of HB.
HB is split into two lines because it feels the magnetic field of HA.
For this line, HB is lined up with the magnetic field
(adds to the overall magnetic field, so the line
comes at higher frequency)
For this line, HB is lined up against the magnetic field(subtracts from the overall magnetic field, so the line
comes at lower frequency)
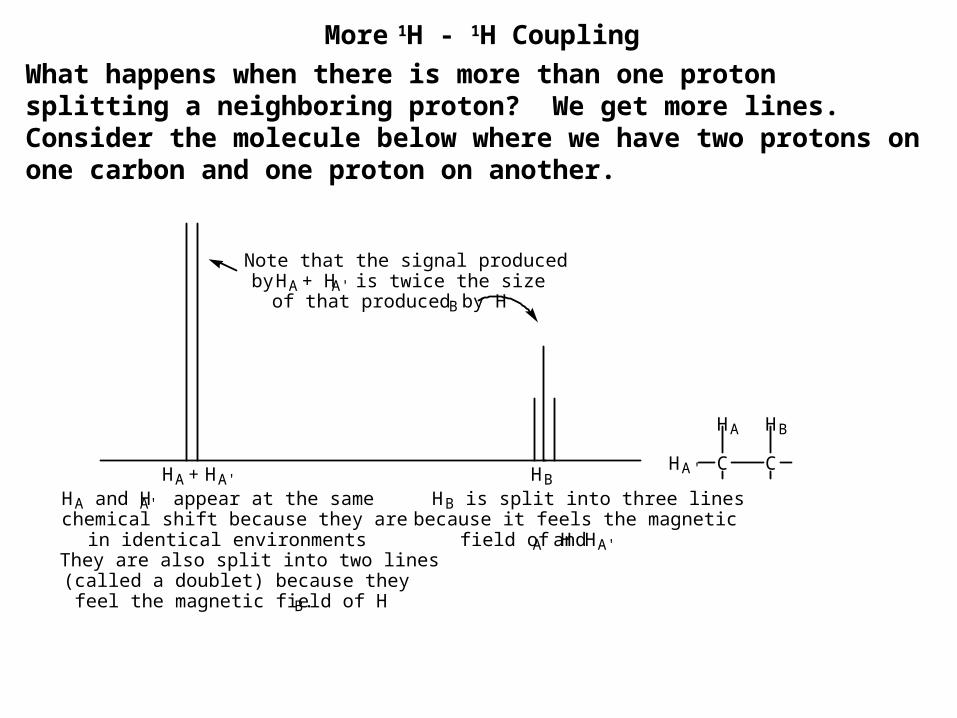
More 1H - 1H Coupling
What happens when there is more than one proton splitting a neighboring proton? We get more lines. Consider the molecule below where we have two protons on one carbon and one proton on another.
C C
HBHA
HA'HA + HA' HBHA and HA' appear at the same chemical shift because they are
in identical environments They are also split into two lines (called a doublet) because they
feel the magnetic field of HB.
HB is split into three lines because it feels the magnetic
field of HA and HA'
Note that the signal produced by HA + HA' is twice the size
of that produced by HB
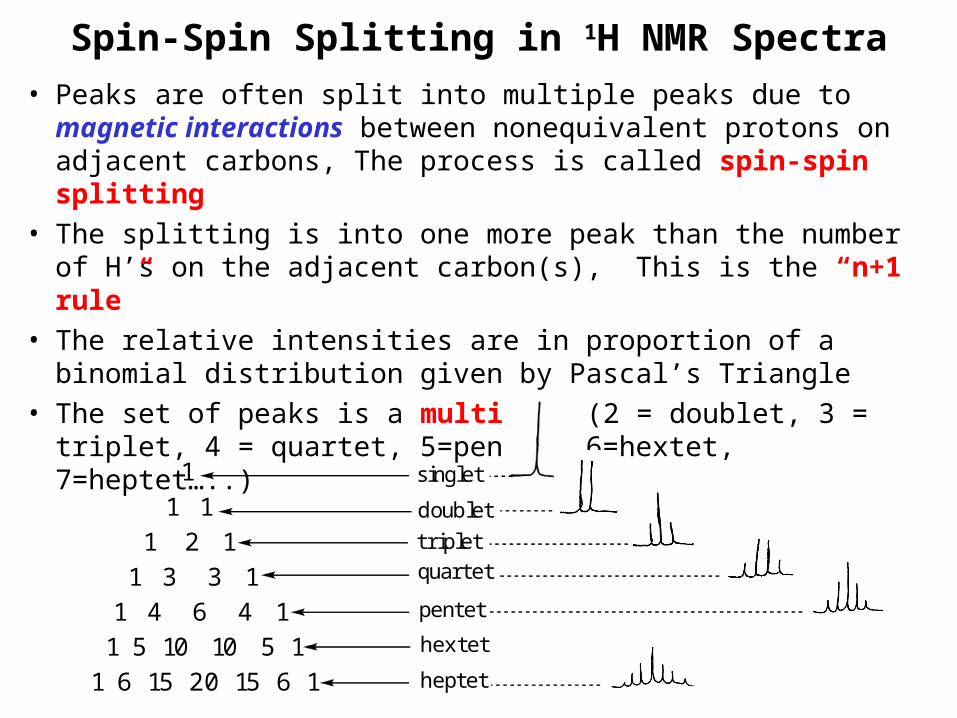
Spin-Spin Splitting in 1H NMR Spectra• Peaks are often split into multiple peaks due to magnetic
interactions between nonequivalent protons on adjacent carbons, The process is called spin-spin splitting
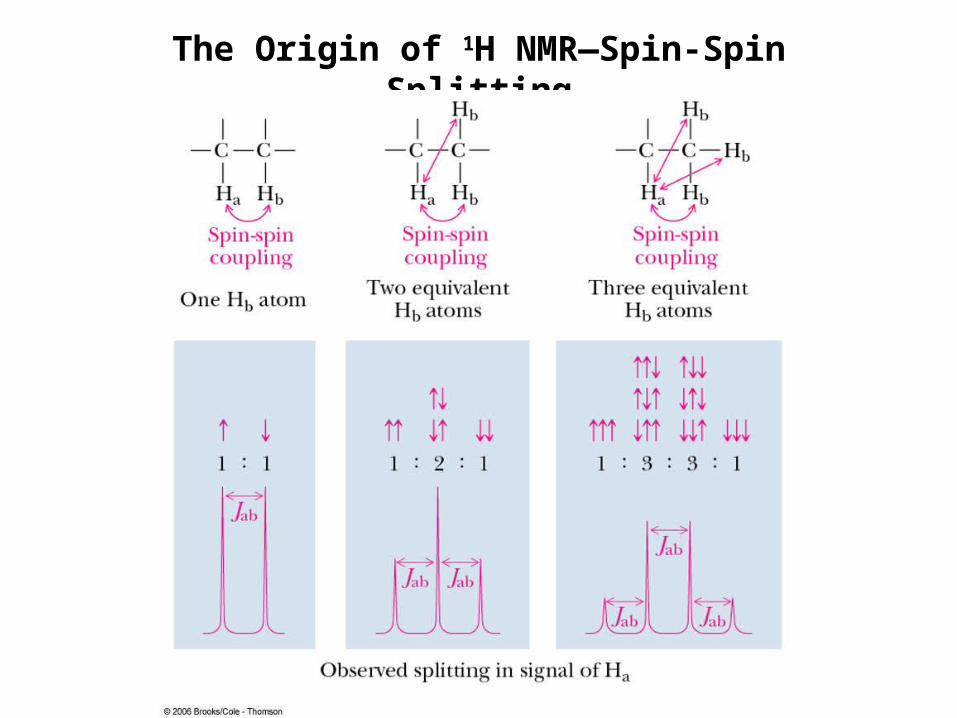
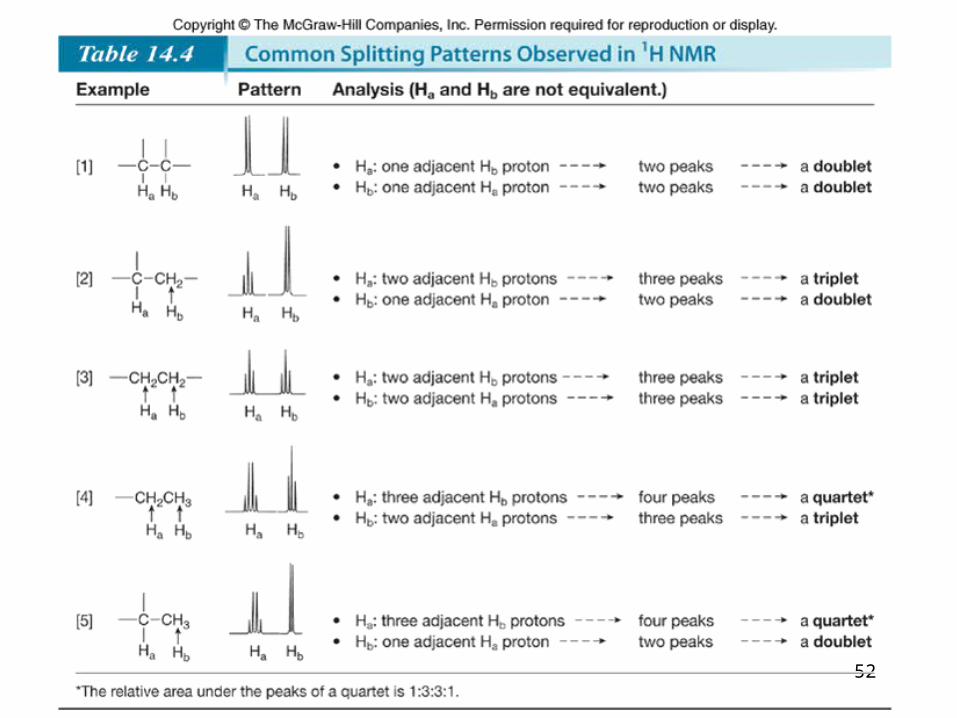
• The splitting is into one more peak than the number of H’s on the adjacent carbon(s), This is the “n+1 rule”
• The relative intensities are in proportion of a binomial distribution given by Pascal’s Triangle
• The set of peaks is a multiplet (2 = doublet, 3 = triplet, 4 = quartet, 5=pentet, 6=hextet, 7=heptet…..)
1 1 1 1 2 1 1 3 3 1 1 4 6 4 1 1 5 10 10 5 11 6 15 20 15 6 1
singlet
doublet
tripletquartet
pentet
hextet
heptet
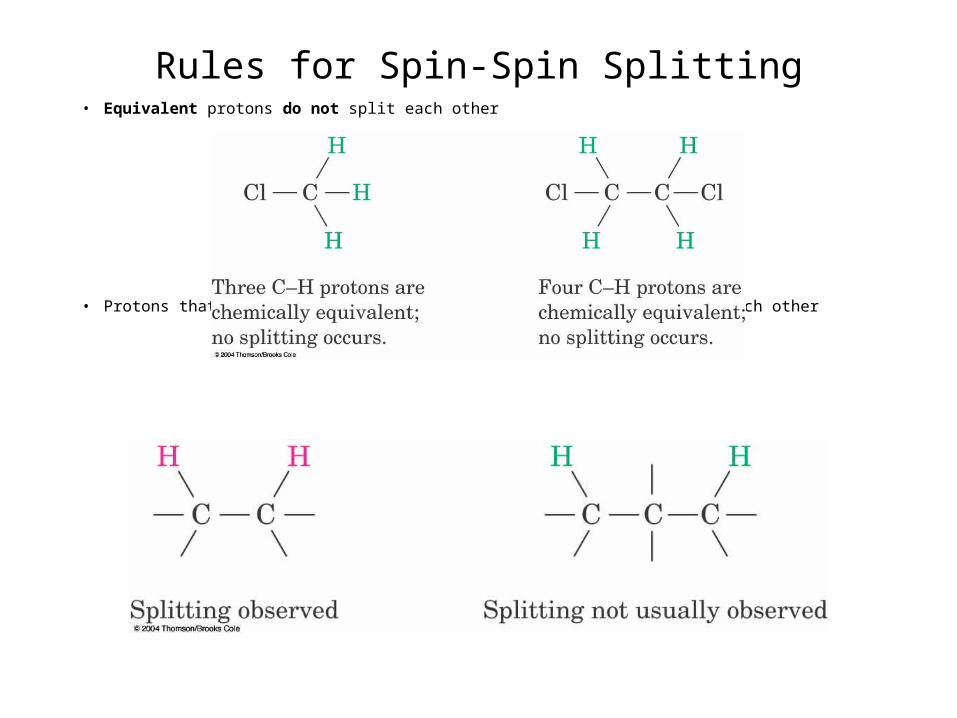
Rules for Spin-Spin Splitting• Equivalent protons do not split each other
• Protons that are farther than two carbon atoms apart do not split each other
45
1H NMR—Spin-Spin Splitting
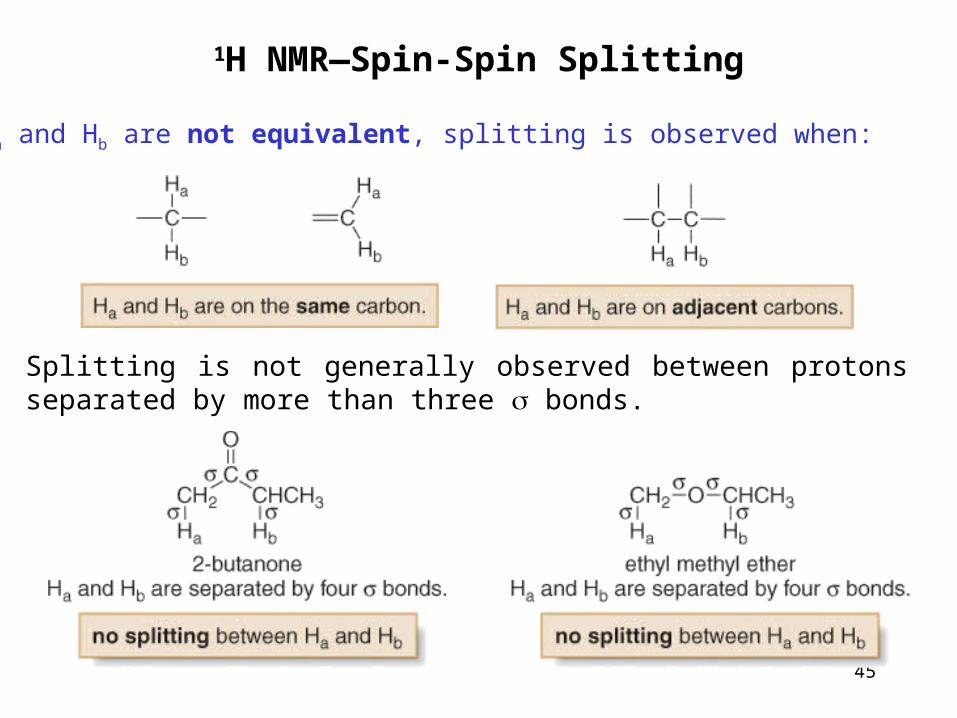
Splitting is not generally observed between protons separated by more than three bonds.
If Ha and Hb are not equivalent, splitting is observed when:
46
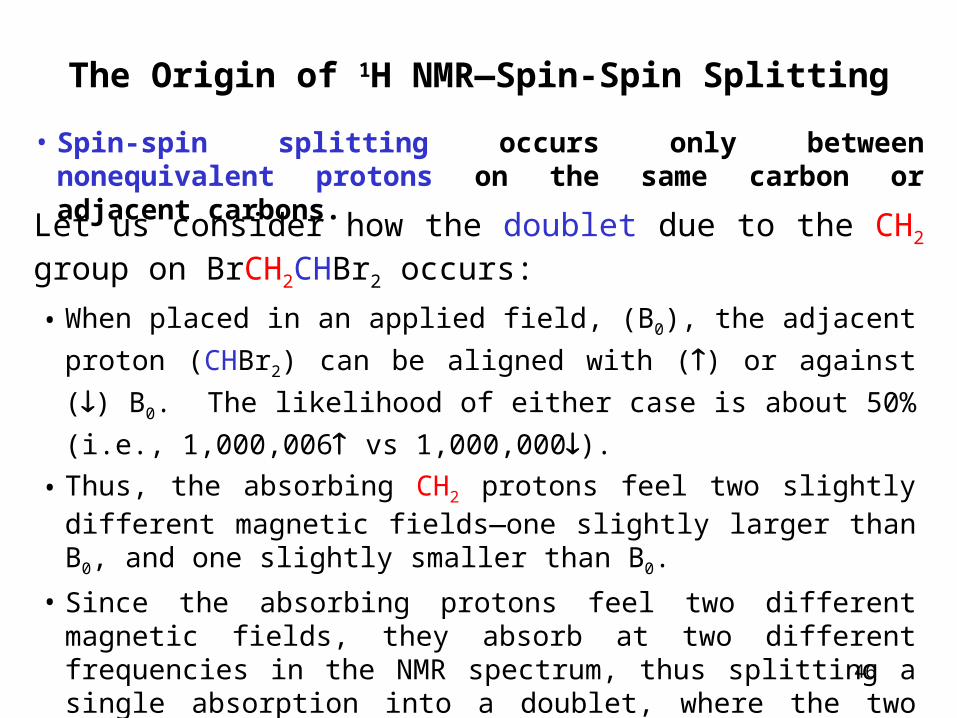
• Spin-spin splitting occurs only between nonequivalent protons on the same carbon or adjacent carbons.
The Origin of 1H NMR—Spin-Spin Splitting
Let us consider how the doublet due to the CH2 group on BrCH2CHBr2 occurs:
• When placed in an applied field, (B0), the adjacent proton
(CHBr2) can be aligned with () or against () B0. The
likelihood of either case is about 50% (i.e., 1,000,006 vs 1,000,000).
• Thus, the absorbing CH2 protons feel two slightly different magnetic fields—one slightly larger than B0, and one slightly smaller than B0.
• Since the absorbing protons feel two different magnetic fields, they absorb at two different frequencies in the NMR spectrum, thus splitting a single absorption into a doublet, where the two peaks of the doublet have equal intensity.
47
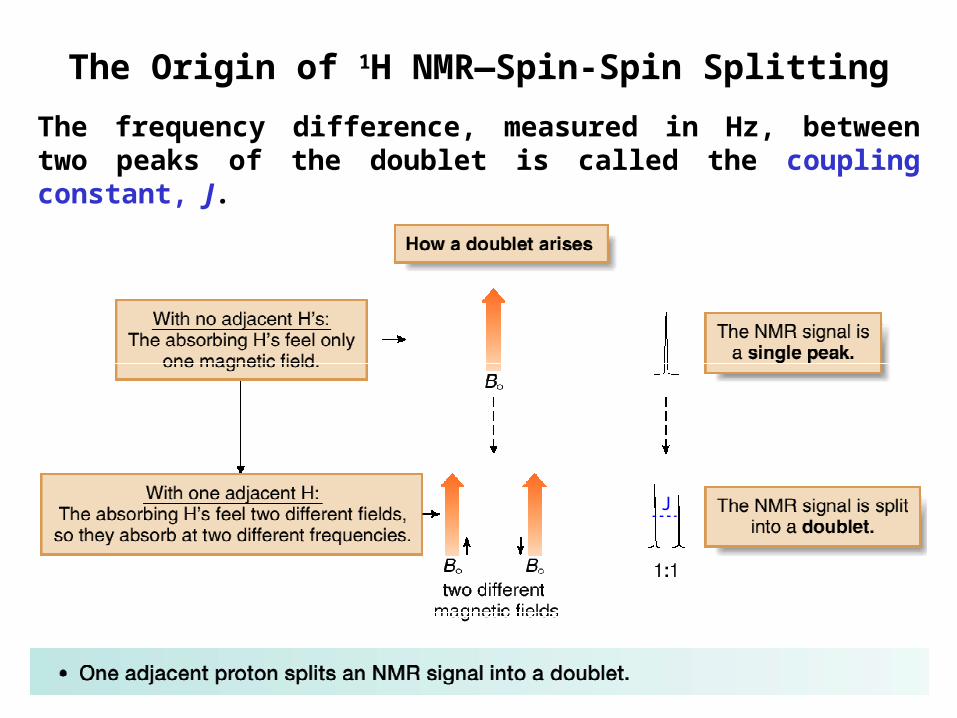
The Origin of 1H NMR—Spin-Spin Splitting
The frequency difference, measured in Hz, between two peaks of the doublet is called the coupling constant, J.
J
48
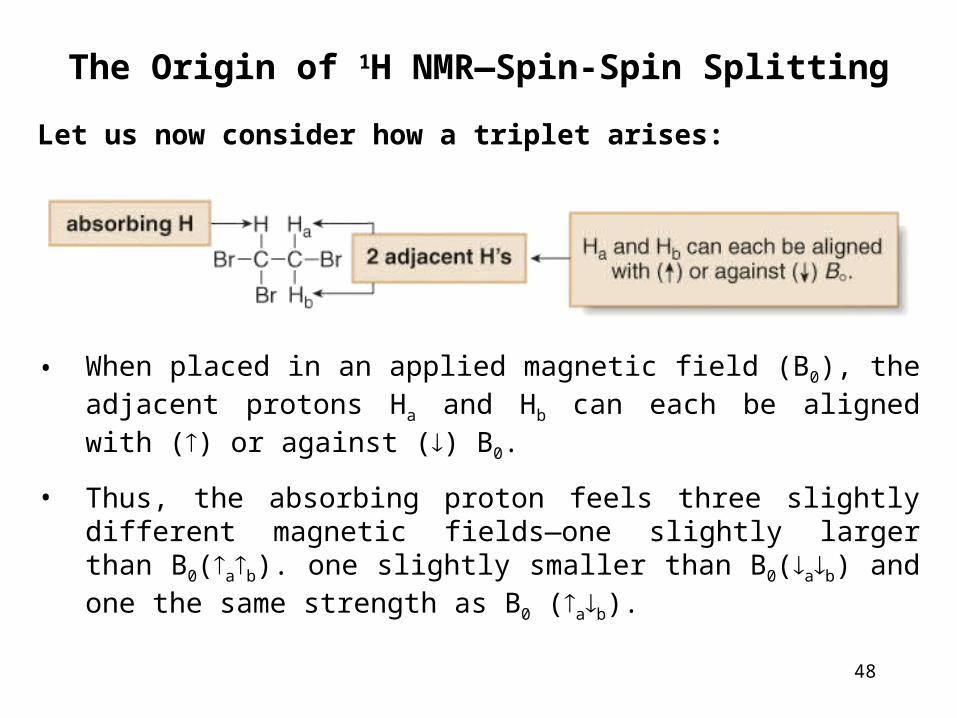
The Origin of 1H NMR—Spin-Spin Splitting
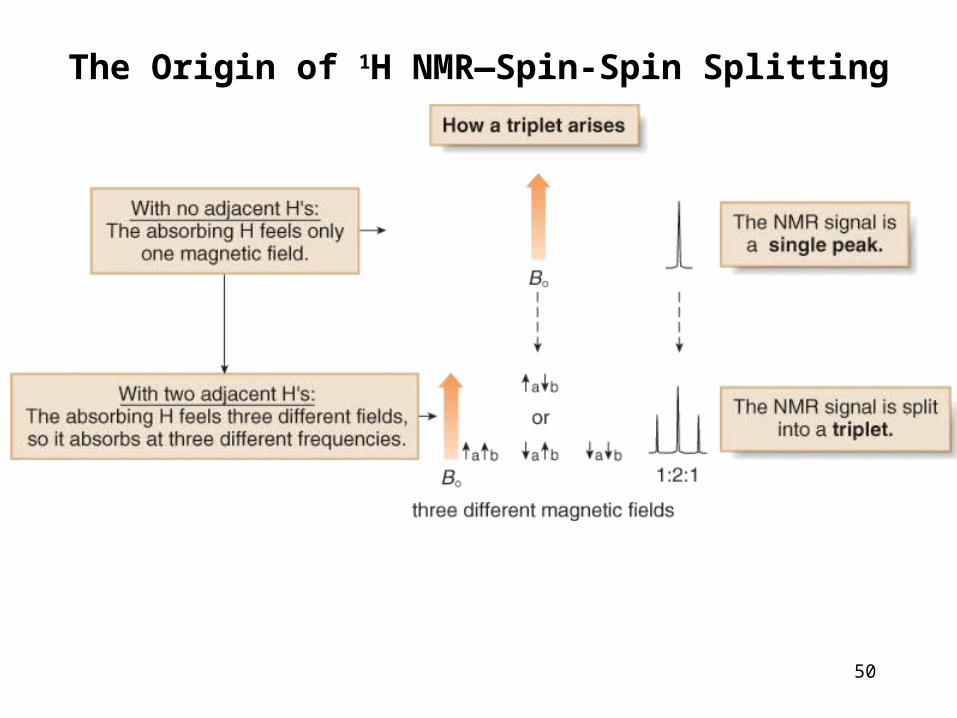
Let us now consider how a triplet arises:
• When placed in an applied magnetic field (B0), the adjacent protons Ha and Hb can each be aligned with () or against () B0.
• Thus, the absorbing proton feels three slightly different magnetic fields—one slightly larger than B0(ab). one slightly smaller than B0(ab) and one the same strength as B0 (ab).
49
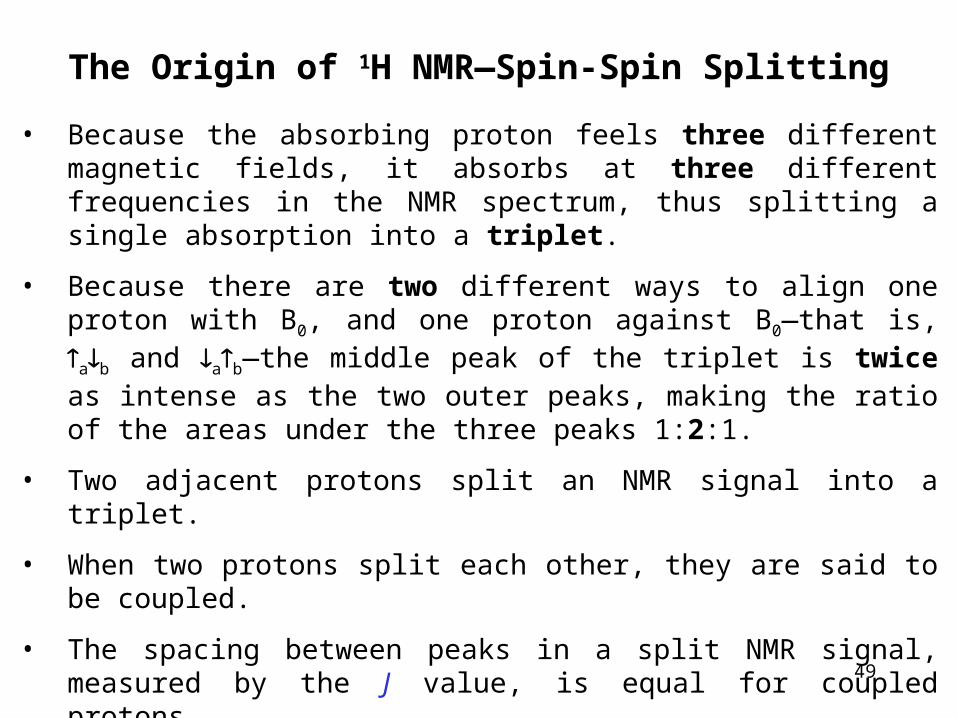
The Origin of 1H NMR—Spin-Spin Splitting
• Because the absorbing proton feels three different magnetic fields, it absorbs at three different frequencies in the NMR spectrum, thus splitting a single absorption into a triplet.
• Because there are two different ways to align one proton with B0, and one proton against B0—that is, ab and ab—the middle peak of the triplet is twice as intense as the two outer peaks, making the ratio of the areas under the three peaks 1:2:1.
• Two adjacent protons split an NMR signal into a triplet.
• When two protons split each other, they are said to be coupled.
• The spacing between peaks in a split NMR signal, measured by the J value, is equal for coupled protons.
50
The Origin of 1H NMR—Spin-Spin Splitting
The Origin of 1H NMR—Spin-Spin Splitting
52
53
Nuclear Magnetic Resonance Spectroscopy1H NMR—Spin-Spin SplittingWhenever two (or three) different sets of adjacent protons are equivalent to each other, use the n + 1 rule to determine the splitting pattern.
54
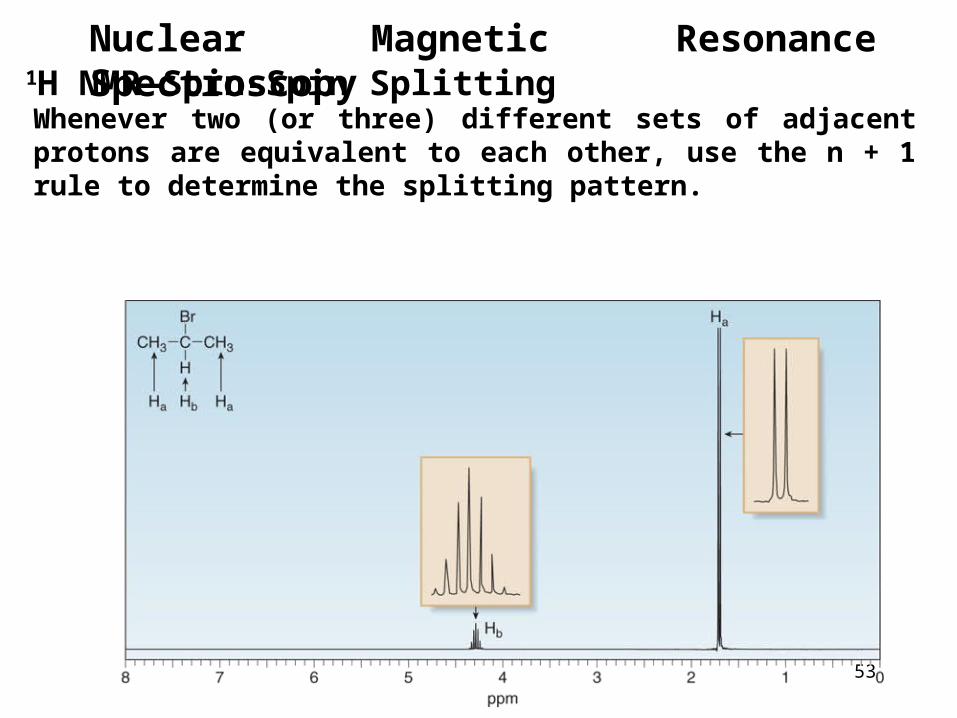
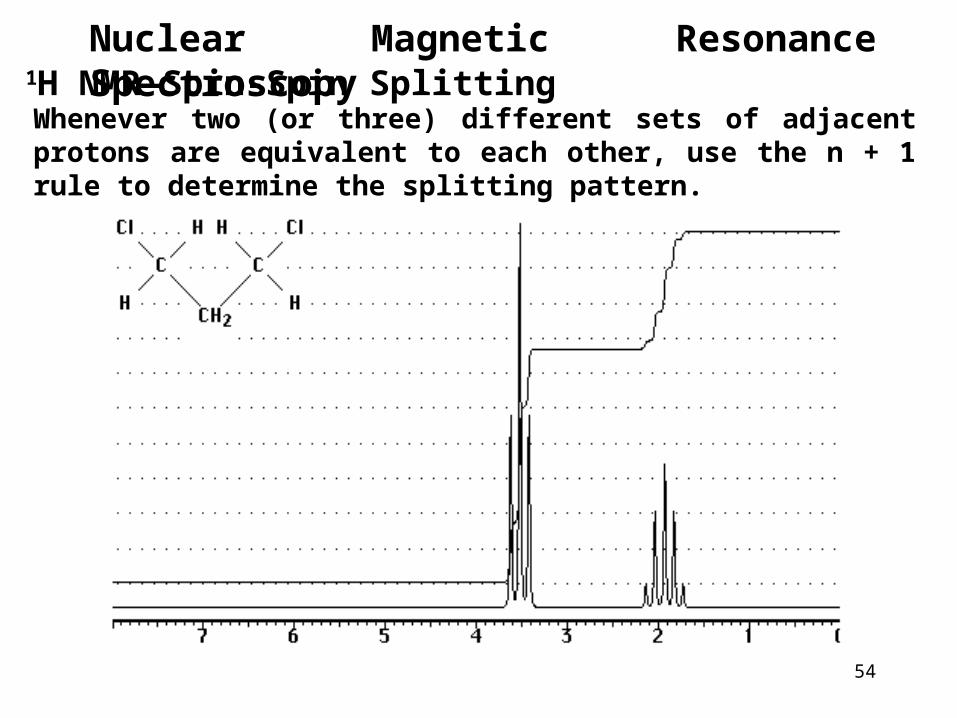
Nuclear Magnetic Resonance Spectroscopy1H NMR—Spin-Spin SplittingWhenever two (or three) different sets of adjacent protons are equivalent to each other, use the n + 1 rule to determine the splitting pattern.
55
Nuclear Magnetic Resonance Spectroscopy1H NMR—Spin-Spin Splitting
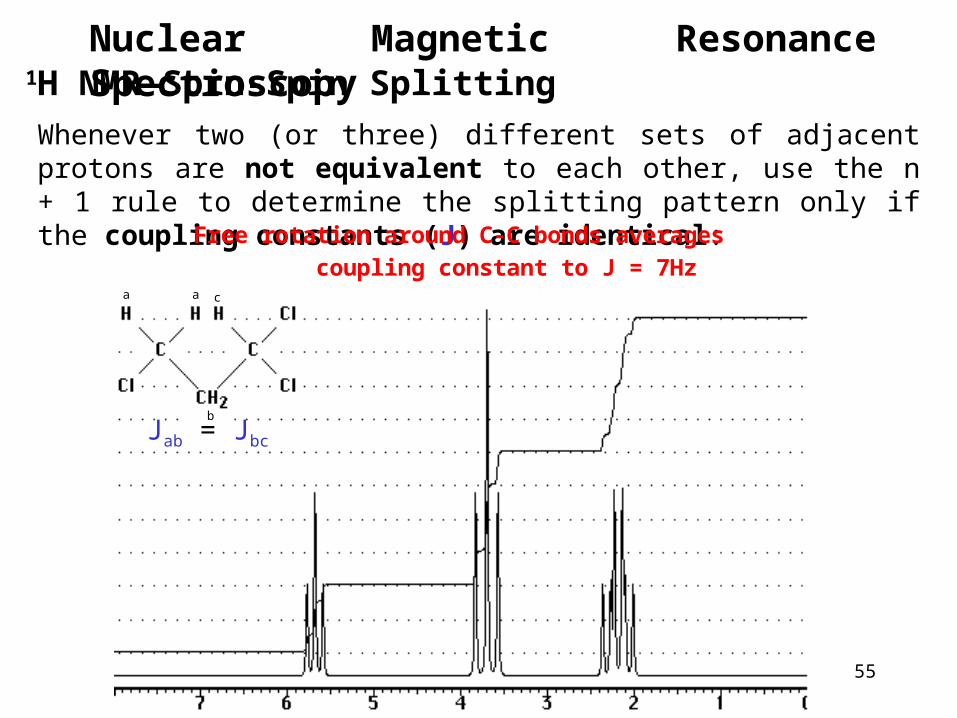
Whenever two (or three) different sets of adjacent protons are not equivalent to each other, use the n + 1 rule to determine the splitting pattern only if the coupling constants (J) are identical:
a a
b
c
Free rotation around C-C bonds averages coupling constant to J = 7Hz
Jab = Jbc
56
Nuclear Magnetic Resonance Spectroscopy1H NMR—Spin-Spin Splitting
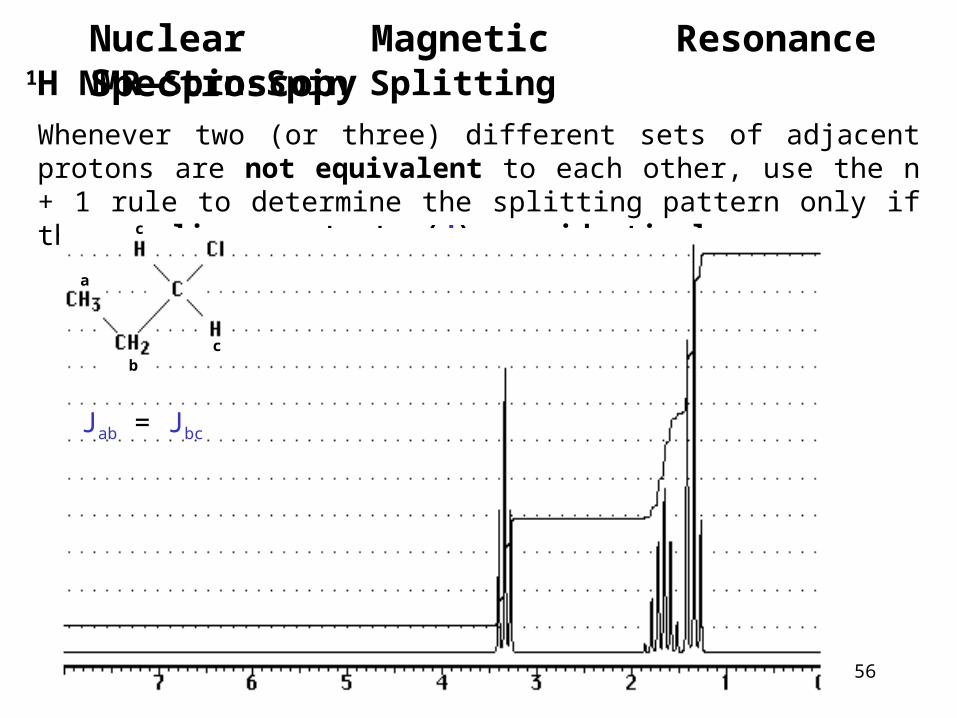
Whenever two (or three) different sets of adjacent protons are not equivalent to each other, use the n + 1 rule to determine the splitting pattern only if the coupling constants (J) are identical:
a
b
c
c
Jab = Jbc
57
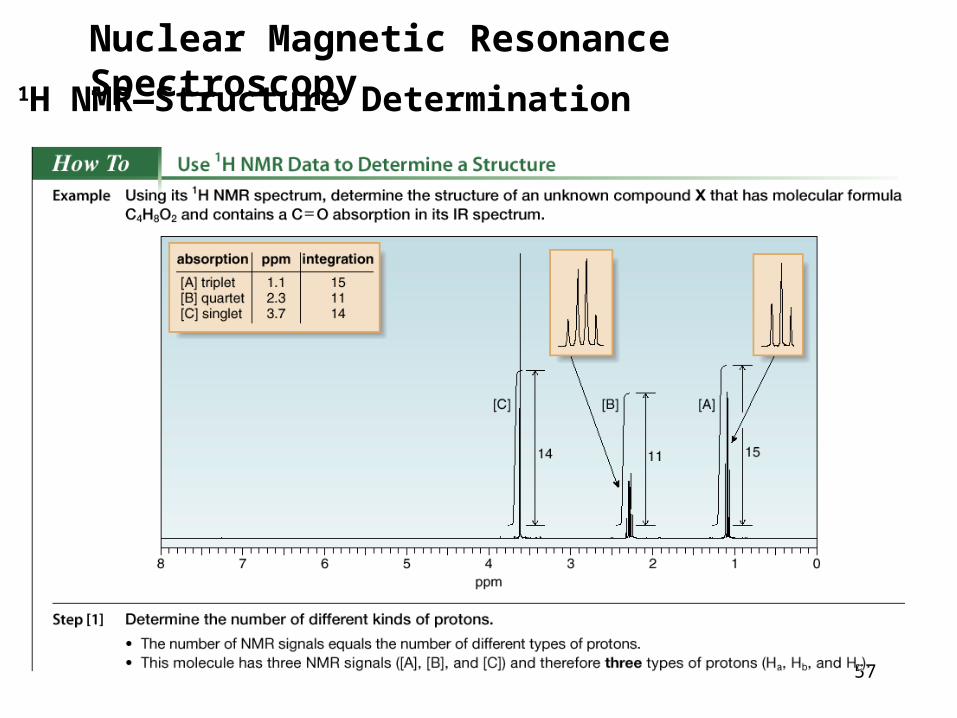
Nuclear Magnetic Resonance Spectroscopy1H NMR—Structure Determination
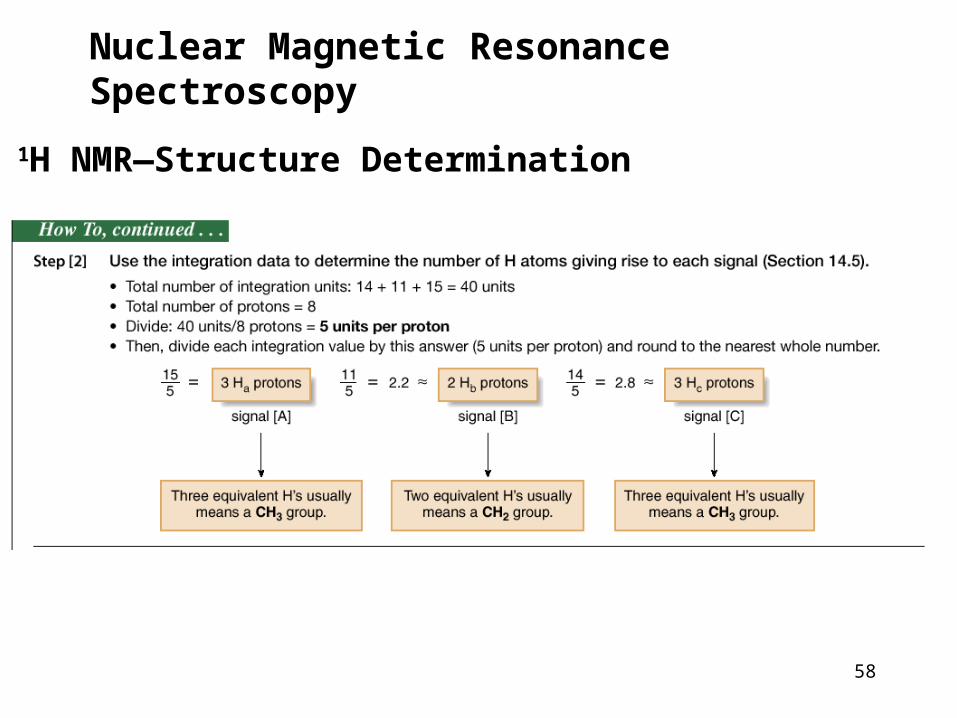
58
Nuclear Magnetic Resonance Spectroscopy
1H NMR—Structure Determination
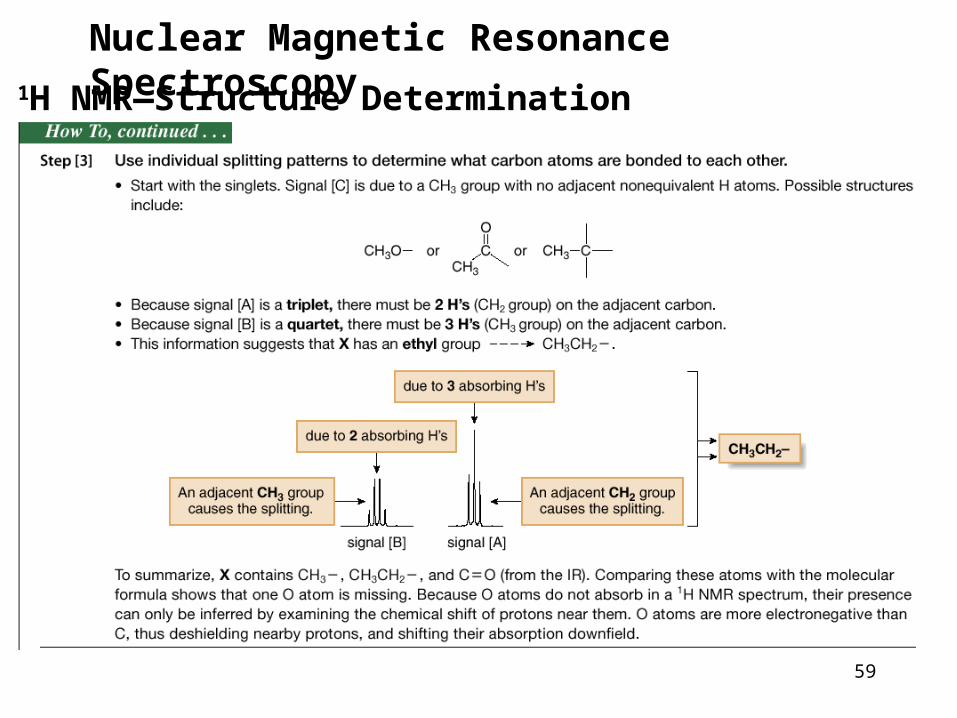
59
Nuclear Magnetic Resonance Spectroscopy1H NMR—Structure Determination
60
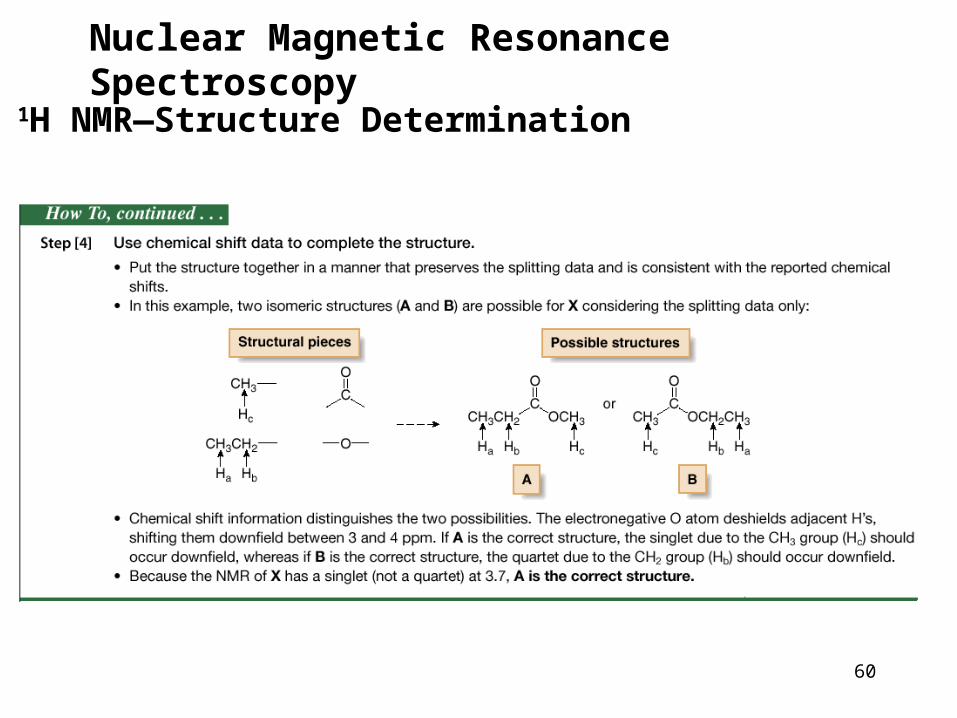
Nuclear Magnetic Resonance Spectroscopy
1H NMR—Structure Determination
61
The Nature of NMR Absorptions
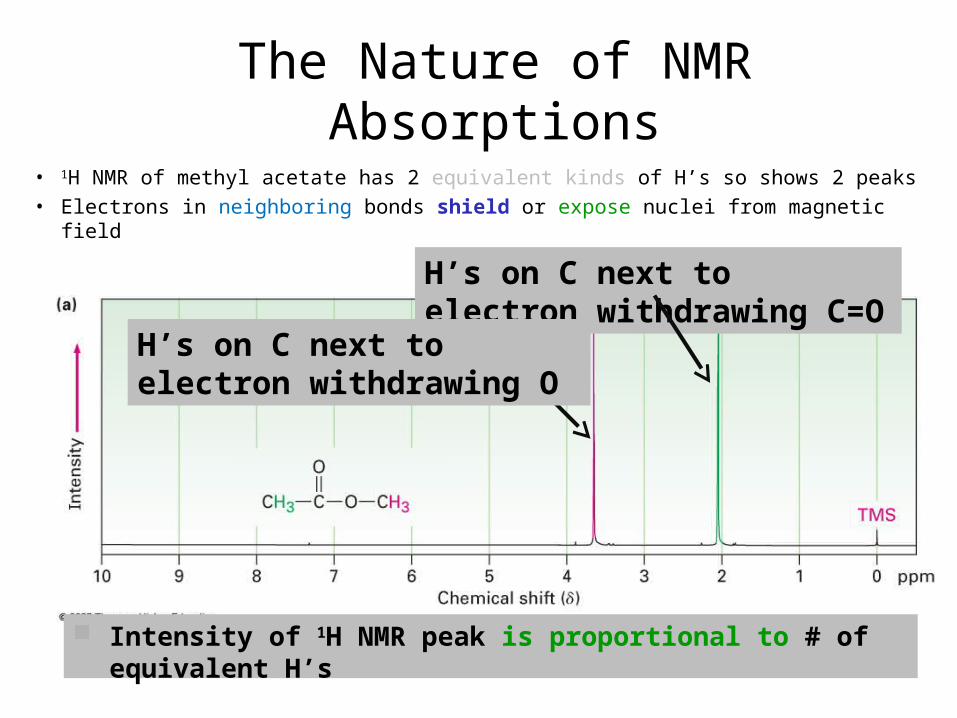
• 1H NMR of methyl acetate has 2 equivalent kinds of H’s so shows 2 peaks
• Electrons in neighboring bonds shield or expose nuclei from magnetic field
H’s on C next to electron withdrawing C=O
H’s on C next to electron withdrawing O
Intensity of 1H NMR peak is proportional to # of equivalent H’s
62
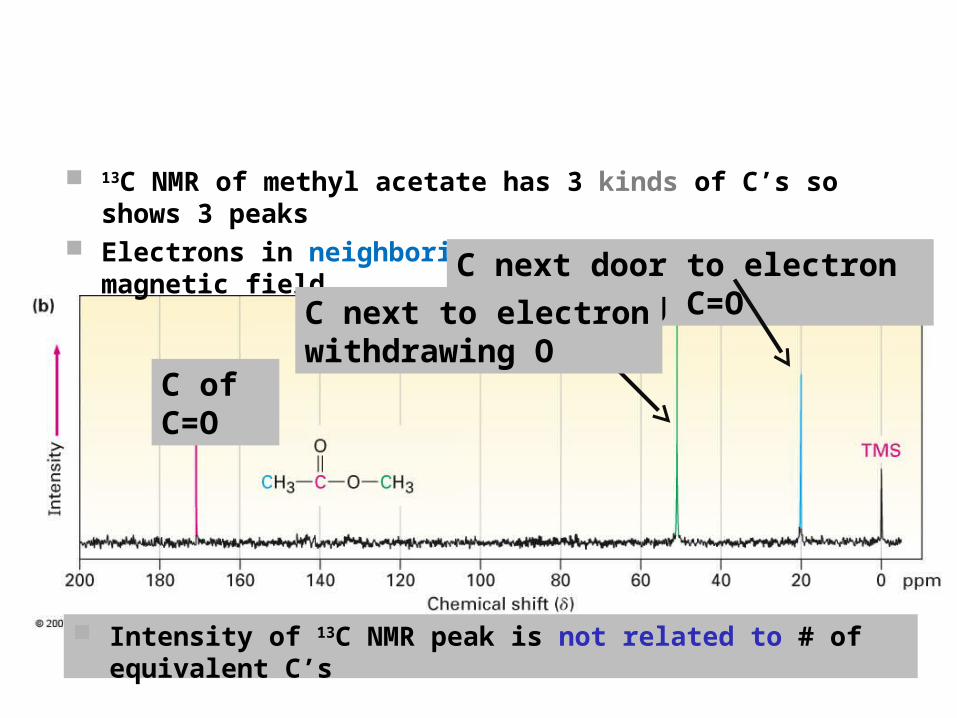
13C NMR of methyl acetate has 3 kinds of C’s so shows 3 peaks Electrons in neighboring bonds shield nuclei from magnetic field
C next door to electron withdrawing C=OC next to electron
withdrawing OC of C=O
Intensity of 13C NMR peak is not related to # of equivalent C’s
1H 13C
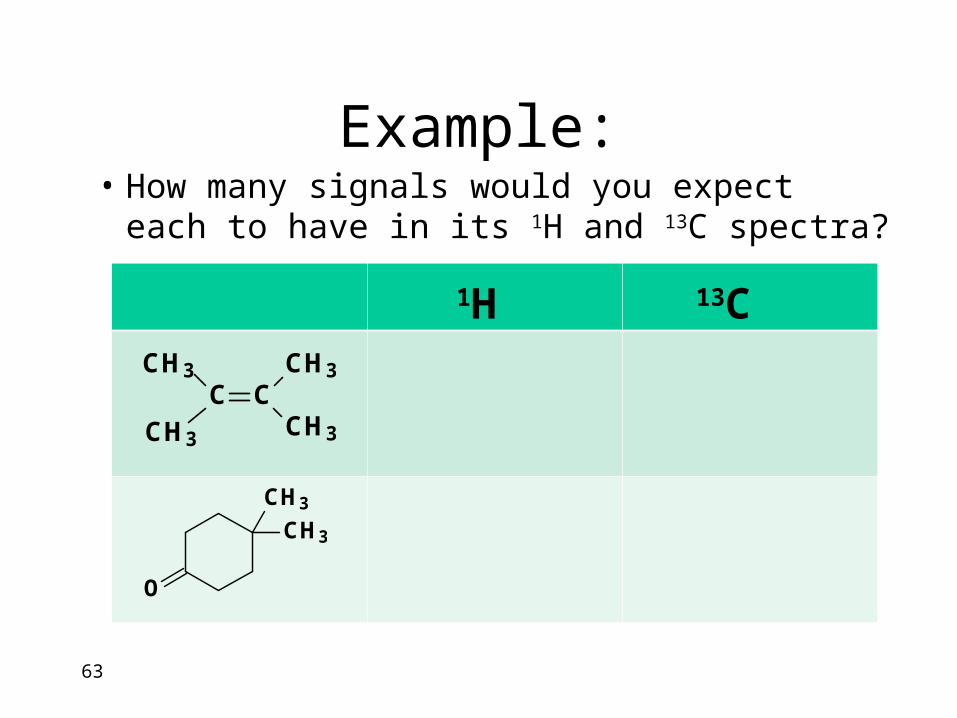
Example:• How many signals would you expect each to have
in its 1H and 13C spectra?
63
CH3
CH3C C
CH3
CH3
O
CH3
CH3
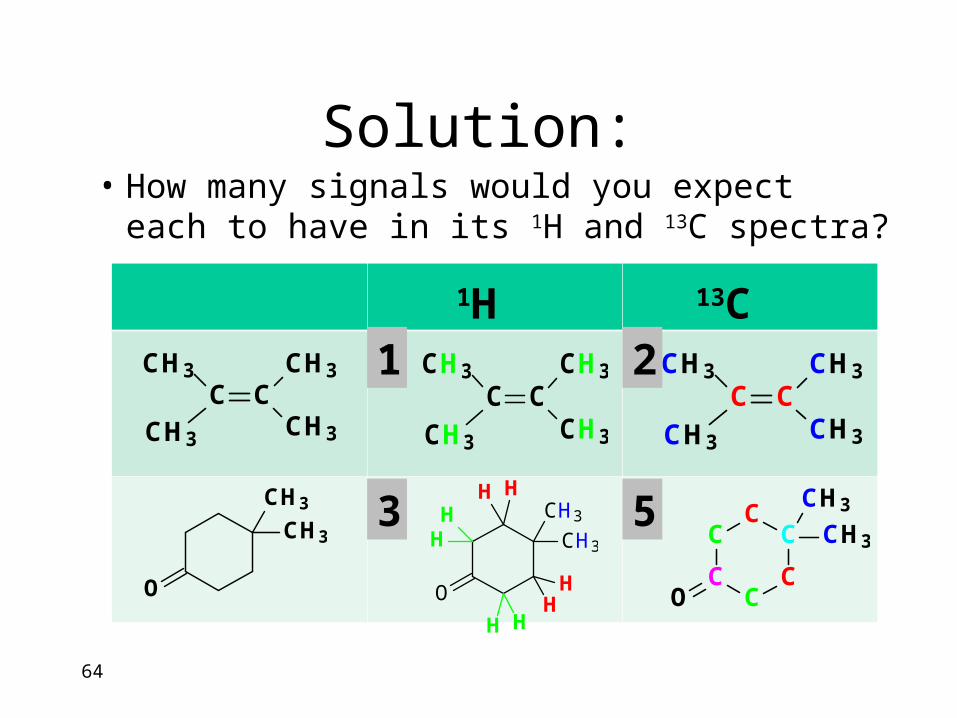
Solution:• How many signals would you expect each to have
in its 1H and 13C spectra?
64
CH3
CH3C C
CH3
CH3
O
CH3
CH3
1H 13C
CH3
CH3C C
CH3
CH3 CH3
CH3C C
CH3
CH3
1 2
3 5
O
CH3
CH3
H H
HH
HH
HH
C
CC
C
CC
O
CH3
CH3
65
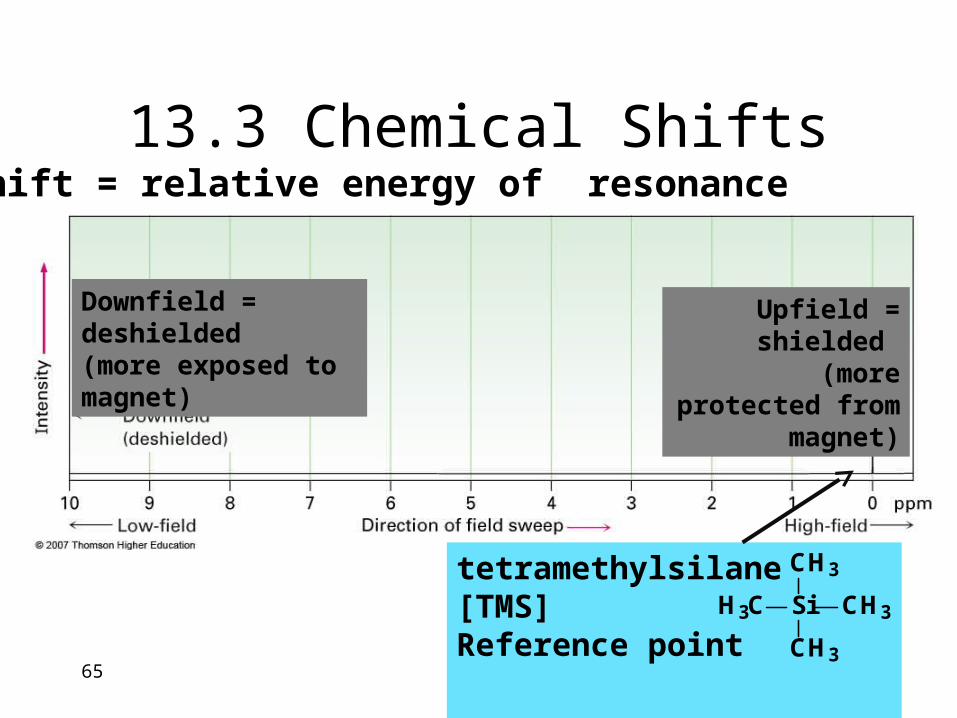
Shift = relative energy of resonance13.3 Chemical Shifts
Downfield = deshielded (more exposed to magnet)
Upfield = shielded
(more protected from magnet)
tetramethylsilane [TMS]Reference point Si
CH3
CH3H3C
CH3
66
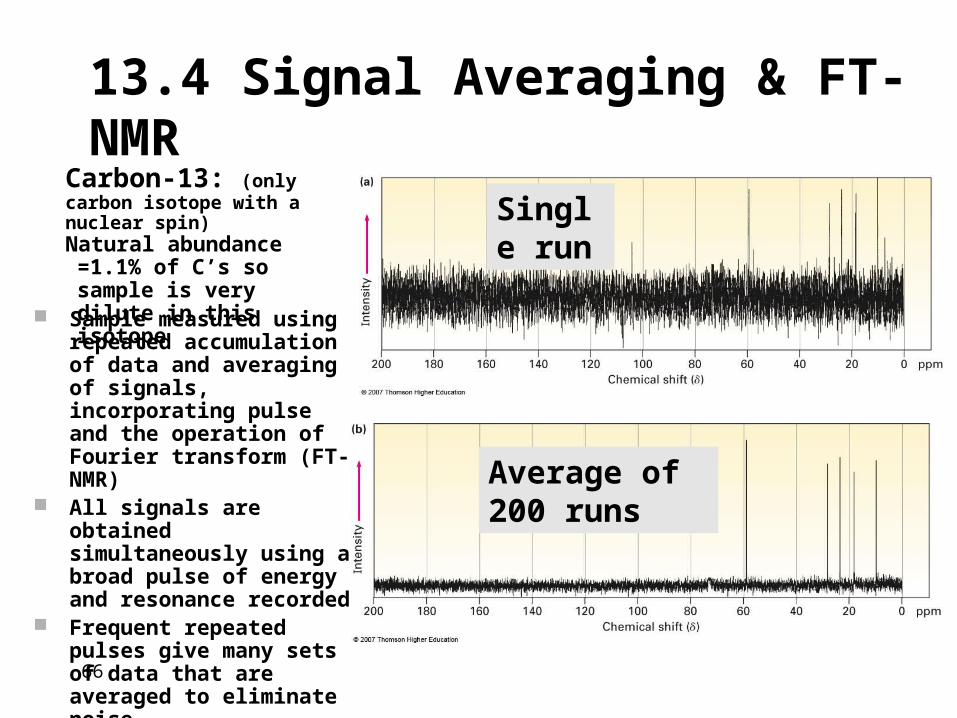
13.4 Signal Averaging & FT-NMRCarbon-13: (only carbon isotope with a nuclear spin)Natural abundance =1.1%
of C’s so sample is very dilute in this isotope
Single run
Average of 200 runs
Sample measured using repeated accumulation of data and averaging of signals, incorporating pulse and the operation of Fourier transform (FT-NMR)
All signals are obtained simultaneously using a broad pulse of energy and resonance recorded
Frequent repeated pulses give many sets of data that are averaged to eliminate noise
Fourier-transform of averaged pulsed data gives spectrum
67
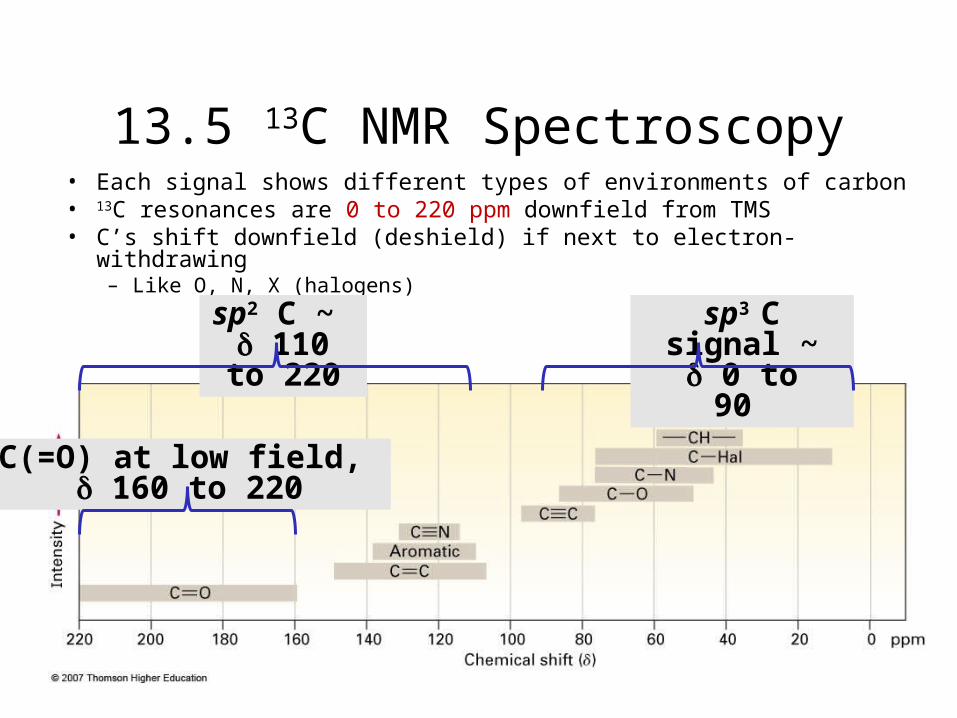
13.5 13C NMR Spectroscopy• Each signal shows different types of environments of carbon• 13C resonances are 0 to 220 ppm downfield from TMS • C’s shift downfield (deshield) if next to electron-withdrawing
– Like O, N, X (halogens)
sp3 C signal ~ 0 to 90
sp2 C ~ 110 to
220
C(=O) at low field, 160 to 220
68
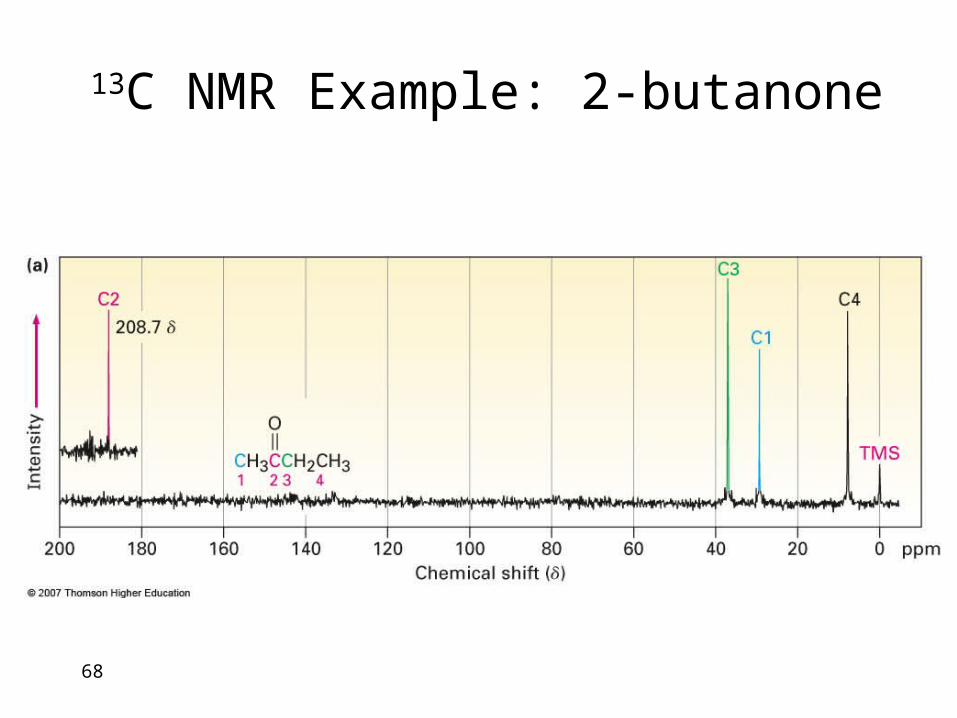
13C NMR Example: 2-butanone
69
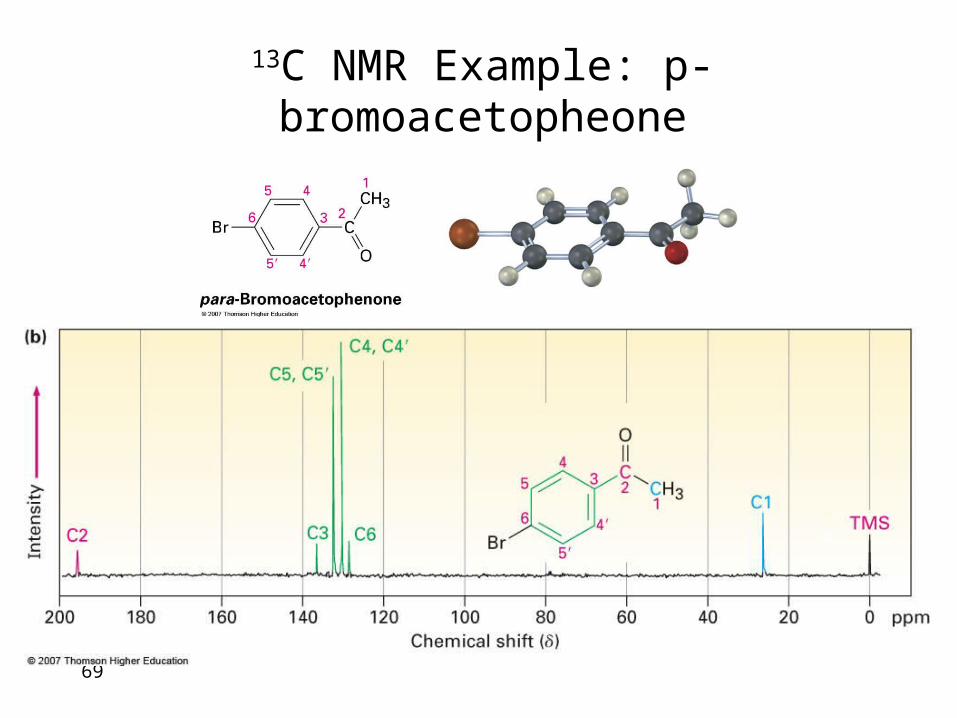
13C NMR Example: p-bromoacetopheone
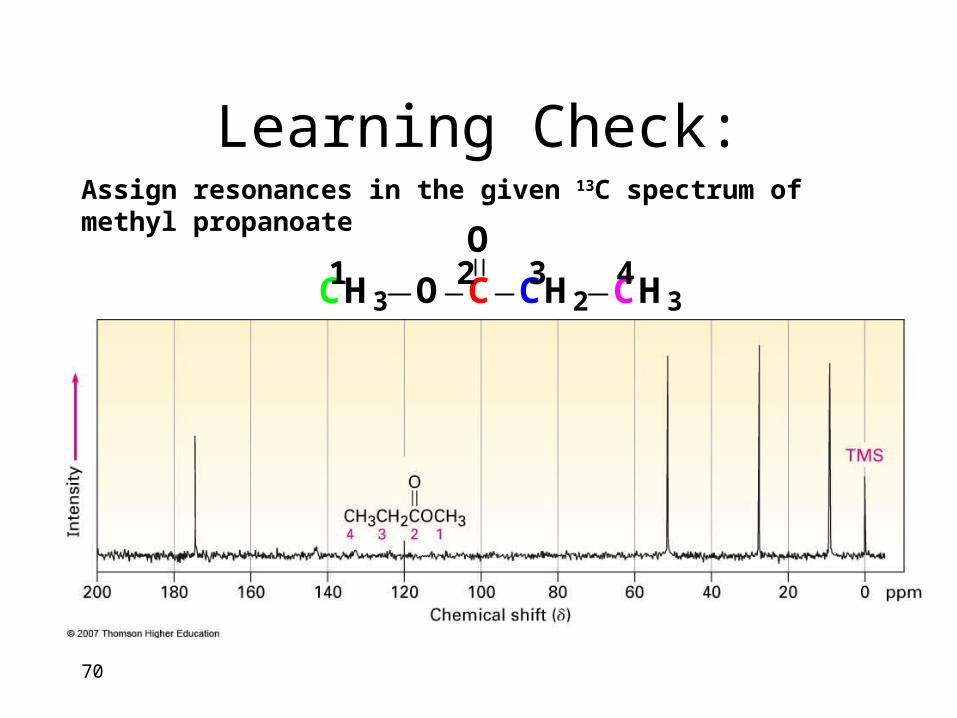
Learning Check:
70
Assign resonances in the given 13C spectrum of methyl propanoate
CH3 O C CH2 CH3
O1 2 3 4
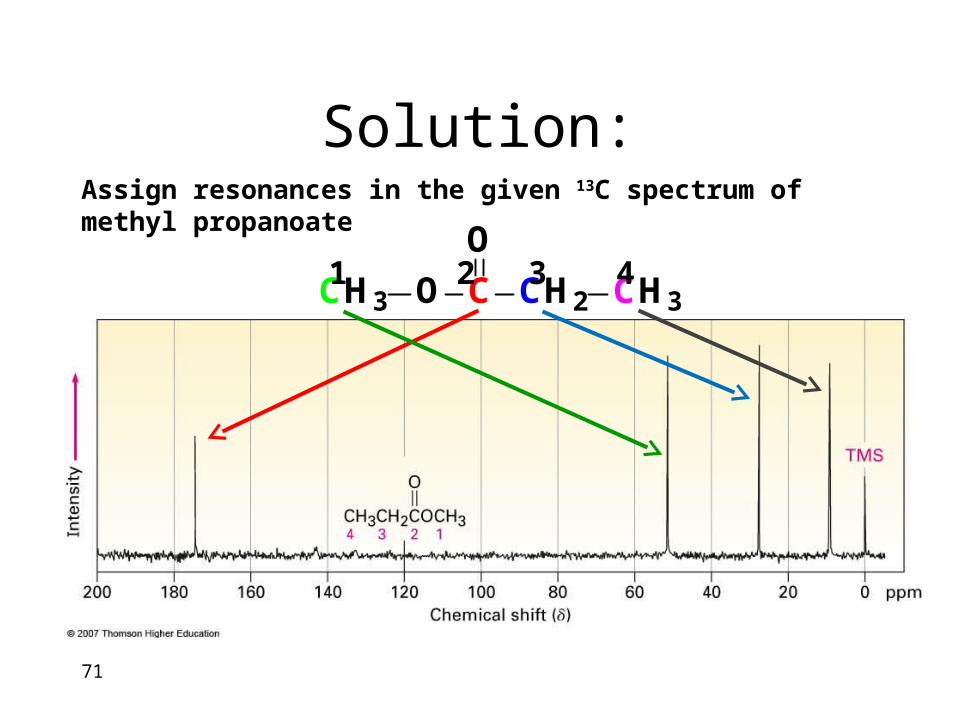
Solution:
71
Assign resonances in the given 13C spectrum of methyl propanoate
CH3 O C CH2 CH3
O1 2 3 4
13.14
13C NMR Spectroscopy
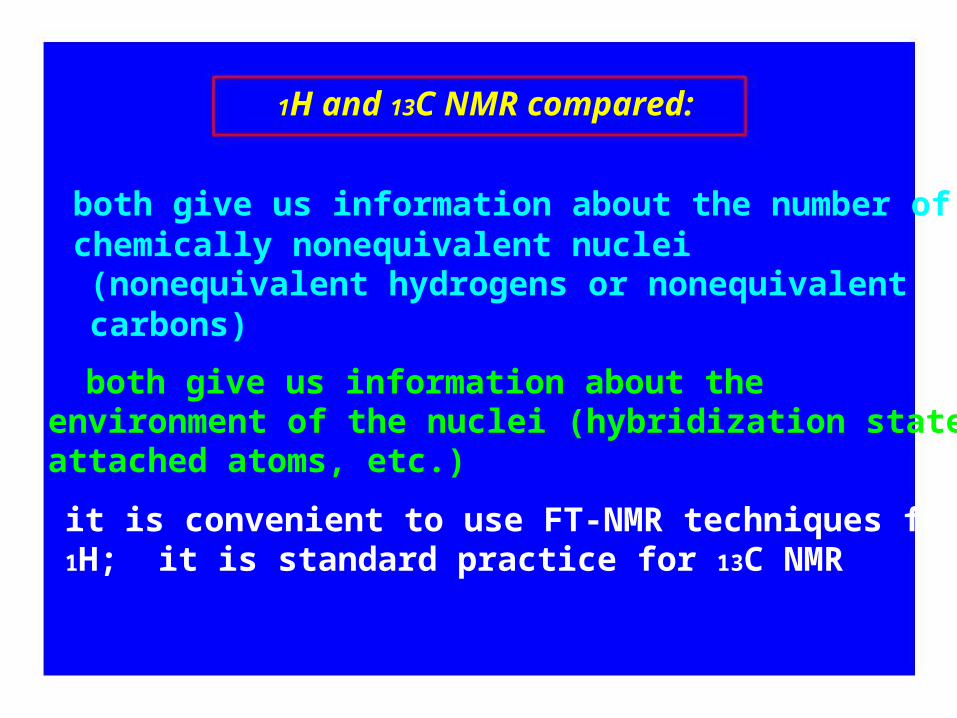
1H and 13C NMR compared:
both give us information about the number ofchemically nonequivalent nuclei(nonequivalent hydrogens or nonequivalentcarbons)
both give us information about theenvironment of the nuclei (hybridization state,attached atoms, etc.)
it is convenient to use FT-NMR techniques for1H; it is standard practice for 13C NMR
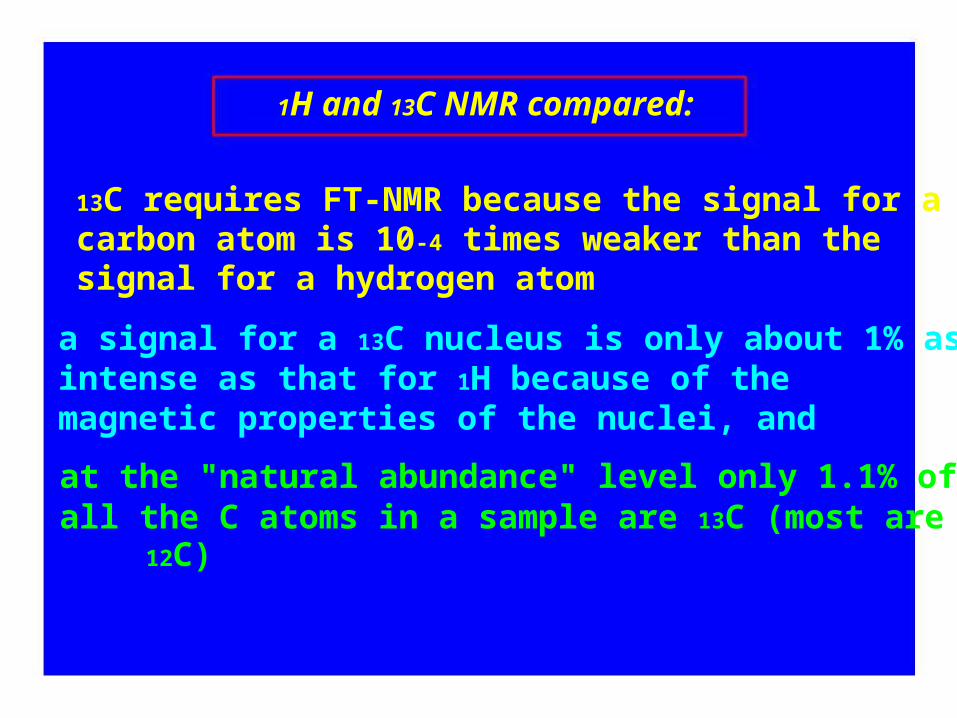
1H and 13C NMR compared:
13C requires FT-NMR because the signal for acarbon atom is 10-4 times weaker than thesignal for a hydrogen atom
a signal for a 13C nucleus is only about 1% asintense as that for 1H because of themagnetic properties of the nuclei, and
at the "natural abundance" level only 1.1% ofall the C atoms in a sample are 13C (most are12C)
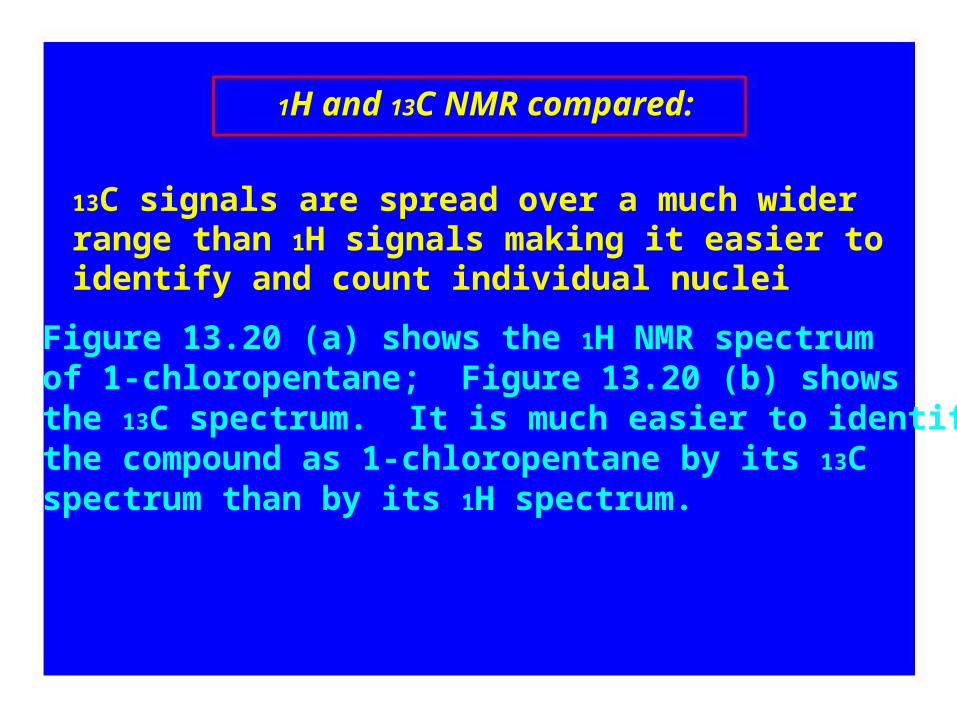
1H and 13C NMR compared:
13C signals are spread over a much widerrange than 1H signals making it easier toidentify and count individual nuclei
Figure 13.20 (a) shows the 1H NMR spectrumof 1-chloropentane; Figure 13.20 (b) showsthe 13C spectrum. It is much easier to identifythe compound as 1-chloropentane by its 13Cspectrum than by its 1H spectrum.
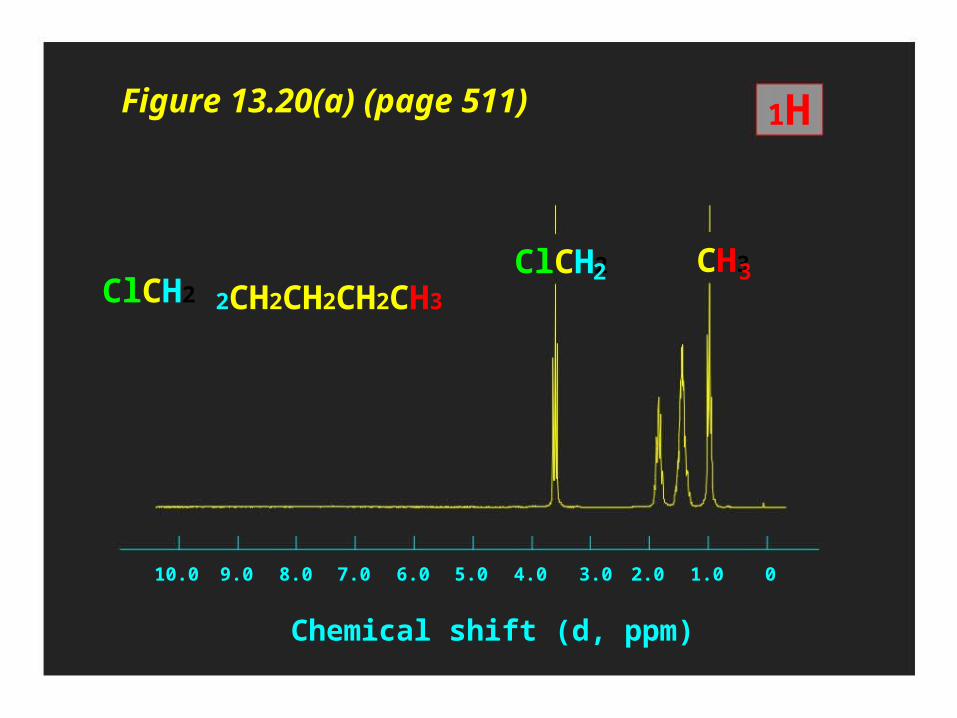
Figure 13.20(a) (page 511)
ClCH2
1H
CH3ClCH2 2CH2CH2CH2CH3
2 3
10.0 9.0 8.0 7.0 6.0 5.0 4.0 3.0 2.0 1.0 0
Chemical shift (d, ppm)
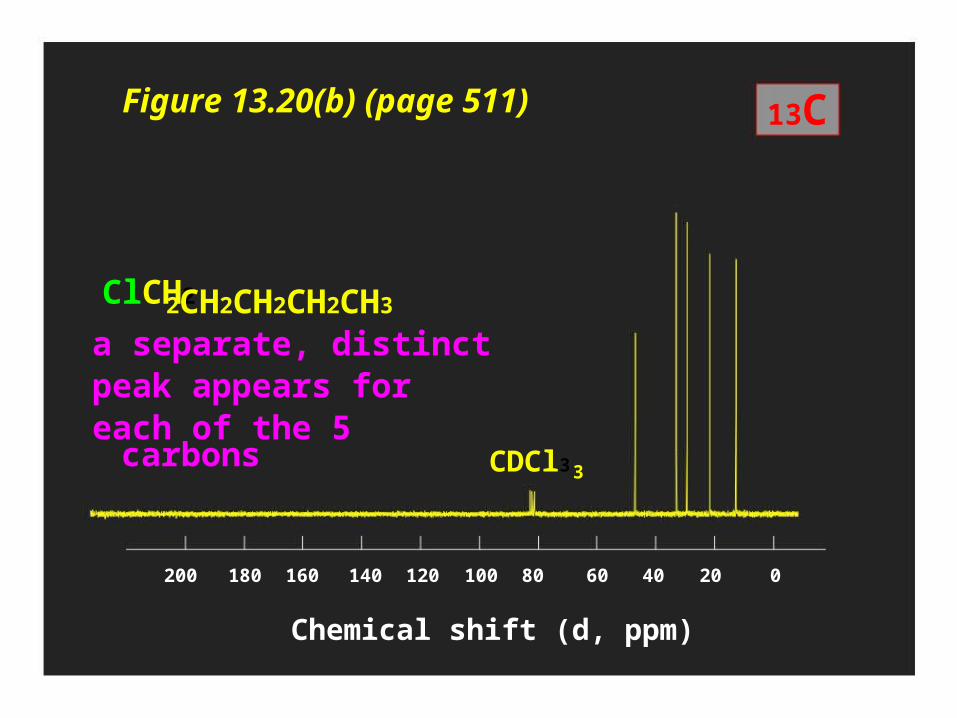
Figure 13.20(b) (page 511)
ClCH2
13C
2CH2CH2CH2CH3
a separate, distinctpeak appears foreach of the 5carbons CDCl33
200 180 160 140 120 100 80 60
Chemical shift (d, ppm)
40 20 0
13.15
13C Chemical Shifts
are measured in ppm (d)
from the carbons of TMS
13C Chemical shifts are most affected by:
• hybridization state of carbon
• electronegativity of groups attached to carbon
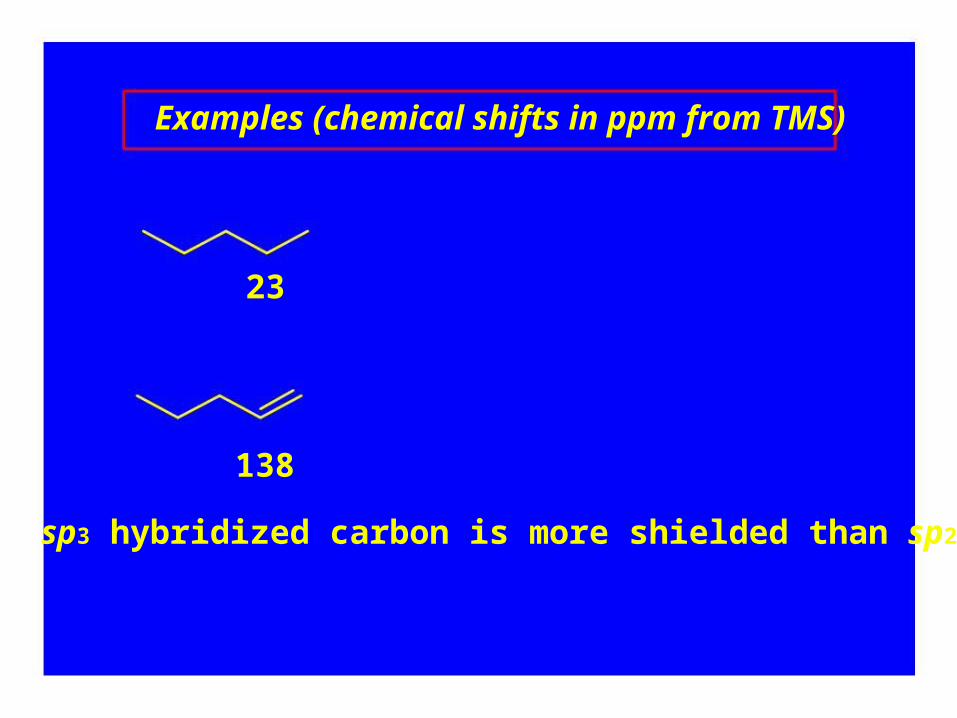
Examples (chemical shifts in ppm from TMS)
23
138
sp3 hybridized carbon is more shielded than sp2
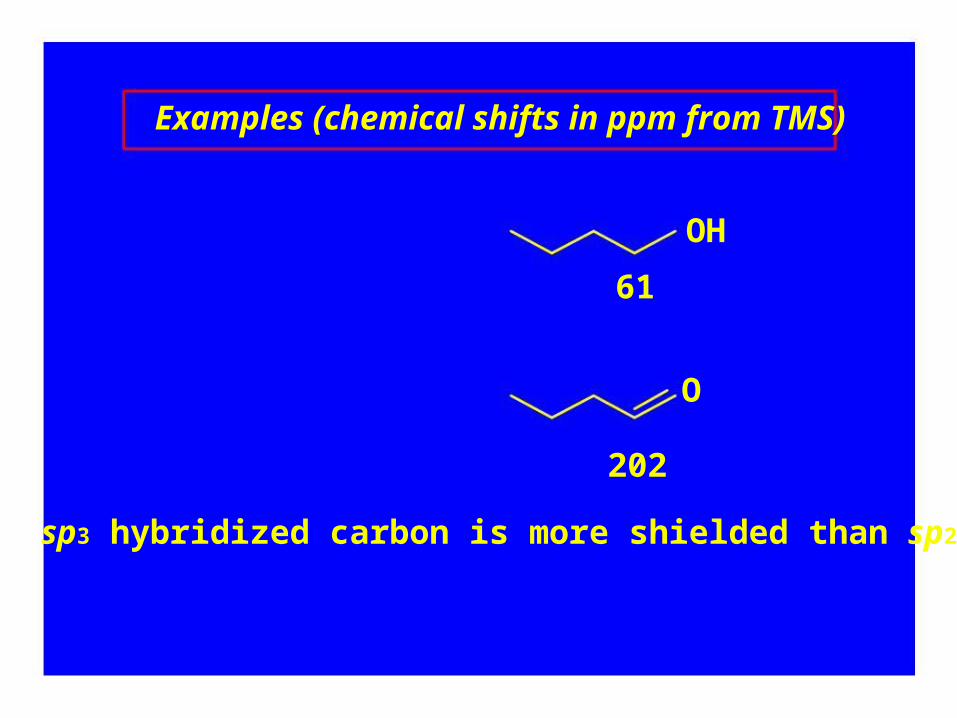
Examples (chemical shifts in ppm from TMS)
OH
61
O
202
sp3 hybridized carbon is more shielded than sp2
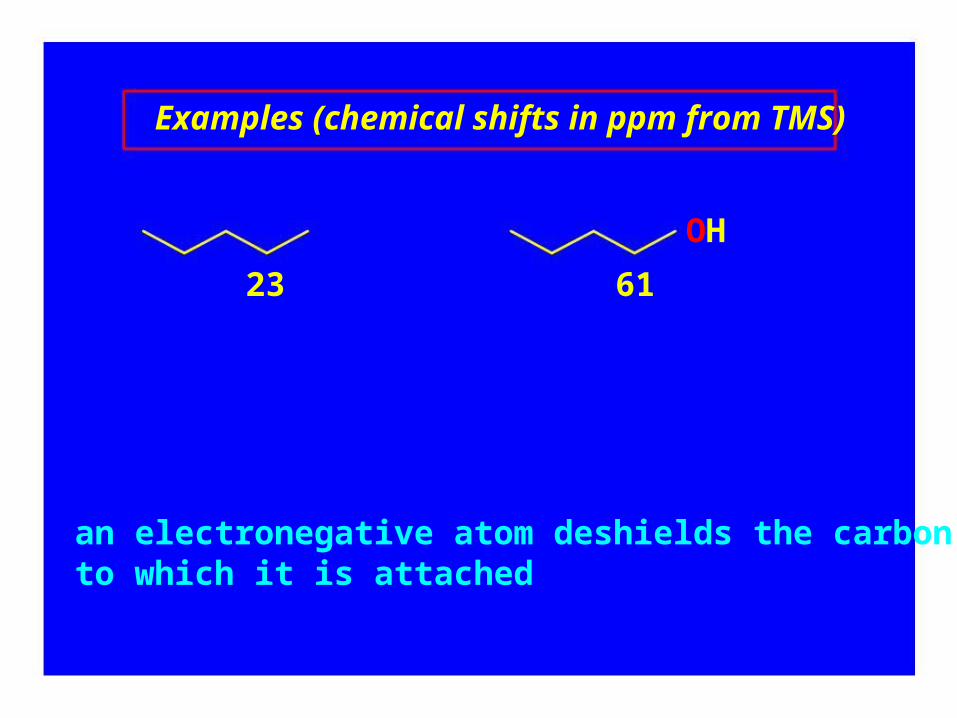
Examples (chemical shifts in ppm from TMS)
OH
23 61
an electronegative atom deshields the carbonto which it is attached
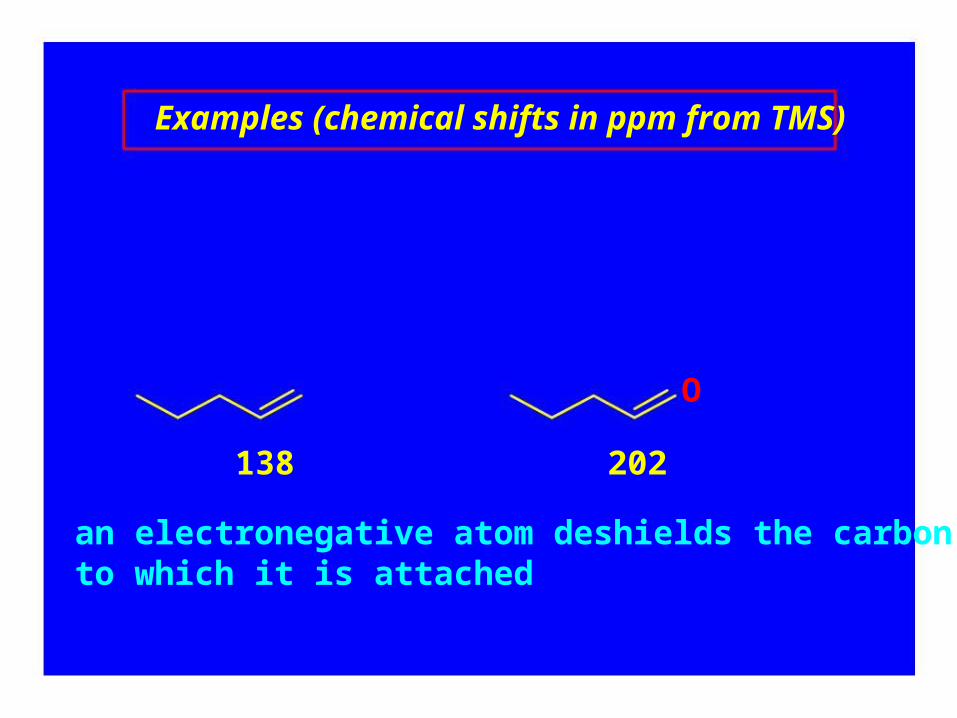
Examples (chemical shifts in ppm from TMS)
O
138 202
an electronegative atom deshields the carbonto which it is attached
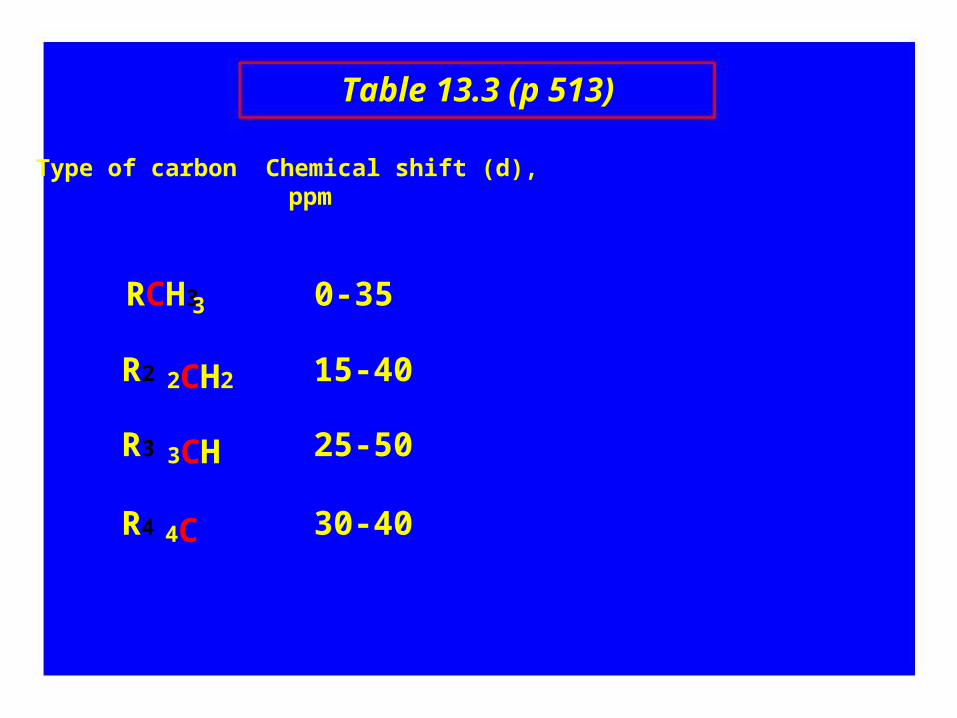
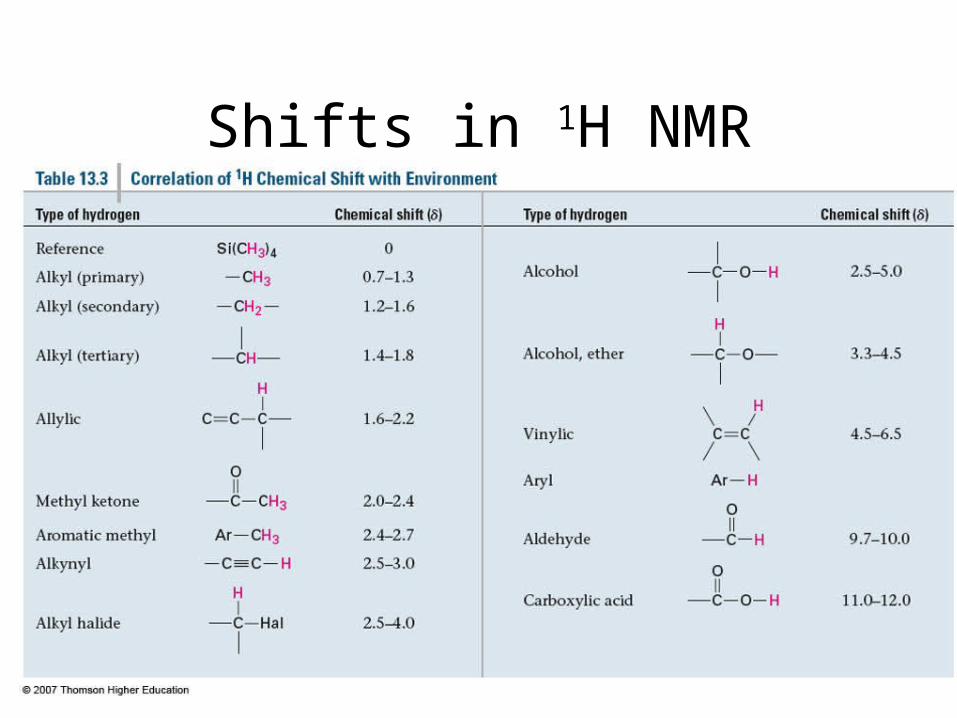
Table 13.3 (p 513)
Type of carbon Chemical shift (d),ppm
RCH3 0-353
R2
R3
R4
2CH2
3CH
4C
15-40
25-50
30-40
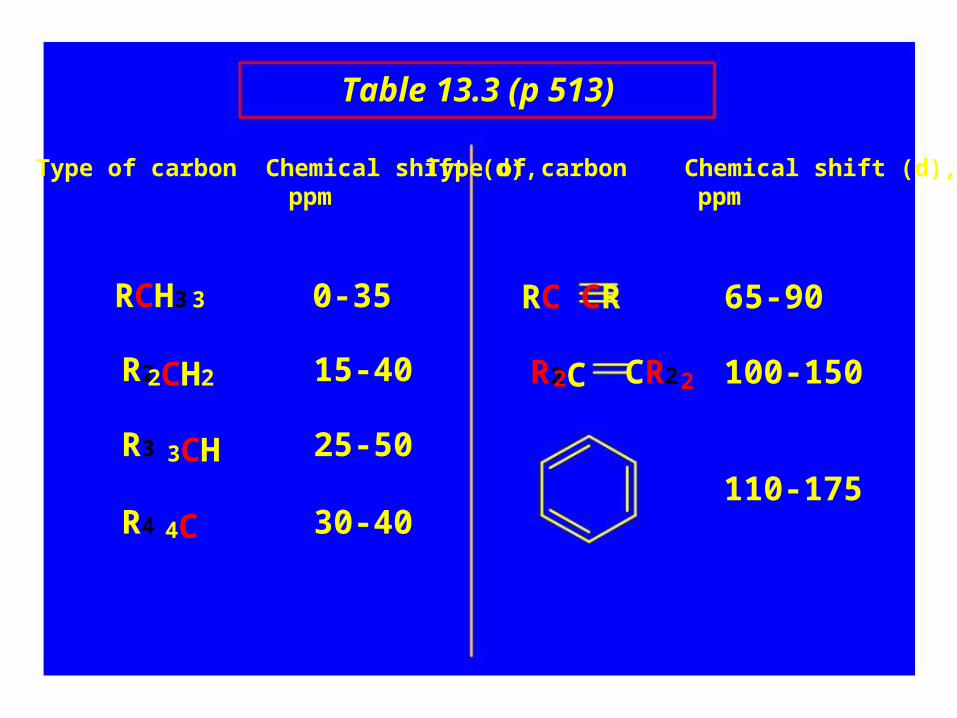
Table 13.3 (p 513)
Type of carbon Chemical shift (d),ppm
RCH3 0-35
Type of carbon Chemical shift (d),ppm
RC CR 65-903
R22CH2
R3
15-40
25-50
R22C CR2 100-1502
3CH110-175
R4 4C 30-40
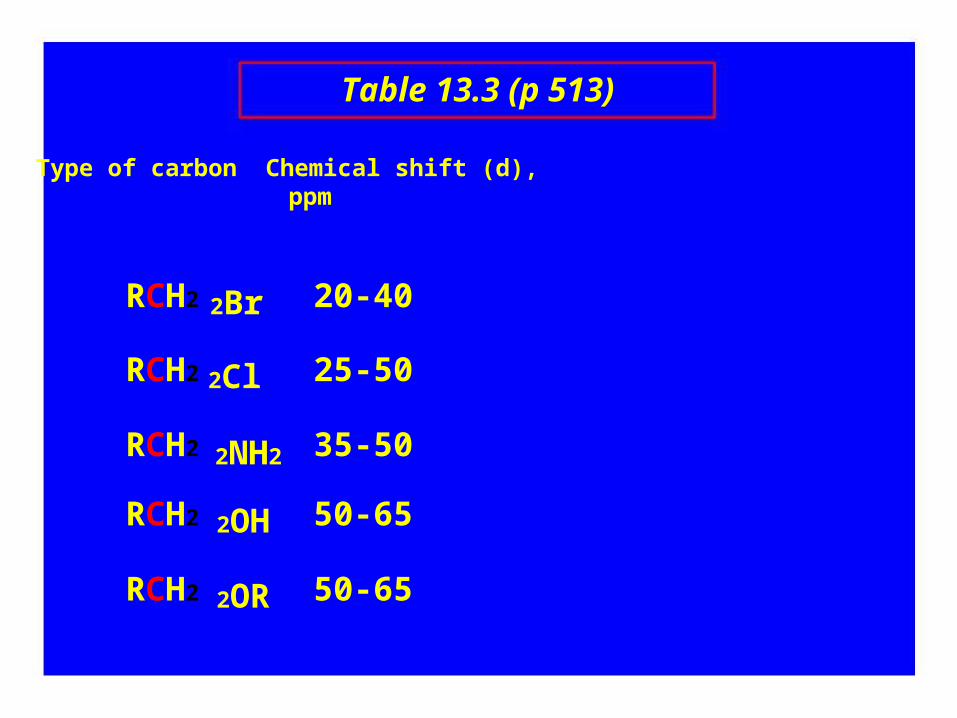
Table 13.3 (p 513)
Type of carbon Chemical shift (d),ppm
RCH2
RCH2
RCH2
RCH2
RCH2
2Br
2Cl
2NH2
2OH
2OR
20-40
25-50
35-50
50-65
50-65
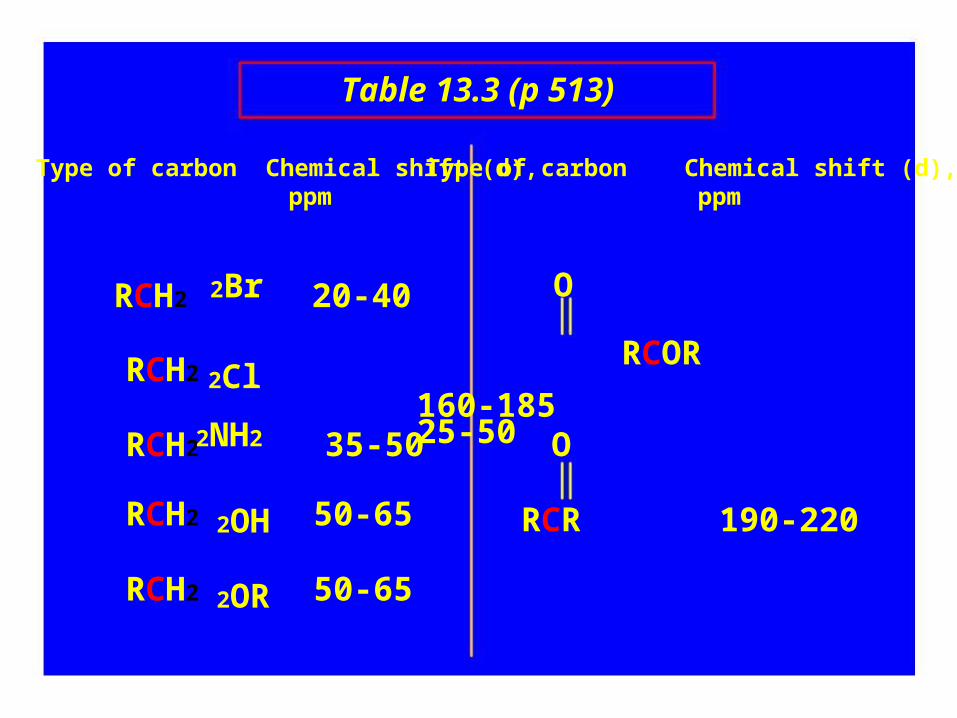
Table 13.3 (p 513)
Type of carbon Chemical shift (d),ppm
RCH2 20-40
Type of carbon Chemical shift (d),ppm
O2Br
RCH2
RCH2
2ClRCOR
160-18525-5035-50 O2NH2
RCH2
RCH2
2OH
2OR
50-65
50-65
RCR 190-220
13.16
13C NMR and Peak Intensities
Pulse-FT NMR distorts intensities of signals.Therefore, peak heights and areas can bedeceptive.
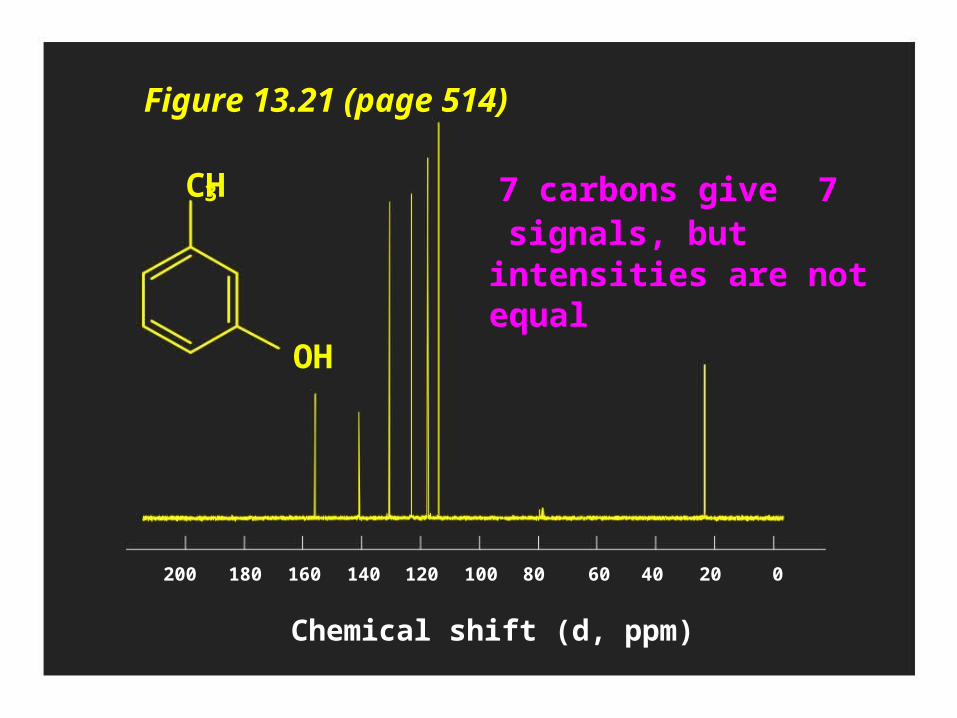
Figure 13.21 (page 514)
CH 3 7 carbons give 7signals, butintensities are notequal
OH
200 180 160 140 120 100 80 60 40 20 0
Chemical shift (d, ppm)
13.17
13C—H Coupling
Peaks in a 13C NMR spectrum are typicallysinglets
13 C—13C splitting is not seen because theprobability of two 13C nuclei being in the samemolecule is very small.
13C—1H splitting is not seen because spectrumis measured under conditions that suppressthis splitting (broadband decoupling).
13.18
Using DEPT to Count the Hydrogens
Attached to 13C
Distortionless Enhancementof Polarization Transfer
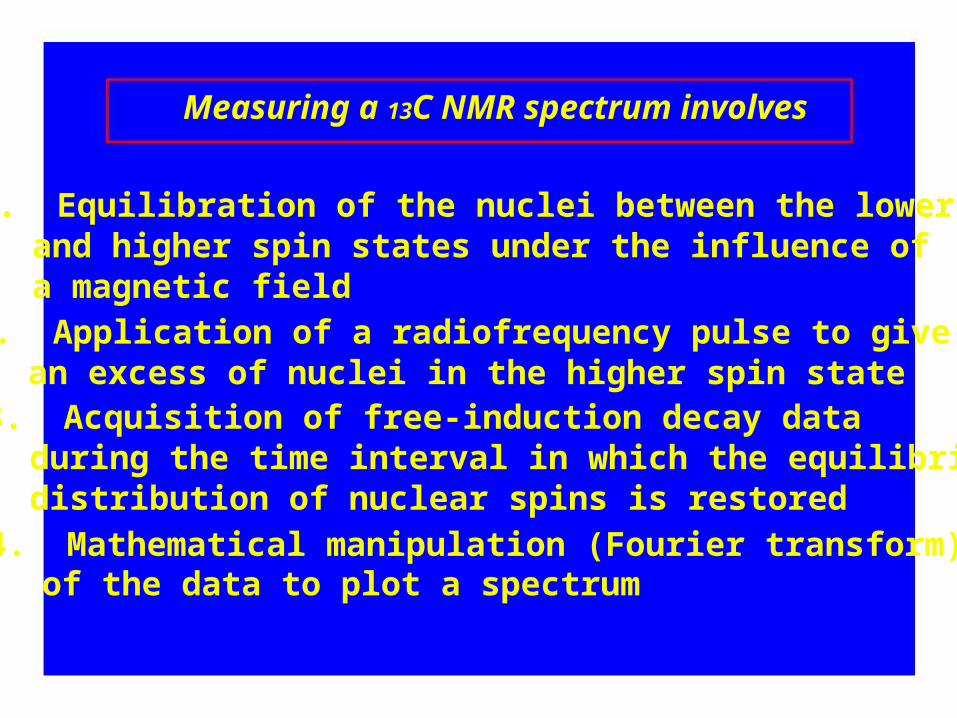
Measuring a 13C NMR spectrum involves
1. Equilibration of the nuclei between the lowerand higher spin states under the influence ofa magnetic field
2. Application of a radiofrequency pulse to givean excess of nuclei in the higher spin state
3. Acquisition of free-induction decay dataduring the time interval in which the equilibriumdistribution of nuclear spins is restored
4. Mathematical manipulation (Fourier transform)of the data to plot a spectrum
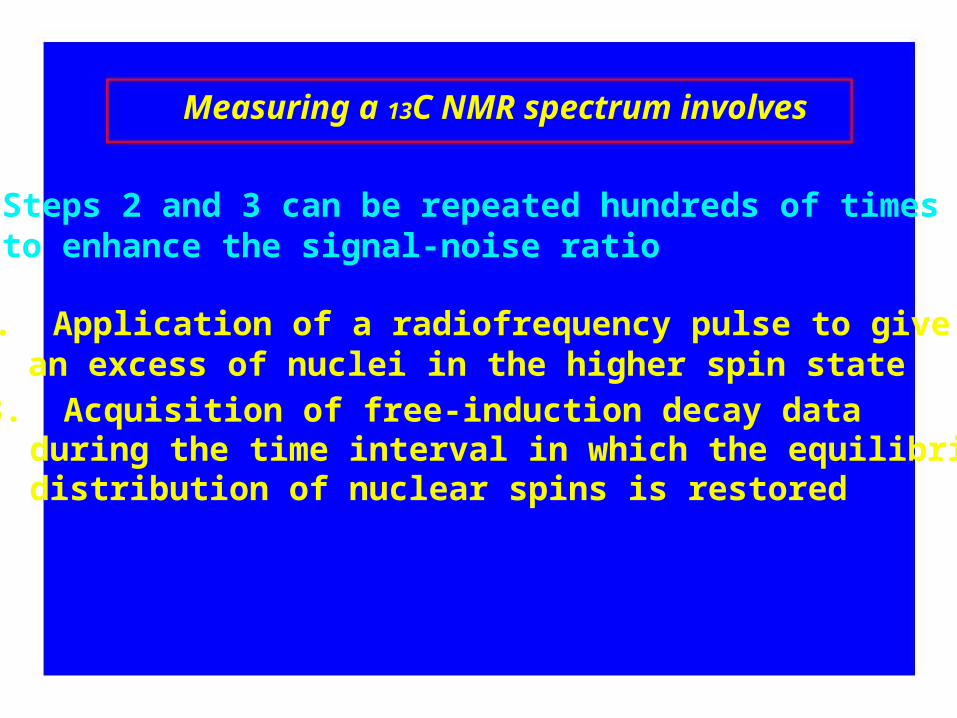
Measuring a 13C NMR spectrum involves
Steps 2 and 3 can be repeated hundreds of timesto enhance the signal-noise ratio
2. Application of a radiofrequency pulse to givean excess of nuclei in the higher spin state
3. Acquisition of free-induction decay dataduring the time interval in which the equilibriumdistribution of nuclear spins is restored
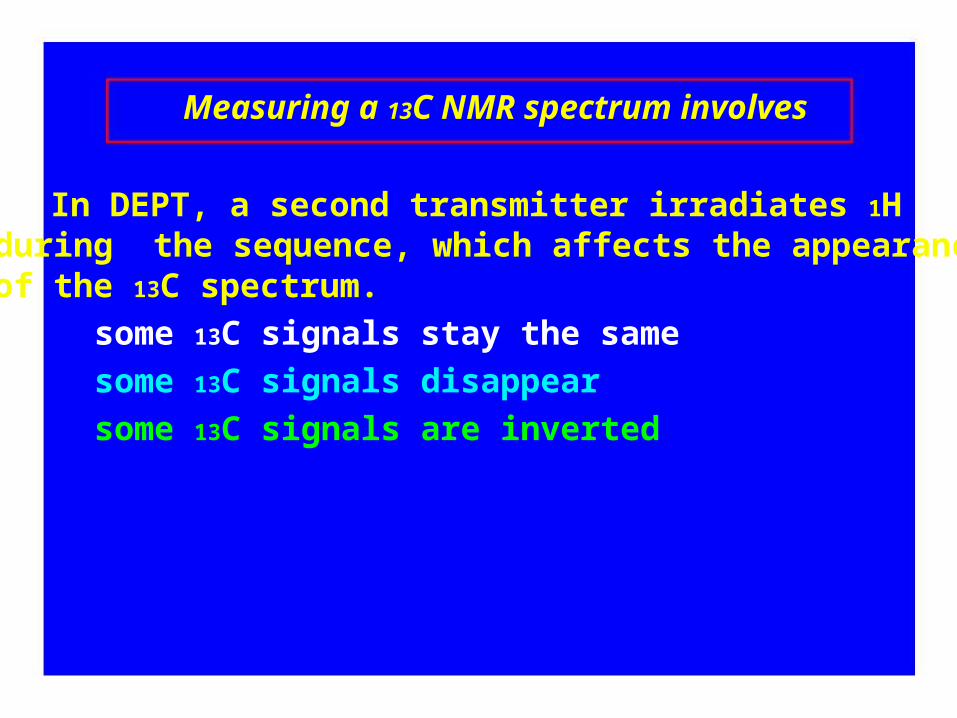
Measuring a 13C NMR spectrum involves
In DEPT, a second transmitter irradiates 1Hduring the sequence, which affects the appearanceof the 13C spectrum.
some 13C signals stay the same
some 13C signals disappear
some 13C signals are inverted
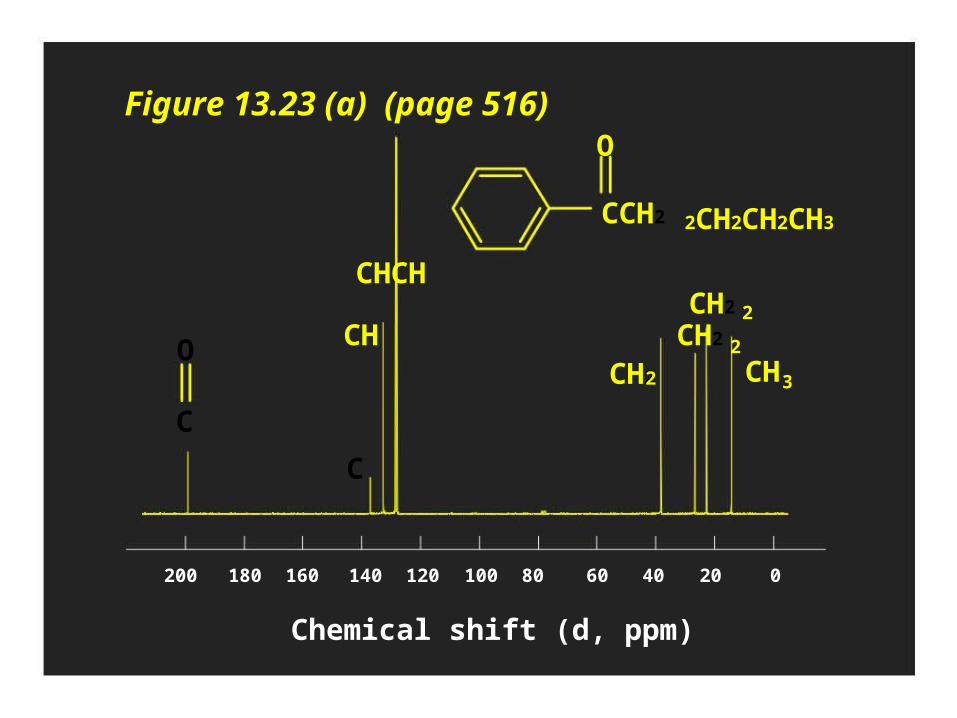
Figure 13.23 (a) (page 516)O
CCH2
CHCH
2CH2CH2CH3
CH2 2
CHO CH2
CH2
2
CH2 3
C
C
200 180 160 140 120 100 80 60
Chemical shift (d, ppm)
40 20 0
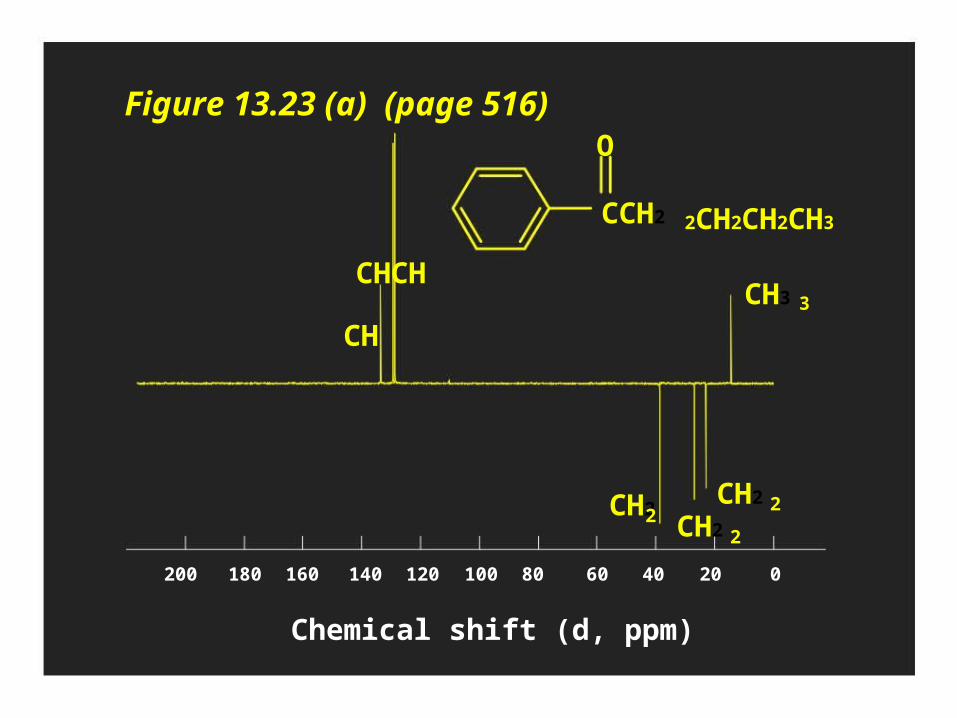
Figure 13.23 (a) (page 516)O
CCH2
CHCH
2CH2CH2CH3
CH3 3
CH
CH2CH22 CH22
2
200 180 160 140 120 100 80 60
Chemical shift (d, ppm)
40 20 0
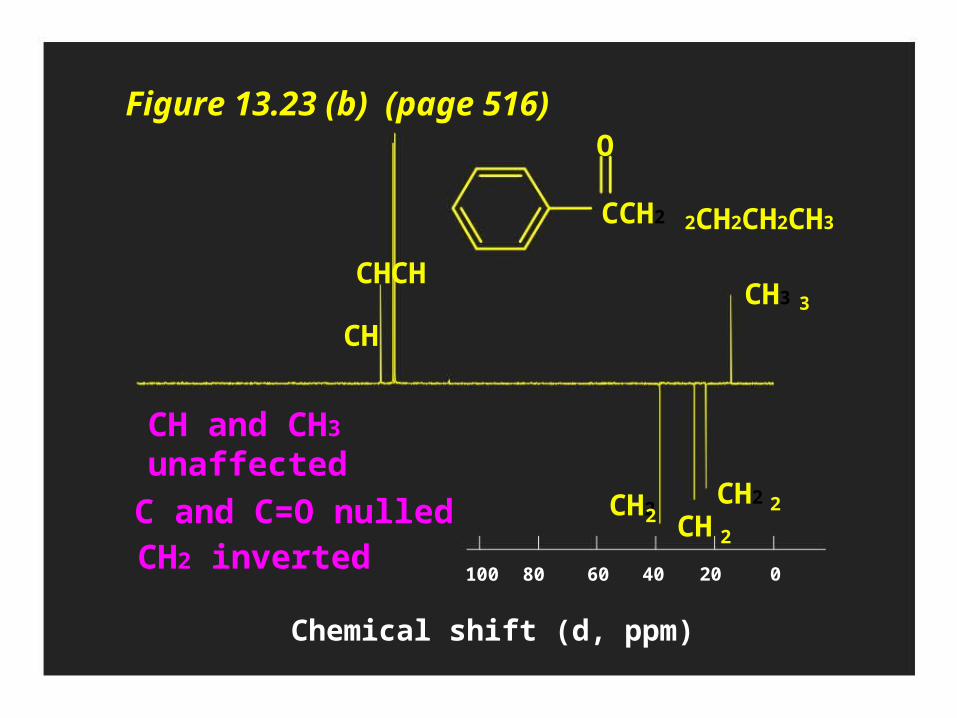
Figure 13.23 (b) (page 516)O
CCH2
CHCH
2CH2CH2CH3
CH3 3
CH
CH and CH3
unaffected
C and C=O nulledCH2CH22 CH
2
CH2 inverted100 80 60
2
40 20 0
Chemical shift (d, ppm)
99
13.6 DEPT 13C NMR• DEPT (distortionless enhancement by polarization transfer)
Normal spectrum shows all C’s then: Obtain spectrum of all C’s except quaternary
(broad band decoupled) Change pulses to obtain separate information for
CH2, CH Subtraction reveals each type
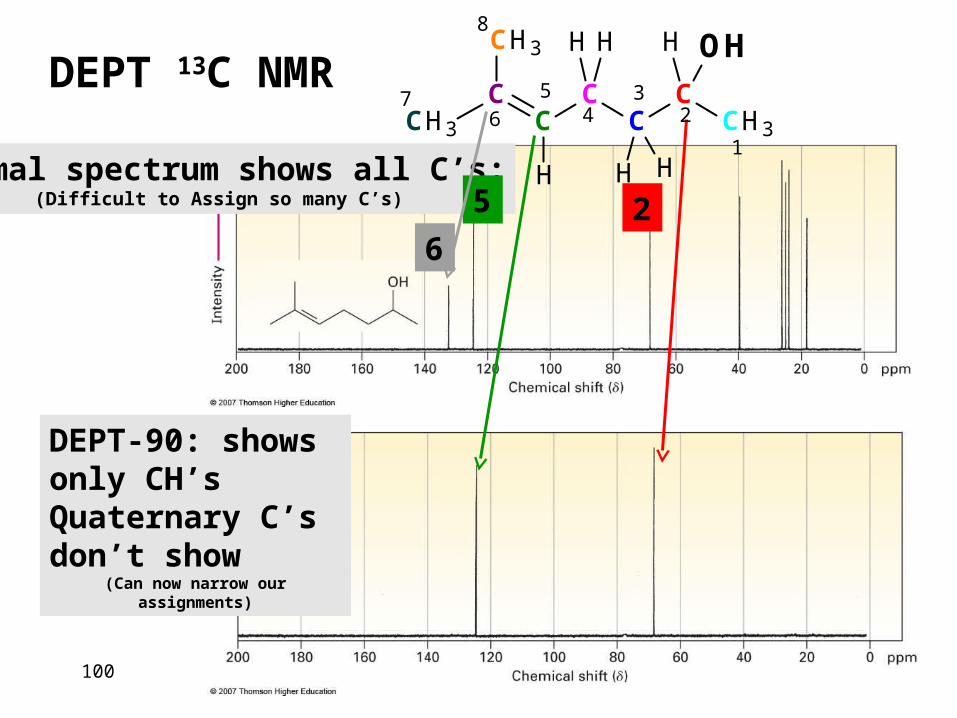
100
Normal spectrum shows all C’s:(Difficult to Assign so many C’s)
DEPT-90: shows only CH’sQuaternary C’s don’t show
(Can now narrow our assignments)
DEPT 13C NMRCH3
CC
CC
CCH3
CH3
H
H H
H H
H OH
1
23
45
67
8
5 26
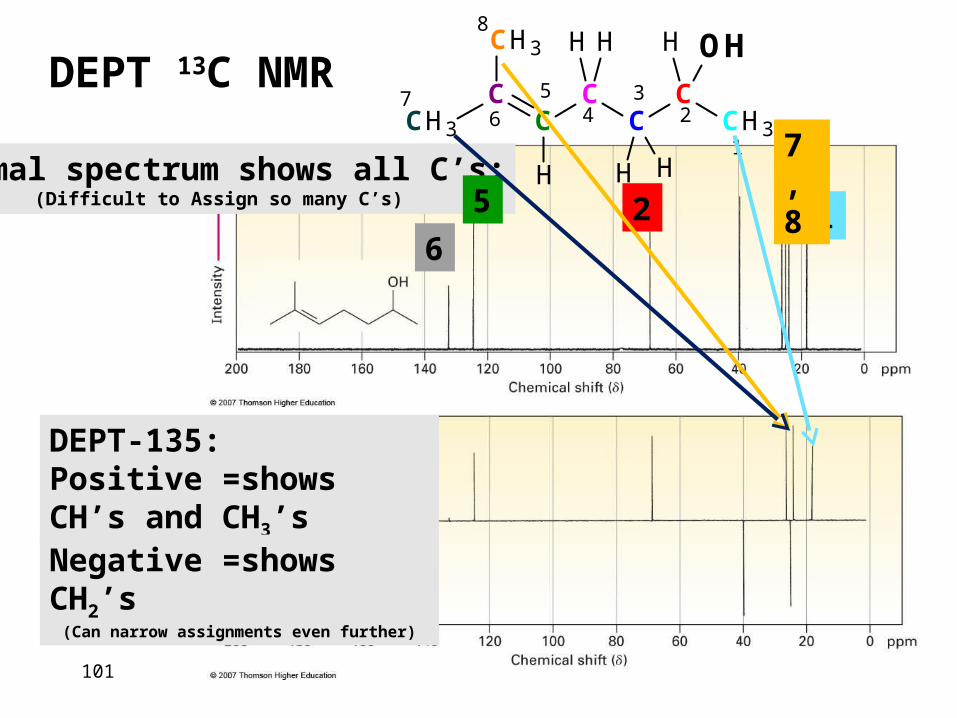
101
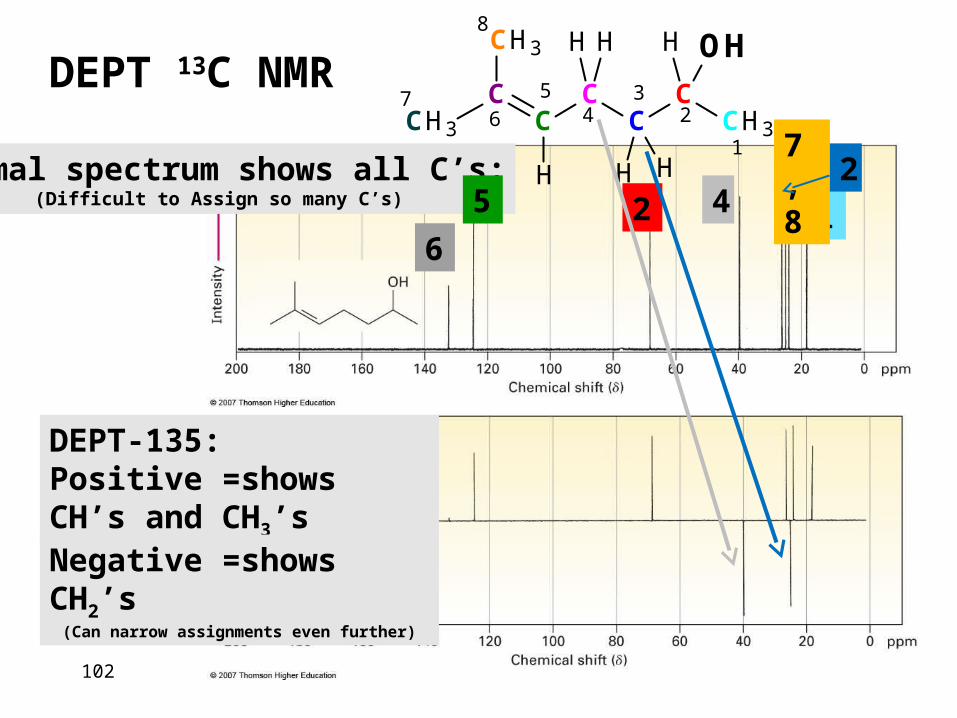
Normal spectrum shows all C’s:(Difficult to Assign so many C’s)
DEPT-135: Positive =shows CH’s and CH3’s
DEPT 13C NMR
Negative =shows CH2’s(Can narrow assignments even further)
CH3
CC
CC
CCH3
CH3
H
H H
H H
H OH
1
23
45
67
8
5 26
1
7,8
102
Normal spectrum shows all C’s:(Difficult to Assign so many C’s)
DEPT-135: Positive =shows CH’s and CH3’s
DEPT 13C NMR
Negative =shows CH2’s(Can narrow assignments even further)
CH3
CC
CC
CCH3
CH3
H
H H
H H
H OH
1
23
45
67
8
5 2 1
7,8
6
24
103
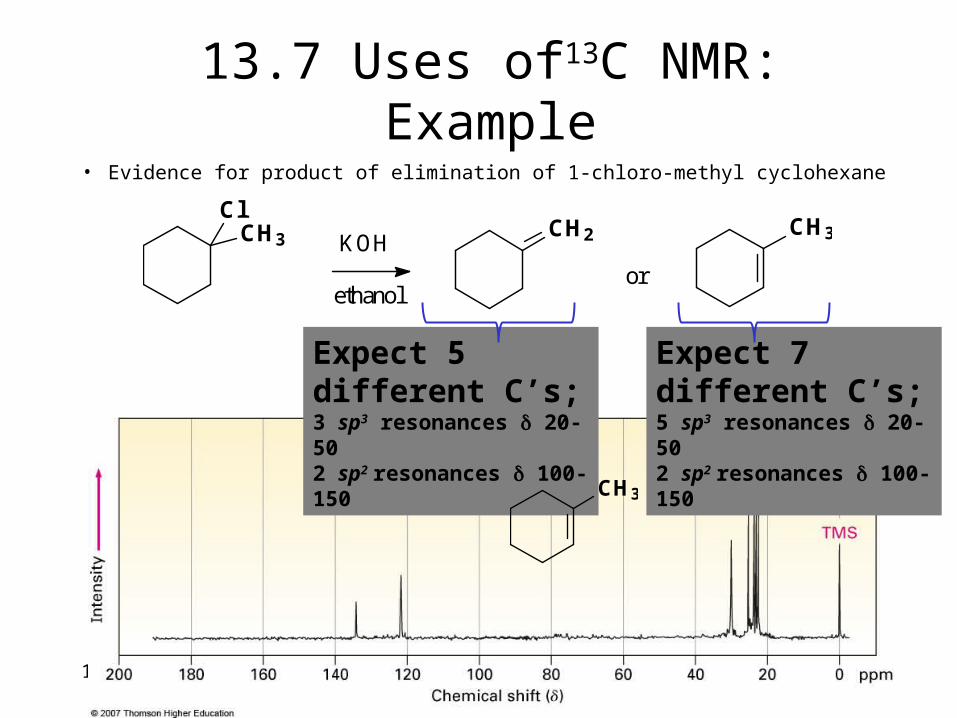
13.7 Uses of13C NMR: Example
• Evidence for product of elimination of 1-chloro-methyl cyclohexane
CH3CH3
ClCH2
or
KOH
ethanol
Expect 7 different C’s;5 sp3 resonances 20-502 sp2 resonances 100-150
Expect 5 different C’s;3 sp3 resonances 20-502 sp2 resonances 100-150
CH3
104
13.8 1H NMR & Proton Equivalence
• Proton NMR is much more sensitive than 13C and the active nucleus (1H) is nearly 100 % of the natural abundance
• Shows how many kinds of nonequivalent hydrogens are in a compound
• Theoretical equivalence can be predicted by seeing if replacing each H with “X” gives the same or different outcome
• Equivalent H’s have the same signal while nonequivalent are different– There are degrees of nonequivalence
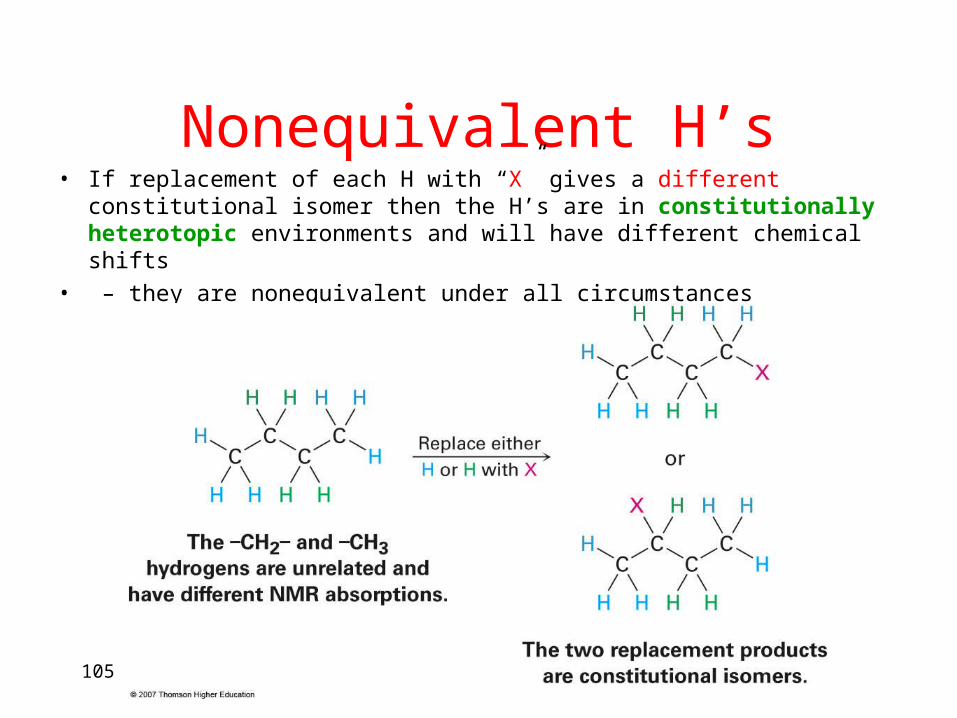
105
Nonequivalent H’s• If replacement of each H with “X” gives a different constitutional isomer
then the H’s are in constitutionally heterotopic environments and will have different chemical shifts
• – they are nonequivalent under all circumstances
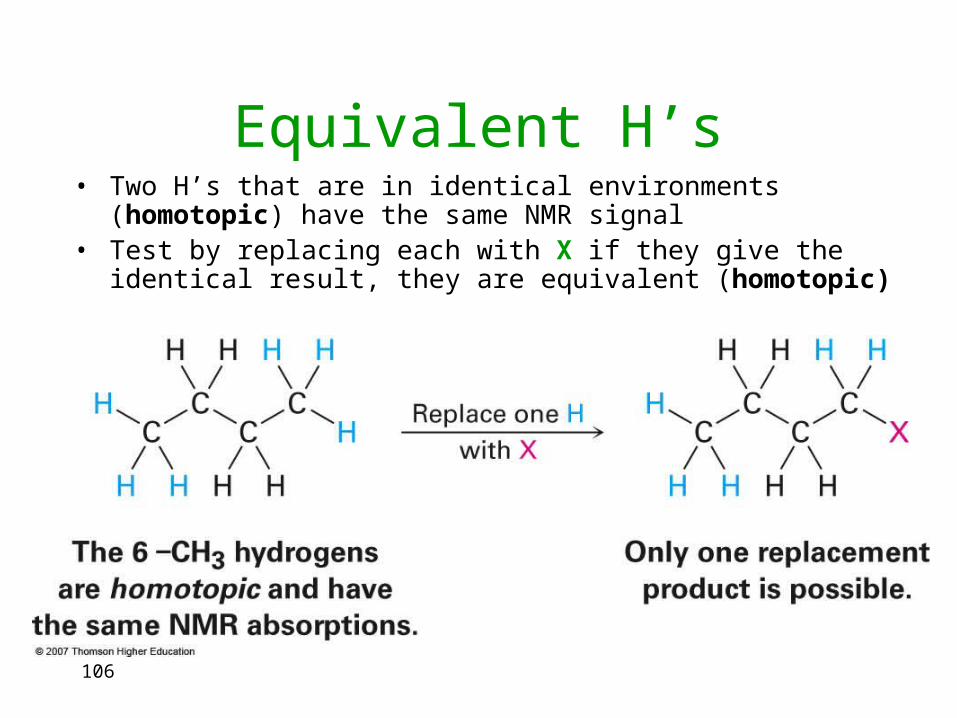
106
Equivalent H’s• Two H’s that are in identical environments (homotopic) have the same
NMR signal• Test by replacing each with X if they give the identical result, they are
equivalent (homotopic)
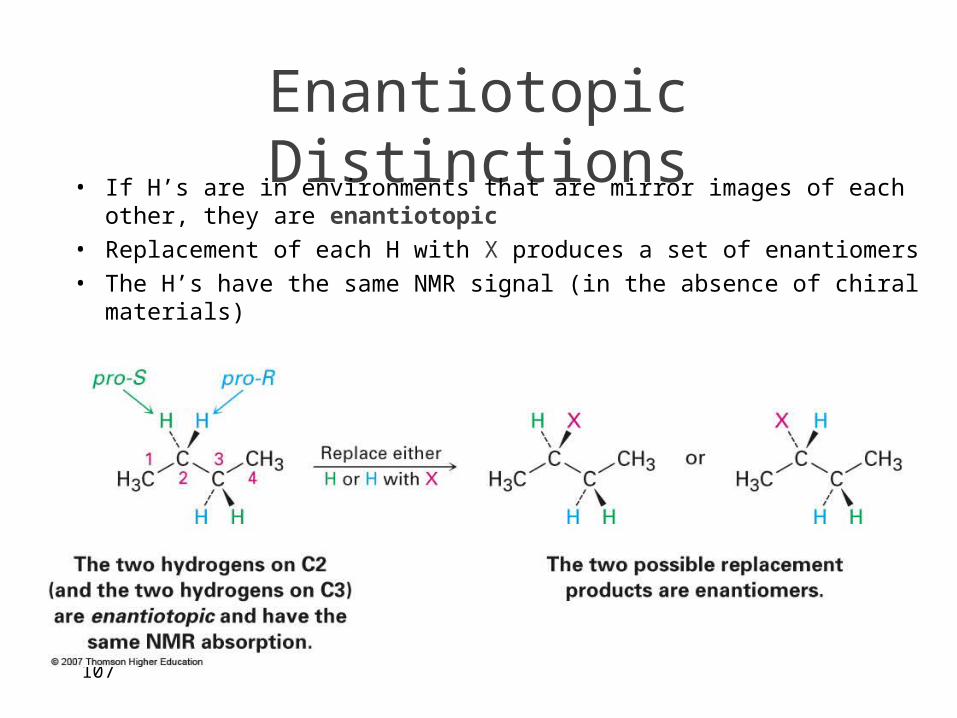
107
Enantiotopic Distinctions• If H’s are in environments that are mirror images of each other, they are
enantiotopic
• Replacement of each H with X produces a set of enantiomers
• The H’s have the same NMR signal (in the absence of chiral materials)
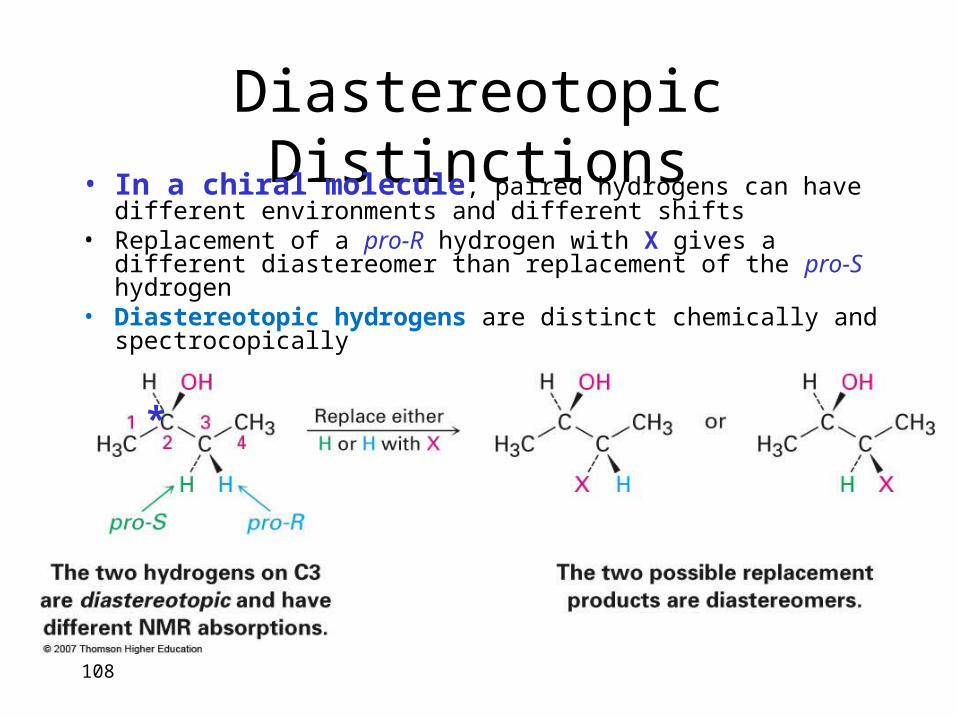
108
Diastereotopic Distinctions• In a chiral molecule, paired hydrogens can have different
environments and different shifts• Replacement of a pro-R hydrogen with X gives a different diastereomer
than replacement of the pro-S hydrogen • Diastereotopic hydrogens are distinct chemically and spectrocopically
*
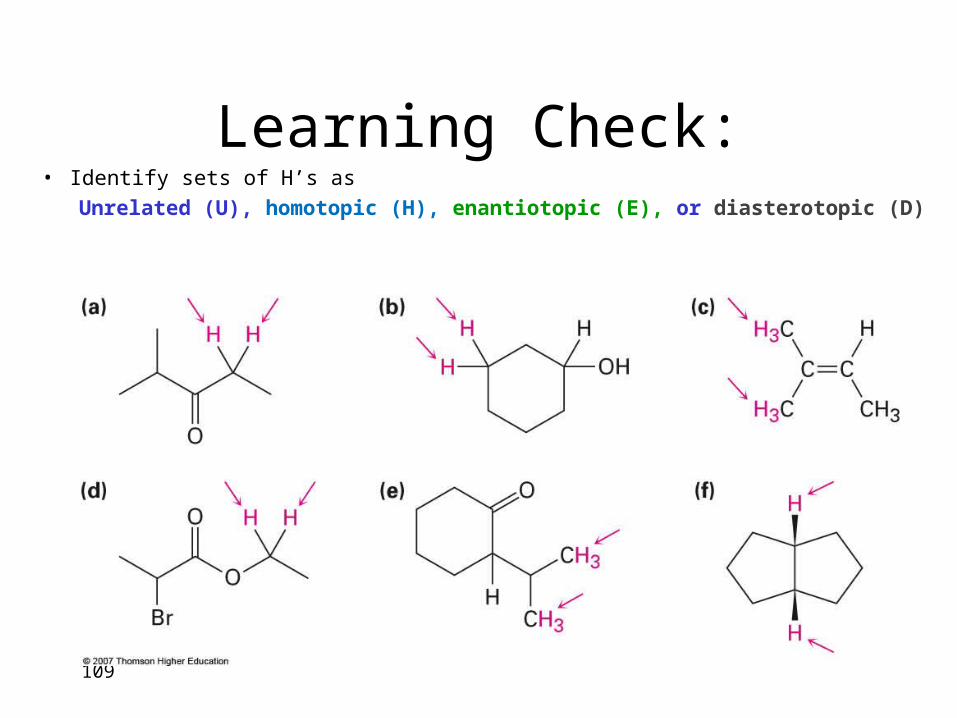
Learning Check:
109
• Identify sets of H’s as
Unrelated (U), homotopic (H), enantiotopic (E), or diasterotopic (D)
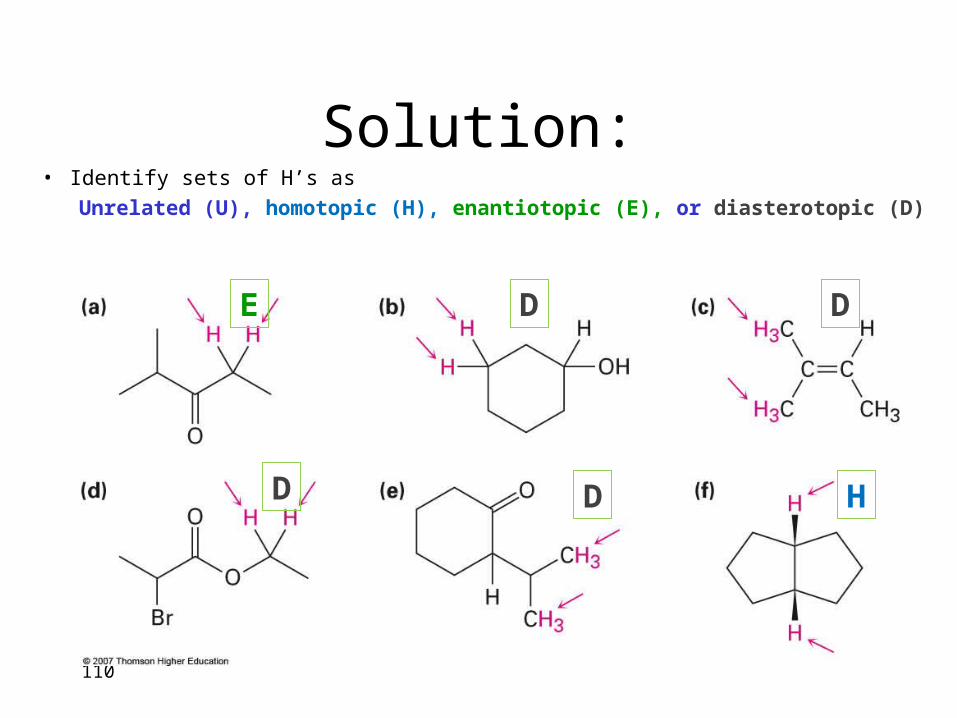
Solution:• Identify sets of H’s as
Unrelated (U), homotopic (H), enantiotopic (E), or diasterotopic (D)
110
DD
D
E
D H
111
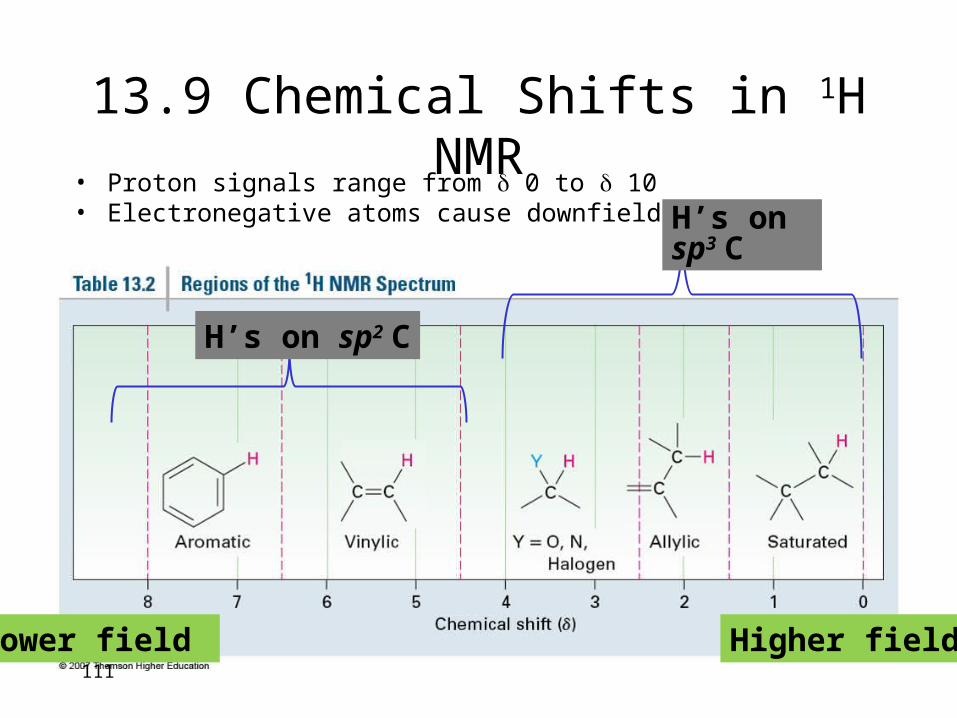
13.9 Chemical Shifts in 1H NMR• Proton signals range from 0 to 10• Electronegative atoms cause downfield shift H’s on
sp3 C
Higher field
H’s on sp2 C
Lower field
Shifts in 1H NMR
112