Embed Size (px)
Citation preview

University of Nebraska - LincolnDigitalCommons@University of Nebraska - Lincoln
Robert Powers Publications Published Research - Department of Chemistry
2013
NMR Metabolomics Analysis of Parkinson'sDiseaseShulei LeiUniversity of Nebraska-Lincoln
Robert PowersUniversity of Nebraska-Lincoln, [email protected]
Follow this and additional works at: http://digitalcommons.unl.edu/chemistrypowers
This Article is brought to you for free and open access by the Published Research - Department of Chemistry at DigitalCommons@University ofNebraska - Lincoln. It has been accepted for inclusion in Robert Powers Publications by an authorized administrator of DigitalCommons@Universityof Nebraska - Lincoln.
Lei, Shulei and Powers, Robert, "NMR Metabolomics Analysis of Parkinson's Disease" (2013). Robert Powers Publications. 36.http://digitalcommons.unl.edu/chemistrypowers/36

NMR Metabolomics Analysis of Parkinson's Disease
Shulei Lei1 and Robert Powers1,*
Robert Powers: [email protected] of Nebraska-Lincoln, Department of Chemistry, 722 Hamilton Hall, Lincoln, NE 68588-0304
Abstract
Parkinson's disease (PD) is a neurodegenerative disease, which is characterized by progressive
death of dopaminergic neurons in the substantia nigra pars compacta. Although mitochondrial
dysfunction and oxidative stress are linked to PD pathogenesis, its etiology and pathology remain
to be elucidated. Metabolomics investigates metabolite changes in biofluids, cell lysates, tissues
and tumors in order to correlate these metabolomic changes to a disease state. Thus, the
application of metabolomics to investigate PD provides a systematic approach to understand the
pathology of PD, to identify disease biomarkers, and to complement genomics, transcriptomics
and proteomics studies. This review will examine current research into PD mechanisms with a
focus on mitochondrial dysfunction and oxidative stress. Neurotoxin-based PD animal models and
the rationale for metabolomics studies in PD will also be discussed. The review will also explore
the potential of NMR metabolomics to address important issues related to PD treatment and
diagnosis.
Keywords
Parkinson's disease; Metabolomics; Biomarkers; NMR; PCA; PLS; OPLS
1. Introduction
PD is the second most common neurodegenerative disorder behind Alzheimer's disease
[1-3]. In 2005, 4.1 to 4.6 million people were estimated to have PD worldwide, with a high
prevalence of PD in the United States [4]. Aging is one of the strongest risk factors
associated with PD (Figure 1a) [5, 6]. Correspondingly, as the world population continues to
age, the number of PD cases is predicted to double by 2030, imposing an increasing burden
on the healthcare systems in many countries. In the U.S.A. alone, the annual economic cost
of Parkinson's disease is estimated at $10.8 billion [7]. As a result, maintenance of
functional independence at advanced ages has become a critical public health priority [8].
PD patients suffer from a range of movement disorders (bradykinesia, postural instability,
rigidity, tremors) collectively known as Parkinsonism. Parkinsonism is mainly caused by the
degeneration of dopaminergic neurons (DAergic) in the substantia nigra pars compacta
*Author to whom correspondence should be addressed; [email protected] (R.P.); Tel.: 402-472-3039; Fax: 402-472-9402.
Conflict of Interest: The authors declare no conflict of interest.
HHS Public AccessAuthor manuscriptCurr Metabolomics. Author manuscript; available in PMC 2015 June 13.
Published in final edited form as:Curr Metabolomics. 2013 ; 1(3): 191–209. doi:10.2174/2213235X113019990004.
Author M
anuscriptA
uthor Manuscript
Author M
anuscriptA
uthor Manuscript

(SNpc) and the resulting depletion in dopamine. However, a large proportion of PD patients
also suffer from other non-motor symptoms (anosmia, autonomic dysfunction,
hallucinations, sleep disorders) [9]; along with neuronal loss in many other brain regions.
This can occur before or after the loss of DAergic neurons [10, 11]. Currently, the diagnosis
of PD depends primarily on the observation of motor symptoms in a clinical setting.
Unfortunately, the rate of misdiagnosis of PD may be upwards of 50% [12]. This is due to
the absence of symptoms in the early stages of the disease, and a variation of symptoms
among individual patients [13]. There is also no cure for PD. Current treatments focus on
addressing the symptoms and reducing the progression of the disease [14-17]. The standard
treatment for PD consists of replacing dopamine with L-DOPA (Figure 2), a dopamine
precursor [18]. Unfortunately, the effectiveness of L-DOPA declines as the disease
progresses; leading to serious side-effects.
Despite decades of investigation, the PD mechanism of pathogenesis is still unknown and
dopamine depletion may be merely a consequence of PD. Several studies have shown that
proteinaceous inclusions (Lewy bodies and Lewy neuritis) are localized in different areas of
a PD brain (Figure 1b) even before dopamine loss and Parkinsonism symptoms occur
[19-21]. These proteinaceous inclusions are composed of lipids and several proteins, such as
α-synuclein (PARK1) [22]. Correspondingly, current hypotheses for PD pathogenesis are
based on protein misfolding and aggregation [23], mitochondrial dysfunction [24], or
oxidative stress [25]. Initially, these pathogenesis routes were thought to work
independently, but recent data strongly suggests they interact together to deplete dopamine
[26].
In this review, we will briefly summarize current models and supportive evidence for the
molecular mechanisms of PD, with a specific focus on mitochondrial dysfunction and
oxidative stress. We will provide a background and rationale for the utility of metabolomics
to investigate PD with a particular emphasis on the application of NMR-based
metabolomics. Metabolomics has a tremendous potential to provide valuable insights into
the etiopathogenesis of PD, to discover novel molecular targets for the treatment of PD, and
to identify reliable and sensitive PD biomarkers. Biomarkers may play an important role in
the early diagnosis of PD, in monitoring the progression of PD, and in determining the
efficacy of therapeutic intervention. Metabolomics methodology and its application to PD
will also be briefly described. The proper choice and handling of cellular and animal models
are critical to a successful metabolomics study. Thus, the most commonly used animal PD
models and their application to metabolomics will also be summarized.
2. Discussion
2.1. Risk Factors of PD
Studies on the etiology of PD have revealed multiple factors. In addition to aging, PD has
been shown to have a genetic association [27], and a correlation with head trauma [28] and
exposure to pesticides and herbicides (Figure 2) [29]. Specifically, PD has been associated
with exposure to paraquat, carbamates, and organochlorines [30, 31]. Not surprisingly, the
Midwest of the USA have a high prevalence of PD with Nebraska having the highest
number of PD patients per capita [6]. A byproduct of a synthetic opioid (MPPP, 1-methyl-4-
Lei and Powers Page 2
Curr Metabolomics. Author manuscript; available in PMC 2015 June 13.
Author M
anuscriptA
uthor Manuscript
Author M
anuscriptA
uthor Manuscript

phenyl-4-propionoxypiperidine), 1-methyl 4-phenyl-1,2,3,6-tetrahydropyridine (MPTP) is
chemically similar to paraquat and also results in PD-like motor symptoms and further
supports an environmental cause of PD.
Additionally, there are genetic links that associate PD with pesticides and herbicides [32]. In
fact, a recent study suggests that an environmental-genetic interaction plays a more
important role in PD than do either genetic or environmental factors alone [33]. A genetic
analysis of an Italian family [34] and a western Nebraska family [35] identified an
association between the α-synuclein (PARK1) and leucine-rich repeat kinase 2 (LRRK2/
PARK8) genes and the development of both familial and sporadic PD. Similar genetic
studies have identified mutations in the protein Parkin (PARK2) as the most common
indicator of familial PD [36]. Other genetic studies have identified a correlation with PD for
mutations in lysosomal protein glucocerebrosidase (GBA) [37], PTEN-induced putative
kinase 1 (PINK1/PARK6) [38], and the DJ-1 protein (PARK7) [39]. The majority of PD
cases are sporadic [1], where α-synuclein (PARK1) and leucine-rich repeat kinase 2
(LRRK2/PARK8) are associated with autosomal-dominant forms of PD and Parkin
(PARK2), PTEN-induced putative kinase 1 (PINK1/PARK6), DJ-1 protein (PARK7) are
associated with autosomal recessive forms of PD [40].
Mutations in leucine-rich repeat kinase 2 (LRRK2/PARK8) usually results in mid-to-late
onset PD with a slow disease progression through an unknown mechanism.
Correspondingly, the neuropathology is generally inconsistent. Conversely, mutations in α-
synuclein (PARK1) often lead to early-onset PD with a rapid disease progression and the
presence of Lewy bodies and α-synuclein (PARK1) fibrils. The mutation in GBA possibly
leads to an increase in α-synuclein (PARK1) aggregation [41]. Parkin (PARK2) mutations
results in juvenile and very early-onset PD that progresses very slowly. It causes neuronal
loss and gliosis in the substantia nigra, but commonly lacks Lewy bodies. Indistinguishable
clinical outcomes occur with mutations in PINK1 (PARK6) and DJ-1/PARK7. Importantly,
mutations in Parkin (PARK2), PINK1 (PARK6), DJ-1 (PARK7) and exposure to pesticides
and herbicides appear to alter redox balance leading to neuronal death [42]. Parkin (PARK2)
is involved in protein ubiquitination and interacts with synphilin-1, which interacts with α-
synuclein (PARK1). DJ-1/PARK7 has an unknown function, but has been associated with a
protective role related to oxidative stress. PINK1 (PARK6) is upstream of Parkin (PARK2)
in a pathway associated with eliminating damaged mitochondria [38, 43, 44]. The
mitochondria are a major provider of cellular energy and also play a key role in cell death
(apoptosis) [45, 46]. The brain has the highest energy requirement of all organs and,
correspondingly, neuronal mitochondria are subjected to high levels of oxidative stress and
potential damage that may lead to cell death. As a result, mitochondrial quality control
pathways have evolved to maintain molecular function or eliminate a dysfunctional
organelle, where the impairment of these processes is associated with PD [43, 44].
2.2. Mitochondrial dysfunction and oxidative stress in PD
Oxidative stress is caused by a cumulative production of free radicals, typically known as
reactive oxygen species (ROS) and reactive nitrogen species (RNS). Elevated level of ROS
may result in a significant damage to DNA, proteins and lipids [47]. Brain tissues are more
Lei and Powers Page 3
Curr Metabolomics. Author manuscript; available in PMC 2015 June 13.
Author M
anuscriptA
uthor Manuscript
Author M
anuscriptA
uthor Manuscript

susceptible to oxidative stress due to (i) a low concentration of antioxidant enzymes and a
low ability to maintain energy homeostasis [48], (ii) a high consumption of the total
available oxygen [49, 50], (iii) a high percentage of polyunsaturated fatty acids [51], and (iv)
the increased presence of redox metals (iron, copper and zinc) in an aging brain [52].
Among many sources of free radical production, metal-catalyzed reactions and
mitochondria-catalyzed electron transport reactions are two potential sources of PD-related
ROS [53]. It is thought that 95-98% of ROS generated during aerobic metabolism are from
mitochondrial activity [54]. As a result, mitochondria contain an extensive antioxidant
defense system, where a damaged or dysfunctional mitochondrion leads to an increase in
ROS [55].
Dopaminergic neurons in the substantia nigra pars compacta region are also very prone to
oxidative damage because of (i) higher iron and copper levels in this region of the brain,
higher activity of monoamine oxidase, and aberrant oxidation of dopamine that all lead to a
higher intrinsic ROS, (ii) higher sensitivity to ROS signaling that induces apoptosis, (iii)
lower mitochondrial mass, lower ATP levels and dysfunctional mitochondria, (iv) readily
activated mitochondrial permeability transition (MPT) pore by dopamine metabolite that
leads to cell death, (v) deficient DNA damage repair, (vi) glial dysfunction, (vii) calcium
dysregulation and glutamate hyperactivity, and (viii) the large size of the neurons and higher
demand for energy [56, 57].
Mitochondria were implicated in PD by two cases involving young drug users taking illicit
narcotics contaminated with MPTP [58]. Later studies implicated the MPP+ (1-methyl-4-
phenylpyridinium) metabolite of MPTP (Figure 2) as the cause of Parkinsonism in these
designer-drug abusers. MPP+ inhibits complex I of the mitochondrial electron-transport
chain [59]. This model has been supported by animal studies, in which the chronic infusion
of rotenone [60] (another complex-I inhibitor) or MPTP [61] results in a clinical
parkinsonian phenotype, and pathological nigrostriatal dopamine degeneration with
cytoplasmic inclusions immunoreactive for α-synuclein (PARK1) and ubiquitin [62].
Oxidative stress is the probable mechanism of toxicity for complex-I inhibitors [63].
Complex-I inhibition and oxidative stress were shown to be relevant to naturally occurring
PD when complex-I deficiency and glutathione depletion were found in the substantia nigra
of patients with idiopathic PD, and in patients with pre-symptomatic PD [64]. In addition,
many of the genes associated with PD also have a functional role in the mitochondria. Choi
et al. argues that mitochondrial complex I inhibition is not required for dopaminergic neuron
death induced by retenone, MPP+, or paraquat. A mouse strain lacking functional Ndufs4,
which abolishes complex I activity in midbrain mesencephalic neurons cultured from
embryonic day 14 mice, showed no effect on the survival of dopaminergic neurons in
culture [65].
2.3. PD animal models
Animal models are essential tools to study etiology, pathogenesis, and the molecular
mechanisms of PD in vivo. Over the past decades, various animal models have been
developed for PD research [66-68]. These animal models can be generally categorized into
toxin-based models and genetic models.
Lei and Powers Page 4
Curr Metabolomics. Author manuscript; available in PMC 2015 June 13.
Author M
anuscriptA
uthor Manuscript
Author M
anuscriptA
uthor Manuscript

Toxin-based models typically rely on dosing animals with MPTP, 6-hydroxydopamine (6-
OHDA), rotenone or paraquat. Given the well-known cases of PD-like motor symptoms
induced by MPTP associated drugs, MPTP has been widely used as a model for PD.
Administration of MPTP mimics human PD in many aspects, such as selective lesion of
substrantia nigra dopaminergic neurons and the presence of α-synuclein (PARK1)
aggregates. Unlike PD, the MPTP animal model is an acute, non-progressive disease. The
neuron toxin 6-OHDA has the longest history of use as a PD model and has been commonly
used to degenerate central catecholaminergic projections, including the nigrostriatal system
[69, 70]. Although dopamine depletion, nigral dopamine cell loss, and neurobehavioral
deficits have been observed with the 6-OHDA model, it does not mimic all of the clinical
features of PD. The 6-OHDA animal model does not form Lewy bodies, and it does not
affect other PD involved brain regions, such as olfactory structures, lower brain stem areas,
or locus coeruleus [71]. The rotenone animal model is the first to link an environmental
toxin to PD development [72, 73]. Rotenone administration produces hallmark traits of PD,
such as nigrostriatal dopamine neurons damage, α-synuclein (PARK1) aggregation, Lewy-
like body formation, oxidative stress, and gastrointestinal problems [74].
A number of genetic animal models have been created by mutating PD associated genes,
such as, α-synuclein (PARK1) [75, 76], LRRK2 (PARK8) [77, 78], PINK1 (PARK6),
Parkin (PARK2) [79, 80], DJ-1 (PARK7) [81] and ubiquitin C-terminal hydrolase-L1
(PARK5) [82]. Interestingly, these genetic models do not present PD related neuronal
degeneration, but they provide systems for investigating PD pathogenesis, for evaluating
potential therapeutic targets, and to assist in the drug discovery process.
2.4. The rationale for PD metabolomics studies
Metabolomics refers to the study of the metabolome, the collection of small molecules, such
as amino acids, carbohydrates and lipids, present in cells, tissues, organs, or biological fluids
[83-89]. Metabolomics combines analytical techniques (IR, NMR, MS, etc.) [85, 90, 91]
with multivariate statistical methods [92] to analyze metabolite concentration changes in a
high throughput manner. Metabolomics is a relatively new omics discipline that is
complementary to genomics and proteomics, and an important addition to systems biology
[86, 93-95]. The identities, concentrations, and fluxes of the metabolites within a
metabolome are a direct consequence of protein activity, and, importantly, change in
response to the environment (disease state, drug treatment, nutrient availability, genetic
modification, etc.). Thus, the metabolome reflects the state of a cell or biological system and
can provide an overall picture of how the system responds to a specific perturbation. Thus,
metabolomics is routinely used to define phenotypes [96-98]. Conversely, a change in the
expression level of a gene or protein from a genomics or proteomics study is not necessarily
correlated with a change in protein activity, or directly linked to a disease state. In addition
to studying disease pathogenesis, metabolomics is used in drug discovery to identify
chemical leads [99] and novel therapeutic targets [100]. Metabolomics is also a powerful
tool for the identification of biomarkers for early disease detection, for monitoring disease
progression, and the response to therapy [83]. Biomarkers have been identified from a
variety of bodily fluids that include cerebrospinal fluid (CSF) by NMR imaging and GC-MS
[101], feces by NMR [102], saliva by CE-MS [103], serum by NMR [104], and urine by
Lei and Powers Page 5
Curr Metabolomics. Author manuscript; available in PMC 2015 June 13.
Author M
anuscriptA
uthor Manuscript
Author M
anuscriptA
uthor Manuscript

NMR [105]. Metabolomics has been applied to a wide-variety of human diseases including
cardiovascular diseases [106], diabetes [107], and various types of cancer [108].
Metabolomics has also been successfully applied to investigate central nervous system
disorders such as Alzheimer's Disease [109], Huntington's disease [110], motor neuron
disease [111], and schizophrenia [112]. Paige et al. reported an alteration in several
metabolites between depressed patients and controls by performing an MS-based
metabolomics analysis of blood plasma samples [113]. Given that PD pathology may be
closely related to protein misfolding and aggregation, mitochondrial dysfunction and
oxidative stress, metabolomic changes would also be expected for PD.
PD is a complex and heterogeneous disease where metabolomics holds the promise of
identifying specific disease-related networks to enhance our understanding of the multiple
interrelated pathways of pathogenesis. This, in turn, may lead to the identification of novel
therapeutic targets and the development of new treatments. Moreover, the application of
metabolomics may result in the discovery of PD biomarkers for diagnosing the disease.
Validated PD biomarkers would aid in the early detection of the disease and address the high
misdiagnosis rate for PD [114, 115]. PD biomarkers would also allow for the accurate
evaluation of disease progression, which would be invaluable in assessing the efficacy of a
patient's treatment [116].
2.5. NMR-based metabolomics methodology
Due to the large size and diversity in the chemical and physical properties of the
metabolome [117, 118], a range of analytical techniques have been applied to characterize
metabolites present in a biological sample. Common analytical techniques used for
metabolomics include NMR [85], GC-MS [119], LC-MS [120] and LC-electrochemistry
array metabolomics platforms (LCECA) [121]. These analytical techniques have both
advantages and limitations; and as a result are complementary to each other. Thus, it is
common to integrate multiple techniques in a metabolomics study [122-124]. NMR
spectroscopy has been used to investigate a wide range of diseases such as cancers
[125-127], aging [128], heart disease [129], polycystic ovary syndrome [130, 131], and
diabetes [132]. Correspondingly, NMR has some unique advantages that include: minimal
sample handling, high reproducibility, easy quantitation, non-destructive, structural
determination, and high throughput [87, 133-136]. Although we only discuss NMR-based
methodologies in this review, there is a common work flow that is independent of the
analytical method employed. This work flow is comprised of sample collection, sample
preparation, data processing and analysis, and metabolite pathway identification (Figure 3).
However, the experimental details for these processes (sample preparation, data analysis,
etc.) still need to be optimized for the specific analytical technique utilized.
Various types of biological samples can be analyzed by NMR which includes cell extracts,
tissue extracts, and numerous biofluids. Moreover, intact tissues can be analyzed by using
high resolution magic angle spinning magnetic resonance spectroscopy (HR MAS) after a
simple sample preparation procedure [137]. For a typical PD in vitro study, intracellular
metabolites are acquired by quenching and lysing neuron cells, followed by extracting the
metabolome. Cerebrospinal fluid (CSF) is a preferred choice for a PD in vivo study.
Lei and Powers Page 6
Curr Metabolomics. Author manuscript; available in PMC 2015 June 13.
Author M
anuscriptA
uthor Manuscript
Author M
anuscriptA
uthor Manuscript

However, there are associated risks with obtaining CSF from patients that diminishes its
value as a routine diagnostic tool [138, 139]. Instead, easily accessible biofluids (plasma,
serum, urine) provide a safer alternative. Procedures for preparing metabolomic samples
from mammalian cell lines and biofluids have been extensively reviewed [88, 133,
140-164].
The metabolome is a complex heterogeneous collection of compounds with a diversity of
physiochemical properties, where specific metabolite stability and enzymatic turn-over rates
are highly variable [161, 162]. It is essential that the extracted or collected metabolome
reflects the true state of the system and is biologically relevant. In effect, changes to the
metabolome should not be introduced by sample handling. Thus, a reliable sampling
protocol is critical to a successful metabolomics study, where rapid sample collection and
analysis are important [163]. For example, rapid quenching of cells with cold methanol
avoids the more time consuming and physiological stressful trypsinization applied in
conventional sampling methods [164]. Residual enzymatic activity or induction of stress
response pathways (e.g. apoptosis) from trypsinization would alter the metabolome. Sample
preparation is considerably simpler for biofluids. The sample is filtered or centrifuged; and
then spiked with a deuterated phosphate buffer containing a preservative or anticoagulant
[88, 89].
The application of NMR for the analysis of metabolomics samples has also been extensively
reviewed [83-85, 87, 134, 165-170]. A typical one-dimensional (1D) 1H NMR spectrum can
be acquired in a few minutes using an automated high throughput protocol [171]. The
resulting 1D 1H NMR spectrum provides a global “fingerprint” or “snap-shot” of the
metabolome for each sample. Thus, the 1D 1H NMR spectrum is routinely used to
characterize a particular class (healthy or diseased, control or drug treated, etc.) and to
identify the global features that distinguish between the classes or groups. This initial global
analysis of the metabolome doesn't rely on identifying changes to individual metabolites (or
assigning the highly complex NMR spectrum). Instead, multivariate statistical methods
(principal component analysis, PCA; partial least squares, PLS; orthogonal projection to
latent structures, OPLS) are applied to identify the spectral features that distinguish between
the classes or groups [92, 172-175]. In general, the outcome of PCA, PLS, or OPLS is a
scores plot, where each 1D 1H NMR spectrum is reduced to a single point in the plot (Figure
4). Simply, the NMR spectrum consisting of a range of chemical shifts (ppm) and peak
intensities is transformed into a multidimensional Cartesian space, where each axis (V1, V2,
V3, … Vn) corresponds to a chemical shift and the value along each axis is the intensity of
the NMR peak at that given chemical shift. If the NMR spectrum was collected with 32K
data points there would be 32K axes. PCA then identifies a principal component vector
within this multidimensional space corresponding to the largest variation in the data
set. A second vector orthogonal to is identified that corresponds to the next
largest variation in the data set. Each successive vector describes a diminishing amount of
the variability of the data set, where most of the variability is described by the first two or
three principal components. The PC1 and PC2 scores (unitless values) are the individual fit
of each NMR spectrum to and , respectively, and are usually presented in a 2D
Lei and Powers Page 7
Curr Metabolomics. Author manuscript; available in PMC 2015 June 13.
Author M
anuscriptA
uthor Manuscript
Author M
anuscriptA
uthor Manuscript

plot. The relative clustering of the NMR spectra in the scores plot identifies the relative
similarity or differences between each spectrum, and correspondingly, their metabolomes. In
essence, PCA, PLS, or OPLS is used to determine if a statistically significant difference in
the metabolome has occurred as a result of the applied environmental stress (disease state,
drug treatment, genetic modification, etc.). To be clear, PCA, PLS, and OPLS do not
provide a direct analysis of the statistical significance of group separation in a scores plot.
Instead, other utilities, such as a Mahalanobis distance metric and T2 and F distributions are
required to return p values for quantitation of PCA, PLS, or OPLS group separations [176].
Multivariate statistical methods are classified into supervised (PLS, OPLS) and
unsupervised (PCA) approaches. PCA [172, 173] is the most popular unsupervised
algorithm routinely used in metabolomics. Importantly, PCA provides an unbiased view of
the clustering patterns for all the conditions under investigation, and should be routinely
employed to verify that a spectral difference actually exists. PCA directly analyzes the NMR
spectra without any user intervention. If a true difference exists between the various classes,
then all members within a class will cluster together and separate from the other classes in
the resulting PCA scores plot. This occurs without PCA having any prior knowledge of the
class membership for each NMR spectrum. In principal, PCA can actually be used to
identify the class membership for each NMR spectrum. Thus, PCA can also be used as a
quality control to identify outliers [177]. Of course, this assumes that the samples and
spectra were not biased by experimental procedures or data processing.
PLS and OPLS are commonly used supervised methods, [174, 175]. The major difference
between PCA and PLS/OPLS is that class membership is defined prior to PLS or OPLS.
Thus, OPLS and PLS are inherently biased techniques since class designations are explicitly
incorporated into the analysis. In effect, PLS/OPLS will only identify spectral differences
that correlate with the manually defined class designations. This occurs regardless of the
significance of these differences compared to other spectral features. As a result, an OPLS
or PLS scores plot will always show a separation based on the manually defined class
designation, even for completely random data [178]. Thus, OPLS and PLS can easily be
misleading and requires validation of the model.
Cross validation and permutation testing [179] and CV-ANOVA [180] are routinely
employed to validate OPLS and PLS models. For cross validation, the PLS/OPLS models
are generated with a subset of the data, where the quality of the fit of the held-out data is
measured against the model. The process is repeated numerous times, where different
subsets of the data are held-out. The resulting quality assessment (Q2) statistic has no
standard of comparison besides its theoretical maximum of 1 or an empirically acceptable
value of ≥ 0.4 [179]. Unfortunately, a large Q2 value is still possible for an invalid model.
The R2 values provide a measure of the fit of the data to the model, while it is not a measure
of cross-validation an R2 ≫ Q2 indicates a possible over-fitting of the model. For
permutation, the class designations are randomly changed and the quality of the model (Q2)
is assessed and compared against the model with the correct classification. Again, the
process is repeated numerous times where the correct classification is expected to yield the
largest Q2 value. Also, a p value can be calculated based on the distribution of Q2 values for
the incorrect class designations relative to the Q2 value for the correct model. Similarly, CV-
Lei and Powers Page 8
Curr Metabolomics. Author manuscript; available in PMC 2015 June 13.
Author M
anuscriptA
uthor Manuscript
Author M
anuscriptA
uthor Manuscript

ANOVA provides a p value for the PLS/OPLS model based on the cross-validated
predictive residuals of a model as a basis for hypothesis testing.
Supervised analyses does provide valuable clues on biomarkers - the metabolites that
experienced the largest change and primarily contribute to the class distinction in the PLS or
OPLS scores plot. These potential biomarkers can then be targeted for further investigation.
Potential biomarkers are typically identified from an S-plot [181] generated by the PLS or
OPLS model (Figure 3). Basically, the extreme regions of the S-plot identify the spectral
features (chemical shifts, metabolites) that significantly contribute to the class distinctions
observed in the scores plot. A number of other data analysis methods are also used to
analyze NMR metabolomics spectra [182], a few select examples include self-organizing
map (SOM) [183, 184] support vector machines (SVM) [185, 186], and hierarchical
clustering (HCA) [187].
The primary difference between PLS and OPLS is that OPLS attempts to maximize the
separation between the classes along the X-axis with unrelated (orthogonal) variations along
the Y-axis. As a result, OPLS minimizes within class variations. To be clear, any separation
along the Y-axis in an OPLS scores plot is not correlated with the manually defined class
designations. In other words, for OPLS a corresponding PLS scores plot is rotated to align
the maximal separation between the classes along the X-axis.
Comparable to sample preparation, multivariate statistical methods are also very sensitive to
the quality of the input data, where the results can be biased by data handling and processing
protocols [178]. Basically, PCA, OPLS or PLS will highlight any spectral difference
regardless of the source. Baseline distortions, incorrect phasing, chemical shift referencing
errors, chemical shift and line shape perturbations, and irrelevant variations in spectral
intensities due to instrument performance or sample preparations are all common NMR
issues. NMR chemical shifts are very sensitive to subtle changes in temperature, pH, ionic
strength, and instrument stability. Therefore, it is important to implement a uniform data
pre-processing protocol that includes spectral alignment, binning, data normalization and
data scaling [92]. The spectra can be aligned by using an internal standard like TMSP-d4 or
computationally aligned using a variety of methods [188-193]. Importantly, an internal
standard can only correct for a uniform deviation in chemical shifts that may arise between
replicate samples. For example, chemical shifts generally change linearly with temperature,
but a subtle variation in pH may result in large chemical shifts for some peaks, while others
are essentially unchanged. Also, the direction of chemical shift change due to pH differences
may vary between peaks. NMR spectra are also commonly binned to minimize minor
variations in peak position and peak shape, and to filter out noise. The NMR spectrum is
divided into “bins” having typical widths of 0.04 ppm, where the total peak intensity within
each bin is integrated. “Intelligent” or “adaptive” binning uses variable bin sizes to avoid
dividing peaks between multiple bins [194-197]. Since noise is biologically irrelevant and
has been shown to bias PCA and PLS, noise regions should be removed prior to any
multivariate statistical analysis [198, 199]. In addition to these spectral variations, the total
signal intensity may vary across a set of NMR spectra due to differences in the number of
cells, biofluid volume, or tissue size per sample. Thus, the absolute NMR peak intensities
need to be normalized to a common reference or standard. Common normalization
Lei and Powers Page 9
Curr Metabolomics. Author manuscript; available in PMC 2015 June 13.
Author M
anuscriptA
uthor Manuscript
Author M
anuscriptA
uthor Manuscript

techniques include normalization to the total signal intensity, probabilistic quotient
normalization, contrast normalization and quantile normalization [200]. Normalization may
also rely on an internal TMSP-d4 standard or an external standard such as cell culture
optical density or protein content [201, 202]. Finally, the data needs to be scaled in order to
avoid the multivariate analysis from only focusing on changes to the most intense peaks
[201]. Effectively, the disparity in intensities and variances between peaks needs to be
minimized in order for changes in low or high concentrated metabolite to make equal
contributions to the PCA, PLS, or OPLS model. A range of scaling methods have been
described [201] that emphasize different features of the spectrum and have different
advantages and disadvantages.
The primary application of 1D 1H NMR spectra is to characterize the global metabolomic
changes. The large number of metabolites and the limited chemical shift dispersion in a 1D
spectrum lead to severe peak overlap that makes metabolite identification very challenging.
As a result, alternative methods have been developed or implemented to simplify metabolite
identification. These approaches include 1D NMR methods such as selective total
correlation spectroscopy (TOCSY) [203, 204], and statistical methods such as statistical
total correlation spectroscopy (STOCSY) [205] and ratio analysis nuclear magnetic
resonance spectroscopy (RANSY) [206]. In addition, two-dimensional (2D) NMR
experiments routinely employed to characterize natural products (1H-13C heteronuclear
single quantum correlation, HSQC; 2D 1H-1H TOCSY) are also used for metabolite
identification [158]. The 2D NMR experiments significantly reduce peak overlap by
dispersing the chemical shift information into two-dimensions. Importantly, these
experiments also improve the accuracy of peak identification by providing chemical shift
information for correlated nuclei, such as 13C-1H and 1H-1H pairs in the 2D 1H-13C HSQC
and 2D 1H-1H TOCSY experiments, respectively. Unfortunately, these NMR experiments
are significantly more time-consuming than the simpler 1D experiment, requiring upwards
of hours to complete. Also, 13C-based NMR experiments require even longer acquisition
times or the incorporation of 13C labeled metabolites because of the low natural abundance
(1.1%) and sensitivity of 13C. However, the 2D 1H-13C HSQC experiment has a unique
advantage when cells can be cultured with a 13C labeled carbon source. Only a subset of the
metabolome is highlighted and the 13C label can be traced as it flows through specific
metabolic pathways. Of course, this requires a judicious selection of the 13C-probe to
monitor the appropriate metabolic pathways.
2.6. Metabolomics applied to PD
2.6.1. PD biomarker identification using the metabolome
2.6.1.1 Targeted metabolomics studies: An exciting potential of metabolomics is the
identification of biomarkers to diagnose PD, to monitor disease progression, and to evaluate
a patient's response to treatment. Thus, a primary goal of metabolomics is to identify or
“discover” the specific metabolites significantly perturbed in response to a disease state.
What are the metabolites that are biologically relevant or correlated with PD? Conversely, a
traditional targeted approach follows changes to a few select metabolites based on prior
knowledge or hypothesis. Correspondingly, targeted analysis has identified metabolite
variations in CSF, blood and urine samples obtained from PD patients and animal models
Lei and Powers Page 10
Curr Metabolomics. Author manuscript; available in PMC 2015 June 13.
Author M
anuscriptA
uthor Manuscript
Author M
anuscriptA
uthor Manuscript

[207-211]. For example, Ahmed et al. [207] evaluated 22 targeted metabolites in plasma
samples obtained from 37 healthy controls and 43 drug-naïve PD patients by using 1D 1H
NMR and multivariate analysis. The 22 metabolites were selected based on prior
connections with PD as cited in the literature. Metabolites were identified using a
combination of 2D COSY and TOCSY NMR experiments, and an NMR reference library
for 292 metabolites to assign the chemical shifts observed in the 1D 1H NMR spectra.
These metabolites were shown to incur statistically significant changes (P < 0.05; ANOVA)
in PD plasma samples. Of the 22 targeted metabolites, 17 metabolites were decreased and 5
were elevated in PD patients (Figure 5a). The heat map depicts metabolite concentration
differences between healthy controls and PD patients. The relative metabolite concentrations
are indicated by a color gradient. Red indicates an increase in the average metabolite
concentration and green a decrease. The metabolites with a decrease in concentration are
suberate, methylmalonate, galactitol, citrate, malate, succinate, glycerol, isocitrate,
ethanolamine, ascorbate, threonate, gluconate, acetate, trimethylamine, glutarate,
methylamine and glucolate, while the five elevated metabolites are pyruvate, sorbitol,
myoinositol, ethymalonate and propylene glycol. It is important to note that a typical heat
map would normally contain all of the individual replicates instead of the group-wise
average presented by Ahmed et al. By including all replicates, it would be possible to assess
the within group variability and, critically, determine if all the patients from the diseased and
normal groups cluster together. This would provide an important quality check to further
substantiate the relevance of each of the 22 targeted metabolites to PD. Simply, is the
metabolite uniformly increased or decreased across the 43 PD patients and 37 healthy
controls? The data was also used to train an artificial neural network (ANN) for PD
diagnosis. The resulting ANN had a classification accuracy of 97.14% and a 100%
specificity. Importantly, this classification accuracy was computed on held-out samples.
A PLS 2D scores plot generated from the NMR data identified a clear separation between
PD patients and healthy controls (Figure 5b). Unfortunately, no statistical validation of the
class separation in the PLS scores plot was provided. Again, PLS is a supervised method, is
inherently biased and will always show a separation in the scores plot regardless of the
existence of any true separation between the classes [178]. The separation in the PLS scores
plot is determined by the manually defined class designation, where the follow-up validation
step determines if this observed separation is statistically significant. Thus, the PLS result is
very difficult to interpret. Instead, PCA would have been a more appropriate choice to
provide a direct assessment of the significance of the class separation between PD patients
and healthy controls. PCA is unsupervised, does not use class designations, and, as a result,
is inherently unbiased. Nevertheless, PLS is useful for identifying the spectral features and,
correspondingly, the metabolites that primarily contribute to the class separation in the
scores plot. Of course, any subsequent analysis is dependent on the reliability of the original
PLS model.
Myoinositol, glucitol, citrate, acetate, and pyruvate were identified as the key contributors to
the class separation in the PLS scores plot and, thus, may serve as potential biomarkers if the
PLS model is valid. The observed increase in myoinositol may be indicative of a decrease in
sciatic motor-nerve conduction velocity. It is well-established that diabetic neuropathy in
Lei and Powers Page 11
Curr Metabolomics. Author manuscript; available in PMC 2015 June 13.
Author M
anuscriptA
uthor Manuscript
Author M
anuscriptA
uthor Manuscript

both humans and animal models is observed through the slowing of nerve conduction [212],
which is also correlated with an increase in plasma and urine myoinositol levels [213, 214],
and a corresponding decrease of myoinositol in nerve cells [215]. As a result, a complex
metabolic mechanism has been proposed that correlates this myoinositol defect with the
slowing of nerve conduction in diabetes [215]. This pathogenic scheme includes the polyols
pathway, Na+-K+-ATPase activity, protein kinase C activity and phosphoinositide
metabolism. The increase in sorbitol in PD may result from oxidative stress. The change in
both myoinositol and sorbitol also implies a dysfunction of the polyols metabolic pathway
and, correspondingly, a malfunctioning mitochondrion. Pyruvate (increased) is an end
product of glycolysis that then enters the tricarboxylic acid cycle (TCA cycle) as acetyl-coA,
where the other TCA metabolites citrate, acetate, succinate and malate were decreased.
These results suggest an abnormal activity in pyruvate dehydrogenase. Interestingly, a
differential down-regulation in the PDHB gene that has pyruvate dehydrogenase activity is
also consistent with the observed increase in pyruvate levels and a decrease in TCA
metabolites in the plasma of PD patients [207]. Correspondingly, Ahmed et al. suggests that
pyruvate plasma levels may be a diagnostic for PD. Of course, given pyruvate's central role
in metabolism, it is highly unlikely that pyruvate will be a unique biomarker for PD since
pyruvate will probably be affected by other diseases besides PD.
Unfortunately, multiple discrepancies have been reported in the literature for metabolites
associated with PD (Table 1). Importantly, the magnitude of these discrepancies can be
misleading since different sets of metabolites were targeted by different studies. For
instance, none of the 22 metabolites described above (Figure 5) and the focus of the study by
Ahmed et al. [194] were selected by the four other studies summarized in Table 1.
Nevertheless, there are still differences in the identity of the metabolites; and the magnitude
and direction of the concentration changes do differ between some of these existing studies.
These contradictory results may be attributed to the different analytical techniques (LCECA,
GC-MS) employed by these studies. This also leads to variations in sample preparation
procedures, storage conditions, and sample sizes. Moreover, differences in the selection of
study participants (random, age/sex matched, family member inclusion), variations in the
disease phenotype (various PD genetic variants), disease progression, and disease treatment
all potentially play a major role in the inconsistency of the identified potential biomarkers.
Furthermore, as discussed previously, there are multiple factors contributing to the etiology
of PD that includes age, exposure to pesticides and herbicides, and head trauma. A different
set of metabolite biomarkers are potentially associated with each etiology. Finally, a variety
of other factors such as diet, life-style, and comorbidity could create a complex background
and mask metabolites associated with PD. Correspondingly, the design of the study and how
these various factors are controlled or normalized may explain or contribute to the observed
discrepancies (Table 2).
As an illustration, Tohgi et al. [208] reported a dramatic reduction in the concentration of
aspartate, glutamate and δ-aminobutyric acid (GABA), and a modest, but significant
reduction of glycine in the CSF from PD patients compared to healthy controls. However,
Jiménez-Jiménez et al. [209] demonstrated that PD patients had similar CSF glutamate,
glutamine, asparagine and glycine levels. CSF GABA levels in PD patients were still higher
Lei and Powers Page 12
Curr Metabolomics. Author manuscript; available in PMC 2015 June 13.
Author M
anuscriptA
uthor Manuscript
Author M
anuscriptA
uthor Manuscript

than in healthy controls. Alternatively, plasma glutamine, asparagine, and glycine levels
were higher, aspartate levels were lower, and glutamate and GABA levels were similar in
PD patients relative to healthy controls. The results of Jiménez-Jiménez et al. also showed
an increase in CSF glycine levels and an increase in plasma aspartate and GABA levels after
levodopa therapy; an increase in plasma glutamine levels after treatment with a dopamine
agonist; and a decrease in CSF and plasma glutamate levels, and plasma aspartate levels
after deprenyl treatment. Alternatively, Mally et al. [210] observed a highly significant
decrease in glutamate levels, a slight decrease in alanine, lysine and isoleucine levels, and a
significant increase in glutamine level in the CSF from PD patients. Mally et al. did observe
a decrease in glutamate similar to Tohgi et al. Fewer metabolite changes were observed in
the serum of PD patients, which included a decrease in the levels of arginine and
methionine, and an increase in the levels of valine. Finally, Weisskopf et al. [211] observed
a reduction in uric acid (a natural antioxidant) levels in the plasma of PD patients.
Importantly, the study design varied significantly across these four projects (Table 2). There
was a large variation in the treatments received by PD patients. Tohgi et al. included PD
patients that were either receiving L-DOPA or no treatment at all. Conversely, Jiménez-
Jiménez et al. included PD patients receiving a variety of treatments, Mally et al. only
included PD patients that were not receiving a treatment and Weisskopf et al. did not report
patient treatments. Similarly, there was a ten year range in the average age of the PD
patients between the studies, a high of 71.5 for the Weisskopf et al. study and a low of 59.8
for the Tohgi et al. study. A similar variation was observed in the number of participants.
Weisskopf et al. included 84 PD patients and 165 healthy controls, while the Mally et al.
study only included 10 PD patients and 10 healthy controls. The Weisskopf et al. study used
matched case controls, where the others used random controls. Critically, the PD patients
were not further classified into PD stage or phenotype in any of these studies.
2.6.1.2 Untargeted metabolomics studies: Untargeted metabolomics has been recently
applied to PD in order to identify disease biomarkers and for the investigation of drug
metabolites resulting from PD treatment [216-220]. Bogdanov et al. [216] identified
approximately 2000 metabolites in plasma samples obtained from 25 healthy controls and
66 PD patients by using high performance liquid chromatography coupled with
electrochemical coulometric array detection (LCECA). A resulting PLS 2D scores plot
showed a statistically significantly separation (P < 0.01 by permutation test) for the
metabolic profiles between healthy and PD patients. The main metabolites contributing to
the observed PLS separation was an increase in 8-hydroxydeoxyguanosine (8-OHdG) and a
decrease in uric acid and glutathione in the plasma of PD patients. Johansen et al. [217]
applied a similar metabolomics strategy, LCECA combined with multivariate data analysis,
to assess changes in plasma samples obtained from PD patients with the G2019S LRRK2
(PARK8) mutation. The study also enrolled PD patients without any known mutation
(idiopathic) and asymptomatic family members of those PD patients with or without the
G2019S LRRK2 (PARK8) mutations. Again, 2D scores plots from PLS depicted an obvious
visual separation (no statistical significance was presented) between the metabolic profiles
for LRRK2 (PARK8) mutation patients, idiopathic patients and control subjects. The
metabolomic analysis also indicated an aberration in the purine pathway in PD. Michell et
Lei and Powers Page 13
Curr Metabolomics. Author manuscript; available in PMC 2015 June 13.
Author M
anuscriptA
uthor Manuscript
Author M
anuscriptA
uthor Manuscript

al. [218] investigated the metabolic profiles of serum and urine samples from 23 female
patients with Parkinson's disease (PD) and 23 age and sex-matched controls using GC-MS,
PCA and PLS. Contrary to the Bogdanov et al. [216] and Johansen et al. [217] studies, PCA
or PLS (P = 0.67; χ2 test) did not yield a separation between healthy and PD patients using
serum samples. Furthermore, PCA did not yield a separation between healthy and PD
patients using urine samples, but interestingly, PLS did (P < 0.01; χ2 test). Importantly, the
separation in the 3D PLS scores plot could not be attributed to any particular metabolite.
This suggests that only a subtle difference exists in the metabolome between healthy and PD
patients. These contradictory results could be attributed to the different experimental
protocols and variations in the study designs (Table 2). Ahmed et al. included PD patients
from three stages of PD, while Johansen et al. recruited idiopathic PD patients or patients
with the LRRK2 (PARK8) PD variant. Again, there were variations in the number of
participants (23 to 66 PD patients, 15 to 37 controls), average age range of the participants
(55.7 to 68.6), and PD treatments.
2.6.2. PD pathogenesis investigation using metabolomics—Metabolomics is also
an invaluable systems biology tool and an important approach for studying the underlying
mechanisms associated with PD. Abnormal choline metabolism and mitochondrial electron
transport system (ETS) dysfunction have been closely associated with central nervous
system diseases like PD, but the relationship between ETS and choline metabolism is not
well-understood. Towards this end, Baykal et al. investigated the relationship between
functionally impaired ETS and choline metabolism using NMR metabolomics [221]. Human
SH-SY5Y neuroblastoma cells were treated with a set of ETS inhibitors, where each
compound selectively inhibited one of the five (I through V) ETS complexes. The extracted
cellular metabolome were analyzed by 1D 1H NMR and PCA. Metabolites of choline and
phosphorylcholine were further quantified by matrix-assisted laser desorption/ionization
mass spectrometer (MALDI-TOF MS). Each ETS complex inhibitor resulted in a separate
cluster in the PCA 2D scores plot consistent with a distinct perturbation of the cellular
metabolome. Thus, the inhibition of each ETS complex leads to a specific mitochondrial
dysfunction, and a distinct phenotype. Nevertheless, all the ETS complex inhibitors resulted
in a significant increase in choline and associated metabolites. This is consistent with the
observation that choline is elevated in CNS diseases [222, 223]. The increase in choline may
occur because the ETS complex inhibitors may also target choline metabolic enzymes as
evident by an observed increase in the induction of choline kinase by all of the inhibitors.
Gao et al. [220] used 1D 1H-NMR spectroscopy and PLS to detect metabolic changes in the
striatum of 6-OHDA-induced Parkinson's rat. The right striatum of Sprague–Dawley rats
were injected with 1.5 μg/μL of 6-OHDA. After the rats were sacrificed, specimens of both
right (6-OHDA dosed) and left (control) striatum were dissected, followed by extraction of
the metabolome for analysis by NMR. As expected, the resulting PLS 2D scores plot
indicated a clear separation between the control and 6-OHDA treated groups. Unfortunately,
the PLS model was not statistically validated making it difficult to interpret the reliability of
the results. The corresponding PLS loading plot indicated that glutamate and glutamine were
among the major contributors to the class separation. A statistically significant (p < 0.05)
increase in glutamate and δ-aminobutyric acid (GABA), and a decrease in glutamine was
Lei and Powers Page 14
Curr Metabolomics. Author manuscript; available in PMC 2015 June 13.
Author M
anuscriptA
uthor Manuscript
Author M
anuscriptA
uthor Manuscript

also observed for the 6-OHDA treated striatum based on a comparison between normalized
NMR integrals. These results suggest a likely shift in the steady-state equilibrium of the
Gln-Glu cycle between astrocytes and neurons. A change in the Gln-Glu cycle would disrupt
the balance between excitatory and inhibitory brain processes that would potentially lead to
long-term abnormalities in glutamatergic and GABAergic activities. 6-OHDA induced
perturbations in other cerebral metabolites (alanine, lactate, N-acetyl aspartate and taurine)
that also suggest the possible involvement of energy metabolism and the TCA cycle in the
pathogenesis of PD.
2.6.2. PD drug discovery using metabolomics—In addition to biomarker discovery
and mechanistic studies, Sun et al. [219] demonstrated the use of metabolomics to
investigate drug metabolism in PD. During the evaluation of a potential new drug, it is
critical to ascertain both the drug's efficacy and toxicity. Tolcapone, a catechol-O-methyl
transferase inhibitor for PD treatment, was used to dose Sprague-Dawley rats. Urine samples
were collected over a 28 day period to identify the metabolite profile. UPLC/MS, MS/MS
(MS2) combined with multivariate statistical analysis was used to investigate the impact of
tolcapone on the urine metabolome. A total of 15 different metabolites of tolcapone were
identified using both positive and negative modes of LC/MS and MS2. While two of the
observed metabolites, could be oxidatively bioactivated to induce liver toxicity, these
reactive species were not observed and histopathology analysis indicated no significant
changes. The PCA 2D score plots show complete separation between the control group, and
the day 1 and day 28 dosed groups (Figure 6). Importantly, tolcapone and the metabolites of
tolcapone were the primary contributors to this class separation. Also, there was a
significantly larger separation between the control group and the day 28 dosed group. This is
consistent with the accumulation of tolcapone and its metabolites from multiple doses.
3. Conclusions
3.1. Merits of metabolomics for PD research
Parkinson's disease is a CNS disorder with a high heterogeneity in clinical symptoms, with
multiple etiological factors, and numerous, not well-understood pathological mechanisms.
Metabolomics offers a unique opportunity to study this complex disease from a systems
biological perspective. Changes in the metabolome are correlated with phenotypes, and are a
direct result of alterations in protein and enzyme activities. Thus, metabolomics may provide
critical information on cellular processes, molecular interactions and metabolic pathways
associated with PD. Correspondingly, the electron transport system, choline metabolism, the
Glu-Gln cycle, energy metabolism and TCA cycle have been implicated in PD from NMR
metabolomics studies discussed in this review. Other highlighted metabolomics studies
demonstrate the great potential of using NMR metabolomics to identify novel biomarkers
for diagnosing PD, for personalized medicine, and for aiding in drug discovery and
development. But, there are also clear challenges with the application of metabolomics to
study PD.
Lei and Powers Page 15
Curr Metabolomics. Author manuscript; available in PMC 2015 June 13.
Author M
anuscriptA
uthor Manuscript
Author M
anuscriptA
uthor Manuscript

3.2 Limitations of metabolomics
The metabolomics studies presented in this review yielded contradictory results in the
identification of metabolite biomarkers for PD. This unfortunate outcome is likely due to a
combination of experimental errors, the use of different analytical techniques, the use of
different targeted metabolites, the heterogeneity of PD, and different study designs. The
appeal of metabolomics is the simplicity of the methodology, but it is also easy to obtain
erroneous results. Simply, the metabolome is sensitive to any variation in experimental
conditions.
The metabolome is a heterogeneous mixture of compounds with a range of turn-over rates,
stabilities, solubilities, and volatilities. Thus, improper sample handling and preparation
procedures may perturb the composition of a biological sample. For example, removing an
extraction solvent like methanol may also result in removing other volatile metabolites.
Also, residual enzymatic activity would affect the concentrations of associated substrates,
co-factors and products. A biological sample is nutrient-rich, so a loss of sterility would also
result in a dramatic change in the sample composition. Concentrating or drying a biological
sample may result in the precipitation of specific metabolites due to limited solubility or
changes in ionic strength or pH. Similar effects may result from choice of buffer or pH. The
solubility of a metabolite can also be negatively affected by the presence of other
metabolites in the sample. How long the sample is kept at room temperature, how long the
sample is stored before analysis, and how many freeze-thaw cycles a sample undergoes are
all factors that can perturb the composition of a biological sample.
Different analytical techniques (NMR, MS, IR, LCECA, etc.) have different strengths and
limitations, and hence, emphasize different regions of the metabolome. Thus, it is not
surprising that the application of various analytical techniques may also result in different
outcomes. NMR is relatively insensitive technique and will only detect the most abundant
metabolites, so a change in a low concentration metabolite would be unobservable by NMR.
In contrast, MS depends on compound ionization and volatility. A number of metabolites do
not produce a detectable molecular ion [224]. Moreover, the heterogeneity and complexity
of the metabolome may lead to additional ion suppression and further diminish the detection
of weakly ionizable metabolites. In addition, the application of chromatography to separate
the metabolome may change the relative concentrations of a select set of metabolites in the
MS spectrum. Again, the diversity of the physiochemical properties of metabolites will
inevitably lead to a range of compound recoveries from chromatography columns; and
correspondingly, result in relative changes in metabolite concentrations.
An observed difference (or lack of a difference) in the metabolome of biofluids from healthy
and PD patients depends both on the disease and patient demographics. A patient's lifestyle,
medical history, disease progression, medical treatments, gender, age, race, diet, etc. are all
likely to affect their metabolome and may obscure the expected similarities between PD
patients or between healthy controls. For example, a difference in the metabolome would be
expected between PD patients receiving or not receiving a drug treatment. In fact, this
difference may mask any similarities in the metabolome due to the disease itself. Similar
issues arise if the PD patients have a variety of disease etiology or are at different stages of
disease progression. The situation becomes even more complex when participants vary in
Lei and Powers Page 16
Curr Metabolomics. Author manuscript; available in PMC 2015 June 13.
Author M
anuscriptA
uthor Manuscript
Author M
anuscriptA
uthor Manuscript

sex, age, diet, lifestyle behavior, and comorbidity, to name just a few possibilities. Again, all
these factors are likely to affect the metabolome and obscure any within group similarities.
As a result, it becomes difficult to find a common difference in the metabolome between PD
patients and healthy controls. In fact, any metabolite identified as a potential PD biomarker
may simply be a result of a coincidence or from another prominent demographic besides PD.
Thus, the inconsistency in the observed PD metabolite biomarkers (PCA, PLS, and OPLS) is
not unexpected given the diversity in the patient demographics (Table 2).
3.3 Potential solutions and future directions
Validating and optimizing the experimental protocol is fundamental to a reliable
metabolomics study [88, 133, 140-155, 161]. This is achieved by eliminating or minimizing
all factors that cause undesirable changes in metabolite concentrations. In practice, this may
be challenging, but general goals include minimizing the number of experimental steps and
limiting sample handling, making the process as fast as possible, keeping the sample cold or
frozen at all times, and analyzing the samples as soon as feasible.
The possibility that various analytical techniques may yield different outcomes for a
metabolomics study can be turned into strength. As highlighted above, analytical techniques
have different limitations and advantages, in essence, the techniques should be viewed as
complementary to each other. Thus, a current trend in metabolomics is the integration of
multiple techniques in a metabolomics study [122-124].
PD is a heterogeneous disease and the analysis of the metabolome to identify potential
biomarkers requires a focused approach. Correctly addressing this challenge requires
controlling or eliminating all patient variables besides the specific disease state. Ideally, all
the PD patients should have the same etiology and stage of PD, and are not receiving any
drug treatment. The participants should be the same age, sex, and equally healthy. Diet
should be strictly controlled and alcohol consumption, smoking, and other medications
should be eliminated. In effect, the only difference in the metabolome between the control
and PD group should result from PD. Of course, this scenario could be very challenging to
achieve in practice.
Also, observing a change in a metabolite between a control and PD group does not
necessarily infer the discovery of a PD biomarker. The potential PD biomarkers need to be
validated. One valuable approach is to simply repeat the study with a second group of
participants and confirm the identification of the same set of metabolites. For the majority of
the PD studies reported here, the number of participants in each class (healthy vs. PD) is too
small (< 80) for statistical significance (α 0.05, power 90%), especially given the presence
of other variables [225]. Also, a number of the models generated from supervised
multivariate analysis were not validated [92, 179]. Similarly, the statistical significance of
the defined group clusters in the PCA, PLS and OPLS scores plot are generally not
evaluated [176, 226]. These are common occurrences in metabolomics studies, and are not
unique to the PD field. Thus, the metabolomics community needs to adopt standard
protocols for reporting the statistical validation of metabolomics data that also needs to be
enforced by publishers [227]. The lack of validation in the PD studies reported herein does
not necessarily negate the value of the individual outcomes, but it does raise a serious
Lei and Powers Page 17
Curr Metabolomics. Author manuscript; available in PMC 2015 June 13.
Author M
anuscriptA
uthor Manuscript
Author M
anuscriptA
uthor Manuscript

concern especially given the observed inconsistencies between the various PD metabolomic
studies. Additionally, the significance of a change in a specific metabolite and its
relationship to PD needs to be statistically verified [227, 228]. If a set of metabolites are
proposed as a potential diagnostic test for PD, the statistical significance of the metabolite
set also needs to be adjusted for multiple comparisons using the Benjamini-Hochberg,
Bonferroni, Holm, or other similar methods [229, 230]. The observed metabolite biomarkers
may not be unique to PD and may be associated with other CNS diseases, an immune
response or some other comorbidity. Thus, the inclusion of multiple control groups,
emphasizing a global analysis of the metabolome, increasing the number of participants,
validating the multivariate models, and repeat studies using a second study group are all
critical to a successful outcome from a PD metabolomics study. Metabolomics is still a
relatively new field of study and, as a result, experimental protocols are still being
developed and optimized. Correspondingly, the application and impact of metabolomics on
PD has been limited to date. Nevertheless, as the methodology continues to evolve and
improve, metabolomics has the potential of making significant contributions to PD research.
Acknowledgments
This work was supported in part by funds from the Nebraska Research Council and the National Institutes of Health (P20 RR017675 and P30 GM103335). The research was performed in facilities renovated with support from the National Institutes of Health (NIH, RR015468-01).
References
1. Thomas B, Beal M. Parkinson's disease. Human molecular genetics. 2007; 16(Spec No. 2):94.
2. Cookson M. The biochemistry of Parkinson's disease. Annual review of biochemistry. 2005; 74:29–52.
3. Moore D, West A, Dawson V, Dawson T. Molecular pathophysiology of Parkinson's disease. Annual review of neuroscience. 2005; 28:57–87.
4. Dorsey E, Constantinescu R, Thompson J, Biglan K, Holloway R, Kieburtz K, Marshall F, Ravina B, Schifitto G, Siderowf A, Tanner C. Projected number of people with Parkinson disease in the most populous nations, 2005 through 2030. Neurology. 2007; 68(5):384–386. [PubMed: 17082464]
5. Collier TJ, Kanaan NM, Kordower JH. Ageing as a primary risk factor for Parkinson's disease: evidence from studies of non-human primates. Nat Rev Neurosci. 2011; 12(6):359–366. [PubMed: 21587290]
6. Wright WA, Evanoff BA, Lian M, Criswell SR, Racette BA. Geographic and ethnic variation in Parkinson disease: a population-based study of US Medicare beneficiaries. Neuroepidemiology. 2010; 34(3):143–151. [PubMed: 20090375]
7. Chen JJ. Parkinson's disease: health-related quality of life, economic cost, and implications of early treatment. Am J Manag Care. 2010; 16 Suppl Implications:S87–93. [PubMed: 20297871]
8. Nagy C, Bernard M, Hodes R. National Institute on Aging at middle age--its past, present, and future. Journal of the American Geriatrics Society. 2012; 60(6):1165–1169. [PubMed: 22646926]
9. Coelho M, Ferreira JJ. Late-stage Parkinson disease. Nat Rev Neurol. 2012; 8:435–442. [PubMed: 22777251]
10. Fearnley J, Lees A. Ageing and Parkinson's disease: substantia nigra regional selectivity. Brain. 1991; 114(Pt 5):2283–2301. [PubMed: 1933245]
11. Bernheimer H, Birkmayer W, Hornykiewicz O, Jellinger K, Seitelberger F. Brain dopamine and the syndromes of Parkinson and Huntington. Clinical, morphological and neurochemical correlations. Journal of the neurological sciences. 1973; 20(4):415–455. [PubMed: 4272516]
12. Tolosa E, Wenning G, Poewe W. The diagnosis of Parkinson's disease. Lancet neurology. 2006; 5(1):75–86.
Lei and Powers Page 18
Curr Metabolomics. Author manuscript; available in PMC 2015 June 13.
Author M
anuscriptA
uthor Manuscript
Author M
anuscriptA
uthor Manuscript

13. Agarwal P, Stoessl A. Biomarkers for trials of neuroprotection in Parkinson's disease. Movement disorders : official journal of the Movement Disorder Society. 2013; 28(1):71–85. [PubMed: 22927101]
14. Savitt JM, Dawson VL, Dawson TM. Diagnosis and treatment of parkinson disease: molecules to medicine. J Clin Invest. 2006; 116(7):1744–1754. [PubMed: 16823471]
15. Seeman P, Van Tol HHM. Dopamine receptor pharmacology. Trends Pharmacol Sci. 1994; 15:264–270. [PubMed: 7940991]
16. Samii A, Nutt JG, Ransom BR. Parkinson's disease. Lancet. 2004; 363(9423):1783–1793. [PubMed: 15172778]
17. Dunnett SB, Björklund A. Prospects for new restorative and neuroprotective treatments in Parkinson's disease. Nature. 1999; 399:A32–A39. [PubMed: 10392578]
18. Mercuri NB, Bernardi G. The ‘magic’ of L-dopa: why is it the gold standard Parkinson's disease therapy? Trends Pharmacol Sci. 2005; 26(7):341–344. [PubMed: 15936832]
19. Shults C. Lewy bodies. Proceedings of the National Academy of Sciences of the United States of America. 2006; 103(6):1661–1668. [PubMed: 16449387]
20. Okazaki H, Lipkin L, Aronson S. Diffuse intracytoplasmic ganglionic inclusions (Lewy type) associated with progressive dementia and quadriparesis in flexion. Journal of neuropathology and experimental neurology. 1961; 20:237–244. [PubMed: 13730588]
21. Iwatsubo T. Pathological biochemistry of alpha-synucleinopathy. Neuropathology : official journal of the Japanese Society of Neuropathology. 2007; 27(5):474–478. [PubMed: 18018483]
22. Goedert M, Spillantini MG, Del TK, Braak H. 100 years of Lewy pathology. Nat Rev Neurol. 2013; 9(1):13–24. [PubMed: 23183883]
23. Breydo L, Wu JW, Uversky VN. α-Synuclein misfolding and Parkinson's disease. Biochim Biophys Acta, Mol Basis Dis. 2012; 1822(2):261–285.
24. Korlipara LVP, Schapira AHV. Parkinson's disease. Int Rev Neurobiol. 2002; 53:283–314. [PubMed: 12512344]
25. Pimentel C, Batista-Nascimento L, Rodrigues-Pousada C, Menezes RA. Oxidative stress in Alzheimer's and Parkinson's diseases: insights from the yeast Saccharomyces cerevisiae. Oxid Med Cell Longevity. 2012; 2012 Epub 132146.
26. Nakamura T, Lipton SA. Redox modulation by S-nitrosylation contributes to protein misfolding, mitochondrial dynamics, and neuronal synaptic damage in neurodegenerative diseases. Cell Death Differ. 2011; 18(9):1478–1486. [PubMed: 21597461]
27. Ross OA, Farrer MJ. Parkinson disease-moving beyond association. Nat Rev Neurol. 2010; 6(6):305–307. [PubMed: 20531431]
28. Factor SA, Sanchez-Ramos J, Weiner WJ. Trauma as an etiology of parkinsonism: a historical review of the concept. Mov Disord. 1988; 3(1):30–36. [PubMed: 3050470]
29. Kamel F, Hoppin JA. Association of pesticide exposure with neurologic dysfunction and disease. Environ Health Perspect. 2004; 112(9):950–958. [PubMed: 15198914]
30. Elbaz A, Tranchant C. Epidemiologic studies of environmental exposures in Parkinson's disease. J Neurol Sci. 2007; 262(1-2):37–44. [PubMed: 17673256]
31. Hatcher JM, Pennell KD, Miller GW. Parkinson's disease and pesticides: a toxicological perspective. Trends Pharmacol Sci. 2008; 29(6):322–329. [PubMed: 18453001]
32. Droździk M, Bialecka M, Myśliwiec K, Honczarenko K, Stankiewicz J, Sych Z. Polymorphism in the P-glycoprotein drug transporter MDR1 gene: a possible link between environmental and genetic factors in Parkinson's disease. Pharmacogenetics. 2003; 13(5):259–263. [PubMed: 12724617]
33. Tsuboi Y. Environmental-genetic interactions in the pathogenesis of Parkinson's disease. Experimental neurobiology. 2012; 21(3):123–128. [PubMed: 23055790]
34. Polymeropoulos M, Lavedan C, Leroy E, Ide S, Dehejia A, Dutra A, Pike B, Root H, Rubenstein J, Boyer R, Stenroos E, Chandrasekharappa S, Athanassiadou A, Papapetropoulos T, Johnson W, Lazzarini A, Duvoisin R, Di Iorio G, Golbe L, Nussbaum R. Mutation in the alpha-synuclein gene identified in families with Parkinson's disease. Science (New York, N Y). 1997; 276(5321):2045–2047.
Lei and Powers Page 19
Curr Metabolomics. Author manuscript; available in PMC 2015 June 13.
Author M
anuscriptA
uthor Manuscript
Author M
anuscriptA
uthor Manuscript

35. Zimprich A, Biskup S, Leitner P, Lichtner P, Farrer M, Lincoln S, Kachergus J, Hulihan M, Uitti R, Calne D, Stoessl A, Pfeiffer R, Patenge N, Carbajal I, Vieregge P, Asmus F, Müller-Myhsok B, Dickson D, Meitinger T, Strom T, Wszolek Z, Gasser T. Mutations in LRRK2 cause autosomal-dominant parkinsonism with pleomorphic pathology. Neuron. 2004; 44(4):601–607. [PubMed: 15541309]
36. Sriram SR, Li X, Ko HS, Chung KKK, Wong E, Lim KL, Dawson VL, Dawson TM. Familial-associated mutations differentially disrupt the solubility, localization, binding and ubiquitination properties of parkin. Hum Mol Genet. 2005; 14(17):2571–2586. [PubMed: 16049031]
37. Sidransky E, Nalls MA, Aasly JO, Aharon-Peretz J, Annesi G, Barbosa ER, Bar-Shira A, Berg D, Bras J, Brice A, Chen CM, Clark L, Condroyer C, De Marco E, Dürr A, Eblan M, Fahn S, Farrer M, Fung HC, Gan-Or Z, Gasser T, Gershoni-Baruch R, Giladi N, Griffith A, Gurevich T, Januario C, Kropp P, Lang A, Lee-Chen GJ, Lesage S, Marder K, Mata I, Mirelman A, Mitsui J, Mizuta I, Nicoletti G, Oliveira C, Ottman R, Orr-Urtreger A, Pereira L, Quattrone A, Rogaeva E, Rolfs A, Rosenbaum H, Rozenberg R, Samii A, Samaddar T, Schulte C, Sharma M, Singleton A, Spitz M, Tan EK, Tayebi N, Toda T, Troiano A, Tsuji S, Wittstock M, Wolfsberg T, Wu YR, Zabetian C, Zhao Y, Ziegler S. Multicenter analysis of glucocerebrosidase mutations in Parkinson's disease. The New England journal of medicine. 2009; 361(17):1651–1661. [PubMed: 19846850]
38. Whitworth AJ, Pallanck LJ. The PINK1/Parkin pathway: A mitochondrial quality control system? J Bioenerg Biomembr. 2009; 41(6):499–503. [PubMed: 19967438]
39. Cookson MR. Pathways to parkinsonism. Neuron. 2003; 37(1):7–10. [PubMed: 12526767]
40. Klein C, Westenberger A. Genetics of Parkinson's disease. Cold Spring Harbor Perspect Med. 2012; 2(1):a008888/008881–a008888/008815.
41. DePaolo J, Goker-Alpan O, Samaddar T, Lopez G, Sidransky E. The association between mutations in the lysosomal protein glucocerebrosidase and parkinsonism. Mov Disord. 2009; 24(11):1571–1578. [PubMed: 19425057]
42. Janda E, Isidoro C, Carresi C, Mollace V. Defective Autophagy in Parkinson's Disease: Role of Oxidative Stress. Mol Neurobiol. 2012; 46(3):639–661. [PubMed: 22899187]
43. Castro IP, Martins LM, Loh SHY. Mitochondrial Quality Control and Parkinson's Disease: A Pathway Unfolds. Mol Neurobiol. 2011; 43(2):80–86. [PubMed: 21120708]
44. Lehmann S, Martins LM. Insights into mitochondrial quality control pathways and Parkinson's disease. J Mol Med (Heidelberg, Ger). 2013; 91(6):665–671.
45. Papa S, Skulachev VP. Reactive oxygen species, mitochondria, apoptosis and aging. Mol Cell Biochem. 1997; 174(1&2):305–319. [PubMed: 9309704]
46. Desagher S, Martinou JC. Mitochondria as the central control point of apoptosis. Trends Cell Biol. 2000; 10(9):369–377. [PubMed: 10932094]
47. Valko M, Leibfritz D, Moncol J, Cronin MTD, Mazur M, Telser J. Free radicals and antioxidants in normal physiological functions and human disease. Int J Biochem Cell Biol. 2006; 39(1):44–84. [PubMed: 16978905]
48. Cotman, CW.; Peterson, C. Aging in the nervous system. In: Fleischer, S.; Packer, L., editors. Basic Neurochemistry. 4th. Academic Press; New York: 1989. p. 382-389.
49. Paulson OB. Blood-brain barrier, brain metabolism and cerebral blood flow. Eur Neuropsychopharmacol. 2002; 12(6):495–501. [PubMed: 12468012]
50. Mayhew JE. Neuroscience: a measured look at neuronal oxygen consumption. Science. 2003; 299:1023–1024. [PubMed: 12586929]
51. Ikonomidou C, Kaindl AM. Neuronal Death and Oxidative Stress in the Developing Brain. Antioxid Redox Signaling. 2011; 14(8):1535–1550.
52. Takahashi S, Takahashi I, Sato H, Kubota Y, Yoshida S, Muramatsu Y. Age-related changes in the concentrations of major and trace elements in the brain of rats and mice. Biological trace element research. 2001; 80(2):145–158. [PubMed: 11437180]
53. Cadenas E. Biochemistry of oxygen toxicity. Annual review of biochemistry. 1989; 58:79–110.
54. Skulachev V. Mitochondrial physiology and pathology; concepts of programmed death of organelles, cells and organisms. Molecular aspects of medicine. 1999; 20(3):139–184. [PubMed: 10626278]
Lei and Powers Page 20
Curr Metabolomics. Author manuscript; available in PMC 2015 June 13.
Author M
anuscriptA
uthor Manuscript
Author M
anuscriptA
uthor Manuscript
55. Büeler H. Impaired mitochondrial dynamics and function in the pathogenesis of Parkinson's disease. Exp Neurol. 2009; 218(2):235–246. [PubMed: 19303005]
56. Exner N, Lutz AK, Haass C, Winklhofer KF. Mitochondrial dysfunction in Parkinson's disease: molecular mechanisms and pathophysiological consequences. Embo J. 2012; 31(14):3038–3062. [PubMed: 22735187]
57. Wang X, Michaelis Elias K. Selective neuronal vulnerability to oxidative stress in the brain. Front Aging Neurosci. 2010; 2:12. [PubMed: 20552050]
58. Lau YS, Meredith GE. From drugs of abuse to Parkinsonism: The MPTP mouse model of Parkinson's disease. Methods Mol Med. 2003; 79:103–116. [PubMed: 12506692]
59. Saporito MS, Heikkila RE, Youngster SK, Nicklas WJ, Geller HM. Dopaminergic neurotoxicity of 1-methyl-4-phenylpyridinium analogs in cultured neurons: relationship to the dopamine uptake system and inhibition of mitochondrial respiration. J Pharmacol Exp Ther. 1992; 260(3):1400–1409. [PubMed: 1312170]
60. Betarbet R, Sherer TB, MacKenzie G, Garcia-Osuna M, Panov AV, Greenamyre JT. Chronic systemic pesticide exposure reproduces features of Parkinson's disease. Nature neuroscience. 2000; 3(12):1301–1306.
61. Fornai F, Schlüter O, Lenzi P, Gesi M, Ruffoli R, Ferrucci M, Lazzeri G, Busceti CL, Pontarelli F, Battaglia G, Pellegrini A, Nicoletti F, Ruggieri S, Paparelli A, Südhof T. Parkinson-like syndrome induced by continuous MPTP infusion: convergent roles of the ubiquitin-proteasome system and alpha-synuclein. Proceedings of the National Academy of Sciences of the United States of America. 2005; 102(9):3413–3418. [PubMed: 15716361]
62. Schulz JB, Matthews RT, Klockgether T, Dichgans J, Beal MF. The role of mitochondrial dysfunction and neuronal nitric oxide in animal models of neurodegenerative diseases. Mol Cell Biochem. 1997; 174(1-2):193–197. [PubMed: 9309687]
63. Sherer T, Betarbet R, Testa C, Seo B, Richardson J, Kim J, Miller G, Yagi T, Matsuno-Yagi A, Greenamyre J. Mechanism of toxicity in rotenone models of Parkinson's disease. The Journal of neuroscience : the official journal of the Society for Neuroscience. 2003; 23(34):10756–10764. [PubMed: 14645467]
64. Schapira A, Cooper J, Dexter D, Jenner P, Clark J, Marsden C. Mitochondrial complex I deficiency in Parkinson's disease. Lancet. 1989; 1(8649):1269. [PubMed: 2566813]
65. Choi WS, Kruse S, Palmiter R, Xia Z. Mitochondrial complex I inhibition is not required for dopaminergic neuron death induced by rotenone, MPP+, or paraquat. Proceedings of the National Academy of Sciences of the United States of America. 2008; 105(39):15136–15141. [PubMed: 18812510]
66. Dawson TM. New animal models for Parkinson's disease. Cell. 2000; 101:115–118. [PubMed: 10786830]
67. Uversky VN. Neurotoxicant-induced animal models of Parkinson's disease: understanding the role of rotenone, maneb and paraquat in neurodegeneration. Cell Tissue Res. 2004; 318(1):225–241. [PubMed: 15258850]
68. Emborg ME. Evaluation of animal models of Parkinson's disease for neuroprotective strategies. J Neurosci Methods. 2004; 139(2):121–143. [PubMed: 15488225]
69. Ungerstedt U. 6-Hydroxy-dopamine induced degeneration of central monoamine neurons. European journal of pharmacology. 1968; 5(1):107–110. [PubMed: 5718510]
70. Beal M. Experimental models of Parkinson's disease. Nature reviews Neuroscience. 2001; 2(5):325–334.
71. Dauer W, Przedborski S. Parkinson's disease: mechanisms and models. Neuron. 2003; 39(6):889–909. [PubMed: 12971891]
72. Uversky VN, Li J, Fink AL. Pesticides directly accelerate the rate of alpha-synuclein fibril formation: a possible factor in Parkinson's disease. FEBS letters. 2001; 500(3):105–108. [PubMed: 11445065]
73. Sherer TB, Betarbet R, Stout AK, Lund S, Baptista M, Panov AV, Cookson MR, Greenamyre JT. An in vitro model of Parkinson's disease: linking mitochondrial impairment to altered alpha-synuclein metabolism and oxidative damage. The Journal of neuroscience : the official journal of the Society for Neuroscience. 2002; 22(16):7006–7015. [PubMed: 12177198]
Lei and Powers Page 21
Curr Metabolomics. Author manuscript; available in PMC 2015 June 13.
Author M
anuscriptA
uthor Manuscript
Author M
anuscriptA
uthor Manuscript

74. Cannon JR, Tapias V, Na HM, Honick AS, Drolet RE, Greenamyre JT. A highly reproducible rotenone model of Parkinson's disease. Neurobiology of disease. 2009; 34(2):279–290. [PubMed: 19385059]
75. Thomas B, Mandir AS, West N, Liu Y, Andrabi SA, Stirling W, Dawson VL, Dawson TM, Lee MK. Resistance to MPTP-neurotoxicity in α-synuclein knockout mice is complemented by human α-synuclein and associated with increased β-synuclein and Akt activation. PloS One. 2011; 6(1):e16706. [PubMed: 21304957]
76. Feany MB, Bender WW. A Drosophila model of Parkinson's disease. Nature. 2000; 404(6776):394–398. [PubMed: 10746727]
77. Wang D, Tang B, Zhao G, Pan Q, Xia K, Bodmer R, Zhang Z. Dispensable role of Drosophila ortholog of LRRK2 kinase activity in survival of dopaminergic neurons. Molecular neurodegeneration. 2008; 3:3. [PubMed: 18257932]
78. Li Y, Liu W, Oo TF, Wang L, Tang Y, Jackson-Lewis V, Zhou C, Geghman K, Bogdanov M, Przedborski S, Beal M, Burke R, Li C. Mutant LRRK2(R1441G) BAC transgenic mice recapitulate cardinal features of Parkinson's disease. Nature neuroscience. 2009; 12(7):826–828.
79. Staropoli JF, McDermott C, Martinat C, Schulman B, Demireva E, Abeliovich A. Parkin is a component of an SCF-like ubiquitin ligase complex and protects postmitotic neurons from kainate excitotoxicity. Neuron. 2003; 37(5):735–749. [PubMed: 12628165]
80. Moore DJ, Dawson TM. Value of genetic models in understanding the cause and mechanisms of Parkinson's disease. Current neurology and neuroscience reports. 2008; 8(4):288–296. [PubMed: 18590612]
81. Mitsumoto A, Nakagawa Y. DJ-1 is an indicator for endogenous reactive oxygen species elicited by endotoxin. Free radical research. 2001; 35(6):885–893. [PubMed: 11811539]
82. Liu Y, Fallon L, Lashuel HA, Liu Z, Lansbury PT. The UCH-L1 gene encodes two opposing enzymatic activities that affect alpha-synuclein degradation and Parkinson's disease susceptibility. Cell. 2002; 111(2):209–218. [PubMed: 12408865]
83. Gebregiworgis T, Powers R. Application of NMR Metabolomics to Search for Human Disease Biomarkers. Comb Chem High Throughput Screening. 2012; 15(8):595–610.
84. Zhang B, Powers R. Using NMR-based metabolomics to study the regulation of biofilm formation. Future Med Chem. 2012; 4(10):1273–1306. [PubMed: 22800371]
85. Powers R. NMR metabolomics and drug discovery. Magnetic Resonance in Chemistry. 2009; 47:S2–S11. [PubMed: 19504464]
86. Fiehn O. Metabolomics - the link between genotypes and phenotypes. Plant Mol Biol. 2002; 48(1-2):155–171. [PubMed: 11860207]
87. Nicholson JK, Lindon JC, Holmes E. “Metabonomics”: understanding the metabolic responses of living systems to pathophysiological stimuli via multivariate statistical analysis of biological NMR spectroscopic data. Xenobiotica. 1999; 29(11):1181–1189. [PubMed: 10598751]
88. Bando K, Kawahara R, Kunimatsu T, Sakai J, Kimura J, Funabashi H, Seki T, Bamba T, Fukusaki E. Influences of biofluid sample collection and handling procedures on GC-MS based metabolomic studies. J Biosci Bioeng. 2010; 110(4):491–499. [PubMed: 20547363]
89. Lauridsen M, Hansen SH, Jaroszewski JW, Cornett C. Human Urine as Test Material in 1H NMR-Based Metabonomics: Recommendations for Sample Preparation and Storage. Anal Chem. 2007; 79(3):1181–1186. [PubMed: 17263352]
90. Wilson ID, Plumb R, Granger J, Major H, Williams R, Lenz EM. HPLC-MS-based methods for the study of metabonomics. J Chromatogr, B: Anal Technol Biomed Life Sci. 2005; 817(1):67–76.
91. Ellis DI, Goodacre R. Metabolic fingerprinting in disease diagnosis: biomedical applications of infrared and Raman spectroscopy. Analyst. 2006; 131:875–885. [PubMed: 17028718]
92. Worley B, Powers R. Multivariate Analysis in Metabolomics. Current Metabolomics. 2013; 1(1):92–107.
93. Weckwerth W. Metabolomics in systems biology. Annu Rev Plant Biol. 2003; 54:669–689. [PubMed: 14503007]
94. Kell DB. Metabolomics and systems biology: making sense of the soup. Curr Opin Microbiol. 2004; 7(3):296–307. [PubMed: 15196499]
Lei and Powers Page 22
Curr Metabolomics. Author manuscript; available in PMC 2015 June 13.
Author M
anuscriptA
uthor Manuscript
Author M
anuscriptA
uthor Manuscript

95. Schmidt C. Metabolomics takes its place as latest up-and-coming “omic” science. Journal of the National Cancer Institute. 2004; 96(10):732–734. [PubMed: 15150298]
96. Tian J, Shi C, Gao P, Yuan K, Yang D, Lu X, Xu G. Phenotype differentiation of three E. coli strains by GC-FID and GC-MS based metabolomics. J Chromatogr, B: Anal Technol Biomed Life Sci. 2008; 871(2):220–226.
97. t'Kindt R, Scheltema RA, Jankevics A, Brunker K, Rijal S, Dujardin JC, Breitling R, Watson DG, Coombs GH, Decuypere S. Metabolomics to unveil and understand phenotypic diversity between pathogen populations. PLoS Neglected Trop Dis. 2010; 4(11):e904.
98. Cavill R, Kamburov A, Ellis JK, Athersuch TJ, Blagrove MSC, Herwig R, Ebbels TMD, Keun HC. Consensus-phenotype integration of transcriptomic and metabolomic data implies a role for metabolism in the chemosensitivity of tumour cells. PLoS Comput Biol. 2011; 7(3):e1001113. [PubMed: 21483477]
99. Halouska S, Fenton RJ, Barletta RG, Powers R. Predicting the in Vivo Mechanism of Action for Drug Leads Using NMR Metabolomics. ACS Chem Biol. 2012; 7(1):166–171. [PubMed: 22007661]
100. Wei R. Metabolomics and its practical value in pharmaceutical industry. Curr Drug Metab. 2011; 12(4):345–358. [PubMed: 21395528]
101. Stoop MP, Coulier L, Rosenling T, Shi S, Smolinska AM, Buydens L, Ampt K, Stingl C, Dane A, Muilwijk B, Luitwieler RL, Silievis SPAE, Hintzen RQ, Bischoff R, Wijmenga SS, Hankemeier T, van, G AJ, Luider TM. Quantitative proteomics and metabolomics analysis of normal human cerebrospinal fluid samples. Mol Cell Proteomics. 2010; 9(9):2063–2075. [PubMed: 20811074]
102. Le GG, Noor SO, Ridgway K, Scovell L, Jamieson C, Johnson IT, Colquhoun IJ, Kemsley EK, Narbad A. Metabolomics of Fecal Extracts Detects Altered Metabolic Activity of Gut Microbiota in Ulcerative Colitis and Irritable Bowel Syndrome. J Proteome Res. 2011; 10(9):4208–4218. [PubMed: 21761941]
103. Sugimoto M, Wong DT, Hirayama A, Soga T, Tomita M. Capillary electrophoresis mass spectrometry-based saliva metabolomics identified oral, breast and pancreatic cancer-specific profiles. Metabolomics. 2010; 6(1):78–95. [PubMed: 20300169]
104. Odunsi K, Wollman RM, Ambrosone CB, Hutson A, McCann SE, Tammela J, Geisler JP, Miller G, Sellers T, Cliby W, Qian F, Keitz B, Intengan M, Lele S, Alderfer JL. Detection of epithelial ovarian cancer using 1H-NMR-based metabonomics. Int J Cancer. 2005; 113(5):782–788. [PubMed: 15499633]
105. Gavaghan CL, Holmes E, Lenz E, Wilson ID, Nicholson JK. An NMR-based metabonomic approach to investigate the biochemical consequences of genetic strain differences: application to the C57BL10J and Alpk:ApfCD mouse. FEBS Lett. 2000; 484(3):169–174. [PubMed: 11078872]
106. Lewis GD, Asnani A, Gerszten RE. Application of metabolomics to cardiovascular biomarker and pathway discovery. J Am Coll Cardiol. 2008; 52(2):117–123. [PubMed: 18598890]
107. Griffin JL, Nicholls AW. Metabolomics as a functional genomic tool for understanding lipid dysfunction in diabetes, obesity and related disorders. Pharmacogenomics. 2006; 7(7):1095–1107. [PubMed: 17054419]
108. Spratlin JL, Serkova NJ, Eckhardt SG. Clinical Applications of Metabolomics in Oncology: A Review. Clin Cancer Res. 2009; 15(2):431–440. [PubMed: 19147747]
109. Barba I, Fernandez-Montesinos R, Garcia-Dorado D, Pozo D. Alzheimer's disease beyond the genomic era: nuclear magnetic resonance (NMR) spectroscopy-based metabolomics. J Cell Mol Med. 2008; 12(5A):1477–1485. [PubMed: 18554316]
110. Underwood BR, Broadhurst D, Dunn WB, Ellis DI, Michell AW, Vacher C, Mosedale DE, Kell DB, Barker RA, Grainger DJ, Rubinsztein DC. Huntington disease patients and transgenic mice have similar pro-catabolic serum metabolite profiles. Brain. 2006; 129(Pt 4):877–886. [PubMed: 16464959]
111. Rozen S, Cudkowicz ME, Bogdanov M, Matson WR, Kristal BS, Beecher C, Harrison S, Vouros P, Flarakos J, Vigneau-Callahan K, Matson TD, Newhall KM, Beal MF, Brown RH Jr, Kaddurah-Daouk R. Metabolomic analysis and signatures in motor neuron disease. Metabolomics. 2005; 1(2):101–108. [PubMed: 18820733]
Lei and Powers Page 23
Curr Metabolomics. Author manuscript; available in PMC 2015 June 13.
Author M
anuscriptA
uthor Manuscript
Author M
anuscriptA
uthor Manuscript
112. Tsang TM, Huang JTJ, Holmes E, Bahn S. Metabolic Profiling of Plasma from Discordant Schizophrenia Twins: Correlation between Lipid Signals and Global Functioning in Female Schizophrenia Patients. J Proteome Res. 2006; 5(4):756–760. [PubMed: 16602681]
113. Paige LA, Mitchell MW, Krishnan KRR, Kaddurah-Daouk R, Steffens DC. A preliminary metabolomic analysis of older adults with and without depression. Int J Geriatr Psychiatry. 2007; 22(5):418–423. [PubMed: 17048218]
114. Litvan I, Bhatia KP, Burn DJ, Goetz CG, Lang AE, McKeith I, Quinn N, Sethi KD, Shults C, Wenning GK. Movement Disorders Society Scientific Issues Committee report: SIC Task Force appraisal of clinical diagnostic criteria for Parkinsonian disorders. Mov Disord. 2003; 18(5):467–486. [PubMed: 12722160]
115. Poewe W, Wenning G. The differential diagnosis of Parkinson's disease. Eur J Neurol. 2002; 9 Suppl 3:23–30. [PubMed: 12464118]
116. Caudle WM, Bammler TK, Lin Y, Pan S, Zhang J. Using ‘omics’ to define pathogenesis and biomarkers of Parkinson's disease. Expert review of neurotherapeutics. 2010; 10(6):925–942. [PubMed: 20518609]
117. Fiehn O. Combining genomics, metabolome analysis, and biochemical modelling to understand metabolic networks. Comparative and functional genomics. 2001; 2(3):155–168. [PubMed: 18628911]
118. Förster J, Famili I, Fu P, Palsson B, Nielsen J. Genome-scale reconstruction of the Saccharomyces cerevisiae metabolic network. Genome research. 2003; 13(2):244–253. [PubMed: 12566402]
119. Shellie RA, Welthagen W, Zrostliková J, Spranger J, Ristow M, Fiehn O, Zimmermann R. Statistical methods for comparing comprehensive two-dimensional gas chromatography-time-of-flight mass spectrometry results: metabolomic analysis of mouse tissue extracts. Journal of chromatography A. 2005; 1086(1-2):83–90. [PubMed: 16130658]
120. Tolstikov VV, Lommen A, Nakanishi K, Tanaka N, Fiehn O. Monolithic silica-based capillary reversed-phase liquid chromatography/electrospray mass spectrometry for plant metabolomics. Analytical chemistry. 2003; 75(23):6737–6740. [PubMed: 14640754]
121. Shi H, Vigneau-Callahan KE, Matson W, Kristal BS. Attention to relative response across sequential electrodes improves quantitation of coulometric array. Analytical biochemistry. 2002; 302(2):239–245. [PubMed: 11878803]
122. Agnolet S, Jaroszewski JW, Verpoorte R, Staerk D. 1H NMR-based metabolomics combined with HPLC-PDA-MS-SPE-NMR for investigation of standardized Ginkgo biloba preparations. Metabolomics. 2010; 6(2):292–302. [PubMed: 20526353]
123. Sun B, Li L, Wu S, Zhang Q, Li H, Chen H, Li F, Dong F, Yan X. Metabolomic analysis of biofluids from rats treated with Aconitum alkaloids using nuclear magnetic resonance and gas chromatography/time-of-flight mass spectrometry. Anal Biochem. 2009; 395(2):125–133. [PubMed: 19683504]
124. Crockford DJ, Holmes E, Lindon JC, Plumb RS, Zirah S, Bruce SJ, Rainville P, Stumpf CL, Nicholson JK. Statistical Heterospectroscopy, an Approach to the Integrated Analysis of NMR and UPLC-MS Data Sets: Application in Metabonomic Toxicology Studies. Anal Chem. 2006; 78(2):363–371. [PubMed: 16408915]
125. Dalton T, Cegielski P, Akksilp S, Asencios L, Campos Caoili J, Cho SN, Erokhin VV, Ershova J, Gler MT, Kazennyy BY, Kim HJ, Kliiman K, Kurbatova E, Kvasnovsky C, Leimane V, van der Walt M, Via LE, Volchenkov GV, Yagui MA, Kang H, Akksilp R, Sitti W, Wattanaamornkiet W, Andreevskaya SN, Chernousova LN, Demikhova OV, Larionova EE, Smirnova TG, Vasilieva IA, Vorobyeva AV, Barry CE 3rd, Cai Y, Shamputa IC, Bayona J, Contreras C, Bonilla C, Jave O, Brand J, Lancaster J, Odendaal R, Chen MP, Diem L, Metchock B, Tan K, Taylor A, Wolfgang M, Cho E, Eum SY, Kwak HK, Lee J, Min S, Degtyareva I, Nemtsova ES, Khorosheva T, Kyryanova EV, Egos G, Perez MT, Tupasi T, Hwang SH, Kim CK, Kim SY, Lee HJ, Kuksa L, Norvaisha I, Skenders G, Sture I, Kummik T, Kuznetsova T, Somova T, Levina K, Pariona G, Yale G, Suarez C, Valencia E, Viiklepp P. Prevalence of and risk factors for resistance to second-line drugs in people with multidrug-resistant tuberculosis in eight countries: a prospective cohort study. Lancet. 2012; 380(9851):1406–1417. [PubMed: 22938757]
Lei and Powers Page 24
Curr Metabolomics. Author manuscript; available in PMC 2015 June 13.
Author M
anuscriptA
uthor Manuscript
Author M
anuscriptA
uthor Manuscript

126. Cao M, Zhao L, Chen H, Xue W, Lin D. NMR-based metabolomic analysis of human bladder cancer. Analytical sciences : the international journal of the Japan Society for Analytical Chemistry. 2012; 28(5):451–456. [PubMed: 22687923]
127. Duarte IF, Gil A. Metabolic signatures of cancer unveiled by NMR spectroscopy of human biofluids. Progress in nuclear magnetic resonance spectroscopy. 2012; 62:51–74. [PubMed: 22364616]
128. Wijeyesekera A, Selman C, Barton RH, Holmes E, Nicholson JK, Withers DJ. Metabotyping of long-lived mice using 1H NMR spectroscopy. Journal of proteome research. 2012; 11(4):2224–2235. [PubMed: 22225495]
129. Brindle JT, Antti H, Holmes E, Tranter G, Nicholson JK, Bethell HW, Clarke S, Schofield PM, McKilligin E, Mosedale DE, Grainger D. Rapid and noninvasive diagnosis of the presence and severity of coronary heart disease using 1H-NMR-based metabonomics. Nature medicine. 2002; 8(12):1439–1444.
130. Zhao Y, Fu L, Li R, Wang LN, Yang Y, Liu NN, Zhang CM, Wang Y, Liu P, Tu BB, Zhang X, Qiao J. Metabolic profiles characterizing different phenotypes of polycystic ovary syndrome: plasma metabolomics analysis. BMC medicine. 2012; 10(1):153. [PubMed: 23198915]
131. Vinaixa M, Rodriguez MA, Samino S, Díaz M, Beltran A, Mallol R, Bladé C, Ibañez L, Correig X, Yanes O. Metabolomics reveals reduction of metabolic oxidation in women with polycystic ovary syndrome after pioglitazone-flutamide-metformin polytherapy. PloS One. 2011; 6(12):e29052. [PubMed: 22194988]
132. Maher AD, Lindon JC, Nicholson JK. 1H NMR-based metabonomics for investigating diabetes. Future medicinal chemistry. 2009; 1(4):737–747. [PubMed: 21426036]
133. Beckonert O, Keun HC, Ebbels TMD, Bundy J, Holmes E, Lindon JC, Nicholson JK. Metabolic profiling, metabolomic and metabonomic procedures for NMR spectroscopy of urine, plasma, serum and tissue extracts. Nat Protoc. 2007; 2(11):2692–2703. [PubMed: 18007604]
134. Bollard ME, Stanley EG, Lindon JC, Nicholson JK, Holmes E. NMR-based metabonomic approaches for evaluating physiological influences on biofluid composition. NMR Biomed. 2005; 18(3):143–162. [PubMed: 15627238]
135. Lindon JC, Holmes E, Bollard ME, Stanley EG, Nicholson JK. Metabonomics technologies and their applications in physiological monitoring, drug safety assessment and disease diagnosis. Biomarkers. 2004; 9(1):1–31. [PubMed: 15204308]
136. Lindon JC, Nicholson JK, Holmes E, Everett JR. Metabonomics: metabolic processes studied by NMR spectroscopy of biofluids. Concepts Magn Reson. 2000; 12(5):289–320.
137. Moestue S, Sitter B, Bathen TF, Tessem MBB, Gribbestad IS. HR MAS MR spectroscopy in metabolic characterization of cancer. Current topics in medicinal chemistry. 2011; 11(1):2–26. [PubMed: 20809888]
138. Peskind E, Nordberg A, Darreh-Shori T, Soininen H. Safety of lumbar puncture procedures in patients with Alzheimer's disease. Curr Alzheimer Res. 2009; 6:290–292. [PubMed: 19519311]
139. Peskind ER, Riekse R, Quinn JF, Kaye J, Clark CM, Farlow MR, Decarli C, Chabal C, Vavrek D, Raskind MA, Galasko D. Safety and acceptability of the research lumbar puncture. Alzheimer Dis Assoc Disord. 2005; 19:220–225. [PubMed: 16327349]
140. Beloueche-Babari M, Jackson LE, Al-Saffar NMS, Eccles SA, Raynaud FI, Workman P, Leach MO, Ronen SM. Identification of magnetic resonance detectable metabolic changes associated with inhibition of phosphoinositide 3-kinase signaling in human breast cancer cells. Molecular cancer therapeutics. 2006; 5(1):187–196. [PubMed: 16432178]
141. Lane AN, Fan TWM. Quantification and identification of isotopomer distributions of metabolites in crude cell extracts using 1 H TOCSY. Metabolomics. 2007; 3(2):79–86.
142. Lin CY, Wu H, Tjeerdema RS, Viant MR. Evaluation of metabolite extraction strategies from tissue samples using NMR metabolomics. Metabolomics. 2007; 3(1):55–67.
143. León Z, García-Cañaveras JC, Donato MT, Lahoz A. Mammalian cell metabolomics: experimental design and sample preparation. Electrophoresis. 2013 accepted, ePub.
144. Sellick CA, Hansen R, Maqsood AR, Dunn WB, Stephens GM, Goodacre R, Dickson AJ. Effective Quenching Processes for Physiologically Valid Metabolite Profiling of Suspension Cultured Mammalian Cells. Anal Chem (Washington, DC, U S). 2009; 81(1):174–183.
Lei and Powers Page 25
Curr Metabolomics. Author manuscript; available in PMC 2015 June 13.
Author M
anuscriptA
uthor Manuscript
Author M
anuscriptA
uthor Manuscript

145. Sellick CA, Hansen R, Stephens GM, Goodacre R, Dickson AJ. Metabolite extraction from suspension-cultured mammalian cells for global metabolite profiling. Nat Protoc. 2011; 6(8):1241–1249. [PubMed: 21799492]
146. Van Gulik WM, Canelas AB, Taymaz-Nikerel H, Douma RD, de Jonge LP, Heijnen JJ. Fast sampling of the cellular metabolome. Methods Mol Biol (N Y, NY, U S). 2012; 881(Microbial Systems Biology):279–306.
147. Villas-Bôas SG, Hoejer-Pedersen J, Aakesson M, Smedsgaard J, Nielsen J. Global metabolite analysis of yeast: Evaluation of sample preparation methods. Yeast. 2005; 22(14):1155–1169. [PubMed: 16240456]
148. Sheedy JR, Ebeling PR, Gooley PR, McConville MJ. A sample preparation protocol for 1H nuclear magnetic resonance studies of water-soluble metabolites in blood and urine. Anal Biochem. 2010; 398(2):263–265. [PubMed: 19941831]
149. Dunn WB, Broadhurst D, Begley P, Zelena E, Francis-McIntyre S, Anderson N, Brown M, Knowles JD, Halsall A, Haselden JN, Nicholls AW, Wilson ID, Kell DB, Goodacre R. Procedures for large-scale metabolic profiling of serum and plasma using gas chromatography and liquid chromatography coupled to mass spectrometry. Nat Protoc. 2011; 6(7):1060–1083. [PubMed: 21720319]
150. Danielsson APH, Moritz T, Mulder H, Spégel P. Development and optimization of a metabolomic method for analysis of adherent cell cultures. Anal Biochem. 2010; 404(1):30–39. [PubMed: 20417172]
151. Dettmer K, Nürnberger N, Kaspar H, Gruber MA, Almstetter MF, Oefner PJ. Metabolite extraction from adherently growing mammalian cells for metabolomics studies: optimization of harvesting and extraction protocols. Anal Bioanal Chem. 2011; 399(3):1127–1139. [PubMed: 21125262]
152. Martineau E, Tea I, Loaëc G, Giraudeau P, Akoka S. Strategy for choosing extraction procedures for NMR-based metabolomic analysis of mammalian cells. Anal Bioanal Chem. 2011; 401(7):2133–2142. [PubMed: 21837464]
153. J A, Trygg J, Gullberg J, Johansson AI, Jonsson P, Antti H, Marklund SL, Moritz T. Extraction and GC/MS Analysis of the Human Blood Plasma Metabolome. Anal Chem. 2005; 77(24):8086–8094. [PubMed: 16351159]
154. Maher AD, Zirah SFM, Holmes E, Nicholson JK. Experimental and Analytical Variation in Human Urine in 1H NMR Spectroscopy-Based Metabolic Phenotyping Studies. Anal Chem (Washington, DC, U S). 2007; 79(14):5204–5211.
155. Zhang Q, Wang G, Du Y, Zhu L, J A. GC/MS analysis of the rat urine for metabonomic research. J Chromatogr, B: Anal Technol Biomed Life Sci. 2007; 854(1-2):20–25.
156. Otto M, Bowser R, Turner M, Berry J, Brettschneider J, Connor J, Costa J, Cudkowicz M, Glass J, Jahn O, Lehnert S, Malaspina A, Parnetti L, Petzold A, Shaw P, Sherman A, Steinacker P, Sussmuth S, Teunissen C, Tumani H, Wuolikainen A, Ludolph A. Roadmap and standard operating procedures for biobanking and discovery of neurochemical markers in ALS. Amyotroph Lateral Scler. 2012; 13(1):1–10. [PubMed: 22214350]
157. Teunissen CE, Iacobaeus E, Khademi M, Brundin L, Norgren N, Koel-Simmelink MJA, Schepens M, Bouwman F, Twaalfhoven HAM, Blom HJ, Jakobs C, Dijkstra CD. Combination of CSF N-acetylaspartate and neurofilaments in multiple sclerosis. Neurology. 2009; 72(15):1322–1329. [PubMed: 19365053]
158. Zhang B, Halouska S, Schiaffo C, Sadykov M, Somerville G, Powers R. NMR analysis of a stress response metabolic signaling network. Journal of proteome research. 2011; 10(8):3743–3754. [PubMed: 21692534]
159. Gebregiworgis T, Massilamany C, Gangaplara A, Thulasingam S, Kolli V, Werth MT, Dodds ED, Steffen D, Reddy J, Powers R. The Potential of Urinary Metabolites for Diagnosing Multiple Sclerosis. ACS Chem Biol. 2013; 8(4):684690.
160. Worley B, Halouska S, Powers R. Utilities for Quantifying Separation in PCA/PLSA-DA Scores. Anal Biochem. 2013; 433(2):102–104. [PubMed: 23079505]
Lei and Powers Page 26
Curr Metabolomics. Author manuscript; available in PMC 2015 June 13.
Author M
anuscriptA
uthor Manuscript
Author M
anuscriptA
uthor Manuscript

161. Álvarez-Sánchez B, Priego-Capote F, Luque de Castro MD. Metabolomics analysis I. Selection of biological samples and practical aspects preceding sample preparation. TrAC, Trends Anal Chem. 2010; 29(2):111–119.
162. Saude EJ, Sykes BD. Urine stability for metabolomic studies: effects of preparation and storage. Metabolomics. 2007; 3(1):19–27.
163. Teahan O, Gamble S, Holmes E, Waxman J, Nicholson JK, Bevan C, Keun HC. Impact of Analytical Bias in Metabonomic Studies of Human Blood Serum and Plasma. Anal Chem. 2006; 78(13):4307–4318. [PubMed: 16808437]
164. Quincy T, Wenlin H, Timothy WC, Drew RE, Chalet T. A direct cell quenching method for cell-culture based metabolomics. Metabolomics. 2009; 5(2):199–208.
165. Coen M, Holmes E, Lindon JC, Nicholson JK. NMR-Based Metabolic Profiling and Metabonomic Approaches to Problems in Molecular Toxicology. Chem Res Toxicol. 2008; 21(1):9–27. [PubMed: 18171018]
166. Dunn WB, Broadhurst DI, Atherton HJ, Goodacre R, Griffin JL. Systems level studies of mammalian metabolomes: the roles of mass spectrometry and nuclear magnetic resonance spectroscopy. Chem Soc Rev. 2011; 40(1):387–426. [PubMed: 20717559]
167. Griffin JL. Metabonomics: NMR spectroscopy and pattern recognition analysis of body fluids and tissues for characterisation of xenobiotic toxicity and disease diagnosis. Curr Opin Chem Biol. 2003; 7(5):648–654. [PubMed: 14580571]
168. Reo NV. NMR-based metabolomics. Drug Chem Toxicol. 2002; 25(4):375–382. [PubMed: 12378948]
169. Serkova NJ, Niemann CU. Pattern recognition and biomarker validation using quantitative 1H-NMR-based metabolomics. Expert Rev Mol Diagn. 2006; 6(5):717–731. [PubMed: 17009906]
170. Wishart DS. Quantitative metabolomics using NMR. TrAC, Trends Anal Chem. 2008; 27(3):228–237.
171. Mercier KA, Shortridge MD, Powers R. A multi-step NMR screen for the identification and evaluation of chemical leads for drug discovery. Comb Chem High Throughput Screening. 2009; 12(3):285–295.
172. Lindon JC, Holmes E, Nicholson JK. Pattern recognition methods and applications in biomedical magnetic resonance. Progress in Nuclear Magnetic Resonance Spectroscopy. 2001; 39(1):1–40.
173. Holmes E, Nicholson JK, Nicholls AW, Lindon JC, Connor SC, Polley S, Connelly J. The identification of novel biomarkers of renal toxicity using automatic data reduction techniques and PCA of proton NMR spectra of urine. Chemom Intell Lab Syst. 1998; 44(1-2):245–255.
174. Bylesjö M, Rantalainen M, Cloarec O, Nicholson JK, Holmes E, Trygg J. OPLS discriminant analysis: combining the strengths of PLS-DA and SIMCA classification. J Chemom. 2007; 20(8-10):341–351.
175. Wold S, Sjöström M, Eriksson L. PLS-regression: a basic tool of chemometrics. Chemom Intell Lab Syst. 2001; 58(2):109–130.
176. Worley B, Halouska S, Powers R. Utilities for quantifying separation in PCA/PLS-DA scores plots. Analytical biochemistry. 2013; 433(2):102–104. [PubMed: 23079505]
177. Brown M, Dunn WB, Ellis DI, Goodacre R, Handl J, Knowles JD, O'Hagan S, Spasić I, Kell DB. A metabolome pipeline: from concept to data to knowledge. Metabolomics. 2005; 1(1):39–51.
178. Kjeldahl K, Bro R. Some common misunderstandings in chemometrics. J Chemom. 2010; 24(7-8):558–564.
179. Westerhuis JA, Hoefsloot HCJ, Smit S, Vis DJ, Smilde AK, van Velzen EJJ, van Duijnhoven JPM, van Dorsten FA. Assessment of PLSDA cross validation. Metabolomics. 2008; 4:81–89.
180. Eriksson L, Trygg J, Wold S. CV-ANOVA for significance testing of PLS and OPLS models. J Chemom. 2008; 22(11-12):594–600.
181. Wiklund S, Johansson E, Sjoestroem L, Mellerowicz EJ, Edlund U, Shockcor JP, Gottfries J, Moritz T, Trygg J. Visualization of GC/TOF-MS-Based Metabolomics Data for Identification of Biochemically Interesting Compounds Using OPLS Class Models. Anal Chem. 2008; 80(1):115–122. [PubMed: 18027910]
Lei and Powers Page 27
Curr Metabolomics. Author manuscript; available in PMC 2015 June 13.
Author M
anuscriptA
uthor Manuscript
Author M
anuscriptA
uthor Manuscript

182. Goodacre R, Vaidyanathan S, Dunn WB, Harrigan GG, Kell DB. Metabolomics by numbers: acquiring and understanding global metabolite data. Trends Biotechnol. 2004; 22(5):245–252. [PubMed: 15109811]
183. Wongravee K, Lloyd GR, Silwood CJ, Grootveld M, Brereton RG. Supervised Self Organizing Maps for Classification and Determination of Potentially Discriminatory Variables: Illustrated by Application to Nuclear Magnetic Resonance Metabolomic Profiling. Anal Chem (Washington, DC, U S). 2010; 82(2):628–638.
184. Simula O, Kangas J. Process monitoring and visualization using self-organizing maps. Comput-Aided Chem Eng. 1995; 6(1):371–384.
185. Brereton, R. Chemometrics for Pattern Recognition. 1. John Wiley & Sons, Inc; 2009. p. 522
186. Xu Y, Zomer S, Brereton RG. Support vector machines: a recent method for classification in chemometrics. Crit Rev Anal Chem. 2006; 36(3-4):177–188.
187. Beckonert O, Bollard ME, Ebbels TMD, Keun HC, Antti H, Holmes E, Lindon JC, Nicholson JK. NMR-based metabonomic toxicity classification: hierarchical cluster analysis and k-nearest-neighbour approaches. Anal Chim Acta. 2003; 490(1-2):3–15.
188. Zhou, W.; Seoung Bum, K. In: Werner, R., editor. Automatic Alignment of High-Resolution NMR Spectra Using a Bayesian Estimation Approach; 18th International Conference on Pattern Recognition, 2006. ICPR 2006; Hong Kong, China. Hong Kong, China: IEEE Computer Society; 2006. p. 667-670.2006
189. Wu W, Daszykowski M, Walczak B, Sweatman BC, Connor SC, Haseldeo JN, Crowther DJ, Gill RW, Lutz MW. Peak alignment of urine NMR spectra using fuzzy warping. Journal of Chemical Information and Modeling. 2006; 46(2):863–875. [PubMed: 16563018]
190. Vu TN, Valkenborg D, Smets K, Verwaest KA, Dommisse R, Lemière F, Verschoren A, Goethals B, Laukens K. An integrated workflow for robust alignment and simplified quantitative analysis of NMR spectrometry data. BMC Bioinformatics. 2011; 12:405. [PubMed: 22014236]
191. Beneduci A, Chidichimo G, Dardo G, Pontoni G. Highly routinely reproducible alignment of H-1 NMR spectral peaks of metabolites in huge sets of urines. Analytica Chimica Acta. 2011; 685(2):186–195. [PubMed: 21168568]
192. Forshed J, Idborg H, Jacobsson SP. Evaluation of different techniques for data fusion of LC/MS and H-1-NMR. Chemometrics and Intelligent Laboratory Systems. 2007; 85(1):102–109.
193. Veselkov KA, Lindon JC, Ebbels TMD, Crockford D, Volynkin VV, Holmes E, Davies DB, Nicholson JK. Recursive Segment-Wise Peak Alignment of Biological 1H NMR Spectra for Improved Metabolic Biomarker Recovery. Anal Chem. 2009; 81(1):56–66. [PubMed: 19049366]
194. De Meyer T, Sinnaeve D, Van Gasse B, Tsiporkova E, Rietzschel ER, De Buyzere ML, Gillebert TC, Bekaert S, Martins JC, Van Criekinge W. NMR-Based Characterization of Metabolic Alterations in Hypertension Using an Adaptive, Intelligent Binning Algorithm. Anal Chem. 2008; 80(10):3783–3790. [PubMed: 18419139]
195. Anderson PE, Mahle DA, Doom TE, Reo NV, DelRaso NJ, Raymer ML. Dynamic adaptive binning: an improved quantification technique for NMR spectroscopic data. Metabolomics. 2011; 7(2):179–190.
196. Davis RA, Charlton AJ, Godward J, Jones SA, Harrison M, Wilson JC. Adaptive binning: An improved binning method for metabolomics data using the undecimated wavelet transform. Chemom Intell Lab Syst. 2007; 85(1):144–154.
197. Anderson PE, Reo NV, DelRaso NJ, Doom TE, Raymer ML. Gaussian binning: a new kernel-based method for processing NMR spectroscopic data for metabolomics. Metabolomics. 2008; 4(3):261–272.
198. Trygg J, Wold S. Orthogonal projections to latent structures (O-PLS). Journal of Chemometrics. 2002; 16(3):119–128.
199. Halouska S, Powers R. Negative impact of noise on the principal component analysis of NMR data. Journal of Magnetic Resonance. 2006; 178(1):88–95. [PubMed: 16198132]
200. Kohl SM, Klein MS, Hochrein J, Oefner PJ, Spang R, Gronwald W. State-of-the art data normalization methods improve NMR-based metabolomic analysis. Metabolomics. 2012; 8(Suppl. 1):146–160. [PubMed: 22593726]
Lei and Powers Page 28
Curr Metabolomics. Author manuscript; available in PMC 2015 June 13.
Author M
anuscriptA
uthor Manuscript
Author M
anuscriptA
uthor Manuscript

201. Craig A, Cloareo O, Holmes E, Nicholson JK, Lindon JC. Scaling and normalization effects in NMR spectroscopic metabonomic data sets. Analytical Chemistry. 2006; 78(7):2262–2267. [PubMed: 16579606]
202. Sysi-Aho M, Katajamaa M, Yetukuri L, Orešič M. Normalization method for metabolomics data using optimal selection of multiple internal standards. BMC Bioinformatics. 2007; 8:93. [PubMed: 17362505]
203. Sandusky P, Raftery D. Use of semiselective TOCSY and the pearson correlation for the metabonomic analysis of biofluid mixtures: application to urine. Analytical chemistry. 2005; 77(23):7717–7723. [PubMed: 16316181]
204. Sandusky P, Raftery D. Use of selective TOCSY NMR experiments for quantifying minor components in complex mixtures: application to the metabonomics of amino acids in honey. Analytical chemistry. 2005; 77(8):2455–2463. [PubMed: 15828781]
205. Cloarec O, Dumas MED, Craig A, Barton RH, Trygg J, Hudson J, Blancher C, Gauguier D, Lindon JC, Holmes EE, Nicholson J. Statistical total correlation spectroscopy: an exploratory approach for latent biomarker identification from metabolic 1H NMR data sets. Analytical chemistry. 2005; 77(5):1282–1289. [PubMed: 15732908]
206. Wei S, Zhang J, Liu L, Ye T, Gowda G, Tayyari F, Raftery D. Ratio analysis nuclear magnetic resonance spectroscopy for selective metabolite identification in complex samples. Analytical chemistry. 2011; 83(20):7616–7623. [PubMed: 21894988]
207. Ahmed S, Santosh W, Kumar S, Christlet HT. Metabolic profiling of Parkinson's disease: evidence of biomarker from gene expression analysis and rapid neural network detection. Journal of biomedical science. 2009; 16:63. [PubMed: 19594911]
208. Tohgi H, Abe T, Hashiguchi K, Takahashi S, Nozaki Y, Kikuchi T. A significant reduction of putative transmitter amino acids in cerebrospinal fluid of patients with Parkinson's disease and spinocerebellar degeneration. Neuroscience letters. 1991; 126(2):155–158. [PubMed: 1681472]
209. Jiménez-Jiménez F, Molina J, Vargas C, Gómez P, Navarro J, Benito-León J, Ortí-Pareja M, Gasalla T, Cisneros E, Arenas J. Neurotransmitter amino acids in cerebrospinal fluid of patients with Parkinson's disease. Journal of the neurological sciences. 1996; 141(1-2):39–44. [PubMed: 8880690]
210. Mally J, Szalai G, Stone TW. Changes in the concentration of amino acids in serum and cerebrospinal fluid of patients with Parkinson's disease. Journal of the neurological sciences. 1997; 151(2):159–162. [PubMed: 9349670]
211. Weisskopf M, O'Reilly E, Chen H, Schwarzschild MA, Ascherio A. Plasma urate and risk of Parkinson's disease. American journal of epidemiology. 2007; 166(5):561–567. [PubMed: 17584757]
212. Greene DA. Sorbitol, myo-inositol and sodium-potassium ATPase in diabetic peripheral nerve. Drugs. 1986; 32 Suppl 2:6–14. [PubMed: 3024950]
213. Clements RS Jr, DeJesus PV Jr, Winegrad AI. Raised plasma-myoinositol levels in uraemia and experimental neuropathy. Lancet. 1973; 1(7813):1137–1141. [PubMed: 4123536]
214. Clements RS Jr, Reynertson R. Myoinositol metabolism in diabetes mellitus. Effect of insulin treatment. Diabetes. 1977; 26(3):215–221. [PubMed: 838172]
215. Greene DA, Lattimer SA, Sima AAF. Are disturbances of sorbitol, phosphoinositide, and sodium-potassium-ATPase regulation involved in pathogenesis of diabetic neuropathy? Diabetes. 1988; 37(6):688–693. [PubMed: 2838351]
216. Bogdanov M, Matson WR, Wang L, Matson T, Saunders-Pullman R, Bressman SS, Beal MF. Metabolomic profiling to develop blood biomarkers for Parkinson's disease. Brain. 2008; 131(Pt 2):389–396. [PubMed: 18222993]
217. Johansen KK, Wang L, Aasly JO, White LR, Matson WR, Henchcliffe C, Beal MF, Bogdanov M. Metabolomic profiling in LRRK2-related Parkinson's disease. PloS One. 2009; 4(10):e7551. [PubMed: 19847307]
218. Michell AW, Mosedale D, Grainger DJ, Barker RA. Metabolomic analysis of urine and serum in Parkinson's disease. Metabolomics. 2008; 4(3):191–201.
Lei and Powers Page 29
Curr Metabolomics. Author manuscript; available in PMC 2015 June 13.
Author M
anuscriptA
uthor Manuscript
Author M
anuscriptA
uthor Manuscript

219. Sun J, Von Tungeln LS, Hines W, Beger RD. Identification of metabolite profiles of the catechol-O-methyl transferase inhibitor tolcapone in rat urine using LC/MS-based metabonomics analysis. J Chromatogr, B: Anal Technol Biomed Life Sci. 2009; 877:2557–2565.
220. Gao HC, Zhu H, Song CY, Lin L, Xiang Y, Yan ZH, Bai GH, Ye FQ, Li XK. Metabolic Changes Detected by Ex Vivo High Resolution 1H NMR Spectroscopy in the Striatum of 6-OHDA-Induced Parkinson's Rat. Mol Neurobiol. 2013; 47(1):123–130. [PubMed: 22936308]
221. Baykal AT, Jain MR, Li H. Aberrant regulation of choline metabolism by mitochondrial electron transport system inhibition in neuroblastoma cells. Metabolomics. 2008; 4(4):347–356. [PubMed: 19774105]
222. Jenkins BG, Koroshetz WJ, Beal MF, Rosen BR. Evidence for impairment of energy metabolism in vivo in Huntington's disease using localized 1H NMR spectroscopy. Neurology. 1993; 43(12):2689–2695. [PubMed: 8255479]
223. Elble R, Giacobini E, Higgins C. Choline levels are increased in cerebrospinal fluid of Alzheimer patients. Neurobiol Aging. 1989; 10(1):45–50. [PubMed: 2755556]
224. Copeland JC, Zehr LJ, Cerny RL, Powers R. The Applicability of Molecular Descriptors for Designing an Electrospray Ionization Mass Spectrometry Compatible Library for Drug Discovery. Combinatorial Chemistry & High Throughput Screening. 2012; 15(10):806–815. [PubMed: 22708878]
225. Hulley, SB.; Cummings, SR.; Browner, WS.; Grady, DG.; Newman, TB. Designing Clinical Research An Epidemiologic Approach. 3rd. Lippincott Williams and Wilkins; Philadelphia: 2007. p. 367
226. Werth MT, Halouska S, Shortridge MD, Zhang B, Powers R. Analysis of Metabolomic PCA Data using Tree Diagrams. Analytical Biochemistry. 2010; 399(1):56–63.
227. Goodacre R, Broadhurst D, Smilde AK, Kristal BS, Baker JD, Beger R, Bessant C, Connor S, Capuani G, Craig A, Ebbels T, Kell DB, Manetti C, Newton J, Paternostro G, Somorjai R, Sjostrom M, Trygg J, Wulfert F. Proposed minimum reporting standards for data analysis in metabolomics. Metabolomics. 2007; 3(4):231–241.
228. Broadhurst DI, Kell DB. Statistical strategies for avoiding false discoveries in metabolomics and related experiments. Metabolomics. 2006; 2(4):171–196.
229. Benjamini Y, Hochberg Y. Controlling the false discovery rate: a practical and powerful approach to multiple hypothesis testing. J R Stat Soc B. 1995; 57(1):289–300.
230. Aickin M, Gensler H. Adjusting for multiple testing when reporting research results: the Bonferroni vs Holm methods. Am J Public Health. 1996; 86(5):726–728. [PubMed: 8629727]
231. Mollenhauer B, Forstl H, Deuschl G, Storch A, Oertel W, Trenkwalder C. Lewy body and parkinsonian dementia: common, but often misdiagnosed conditions. Dtsch Arztebl Int. 2010; 107(39):684–691. [PubMed: 20963199]
Lei and Powers Page 30
Curr Metabolomics. Author manuscript; available in PMC 2015 June 13.
Author M
anuscriptA
uthor Manuscript
Author M
anuscriptA
uthor Manuscript
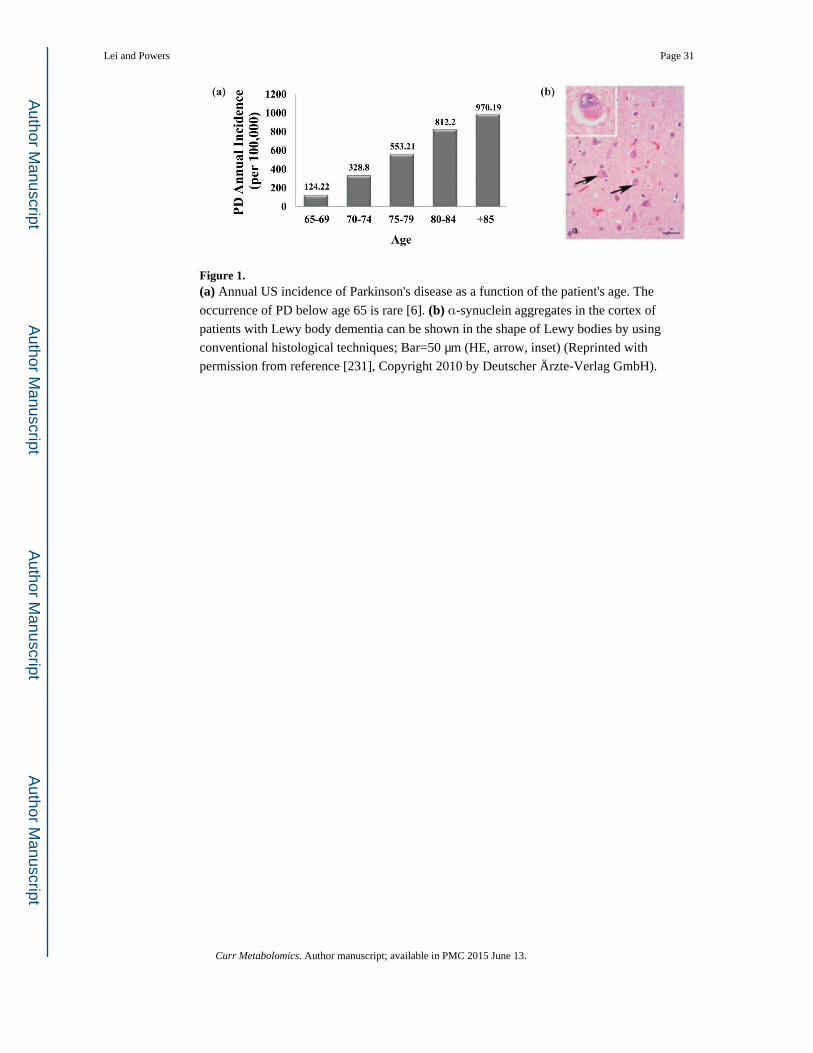
Figure 1. (a) Annual US incidence of Parkinson's disease as a function of the patient's age. The
occurrence of PD below age 65 is rare [6]. (b) α-synuclein aggregates in the cortex of
patients with Lewy body dementia can be shown in the shape of Lewy bodies by using
conventional histological techniques; Bar=50 μm (HE, arrow, inset) (Reprinted with
permission from reference [231], Copyright 2010 by Deutscher Ärzte-Verlag GmbH).
Lei and Powers Page 31
Curr Metabolomics. Author manuscript; available in PMC 2015 June 13.
Author M
anuscriptA
uthor Manuscript
Author M
anuscriptA
uthor Manuscript

Figure 2. Chemical structures of L-DOPA, a common treatment for Parkinson's disease, and toxins,
herbicides and pesticides known to selectively destroy dopamine neurons and induce
Parkinson's disease in animals.
Lei and Powers Page 32
Curr Metabolomics. Author manuscript; available in PMC 2015 June 13.
Author M
anuscriptA
uthor Manuscript
Author M
anuscriptA
uthor Manuscript

Figure 3. (a) Illustration of NMR-based metabolomics work flow with (b) select examples of
representative data and results [99, 158-160].
Lei and Powers Page 33
Curr Metabolomics. Author manuscript; available in PMC 2015 June 13.
Author M
anuscriptA
uthor Manuscript
Author M
anuscriptA
uthor Manuscript

Figure 4. Illustration of the principal component analysis of NMR spectra.
Lei and Powers Page 34
Curr Metabolomics. Author manuscript; available in PMC 2015 June 13.
Author M
anuscriptA
uthor Manuscript
Author M
anuscriptA
uthor Manuscript

Figure 5. (a) Heat map differentiation of metabolite. Average metabolite variability of blood plasma
between PD patients (n = 43) and healthy controls (n = 37) are shown. Cluster analyses of
the 22 differentially altered metabolites are selected based on significance P value (P <
0.05). The heat map depicts high (red) and low (green) relative levels of metabolite
variation. (b) Partial least square discriminant analysis. PLS scores plot showing a
significant separation between control subjects (n = 37) and unmedicated PD patients (n =
43) using complete digital maps. The observations coded according to class membership:
black square = controls; red square = PD patients. (Reprinted with permission from
reference [207], Copyright 2009 by BioMed Central Ltd.)
Lei and Powers Page 35
Curr Metabolomics. Author manuscript; available in PMC 2015 June 13.
Author M
anuscriptA
uthor Manuscript
Author M
anuscriptA
uthor Manuscript

Figure 6. The scores plot (a) from PCA analysis of the positive UPLC/MS data and (b) for negative
UPLC/MS data for animals after day 1 and day 28 post-dosing of vehicle only (control) and
200mg/kg tolcapone administration. (Reprinted with permission from reference [219],
Copyright 2009 by Elsevier).
Lei and Powers Page 36
Curr Metabolomics. Author manuscript; available in PMC 2015 June 13.
Author M
anuscriptA
uthor Manuscript
Author M
anuscriptA
uthor Manuscript

Author M
anuscriptA
uthor Manuscript
Author M
anuscriptA
uthor Manuscript
Lei and Powers Page 37
Tab
le 1
Sum
mar
y of
met
abol
ite c
hang
es f
rom
targ
eted
-met
abol
ite P
D s
tudi
es.a
CSF
Pla
sma
Met
abol
ites
Toh
gi e
t al.
[208
]Ji
mén
ez-J
imén
ez e
t al.
[209
]M
ally
et a
l. [2
10]
Jim
énez
-Jim
énez
et a
l. [2
09]
Mal
ly e
t al.
[210
]W
eiss
kopf
et a
l. [2
11]
alan
ine
-n.
t.↓
n.t.
-n.
t.
argi
nine
-n.
t.-
n.t.
↓n.
t.
aspa
ragi
ne-
--
↑-
n.t.
aspa
rtat
e↓↓
n.t.
n.t.
↓n.
t.n.
t.
GA
BA
↓↓↑
n.t.
-n.
t.n.
t.
glut
amat
e↓↓
-↓
--
n.t.
glut
amin
e-
-↑↑
↑-
n.t.
glyc
ine
↓-
-↑
-n.
t.
isol
euci
nen.
t.n.
t.↓
n.t.
-n.
t.
lysi
nen.
t.n.
t.↓
n.t.
-n.
t.
met
hion
ine
n.t.
n.t.
-n.
t.↓
n.t.
uric
aci
dn.
t.n.
t.n.
t.n.
t.n.
t.↓
valin
en.
t.n.
t.-
n.t.
↑n.
t.
a ↑ -
incr
ease
(P<
0.05
), ↑
↑ -
incr
ease
(P<
0.01
), ↓
-dec
reas
e (P
<0.
05),
↓↓-
dec
reas
e (P
<0.
01),
- n
o ch
ange
, n.t.
– n
ot ta
rget
ed.
Curr Metabolomics. Author manuscript; available in PMC 2015 June 13.

Author M
anuscriptA
uthor Manuscript
Author M
anuscriptA
uthor Manuscript
Lei and Powers Page 38
Tab
le 2
Sum
mar
y of
par
ticip
ants
in P
D m
etab
olom
ic s
tudi
es
Tar
gete
d St
udie
sU
ntar
gete
d St
udie
s
Toh
gi e
t al.
[202
]Ji
mén
ez-J
imén
ez
et a
l. [2
09]
Mal
ly e
t al.
[204
]W
eiss
kopf
et a
l.[21
1]A
hmed
et a
l. [2
07]
Bog
dano
v et
al.
[206
]Jo
hans
en e
t al.
[217
]M
iche
ll et
al.
[218
]
PD
Pat
ient
s
No.
PD
pat
ient
sa28
3110
8443
(15
,13,
15)
6653
(41
,12)
23
Gen
der
(Fem
ale/
Mal
e)b
n/a
20/1
13/
7n/
a6/
95/
67/
827
/39
16/2
57/
523
/0
Age
(ye
ars)
c59
.8 ±
8.9
60.1
± 8
.862
.6±
12.5
65.9
±63
71.5
58.2
±11
.760
.2±
11.2
55.7
±12
.166
.0±
11.1
64.8
61.1
68.6
±7.
2
PD
tre
atm
entd
L-D
OPA
(18
)va
riou
s (2
6)0
n/a
n/a
vari
ous
(51)
n/a
vari
ous
(15)
PD
Dur
atio
n (y
ears
)en/
a7.
0±6.
06.
6±1.
1n/
an/
a7.
1±4.
911
.2;1
1.7
2.77
Age
at
onse
tn/
a56
.6±
12.0
n/a
n/a
n/a
n/a
n/a
n/a
Hea
lthy
Con
trol
s
No.
Hea
lthy
Con
trol
sf22
4510
165
3725
1523
Gen
der
(Fem
ale/
Mal
e)g
n/a
27/1
87/
33/
7n/
a16
/21
17/8
7/8
n/a
Age
(ye
ars)
hn/
a57
.8 ±
15.
457
±10
55±
7n/
a58
.5±
11.8
61.5
±12
.266
.4n/
a
a For
the
Ahm
ed e
t al.
stud
y, th
e PD
pat
ient
s w
ere
divi
ded
into
thre
e di
ffer
ent g
roup
s co
rres
pond
ing
to P
D-S
tage
1, P
D-S
tage
-2 a
nd P
D-S
tage
3. T
he n
umbe
r of
par
ticip
ants
in e
ach
grou
p is
list
ed in
the
pare
nthe
sis
in th
at o
rder
. For
the
Joha
nsen
et a
l. st
udy,
the
PD p
atie
nts
wer
e di
vide
d in
to tw
o gr
oups
cor
resp
ondi
ng to
idio
path
ic P
D a
nd L
RR
K2
(PA
RK
8) P
D. T
he n
umbe
r of
par
ticip
ants
in e
ach
grou
p is
lis
ted
in th
e pa
rent
hesi
s in
that
ord
er.
b The
num
ber
of F
emal
e/M
ale
part
icip
ants
in e
ach
of th
e th
ree
grou
ps f
rom
the
Ahm
ed e
t al.
stud
y an
d th
e tw
o gr
oups
fro
m th
e Jo
hans
en e
t al.
stud
y ar
e lis
ted
in th
e sa
me
orde
r as
in th
e nu
mbe
r of
PD
pa
tient
s.
c For
the
Toh
gi e
t al.
stud
y, th
e ag
e di
stri
butio
n ar
e lis
ted
for
patie
nts
on P
D m
edic
atio
n an
d no
t on
PD m
edic
atio
ns, r
espe
ctfu
lly. T
he a
ge d
istr
ibut
ion
for
each
of
thre
e gr
oups
fro
m th
e A
hmed
et a
l. st
udy
and
the
two
grou
ps f
rom
the
Joha
nsen
et a
l. st
udy
are
liste
d in
the
sam
e or
der
as th
e nu
mbe
r of
PD
pat
ient
s.
d The
num
ber
of p
artic
ipan
ts r
ecei
ving
a P
D tr
eatm
ent i
s lis
ted
in p
aren
thes
is.
e The
PD
dur
atio
n fo
r th
e tw
o gr
oups
fro
m th
e Jo
hans
en e
t al.
stud
y ar
e lis
ted
in th
e sa
me
orde
r as
the
num
ber
of P
D p
atie
nts.
f The
hea
lthy
cont
rols
fro
m th
e W
eiss
kopf
et a
l. an
d M
iche
ll et
al.
stud
ies
are
mat
ched
cas
es.
Curr Metabolomics. Author manuscript; available in PMC 2015 June 13.

Author M
anuscriptA
uthor Manuscript
Author M
anuscriptA
uthor Manuscript
Lei and Powers Page 39g T
he n
umbe
r of
Fem
ale/
Mal
e pa
rtic
ipan
ts is
div
ided
into
two
clas
ses
for
the
Mal
ly e
t al.
stud
y ba
sed
on c
ontr
ibut
ions
of
plas
ma
or C
SF s
ampl
es, r
espe
ctfu
lly.
h The
age
dis
trib
utio
n of
the
part
icip
ants
fro
m th
e tw
o cl
asse
s fo
r th
e M
ally
et a
l. st
udy
base
d on
con
trib
utio
ns o
f pl
asm
a or
CSF
sam
ples
, res
pect
fully
.
Curr Metabolomics. Author manuscript; available in PMC 2015 June 13.