Embed Size (px)
Citation preview
1
Running head: N processing below a WWTP 1
Nitrogen processing and the role of epilithic biofilms downstream of a 2
wastewater treatment plant 3
Miquel Ribot1, Eugènia Martí2, Daniel von Schiller3, Francesc Sabater4, Holger Daims5, Tom J. 4
Battin6,7 5
6
1 Biogeodynamics and Biodiversity Group, Centre d’Estudis Avançats de Blanes, CSIC, Accés a la 7
Cala St. Francesc 14, 17300, Blanes, Spain. E-mail: [email protected]. Telf:+34972336101, 8
Fax:+34972337806 9
2 Biogeodynamics and Biodiversity Group, Centre d’Estudis Avançats de Blanes, CSIC, Accés a la 10
Cala St. Francesc 14, 17300, Blanes, Spain. E-mail: [email protected]. Telf:+34972336101, 11
Fax:+34972337806 12
3Catalan Institute for Water Research, Emili Grahit 101, Edifici H2O, Parc Científic i Tecnològic de 13
la Universitat de Girona, 17003, Girona, Spain.E-mail: [email protected]. Telf: +34972183380, 14
Fax:+34972183248 15
4 Department of Ecology, Faculty of Biology, University of Barcelona, Avinguda Diagonal 645, 08028 16
Barcelona, Spain. E-mail: [email protected]. Telf: +34934021516, Fax: +34934111438 17
5 Department of Microbial Ecology, Ecology Centre, University of Vienna, Althanstrasse 14, 1090 18
Vienna, Austria. E-mail: [email protected]. Telf.+431427754392, Fax:+431427754389 19
6 Department of Freshwater Ecology and Hydrobotany, University of Vienna, Althanstrasse 14, 1090 20
Vienna, Austria. E-mail: [email protected]. Telf:+431427757200, Fax:+431427757209 21
7 Interuniversity Center for Aquatic Ecosystem Research, WasserCluster Lunz, Dr. Carl Kupelwieser 22
Promenade, A-3293 Lunz am See, Austria. Telf: +43074862006030 23
24
2
Abstract 25
In this study, we investigated how dissolved inorganic nitrogen (DIN) inputs from a waste 26
water treatment plant (WWTP) effluent are biogeochemically processed by the receiving stream. We 27
examined longitudinal patterns of ammonium and nitrate concentrations and their 15N signatures along 28
a stream reach located downstream of a WWTP effluent. To determine the role of stream biofilms in N 29
processing, we compared the δ15N signatures of epilithic biofilms with those of DIN. We analyzed the 30
δ15N signatures of biofilms coating the light-side and the dark-side surfaces of cobbles separately to 31
test if light constrains may influence the functioning of biofilm communities. We sampled during two 32
contrasting periods of the year (winter and summer) to explore whether changes in environmental 33
conditions had an effect on N biogeochemical processes. Results indicated that the study reach had a 34
remarkable capacity for transformation and removal of DIN; however, the magnitude and relevance of 35
different biogeochemical pathways of N processing differed between seasons. In winter, assimilation 36
and nitrification influenced downstream N fluxes. These processes were spatially segregated at the 37
microhabitat scale, as indicated by a significant difference in the δ15N signature of light- and dark-side 38
biofilms, which suggested that nitrification was mostly associated with biofilms coating the dark-side 39
of cobbles. In summer, N processing was intensified and denitrification became an important N 40
removal pathway. The δ15N signature of the light- and dark-side biofilms was similar, suggesting a 41
lower spatial segregation of N cycling processes at this microhabitat scale. Collectively, results from 42
this study highlight the capacity of WWTP-influenced streams to transform and remove WWTP-43
derived N inputs and also indicate the active role of biofilms in these in-stream processes. 44
45
Key words: nitrogen, wastewater treatment plant, stream, biofilm, stable isotopes, nitrification, 46
denitrification 47
48
3
Introduction 49
Assimilation, nitrification and denitrification are the predominant biological processes that in-50
stream dissolved inorganic nitrogen (DIN) compounds undergo during downstream transport (Bernot 51
and Dodds 2005). Assimilation refers to biological nitrogen (N) removal from the water column 52
during biosynthetic processes (Kendall et al. 2007). Nitrification is the two-step pathway of oxidation 53
of ammonium (NH4+) to nitrate (NO3
-) via nitrite, which is mediated by several specialized 54
chemolithotrophic bacteria and archaea (Lin et al. 2009, Daims and Wagner 2010). Nitrification plays 55
an important role in reducing the effects of NH4+-rich waste water treatment plant (WWTP) effluents; 56
both by reducing high concentrations of NH4+ that are potentially lethal to resident biota, and by 57
converting NH4+ to NO3
-, which can further be removed from the stream via denitrification. The latter 58
process refers to the dissimilatory reduction of NO3- to gaseous products such as N2, N2O or NO and 59
usually occurs at low dissolved oxygen concentrations (Seitzinger 1988, Seitzinger et al. 2006, Lin et 60
al. 2009). These in-stream transformation and removal processes associated with DIN are largely 61
driven by microbial communities (hereafter referred to as biofilms) that develop on stream substrata 62
and hyporheic sediments (Pusch et al. 1998, Battin et al. 2003). 63
The ecological relevance of these in-stream N removal and transformation processes is well 64
documented for various pristine and impacted headwaters (Peterson et al. 2001, Mulholland et al. 65
2008, Beaulieu et al. 2011). Fewer studies have examined the importance of N removal and 66
transformation in recipient streams with high loads of N from WWTPs (Martí et al. 2010). WWTP 67
effluents constitute prominent sources of nutrients and microorganisms to recipient streams 68
(Montuelle et al. 1996, Brion and Billen 2000, Gray 2004). Ultimately, WWTP inputs can deteriorate 69
water quality and adversely affect both structure and function of the stream communities (Miltner and 70
Rankin 1998, Ra et al. 2007, Beyene et al. 2009). Nevertheless, nutrients from the WWTP may be 71
transformed and removed, at least in part, by biofilms in the recipient stream before reaching 72
downstream ecosystems and even coastal waters (Howarth et al. 1996, Alexander et al. 2000). Yet, the 73
characterization of these processes and the underlying mechanisms are not well understood. 74
4
Past research showed that WWTP-recipient streams have a high capacity for N assimilation, 75
nitrification, and denitrification (Marti et al. 2004, Haggard et al. 2005, Merseburger et al. 2005). In 76
these studies, net N uptake was derived from longitudinal changes in the concentration of DIN species, 77
a measure that integrates both removal and release processes along the stream. More recently, 78
longitudinal patterns of stable N isotopes have been used in conjunction with measured concentrations 79
of N compounds to assess processes that drive N cycling in WWTP-recipient streams (De Brabandere 80
et al. 2007, Lofton et al. 2007, Gammons et al. 2011). Nitrification, denitrification, and N assimilation 81
involve isotopic fractionation by preferentially using the lighter N isotope (i.e., 14N; Kendall et al. 82
2007). Ultimately, these processes modify the relative proportion of 15N of both the substrate and the 83
product, resulting in an enrichment or depletion of 15N relative to 14N. Therefore, 15N signatures are 84
good indicators of dominance of different biogeochemical processes associated with cycling of DIN. 85
In addition, 15N signatures in biofilms can help tracing distinct N sources. For instance, N sources, 86
mostly NH4+, from WWTPs tend to be highly enriched in 15N (i.e., high proportion of 15N to 14N) 87
compared to N from the recipient natural waters due to the preferential use of 14N during biological 88
wastewater treatment (Heaton 1986, Vivian 1986, Cabana and Rasmussen 1996). Together with 89
concentration measurements of the DIN compounds, this differential influence on the 15N signature 90
offers opportunities for tracing the fate of N from the WWTP effluent along the recipient stream. 91
Nitrification, as the previously reported dominant process in these type of streams (Merseburger et al. 92
2005), is expected to result in a decrease in NH4+ concentration coupled with an increase in NO3
- 93
concentration, with a concomitant increase in 15NH4+ and a decrease in 15NO3
- along the reach 94
(Gammons et al. 2011). In contrast, denitrification is expected to lead to a decrease in NO3- and DIN 95
concentrations, with a concomitant increase in 15NO3- along the reach, regardless of the concentration 96
and 15N signature of NH4+ (Lofton et al. 2007). In either scenario, a strong correlation between the 15N 97
signature of stream biofilms and the 15NH4+ in the water is expected, because NH4
+ is preferred over 98
NO3- as an N-source for assimilation (Dudley et al. 2001, Naldi and Wheeler 2002, Cohen and Fong 99
2004). 100
5
This study aimed to investigate the capacity of a recipient stream to process the inputs of DIN 101
from the WWTP effluent and the biogeochemical processes involved. We measured the longitudinal 102
patterns of ambient concentrations of DIN species in conjunction with the patterns of their 15N 103
signatures along a stream reach located downstream of a municipal WWTP input. In addition, we 104
assessed the role of benthic biofilms on in-stream N processing by comparing the longitudinal patterns 105
of the 15N signatures of biofilms to those of DIN. For this purpose, we sampled biofilms from the 106
upper part of cobbles exposed to light (hereafter referred to as light-side) and from the lower part of 107
cobbles not exposed to light (hereafter referred to as dark-side). The study was done under two 108
contrasting seasonal conditions to assess the effect of changes in environmental conditions on the 109
variability of longitudinal patterns. 110
111
Methods 112
Study site 113
The study site was located in the main course of La Tordera river, immediately downstream of the 114
WWTP outlet of the village of Santa Maria de Palautordera (41º 41’ 7’’N, 2º 27’ 33’’E; Catalonia, NE 115
Spain). This WWTP treats 11,747 population equivalents; where 1 population equivalent is the 116
biodegradable organic matter load corresponding to a biological oxygen demand (BOD5) of 60 g O2 117
day-1. The WWTP performs biological secondary treatment with activated sludge, but does not include 118
tertiary treatment for N and phosphorus removal. Discharge of the WWTP effluent is relatively 119
constant over the year (mean=27.4 L/s), but its contribution to the discharge of the receiving stream 120
depends on the stream hydrological conditions and can range from 3% to 100% (Merserburger et al. 121
2005). The WWTP effluent has a high concentration of DIN, but it can be highly variable among 122
seasons mainly due to changes in the biologic activity of the WWTP activated sludge (Merseburger et 123
al. 2006). Most DIN (>90%) in the WWTP effluent is in the form of NH4+ (Merseburger et al. 2005). 124
Eleven sampling sites were defined along a 850-m long reach located downstream of the WWTP 125
outlet with no lateral surface water inputs. These sites were used to examine net longitudinal changes 126
in nutrient concentrations and to characterize the 15N signature of NH4+ and NO3
- as well as that of the 127
6
biofilms. An additional sampling site upstream of the WWTP served as control to assess the impact of 128
the WWTP input. Channel morphology of the selected reach was characterized by a low sinuosity, a 129
run-riffle sequence with a few shallow pools, and a slope close to 1%. Streambed substrata were 130
dominated by cobbles (34%), pebbles (22%) and boulders (22%). We sampled in winter (February, 131
11th 2008) and summer (September, 9th 2008) to account for possible seasonal changes in WWTP 132
effects on the recipient stream. In winter, we did not sample the site located 25 m downstream of the 133
WWTP, because cross-sectional measurements of electrical conductivity indicated that at this site the 134
water coming from the WWTP effluent was not completely mixed with stream water discharge. In 135
summer, the stream was dry upstream of the WWTP input; and thus this site could not be sampled. 136
Field sampling 137
Surface water samples for the analysis of nutrient concentrations (3 replicates per site) and δ15N 138
signatures (1 replicate per site) were collected from the mid-channel area, filtered in the field through 139
precombusted Albet (Barcelona, Spain) FVF glass fiber filters (0.7μm pore size) into plastic 140
containers, stored on ice, and brought to the laboratory. Samples for 15NH4+ analysis were immediately 141
processed (see below). The samples for nutrient analyses and 15NO3- were stored frozen until further 142
processing. Electrical conductivity, water temperature, and dissolved oxygen concentration were 143
recorded in the field at each site with WTW (Weilheim, Germany) 340i portable sensors. 144
Composite samples for epilithic biofilm 15N-analysis were collected at each site from 3 randomly 145
selected cobbles by scraping and filtering the biomass onto precombusted and pre-weighted FVF glass 146
fiber filters. Samples were taken separately from the light- and the dark-side of the same cobbles, 147
stored on ice in the field and brought to the laboratory for further processing. 148
Stream discharge was calculated based on NaCl slug additions both, at the uppermost site 149
downstream of the WWTP input, and at the bottom of the study reach (Gordon et al. 1992). 150
Laboratory analyses 151
Stream water samples were analyzed for NO3-+ NO2
- and NH4+ concentrations following 152
standard colorimetric methods (APHA 1995) on a Bran+Luebbe (Nordersted, Germany) TRAACS 153
2000 Autoanalyzer. Concentration of NO3- is used hereafter to refer to the concentration of NO3
- + 154
7
NO2-, because NO2
- generally accounts for only 0.5% of DIN in our study stream (Merseburger 2006). 155
DIN concentration was calculated as the sum of NO3- and NH4
+ concentrations. 156
Water samples for stable isotope (i.e., 15NH4+
and 15NO3-) analyses were processed using the 157
ammonia diffusion technique (Sigman et al. 1997, Holmes et al. 1998). For 15NH4+, samples were 158
amended with 3 g/L of MgO and 50 g/L of NaCl and a Teflon filter packet containing an acidified 159
glass fiber to trap the diffusing NH3. For 15NO3-, dissolved NH4
+ was removed first by boiling the 160
samples with 3 g of MgO and 5 g of NaCl, followed by the reduction of NO3- to NH4
+ with Devarda’s 161
alloy. The remaining sample was then treated as for 15NH4+. A set of standards of known volume and 162
NH4+ concentration were diffused along with the water samples for volume-related fractionation 163
corrections. Biofilm samples for 15N signature were dried (60 ºC) and subsamples were weighted to 164
the nearest 0.001 mg on a Mettler-Toledo MX5 microbalance (Greifensee, Switzerland). All 15N 165
samples were encapsulated in tins and analyzed at the University of California Stable Isotope Facility 166
(Davis, California, USA). The N content (as a percent of dry mass) and the abundance of the heavier 167
isotope, expressed as the 14N:15N ratio compared to that of a standard (i.e., N2 from the atmosphere) 168
using the notation of δ15N in units of ‰, were measured by continuous flow isotope ratio mass 169
spectrometry (20–20 mass spectrometer; PDZEuropa, Northwich, UK) after sample combustion in an 170
on-line elemental analyzer (PDZEuropa ANCA-GSL). 171
Data analysis 172
We used the longitudinal patterns of ambient nutrient concentrations downstream of the 173
WWTP effluent input to estimate the net nutrient uptake length (SW-net) (Martí et al. 2004), in which 174
the net variation of nutrient concentration along the reach can be described as: 175 / [1] 176
where N1 and C1 are the nutrient concentration and electrical conductivity at the first site downstream 177
of the WWTP input, respectively; and Nx and Cx are the nutrient concentration and electrical 178
conductivity at the downstream site located x m downstream of site 1, respectively. Kc is the net 179
nutrient uptake coefficient per unit of reach length (m-1); and the negative inverse of Kc equals SW-net. 180
Positive values of SW-net indicate that the reach acts as a net nutrient sink (i.e. nutrient uptake > nutrient 181
8
release), whereas negative values of SW-net indicate that the reach acts as a net nutrient source (i.e. 182
nutrient uptake < nutrient release). Regardless of the sign, this metric indicates the efficiency at which 183
nutrients are either removed from or released to the water column. Longitudinal patterns in NH4+ or 184
NO3- concentrations along the reach, and thus the Kc values, were assumed to differ from zero when 185
the fit of ambient values with the Eq. 1 was significant (p<0.05; von Schiller et al. 2011). Longitudinal 186
patterns in δ15NH4+, δ15NO3
- and δ15N of the biofilm along the downstream reach were examined using 187
linear regression analysis. To assess the relevance of denitrification or nitrification along the reach, we 188
examined the correlation between the concentration of the different DIN species and their δ15N values 189
using Spearman rank correlations. To compare the δ15N values of the light- and dark- side biofilms 190
downstream of the WWTP, we used a Wilcoxon matched pair test. This test was also used to compare 191
biofilm δ15N values to those of the DIN species. Finally, we examined the relationship between δ15N 192
values of biofilm and of DIN species using Spearman rank correlations with data from both biofilm 193
types separately. Statistical analyses were done with the software PASW Statistics 18 (v18.0.0/SPSS 194
Inc). Statistical results were evaluated at the α=0.05 significance level. 195
196
Results 197
Influence of the WWTP effluent on stream physical and chemical parameters 198
The WWTP effluent modified physical and chemical parameters in the recipient stream, with 199
noticeable differences between both seasons (Table 1). In winter, the WWTP effluent accounted for 200
26% of downstream discharge. On this date, electrical conductivity, NH4+ and DIN concentrations 201
increased considerably downstream of the WWTP effluent, whereas comparably irrelevant changes in 202
water temperature and NO3- concentration were observed. In summer, the WWTP effluent accounted 203
for 100% of downstream discharge; and thus, completely determined downstream water chemistry. 204
Electrical conductivity and water temperature downstream of the WWTP were lower in winter 205
than in summer, whereas dissolved oxygen showed the opposite pattern. Concentration of DIN 206
downstream of the WWTP was higher in winter than in summer because DIN concentration in the 207
effluent was seven times higher in winter than in summer (mean±SE, 12.6±0.2 and 1.7±0.2 mg/L, 208
9
respectively). The NO3-: NH4
+ ratio was <1 on both dates. Values of δ15NH4+ downstream of the 209
WWTP were higher in summer than in winter, whereas values of δ15NO3- were similar between 210
sampling dates and lower than those of δ15NH4+. 211
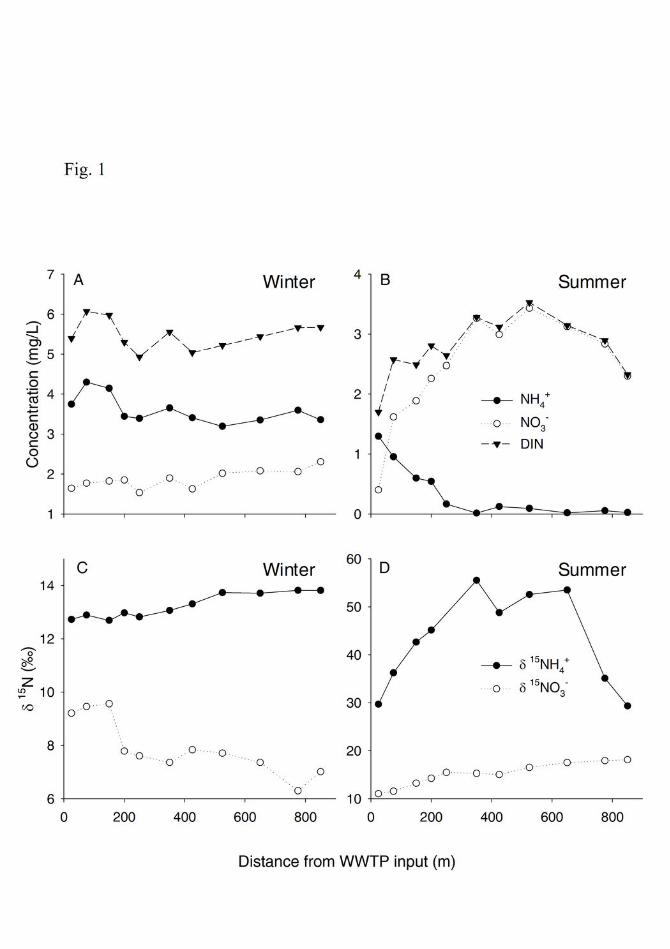
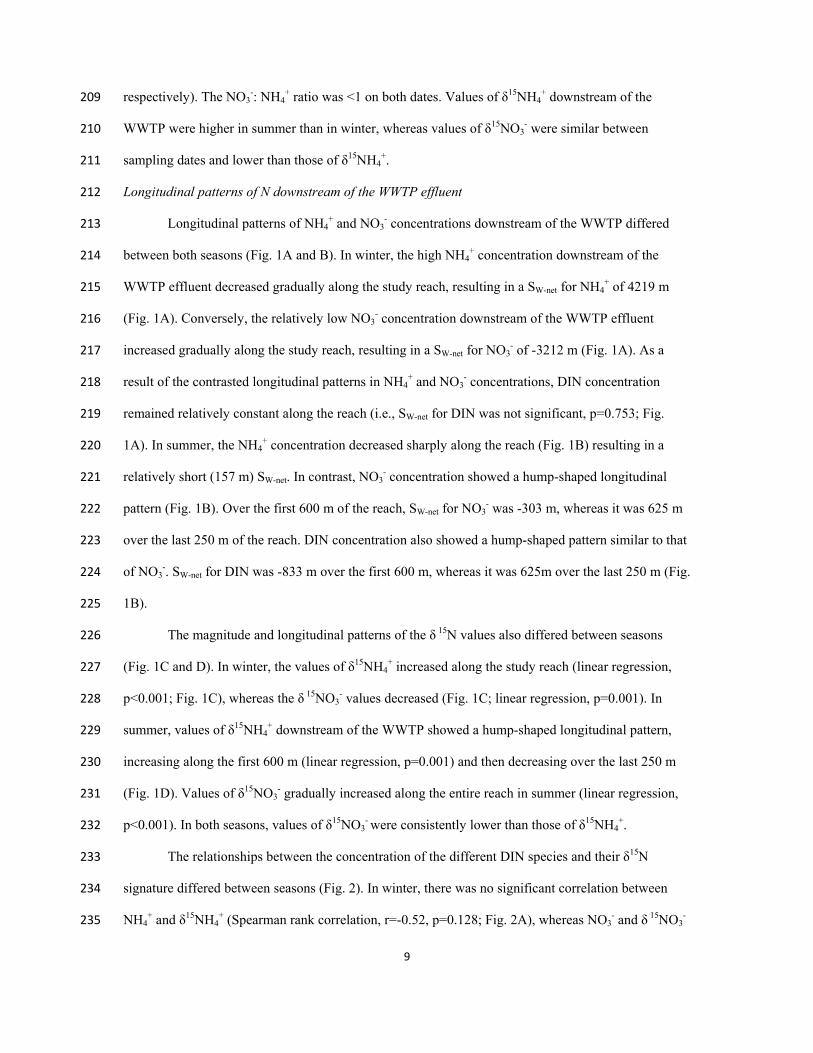
Longitudinal patterns of N downstream of the WWTP effluent 212
Longitudinal patterns of NH4+ and NO3
- concentrations downstream of the WWTP differed 213
between both seasons (Fig. 1A and B). In winter, the high NH4+ concentration downstream of the 214
WWTP effluent decreased gradually along the study reach, resulting in a SW-net for NH4+ of 4219 m 215
(Fig. 1A). Conversely, the relatively low NO3- concentration downstream of the WWTP effluent 216
increased gradually along the study reach, resulting in a SW-net for NO3- of -3212 m (Fig. 1A). As a 217
result of the contrasted longitudinal patterns in NH4+ and NO3
- concentrations, DIN concentration 218
remained relatively constant along the reach (i.e., SW-net for DIN was not significant, p=0.753; Fig. 219
1A). In summer, the NH4+ concentration decreased sharply along the reach (Fig. 1B) resulting in a 220
relatively short (157 m) SW-net. In contrast, NO3- concentration showed a hump-shaped longitudinal 221
pattern (Fig. 1B). Over the first 600 m of the reach, SW-net for NO3- was -303 m, whereas it was 625 m 222
over the last 250 m of the reach. DIN concentration also showed a hump-shaped pattern similar to that 223
of NO3-. SW-net for DIN was -833 m over the first 600 m, whereas it was 625m over the last 250 m (Fig. 224
1B). 225
The magnitude and longitudinal patterns of the δ 15N values also differed between seasons 226
(Fig. 1C and D). In winter, the values of δ15NH4+ increased along the study reach (linear regression, 227
p<0.001; Fig. 1C), whereas the δ 15NO3- values decreased (Fig. 1C; linear regression, p=0.001). In 228
summer, values of δ15NH4+ downstream of the WWTP showed a hump-shaped longitudinal pattern, 229
increasing along the first 600 m (linear regression, p=0.001) and then decreasing over the last 250 m 230
(Fig. 1D). Values of δ15NO3- gradually increased along the entire reach in summer (linear regression, 231
p<0.001). In both seasons, values of δ15NO3- were consistently lower than those of δ15NH4
+. 232
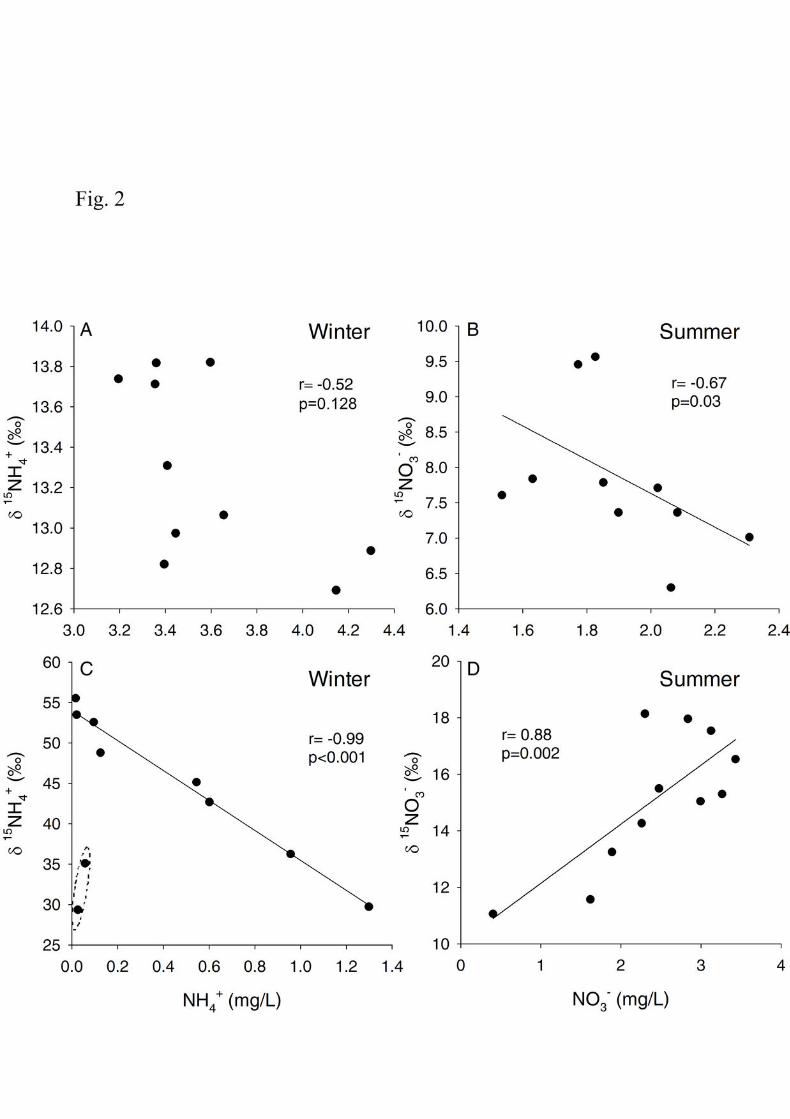
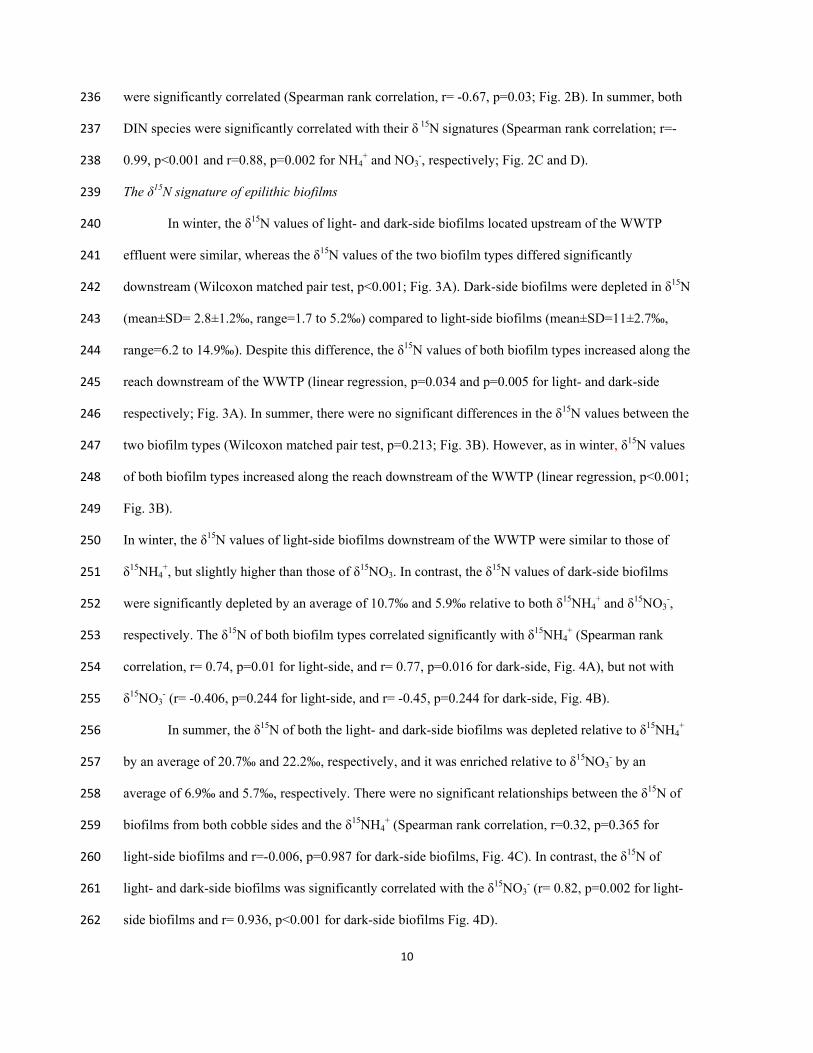
The relationships between the concentration of the different DIN species and their δ15N 233
signature differed between seasons (Fig. 2). In winter, there was no significant correlation between 234
NH4+ and δ15NH4
+ (Spearman rank correlation, r=-0.52, p=0.128; Fig. 2A), whereas NO3- and δ 15NO3
- 235
10
were significantly correlated (Spearman rank correlation, r= -0.67, p=0.03; Fig. 2B). In summer, both 236
DIN species were significantly correlated with their δ 15N signatures (Spearman rank correlation; r=-237
0.99, p<0.001 and r=0.88, p=0.002 for NH4+ and NO3
-, respectively; Fig. 2C and D). 238
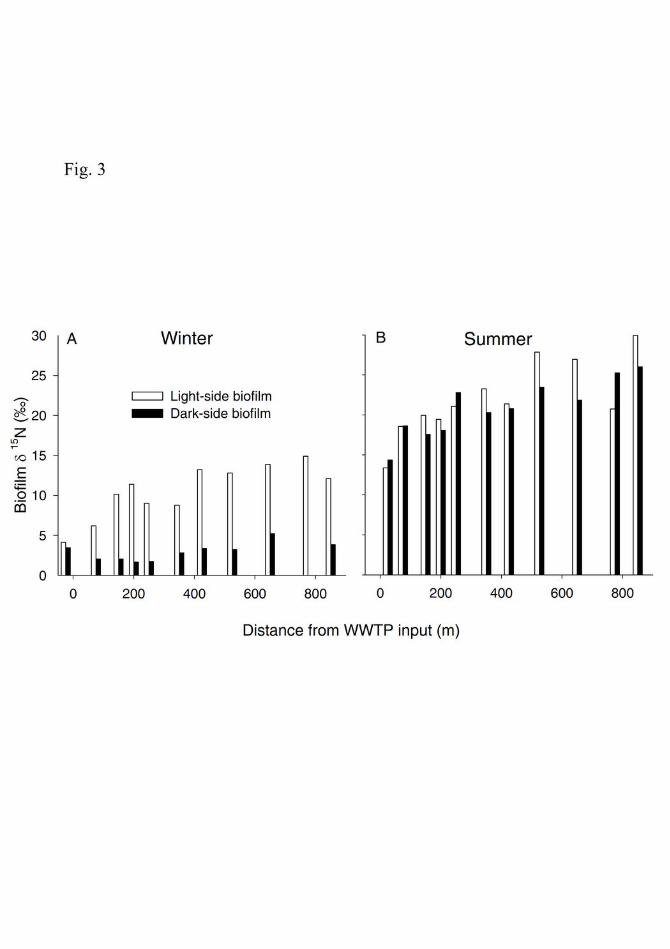
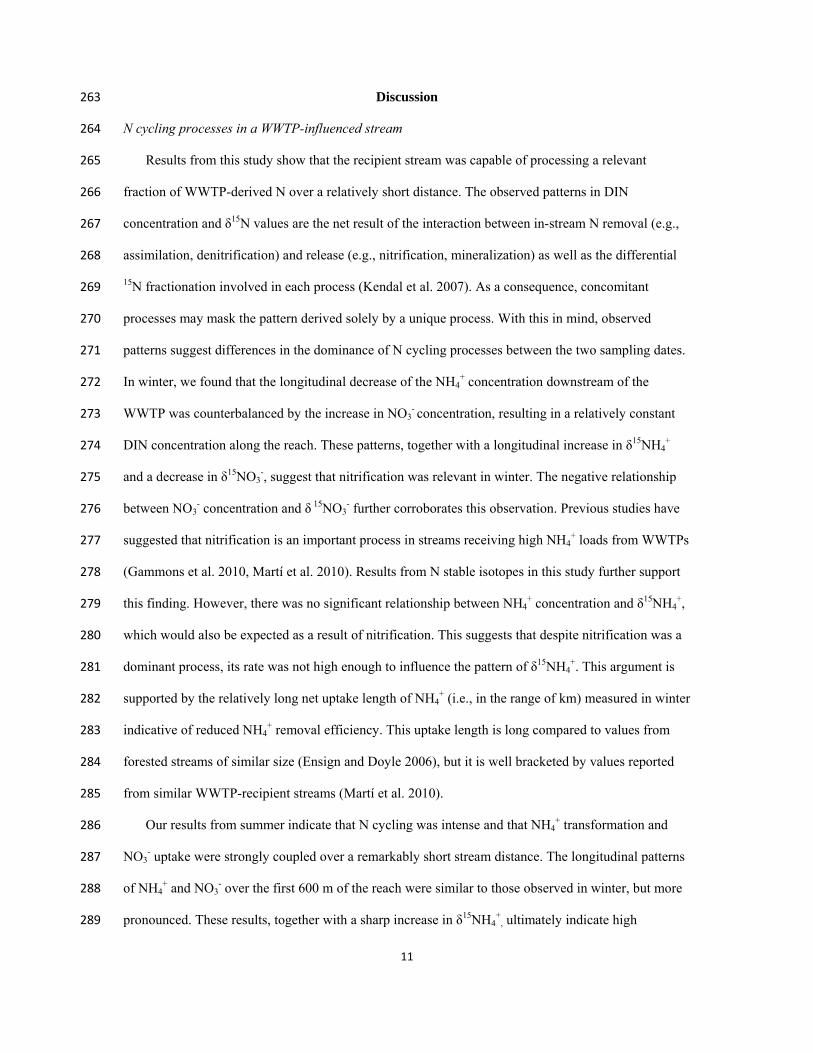
The δ15N signature of epilithic biofilms 239
In winter, the δ15N values of light- and dark-side biofilms located upstream of the WWTP 240
effluent were similar, whereas the δ15N values of the two biofilm types differed significantly 241
downstream (Wilcoxon matched pair test, p<0.001; Fig. 3A). Dark-side biofilms were depleted in δ15N 242
(mean±SD= 2.8±1.2‰, range=1.7 to 5.2‰) compared to light-side biofilms (mean±SD=11±2.7‰, 243
range=6.2 to 14.9‰). Despite this difference, the δ15N values of both biofilm types increased along the 244
reach downstream of the WWTP (linear regression, p=0.034 and p=0.005 for light- and dark-side 245
respectively; Fig. 3A). In summer, there were no significant differences in the δ15N values between the 246
two biofilm types (Wilcoxon matched pair test, p=0.213; Fig. 3B). However, as in winter, δ15N values 247
of both biofilm types increased along the reach downstream of the WWTP (linear regression, p<0.001; 248
Fig. 3B). 249
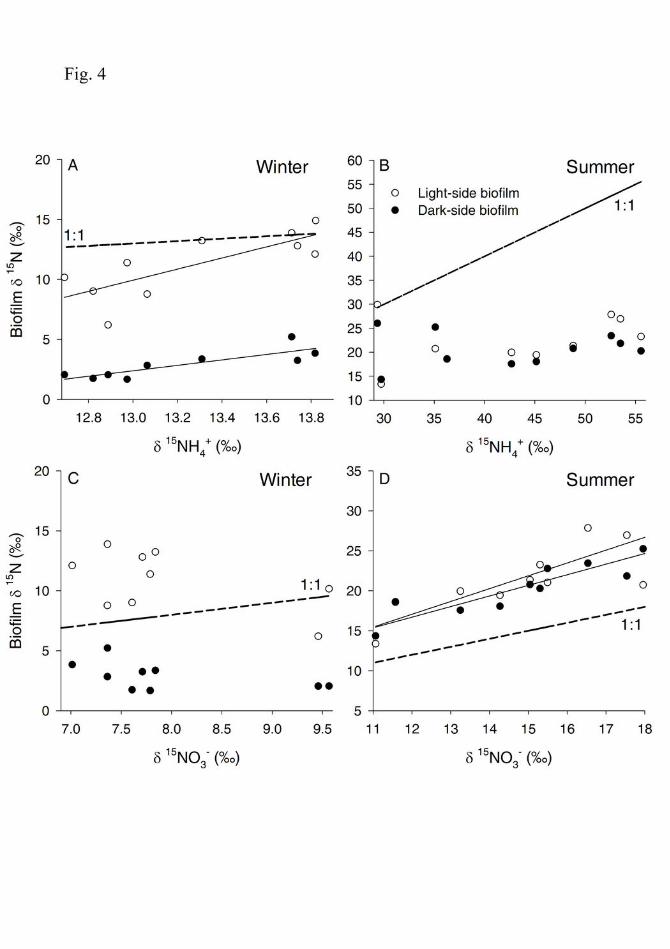
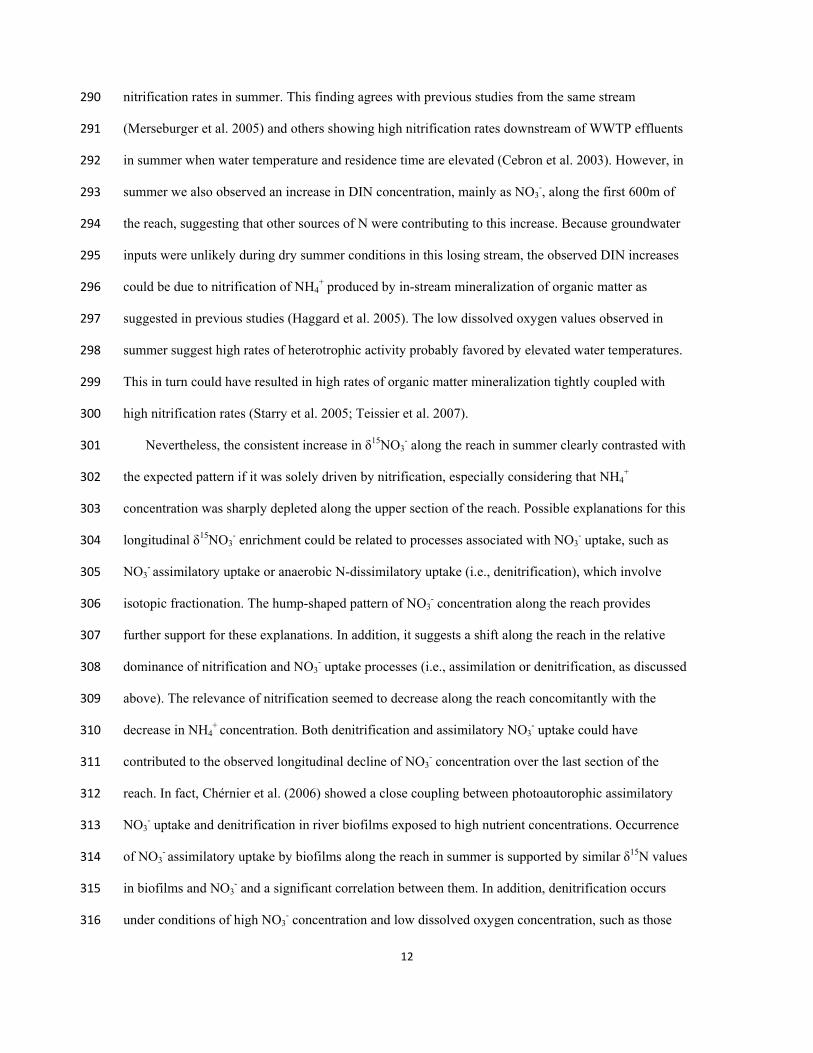
In winter, the δ15N values of light-side biofilms downstream of the WWTP were similar to those of 250
δ15NH4+, but slightly higher than those of δ15NO3. In contrast, the δ15N values of dark-side biofilms 251
were significantly depleted by an average of 10.7‰ and 5.9‰ relative to both δ15NH4+ and δ15NO3
-, 252
respectively. The δ15N of both biofilm types correlated significantly with δ15NH4+ (Spearman rank 253
correlation, r= 0.74, p=0.01 for light-side, and r= 0.77, p=0.016 for dark-side, Fig. 4A), but not with 254
δ15NO3- (r= -0.406, p=0.244 for light-side, and r= -0.45, p=0.244 for dark-side, Fig. 4B). 255
In summer, the δ15N of both the light- and dark-side biofilms was depleted relative to δ15NH4+ 256
by an average of 20.7‰ and 22.2‰, respectively, and it was enriched relative to δ15NO3- by an 257
average of 6.9‰ and 5.7‰, respectively. There were no significant relationships between the δ15N of 258
biofilms from both cobble sides and the δ15NH4+ (Spearman rank correlation, r=0.32, p=0.365 for 259
light-side biofilms and r=-0.006, p=0.987 for dark-side biofilms, Fig. 4C). In contrast, the δ15N of 260
light- and dark-side biofilms was significantly correlated with the δ15NO3- (r= 0.82, p=0.002 for light-261
side biofilms and r= 0.936, p<0.001 for dark-side biofilms Fig. 4D). 262
11
Discussion 263
N cycling processes in a WWTP-influenced stream 264
Results from this study show that the recipient stream was capable of processing a relevant 265
fraction of WWTP-derived N over a relatively short distance. The observed patterns in DIN 266
concentration and δ15N values are the net result of the interaction between in-stream N removal (e.g., 267
assimilation, denitrification) and release (e.g., nitrification, mineralization) as well as the differential 268
15N fractionation involved in each process (Kendal et al. 2007). As a consequence, concomitant 269
processes may mask the pattern derived solely by a unique process. With this in mind, observed 270
patterns suggest differences in the dominance of N cycling processes between the two sampling dates. 271
In winter, we found that the longitudinal decrease of the NH4+ concentration downstream of the 272
WWTP was counterbalanced by the increase in NO3- concentration, resulting in a relatively constant 273
DIN concentration along the reach. These patterns, together with a longitudinal increase in δ15NH4+ 274
and a decrease in δ15NO3-, suggest that nitrification was relevant in winter. The negative relationship 275
between NO3- concentration and δ 15NO3
- further corroborates this observation. Previous studies have 276
suggested that nitrification is an important process in streams receiving high NH4+ loads from WWTPs 277
(Gammons et al. 2010, Martí et al. 2010). Results from N stable isotopes in this study further support 278
this finding. However, there was no significant relationship between NH4+ concentration and δ15NH4
+, 279
which would also be expected as a result of nitrification. This suggests that despite nitrification was a 280
dominant process, its rate was not high enough to influence the pattern of δ15NH4+. This argument is 281
supported by the relatively long net uptake length of NH4+ (i.e., in the range of km) measured in winter 282
indicative of reduced NH4+ removal efficiency. This uptake length is long compared to values from 283
forested streams of similar size (Ensign and Doyle 2006), but it is well bracketed by values reported 284
from similar WWTP-recipient streams (Martí et al. 2010). 285
Our results from summer indicate that N cycling was intense and that NH4+ transformation and 286
NO3- uptake were strongly coupled over a remarkably short stream distance. The longitudinal patterns 287
of NH4+ and NO3
- over the first 600 m of the reach were similar to those observed in winter, but more 288
pronounced. These results, together with a sharp increase in δ15NH4+
, ultimately indicate high 289
12
nitrification rates in summer. This finding agrees with previous studies from the same stream 290
(Merseburger et al. 2005) and others showing high nitrification rates downstream of WWTP effluents 291
in summer when water temperature and residence time are elevated (Cebron et al. 2003). However, in 292
summer we also observed an increase in DIN concentration, mainly as NO3-, along the first 600m of 293
the reach, suggesting that other sources of N were contributing to this increase. Because groundwater 294
inputs were unlikely during dry summer conditions in this losing stream, the observed DIN increases 295
could be due to nitrification of NH4+ produced by in-stream mineralization of organic matter as 296
suggested in previous studies (Haggard et al. 2005). The low dissolved oxygen values observed in 297
summer suggest high rates of heterotrophic activity probably favored by elevated water temperatures. 298
This in turn could have resulted in high rates of organic matter mineralization tightly coupled with 299
high nitrification rates (Starry et al. 2005; Teissier et al. 2007). 300
Nevertheless, the consistent increase in δ15NO3- along the reach in summer clearly contrasted with 301
the expected pattern if it was solely driven by nitrification, especially considering that NH4+ 302
concentration was sharply depleted along the upper section of the reach. Possible explanations for this 303
longitudinal δ15NO3- enrichment could be related to processes associated with NO3
- uptake, such as 304
NO3- assimilatory uptake or anaerobic N-dissimilatory uptake (i.e., denitrification), which involve 305
isotopic fractionation. The hump-shaped pattern of NO3- concentration along the reach provides 306
further support for these explanations. In addition, it suggests a shift along the reach in the relative 307
dominance of nitrification and NO3- uptake processes (i.e., assimilation or denitrification, as discussed 308
above). The relevance of nitrification seemed to decrease along the reach concomitantly with the 309
decrease in NH4+
concentration. Both denitrification and assimilatory NO3- uptake could have 310
contributed to the observed longitudinal decline of NO3- concentration over the last section of the 311
reach. In fact, Chérnier et al. (2006) showed a close coupling between photoautorophic assimilatory 312
NO3- uptake and denitrification in river biofilms exposed to high nutrient concentrations. Occurrence 313
of NO3- assimilatory uptake by biofilms along the reach in summer is supported by similar δ15N values 314
in biofilms and NO3- and a significant correlation between them. In addition, denitrification occurs 315
under conditions of high NO3- concentration and low dissolved oxygen concentration, such as those 316
13
observed in summer in the study stream, which are mostly favored within the oxic/anoxic interfaces of 317
both epilithic biofilms and hyporheic sediments (Seitzinger et al. 2006, Lin et al. 2009). Furthermore, 318
denitrification during summer could have been enhanced by the high water temperature (Chénier et al. 319
2003, Boulêtreau et al. 2012). Supporting these observations, previous studies have reported the 320
relevance of in-stream denitrification in WWTP-influenced streams based on trends in stable isotopes 321
(Lofton et al. 2007) or in microbial communities (Wakelin et al. 2008). Regardless of the relative 322
importance of the different processes, our results indicate active N cycling in this recipient stream, 323
especially in summer when streamwater discharge and chemistry are most influenced by the WWTP. 324
Other processes, such as anammox and DNRA, may further have contributed to the highly 325
efficient N cycling in summer. However, these processes seem to be more relevant in lentic systems 326
(Op Den Camp et al. 2006, Burgin and Hamilton 2007, Zhu et al. 2010) and our data do not allow 327
assessing their relative importance. Ammonia volatilization, as an alternative explanation for the 328
observed patterns, was unlikely an important N removal process in the study reach because pH values 329
in this stream during both study periods were < 8 (data from nearby water quality monitoring station 330
from the Catalan Water Agency, http://aca-web.gencat.cat). Although we did not directly measure pH 331
in our study, pH values just downstream from the WWTP effluent were probably even lower than in 332
the nearby monitoring station do to enhanced heterotrophic respiration (Merseburger et al. 2006). In 333
addition, in both seasons a decrease in NH4+ concentration was counterbalanced by an increase of 334
NO3- suggesting no net loss of NH4
+ along the study reach. 335
The role of biofilms in N cycling 336
The WWTP effluent increased both the concentration and δ15N signature of DIN in the 337
recipient stream, especially for NH4+. Interestingly, δ15N of epilithic biofilms downstream of the 338
WWTP traced the increases of δ15N-DIN. These results suggest that epilithic biofilms were an active 339
compartment in N uptake, contributing to some extent to the observed longitudinal DIN patterns. 340
Nevertheless, we acknowledge that biofilms developed in other stream compartments, such as the 341
hyporheic zone, could also contribute to whole-reach DIN patterns. However, in this study we focused 342
14
on the role of epilithic biofilms that grow on cobbles, because these were the microbial communities 343
coating most of the dominant stream bed substrata. 344
The δ15N of biofilms clearly varied with time in accordance with the changes of the δ15N of DIN 345
species, and especially of NH4+. The biofilm δ15N signature is a net result of the isotope fractionation 346
during N assimilatory and dissimilatory processes (Sulzman et al. 2007). The differences between the 347
δ15N signatures of light- and dark-side biofilms in winter suggest that processes involved in N cycling 348
differ between both communities. This is evidence towards a fine-scale spatial segregation of 349
biogeochemical processes. In winter, light was not a limiting factor for phototrophic organisms 350
growing on the upper side of cobbles because riparian canopy cover was leaf-less. This clearly 351
contrasted with light-limited conditions on the dark-side of cobbles, which most likely lead to 352
differences in microbial communities between dark- and light-side biofilms. This segregation at 353
microhabitat scale may be due to the general light intolerance of nitrifying organism (Prosser 1989, 354
Merbt et al. 2012) or to poor competition capacity for NH4+ with respect to phototrophic organisms 355
(Risgaard-Petersen 2004). Ammonia-oxidizing bacteria grow slower and have lower N uptake rates 356
than photoautotrophs (Risgaard-Petersen 2003, Risgaard-Petersen 2004), which may favor their 357
development on dark-side environments. However, findings by Teissier et al. (2007) showed that 358
ammonia-oxidizing bacteria growing on light-exposed biofilms could compete successfully with algae 359
for NH4+, which would discard the previous argument. Finally, nitrifying bacteria supplied by the 360
WWTP may be less competitive for NH4+ than the autochthonous bacteria and consequently, they may 361
be forced to the dark-side environment where there is no competition by phototrophs (Cebron et al. 362
2003). In fact, in the same study reach during winter, Merbt et al. (2011) found that ammonia-363
oxidizing archaea developed on both sides of the cobbles, whereas ammonia-oxidizing bacteria were 364
only found below the WWTP input and were restricted to the dark-side of cobbles. These results 365
would support previous findings by Cebron et al. (2003) and may explain the observed differences in 366
δ15N signature of biofilms coating the light- and dark-sides of cobbles during winter. 367
In winter, the similar δ15N signatures between NH4+ and light-side biofilms suggest that NH4
+ from 368
the effluent was partly assimilated by these biofilms without undergoing substantial fractionation. 369
15
Moreover, the δ15N enrichment of the light-side biofilms was decoupled from that of δ15NO3-, which 370
suggests that these biofilm communities displayed a higher preference to assimilate NH4+ than NO3
-. 371
Similar results have been reported in comparative studies of NH4+ and NO3
- uptake by primary 372
producers (Dudley et al. 2001, Naldi and Wheeler 2002, Cohen and Fong 2004). This contrasts with 373
the clearly depleted δ15N signatures of the dark-side biofilms, which could be explained by a high 374
isotopic fractionation associated with nitrification, in agreement with previous studies (Mariotti et al. 375
1981, Casciotti et al. 2003). An alternative explanation could be that dark-side biofilms used a 376
different source of N with lower 15N content. However, this hypothesis cannot be verified in the 377
present study because we lack data from DIN sources other than the water column, such as hyporheic 378
water. 379
Contrastingly, the similar δ15N signatures of the light- and dark-side biofilm communities found in 380
summer suggest a lower spatial segregation of N cycling processes at microhabitat scale during this 381
season. In summer, riparian canopy was completely closed, thereby reducing light availability in the 382
stream. Therefore, differences between the light- and dark-side biofilms in terms of light availability 383
were smaller than in winter, and the development of photoautotrophs in light-side biofilms was 384
probably limited (von Schiller et al. 2007). This is supported by results from Ortiz et al. (2005) who 385
found that chlorophyll a was one order of magnitude lower in summer (mean= 11.3 mg Chl a/m2 ) than 386
in winter (mean= 572 mg Chl a/m2) in this study reach. In addition, a recent study by Merbt et al. 387
(2012) suggests that under low light conditions, nitrifiers could be more active and may not be 388
restricted just to the dark-side of the cobbles. Thus, the compositions of light- and dark- side 389
communities may be more homogeneous in summer than in winter, resulting in similar δ15N 390
signatures. Presence of nitrifiers on both sides of the cobbles in summer may be further supported by 391
the clear 15N-depletion of biofilms relative to δ15NH4+ as a result of the high isotopic fractionation 392
associated with nitrification. Alternatively, the similar δ15N signature of biofilms to that of δ15NO3- 393
may indicate a preferential uptake of NO3- during summer conditions, at least over the last 200 m of 394
the reach where the concentration of NH4+ was very low. Regardless of the mechanisms underlying N 395
cycling at the biofilm scale, δ15N results indicate that the biogeochemical role of epilithic biofilms on 396
16
N cycling at reach scale changes seasonally and at microhabitat scale. This agrees with Chénier et 397
al.2006 who observed that both the microbial component of river biofilms and its activity vary 398
seasonally, with higher activity as well as a tighter linkage with the phototrophic component of the 399
biolfim during summer. 400
Overall, our study revealed that the longitudinal patterns of stream DIN concentrations together 401
with the δ15N signatures downstream of the WWTP effluent were useful to infer the magnitude and 402
relative dominance of in-stream N cycling processes (e.g. assimilation, nitrification, denitrification) in 403
this N-enriched stream. The observed linkage between the δ15N signal of DIN sources and the biofilm 404
demonstrates the influence of epilithic biofilms on in-stream N cycling in these WWTP-influenced 405
streams. Nonetheless, microbial activity in other stream compartments, such as the hyporheic zone, 406
could have also contributed to the observed whole-reach patterns in DIN concentrations. Our results 407
also show clear seasonal differences in the capacity of receiving streams to cycle excess of N from 408
WWTPs and in the dominance of different N cycling processes. Collectively, our results highlight the 409
capacity of WWTP-influenced streams to process the additional N released from point-source urban-410
related activities along the adjacent landscape. 411
412
17
Acknowledgements 413
We thank S. Merbt for field assistance. This study was funded by the European Science Foundation 414
project Coupling biofilm diversity and ecosystem functioning: the role of communication and mixing 415
in microbial landscapes (COMIX; EURODIVERSITY, Collaborative Research Program, ref: 416
05_EDIV_FP065-COMIX). M. Ribot was supported by a contract with the Spanish Ministry of 417
Science and Innovation through the project N stable isotopes in fluvial ecosystems, the role of primary 418
uptake compartments as biotic indicators of N sources and processes (ISONEF, ref: CGL2008-05504-419
C02-02/BOS). 420
421

18
Literature cited 422
Alexander, R. B., R. A. Smith, and G. E. Schwarz. 2000. Effect of stream channel size on the delivery 423
of nitrogen to the Gulf of Mexico. Nature 403:758-761. 424
APHA (American Public Health Association). 1995. Standard methods for the examination of water 425
and wastewater, 19th edition. American Public Health Association, Washington DC. 426
Battin, T. J., L. A. Kaplan, J. D. Newbold, and C. M. E. Hansen. 2003. Contributions of microbial 427
biofilms to ecosystem processes in stream mesocosms. Nature 426:439-442. 428
Beaulieu, J. J., J. L. Tank, S. K. Hamilton, W. M. Wollheim, R. O. Hall, P. J. Mulholland, B. J. 429
Peterson, L. R. Ashkenas, L. W. Cooper, C. N. Dahm, W. K. Dodds, N. B. Grimm, S. L. 430
Johnson, W. H. Mcdowell, G. C. Poole, H. M. Valett, C. P. Arango, M. J. Bernot, A. J. 431
Burgin, C. L. Crenshaw, A. M. Helton, L. T. Johnson, J. M. O'brien, J. D. Potter, R. W. 432
Sheibley, D. J. Sobota, and S. M. Thomas. 2011. Nitrous oxide emission from denitrification 433
in stream and river networks. Proceedings of the National Academy of Sciences 108:214-219. 434
Boulêtreau, S., E. Salvo, E. Lyautey, S. Mastrorillo, and F. Garabetian. 2012. Temperature 435
dependence of denitrification in phototrophic river biofilms. Science of The Total 436
Environment 416:323-328. 437
Bernot, M. J., W. K. Dodds. 2005. Nitrogen retention, removal, and saturation in lotic ecosystems. 438
Ecosystems 8(4): 442-453. 439
Beyene, A., W. Legesse, L. Triest, and H. Kloos. 2009. Urban impact on ecological integrity of nearby 440
rivers in developing countries: the Borkena River in highland Ethiopia. Environmental 441
Monitoring and Assessment 153:461-476. 442
Brion, N., and G. Billen. 2000. Wastewater as a source of nitrifying bacteria in river systems: the case 443
of the River Seine downstream from Paris. Water Research 34:3213-3221. 444
Burgin, A. J., and S. K. Hamilton. 2007. Have we overemphasized the role of denitrification in aquatic 445
ecosystems? A review of nitrate removal pathways. Frontiers in Ecology and the Environment 446
5:89-96. 447
19
Cabana, G., and J. B. Rasmussen. 1996. Comparison of aquatic food chains using nitrogen isotopes. 448
Proceedings of the National Academy of Sciences of the United States of America 93:10844-449
10847. 450
Casciotti, K. L., D. M. Sigman, and B. B. Ward. 2003. Linking diversity and stable isotope 451
fractionation in ammonia-oxidizing bacteria. Geomicrobiology Journal 20:335-353. 452
Cebron, A., T. Berthe, and J. Garnier. 2003. Nitrification and Nitrifying Bacteria in the Lower Seine 453
River and Estuary (France). Applied and Environmental Microbiology 69:7091-7100. 454
Chenier, M. R., D. Beaumier, N. Fortin, R. Roy, B. T. Driscoll, J. R. Lawrence, and C. W. Greer. 455
2006. Influence of nutrient inputs, hexadecane and temporal variations on denitrification and 456
community composition of river biofilms. Applied and Environmental Microbiology 72:575-457
584. 458
Chenier, M. R., D. Beaumier, R. Roy, B. T. Driscoll, J. R. Lawrence, and C. W. Greer. 2003. Impact 459
of seasonal variations and nutrient inputs on nitrogen cycling and degradation of hexadecane 460
by replicated river biofilms. Applied and Environmental Microbiology 69:5170-5177. 461
Cohen, R. A., and P. Fong. 2004. Nitrogen uptake and assimilation in Enteromorpha intestinalis (L.) 462
Link (Chlorophyta): using 15N to determine preference during simultaneous pulses of nitrate 463
and ammonium. Journal of Experimental Marine Biology and Ecology 309:67-77. 464
Daims, H., and M. Wagner . 2010. The microbiology of nitrogen removal. Pages 259-280 in R. J. 465
Seviour and Nielsen P.H. (editors). The microbiology of activated sludge. IWA Publishing, 466
London, UK. 467
De Brabandere, L. D., T. K. Frazer, and J. P. Montoya. 2007. Stable nitrogen isotope ratios of 468
macrophytes and associated periphyton along a nitrate gradient in two subtropical, spring-fed 469
streams. Freshwater Biology 52:1564-1575. 470
Dudley, B. J., A. M. E. Gahnstrom, and D. I. Walker. 2001. The role of benthic vegetation as a sink 471
for elevated inputs of ammonium and nitrate in a mesotrophic estuary. Marine Ecology-472
Progress Series 219:99-107. 473
20
Ensign, S. H., and M. W. Doyle. 2006. Nutrient spiraling in streams and river networks. Journal of 474
Geophysical Research-Biogeosciences 111. 475
Gammons, C. H., J. N. Babcock, S. R. Parker, and S. R. Poulson. 2011. Diel cycling and stable 476
isotopes of dissolved oxygen, dissolved inorganic carbon, and nitrogenous species in a stream 477
receiving treated municipal sewage. Chemical Geology 283:44-55. 478
Gordon, N. D., T.A Mcmahon and B.L. Finlayson. 1992. Stream hydrology: an introduction for 479
ecologists, 1st edition. John Wiley and Sons, England. 480
Gray, N. F. 2004. Biology of wastewater treatment. 2nd edition. Imperial College Press. 481
Haggard, B. E., E. H. Stanley, and D. E. Storm. 2005. Nutrient retention in a point-source-enriched 482
stream. Journal of the North American Benthological Society 24:29-47. 483
Heaton, T. H. E. 1986. Isotopic studies of nitrogen pollution in the hydrosphere and atmosphere – a 484
review. Chemical Geology 59:87-102. 485
Holmes, R. M., J. W. Mcclelland, D. M. Sigman, B. Fry, and B. J. Peterson. 1998. Measuring N-15-486
NH4+ in marine, estuarine and fresh waters: An adaptation of the ammonia diffusion method 487
for samples with low ammonium concentrations. Marine Chemistry 60:235-243. 488
Howarth, R. W., G. Billen, D. Swaney, A. Townsend, N. Jaworski, K. Lajtha, J. A. Downing, R. 489
Elmgren, N. Caraco, T. Jordan, F. Berendse, J. Freney, V. Kudeyarov, P. Murdoch, and Z. L. 490
Zhu. 1996. Regional nitrogen budgets and riverine N&P fluxes for the drainages to the North 491
Atlantic Ocean: Natural and human influences. Biogeochemistry 35:75-139. 492
Kendal, C., E.M. Elliott, and S.D. Wankel. 2007. Tracing anthropogenic inputs of nitrogen to 493
ecosystems. Pages 375-435 in R. Michener and K. Lajtha (editors). Stable Isotopes in Ecology 494
and Environmental Science, Blackwell. 495
Lin, Y.-M., J.-H. Tay, Y. Liu, and Y.-T. Hung. 2009. Biological Nitrification and Denitrification 496
Processes. Pages 539-588 in L. K. Wang, N. C. Pereira and Y.-T. Hung (editors). Biological 497
Treatment Processes. Handbook of Environmental Engineering, Humana Press. 498
Lofton, D. D., A. E. Hershey, and S. C. Whalen. 2007. Evaluation of denitrification in an urban stream 499
receiving wastewater effluent. Biogeochemistry 86:77-90. 500
21
Mariotti, A., J. C. Germon, P. Hubert, P. Kaiser, R. Letolle, A. Tardieux, and P. Tardieux. 1981. 501
Experimental-determination of nitrogen kinetic isotope fractionation -some principles- 502
illustration for the denitrification and nitification processes. Plant and Soil 62:413-430. 503
Martí, E., J. Aumatell, L. Gode, M. Poch, and F. Sabater. 2004. Nutrient retention efficiency in 504
streams receiving inputs from wastewater treatment plants. Journal of Environmental Quality 505
33:285-293. 506
Martí, E., J. Riera, and F. Sabater. 2010. Effects of Wastewater Treatment Plants on Stream Nutrient 507
Dynamics Under Water Scarcity Conditions. Pages 173-195 in S. Sabater and D. Barceló 508
(editors). Water Scarcity in the Mediterranean. The Handbook of Environmental Chemistry. 509
Springer Berlin, Heidelberg. 510
Merbt, S. N., J. C. Auguet, E. O. Casamayor, and E. Marti. 2011. Biofilm recovery in a wastewater 511
treatment plant-influenced stream and spatial segregation of ammonia-oxidizing microbial 512
populations. Limnology and Oceanography 56:1054-1064. 513
Merbt, S.N., D.A. Stahl, E.O. Casamayor, E. Martí, G.W. Nicol, and J.I. Prosser. 2012. Differential 514
photoinhibition of bacterial and archaeal ammonia oxidation. FEMS Microbiology Letters. 515
327: 41-46. 516
Merseburger, G. C., E. Martí, and F. Sabater. 2005. Net changes in nutrient concentrations below a 517
point source input in two streams draining catchments with contrasting land uses. Science of 518
The Total Environment 347:217-229. 519
Merseburger, G. C. 2006. Nutrient dynamics and metabolism in Mediterranean streams affected by 520
nutrient inputs from human activities. Ph D Thesis. Universitat de Barcelona, Barcelona, 521
Spain. 522
Miltner, R. J., and E. T. Rankin. 1998. Primary nutrients and the biotic integrity of rivers and streams. 523
Freshwater Biology 40:145-158. 524
Montuelle, B., B. Volat, M. M. Torio-Fernandez, and E. Navarro. 1996. Changes in Nitrobacter 525
serotypes biodiversity in a river: Impact of a wastewater treatment plant discharge. Water 526
Research 30:1057-1064. 527
22
Mulholland, P. J., A. M. Helton, G. C. Poole, R. O. Hall, S. K. Hamilton, B. J. Peterson, J. L. Tank, L. 528
R. Ashkenas, L. W. Cooper, C. N. Dahm, W. K. Dodds, S. E. G. Findlay, S. V. Gregory, N. B. 529
Grimm, S. L. Johnson, W. H. Mcdowell, J. L. Meyer, H. M. Valett, J. R. Webster, C. P. 530
Arango, J. J. Beaulieu, M. J. Bernot, A. J. Burgin, C. L. Crenshaw, L. T. Johnson, B. R. 531
Niederlehner, J. M. O'brien, J. D. Potter, R. W. Sheibley, D. J. Sobota, and S. M. Thomas. 532
2008. Stream denitrification across biomes and its response to anthropogenic nitrate loading. 533
Nature 452:202-246. 534
Naldi, M., and P. A. Wheeler. 2002. 15N measurements of ammonium and nitrate by Ulva fenestrata 535
(Clorophyta) and Gracilaria pacifica (Rhodophyta): comparison of net nutrient disappearance, 536
release of ammonium and nitrate, and 15N accumutaion in algal tissue. Journal of Phycology 537
38:135-144. 538
Op Den Camp, H. J. M., B. Kartal, D. Guven, L. A. M. P. Van Niftrik, S. C. M. Haaijer, W. R. L. Van 539
Der Star, K. T. Van De Pas-Schoonen, A. Cabezas, Z. Ying, M. C. Schmid, M. M. M. 540
Kuypers, J. Van De Vossenberg, H. R. Harhangi, C. Picioreanu, M. C. M. Van Loosdrecht, J. 541
G. Kuenen, M. Strous, and M. S. M. Jetten. 2006. Global impact and application of the 542
anaerobic ammonium-oxidizing (anammox) bacteria. Biochemical Society Transactions 543
34:174-178. 544
Ortiz, J. 2005. Response of the benthic macroinvertebrate community to a point source in La Tordera 545
stream (Catalonia, NE Spain). Ph D Thesis. Universitat de Girona, Girona, Spain. 546
Peterson, B. J., W. M. Wollheim, P. J. Mulholland, J. R. Webster, J. L. Meyer, J. L. Tank, E. Marti, 547
W. B. Bowden, H. M. Valett, A. E. Hershey, W. H. Mcdowell, W. K. Dodds, S. K. Hamilton, 548
S. Gregory, and D. D. Morrall. 2001. Control of nitrogen export from watersheds by 549
headwater streams. Science 292:86-90. 550
Prosser J.I. 1989. Autotrophic Nitrification in Bacteria. Pages 125-181 in A. H. Rose and D. W. 551
Tempest (editors). Advances in Microbial Physiology. Academic Press. 552
23
Pusch, M., D. Fiebig, I. Brettar, H. Eisenmann, B. K. Ellis, L. A. Kaplan, M. A. Lock, M. W. Naegeli, 553
and W. Traunspurger. 1998. The role of micro-organisms in the ecological connectivity of 554
running waters. Freshwater Biology 40:453-495. 555
Ra, J. S., S. D. Kim, N. I. Chang, and K. G. An. 2007. Ecological health assessments based on whole 556
effluent toxicity tests and the index of biological integrity in temperate streams influenced by 557
wastewater treatment plant effluents. Environmental Toxicology and Chemistry 26:2010-558
2018. 559
Risgaard-Petersen, N. 2003. Coupled nitrification-denitrification in autotrophic and heterotrophic 560
estuarine sediments: On the influence of benthic microalgae. Limnology and Oceanography 561
48:93-105. 562
Risgaard-Petersen, N., M. H. Nicolaisen, N. P. Revsbech, and B. A. Lomstein. 2004. Competition 563
between ammonia-oxidizing bacteria and benthic microalgae. Applied and Environmental 564
Microbiology 70:5528-5537. 565
Seitzinger, S., J. A. Harrison, J. K. Bohlke, A. F. Bouwman, R. Lowrance, B. Peterson, C. Tobias, and 566
G. Van Drecht. 2006. Denitrification across landscapes and waterscapes: A synthesis. 567
Ecological Applications 16:2064-2090. 568
Seitzinger, S. P. 1988. Denitrification in Freshwater and Coastal Marine Ecosystems: Ecological and 569
Geochemical Significance. Limnology and Oceanography 33:702-724. 570
Sigman, D. M., M. A. Altabet, R. Michener, D. C. Mccorkle, B. Fry, and R. M. Holmes. 1997. Natural 571
abundance-level measurement of the nitrogen isotopic composition of oceanic nitrate: an 572
adaptation of the ammonia diffusion method. Marine Chemistry 57:227-242. 573
Starry, O. S., H. M. Valett, and M. E. Schreiber. 2005. Nitrification rates in a headwater stream: 574
influences of seasonal variation in C and N supply. Journal of the North American 575
Benthological Society 24:753-768. 576
Sulzman, E. W. 2007. Stable isotope chemistry and measurement: a primer. Pages 1-14 in R. 577
Michener and K. Lajtha (Editors). Stable Isotopes in Ecology and Environmental Science, 578
Blackwell. 579
24
Teissier, S., M. Torre, F. Delmas, and F. Garabetian. 2007. Detailing biogeochemical N budgets in 580
riverine epilithic biofilms. Journal of the North American Benthological Society 26:178-190. 581
Vivian, C. M. G. 1986. Tracers of sewage sludge in the marine environment: A review. Science of The 582
Total Environment 53:5-40. 583
Von Schiller, D., S. Bernal, and E. Martí. 2011. Technical Note: A comparison of two empirical 584
approaches to estimate in-stream net nutrient uptake. Biogeosciences. 8: 875–882. 585
Von Schiller, D., E. Martí, J. L. Riera, and F. Sabater. 2007. Effects of nutrients and light on 586
periphyton biomass and nitrogen uptake in Mediterranean streams with contrasting land uses. 587
Freshwater Biology 52:891-906. 588
Wakelin, S. A., M. J. Colloff, and R. S. Kookana. 2008. Effect of Wastewater Treatment Plant 589
Effluent on Microbial Function and Community Structure in the Sediment of a Freshwater 590
Stream with Variable Seasonal Flow. Applied and Environmental Microbiology 74:2659-591
2668. 592
Zhu, G. B., M. S. M. Jetten, P. Kuschk, K. F. Ettwig, and C. Q. Yin. 2010. Potential roles of anaerobic 593
ammonium and methane oxidation in the nitrogen cycle of wetland ecosystems. Applied 594
Microbiology and Biotechnology 86:1043-1055. 595
596
25
Tables 597
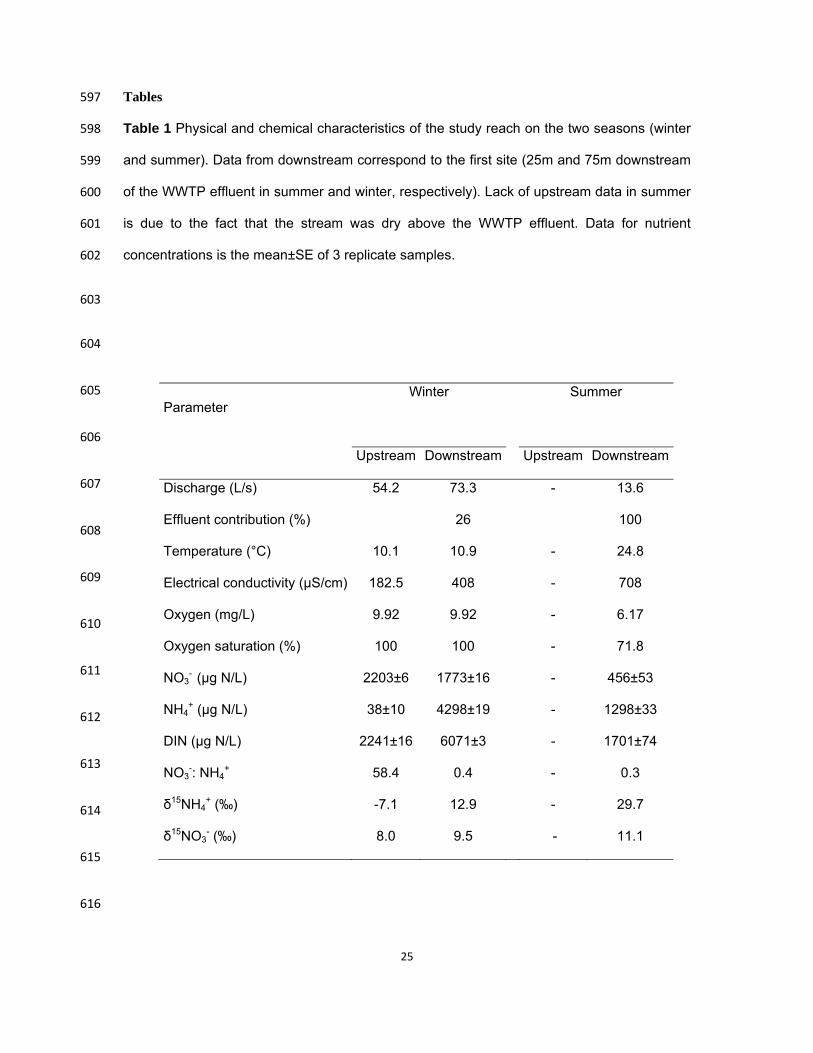
Table 1 Physical and chemical characteristics of the study reach on the two seasons (winter 598
and summer). Data from downstream correspond to the first site (25m and 75m downstream 599
of the WWTP effluent in summer and winter, respectively). Lack of upstream data in summer 600
is due to the fact that the stream was dry above the WWTP effluent. Data for nutrient 601
concentrations is the mean±SE of 3 replicate samples. 602
603
604
605
606
607
608
609
610
611
612
613
614
615
616
Parameter Winter
Summer
Upstream Downstream Upstream Downstream
Discharge (L/s) 54.2 73.3 - 13.6
Effluent contribution (%) 26 100
Temperature (°C) 10.1 10.9 - 24.8
Electrical conductivity (µS/cm) 182.5 408 - 708
Oxygen (mg/L) 9.92 9.92 - 6.17
Oxygen saturation (%) 100 100 - 71.8
NO3- (µg N/L) 2203±6 1773±16 - 456±53
NH4+ (µg N/L) 38±10 4298±19 - 1298±33
DIN (µg N/L) 2241±16 6071±3 - 1701±74
NO3-: NH4
+ 58.4 0.4 - 0.3
δ15NH4+ (‰) -7.1 12.9 - 29.7
δ15NO3- (‰) 8.0 9.5 - 11.1
26
Figure legends 617
Fig. 1. Variation of ambient concentrations and δ15N signatures of dissolved N species along 618
the study reach in winter (A, C) and summer (B, D). 619
620
Fig. 2. Relationships between the concentrations of NH4+ and NO3
- and their respective δ15N 621
signatures in winter (A, C) and summer (B, D). The dashed ellipse in C indicates the two 622
outliers of the correlation corresponding with the last two sampling sites. Results of 623
Spearman rank correlations are shown. 624
625
Fig. 3. Variation along the study reach of the δ15N values of biofilm types from the light-side 626
(white bars) and dark-side (black bars) of cobbles measured in winter (A) and summer (B). 627
Negative distance values denote the location of the upstream site in relation to the WWTP 628
input. 629
630
Fig. 4. Relationships between the longitudinal variation of the δ15N signature of dissolved N 631
species and the δ15N signature of the biofilm from the light-side (white circles) and dark-side 632
(black circles) in winter (A, C) and summer (B, D). Significant Spearman rank correlations 633
(p<0.05) are shown. Dashed lines denote 1:1 relationships. 634