Embed Size (px)
Citation preview

Nutrient limitation of epilithic and epixylic biofilmsin 10 North American streams
JENNIFER L. TANK* AND WALTER K. DODDS†
*Department of Biological Sciences, University of Notre Dame, Notre Dame, IN, U.S.A.
†Division of Biology, Kansas State University, Manhattan, KS, U.S.A.
SUMMARY
1. Nutrient diffusing substrata were used to determine the effect of added inorganic
nitrogen (N) and phosphorus (P) on the development of epilithic and epixylic biofilms in
10 North American streams. Four treatments of diffusing substrata were used: Control
(agar only), N addition (0.5 MM NaNO3), P addition (0.5 MM KH2PO4), and N + P combined
(0.5 MM NaNO3 + 0.5 MM KH2PO4). Agar surfaces were covered with glass fibre filters (for
epilithon) or discs of untreated white oak wood veneer (for epixylon).
2. We found that if algae showed significant response to nutrient addition, N limitation
(either N alone or N with P) was the most frequent response both on GF ⁄ F filters and on
wood. Despite the low dissolved nutrient concentrations in our study streams, more than a
third of the streams did not show any response to N or P addition. In fact, P was never the
sole limiting nutrient for algal biofilms in this study.
3. Nutrient addition influenced algal colonisation of inorganic versus organic substrata in
different ways. The presence of other biofilm constituents (e.g. fungi or bacteria) may
influence whether algal biomass on wood increased in response to nutrient addition. Algae
on organic and inorganic substrata responded similarly to nutrient addition in only one
stream.
4. Fungal biomass on wood was nutrient limited in six of 10 study streams. N limitation of
fungal biomass (with or without secondary P limitation) was most frequent, but P
limitation did occur in two streams.
5. Our results show that biomass responses to nutrient addition by the heterotrophic and
autotrophic components of the epixylic biofilm were different, though both experienced
the same stream nutrient conditions. For algae and fungi growing on wood, limiting
nutrients were rarely similar. Only three of nine streams showed the same biomass
response to nutrient addition, including two that showed no significant change in biomass
despite added nutrients.
Keywords: biofilm, epilithon, fungi, nitrogen, nutrients, periphyton, phosphorus, stream
Introduction
Microbial biofilms are largely responsible for stream
processes such as primary production, community
respiration, nutrient uptake and retention, and
decomposition of particulate organic matter. While
autotrophs (primarily algae) control the transfer of
atmospheric carbon to higher trophic levels, microbial
colonisation by bacteria and fungi is critical to the
transfer of allochthonous particulate carbon through
stream food webs. However, primary production and
detrital decomposition are influenced by nutrient
availability. In streams, dissolved nutrients are
continuously delivered to colonised surfaces via
unidirectional water flow. Nevertheless, nutrients
Correspondence: J.L. Tank, Department of Biological Sciences,
192 Galvin Life Sciences, University of Notre Dame, Notre
Dame, IN, 46556, U.S.A.
E-mail: [email protected]
Freshwater Biology (2003) 48, 1031–1049
� 2003 Blackwell Publishing Ltd 1031
(primarily nitrogen (N) and phosphorus (P)) are often
limiting to algae, bacteria and fungi in these systems
(e.g. Pringle et al., 1986; Tank & Webster, 1998;
Francoeur et al., 1999; Wold & Hershey, 1999).
Research on nutrient limitation in streams has
centred primarily on algae (i.e. periphyton or epili-
thon). Factors important to the accrual of autotrophic
biomass include nutrients (Borchardt, 1996), light
(Hill, 1996), temperature, invertebrate grazing (Stein-
man, 1996), and scouring caused by increased flow
(Biggs & Close, 1989; Peterson, 1996). In general,
however, there is a positive relationship between
nutrient concentrations in the water column and
benthic chlorophyll across many streams (Dodds,
Smith & Zander, 1997). In contrast to the algal-
dominated biofilms colonising inorganic substrata,
fungi comprise the major biotic component of hetero-
trophic decomposers in streams dominated by
allochthonous organic matter (Suberkropp & Klug,
1976). Fungi play a major role in the conditioning of
woody debris and leaf litter, thereby making detritus
a more easily assimilated food resource for consumers
(Barlocher, 1985; Hax & Golladay, 1993). In fact, fungi
may comprise up to 90% of the microbial biomass
colonising large particulate organic matter in hetero-
trophic food webs (Aumen et al., 1983; Findlay &
Arsuffi, 1989; Tank & Winterbourn, 1996). Hetero-
trophs, such as fungi, are not only influenced by
environmental conditions such as temperature and
dissolved nutrients (Suberkropp & Chauvet, 1995;
Tank & Webster, 1998), but are also influenced by the
quality of the substratum they colonise (e.g. lignin
content, C : N ratio) (Peterson et al., 1993; Gessner &
Chauvet, 1994). Given these differences between
autotrophs and heterotrophs, we can ask (a) whether
the same nutrients limit both algae and fungi growing
in the same stream or on the same substratum and (b)
whether the magnitude of biomass response to the
addition of these nutrients is the same for both algae
and fungi. Relatively few studies have examined the
effect of water column nutrients on heterotrophic acti-
vity, despite their important role in stream ecosystem
function. Moreover, we know of no simultaneous test
for nutrient limitation of both autotrophs and hetero-
trophs. Because algae grow on both inorganic and
organic substrata, we analysed the response of algae
to nutrient addition on both substratum types.
We investigated nutrient (N and P) limitation in
heterotrophic (fungal) and autotrophic (algal) biofilms
using nutrient-diffusing substrata: (1) across streams
in different biomes with different nutrient and light
regimes and (2) on inorganic and organic substrata.
We compared the biofilm response with nutrient
addition in 10 first or second order streams in North
America, yielding a ‘snapshot’ of N and P limitation
for both algae and fungi. These sites range from
closed-canopy, shaded streams to others with little
riparian vegetation and open channels. Our intent was
not to describe the geographical distribution of N and
P limitation, but rather to explore the possible range of
responses to N and P addition between fungi and
autotrophic algae in streams. Differentiating between
the response to nutrient addition of the algal and
fungal components of biofilms is critical to under-
standing how nutrients may differentially influence or
control stream ecosystem function through heterotro-
phic and ⁄or autotrophic pathways.
Methods
Our 10 study streams were located in eight different
biomes, ranging from tropical to tundra (Table 1).
Seven of the 10 streams had closed canopies (i.e. >50%
riparian shading) and heterotrophic processes
strongly dominated stream metabolism (Mulholland
et al., 2001; Table 2). The remaining three streams had
open canopies and a higher rate of primary produc-
tion (Tables 1 and 2). The streams varied somewhat in
physical and chemical characteristics but were in
general small (<200 L s)1 baseflow discharge) and
oligotrophic (dissolved inorganic N (DIN) <60 lg L)1
and soluble reactive phosphorus (SRP) <15 lg L)1,
Table 2). The ratio of molar DIN : SRP ranged from 2
to 36 across the 10 sites (Table 2).
Nutrient diffusing substrata (NDS) were construc-
ted using 60 mL plastic containers filled with a 2%
(by weight) agar solution amended with 0.5 MM KNO3
(N treatment), 0.5 MM NaH2PO4 (P treatment), both
(N + P treatment), or not amended as a control (C
treatment). We placed either Whatman (Kent, UK)
GF ⁄F glass fibre filters (0.7 lm retention) or 1-mm
thick untreated white oak (Quercus alba G. Lumis)
veneer discs (from heartwood; Constantines Wood
Center, Ft. Lauderdale, FL, USA) across the tops of the
containers to cover the agar completely and serve as
either inorganic or organic substrata for biofilm
colonisation. The wood veneer technique has been
used successfully to assess nutrient limitation in
1032 J.L. Tank and W.K. Dodds
� 2003 Blackwell Publishing Ltd, Freshwater Biology, 48, 1031–1049
epixylon (Tank & Winterbourn, 1995, 1996; Tank &
Webster, 1998). This represents a modification of
bioassay techniques developed previously by Winter-
bourn (1990) and Corkum (1996).
Five replicates of each nutrient treatment for both
organic and inorganic substrata were placed on the
stream bottom in plastic racks for 21 ± 2 days, except
in Upper Ball Creek where low winter stream
temperature resulted in very slow colonisation times
and incubation was for 42 days (Table 1). Laboratory
assays have previously shown that the rate of nutrient
diffusion from the 2% agar cups was constant
through 17 days and then declined only slightly until
day 21 (J.L. Tank, unpublished data). At the end of the
incubation period, filters were removed and frozen
until analysis for chlorophyll a (to estimate algal
biomass). Wood veneer discs were removed, split, and
half of each disc was frozen for later analysis of
chlorophyll a and the other half immediately fixed
with 5 mL of high-performance liquid chromatogra-
phy (HPLC)-grade methanol for later extraction of
ergosterol (an indicator of fungal biomass). Within
48 h of collection, chlorophyll a extracts were ana-
lysed spectrophotometrically or fluorometrically with
correction for phaeophytin by standard methods
(APHA, 1995). Ergosterol was extracted and analysed
using an HPLC as reported previously (Newell,
Arsuffi & Fallon, 1988; Tank & Webster, 1998)
and expressed as fungal biomass using a general
conversion factor of 6 mg ergosterol g)1 fungal bio-
mass (Newell et al., 1988).
To determine whether algal or fungal biomass on
our artificial substrata (GF ⁄ F filters or wood veneer)
approximated in situ biomass on natural substrata
(stream rocks and submerged woody debris) in our 10
study streams, we estimated epilithic algal biomass
(as chlorophyll a) and fungal biomass on wood (as
ergosterol) just prior to the implementation of the
NDS and compared biomass estimates from natural
substrata to those from the control (non-nutrient)
treatments of the NDS. In situ epilithic biomass was
determined at each site using 12 randomly selected
rock scrapings of known area and filtering the
epilithon slurry from each rock onto ashed GF ⁄Ffilters and then extracting for chlorophyll a as
described above for the NDS. Fungal biomass in the
epixylon was obtained by scraping a known area of
submerged wood and filtering the epixylic slurry in a
fashion similar to the epilithon filtering (n ¼ 12 per
site). The resulting filter was then extracted for
ergosterol as described above. Both in situ chlorophyll
a and fungal biomass were then expressed per unit
surface area of scraping.
Stream water nutrient analyses were conducted on
water samples taken weekly during the NDS incuba-
tions. All water samples were immediately filtered
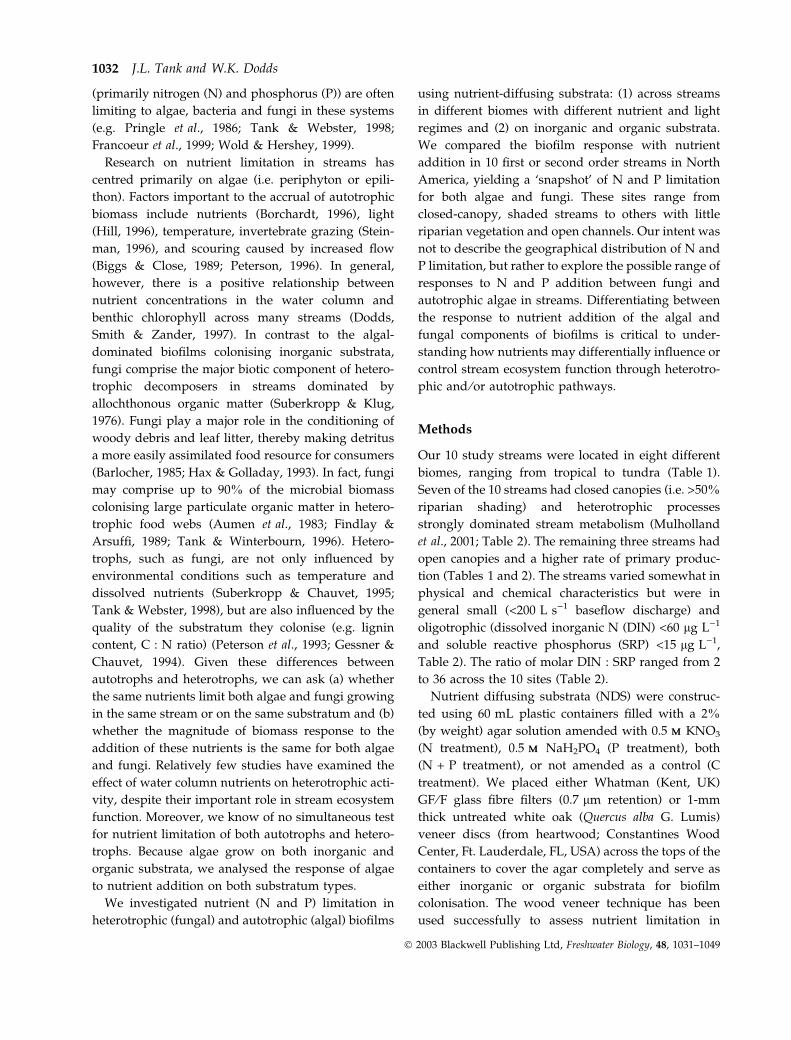
Table 1 Study sites where bioassays were conducted
Site (State) Location Description Canopy
Season
(month)
Incubation
time (day)
Upper Ball Creek, 35�N, 83�W Temperate deciduous forest Closed Autumn 42
North Carolina (NC) (November)
Walker Branch, 36�N, 84�W Temperate deciduous forest Closed Spring 21
Tennessee (TN) (March)
Sycamore Creek, 33�N, 112�W Sonoran desert Open Spring 22
Arizona (AZ) (May)
Bear Brook, 44�N, 72�W Temperate deciduous forest Closed Summer 21
New Hampshire (NH) (June)
Gallina Creek, 36�N, 106�W High desert montane forest Closed Autumn 21
New Mexico (NM) (September)
Quedebra Bisley, 18�N, 66�W Tropical forest Closed Winter 21
Puerto Rico (PR) (February)
Kings Creek, 39�N, 94�W Prairie Open Spring 19
Kansas (KS) (April)
Eagle Creek, 42�N, 85�W Temperate, low gradient forest Closed Summer 21
Michigan (MI) (June)
Mack Creek, 44�N, 122�W Temperate rainforest Closed Summer 21
Oregon (OR) (July)
E 1, 68�N, 149�W Tundra Open Summer 21
Alaska (AK) (July)
Nutrient limitation on epilithic versus epixylic biofilms 1033
� 2003 Blackwell Publishing Ltd, Freshwater Biology, 48, 1031–1049
through Gelman (Pall Corporation, Port Washington,
NY, USA) A ⁄E glass fibre filters (0.45 lm pore
retention) in the field and then frozen for later
chemical analysis. Water was analysed for ammo-
nium, nitrate + nitrite, soluble reactive P, and total
dissolved N using standard colorimetric methods
(APHA, 1995; Table 2).
A two-factor analysis of variance (ANOVAANOVA) was used
to test whether algal or fungal biofilms were signifi-
cantly affected by N enrichment (presence or absence
of NaNO3 in agar) or P enrichment (presence or
absence of KH2PO4 in agar) (Dube, Culp & Scrimgeour,
1997). Post-hoc least-squares means (LSM) followed
significant ANOVAANOVA (P < 0.05) to differentiate between
biomass means. If the biomass data were not normally
distributed or the variances were unequal, the data
were log-transformed prior to analysis. Possible out-
comes from the ANOVAANOVA on the bioassays are summa-
rised in Table 3. Single nutrient limitation was
indicated when just one of the additions (N or P)
elicited a positive response, but the interaction term in
the ANOVAANOVA was not significant. If neither N nor P alone
significantly increased biomass (P > 0.05), but N and P
added together (N + P) did (i.e. the interaction term in
the ANOVAANOVA was significant, P < 0.05), we considered
the biofilm to be colimited by both N and P. Similarly,
there could also be colimitation by both N and P if,
when added separately, they each stimulated biomass
relative to controls, but the positive N and P responses
were not different from each other. Secondary limita-
tion was indicated if N or P alone significantly
increased biomass, both N and P added together
caused an even greater increase in biomass, and the
interaction term for the ANOVAANOVA was significant.
Ta
ble
2P
hy
sica
lan
dch
emic
alch
arac
teri
sati
on
of
10st
ud
ysi
tes
asab
bre
via
ted
by
stat
e(s
eeT
able
1).
Dat
are
po
rted
are
wee
kly
aver
ages
ov
erth
est
ud
yp
erio
d,
exce
pt
for
dai
ly
lig
ht
and
met
abo
lism
wh
ich
rep
rese
nt
on
esa
mp
lin
gd
ate
atth
eb
egin
nin
go
fth
ein
cub
atio
np
erio
d
Sit
e
Ph
ysi
cal
Wat
erch
emis
try
Met
abo
lism
Q (Ls)
1)
Dep
th
(m)
Dai
lyli
gh
t
(mo
lm
)2
d)
1)
Wat
erv
elo
city
(cm
s)1)
Wat
erte
mp
.
(�C
)
NH
4+
(lg
NL)
1)
NO
3)
(lg
NL)
1)
DO
N
(lg
NL)
1)
SR
P
(lg
PL)
1)
DIN
:S
RP
(Mo
lar)
Ep
ilit
ho
n
(gA
FD
Mm
)2)
Ep
ilit
ho
n
(mg
Ch
lm
)2)
GP
PC
R
(gO
2m
)2
d)
1)
P:
R
rati
o
NC
130
0.18
0.8
10.6
7.2
3.3
2.3
20.3
2.9
4.3
1.26
0.59
0.06
32.3
0.00
2
TN
180.
0515
.06.
812
.44.
118
.7–
3.3
15.3
3.8
12.0
1.1
6.3
0.18
AZ
430.
0451
.028
.623
.06.
09.
017
9.0
14.0
2.4
18.0
53.0
15.0
8.3
1.8
NH
90.
092.
21.
914
.34.
354
.415
3.0
3.6
36.1
2.66
7.8
0.2
9.1
0.02
NM
40.
036.
89.
97.
24.
74.
212
7.0
8.0
2.5
3.49
8.65
0.4
6.7
0.06
PR
200.
130.
33.
022
.03.
316
7.0
119.
014
.326
.43.
549.
80.
19.
00.
01
KS
160.
1538
.011
.315
.53.
02.
3–
3.3
3.6
76.0
63.0
1.8
2.4
0.75
MI
202
0.18
18.0
23.6
23.0
12.0
17.5
229.
03.
121
.15.
847.
41.
26.
40.
19
OR
570.
163.
87.
613
.12.
259
.250
.013
.010
.52.
913
.01.
911
.20.
17
AK
134
0.10
–13
.09.
82.
813
.615
0.0
1.8
20.2
–5.
81.
10.
33.
9
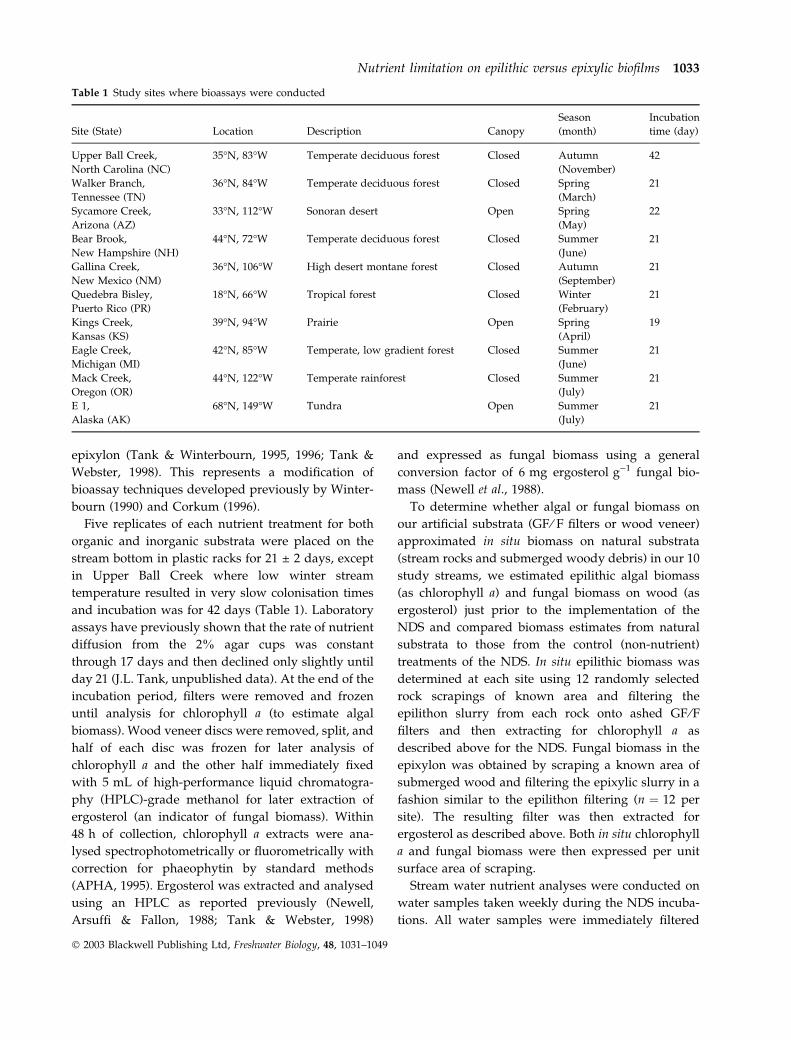
Table 3 Interpretation of responses to N and P addition. A
diamond in N or P treatment indicates a significant N or P effect
in the two-way A N O V AA N O V A (P < 0.05) and a diamond in the NXP
treatment indicates a significant interaction between the two
treatments
Interpretation N effect P effect
Interaction
NXP
N limited r
P limited r
N and P colimited r
N and P colimited r r
N and P colimited r r r
1�N limited, 2�P limited r r
1�P limited, 2�N limited r r
Not limited by N or P
1034 J.L. Tank and W.K. Dodds
� 2003 Blackwell Publishing Ltd, Freshwater Biology, 48, 1031–1049

Whether a particular nutrient is found to be limiting
or not is partially a function of the statistical power of
the experiment (Francoeur, 2001). For this reason, we
found it useful to compare in addition the relative
magnitude of the response of algal or fungal biomass
to nutrient addition between streams and substrata
types. We modified the approach of Brett & Goldman
(1997) and the treatment response data were trans-
formed by calculating the logarithmic ratio of the
treatment (N, P, or N + P) relative to the control. For
example, for the addition of N, the N biomass
response would be log (nitrogen mean ⁄control mean).
In this way, the response variables (either chlorophyll
a or fungal biomass) were normalised across streams
by scaling the mean treatment response (to N, P, or
N + P) relative to the control treatment (N : C, P : C,
N + P : C); the higher the ratio, the greater the
response to nutrient addition. We used ANOVAANOVA to
compare the biomass responses to nutrient addition
among substratum types (chorophyll a on GF ⁄Fversus wood veneers) and between response variables
on the same substratum type (fungal biomass versus
chlorophyll a on wood). Post-hoc LSM followed
significant ANOVAANOVA (P < 0.05) to differentiate between
biomass responses. Linear regression was used to test
for significant relationships between response to
nutrient addition (as log relative response) and the
independent variables described in Table 2, such as
stream water nutrient concentrations or light.
Results
Are the biofilms on the GF ⁄F filters and wood
veneers representative of in situ biofilms?
Chlorophyll a concentration on both wood veneers
and GF ⁄F filters was not significantly different from
ambient chlorophyll a on stream rocks (ANOVAANOVA,
P > 0.05, Fig. 1a), so the 3-week incubation time
resulted in a representative epilithic biomass on
artificial substrata. In contrast, fungal biomass on
wood veneer was significantly lower than on surfaces
of in situ small woody debris (ANOVAANOVA, P ¼ 0.04), so
the 3-week incubation time resulted in lower fungal
colonisation (Fig. 1b), consistent with previous work
using veneers (Tank & Webster, 1998). We did not
assess the community structure of biofilms, so we do
not know if in situ biofilms are structurally similar to
those that colonised our artificial substrata.
Nutrient limitation in algae
Chlorophyll a concentrations were similar between
GF ⁄F filters and wood veneers (Figs 2 and 3). On
GF ⁄F, chlorophyll a ranged from a minimum of
0.1 lg cm)2 for the P treatment in Puerto Rico to
13.2 lg cm)2 for the N + P treatment in Kansas
(Fig. 2). On wood veneers, chlorophyll a ranged from
0.07 lg cm)2 for the N + P treatment in Puerto Rico to
19.3 lg cm)2 for the N + P treatment in Arizona
(Fig. 3). Substratum type did not influence algal
biomass for either controls or nutrient treatments
and mean chlorophyll a concentrations on the sub-
strata for each individual treatment were not different
between wood and GF ⁄F (paired t-test, for control,
P ¼ 0.226, N addition, P ¼ 0.793, P addition,
P ¼ 0.432, and N + P addition, P ¼ 0.987).
We tested for a significant algal response to
nutrient addition using two-way ANOVAANOVA (Table 4).
In about half of the streams, algal biomass was not
Fig. 1 (a) Mean chlorophyll a from the control treatment at all
sites using wood veneer substrata (WD chl a), natural epili-
thon colonising stream rocks (epilithon), and control treatment
using GF ⁄F filters (GF ⁄F chl a). (b) Mean fungal biomass from
the control treatment at all sites using wood veneer substrata
(WV) and in situ small woody debris (wood). Means ±
standard errors (SE) are plotted and N ¼ 5 for each bar.
Letters refer to comparisons of treatments among all streams
and bars with same letters were not significantly different
(A N O V AA N O V A, P > 0.05).
Nutrient limitation on epilithic versus epixylic biofilms 1035
� 2003 Blackwell Publishing Ltd, Freshwater Biology, 48, 1031–1049
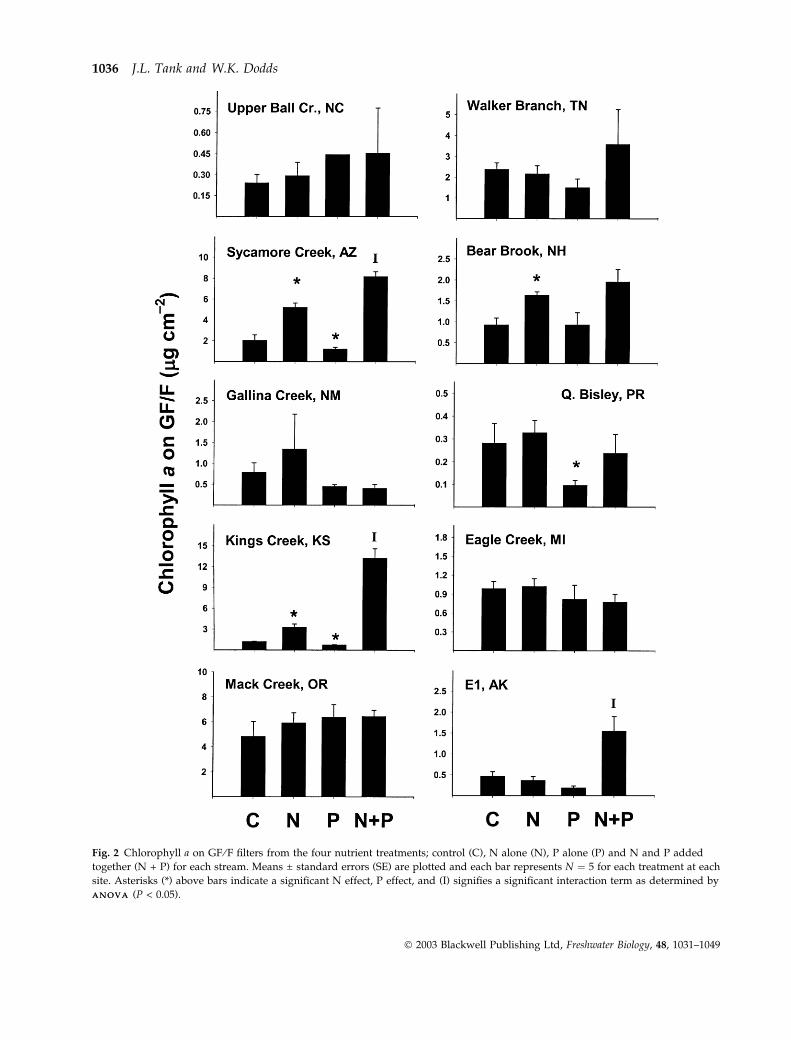
Fig. 2 Chlorophyll a on GF ⁄F filters from the four nutrient treatments; control (C), N alone (N), P alone (P) and N and P added
together (N + P) for each stream. Means ± standard errors (SE) are plotted and each bar represents N ¼ 5 for each treatment at each
site. Asterisks (*) above bars indicate a significant N effect, P effect, and (I) signifies a significant interaction term as determined by
A N O V AA N O V A (P < 0.05).
1036 J.L. Tank and W.K. Dodds
� 2003 Blackwell Publishing Ltd, Freshwater Biology, 48, 1031–1049
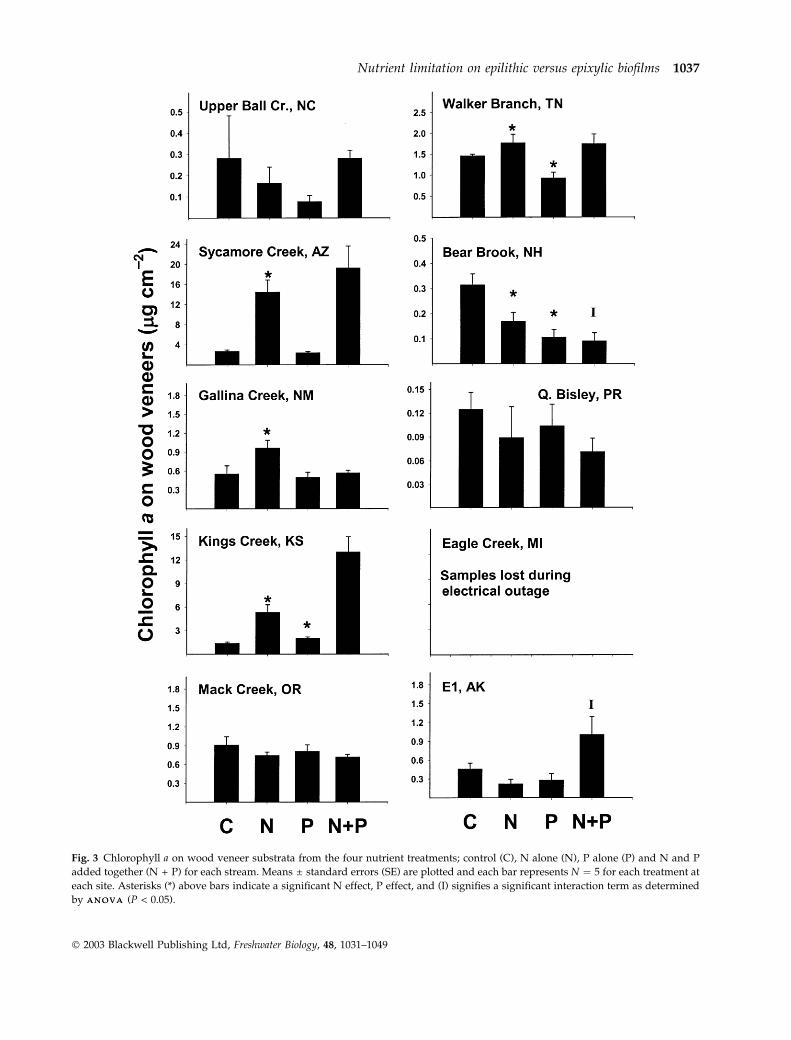
Fig. 3 Chlorophyll a on wood veneer substrata from the four nutrient treatments; control (C), N alone (N), P alone (P) and N and P
added together (N + P) for each stream. Means ± standard errors (SE) are plotted and each bar represents N ¼ 5 for each treatment at
each site. Asterisks (*) above bars indicate a significant N effect, P effect, and (I) signifies a significant interaction term as determined
by A N O V AA N O V A (P < 0.05).
Nutrient limitation on epilithic versus epixylic biofilms 1037
� 2003 Blackwell Publishing Ltd, Freshwater Biology, 48, 1031–1049
nutrient limited; six streams on the inorganic GF ⁄Ffilters (NC, TN, NM, PR, MI, OR) and four streams
on wood (NC, NH, PR, OR). Algal biomass on filters
was limited by N alone in only a single stream (NH),
but in three streams on wood veneers (AZ, NM, TN).
Nitrogen limitation with secondary P limitation was
more common for algae on filters (AZ, KS) but did
not occur on wood. Co-limitation by both N and P
on filters occurred only in the Alaskan stream, but
was found in two streams on veneers (KS, AK). We
saw no significant positive response of algae to P
addition on either substratum in any of the 10
streams. Phosphorus addition suppressed algal bio-
mass in three streams on filters (AZ, KS, PR) and in
two streams on veneers (TN, NH). Autotrophs
responded similarly on organic and inorganic sub-
strata in only four of 10 streams, three showing no
significant nutrient limitation (NC, PR, OR) and,
when there was a statistically significant response,
only the Alaskan stream showed the same treatment
effect (Table 4).
Heterotrophic response to nutrient addition
The lowest estimates of fungal biomass occurred at
the New Hampshire site (0.01 mg dry mass
(DM) cm)2 for both control and P treatments),
whereas fungal biomass was highest in Tennessee,
both for control (0.25 mg DM cm)2) and nutrient
treatments (0.79 mg DM cm)2, N + P) (Fig. 4). As in
the autotrophs, there was no significant fungal
response to nutrient addition in four of our study
streams (KS, OR, PR, AK) (Table 4). Fungal biomass
was limited by N alone in two streams (AZ, NH) and
by P alone in two streams (NC, MI) (Table 4).
Nitrogen limitation of fungal biomass with secondary
P limitation also occurred in two streams (NM, TN),
but there were no cases of colimitation by N and P.
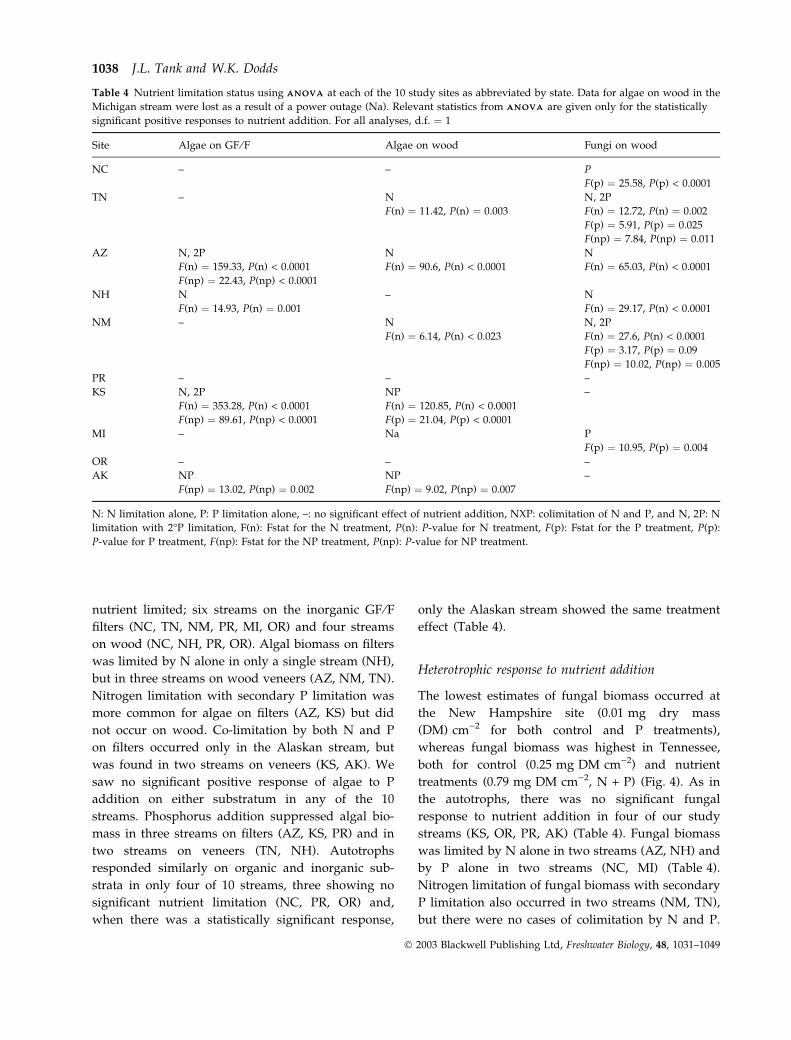
Table 4 Nutrient limitation status using A N O V AA N O V A at each of the 10 study sites as abbreviated by state. Data for algae on wood in the
Michigan stream were lost as a result of a power outage (Na). Relevant statistics from A N O V AA N O V A are given only for the statistically
significant positive responses to nutrient addition. For all analyses, d.f. ¼ 1
Site Algae on GF ⁄F Algae on wood Fungi on wood
NC – – P
F(p) ¼ 25.58, P(p) < 0.0001
TN – N N, 2P
F(n) ¼ 11.42, P(n) ¼ 0.003 F(n) ¼ 12.72, P(n) ¼ 0.002
F(p) ¼ 5.91, P(p) ¼ 0.025
F(np) ¼ 7.84, P(np) ¼ 0.011
AZ N, 2P N N
F(n) ¼ 159.33, P(n) < 0.0001 F(n) ¼ 90.6, P(n) < 0.0001 F(n) ¼ 65.03, P(n) < 0.0001
F(np) ¼ 22.43, P(np) < 0.0001
NH N – N
F(n) ¼ 14.93, P(n) ¼ 0.001 F(n) ¼ 29.17, P(n) < 0.0001
NM – N N, 2P
F(n) ¼ 6.14, P(n) < 0.023 F(n) ¼ 27.6, P(n) < 0.0001
F(p) ¼ 3.17, P(p) ¼ 0.09
F(np) ¼ 10.02, P(np) ¼ 0.005
PR – – –
KS N, 2P NP –
F(n) ¼ 353.28, P(n) < 0.0001 F(n) ¼ 120.85, P(n) < 0.0001
F(np) ¼ 89.61, P(np) < 0.0001 F(p) ¼ 21.04, P(p) < 0.0001
MI – Na P
F(p) ¼ 10.95, P(p) ¼ 0.004
OR – – –
AK NP NP –
F(np) ¼ 13.02, P(np) ¼ 0.002 F(np) ¼ 9.02, P(np) ¼ 0.007
N: N limitation alone, P: P limitation alone, –: no significant effect of nutrient addition, NXP: colimitation of N and P, and N, 2P: N
limitation with 2�P limitation, F(n): Fstat for the N treatment, P(n): P-value for N treatment, F(p): Fstat for the P treatment, P(p):
P-value for P treatment, F(np): Fstat for the NP treatment, P(np): P-value for NP treatment.
1038 J.L. Tank and W.K. Dodds
� 2003 Blackwell Publishing Ltd, Freshwater Biology, 48, 1031–1049

Fig. 4 Fungal biomass on wood veneer substrata from the four nutrient treatments; control (C), N alone (N), P alone (P) and N and P
added together (N + P) for each stream. Means ± standard errors (SE) are plotted and each bar represents N ¼ 5 for each treatment at
each site. Asterisks (*) above bars indicate a significant N effect, P effect, and (I) signifies a significant interaction term as determined
by A N O V AA N O V A (P < 0.05).
Nutrient limitation on epilithic versus epixylic biofilms 1039
� 2003 Blackwell Publishing Ltd, Freshwater Biology, 48, 1031–1049
Lower biomass after P addition occurred at only one
site (TN).
Comparing the magnitude of the biomass response
to nutrient addition
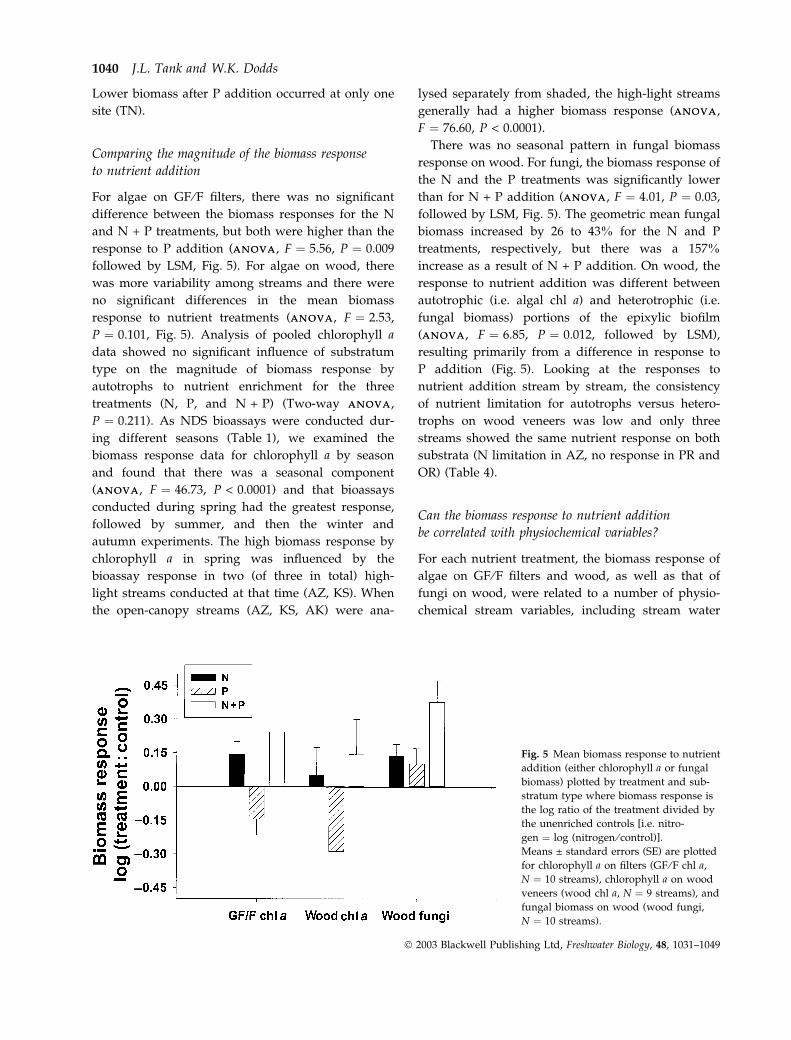
For algae on GF ⁄F filters, there was no significant
difference between the biomass responses for the N
and N + P treatments, but both were higher than the
response to P addition (ANOVAANOVA, F ¼ 5.56, P ¼ 0.009
followed by LSM, Fig. 5). For algae on wood, there
was more variability among streams and there were
no significant differences in the mean biomass
response to nutrient treatments (ANOVAANOVA, F ¼ 2.53,
P ¼ 0.101, Fig. 5). Analysis of pooled chlorophyll a
data showed no significant influence of substratum
type on the magnitude of biomass response by
autotrophs to nutrient enrichment for the three
treatments (N, P, and N + P) (Two-way ANOVAANOVA,
P ¼ 0.211). As NDS bioassays were conducted dur-
ing different seasons (Table 1), we examined the
biomass response data for chlorophyll a by season
and found that there was a seasonal component
(ANOVAANOVA, F ¼ 46.73, P < 0.0001) and that bioassays
conducted during spring had the greatest response,
followed by summer, and then the winter and
autumn experiments. The high biomass response by
chlorophyll a in spring was influenced by the
bioassay response in two (of three in total) high-
light streams conducted at that time (AZ, KS). When
the open-canopy streams (AZ, KS, AK) were ana-
lysed separately from shaded, the high-light streams
generally had a higher biomass response (ANOVAANOVA,
F ¼ 76.60, P < 0.0001).
There was no seasonal pattern in fungal biomass
response on wood. For fungi, the biomass response of
the N and the P treatments was significantly lower
than for N + P addition (ANOVAANOVA, F ¼ 4.01, P ¼ 0.03,
followed by LSM, Fig. 5). The geometric mean fungal
biomass increased by 26 to 43% for the N and P
treatments, respectively, but there was a 157%
increase as a result of N + P addition. On wood, the
response to nutrient addition was different between
autotrophic (i.e. algal chl a) and heterotrophic (i.e.
fungal biomass) portions of the epixylic biofilm
(ANOVAANOVA, F ¼ 6.85, P ¼ 0.012, followed by LSM),
resulting primarily from a difference in response to
P addition (Fig. 5). Looking at the responses to
nutrient addition stream by stream, the consistency
of nutrient limitation for autotrophs versus hetero-
trophs on wood veneers was low and only three
streams showed the same nutrient response on both
substrata (N limitation in AZ, no response in PR and
OR) (Table 4).
Can the biomass response to nutrient addition
be correlated with physiochemical variables?
For each nutrient treatment, the biomass response of
algae on GF ⁄F filters and wood, as well as that of
fungi on wood, were related to a number of physio-
chemical stream variables, including stream water
Fig. 5 Mean biomass response to nutrient
addition (either chlorophyll a or fungal
biomass) plotted by treatment and sub-
stratum type where biomass response is
the log ratio of the treatment divided by
the unenriched controls [i.e. nitro-
gen ¼ log (nitrogen ⁄ control)].
Means ± standard errors (SE) are plotted
for chlorophyll a on filters (GF ⁄F chl a,
N ¼ 10 streams), chlorophyll a on wood
veneers (wood chl a, N ¼ 9 streams), and
fungal biomass on wood (wood fungi,
N ¼ 10 streams).
1040 J.L. Tank and W.K. Dodds
� 2003 Blackwell Publishing Ltd, Freshwater Biology, 48, 1031–1049

chemistry, light [as photosynthetically active radiation
(PAR)], whole-stream metabolism, stream tempera-
ture and depth (See Table 2). For algae, if there was a
significant response to nutrient addition, N limitation
(alone or in conjunction with P limitation) was most
frequent and chlorophyll a concentrations were most
strongly influenced by water chemistry and light (as
PAR). On GF ⁄F filters, chlorophyll a biomass response
to N addition was inversely related to water column
molar DIN : SRP ratios (r2 ¼ 0.52, P ¼ 0.02, Fig. 6),
but this relationship was only marginally significant
on wood (r2 ¼ 0.40, P ¼ 0.06, data not shown). In
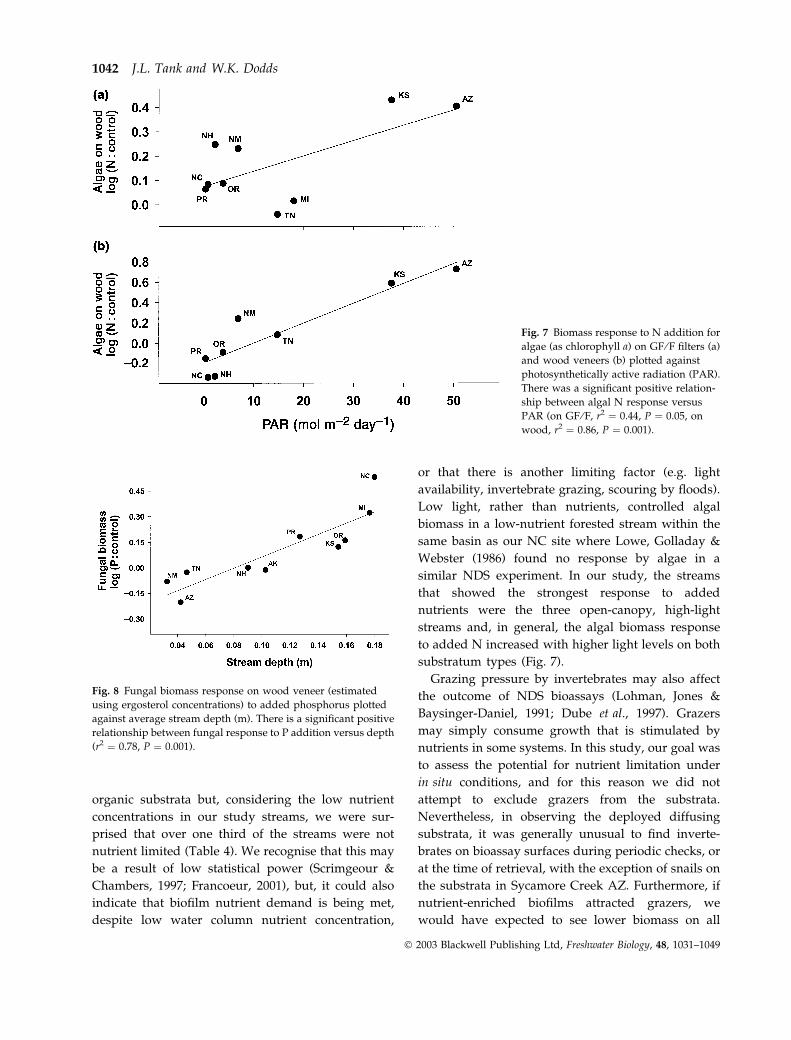
contrast, we found a positive correlation between light
and the algal response to N addition on both filters
(r2 ¼ 0.44, P ¼ 0.05) and wood (r2 ¼ 0.86, P ¼ 0.001)
(Figs 7a,b), but this relationship was strongly influ-
enced by our two high-light streams; a prairie stream
in Kansas and a desert stream in Arizona. Similarly,
autotrophic response to N + P addition was also
influenced by light on both substrata (for GF ⁄F,
r2 ¼ 0.44, P ¼ 0.05, and wood, r2 ¼ 0.87, P ¼ 0.001).
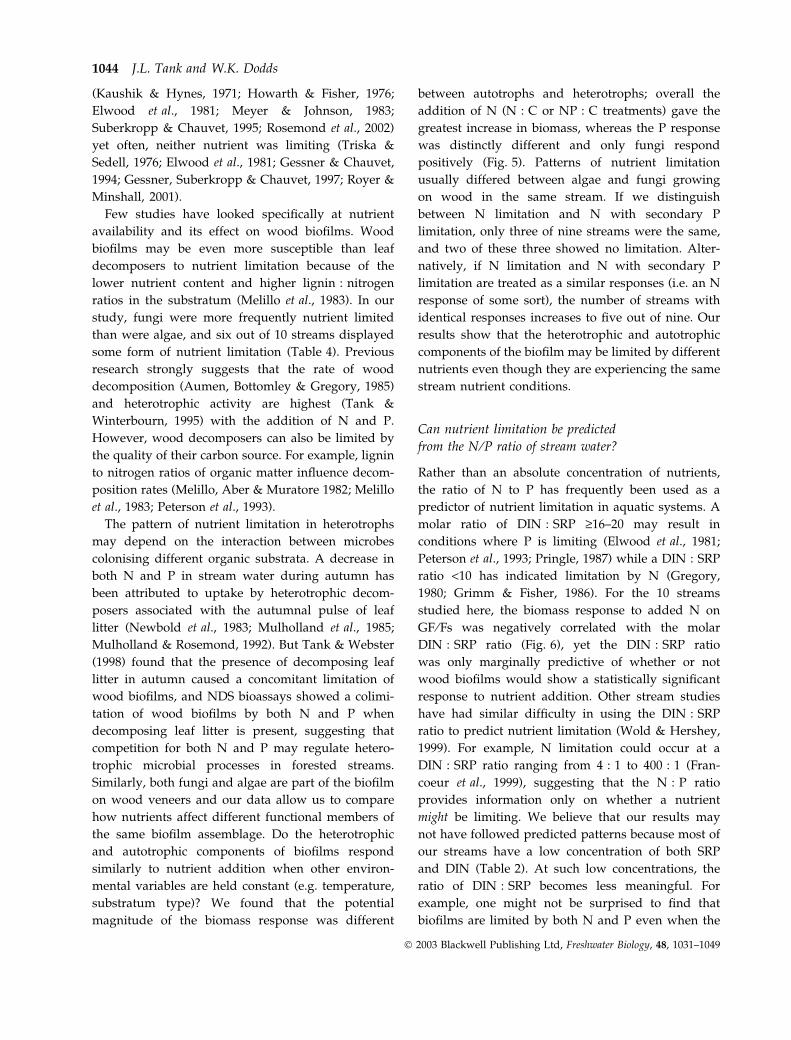
Only the fungi showed significant P limitation.
However, the fungal biomass response to P addition
was not related to light or water chemistry, but rather
was positively correlated with stream depth
(r2 ¼ 0.78, P ¼ 0.001) (Fig. 8). In this case, deeper
streams, which may have lower light penetration and
a relatively smaller autotrophic component in the
epixylon, had greater response to P addition. This
result is robust given the wide range of streams we
studied.
Discussion
Autotrophic response to nutrient addition
Many studies have shown that autochthonous pro-
duction is affected by nutrients (e.g. Bott, 1983; Grimm
& Fisher, 1986; Pringle, 1987; Meyer et al., 1988; Hart
& Robinson, 1990; Peterson et al., 1993; Rosemond,
1993; Rosemond et al., 1993). In this study, we have
used NDS bioassays of chlorophyll a, as an indicator
of algal biomass, to assess potential nutrient limitation
in streams in various biomes. In the 10 streams used in
this study, DIN ranged from 5 to 170 lg L)1, and SRP
ranged from 2 to 14 lg L)1 (Table 2). These streams
would be considered by most to be ‘low nutrient’
streams (especially for P) and therefore we predicted
that biofilms would be limited in some way by
nutrient availability. We recognise that biomass does
not equal productivity per se, and our estimates only
provide a snapshot in time with regard to nutrient
limitation (Francoeur, 2001).
When nutrients were limiting, N limitation (either
alone or with secondary limitation by P) was the
most frequent response on both inorganic and
Fig. 6 Algal biomass response (as chloro-
phyll a) on GF ⁄F filters to added nitrogen
plotted against the log molar ratio of
water column dissolved inorganic nitro-
gen (DIN) to soluble reactive phosphorus
(SRP) concentrations. There was a signifi-
cant negative relationship between algal
N response versus DIN : SRP (r2 ¼ 0.52,
P ¼ 0.02).
Nutrient limitation on epilithic versus epixylic biofilms 1041
� 2003 Blackwell Publishing Ltd, Freshwater Biology, 48, 1031–1049
organic substrata but, considering the low nutrient
concentrations in our study streams, we were sur-
prised that over one third of the streams were not
nutrient limited (Table 4). We recognise that this may
be a result of low statistical power (Scrimgeour &
Chambers, 1997; Francoeur, 2001), but, it could also
indicate that biofilm nutrient demand is being met,
despite low water column nutrient concentration,
or that there is another limiting factor (e.g. light
availability, invertebrate grazing, scouring by floods).
Low light, rather than nutrients, controlled algal
biomass in a low-nutrient forested stream within the
same basin as our NC site where Lowe, Golladay &
Webster (1986) found no response by algae in a
similar NDS experiment. In our study, the streams
that showed the strongest response to added
nutrients were the three open-canopy, high-light
streams and, in general, the algal biomass response
to added N increased with higher light levels on both
substratum types (Fig. 7).
Grazing pressure by invertebrates may also affect
the outcome of NDS bioassays (Lohman, Jones &
Baysinger-Daniel, 1991; Dube et al., 1997). Grazers
may simply consume growth that is stimulated by
nutrients in some systems. In this study, our goal was
to assess the potential for nutrient limitation under
in situ conditions, and for this reason we did not
attempt to exclude grazers from the substrata.
Nevertheless, in observing the deployed diffusing
substrata, it was generally unusual to find inverte-
brates on bioassay surfaces during periodic checks, or
at the time of retrieval, with the exception of snails on
the substrata in Sycamore Creek AZ. Furthermore, if
nutrient-enriched biofilms attracted grazers, we
would have expected to see lower biomass on all
Fig. 7 Biomass response to N addition for
algae (as chlorophyll a) on GF ⁄F filters (a)
and wood veneers (b) plotted against
photosynthetically active radiation (PAR).
There was a significant positive relation-
ship between algal N response versus
PAR (on GF ⁄F, r2 ¼ 0.44, P ¼ 0.05, on
wood, r2 ¼ 0.86, P ¼ 0.001).
Fig. 8 Fungal biomass response on wood veneer (estimated
using ergosterol concentrations) to added phosphorus plotted
against average stream depth (m). There is a significant positive
relationship between fungal response to P addition versus depth
(r2 ¼ 0.78, P ¼ 0.001).
1042 J.L. Tank and W.K. Dodds
� 2003 Blackwell Publishing Ltd, Freshwater Biology, 48, 1031–1049

nutrient-enriched substrata, but we only saw reduc-
tions in biomass in some P treatments and not the
corresponding N + P treatments. We never observed
such an effect in the N treatments, nevertheless, we
still acknowledge that grazing could have ‘masked’
responses to nutrient addition. In this case, the algal
and fungal biomass we measured here are a net result
of both biomass growth and loss.
Stream ecosystems are often not at equilibrium.
Variations in discharge, groundwater inputs and
precipitation can alter nutrient inputs and water
column nutrient concentrations. An arctic tundra
stream exhibited alternately P or N limited conditions
depending on nitrate concentrations, which were
influenced by stream discharge (Hullar & Vestal,
1989). Additionally, nutrient availability may change
with depth into the biofilm. Although nutrients within
biofilms are not often measured, flow has been shown
to be highly attenuated in periphyton mats (Dodds,
1991), which may create a gradient of nutrient
availability within biofilms. Spatial and temporal
variation in nutrient limitation has been documented
for streams in Minnesota (Wold & Hershey, 1999),
Tennessee (Elwood et al., 1981) and New Zealand
(Francoeur et al., 1999). We recognise that results from
NDS studies must be interpreted cautiously, because
they represent only a snapshot of stream nutrient
conditions and, once streams have moved away from
those conditions, nutrient limitation and response
may differ greatly (Francoeur et al., 1999; Francoeur,
2001). Because we conducted bioassays in a wide
variety of streams at different seasons, we assume
that our results characterise a range of possible
responses to nutrient enrichment rather than
allowing characterisation of any individual stream
or biome.
Despite very low SRP concentrations, often near
our limits of detection (2–14 lg P L)1), P was never
the sole limiting nutrient for algal biofilms in this
study. In fact, lower algal biomass as a result of P
addition occurred three times on GF ⁄Fs and once on
wood. Previous NDS studies did not highlight this
decline in biomass with P addition, but careful
inspection of published data reveals some possible
cases where it has occurred in other studies (e.g.
Francoeur et al., 1999; Wold & Hershey, 1999;
Francoeur, 2001). Perhaps such a response is repor-
ted less often than it really occurs. A post hoc
diffusion study in the laboratory showed somewhat
elevated SRP concentrations (<50 lg P L)1) in water
in which NDS had been placed. However, we have
no way of knowing the P concentration at the
surface of diffusing substrata at the time of incuba-
tion. Thus, we have no field data to support an
explanation of the inhibitory response. Study of
such a response could be a fruitful avenue for
future research.
Effect of substratum type on autotrophic response
The response by algae to nutrient enrichment was not
influenced by substratum type in our short-term
studies. Chlorophyll a concentration and the magni-
tude of the biomass response were similar on both
organic and inorganic substrata (Fig. 5). In cases
where algae were nutrient limited, however, only
the Alaskan stream showed similar limitation on both
substrata. The presence of fungi could influence
overall nutrient response by algae on wood. In
general, biofilms on wood differ from inorganic
substrata in that wood biofilms are dominated by
fungal hyphae and may contain diatoms, while stone
surfaces have no fungal hyphae (Tank & Winter-
bourn, 1996). Comparing biofilm development on
organic (wood, leaves) and inorganic (stones) sub-
strata in a New Zealand mountain stream, Tank &
Winterbourn (1996) found that chlorophyll a concen-
tration on wood could be as high as on stones,
but endocellulase activity, an indicator of cellulose
decomposition by heterotrophs, was present only on
wood.
Nutrient limitation on organic substrata
Compared with algae, far fewer studies have
explored patterns of nutrient limitation of hetero-
trophic colonisers. Fungi and bacteria colonising
organic substrata can satisfy some of their N and P
demand from the substratum, which may change
dynamics of N and P limitation on organic substrata
and make limitation patterns in wood biofilms
distinct from epilithic biofilms. But when substratum
nutrient concentration is insufficient, fungi can also
obtain nutrients from the water column (e.g. Elwood
et al., 1981; Mulholland et al., 1984). Previous work
has focused primarily on the effect of nutrients on the
decomposition of leaf litter. Like epilithon, both N
and P have been shown to limit leaf decomposition
Nutrient limitation on epilithic versus epixylic biofilms 1043
� 2003 Blackwell Publishing Ltd, Freshwater Biology, 48, 1031–1049
(Kaushik & Hynes, 1971; Howarth & Fisher, 1976;
Elwood et al., 1981; Meyer & Johnson, 1983;
Suberkropp & Chauvet, 1995; Rosemond et al., 2002)
yet often, neither nutrient was limiting (Triska &
Sedell, 1976; Elwood et al., 1981; Gessner & Chauvet,
1994; Gessner, Suberkropp & Chauvet, 1997; Royer &
Minshall, 2001).
Few studies have looked specifically at nutrient
availability and its effect on wood biofilms. Wood
biofilms may be even more susceptible than leaf
decomposers to nutrient limitation because of the
lower nutrient content and higher lignin : nitrogen
ratios in the substratum (Melillo et al., 1983). In our
study, fungi were more frequently nutrient limited
than were algae, and six out of 10 streams displayed
some form of nutrient limitation (Table 4). Previous
research strongly suggests that the rate of wood
decomposition (Aumen, Bottomley & Gregory, 1985)
and heterotrophic activity are highest (Tank &
Winterbourn, 1995) with the addition of N and P.
However, wood decomposers can also be limited by
the quality of their carbon source. For example, lignin
to nitrogen ratios of organic matter influence decom-
position rates (Melillo, Aber & Muratore 1982; Melillo
et al., 1983; Peterson et al., 1993).
The pattern of nutrient limitation in heterotrophs
may depend on the interaction between microbes
colonising different organic substrata. A decrease in
both N and P in stream water during autumn has
been attributed to uptake by heterotrophic decom-
posers associated with the autumnal pulse of leaf
litter (Newbold et al., 1983; Mulholland et al., 1985;
Mulholland & Rosemond, 1992). But Tank & Webster
(1998) found that the presence of decomposing leaf
litter in autumn caused a concomitant limitation of
wood biofilms, and NDS bioassays showed a colimi-
tation of wood biofilms by both N and P when
decomposing leaf litter is present, suggesting that
competition for both N and P may regulate hetero-
trophic microbial processes in forested streams.
Similarly, both fungi and algae are part of the biofilm
on wood veneers and our data allow us to compare
how nutrients affect different functional members of
the same biofilm assemblage. Do the heterotrophic
and autotrophic components of biofilms respond
similarly to nutrient addition when other environ-
mental variables are held constant (e.g. temperature,
substratum type)? We found that the potential
magnitude of the biomass response was different
between autotrophs and heterotrophs; overall the
addition of N (N : C or NP : C treatments) gave the
greatest increase in biomass, whereas the P response
was distinctly different and only fungi respond
positively (Fig. 5). Patterns of nutrient limitation
usually differed between algae and fungi growing
on wood in the same stream. If we distinguish
between N limitation and N with secondary P
limitation, only three of nine streams were the same,
and two of these three showed no limitation. Alter-
natively, if N limitation and N with secondary P
limitation are treated as a similar responses (i.e. an N
response of some sort), the number of streams with
identical responses increases to five out of nine. Our
results show that the heterotrophic and autotrophic
components of the biofilm may be limited by different
nutrients even though they are experiencing the same
stream nutrient conditions.
Can nutrient limitation be predicted
from the N ⁄P ratio of stream water?
Rather than an absolute concentration of nutrients,
the ratio of N to P has frequently been used as a
predictor of nutrient limitation in aquatic systems. A
molar ratio of DIN : SRP ‡16–20 may result in
conditions where P is limiting (Elwood et al., 1981;
Peterson et al., 1993; Pringle, 1987) while a DIN : SRP
ratio <10 has indicated limitation by N (Gregory,
1980; Grimm & Fisher, 1986). For the 10 streams
studied here, the biomass response to added N on
GF ⁄Fs was negatively correlated with the molar
DIN : SRP ratio (Fig. 6), yet the DIN : SRP ratio
was only marginally predictive of whether or not
wood biofilms would show a statistically significant
response to nutrient addition. Other stream studies
have had similar difficulty in using the DIN : SRP
ratio to predict nutrient limitation (Wold & Hershey,
1999). For example, N limitation could occur at a
DIN : SRP ratio ranging from 4 : 1 to 400 : 1 (Fran-
coeur et al., 1999), suggesting that the N : P ratio
provides information only on whether a nutrient
might be limiting. We believe that our results may
not have followed predicted patterns because most of
our streams have a low concentration of both SRP
and DIN (Table 2). At such low concentrations, the
ratio of DIN : SRP becomes less meaningful. For
example, one might not be surprised to find that
biofilms are limited by both N and P even when the
1044 J.L. Tank and W.K. Dodds
� 2003 Blackwell Publishing Ltd, Freshwater Biology, 48, 1031–1049
N : P ratio is 20 : 1 if DIN is 10 lg N L)1 and SRP is
0.5 lg P L)1. Despite a DIN : SRP >16, the absolute
quantity of either nutrient that is biologically avail-
able is very small.
As an alternative to the hypothesis that nutrient
ratios can predict nutrient limitation in streams,
perhaps there are threshold values of nutrients
below which one might find nutrient limitation.
Grimm & Fisher (1986) implied that a NO3-N
concentration below 55 lg L)1 in Sycamore Creek,
AZ would suggest N limitation and our bioassay
in that stream did indeed show N limitation at a
NO3-N concentration of 9 lg L)1. Yet the threshold
hypothesis was not universally supported in our
study. A number of streams with a DIN concentra-
tion below 55 lg L)1 did not show significant N
limitation. A higher rate of nutrient recycling within
biofilms has been shown to accompany low nutrient
concentrations and this may explain why some
streams did not show a response to added nutrients
(Mulholland et al., 1991). In lotic systems, continuous
unidirectional flow might cause deviation from
expected nutrient limitation patterns related to
concentration. For example, if there is a continuous
flux, and therefore delivery, of nutrients across any
biofilm surface, biofilm nutrient requirements can be
met despite low nutrient concentrations in stream
water. We believe this issue of nutrient flux and
delivery in streams and rivers merits further study
(Borchardt, 1996).
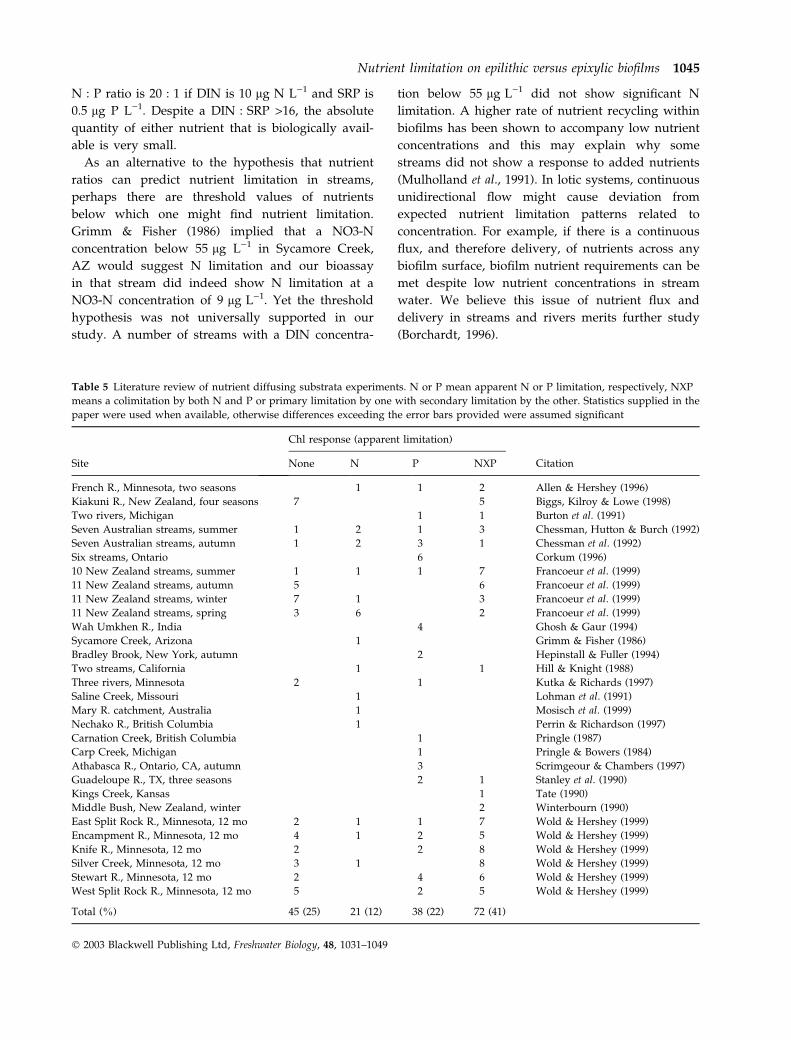
Table 5 Literature review of nutrient diffusing substrata experiments. N or P mean apparent N or P limitation, respectively, NXP
means a colimitation by both N and P or primary limitation by one with secondary limitation by the other. Statistics supplied in the
paper were used when available, otherwise differences exceeding the error bars provided were assumed significant
Site
Chl response (apparent limitation)
CitationNone N P NXP
French R., Minnesota, two seasons 1 1 2 Allen & Hershey (1996)
Kiakuni R., New Zealand, four seasons 7 5 Biggs, Kilroy & Lowe (1998)
Two rivers, Michigan 1 1 Burton et al. (1991)
Seven Australian streams, summer 1 2 1 3 Chessman, Hutton & Burch (1992)
Seven Australian streams, autumn 1 2 3 1 Chessman et al. (1992)
Six streams, Ontario 6 Corkum (1996)
10 New Zealand streams, summer 1 1 1 7 Francoeur et al. (1999)
11 New Zealand streams, autumn 5 6 Francoeur et al. (1999)
11 New Zealand streams, winter 7 1 3 Francoeur et al. (1999)
11 New Zealand streams, spring 3 6 2 Francoeur et al. (1999)
Wah Umkhen R., India 4 Ghosh & Gaur (1994)
Sycamore Creek, Arizona 1 Grimm & Fisher (1986)
Bradley Brook, New York, autumn 2 Hepinstall & Fuller (1994)
Two streams, California 1 1 Hill & Knight (1988)
Three rivers, Minnesota 2 1 Kutka & Richards (1997)
Saline Creek, Missouri 1 Lohman et al. (1991)
Mary R. catchment, Australia 1 Mosisch et al. (1999)
Nechako R., British Columbia 1 Perrin & Richardson (1997)
Carnation Creek, British Columbia 1 Pringle (1987)
Carp Creek, Michigan 1 Pringle & Bowers (1984)
Athabasca R., Ontario, CA, autumn 3 Scrimgeour & Chambers (1997)
Guadeloupe R., TX, three seasons 2 1 Stanley et al. (1990)
Kings Creek, Kansas 1 Tate (1990)
Middle Bush, New Zealand, winter 2 Winterbourn (1990)
East Split Rock R., Minnesota, 12 mo 2 1 1 7 Wold & Hershey (1999)
Encampment R., Minnesota, 12 mo 4 1 2 5 Wold & Hershey (1999)
Knife R., Minnesota, 12 mo 2 2 8 Wold & Hershey (1999)
Silver Creek, Minnesota, 12 mo 3 1 8 Wold & Hershey (1999)
Stewart R., Minnesota, 12 mo 2 4 6 Wold & Hershey (1999)
West Split Rock R., Minnesota, 12 mo 5 2 5 Wold & Hershey (1999)
Total (%) 45 (25) 21 (12) 38 (22) 72 (41)
Nutrient limitation on epilithic versus epixylic biofilms 1045
� 2003 Blackwell Publishing Ltd, Freshwater Biology, 48, 1031–1049
How common is colimitation in streams?
Considering broad patterns of N and P availability,
algal growth in lakes is usually assumed to be limited
by P supply (Hecky & Kilham, 1988) or colimited by P
and N (Elser, Marzolf & Goldman, 1990; Dodds,
Johnson & Priscu, 1989). Is this also true for streams?
In a literature review of previously published NDS
studies (all for epilithon in lotic systems), we found
that limitation of algal biomass by both N and P
together was reported most frequently (41% of
occasions, Table 5). The next most common response
was no response to N or P addition (25%), followed
by 22% occurrence of solely P limitation, and N
limitation alone reported for 12% of the cases
(Table 5). Using meta-analysis of lotic NDS studies
that resulted in increased statistical power, Francoeur
(2001) found that simultaneous stimulation of algae
by >1 nutrient (e.g. both N and P) was the most
frequent response and concluded that multispecies
biofilm communities are unlikely to be limited by just
one nutrient. The results from our study are consis-
tent with these general trends from previous studies
and indicate that sole P limitation, despite very low
apparent SRP concentrations, seems less frequent in
streams than in lakes, even for the heterotrophic
biofilms not previously studied in this context. In fact,
we never saw algal limitation by P alone and it
occurred only twice for the fungi on wood (Table 4).
Why is colimitation by N and P so common? Previous
research has shown that algal species differ in the
nutrient requirements (e.g. Borchardt, 1996) and it
follows that species-specific nutrient requirements
could exist for heterotrophic microbes as well. In a
multispecies biofilm, be it heterotrophic, autotrophic
or a mix of the two, different species can be limited by
different nutrients. Additionally, when N and P
concentrations are very low, there may be an additive
effect of N + P amendment. Adding N or P alone
would not affect biofilm biomass, but the addition of
the primary limiting nutrient depletes the secondary
limiting nutrient sufficiently quickly for both nutri-
ents to limit growth (Tate, 1990; Francoeur, 2001).
Our results suggest that different nutrients or
combinations of nutrients may limit heterotrophic
and autotrophic components of stream biofilms and
these differences may vary spatially across habitats
and substrata. When designing nutrient enrichment
bioassays, substrata should be chosen that are as
similar as possible to the dominant substratum type in
the stream. Two lines of future research could
improve our understanding of nutrient-biofilm rela-
tionships in streams: (1) further research into the
geographic distribution of N and P limitation and (2)
taxonomic composition of biofilms (including bac-
teria) and how it might change with nutrient addition.
Acknowledgments
We thank J. Schaefer for help with the laboratory
analysis of ergosterol. T.V. Royer, A. Hildrew, and
two very thoughtful anonymous reviews helped to
improve earlier drafts of the manuscript. This study
was part of the Lotic Intersite Nitrogen eXperiment
(LINX) supported by a grant from the Ecosystems
Program, National Science Foundation, awarded to
Virginia Tech (DEB-9628860).
References
Allen N.S. & Hershey A.E. (1996) Seasonal changes in
chlorophyll a response to nutrient amendments in a
North Shore tributary of Lake Superior. Journal of the
North American Benthological Society, 15, 170–178.
APHA. (1995) Standard Methods for the Examination of
Water and Wastewater, 19th edn. American Public
Health Association, Washington.
Aumen N.G., Bottomley P.J. & Gregory S.V. (1985) Impact
of nitrogen and phosphorus on [14C]-lignocellulose
decomposition by stream wood microflora. Applied and
Environmental Microbiology, 49, 1113–1118.
Aumen N.G., Bottomley P.J., Ward G.M. & Gregory S.V.
(1983) Microbial decomposition of wood in streams:
distribution of microflora and factors affecting 14C
Lignocellulose mineralization. Applied and Environmen-
tal Microbiology, 46, 1409–1416.
Barlocher F. (1985) The role of fungi in the nutrition of
stream invertebrates. Botanical Journal of the Linnean
Society, 91, 83–94.
Biggs B.J.F. & Close M.E. (1989) Periphyton biomass
dynamics in gravel bed rivers: The relative effects of
flows and nutrients. Freshwater Biology, 22, 209–231.
Biggs B.J., Kilroy C. & Lowe R.L. (1998) Periphyton
development in three valley segments of a New
Zealand grassland river: Test of a habitat matrix
conceptual model within a catchment. Archiv f€uur
Hydrobiologie, 143, 147–177.
Borchardt M.A. (1996) Nutrients. In: Algal Ecology (Eds
R.J. Stevenson, M.L. Bothwell & R.L. Lowe). Academic
Press, California.
1046 J.L. Tank and W.K. Dodds
� 2003 Blackwell Publishing Ltd, Freshwater Biology, 48, 1031–1049

Bott T.L. (1983) Primary productivity in streams. In:
Stream Ecology (Eds J.R. Barnes & G.W. Minshall).
Plenum Press, New York.
Brett M.T. & Goldman C.R. (1997) Consumer vs. resource
control in freshwater pelagic foodwebs. Science, 275,
384–386.
Burton T.M., Oemke M.P. & Molloy J.M. (1991) Con-
trasting effects of nitrogen and phosphorus additions
on epilithic algae in a hardwater and a softwater
stream in northern Michigan. Internationale Vereinigung
Fur Theoretische Und Angewandte Limnologie, 24, 1644–
1653.
Chessman B.C., Hutton P.E. & Burch J.M. (1992) Limiting
nutrients for periphyton growth in sub-alpine, forest,
agricultural, and urban streams. Freshwater Biology, 28,
349–361.
Corkum L.D. (1996) Responses of chlorophyll-a, organic
matter, and macroinvertebrates to nutrient additions in
rivers flowing through agricultural and forested land.
Archiv f€uur Hydrobiologie, 136, 391–411.
Dodds W.K. (1991) Micro-environmental characteristics
of filamentous algal communities in flowing freshwa-
ters. Freshwater Biology, 25, 199–209.
Dodds W.K., Johnson K. & Priscu J.C. (1989) Simulta-
neous nitrogen and phosphorus deficiency in natural
phytoplankton assemblages: theory, empirical evi-
dence, and implications for lake management. Lake
Reservoir Management, 5, 21–26.
Dodds W.K., Smith V.H. & Zander B. (1997) Developing
nutrient targets to control benthic chlorophyll levels in
streams: a case study of the Clark Fork River. Water
Resources, 31, 1738–1750.
Dube M.G., Culp J.M. & Scrimgeour G.J. (1997) Nutrient
limitation and herbivory: processes influenced by
bleached kraft pulp mill effluent. Canadian Journal of
Fisheries and Aquatic Sciences, 54, 2584–2595.
Elser J.J., Marzolf E.R. & Goldman C.R. (1990) Phos-
phorus and nitrogen limitation of phytoplankton
growth in the freshwaters of North America – a review
and critique of experimental enrichments. Canadian
Journal of Fisheries and Aquatic Sciences, 47, 1468–1477.
Elwood J.W., Newbold J.D., Trimble A.F. & Stark R.W.
(1981) The limiting role of phosphorus in a woodland
stream ecosystem: effects of P enrichment on leaf
decomposition and primary producers. Ecology, 62,
146–158.
Findlay S.E.G. & Arsuffi T.L. (1989) Microbial growth
and detritus transformations during decomposition of
leaf litter in a stream. Freshwater Biology, 21, 261–269.
Francoeur S.N. (2001) Meta-analysis of lotic nutrient
amendment experiments: detecting and quantifying
subtle responses. Journal of the North American Bentho-
logical Society, 20, 358–368.
Francoeur S.N., Biggs B.J.F., Smith R.A. & Lowe R.L.
(1999) Nutrient limitation of algal biomass accrual in
streams: seasonal patterns and a comparison of
methods. Journal of the North American Benthological
Society, 18, 242–260.
Gessner M.O. & Chauvet E. (1994) Importance of stream
microfungi in controlling breakdown rates of leaf litter.
Ecology, 75, 1807–1817.
Gessner M.O., Suberkropp K. & Chauvet E. (1997)
Decomposition of plant litter by fungi in marine and
freshwater ecosysems. In: The Mycota IV: Environmental
and Microbial Relationships (Ed. W. Soderstrom). Sprin-
ger-Verlag, Berlin.
Ghosh M. & Gaur J.P. (1994) Algal periphyton of an
unshaded stream in relation to in situ nutrient
enrichment and current velocity. Aquatic Botany, 47,
185–189.
Gregory S.V. (1980) Effects of light, nutrients, and
grazing on periphyton communities in streams.
PhD Dissertation, Oregon State University, Corvallis,
OR.
Grimm N.B. & Fisher S.G. (1986) Nitrogen limitation in a
Sonoran Desert stream. Journal of the North American
Benthological Society, 5, 2–15.
Hart D.D. & Robinson C.T. (1990) Resource limitation
in a stream community: phosphorus enrichment
effects on periphyton and grazers. Ecology, 71, 1494–
1502.
Hax C.L. & Golladay S.W. (1993) Macroinvertebrate
colonization and biofilm development on leaves and
wood in a boreal river. Freshwater Biology, 29, 79–87.
Hecky R.E. & Kilham P. (1988) Nutrient limitation of
phytoplankton in freshwater and marine environ-
ments: a review of recent evidence on the effects of
enrichment. Limnology and Oceanography, 33, 796–822.
Hepinstall J.A. & Fuller R.L. (1994) Periphyton reactions
to different light and nutrient levels and the response
of bacteria to these manipulations. Archiv f€uur Hydro-
biologie, 131, 161–173.
Hill W.R. (1996) Effects of light. In: Algal Ecology (Eds R.J.
Stevenson, M.L. Bothwell & R.L. Lowe). Academic
Press, California.
Hill W.R. & Knight A.W. (1988) Nutrient and light
limitation of algae in two northern California streams.
Journal of Phycology, 24, 125–132.
Howarth R.W. & Fisher S.G. (1976) Carbon, nitrogen, and
phosphorus dynamics during leaf decay in nutrient-
enriched stream microecosystems. Freshwater Biology, 6,
221–228.
Hullar M.A. & Vestal J.R. (1989) The effects of nutrient
limitation and stream discharge on the epilithic
microbial community in an oligotrophic arctic stream.
Hydrobiologia, 172, 19–26.
Nutrient limitation on epilithic versus epixylic biofilms 1047
� 2003 Blackwell Publishing Ltd, Freshwater Biology, 48, 1031–1049

Kaushik N.K. & Hynes H.B.N. (1971) The fate of the dead
leaves that fall into streams. Archiv f€uur Hydrobiologie, 68,
465–515.
Kutka F.J. & Richards C. (1997) Short-term nutrient
influences on algal assemblages in three rivers of the
Minnesota River basin. Journal of Freshwater Ecology, 12,
411–419.
Lohman K., Jones J.R. & Baysinger-Daniel C. (1991)
Experimental evidence for nitrogen limitation in a
Northern Ozark stream. Journal of the North American
Benthological Society, 10, 14–23.
Lowe R.L., Golladay S.W. & Webster J.R. (1986) Periph-
yton response to nutrient manipulation in streams
draining clearcut and forested watersheds. Journal of
the North American Benthological Society, 5, 221–229.
Melillo J.M., Aber J.D. & Muratore J.F. (1982) Nitrogen
and lignin control of hardwood leaf litter decomposi-
tion dynamics. Ecology, 63, 621–626.
Melillo J.M., Naiman R.J., Aber J.D. & Eshleman K.N.
(1983) The influence of substrate quality and stream
size on wood decomposition dynamics. Oecologia, 58,
281–285.
Meyer J.L. & Johnson C. (1983) The influence of elevated
nitrate concentration on rate of leaf decomposition in a
stream. Freshwater Biology, 13, 177–183.
Meyer J.L., McDowell W.H., Bott T.L., Elwood J.W.,
Ishizaki C., Melack J.M., Peckarsky B.L., Peterson B.J.
& Rublee P.A. (1988) Elemental dynamics in streams.
Journal of the North American Benthological Society, 7, 410–
432.
Mosisch T.D., Bunn S.E., Davies P.M. & Marshall C.J.
(1999) Effect of shade and nutrient manipulation on
periphyton growth in a subtropical stream. Aquatic
Botany, 64, 167–177.
Mulholland P.J., Elwood J.W., Webster J.R., Ferren L.A. &
Perkins R.E. (1984) Phosphorus uptake by decomposing
leaf detritus: effect of microbial biomass and activity.
Verhandlungen der Internationalen Vereinigung f€uur Theore-
tische und Angewandte Limnologie, 22, 1899–1905.
Mulholland P.J., Fellows C.S., Tank J.L. et al. (2001)
Inter-biome comparison of factors controlling stream
metabolism. Freshwater Biology, 46, 1503–1517.
Mulholland P.J., Newbold J.D., Elwood J.W., Ferren L.A.
& Webster J.R. (1985) Phosphorus spiraling in a
woodland stream: seasonal variations. Ecology, 66,
1012–1023.
Mulholland P.J. & Rosemond A.D. (1992) Periphyton
response to longitudinal nutrient depletion in a
woodland stream: evidence of upstream-downstream
linkage. Journal of the North American Benthological
Society, 11, 405–419.
Mulholland P.J., Steinman A.D., Palumbo A.V., Elwood
J.W. & Kirschtel D.B. (1991) Role of nutrient cycling
and herbivory in regulating periphyton communities
in laboratory streams. Ecology, 72, 966–982.
Newbold J.D., Elwood J.W., Schulze M.S., Stark R.W. &
Barmeier J.C. (1983) Continuous ammonium enrich-
ment of a woodland stream: uptake kinetics, leaf
decomposition, and nitrification. Freshwater Biology, 13,
193–204.
Newell S.Y., Arsuffi T.L. & Fallon R.D. (1988) Funda-
mental procedures for determining ergosterol content
of decaying plant material by liquid chromatography.
Applied and Environmental Microbiology, 54, 1869–1876.
Perrin C.J. & Richardson J.S. (1997) N and P limitation of
benthos abundance in the Nechako River, British
Columbia. Canadian Journal of Fisheries and Aquatic
Science, 54, 2574–2583.
Peterson C.G. (1996) Responses of benthic algal commu-
nities to natural physical disturbance. In: Algal Ecology
(Eds R.J. Stevenson, M.L. Bothwell & R.L. Lowe).
Academic Press, California.
Peterson B.J., Deegan L., Helfrich J. et al. (1993) Biological
responses of a tundra river to fertilization. Ecology, 74,
653–672.
Pringle C.M. (1987) Effects of water and substratum
nutrient supplies on lotic periphyton growth: an
integrated bioassay. Canadian Journal of Fisheries and
Aquatic Science, 44, 619–629.
Pringle C.M. & Bowers J.A. (1984) An in situ substratum
fertilization technique: diatom colonization on nutri-
ent-enriched, sand substrata. Canadian Journal of Fish-
eries and Aquatic Sciences, 41, 1247–1251.
Pringle C.M., Paaby-Hansen P., Vaux P.D. & Goldman
C.R. (1986) In situ nutrient assays of periphyton
growth in a lowland Costa Rican stream. Hydrobiologia,
134, 207–213.
Rosemond A.D. (1993) Interactions among irradiance,
nutrients, and herbivores constrain a stream algal
community. Oecologia, 94, 584–594.
Rosemond A.D., Mulholland P.J. & Elwood J.W. (1993)
Top-down and bottom-up control of stream periph-
yton: effects of nutrients and herbivores. Ecology, 74,
1264–1280.
Rosemond A.D., Pringle C.M., Ramirez A., Paul M.J. &
Meyer J.L. (2002) Landscape variation in phosphorus
concentration and effects on detritus-based tropical
streams. Limnology and Oceanography, 47, 278–289.
Royer T.V. & Minshall G.W. (2001) Effects of nutrient
enrichment and leaf quality on the breakdown of leaves
in a headwater stream. Freshwater Biology, 46, 603–610.
Scrimgeour G. & Chambers P. (1997) Development and
application of a nutrient-diffusing bioassay for large
rivers. Freshwater Biology, 38, 221–231.
Stanley E.H., Short R.A., Harrison J.W., Hall R. &
Wiedenfeld R.C. (1990) Variation in nutrient limitation
1048 J.L. Tank and W.K. Dodds
� 2003 Blackwell Publishing Ltd, Freshwater Biology, 48, 1031–1049

of lotic and lentic algal communities in a Texas (USA)
river. Hydrobiologia, 206, 61–71.
Steinman A.D. (1996) Effects of grazers on freshwater
benthic algae. In: Algal Ecology (Eds R.J. Stevenson, M.L.
Bothwell & R.L. Lowe). Academic Press, California.
Suberkropp K. & Chauvet E. (1995) Regulation of leaf
breakdown by fungi in streams: influences of water
chemistry. Ecology, 76, 1433–1445.
Suberkropp K. & Klug M.J. (1976) Fungi and bacteria
associated with leaves during processing in a wood-
land stream. Ecology, 57, 707–719.
Tank J.L. & Webster J.R. (1998) Interaction of substrate
and nutrient availability on wood biofilm processes in
streams. Ecology, 79, 2168–2179.
Tank J.L. & Winterbourn M.J. (1995) Biofilm develop-
ment and invertebrate colonization of wood in four
New Zealand streams of contrasting pH. Freshwater
Biology, 34, 303–315.
Tank J.L. & Winterbourn M.J. (1996) Microbial activity
and invertebrate colonisation of wood in a New
Zealand forest stream. New Zealand Journal of Marine
and Freshwater Research, 30, 271–280.
Tate C.M. (1990) Patterns and controls of nitrogen in
tallgrass prairie streams. Ecology, 71, 2007–2018.
Triska F.J. & Sedell J.R. (1976) Decomposition of four
species of leaf litter in response to nitrate manipula-
tion. Ecology, 57, 783–792.
Winterbourn M.J. (1990) Interactions among nutrients,
algae and invertebrates in a New Zealand mountain
stream. Freshwater Biology, 23, 463–474.
Wold A.P. & Hershey A.E. (1999) Spatial and temporal
variability of nutrient limitation in 6 North Shore
tributaries to Lake Superior. Journal of the North
American Benthological Society, 18, 2–14.
(Manuscript accepted 17 February 2003)
Nutrient limitation on epilithic versus epixylic biofilms 1049
� 2003 Blackwell Publishing Ltd, Freshwater Biology, 48, 1031–1049