Embed Size (px)
Citation preview
Nitrogen Inflation for Passenger Car and Light Truck Tires
John W. Daws, Ph.D., P.E. Daws Engineering, LLC
4535 W. Marcus Dr. Phoenix, AZ 85083
Presented at the September 2010
Meeting of the Tire Society Akron, OH
2
J.W. Daws
Nitrogen Inflation for Passenger Car and Light Truck Tires
REFERENCE: J.W. Daws, “Nitrogen Inflation for Passenger Car and Light Truck Tires,” submitted for presentation at the 2010 Tire Society Meeting, and for consideration for publication in the journal Tire Science and Technology.
ABSTRACT: Nitrogen as an inflation gas for passenger car and light truck tires use is widely available commercially. Consumers are confronted with a bewildering selection of offerings, and suppliers tout the purity of their nitrogen generation systems and effectiveness of using the gas in place of air. This paper develops models for the initial tire nitrogen purity, the inflation pressure loss rate, and the evolution of the nitrogen gas purity in the tire as a function of the gas used to top off the tire over its life. A series of simulations using the basic model is developed for air and various purities of nitrogen initial inflation with monthly top-off using air or various purities of nitrogen. The initial inflation pressure loss rate is shown as a function of the tire’s initial nitrogen purity. This paper proposes the use of the total oxygen passing through the tire over its lifetime as a metric for evaluation of various inflation schemes. This metric is developed for several of the popular available nitrogen inflation purities using both air and nitrogen as a top-off gas.
KEY WORDS: Nitrogen inflation, inflation pressure loss rate, nitrogen purity evolution, oxygen flow across a tire.
Nomenclature
A inner liner surface area of tire B reaction kinetics constant E activation energy for a given reaction K reaction rate G gauge (thickness) of tire MO2 mass of oxygen corresponding to a loss in partial pressure N number of inflation steps P absolute partial pressure of a gas in the tire P0 initial internal absolute partial pressure of a gas in the tire PA absolute partial pressure of a gas in the atmosphere Q permeability coefficient for an ideal gas R ideal gas constant Rc compression ratio at maximum tire inflation pressure t time T absolute temperature V tire internal volume nitrogen purity of a gas
3
Introduction
Nitrogen inflation has not been adopted by any vehicle manufacturers, nor has it been promoted by
tire manufacturers, but nitrogen inflation for passenger car and light truck tires is widely promoted
in the tire service industry. Many claims are made by supporters of nitrogen inflation: lower
inflation pressure loss rates (IPLR), lower rolling resistance, higher fuel economy, lower running
temperature, improved wear, and reduced age-related degradation, to name a few. The normal
reasoning presented is that the tire materials are significantly more permeable to oxygen than to
nitrogen (some promotional documents even suggest that nitrogen will not leak out of the tire at
all), while omitting the information that the partial pressure of nitrogen inside the tire is several
times higher than that of oxygen. Clearly, claims of lower rolling resistance and lower running
temperature and improved wear have no hope of being scientifically valid, since these tire
characteristics are controlled by the mechanical deformation of the tire’s hysteretic materials.
There have been several studies aimed at validating one or more of these claims, but the tire types
and conditions tested have varied widely and were observed over a short time. The issues are
complicated by the fact that tire service providers offering nitrogen do not all offer the same level
of nitrogen inflation gas purity, and the maintenance of the inflation pressure in the tire is the
responsibility of the vehicle owner who may follow any number of inflation maintenance
strategies.
This paper will examine a number of the issues that are key to nitrogen inflation. The first is the
initial inflation of the tire with nitrogen. Since there is always some air in the tire due to the bead
seating process, the inflation of a tire with nitrogen typically is done using a number of inflation
and deflation cycles. A model will be presented to yield the nitrogen purity in the tire as a function
of the purity of the inflating gas, the maximum inflation pressure of the tire, and the number of
inflation steps used. The second issue that will be addressed is the inflation pressure loss rate. A
simple model will be developed that allows the study of the evolution of the nitrogen and oxygen
purities in the tire over the life of the tire. It will be shown that the inflation pressure loss rate
evolves with the nitrogen purity in the tire and that, in fact, inflation with gases at a higher nitrogen
purity than that of air do reduce the inflation pressure loss rate. This model is used to determine the
amount of oxygen flowing out of or into the tire between top-offs of tire pressure. This paper
4
proposes the use of the oxygen flow across the tire material as a metric for evaluating the
effectiveness of various nitrogen management strategies.
Background
The spread of nitrogen inflation in the tire service industry has led to the availability of many
different sources, and different purities, of the nitrogen inflation gas itself. The most common form
of nitrogen supply system depends on the use of a membrane to extract the nitrogen from a
compressed air stream. One of the characteristics of these membranes is that the level of nitrogen
purity in the output gas is directly dependent upon the flow rate of the gas output. On some
systems, there is a switch that allows the shop to select any purity between 95% and 98%. These
systems also depend upon proper maintenance of filters in front of the membrane, with the filters
being designed to extract water vapor and oils from the compressed air stream prior to its entering
the membrane. Any degradation of these filters due to lack of maintenance has the potential to
compromise the purity of the nitrogen being generated. These types of nitrogen generation systems
have considerable capital costs that depend upon their output rate. A second type of nitrogen
supply is welding nitrogen supplied in standard tanks. While the capital outlay is significantly less,
the cost per standard cubic foot of nitrogen gas is much higher. However, the purity is guaranteed
to be greater than 99.98% (100% will be used for this source in all subsequent analyses), although
there are also safety issues in handling high-pressure tanks routinely in a tire shop. The
combination of cost and handling issues mean that tank-supplied nitrogen is not widely used in the
tire service industry. The costs for a shop to offer nitrogen inflation to consumers will be a
function of the nitrogen source, direct labor, and consumable supplies.
Nitrogen inflation for on-road vehicle tires has been studied for decades, either as a method for the
tire service industry to exploit or to develop insight into tire aging. Sperberg [1] discussed nitrogen
inflation as a means of improving tire life in 1967. Tokita [2] discussed the use of an oxygen
permeation and consumption model in conjunction with more rapid aging of tires for wheel tests.
The model proposed in that paper accounted for the permeation of oxygen through the tire as well
as for the reaction of oxygen with the rubber hydrocarbon. A mixture of 50% nitrogen and 50%
oxygen was used in that study as a means of accelerating the oxidation of the tire’s rubber
components. Tokita concluded that there was a correlation between the amount of oxygen
5
absorbed by the tire and both the tire’s breaker rubber strength and the mileage to failure on a given
wheel test. More recently, Baldwin [3] showed the results of the influence of nitrogen on belt skim
stock properties. Of particular interest was that there was no apparent benefit beyond about 96%
nitrogen purity in the tire. Karmarker [4] discussed the results of an investigation on the influence
of nitrogen inflation on belt skim stock. Karmarker noted that “it has been shown that property
changes with greater than 95% purity in a tire are within the error limits inherent in tire variations”.
MacIsaac [5], with the National Highway Traffic Safety Administration (NHTSA), has also studied
the influence of nitrogen inflation on tire performance. In that study, NHTSA found that the IPLR
of the tires studied did decrease with increasing purity of the nitrogen in the tire, and that the IPLR
in dynamic testing was greater than in static tests. NHTSA concluded that there was no direct
effect of nitrogen purity on rolling resistance. As an aside, NHTSA found that the nitrogen purity
in air-inflated tires actually increased over time. NHTSA also tested tires with 50% nitrogen, air,
and 95% nitrogen by oven aging at 65C, followed by Federal Motor Vehicle Safety Standard
(FMVSS) Number 139 endurance tests, and found that some of the tires inflated with 50% nitrogen
failed the wheel test while all those inflated with air or 95% nitrogen passed. Most recently, Napier
and Waddell [6] studied nitrogen inflation using laboratory tests and vehicle studies and concluded
that nitrogen affected neither the operating temperature nor the rolling resistance coefficient
directly.
Initial Gas Discussion
Nitrogen, oxygen, and the rest of the components of air are considered ideal gases at pressures and
temperatures found in tires. For the purposes of the analyses in this paper, air is considered to be
78.1% nitrogen and 21.9% oxygen, as the trace gases are generally found to comprise less than
about one percent of the total. Following Dalton’s Law (i.e., the pressure of a mixture of ideal
gases equals the sum of the pressures of its constituents if each existed alone at the temperature and
volume of the mixture) for air at 1 Bar (14.7 psia), the partial pressure of nitrogen in the
atmosphere is about 79.3 kPa (11.5 psia), and the partial pressure of oxygen in the atmosphere is
about 22.1 kPa (3.2 psia). Each of these gases is deemed to behave independently in the tire. Since
the tire pressure is higher than that of the atmosphere, and the partial pressures of nitrogen and
oxygen in the tire depend upon nitrogen purity in the tire, these gases will permeate through the tire
6
materials at a rate that is dependent upon the permeability coefficient of the tire materials to each
gas and the pressure difference between the partial pressures of each gas inside and outside the tire.
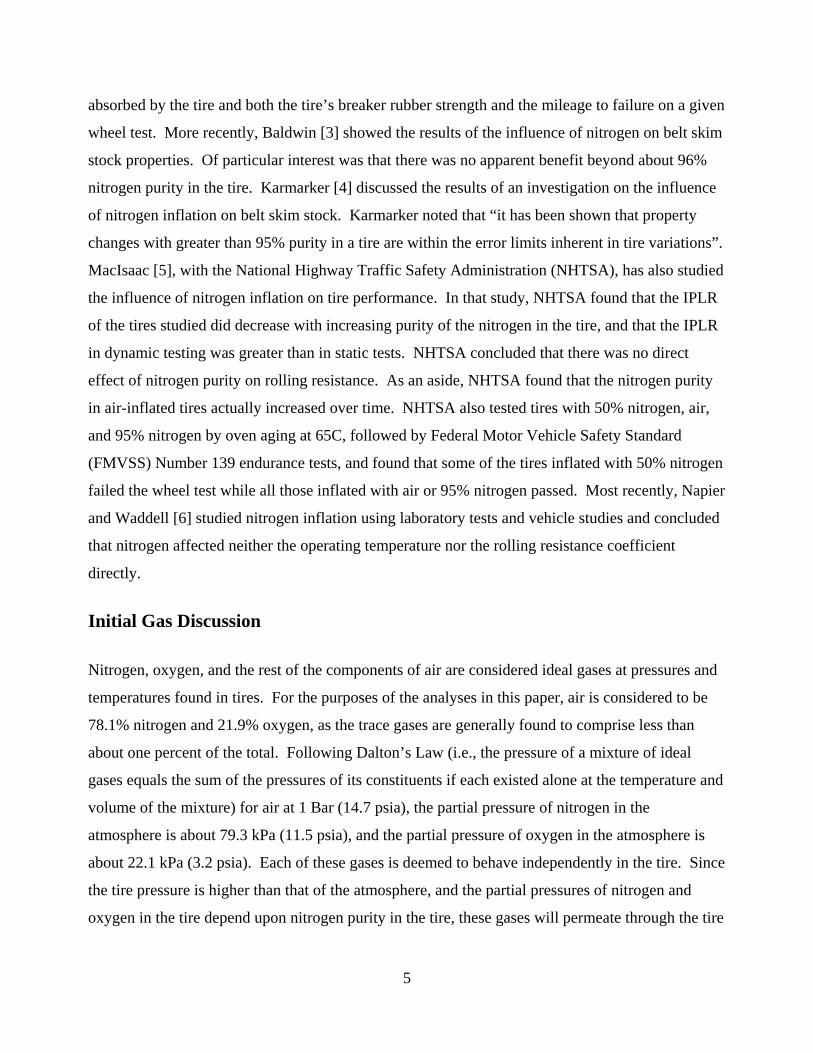
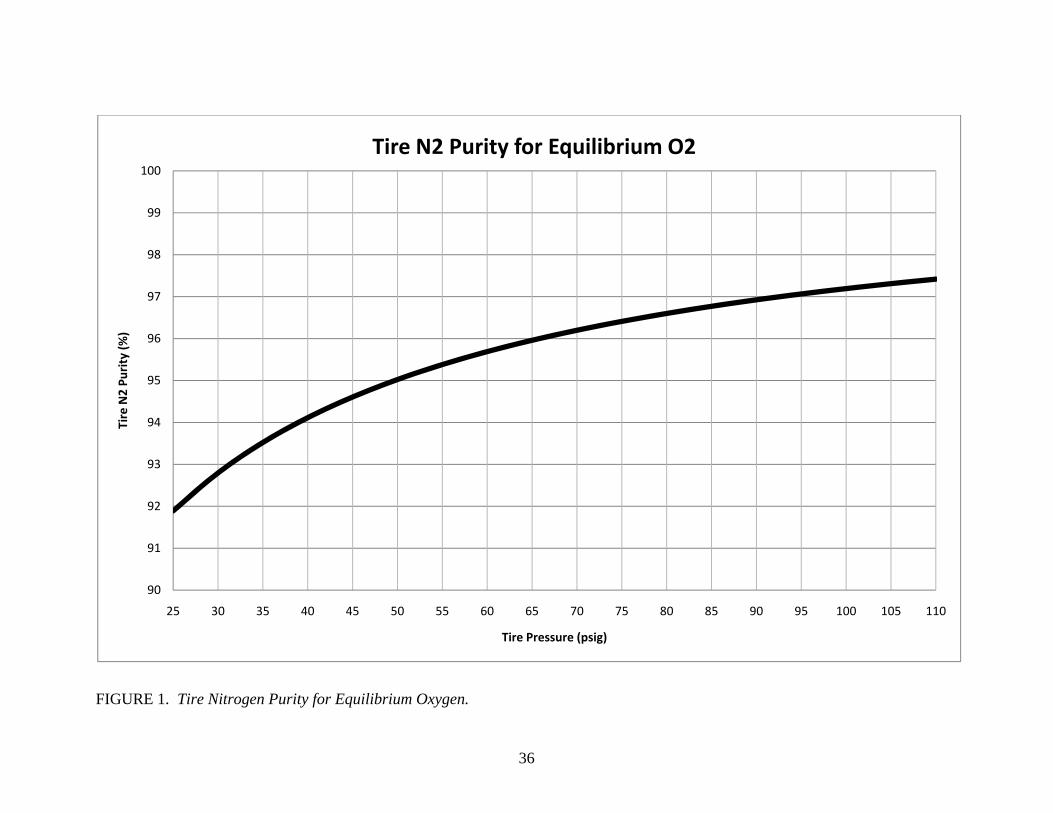
Since one of the objectives of nitrogen inflation is to minimize the permeation of oxygen through
the tire, it follows that for every tire inflation pressure, there is a purity of nitrogen where the partial
pressure of the oxygen inside the tire is equal to the partial pressure of oxygen in the atmosphere.
Figure 1 shows this relationship in graphical form. For a P-metric standard load tire with a
maximum inflation pressure of 240 kPa (35 psi), the equilibrium nitrogen purity level would be
about 93.5%. For a Load Range E light truck tire with a maximum inflation pressure of 550 kPa
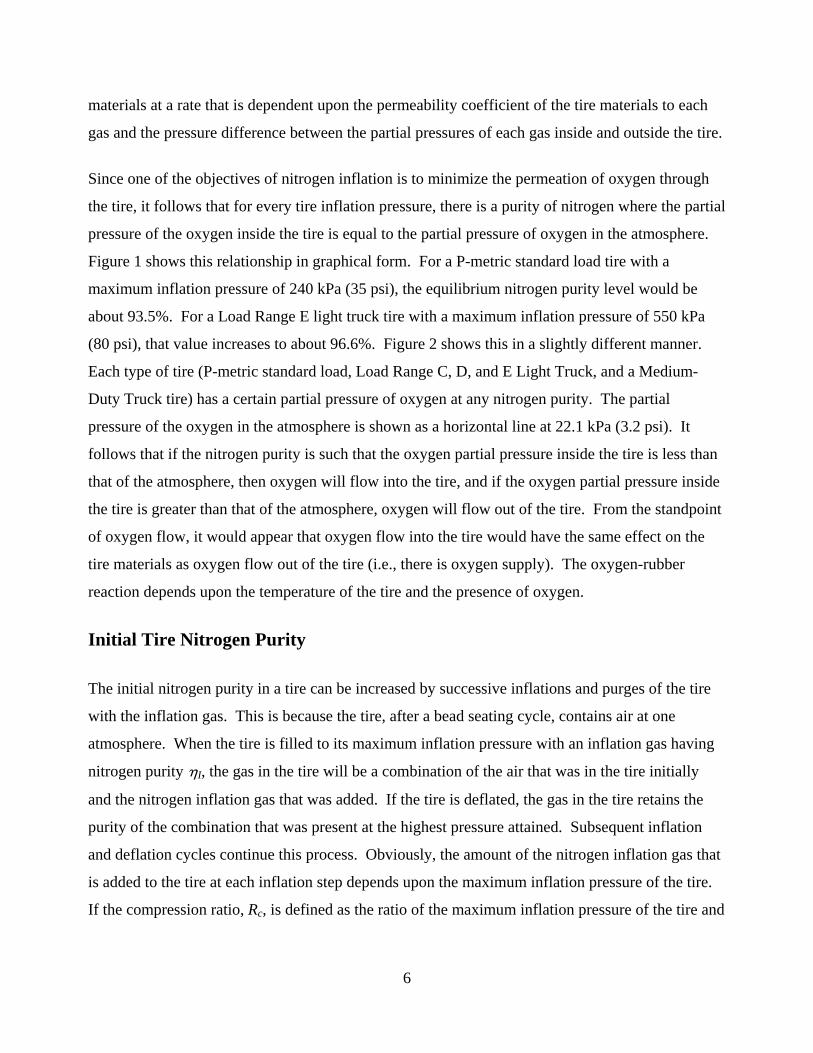
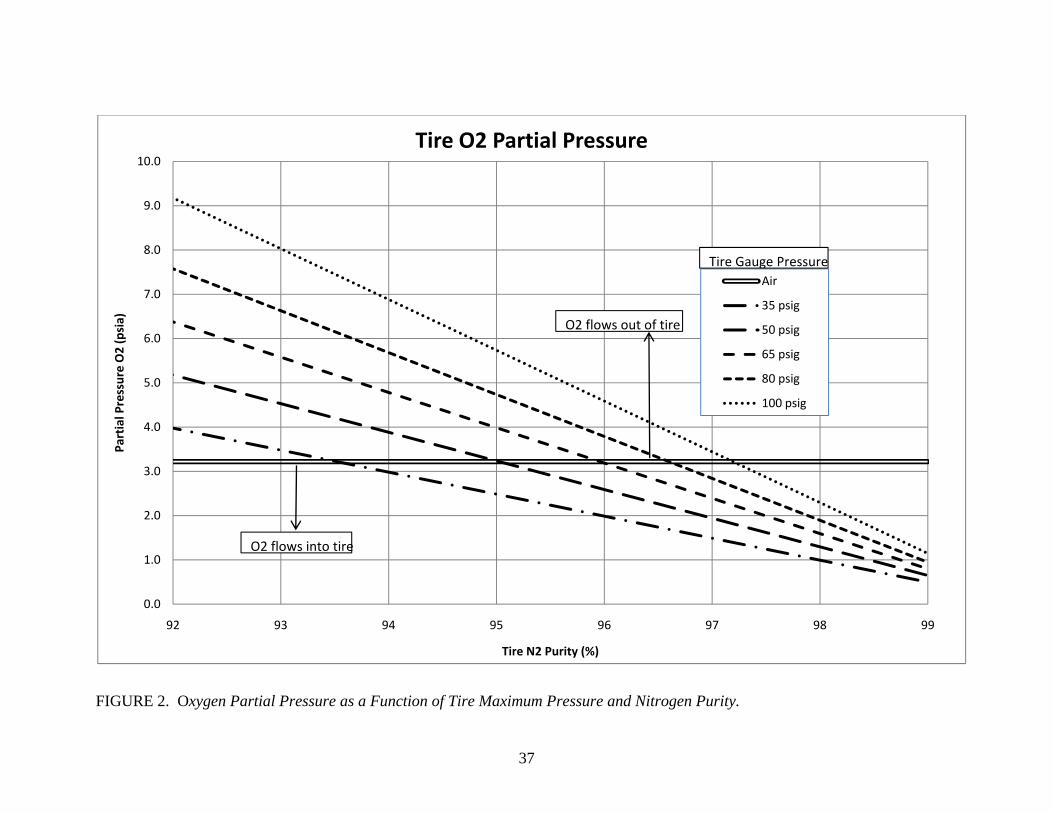
(80 psi), that value increases to about 96.6%. Figure 2 shows this in a slightly different manner.
Each type of tire (P-metric standard load, Load Range C, D, and E Light Truck, and a Medium-
Duty Truck tire) has a certain partial pressure of oxygen at any nitrogen purity. The partial
pressure of the oxygen in the atmosphere is shown as a horizontal line at 22.1 kPa (3.2 psi). It
follows that if the nitrogen purity is such that the oxygen partial pressure inside the tire is less than
that of the atmosphere, then oxygen will flow into the tire, and if the oxygen partial pressure inside
the tire is greater than that of the atmosphere, oxygen will flow out of the tire. From the standpoint
of oxygen flow, it would appear that oxygen flow into the tire would have the same effect on the
tire materials as oxygen flow out of the tire (i.e., there is oxygen supply). The oxygen-rubber
reaction depends upon the temperature of the tire and the presence of oxygen.
Initial Tire Nitrogen Purity
The initial nitrogen purity in a tire can be increased by successive inflations and purges of the tire
with the inflation gas. This is because the tire, after a bead seating cycle, contains air at one
atmosphere. When the tire is filled to its maximum inflation pressure with an inflation gas having
nitrogen purity I, the gas in the tire will be a combination of the air that was in the tire initially
and the nitrogen inflation gas that was added. If the tire is deflated, the gas in the tire retains the
purity of the combination that was present at the highest pressure attained. Subsequent inflation
and deflation cycles continue this process. Obviously, the amount of the nitrogen inflation gas that
is added to the tire at each inflation step depends upon the maximum inflation pressure of the tire.
If the compression ratio, Rc, is defined as the ratio of the maximum inflation pressure of the tire and
7
the atmospheric pressure of air (both in absolute units), then the amount of nitrogen that will be
added to the tire having 100 units of air will be:
1
where I is the nitrogen purity of the inflation gas. The total nitrogen in the tire at the end of the
inflation-deflation step will be:
1
where A is the nitrogen purity of air (78.1%). Since the total amount of gas in the tire that initially
held 100 units would be 100Rc, the percentage purity of the nitrogen in the tire after this first
inflation step will be given as:
11
where 1 is the nitrogen purity after the first inflation step. Continuing the same analysis for the
second and subsequent inflation steps yields the following general relation:
11
where N is the nitrogen purity at the end of the Nth inflation step. This clearly shows that the
nitrogen purity in a tire depends upon the inflation gas purity as well as the maximum inflation
pressure of the tire. Equation 4 also clearly shows that the nitrogen purity in a tire cannot exceed
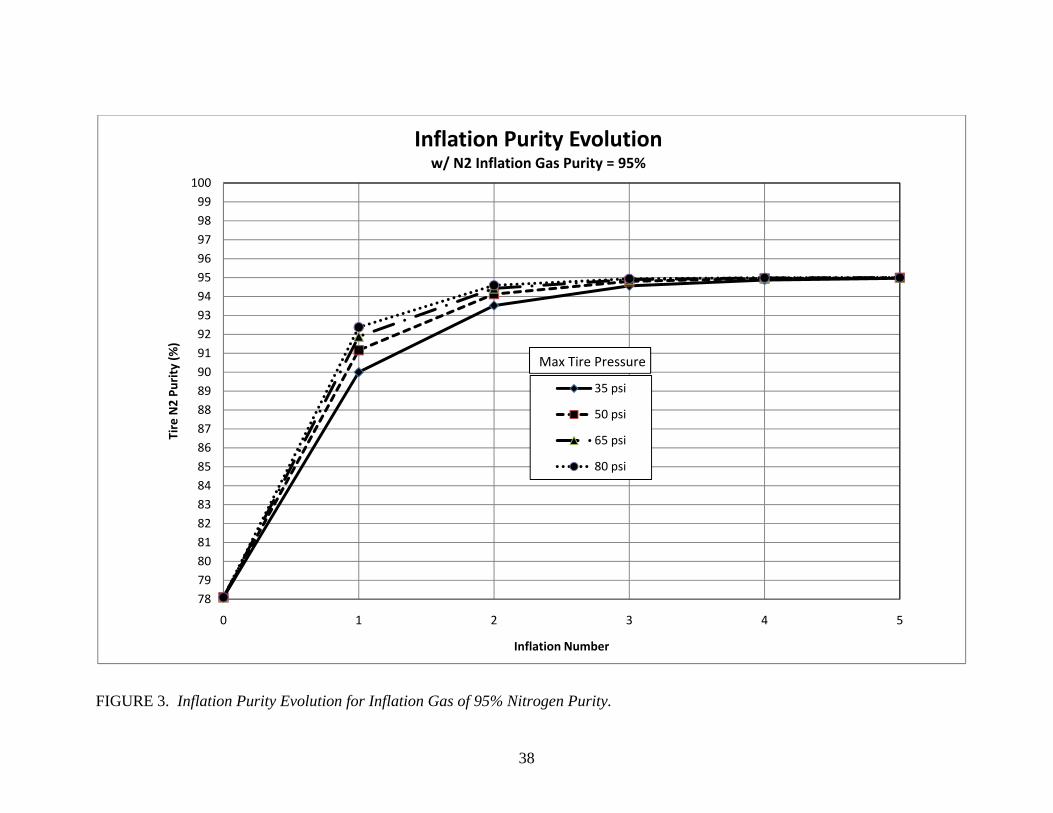
the purity of the inflation gas, regardless of the number of inflation steps used. Figure 3 shows the
evolution of nitrogen purity with inflation steps for passenger and light truck tires when the
inflation gas has 95% nitrogen purity. By the fourth inflation step, all tire types have attained
nearly the same purity as the inflation gas. The P-metric standard load tire, as expected, lags the
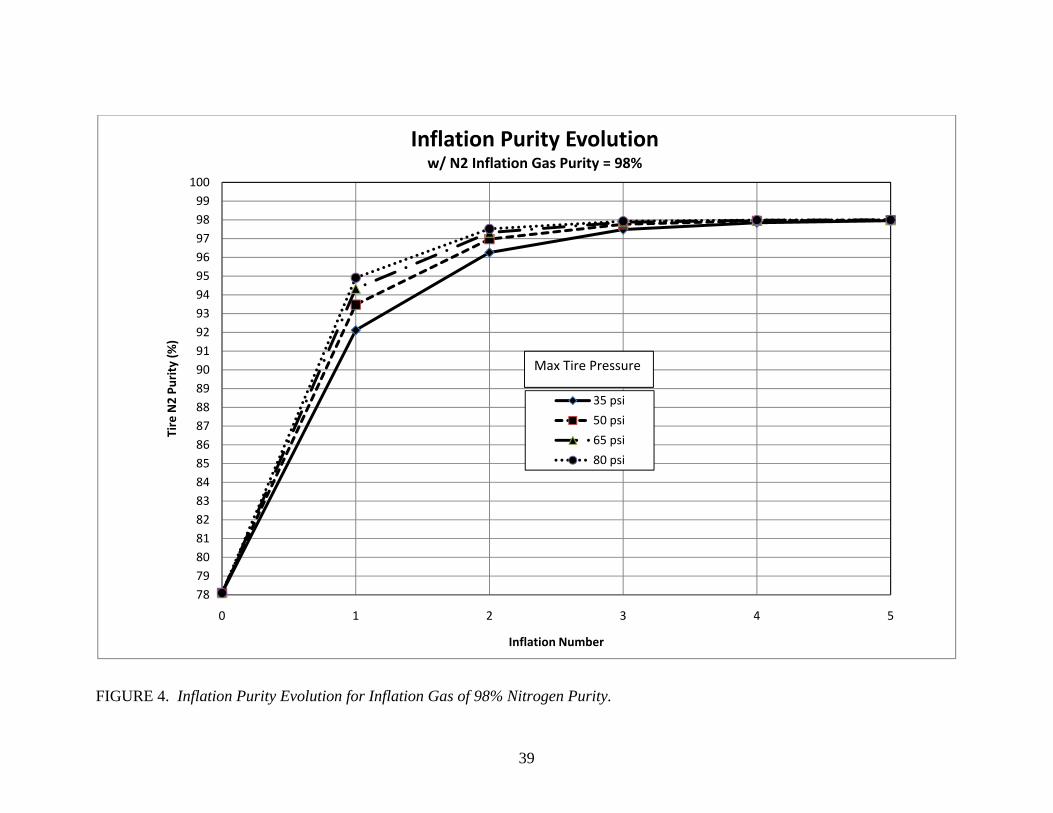
light truck tires, especially on the first and second inflation step. Figure 4 shows the same data for
an inflation gas having 98% nitrogen purity. The same type of behavior is noted. Clearly,
depending upon the level of initial inflation purity desired, for P-metric Standard Load tires
especially, the choice of inflation gas purity is critical to the creation of an effective inflation
[3]
[1]
[2]
[4]
8
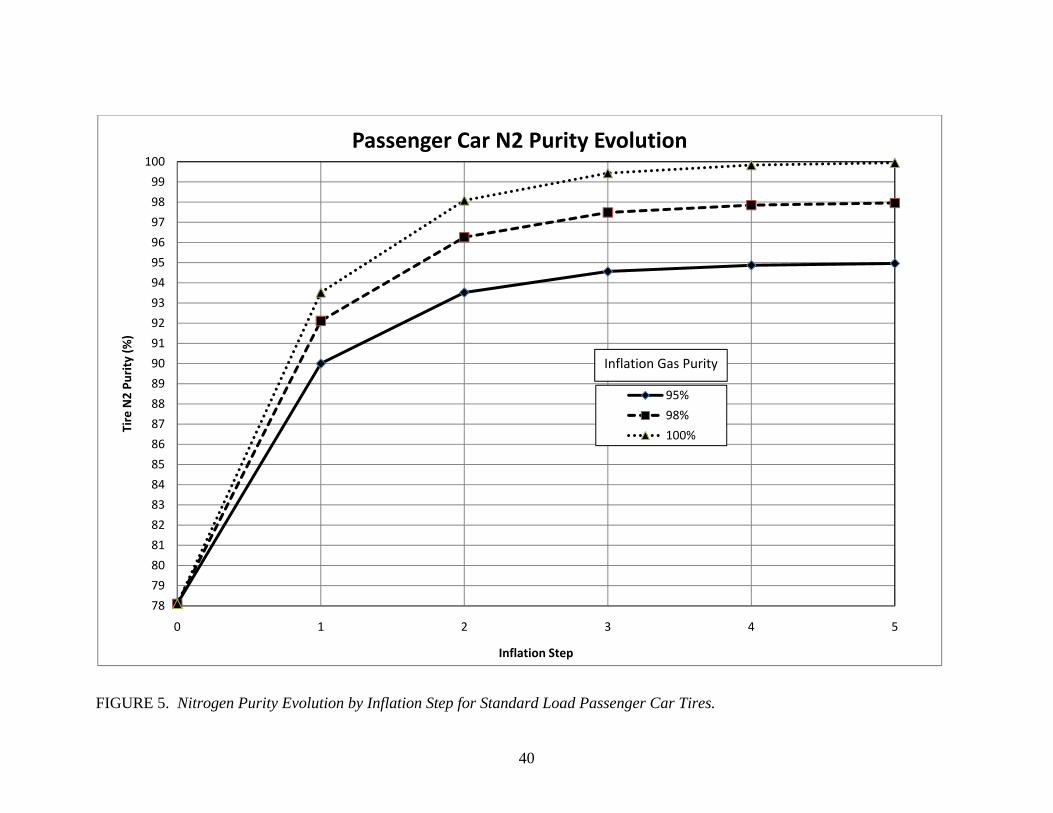
practice. Figure 5, for P-metric standard load tires having a value of compression ratio Rc = 3.4,
shows very clearly that if an initial nitrogen purity of some value is desired in the tire, then
inflation gas purity must be at least that level, and higher purity inflation gas allows the use of
fewer inflation-deflation steps. Needing fewer inflation steps means a more economical process in
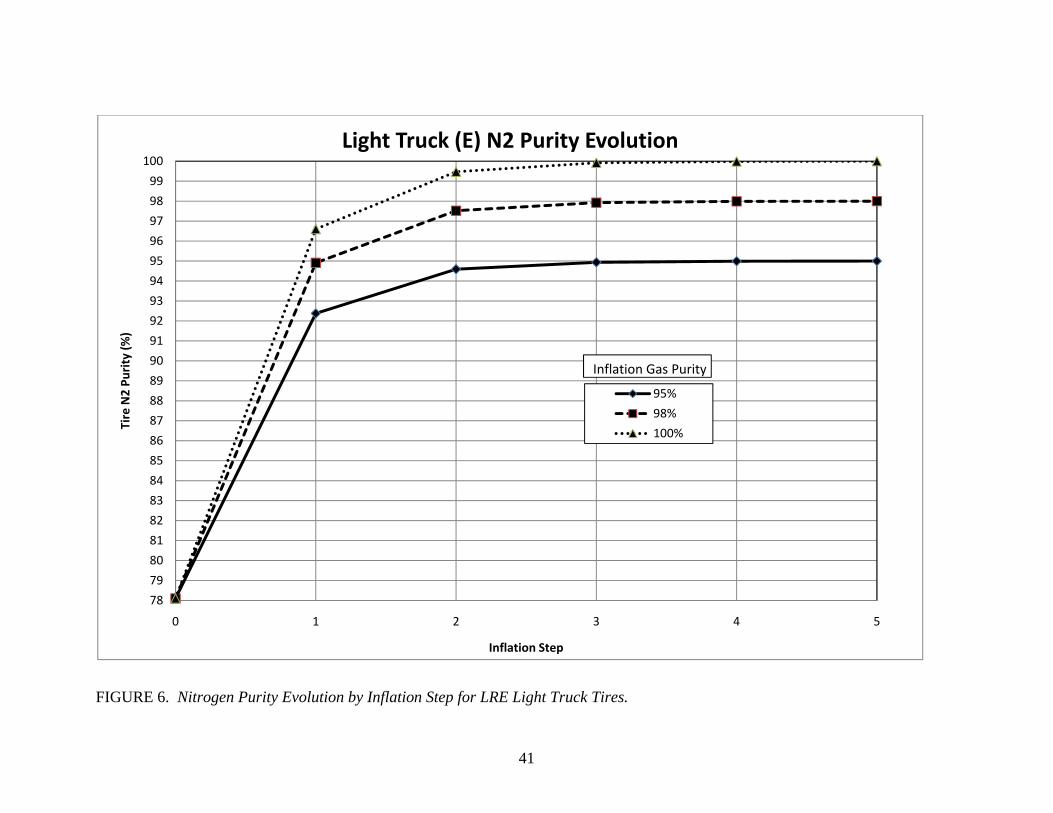
terms of nitrogen consumed and labor used. Figure 6, for Light Truck Load Range E tires having a
compression ratio Rc = 6.4, shows that the purity evolves much more rapidly by inflation step than
for the passenger car tire.
The initial nitrogen purity in the tire is obviously the primary concern of the tire service industry.
However, from the standpoint of the consumer, the question becomes one of the stability of the
benefits being purchased. If the nitrogen purity established at the initial service degrades over
time, then it follows that the benefit in IPLR would also degrade. Also, as NHTSA showed, if an
air-inflated tire’s nitrogen purity increases with time, then why would the purchase of nitrogen
inflation be of significant interest? To explore these issues, one must not only look at the initial
nitrogen purity in the tire, but also at the evolution in that purity over time.
Development of a Lifetime Nitrogen Purity Evolution Model
The development of a purity evolution model for a tire presented here generally follows work done
by Costemalle [6] on the permeability of tires to air. Costemalle’s focus was on the effect of the
inner liner material on the overall inflation pressure loss rate. In the present analysis, nitrogen and
oxygen will be treated using the same physical relationships, but, as previously mentioned, they are
assumed to act independently. Further, the model that is developed here assumes that pressure lost
from the tire due to permeation of nitrogen and oxygen is made up by topping off the tire routinely
throughout its life. Obviously, the nitrogen purity of the top-off gas also becomes a variable in this
analysis.
Since both nitrogen and oxygen behave as ideal gases, they follow the ideal gas law:
[5]
9
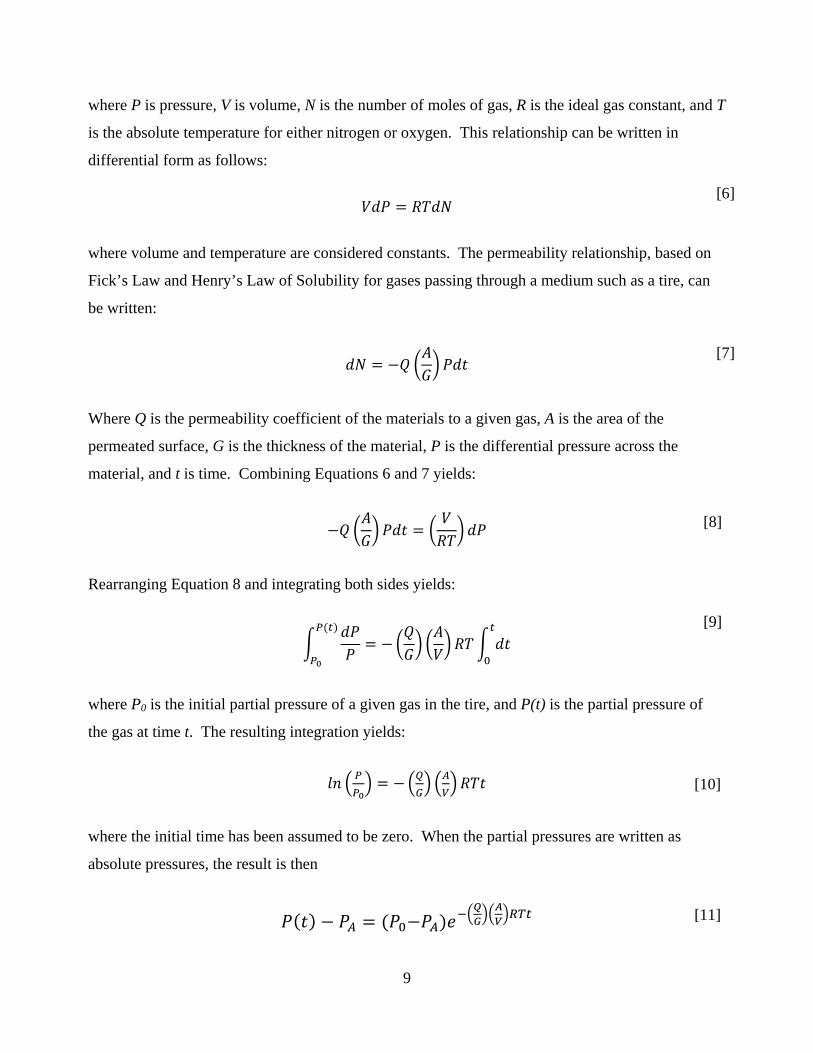
where P is pressure, V is volume, N is the number of moles of gas, R is the ideal gas constant, and T
is the absolute temperature for either nitrogen or oxygen. This relationship can be written in
differential form as follows:
where volume and temperature are considered constants. The permeability relationship, based on
Fick’s Law and Henry’s Law of Solubility for gases passing through a medium such as a tire, can
be written:
Where Q is the permeability coefficient of the materials to a given gas, A is the area of the
permeated surface, G is the thickness of the material, P is the differential pressure across the
material, and t is time. Combining Equations 6 and 7 yields:
Rearranging Equation 8 and integrating both sides yields:
where P0 is the initial partial pressure of a given gas in the tire, and P(t) is the partial pressure of
the gas at time t. The resulting integration yields:
where the initial time has been assumed to be zero. When the partial pressures are written as
absolute pressures, the result is then
[6]
[7]
[8]
[9]
[10]
[11]
10
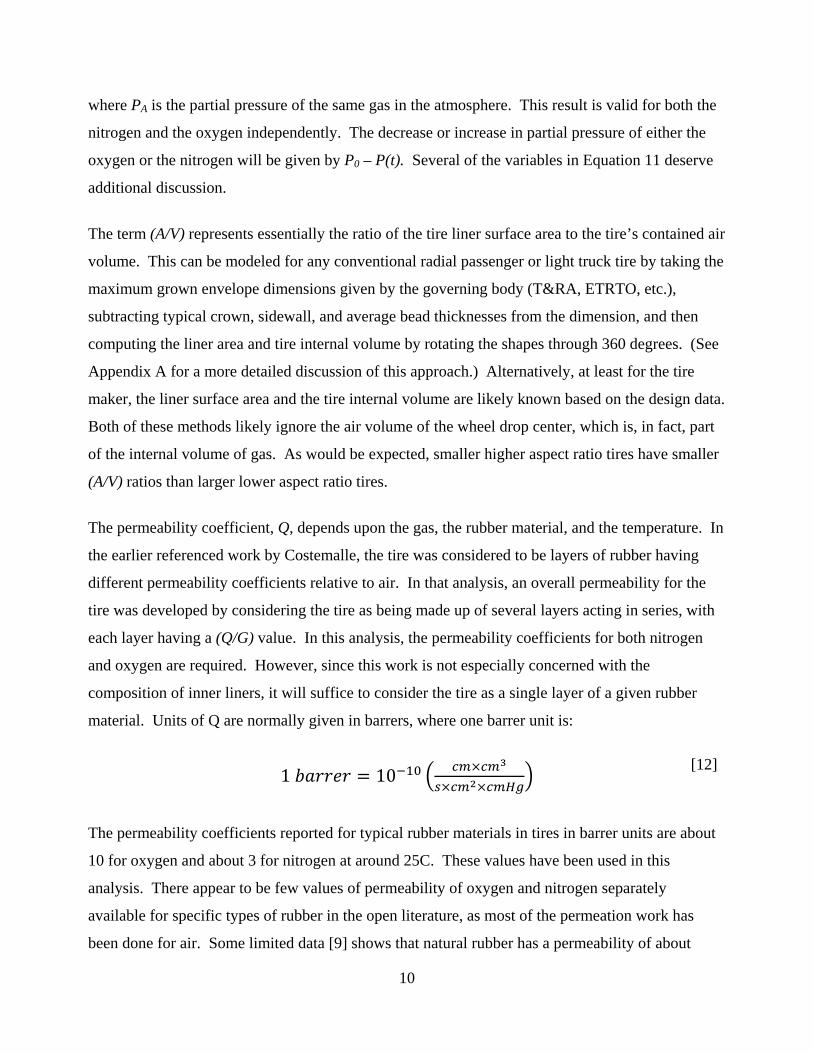
where PA is the partial pressure of the same gas in the atmosphere. This result is valid for both the
nitrogen and the oxygen independently. The decrease or increase in partial pressure of either the
oxygen or the nitrogen will be given by P0 – P(t). Several of the variables in Equation 11 deserve
additional discussion.
The term (A/V) represents essentially the ratio of the tire liner surface area to the tire’s contained air
volume. This can be modeled for any conventional radial passenger or light truck tire by taking the
maximum grown envelope dimensions given by the governing body (T&RA, ETRTO, etc.),
subtracting typical crown, sidewall, and average bead thicknesses from the dimension, and then
computing the liner area and tire internal volume by rotating the shapes through 360 degrees. (See
Appendix A for a more detailed discussion of this approach.) Alternatively, at least for the tire
maker, the liner surface area and the tire internal volume are likely known based on the design data.
Both of these methods likely ignore the air volume of the wheel drop center, which is, in fact, part
of the internal volume of gas. As would be expected, smaller higher aspect ratio tires have smaller
(A/V) ratios than larger lower aspect ratio tires.
The permeability coefficient, Q, depends upon the gas, the rubber material, and the temperature. In
the earlier referenced work by Costemalle, the tire was considered to be layers of rubber having
different permeability coefficients relative to air. In that analysis, an overall permeability for the
tire was developed by considering the tire as being made up of several layers acting in series, with
each layer having a (Q/G) value. In this analysis, the permeability coefficients for both nitrogen
and oxygen are required. However, since this work is not especially concerned with the
composition of inner liners, it will suffice to consider the tire as a single layer of a given rubber
material. Units of Q are normally given in barrers, where one barrer unit is:
1 10
The permeability coefficients reported for typical rubber materials in tires in barrer units are about
10 for oxygen and about 3 for nitrogen at around 25C. These values have been used in this
analysis. There appear to be few values of permeability of oxygen and nitrogen separately
available for specific types of rubber in the open literature, as most of the permeation work has
been done for air. Some limited data [9] shows that natural rubber has a permeability of about
[12]
11
23 barrer to oxygen and about 8 barrer to nitrogen, while butyl rubber has a permeability of about
1.3 barrer to oxygen and about 0.3 barrer to nitrogen (these values at 25C). Obviously, given
permeability coefficients for nitrogen and oxygen independently for various types of rubber mixes,
a more elaborate model could be built for the tire following the method outlined by Costemalle.
Another obvious complexity is that permeability coefficients are functions of temperature as well.
Limited data presented by Dalpe [10] suggests that when the temperature rises from 25C, where the
vast majority of this type of data is presented, to 65C where some additional data has been taken,
the permeability coefficients generally increase by about a factor of three. This explains why
dynamic testing shows higher inflation pressure loss rates than static testing. For passenger car and
light truck analyses, using 25C as the analysis temperature for IPLR and gas purity evolution will
produce generally appropriate results, since these tires are estimated to be in service only about
10% of their lifetimes.
The term P(t) yields the partial pressure for either nitrogen or oxygen in the tire at the end of the
time period t. The change in partial pressure for either the oxygen or the nitrogen will be P0 – P(t).
The sum of the change in partial pressures of nitrogen and oxygen in each time step analyzed
represents the overall pressure loss in the tire (recall that Equation 11 requires an evaluation over
some time period t). Therefore, for the purpose of a long term model of the tire, there must be
some top-off gas added to replace this pressure loss. Obviously, the top-off gas will have some
purity of nitrogen that will be different than what is in the tire at the end of the time period t. For
the purpose of the analysis of the evolution of the nitrogen and oxygen purities in the tire, it is
convenient to take the time period, t, as 30 days. This period is consistent with tire industry
recommendations that tire pressure be maintained on at least a monthly cycle.
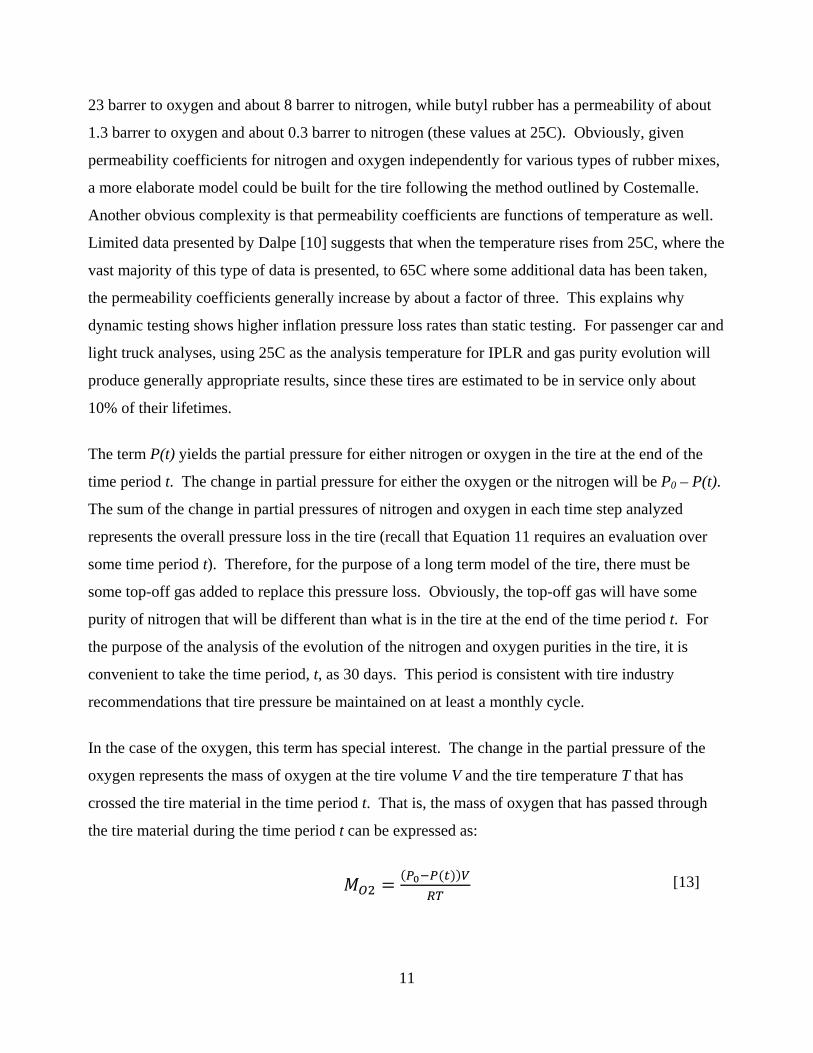
In the case of the oxygen, this term has special interest. The change in the partial pressure of the
oxygen represents the mass of oxygen at the tire volume V and the tire temperature T that has
crossed the tire material in the time period t. That is, the mass of oxygen that has passed through
the tire material during the time period t can be expressed as:
[13]
12
where MO2 is the mass of oxygen corresponding to the drop (or increase) in partial pressure of
oxygen during the tire period t. Oxidation is known to be the process by which the tire is aged, so
estimating the amount of oxygen that passes through the tire can help in the evaluation of the
benefit of different nitrogen inflation strategies. Obviously, there is a difference between the
amount of oxygen that passes through the tire and the amount that reacts with the tire’s rubber
hydrocarbons. Tokita estimated the reacted amount of oxygen by using the oxygen-rubber kinetics.
That study, as well as many others, have shown that limiting the oxygen flow (i.e., by using better
inner liners), selecting rubber materials that are less reactive, and reducing tire operating
temperature (i.e., designing lower rolling resistance tires) are all important to improving the long-
term durability of the tire. The present analysis will focus on the contribution of nitrogen inflation
in reducing the oxygen flow across the tire over its lifetime.
Lifetime Simulation and Results
The formulation presented above was used to develop a set of simulations. The process for each
simulation was to assume that the initial nitrogen purity in the tire was set to a given value, as
described previously. Then, Equation 11 was used to compute a change in the nitrogen and oxygen
partial pressures over a time period equal to 30 days. The total inflation pressure loss was found as
the sum of the two partial pressure losses. The pressure in the tire was assumed to be reset to the
starting pressure by using an inflation gas of a given purity nitrogen. This resulted in a new
nitrogen and oxygen purity in the tire, and the process was repeated. For the purposes of this
analysis, the “lifetime” of the tire was arbitrarily taken to be six years, as this would effectively
demonstrate how the nitrogen and oxygen purities evolved over an extended period of time. Then,
Equation 13 was used to compute the mass of oxygen that passed through the tire during the period
based on the oxygen partial pressure losses. Obviously, this analysis assumes that the tire is
receiving monthly maintenance as recommended by the tire industry. Further, the parameters used
in this phase of analysis were for a temperature of 25C. To simplify the number of variables, a
P235/75R15 Standard Load tire was chosen as the tire size for analysis. Such a tire would have a
maximum inflation pressure of 240 kPa (35 psi). In addition, the (A/V) ratio for this size tire was
estimated to be 0.165 cm-1, and the tire’s internal volume was estimated at 51.6 liters, ignoring the
gas volume of the drop center in the wheel. Including the drop center volume would reduce the
(A/V) ratio slightly, which would produce slightly lower pressure drops. Since the purpose of this
13
analysis was to show trends in gas purity, it was felt that this was an acceptable simplification to
make in light of the assumption of the tire as a single material. The gauge for the tire’s sidewall
was taken as 6 mm, following Costemalle’s recommendation that the sidewall gauge gave the best
representation of the inflation pressure loss rate.
Air Inflation with Air Top-off
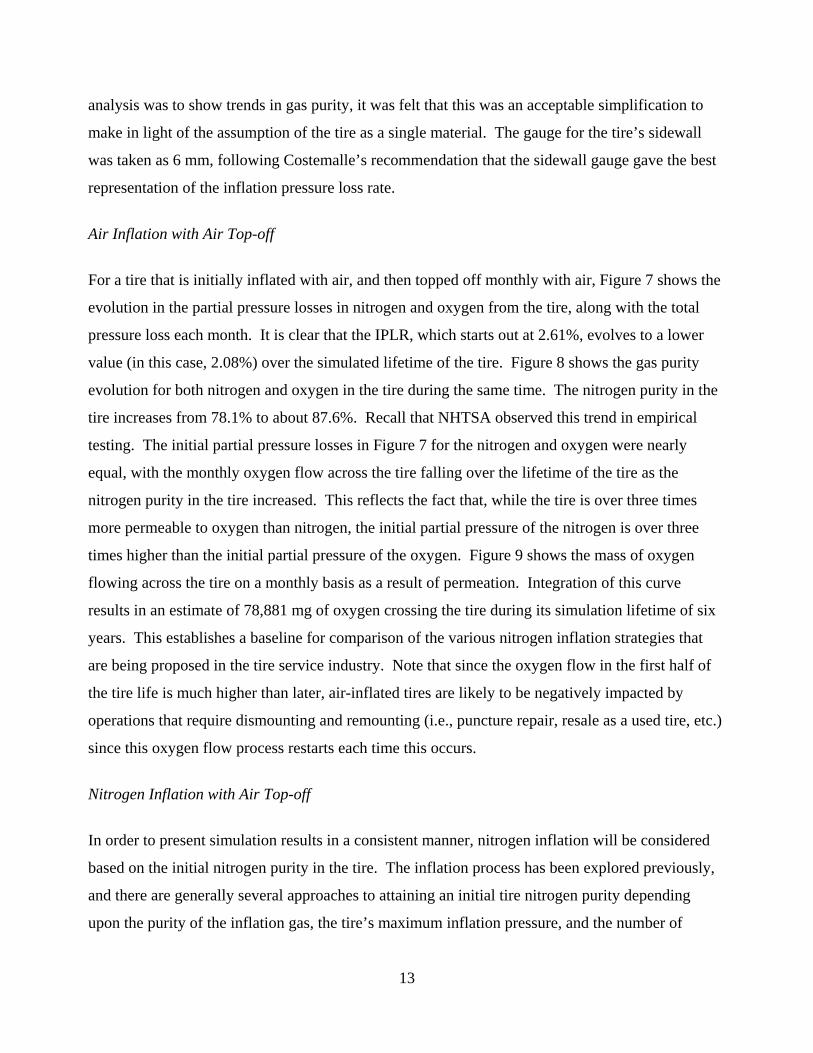
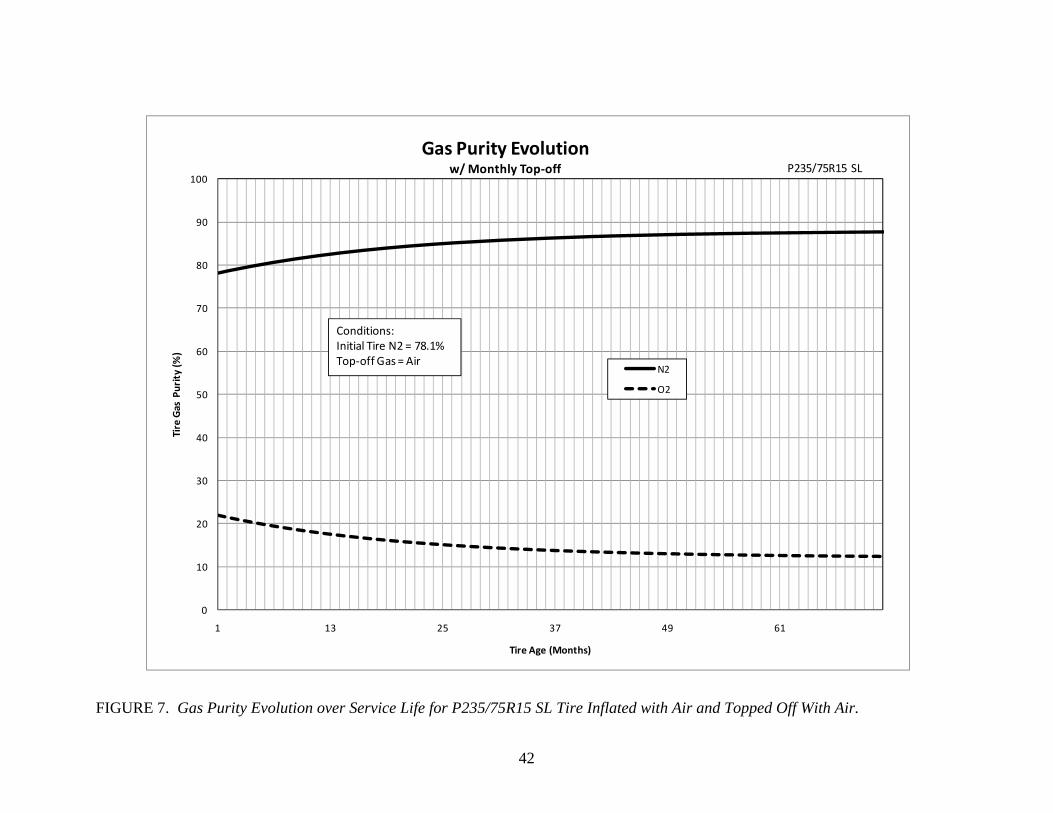
For a tire that is initially inflated with air, and then topped off monthly with air, Figure 7 shows the
evolution in the partial pressure losses in nitrogen and oxygen from the tire, along with the total
pressure loss each month. It is clear that the IPLR, which starts out at 2.61%, evolves to a lower
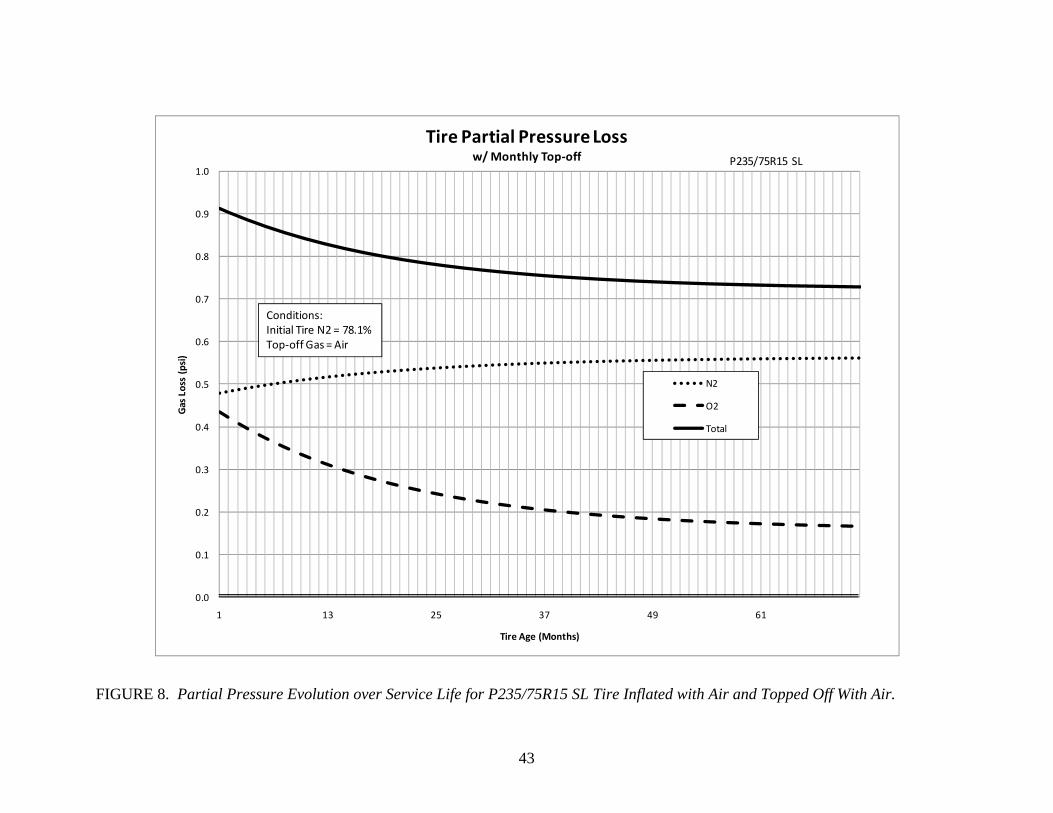
value (in this case, 2.08%) over the simulated lifetime of the tire. Figure 8 shows the gas purity
evolution for both nitrogen and oxygen in the tire during the same time. The nitrogen purity in the
tire increases from 78.1% to about 87.6%. Recall that NHTSA observed this trend in empirical
testing. The initial partial pressure losses in Figure 7 for the nitrogen and oxygen were nearly
equal, with the monthly oxygen flow across the tire falling over the lifetime of the tire as the
nitrogen purity in the tire increased. This reflects the fact that, while the tire is over three times
more permeable to oxygen than nitrogen, the initial partial pressure of the nitrogen is over three
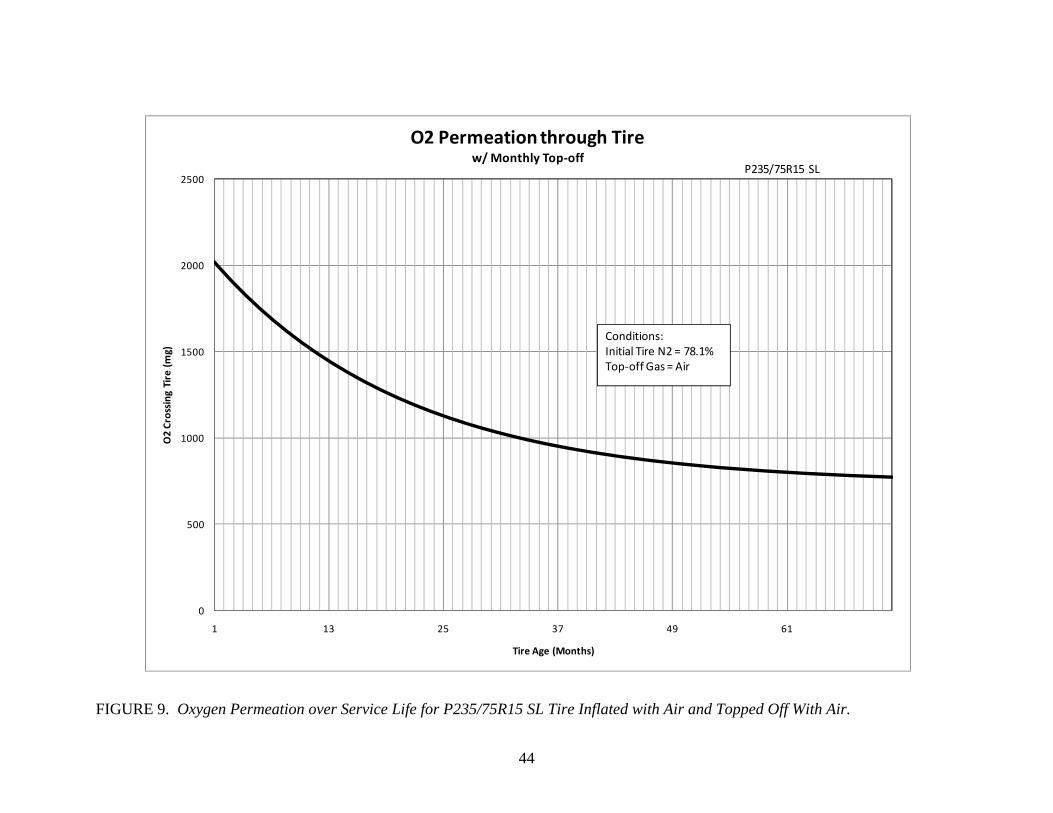
times higher than the initial partial pressure of the oxygen. Figure 9 shows the mass of oxygen
flowing across the tire on a monthly basis as a result of permeation. Integration of this curve
results in an estimate of 78,881 mg of oxygen crossing the tire during its simulation lifetime of six
years. This establishes a baseline for comparison of the various nitrogen inflation strategies that
are being proposed in the tire service industry. Note that since the oxygen flow in the first half of
the tire life is much higher than later, air-inflated tires are likely to be negatively impacted by
operations that require dismounting and remounting (i.e., puncture repair, resale as a used tire, etc.)
since this oxygen flow process restarts each time this occurs.
Nitrogen Inflation with Air Top-off
In order to present simulation results in a consistent manner, nitrogen inflation will be considered
based on the initial nitrogen purity in the tire. The inflation process has been explored previously,
and there are generally several approaches to attaining an initial tire nitrogen purity depending
upon the purity of the inflation gas, the tire’s maximum inflation pressure, and the number of
14
inflation steps to be used. When the top-off gas is air, the only variable is therefore the tire initial
nitrogen purity. Air top-off probably represents the norm in the tire service industry, since
providers typically charge for the initial inflation, and consumers are essentially on their own for
the routine maintenance of the tire’s inflation pressure.
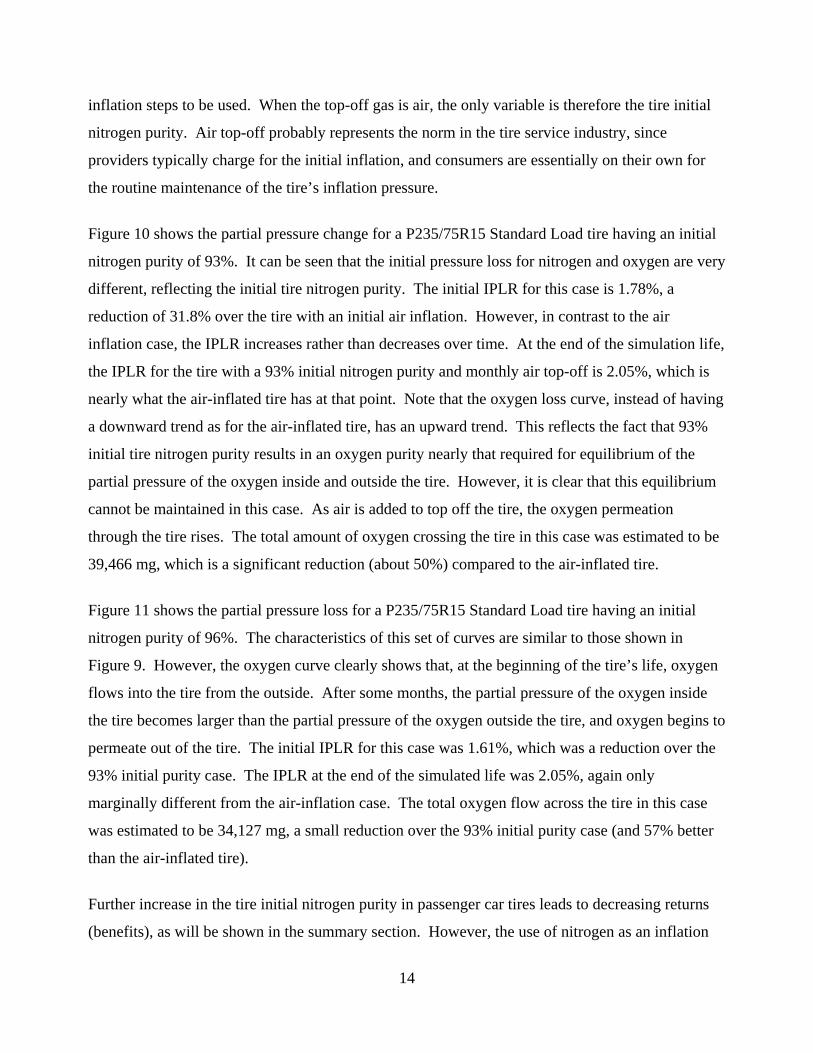
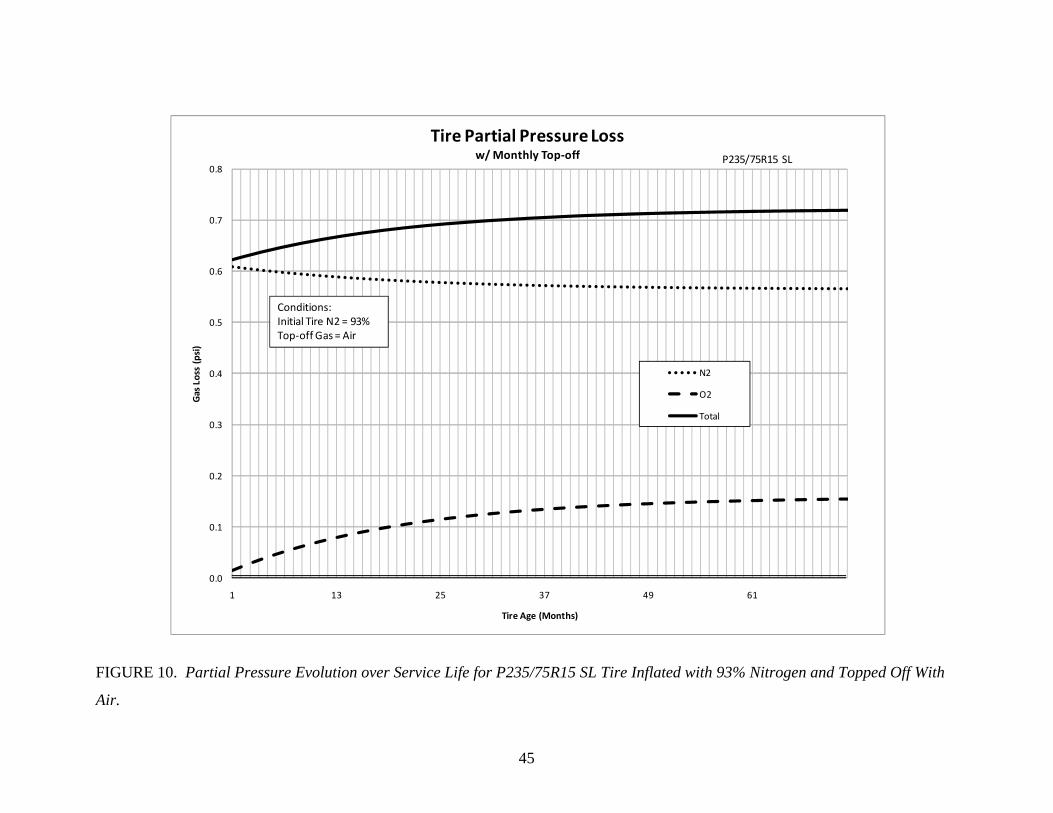
Figure 10 shows the partial pressure change for a P235/75R15 Standard Load tire having an initial
nitrogen purity of 93%. It can be seen that the initial pressure loss for nitrogen and oxygen are very
different, reflecting the initial tire nitrogen purity. The initial IPLR for this case is 1.78%, a
reduction of 31.8% over the tire with an initial air inflation. However, in contrast to the air
inflation case, the IPLR increases rather than decreases over time. At the end of the simulation life,
the IPLR for the tire with a 93% initial nitrogen purity and monthly air top-off is 2.05%, which is
nearly what the air-inflated tire has at that point. Note that the oxygen loss curve, instead of having
a downward trend as for the air-inflated tire, has an upward trend. This reflects the fact that 93%
initial tire nitrogen purity results in an oxygen purity nearly that required for equilibrium of the
partial pressure of the oxygen inside and outside the tire. However, it is clear that this equilibrium
cannot be maintained in this case. As air is added to top off the tire, the oxygen permeation
through the tire rises. The total amount of oxygen crossing the tire in this case was estimated to be
39,466 mg, which is a significant reduction (about 50%) compared to the air-inflated tire.
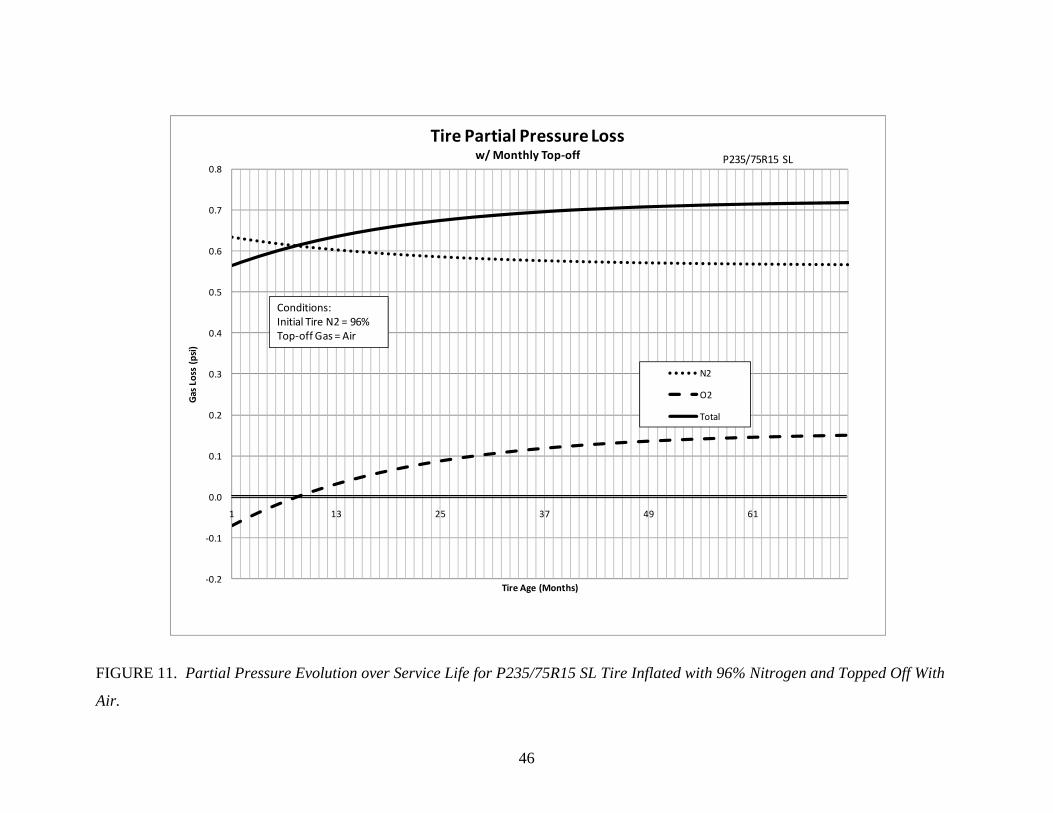
Figure 11 shows the partial pressure loss for a P235/75R15 Standard Load tire having an initial
nitrogen purity of 96%. The characteristics of this set of curves are similar to those shown in
Figure 9. However, the oxygen curve clearly shows that, at the beginning of the tire’s life, oxygen
flows into the tire from the outside. After some months, the partial pressure of the oxygen inside
the tire becomes larger than the partial pressure of the oxygen outside the tire, and oxygen begins to
permeate out of the tire. The initial IPLR for this case was 1.61%, which was a reduction over the
93% initial purity case. The IPLR at the end of the simulated life was 2.05%, again only
marginally different from the air-inflation case. The total oxygen flow across the tire in this case
was estimated to be 34,127 mg, a small reduction over the 93% initial purity case (and 57% better
than the air-inflated tire).
Further increase in the tire initial nitrogen purity in passenger car tires leads to decreasing returns
(benefits), as will be shown in the summary section. However, the use of nitrogen as an inflation
15
gas results in a substantial reduction in the total oxygen that flows across the tire material during its
lifetime. When considered in comparison to the use of a higher quality or thicker inner liner that
reduces the IPLR by a factor of two, the reduction in lifetime oxygen flow would be about the
same. Additional nitrogen purity in the tire results in a faster permeation of oxygen into the tire
initially followed by a gradual transition to permeation of the oxygen out of the tire. Since oxygen
flow likely affects the tire rubber regardless of the direction of the flow, the total amount of oxygen
crossing the tire over the simulated lifetime does not continue to decrease monotonically with
increasing initial nitrogen purity. This suggests that significant additional improvements could be
obtained by adopting other nitrogen strategies. For example, adopting the recommendation that the
nitrogen fill process be redone every two to three years would reset the initial IPLR to the original
value and have the additional benefit of an even more significant reduction in lifetime oxygen flow
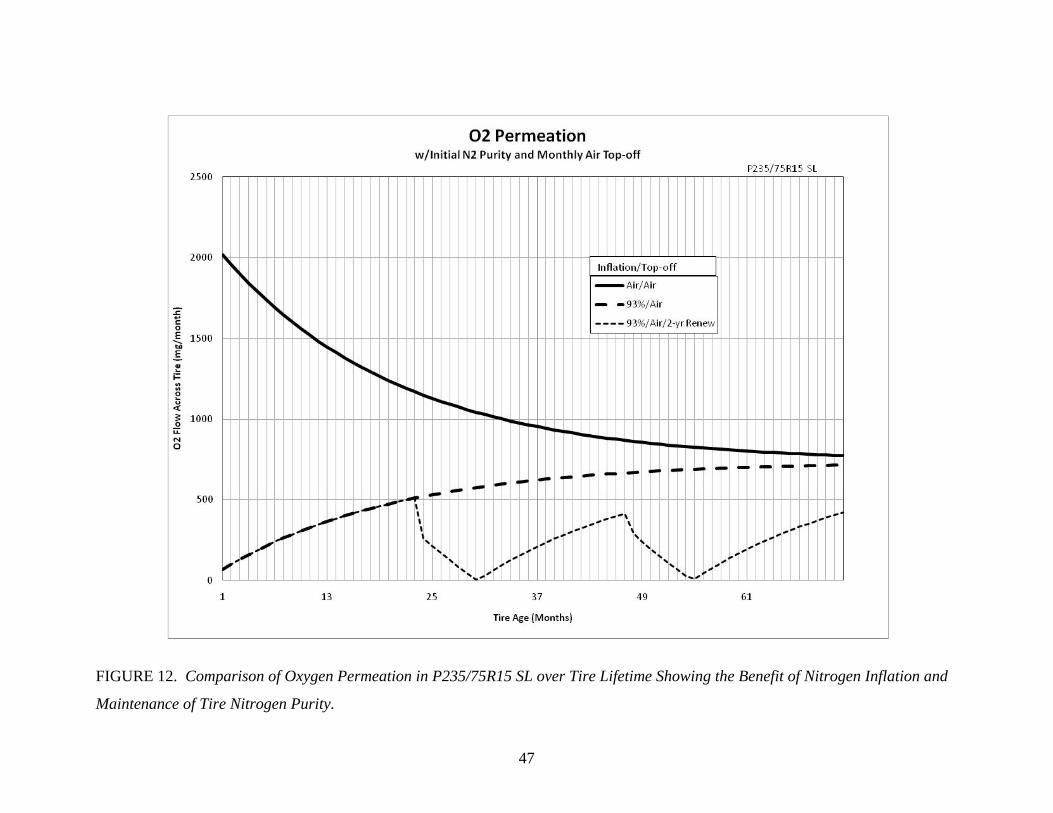
across the tire. Figure 12 shows a comparison of oxygen flow across the tire for three cases all
being topped off monthly with air: the air-inflated tire, the tire with a 93% initial nitrogen purity,
and the tire with a 93% initial purity where the nitrogen inflation is renewed every two years. The
nitrogen renew cycles in this simulation were assumed to be a single inflation step using 98%
purity inflation gas. Note that the renew process is a single step reinflation, since the nitrogen
purity of the tire even after two years is such that the resulting nitrogen purity after reinflation will
be above the oxygen equilibrium point. Clearly, this approach resets the initial nitrogen inflation
and produces a lower lifetime oxygen flow than nitrogen inflation without any renewal.
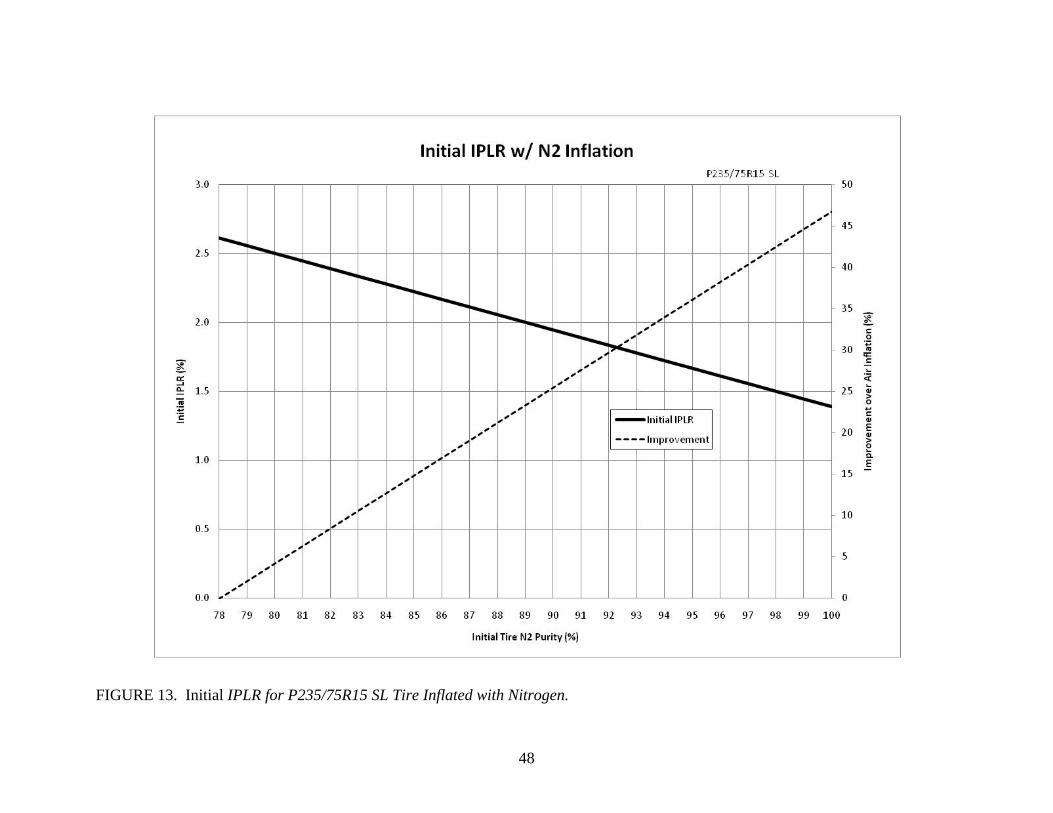
Figure 13 shows the initial IPLR as a function of the tire’s initial nitrogen purity. The IPLR is
simply the sum of the partial pressure losses or gains for nitrogen and oxygen, each derived
independently using Equation 11. The higher the initial nitrogen purity, the better the IPLR
performance with respect to the air-inflated tire will be. It can easily be shown that this
relationship is linear with initial nitrogen purity, and that the slope of the line depends upon the tire
parameters, the permeability coefficients for the tire materials, and the temperature of the tire. In
fact, the IPLR at any time is linear with the nitrogen purity at that point in time, so Figure 13
applies at any level of nitrogen purity. As was shown, the nitrogen and oxygen purities in the tire
evolve over the simulated lifetime of the tire, and consequently so does the IPLR. In the case
where the top-off gas is air, the IPLR at the end of the tire life is not significantly different from an
air-inflated tire at initial nitrogen purities being offered by the tire service industry.
16
Nitrogen Inflation with Nitrogen Top-Off
Another approach to nitrogen inflation would require that nitrogen providers also provide top-off
services over the life of the tires. While this is not generally done in the industry today, it could be
implemented at some additional cost to nitrogen providers. The question is really whether or not
there is a significant benefit from nitrogen top-off. In this case, there are two variables; the initial
purity of the nitrogen in the tire and the nitrogen purity of the top-off gas being used.
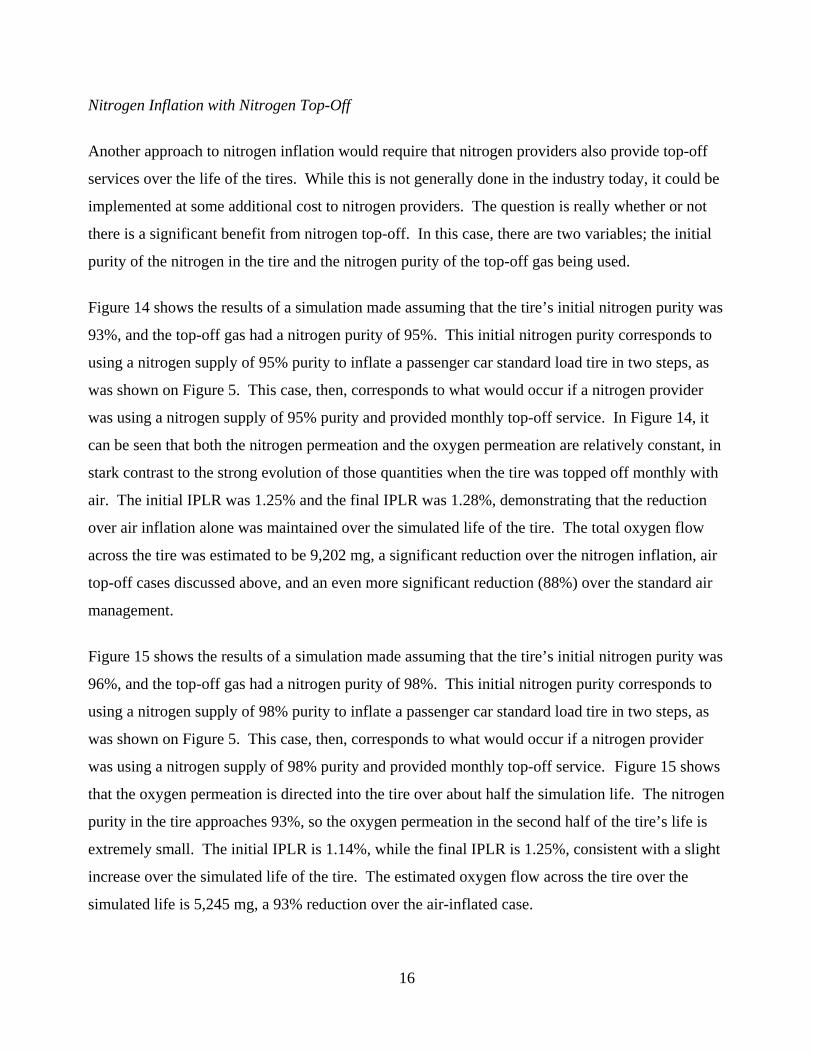
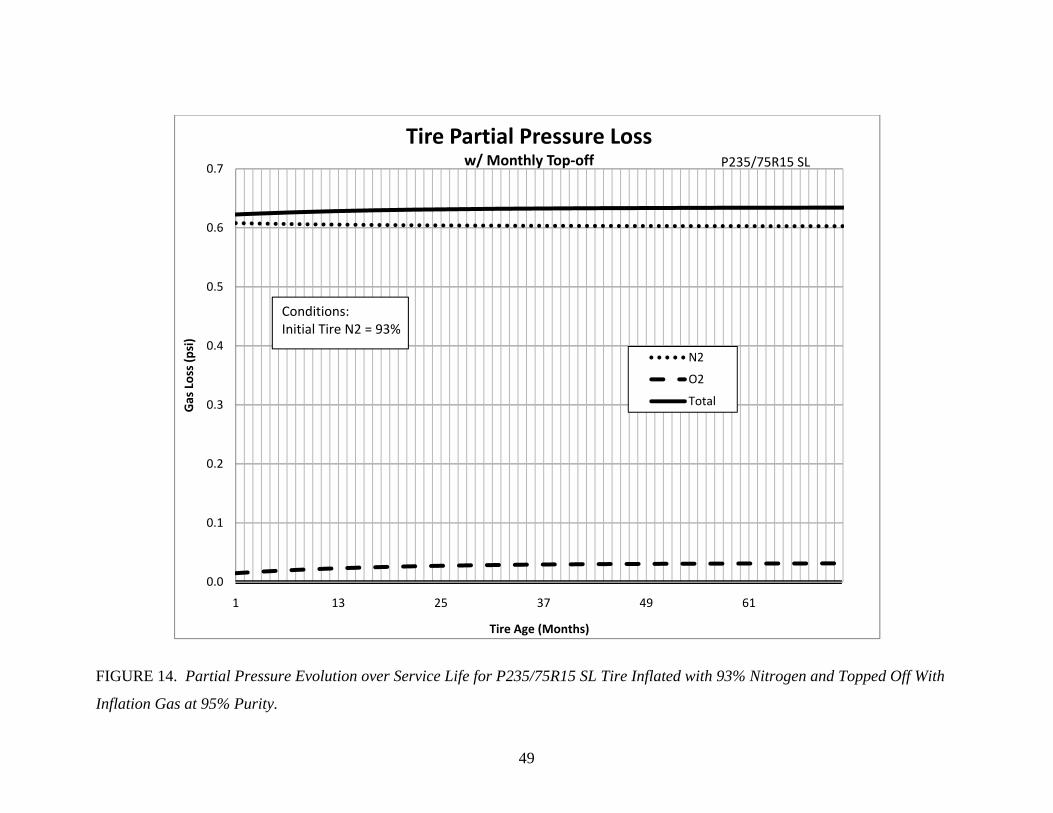
Figure 14 shows the results of a simulation made assuming that the tire’s initial nitrogen purity was
93%, and the top-off gas had a nitrogen purity of 95%. This initial nitrogen purity corresponds to
using a nitrogen supply of 95% purity to inflate a passenger car standard load tire in two steps, as
was shown on Figure 5. This case, then, corresponds to what would occur if a nitrogen provider
was using a nitrogen supply of 95% purity and provided monthly top-off service. In Figure 14, it
can be seen that both the nitrogen permeation and the oxygen permeation are relatively constant, in
stark contrast to the strong evolution of those quantities when the tire was topped off monthly with
air. The initial IPLR was 1.25% and the final IPLR was 1.28%, demonstrating that the reduction
over air inflation alone was maintained over the simulated life of the tire. The total oxygen flow
across the tire was estimated to be 9,202 mg, a significant reduction over the nitrogen inflation, air
top-off cases discussed above, and an even more significant reduction (88%) over the standard air
management.
Figure 15 shows the results of a simulation made assuming that the tire’s initial nitrogen purity was
96%, and the top-off gas had a nitrogen purity of 98%. This initial nitrogen purity corresponds to
using a nitrogen supply of 98% purity to inflate a passenger car standard load tire in two steps, as
was shown on Figure 5. This case, then, corresponds to what would occur if a nitrogen provider
was using a nitrogen supply of 98% purity and provided monthly top-off service. Figure 15 shows
that the oxygen permeation is directed into the tire over about half the simulation life. The nitrogen
purity in the tire approaches 93%, so the oxygen permeation in the second half of the tire’s life is
extremely small. The initial IPLR is 1.14%, while the final IPLR is 1.25%, consistent with a slight
increase over the simulated life of the tire. The estimated oxygen flow across the tire over the
simulated life is 5,245 mg, a 93% reduction over the air-inflated case.
17
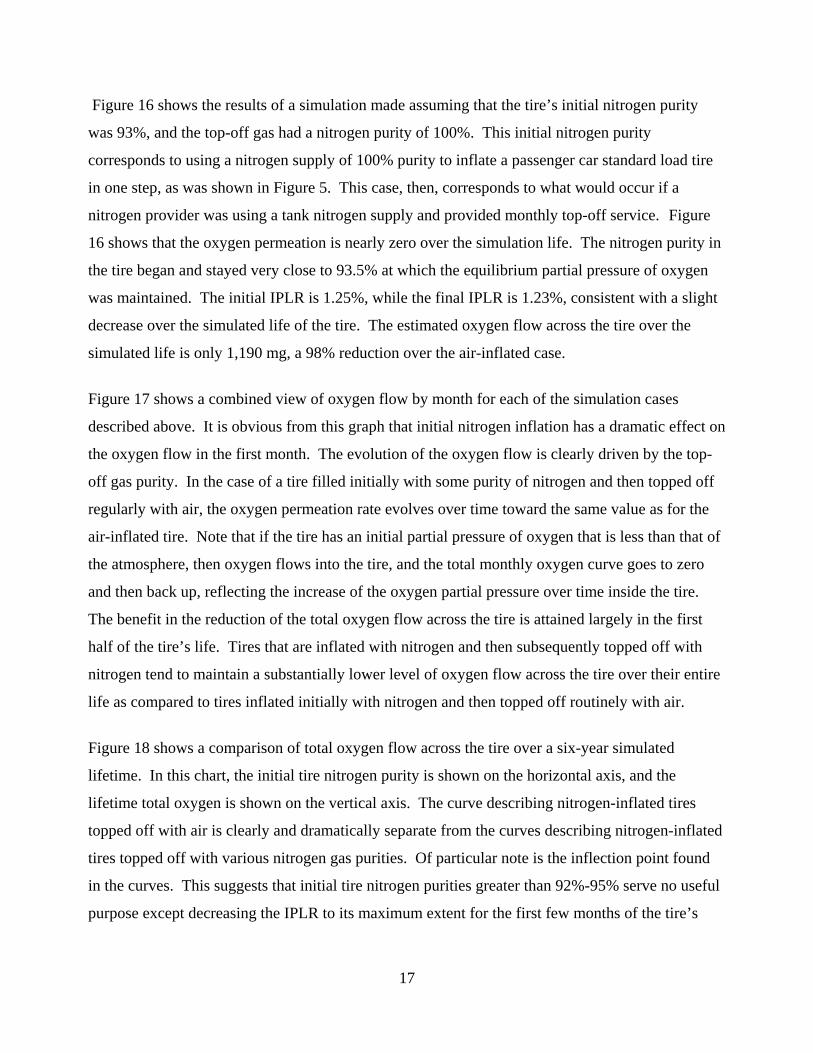
Figure 16 shows the results of a simulation made assuming that the tire’s initial nitrogen purity
was 93%, and the top-off gas had a nitrogen purity of 100%. This initial nitrogen purity
corresponds to using a nitrogen supply of 100% purity to inflate a passenger car standard load tire
in one step, as was shown in Figure 5. This case, then, corresponds to what would occur if a
nitrogen provider was using a tank nitrogen supply and provided monthly top-off service. Figure
16 shows that the oxygen permeation is nearly zero over the simulation life. The nitrogen purity in
the tire began and stayed very close to 93.5% at which the equilibrium partial pressure of oxygen
was maintained. The initial IPLR is 1.25%, while the final IPLR is 1.23%, consistent with a slight
decrease over the simulated life of the tire. The estimated oxygen flow across the tire over the
simulated life is only 1,190 mg, a 98% reduction over the air-inflated case.
Figure 17 shows a combined view of oxygen flow by month for each of the simulation cases
described above. It is obvious from this graph that initial nitrogen inflation has a dramatic effect on
the oxygen flow in the first month. The evolution of the oxygen flow is clearly driven by the top-
off gas purity. In the case of a tire filled initially with some purity of nitrogen and then topped off
regularly with air, the oxygen permeation rate evolves over time toward the same value as for the
air-inflated tire. Note that if the tire has an initial partial pressure of oxygen that is less than that of
the atmosphere, then oxygen flows into the tire, and the total monthly oxygen curve goes to zero
and then back up, reflecting the increase of the oxygen partial pressure over time inside the tire.
The benefit in the reduction of the total oxygen flow across the tire is attained largely in the first
half of the tire’s life. Tires that are inflated with nitrogen and then subsequently topped off with
nitrogen tend to maintain a substantially lower level of oxygen flow across the tire over their entire
life as compared to tires inflated initially with nitrogen and then topped off routinely with air.
Figure 18 shows a comparison of total oxygen flow across the tire over a six-year simulated
lifetime. In this chart, the initial tire nitrogen purity is shown on the horizontal axis, and the
lifetime total oxygen is shown on the vertical axis. The curve describing nitrogen-inflated tires
topped off with air is clearly and dramatically separate from the curves describing nitrogen-inflated
tires topped off with various nitrogen gas purities. Of particular note is the inflection point found
in the curves. This suggests that initial tire nitrogen purities greater than 92%-95% serve no useful
purpose except decreasing the IPLR to its maximum extent for the first few months of the tire’s
18
lifetime. This is consistent with the finding that initial IPLR was directly related to the initial tire
nitrogen purity.
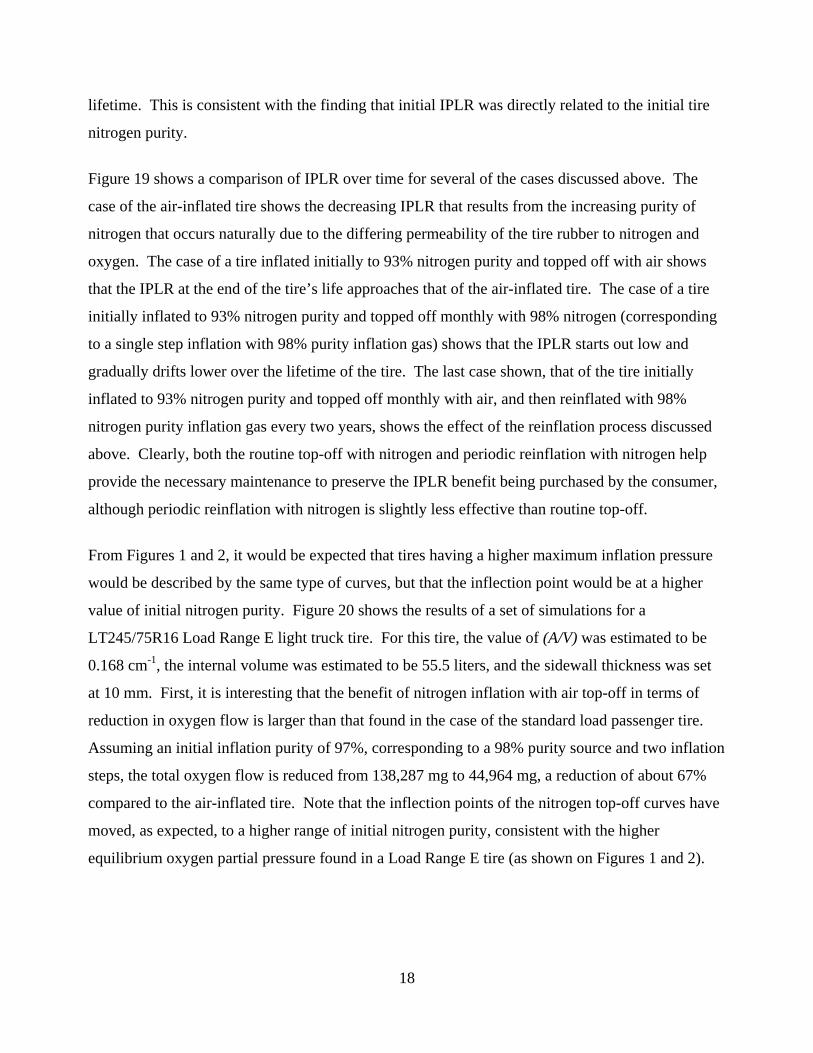
Figure 19 shows a comparison of IPLR over time for several of the cases discussed above. The
case of the air-inflated tire shows the decreasing IPLR that results from the increasing purity of
nitrogen that occurs naturally due to the differing permeability of the tire rubber to nitrogen and
oxygen. The case of a tire inflated initially to 93% nitrogen purity and topped off with air shows
that the IPLR at the end of the tire’s life approaches that of the air-inflated tire. The case of a tire
initially inflated to 93% nitrogen purity and topped off monthly with 98% nitrogen (corresponding
to a single step inflation with 98% purity inflation gas) shows that the IPLR starts out low and
gradually drifts lower over the lifetime of the tire. The last case shown, that of the tire initially
inflated to 93% nitrogen purity and topped off monthly with air, and then reinflated with 98%
nitrogen purity inflation gas every two years, shows the effect of the reinflation process discussed
above. Clearly, both the routine top-off with nitrogen and periodic reinflation with nitrogen help
provide the necessary maintenance to preserve the IPLR benefit being purchased by the consumer,
although periodic reinflation with nitrogen is slightly less effective than routine top-off.
From Figures 1 and 2, it would be expected that tires having a higher maximum inflation pressure
would be described by the same type of curves, but that the inflection point would be at a higher
value of initial nitrogen purity. Figure 20 shows the results of a set of simulations for a
LT245/75R16 Load Range E light truck tire. For this tire, the value of (A/V) was estimated to be
0.168 cm-1, the internal volume was estimated to be 55.5 liters, and the sidewall thickness was set
at 10 mm. First, it is interesting that the benefit of nitrogen inflation with air top-off in terms of
reduction in oxygen flow is larger than that found in the case of the standard load passenger tire.
Assuming an initial inflation purity of 97%, corresponding to a 98% purity source and two inflation
steps, the total oxygen flow is reduced from 138,287 mg to 44,964 mg, a reduction of about 67%
compared to the air-inflated tire. Note that the inflection points of the nitrogen top-off curves have
moved, as expected, to a higher range of initial nitrogen purity, consistent with the higher
equilibrium oxygen partial pressure found in a Load Range E tire (as shown on Figures 1 and 2).
19
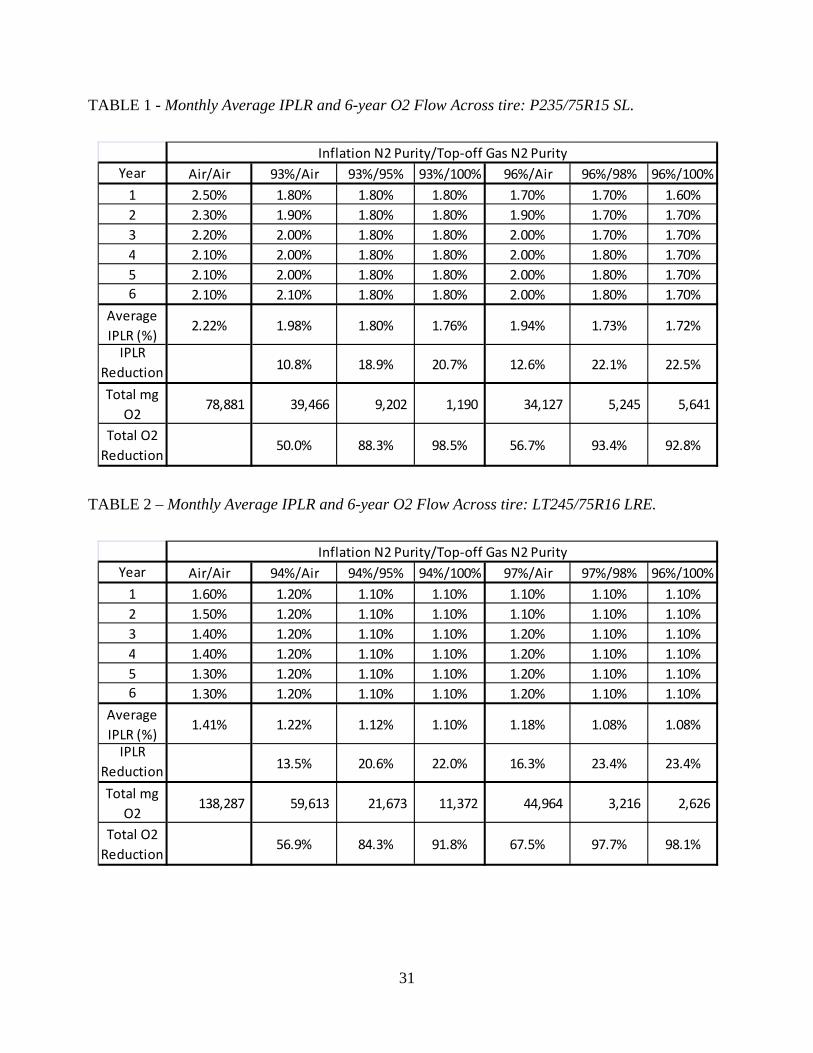
Tables 1 and 2 present the results discussed above in a slightly different format. Table 1 presents
the results of several simulations for the P235/75R15 Standard Load tire. The results can be
lumped into three distinct categories:
1. The tire inflated with air and topped off with air has a slight reduction of IPLR over its life,
corresponding to an increase in the purity of the nitrogen in the tire with time. The total
oxygen that passes across the tire is estimated at about 79,000 mg.
2. The tire inflated with various purities of nitrogen and topped off routinely with air shows a
reduction in IPLR with initial tire purity (from 66% to 69% as nitrogen purity increases
from 93% to 96%), in accord with the previous discussions. The oxygen flowing across the
tire due to permeation has been significantly reduced by 50% to 57% over the air-inflated
tire. Again the difference between the 93% and 96% initial nitrogen purity is not large.
And, as predicted, the IPLR increases as the tire ages.
3. The tire inflated with various purities of nitrogen and topped off with nitrogen of some
purity shows another large reduction in oxygen flow across the tire (from 88% to 98%
better than the air-inflated tire) and another step change in reduction in IPLR. Again, the
initial tire purity does not seem to have a large effect on the outcome, but the IPLR does
remain essentially constant over time.
A review of Table 2, which presents the results for several Load Range E light truck tire
simulations, shows the same trends. These categories make more sense when considering that the
simulations discussed here represent a simplified view. In particular, field work would include
many tire sizes and types, as well as top-off intervals and gas purities that would be variable. The
differences in IPLR between the air-inflated case and any of the nitrogen inflated cases would
likely be difficult for the average driver to appreciate, given the difficulty the average driver has in
performing routine tire pressure maintenance. The small differences in oxygen flow likely explain
why experiments into the influence of nitrogen inflation do not detect differences in durability
above about the 93% level of initial nitrogen purity.
Oxygen flow has been used in this analysis as a comparative value, or metric, to show differences
among the various nitrogen inflation strategies available in the tire service industry. A significant
number of studies have linked air permeation to tire durability, and significant care is taken in the
20
development of modern radial tire inner liners to reduce the overall tire permeability. Operations
requiring dismount and remount of the tire, such as puncture repair, are likely to negatively impact
the tire’s long-term durability for an air-inflated tire, since the oxygen permeation is significantly
higher just after inflation. Significantly, nitrogen inflation, even with air top-off, significantly
reduces the lifetime exposure of the tire to oxygen.
Relation to Aging Studies
Much of the previous work involving nitrogen inflation that was cited initially was targeted at the
issue of rapid aging of tires (i.e., the development of an aged-tire test). Some of the initial work in
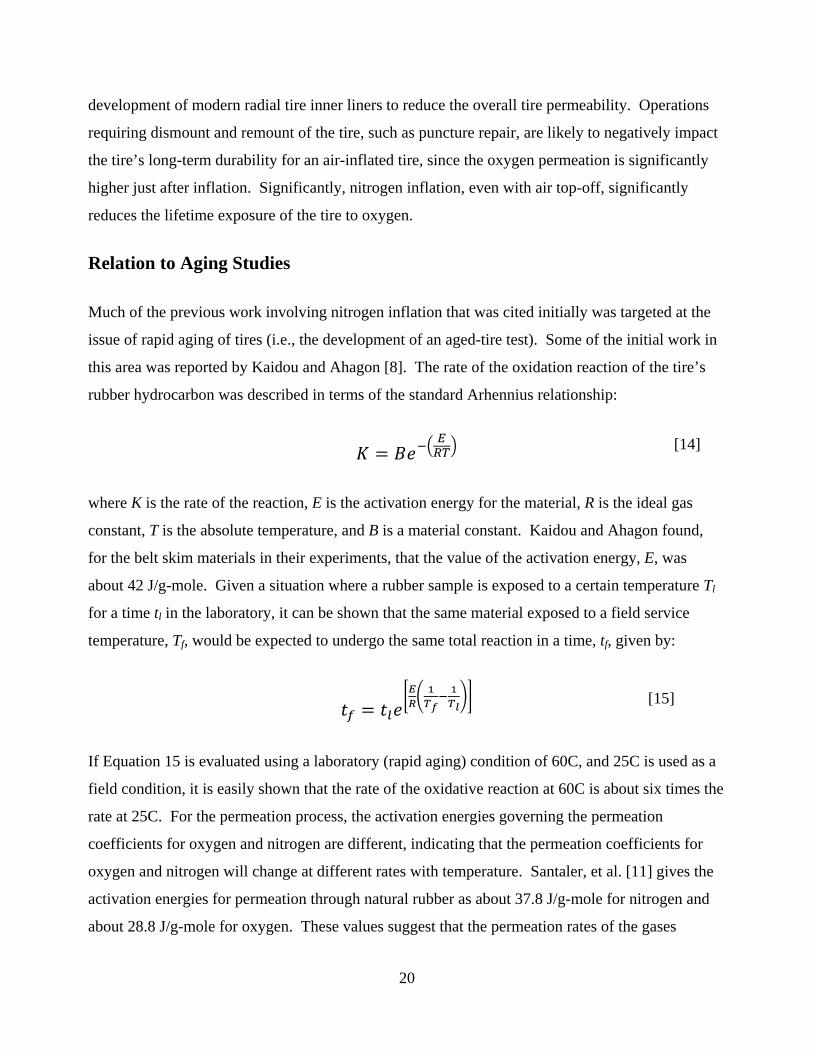
this area was reported by Kaidou and Ahagon [8]. The rate of the oxidation reaction of the tire’s
rubber hydrocarbon was described in terms of the standard Arhennius relationship:
where K is the rate of the reaction, E is the activation energy for the material, R is the ideal gas
constant, T is the absolute temperature, and B is a material constant. Kaidou and Ahagon found,
for the belt skim materials in their experiments, that the value of the activation energy, E, was
about 42 J/g-mole. Given a situation where a rubber sample is exposed to a certain temperature Tl
for a time tl in the laboratory, it can be shown that the same material exposed to a field service
temperature, Tf, would be expected to undergo the same total reaction in a time, tf, given by:
If Equation 15 is evaluated using a laboratory (rapid aging) condition of 60C, and 25C is used as a
field condition, it is easily shown that the rate of the oxidative reaction at 60C is about six times the
rate at 25C. For the permeation process, the activation energies governing the permeation
coefficients for oxygen and nitrogen are different, indicating that the permeation coefficients for
oxygen and nitrogen will change at different rates with temperature. Santaler, et al. [11] gives the
activation energies for permeation through natural rubber as about 37.8 J/g-mole for nitrogen and
about 28.8 J/g-mole for oxygen. These values suggest that the permeation rates of the gases
[14]
[15]
21
increase more slowly with temperature than do the oxidation reaction rates, resulting in what has
been termed in the literature a Diffusion Limited Oxidation, or DLO. Using the values presented
for nitrogen and oxygen, along with Equation 15, allows the prediction of permeation coefficients
for nitrogen and oxygen at various temperatures. The model presented above was used to predict
the oxygen flow across the tires involved in the aging studies previously discussed.
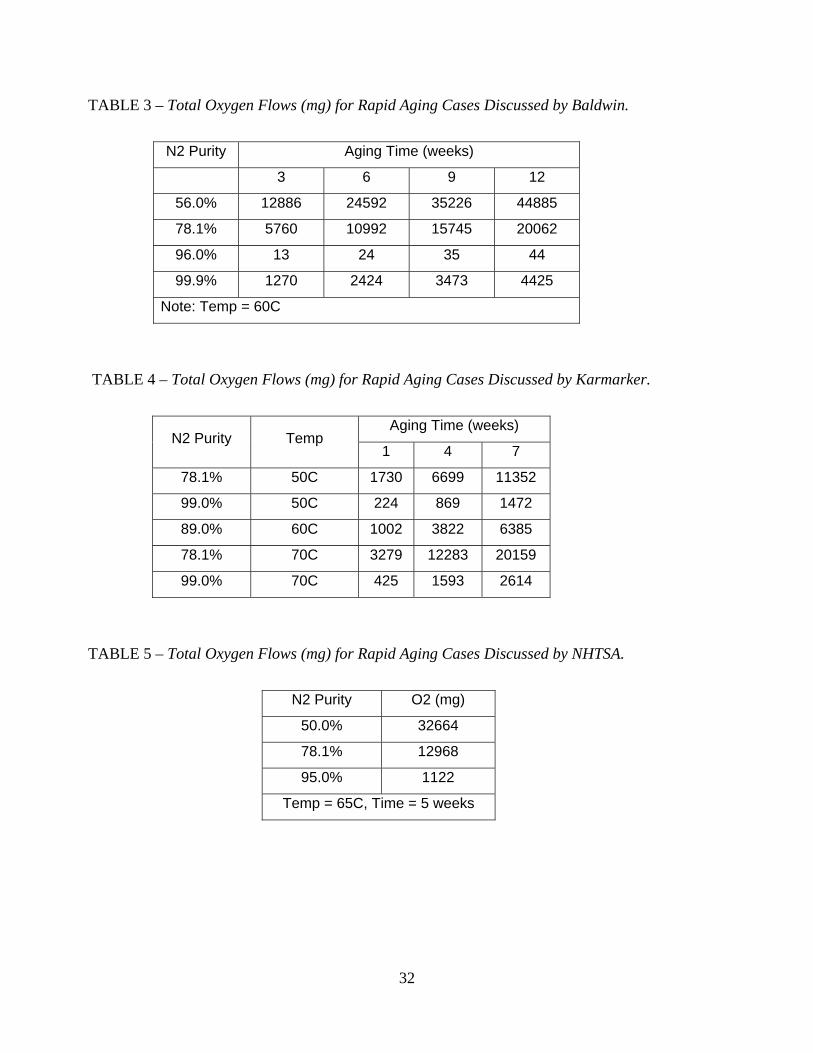
The work of Baldwin, et al., involved inflating LT245/75R16 Load Range D tires with initial
nitrogen purities of 56%, 78% (air), 96% and 99.9%, and then subjecting them to accelerated aging
at 60C for periods of 3, 6, 9, and 12 weeks. Samples of the wedge material from the aged tires
were compared to un-aged tires. The results showed that the tires that were inflated with 56%
nitrogen and air had a substantial change in the normalized strain ratio at break after only three
weeks, and this trend continued to develop over the 12-week period. The tires filled with 96% and
99.9% initial nitrogen purity showed essentially no change in the normalized strain ratio. Table 3
shows the result of a simulation using the previously-described methodology for the various cases
in the Baldwin study. Note that there is a significant difference in oxygen flow over these short
oven periods between the low nitrogen inflation cases (56% nitrogen and air) and the high nitrogen
purity cases. While a LRD tire of this size inflated with air would experience about 112,000 mg of
oxygen flow over a six-year life, the tire inflated with 56% purity nitrogen would be expected to
experience 44,885 mg, and the tire inflated with air would experience 20,062 mg in the twelve-
week aging process. Oxygen flows with nitrogen purities of 96% and 99.9% were significantly
lower, as expected. Significantly, 96% nitrogen purity results in significantly lower oxygen flows
than 99.9% nitrogen purity due to the permeation of oxygen from the outside of the tire in the high
purity case.
Karmarker’s studies also involved the belt skim material. The tires in this study were
LT245/75R16 Load Range E tires such as those discussed in the previous section. These tires were
inflated to initial nitrogen purities of 78.1% (using air alone), 89%, and 99%. The tires inflated to
78.1% and 99% initial nitrogen purity were aged at 50C and 70C for 1 week and 4 weeks. The
tires inflated to an initial nitrogen purity of 89% were aged at 60C for 4 weeks, thereby completing
a “box” style experimental design. The paper indicated that tires were “routinely” purged and re-
inflated to keep the partial pressure of the oxygen within 5% of the target value. Tires were then
run on an endurance wheel test, and examined shearographically at 10, 22, 34, 38, and 42 hours. In
22
this study, shearography areas recorded for belt edge separations developed much more quickly for
the tires aged at 70C in air than for the other test cases. Table 4 shows simulation results of oxygen
flow for the test cases in Karmarker’s study. As expected, the air-inflated cases show significantly
more oxygen flow than did the cases having higher nitrogen purity, although the total oxygen flows
attained were seen to be very low compared to the 138,000 mg predicted over a six-year life.
The NHTSA study involved a number of different passenger and light truck tires. NHTSA
measured IPLRs across this range of tires and experimentally determined that the IPLR for nitrogen
tire inflation was about 66% of that for an air-inflated tire on average. This is in the range of the
results shown in Tables 1 and 2, given that NHTSA studied initial tire nitrogen purities of 94% to
99% and covered a number of different tire types and sizes. NHTSA also subjected tires with
initial nitrogen purities of 50%, 78.1% (using air alone), and 94-99% to oven aging at 65C for 5
weeks followed by FMVSS 139 endurance testing. It was observed that some tires having initial
nitrogen purities of 50% did not complete the endurance test of 35.5 hours. Table 5 shows the
result of the simulation of oxygen flow for the conditions considered by NHTSA for the
LT245/75R16 Load Range E light truck tire assuming that the initial nitrogen inflation purity was
95% for the “nitrogen” case. Note that the oxygen flow through the tire inflated with an initial
nitrogen purity of 50% was about 2.5 times greater than for the tire with air inflation. Some of the
tires in NHTSA’s study group failed FMVSS testing when aged at the 50% nitrogen purity level.
Discussion
It is clear that nitrogen inflation, either as an initial tire treatment or together with an on-going
maintenance approach, can significantly reduce the amount of oxygen that flows through a tire
during the course of its life. The studies cited above showed that increased oxygen levels in the
tire’s inflation gas can increase the oxidation of the rubber materials in the tire and thereby reduce
its durability even on some short-term testing. It is, however, far from clear exactly what threshold
of oxygen flow corresponds to that required to cause a breakdown in the tire’s durability. Indeed,
this likely depends upon the design and manufacture of the tire, as was shown in NHTSA’s data
where some tires tested at 50% nitrogen purity did not complete the FMVSS endurance test while
others did.
23
From the current study, initial tire nitrogen purities vary widely depending upon the tire maximum
inflation pressure, the nitrogen purity of the inflation gas, and the number of inflation steps used at
a particular facility. It is also clear that initial inflation with nitrogen with air top-off imparts a
significant reduction in lifetime oxygen flow, with most of the benefit occurring in the early years
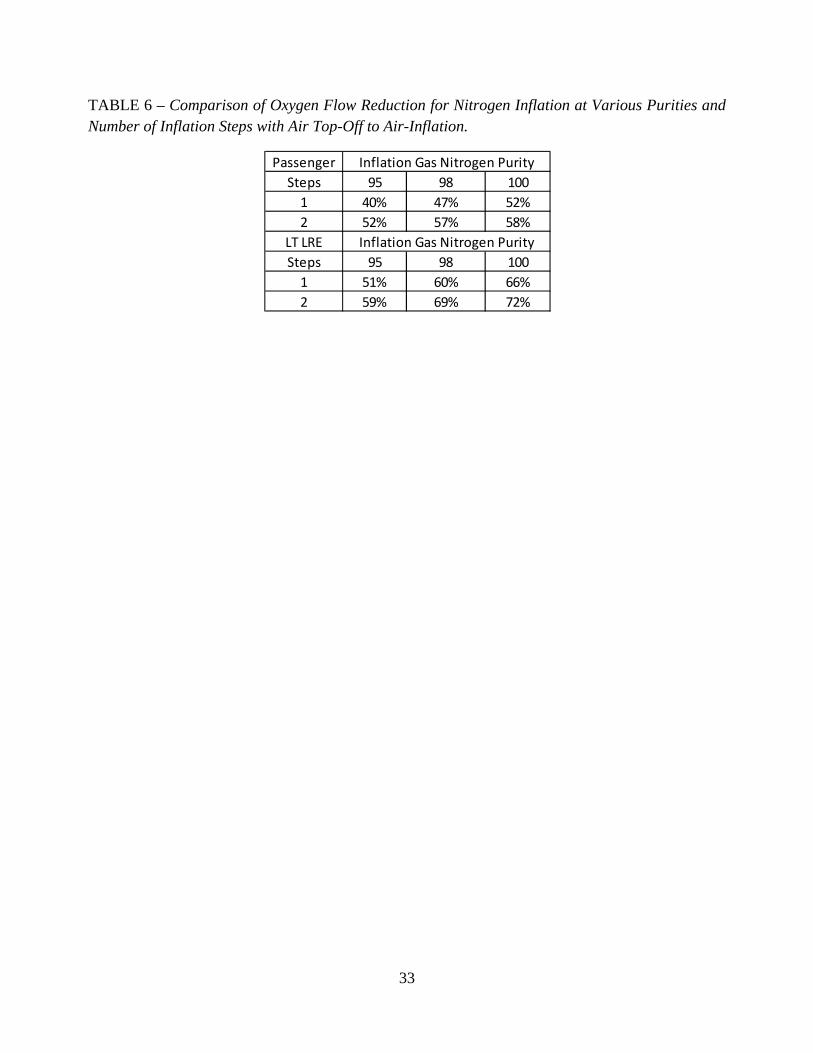
of a tire’s service lifetime. Table 6 shows a comparison of the simulated six-year oxygen flow
across the tire at various inflation gas purities and inflation steps for both Passenger Car and Light
Truck LRE tires. The differences between the inflation gas nitrogen purity of 95% and one
inflation step and a nitrogen purity of 100% and two inflation steps appear to be small considering
this simulation covers only two distinct sizes and a fixed six-year life with regular top-off intervals.
It is very likely that, in practice, the differences among all these conditions would be less distinct.
This means that the nitrogen purity of the inflation gas and the number of inflation steps likely
become less significant, i.e., single-step inflation with nitrogen may be just as effective and more
cost efficient than two-step inflation, given the wide variation of tire sizes and tire maintenance
strategies found in the field. In any event, the reduction in oxygen flow across the tire due to
nitrogen inflation, even with air top-off maintenance, is on the order of 50%. This is equivalent to
building a tire with an inner liner that reduces the IPLR by a factor of two, all other conditions
being equal. The data also suggest that for tires with nitrogen inflation and air top-off that remain
in service for extended periods of time beyond six years, the percentage benefit in oxygen flow
reduction over the service lifetime would be reduced from the results presented here because the
tire’s inflation gas will evolve more completely toward that of an air-inflated, air topped-off tire.
For tires that are inflated with nitrogen and topped off with nitrogen, the oxygen flow through the
tire tends to be driven from the outside toward the inside, at least initially, and will remain
significantly lower on a monthly basis throughout the tire’s service life. This has the potential to
generate another significant reduction in oxygen flow over both the air-inflated tire and the
nitrogen-inflated tire topped off with air. However, the burden of providing this top-off service
along with nitrogen inflation would fall directly on the tire service industry and would require a
significant increase in the availability of nitrogen inflation gas outlets. As mentioned previously, a
perhaps more palatable approach would be to redo the nitrogen inflation every two to three years,
given that the significant benefits in the initial nitrogen inflation will have become significantly
degraded at that point. This would provide a more stable IPLR for the customer, an additional
24
significant reduction in lifetime oxygen flow across the tire, and a more stable income stream for
the nitrogen service industry. In any event, this study clearly shows that IPLR cannot be
maintained at low levels without some form of nitrogen purity maintenance.
Conclusions
1. The fact that a tire is about three times more permeable to oxygen than nitrogen is offset by
the fact that the partial pressure of nitrogen is over three times higher than oxygen. This
means that the initial permeation of gas out of an air-filled tire is almost half nitrogen and
half oxygen. This also results in an evolution of the nitrogen purity in the tire over its
service life.
2. The equilibrium partial pressure of oxygen is different for different maximum inflation
pressures in different tire types. Higher purities of nitrogen may be obtained in fewer
inflation steps with lower purity gas sources if the maximum inflation pressure for the tire is
high. Standard Load passenger car tires marked with 240kPa (35psi) represent the most
difficult tires in which to attain high initial nitrogen purity since they have the lowest
maximum inflation pressure.
3. The partial pressure of both the nitrogen and the oxygen in the tire evolves over the life of
the tire. For a tire inflated with air, the purity of nitrogen in the tire increases monotonically
over the tire life as the tire’s pressure is topped off with additional air.
4. For an air-inflated tire, the oxygen flow across the tire decreases over the life of the tire.
This means that tires that are dismounted and remounted have significantly more oxygen
exposure than those that are not so treated. Therefore, puncture repairs and used tire sales
likely adversely affect tire long-term durability.
5. Initial inflation of a tire with nitrogen at some purity level results in an initial reduction in
inflation pressure loss rate. The IPLR approaches that of an air-inflated tire over time if the
tire is topped off with air. The IPLR at any point in the tire’s life is linearly related to the
level of nitrogen purity in the tire at that time. Since the nitrogen purity of a tire evolves
over time, IPLR improvements are transient if the tire is topped off with air rather than
nitrogen.
6. Initial inflation of a tire with nitrogen at some purity and topping it off with air results in a
reduction in the total oxygen flowing across the tire during a simulated lifetime of six years
25
of about half compared to that experienced by an air-inflated tire. The bulk of this
reduction occurs in the first half of the simulated life, so extending the lifetime will reduce
the percentage reduction in oxygen flow.
7. Initial inflation of a tire with nitrogen at some purity and topping it off with nitrogen results
in another significant reduction in the amount of oxygen that flows across the tire during its
lifetime. A similar improvement could be obtained by repeating the nitrogen inflation
process every two to three years, given that the bulk of the benefits accrue in the early years
of the tire’s lifetime.
8. The reduction in oxygen flow across the tire using nitrogen inflation is likely to be
substantially the same in the field across large populations of tires regardless of the purity
of the nitrogen inflation source or the number of inflation steps used as long as the tire is
topped off with air. This suggests that the nitrogen service industry could settle on a more
efficient and economical initial inflation process coupled with a maintenance program
including nitrogen.
9. The oxidation reaction rate in oven-aged tires appears to increase more rapidly with
temperature than does the rate of oxygen permeation through the tire. This fact likely
contributes to the change from aerobic to anaerobic reaction kinetics as oven aging
temperature is increased.
26
Appendix A
Estimation of (A/V) ratio for a Passenger or Light Truck tire
The approach used for estimating the ratio (A/V) for a passenger or light truck tire will be
illustrated using the passenger car tire data. This approach is based upon the definition of
the maximum envelope dimensions for the grown tire, as given in the Tire & Rim
Association (T&RA) Yearbook, and shown on Figure A-1. In this definition, every
dimension of the outside profile of the tire is given in terms of the rim diameter, the
maximum section height, and the maximum overall width. In order to estimate the tire’s
internal volume and its internal surface area, it is necessary to generate an approximation of
the tire’s internal profile. Figure A-1 also shows the construction of four straight lines
internal to half the T&RA envelope that can be used to make such an estimation. Vertical
Line 1 is drawn parallel to the sidewall, inset from the outer sidewall line by the sidewall
thickness, Gs, and extending from H1 to H2 on the figure. Horizontal Line 2 is drawn inset
from the crown curve by the crown thickness, Gc, at the tire centerline. Line 3 is drawn
from the upper end of Line 1 and offset from the shoulder line by the sidewall thickness.
Line 4 is drawn from the lower end of Line 1 to intersect with the base line a distance inside
the rim flange equal to the average bead thickness, Gb. Using this straight-line
approximation, the half internal volume of the tire will be given by the sum of the two
trapezoidal and one rectangular areas swept through 360 degrees using the radius to the
appropriate centroid of each area. The half liner area will be the length of lines 1 through 4
each swept through 360 degrees using the radius to the appropriate centroid of the line.
This approach, based on simple geometry, can easily be implemented on a spreadsheet for
calculation purposes. Generally, passenger car section thicknesses are relatively consistent.
For example, the approach outlined above was used to compute the (A/V) ratio for eleven
different tire sizes where this value had been experimentally measured and reported by
Costemalle. The same values of the three thickness results were used for all tires: Gc = 15
mm, Gs = 6 mm, and Gb = 10 mm. The comparison between the experimentally
determined values and the approximations obtained from the above approach are shown in
Figure A-2. A similar approach can be used for light truck tires using the maximum grown
envelope model for that tire type found in the T&RA Yearbook. Again, section thicknesses

27
will be relatively consistent among light truck tires except for variations in tread depths for
off-road and highway uses.
28
References
[1] Sperberg, L.R., “Tire Durability with Nitrogen Inflation”, Rubber Age, 99(11), 83 (1967).
[2] Tokita, N., et al., “Long Term Durability of Tires”, International Rubber Conference
Proceedings”, Kyoto, Japan, October 15-18, 1985, Paper 18D17, pp. 672-679.
[3] Baldwin, J.M., Bauer, D.R., and Ellwood, K.R., “Effects of Nitrogen Inflation on Tire Aging
and Performance”, presented at a meeting of the Rubber Division, American Chemical Society,
Grand Rapids, MI, May 17-19, 2004.
[4] Karmarker, U., “Effect of Nitrogen Purity on the Oxidation of Belt Coat Compound”, Presented
at a Meeting of the International Tire Exhibition and Conference (ITEC), Akron, OH, September,
2006, Paper No. 19B.
[5] MacIsaac, J., et al., “The Effects of Inflation Gas on Tire Laboratory Test Performance”,
Presented at a Meeting of the International Tire Exhibition and Conference (ITEC), Akron, OH,
September 17, 2008, Paper No. 18C-1.
[6] Waddell, W.H., et al., “Nitrogen Inflation of Tires”, presented at the Fall 174th Technical
Meeting of the Rubber Division, ACS, Louisville, KY, October 14-16, 2008.
[7] Costemalle, B., “Tyre Pressure Loss and Intracarcass Pressure Modeling”, Paper Presented to
The Tire Society, Akron, OH, March, 1992.
[8] Kaidou, H. and Ahagon, A., “Aging of Tire Parts During Service. II. Aging of Belt-Skim
Rubbers in Passenger Tires”, Presented at a Meeting of the Rubber Division, American Chemical
Society, Las Vegas, Nevada, May 29-June 1, 1990.
[9] United States Patent 5,040,583, “Tire Innerliner”
[10] Dalpe, S., “Innerliner Permeability and Thickness: Influence on Inflation Pressure Retention,
Intracarcass Pressure, and Tire Durability”, Exxon Chemical Company, Linden, NJ, Ref No.
92PLYM 445.

29
[11] Santeler, D.J., et al., “Vacuum Technology and Space Simulation”, NASA SP-105, Prepared
under contract NASw-680 by Aero Vac Corporation, 1996, p. 216.
30
List of Tables
TABLE 1 – Monthly Average IPLR and 6-year O2 Flow Across tire: P235/75R15 SL.
TABLE 2 – Monthly Average IPLR and 6-year O2 Flow Across tire: LT245/75R16 LRE.
TABLE 3 – Total Oxygen Flows (mg) for Rapid Aging Cases Discussed by Baldwin.
TABLE 4 – Total Oxygen Flows (mg) for Rapid Aging Cases Discussed by Karmarker.
TABLE 5 – Total Oxygen Flows (mg) for Rapid Aging Cases Discussed by NHTSA.
TABLE 6 – Comparison of Oxygen Flow Reduction for Nitrogen Inflation at Various Purities and Number of Inflation Steps with Air Top-Off to Air-Inflation.
31
TABLE 1 - Monthly Average IPLR and 6-year O2 Flow Across tire: P235/75R15 SL.
TABLE 2 – Monthly Average IPLR and 6-year O2 Flow Across tire: LT245/75R16 LRE.
Year Air/Air 93%/Air 93%/95% 93%/100% 96%/Air 96%/98% 96%/100%
1 2.50% 1.80% 1.80% 1.80% 1.70% 1.70% 1.60%
2 2.30% 1.90% 1.80% 1.80% 1.90% 1.70% 1.70%
3 2.20% 2.00% 1.80% 1.80% 2.00% 1.70% 1.70%
4 2.10% 2.00% 1.80% 1.80% 2.00% 1.80% 1.70%
5 2.10% 2.00% 1.80% 1.80% 2.00% 1.80% 1.70%
6 2.10% 2.10% 1.80% 1.80% 2.00% 1.80% 1.70%
Average
IPLR (%)2.22% 1.98% 1.80% 1.76% 1.94% 1.73% 1.72%
IPLR
Reduction10.8% 18.9% 20.7% 12.6% 22.1% 22.5%
Total mg
O278,881 39,466 9,202 1,190 34,127 5,245 5,641
Total O2
Reduction50.0% 88.3% 98.5% 56.7% 93.4% 92.8%
Inflation N2 Purity/Top‐off Gas N2 Purity
Year Air/Air 94%/Air 94%/95% 94%/100% 97%/Air 97%/98% 96%/100%
1 1.60% 1.20% 1.10% 1.10% 1.10% 1.10% 1.10%
2 1.50% 1.20% 1.10% 1.10% 1.10% 1.10% 1.10%
3 1.40% 1.20% 1.10% 1.10% 1.20% 1.10% 1.10%
4 1.40% 1.20% 1.10% 1.10% 1.20% 1.10% 1.10%
5 1.30% 1.20% 1.10% 1.10% 1.20% 1.10% 1.10%
6 1.30% 1.20% 1.10% 1.10% 1.20% 1.10% 1.10%
Average
IPLR (%)1.41% 1.22% 1.12% 1.10% 1.18% 1.08% 1.08%
IPLR
Reduction13.5% 20.6% 22.0% 16.3% 23.4% 23.4%
Total mg
O2138,287 59,613 21,673 11,372 44,964 3,216 2,626
Total O2
Reduction56.9% 84.3% 91.8% 67.5% 97.7% 98.1%
Inflation N2 Purity/Top‐off Gas N2 Purity
32
TABLE 3 – Total Oxygen Flows (mg) for Rapid Aging Cases Discussed by Baldwin.
N2 Purity Aging Time (weeks)
3 6 9 12
56.0% 12886 24592 35226 44885
78.1% 5760 10992 15745 20062
96.0% 13 24 35 44
99.9% 1270 2424 3473 4425
Note: Temp = 60C
TABLE 4 – Total Oxygen Flows (mg) for Rapid Aging Cases Discussed by Karmarker.
N2 Purity Temp Aging Time (weeks)
1 4 7
78.1% 50C 1730 6699 11352
99.0% 50C 224 869 1472
89.0% 60C 1002 3822 6385
78.1% 70C 3279 12283 20159
99.0% 70C 425 1593 2614
TABLE 5 – Total Oxygen Flows (mg) for Rapid Aging Cases Discussed by NHTSA.
N2 Purity O2 (mg)
50.0% 32664
78.1% 12968
95.0% 1122
Temp = 65C, Time = 5 weeks
33
TABLE 6 – Comparison of Oxygen Flow Reduction for Nitrogen Inflation at Various Purities and Number of Inflation Steps with Air Top-Off to Air-Inflation.
Passenger
Steps 95 98 100
1 40% 47% 52%
2 52% 57% 58%
LT LRE
Steps 95 98 100
1 51% 60% 66%
2 59% 69% 72%
Inflation Gas Nitrogen Purity
Inflation Gas Nitrogen Purity
34
List of Figures
FIGURE 1. Tire Nitrogen Purity for Equilibrium Oxygen.
FIGURE 2. Oxygen Partial Pressure as a Function of Tire Maximum Pressure and Nitrogen
Purity.
FIGURE 3. Inflation Purity Evolution for Inflation Gas of 95% Nitrogen Purity.
FIGURE 4. Inflation Purity Evolution for Inflation Gas of 98% Nitrogen Purity.
FIGURE 5. Nitrogen Purity Evolution by Inflation Step for Standard Load Passenger Car Tires.
FIGURE 6. Nitrogen Purity Evolution by Inflation Step for LRE Light Truck Tires.
FIGURE 7. Gas Purity Evolution over Service Life for P235/75R15 SL Tire Inflated with Air and
Topped Off With Air.
FIGURE 8. Partial Pressure Evolution over Service Life for P235/75R15 SL Tire Inflated with Air
and Topped Off With Air.
FIGURE 9. Oxygen Permeation over Service Life for P235/75R15 SL Tire Inflated with Air and
Topped Off With Air.
FIGURE 10. Partial Pressure Evolution over Service Life for P235/75R15 SL Tire Inflated with
93% Nitrogen and Topped Off With Air.
FIGURE 11. Partial Pressure Evolution over Service Life for P235/75R15 SL Tire Inflated with
96% Nitrogen and Topped Off With Air.
FIGURE 12. Comparison of Oxygen Permeation in P235/75R15 SL over Tire Lifetime Showing
the Benefit of Nitrogen Inflation and Maintenance of Tire Nitrogen Purity.
FIGURE 13. Initial IPLR for P235/75R15 SL Tire Inflated with Nitrogen.
35
FIGURE 14. Partial Pressure Evolution over Service Life for P235/75R15 SL Tire Inflated with
93% Nitrogen and Topped Off With Inflation Gas at 95% Purity.
FIGURE 15. Partial Pressure Evolution over Service Life for P235/75R15 SL Tire Inflated with
96% Nitrogen and Topped Off With Inflation Gas at 98%.
FIGURE 16. Partial Pressure Evolution over Service Life for P235/75R15 SL Tire Inflated with
93% Nitrogen and Topped Off With Inflation Gas at 100%.
FIGURE 17. Comparison of Oxygen Flow Curves over the Service Life for P235/75R15 SL Tire.
FIGURE 18. Service Life Oxygen Flow Across P235/75R15 SL Tire for Various Initial Nitrogen
Purities and Top-Off Gases.
FIGURE 19. Comparison of IPLR in P235/75R15 SL Tire for Nitrogen Inflation with Various
Maintenance Strategies.
FIGURE 20. Service Life Oxygen Flow Across LT245/75R16 LRE Tire for Various Initial
Nitrogen Purities and Top-Off Gases.
FIGURE A-1. Cross-Section Development for Estimation of (A/V) Ratio..
FIGURE A-2. Comparison of Estimated and Experimentally-Determined (A/V) Ratios for
Passenger Car Tire Sizes Reported by Costemalle.
36
FIGURE 1. Tire Nitrogen Purity for Equilibrium Oxygen.
90
91
92
93
94
95
96
97
98
99
100
25 30 35 40 45 50 55 60 65 70 75 80 85 90 95 100 105 110
Tire N2 Pu
rity (%
)
Tire Pressure (psig)
Tire N2 Purity for Equilibrium O2
37
FIGURE 2. Oxygen Partial Pressure as a Function of Tire Maximum Pressure and Nitrogen Purity.
0.0
1.0
2.0
3.0
4.0
5.0
6.0
7.0
8.0
9.0
10.0
92 93 94 95 96 97 98 99
Partial Pressure O2 (psia)
Tire N2 Purity (%)
Tire O2 Partial Pressure
Air
35 psig
50 psig
65 psig
80 psig
100 psig
Tire Gauge Pressure
O2 flows into tire
O2 flows out of tire
38
FIGURE 3. Inflation Purity Evolution for Inflation Gas of 95% Nitrogen Purity.
78
79
80
81
82
83
84
85
86
87
88
89
90
91
92
93
94
95
96
97
98
99
100
0 1 2 3 4 5
Tire N2 Pu
rity (%
)
Inflation Number
Inflation Purity Evolutionw/ N2 Inflation Gas Purity = 95%
35 psi
50 psi
65 psi
80 psi
Max Tire Pressure
39
FIGURE 4. Inflation Purity Evolution for Inflation Gas of 98% Nitrogen Purity.
78
79
80
81
82
83
84
85
86
87
88
89
90
91
92
93
94
95
96
97
98
99
100
0 1 2 3 4 5
Tire N2 Pu
rity (%
)
Inflation Number
Inflation Purity Evolutionw/ N2 Inflation Gas Purity = 98%
35 psi
50 psi
65 psi
80 psi
Max Tire Pressure
40
FIGURE 5. Nitrogen Purity Evolution by Inflation Step for Standard Load Passenger Car Tires.
78
79
80
81
82
83
84
85
86
87
88
89
90
91
92
93
94
95
96
97
98
99
100
0 1 2 3 4 5
Tire N2 Pu
rity (%
)
Inflation Step
Passenger Car N2 Purity Evolution
95%
98%
100%
Inflation Gas Purity
41
FIGURE 6. Nitrogen Purity Evolution by Inflation Step for LRE Light Truck Tires.
78
79
80
81
82
83
84
85
86
87
88
89
90
91
92
93
94
95
96
97
98
99
100
0 1 2 3 4 5
Tire N2 Pu
rity (%
)
Inflation Step
Light Truck (E) N2 Purity Evolution
95%
98%
100%
Inflation Gas Purity
42
FIGURE 7. Gas Purity Evolution over Service Life for P235/75R15 SL Tire Inflated with Air and Topped Off With Air.
0
10
20
30
40
50
60
70
80
90
100
1 13 25 37 49 61
Tire Gas Purity (%
)
Tire Age (Months)
Gas Purity Evolutionw/ Monthly Top‐off
N2
O2
P235/75R15 SL
Conditions:Initial Tire N2 = 78.1%Top‐off Gas = Air
43
FIGURE 8. Partial Pressure Evolution over Service Life for P235/75R15 SL Tire Inflated with Air and Topped Off With Air.
0.0
0.1
0.2
0.3
0.4
0.5
0.6
0.7
0.8
0.9
1.0
1 13 25 37 49 61
Gas Loss (psi)
Tire Age (Months)
Tire Partial Pressure Lossw/ Monthly Top‐off
N2
O2
Total
P235/75R15 SL
Conditions:Initial Tire N2 = 78.1%Top‐off Gas = Air
44
FIGURE 9. Oxygen Permeation over Service Life for P235/75R15 SL Tire Inflated with Air and Topped Off With Air.
0
500
1000
1500
2000
2500
1 13 25 37 49 61
O2 Crossing
Tire (m
g)
Tire Age (Months)
O2 Permeation through Tirew/ Monthly Top‐off
Conditions:Initial Tire N2 = 78.1%Top‐off Gas = Air
P235/75R15 SL
45
FIGURE 10. Partial Pressure Evolution over Service Life for P235/75R15 SL Tire Inflated with 93% Nitrogen and Topped Off With
Air.
0.0
0.1
0.2
0.3
0.4
0.5
0.6
0.7
0.8
1 13 25 37 49 61
Gas Loss (psi)
Tire Age (Months)
Tire Partial Pressure Lossw/ Monthly Top‐off
N2
O2
Total
P235/75R15 SL
Conditions:Initial Tire N2 = 93%Top‐off Gas = Air
46
FIGURE 11. Partial Pressure Evolution over Service Life for P235/75R15 SL Tire Inflated with 96% Nitrogen and Topped Off With
Air.
‐0.2
‐0.1
0.0
0.1
0.2
0.3
0.4
0.5
0.6
0.7
0.8
1 13 25 37 49 61
Gas Loss (psi)
Tire Age (Months)
Tire Partial Pressure Lossw/ Monthly Top‐off
N2
O2
Total
P235/75R15 SL
Conditions:Initial Tire N2 = 96%Top‐off Gas = Air
47
FIGURE 12. Comparison of Oxygen Permeation in P235/75R15 SL over Tire Lifetime Showing the Benefit of Nitrogen Inflation and
Maintenance of Tire Nitrogen Purity.
48
FIGURE 13. Initial IPLR for P235/75R15 SL Tire Inflated with Nitrogen.
49
FIGURE 14. Partial Pressure Evolution over Service Life for P235/75R15 SL Tire Inflated with 93% Nitrogen and Topped Off With
Inflation Gas at 95% Purity.
0.0
0.1
0.2
0.3
0.4
0.5
0.6
0.7
1 13 25 37 49 61
Gas Loss (psi)
Tire Age (Months)
Tire Partial Pressure Lossw/ Monthly Top‐off
N2
O2
Total
P235/75R15 SL
Conditions:Initial Tire N2 = 93%
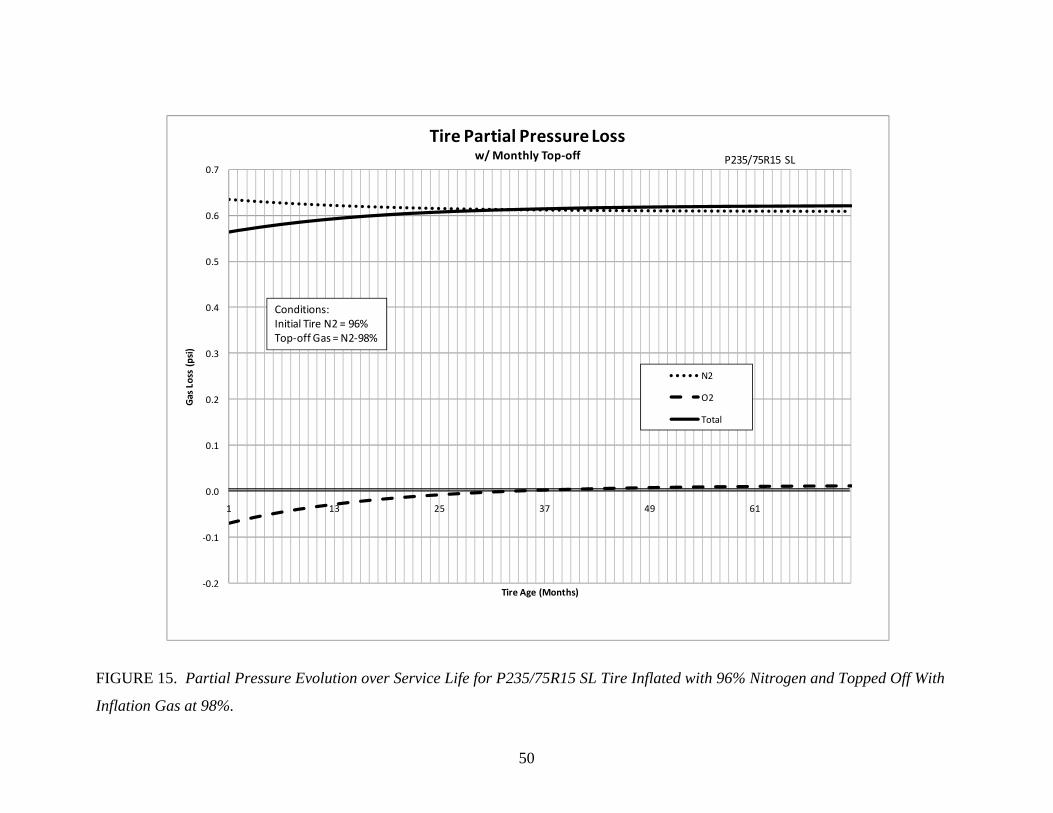
50
FIGURE 15. Partial Pressure Evolution over Service Life for P235/75R15 SL Tire Inflated with 96% Nitrogen and Topped Off With
Inflation Gas at 98%.
‐0.2
‐0.1
0.0
0.1
0.2
0.3
0.4
0.5
0.6
0.7
1 13 25 37 49 61
Gas Loss (psi)
Tire Age (Months)
Tire Partial Pressure Lossw/ Monthly Top‐off
N2
O2
Total
P235/75R15 SL
Conditions:Initial Tire N2 = 96%Top‐off Gas = N2‐98%
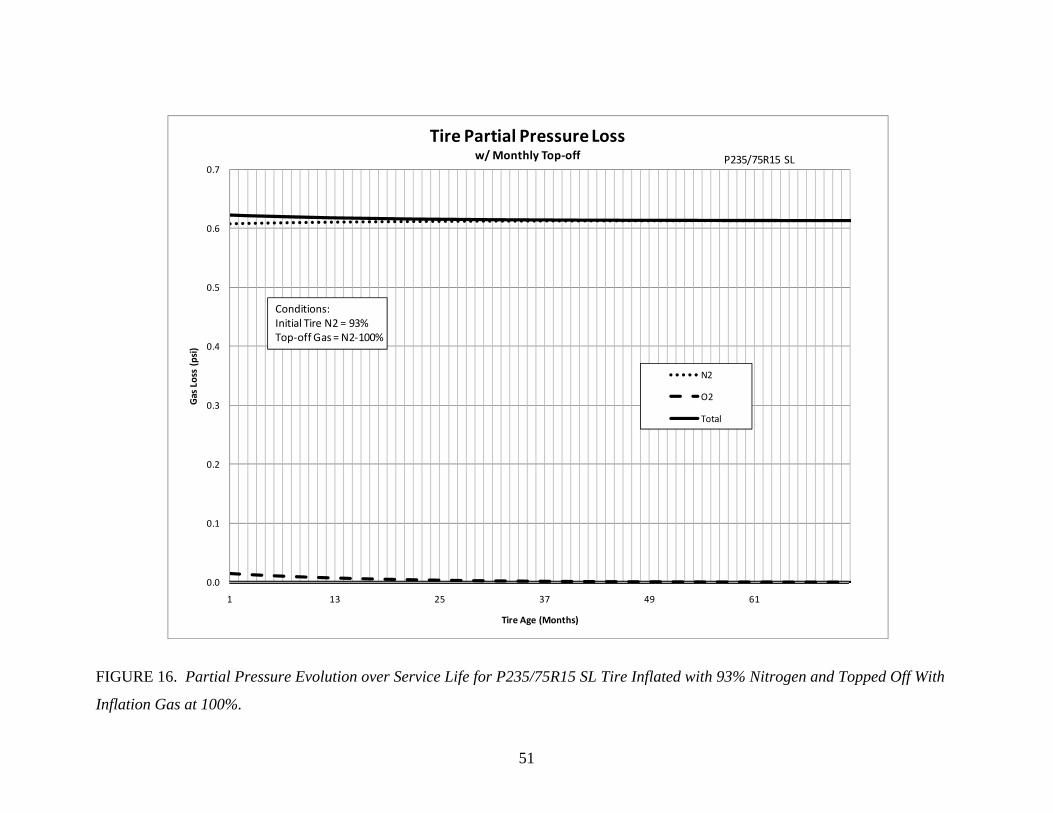
51
FIGURE 16. Partial Pressure Evolution over Service Life for P235/75R15 SL Tire Inflated with 93% Nitrogen and Topped Off With
Inflation Gas at 100%.
0.0
0.1
0.2
0.3
0.4
0.5
0.6
0.7
1 13 25 37 49 61
Gas Loss (psi)
Tire Age (Months)
Tire Partial Pressure Lossw/ Monthly Top‐off
N2
O2
Total
P235/75R15 SL
Conditions:Initial Tire N2 = 93%Top‐off Gas = N2‐100%
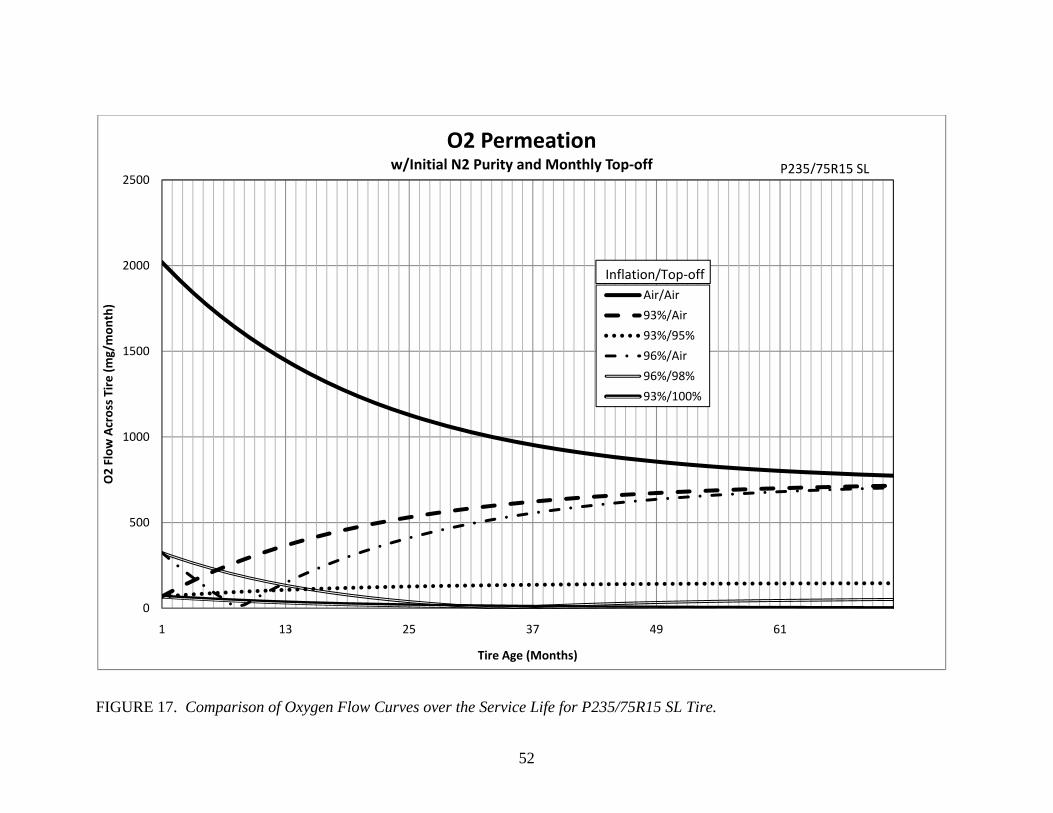
52
FIGURE 17. Comparison of Oxygen Flow Curves over the Service Life for P235/75R15 SL Tire.
0
500
1000
1500
2000
2500
1 13 25 37 49 61
O2 Flow
Across Tire (m
g/mon
th)
Tire Age (Months)
O2 Permeationw/Initial N2 Purity and Monthly Top‐off
Air/Air
93%/Air
93%/95%
96%/Air
96%/98%
93%/100%
Inflation/Top‐off
P235/75R15 SL
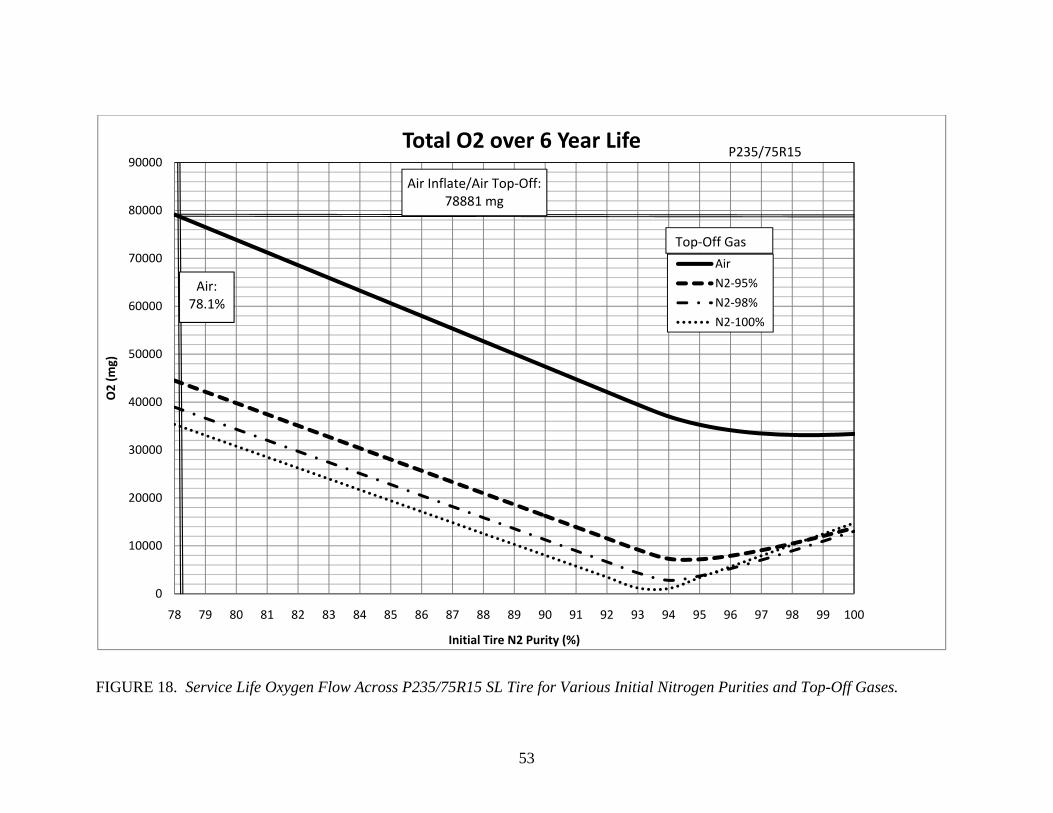
53
FIGURE 18. Service Life Oxygen Flow Across P235/75R15 SL Tire for Various Initial Nitrogen Purities and Top-Off Gases.
0
10000
20000
30000
40000
50000
60000
70000
80000
90000
78 79 80 81 82 83 84 85 86 87 88 89 90 91 92 93 94 95 96 97 98 99 100
O2 (m
g)
Initial Tire N2 Purity (%)
Total O2 over 6 Year Life
Air
N2‐95%
N2‐98%
N2‐100%
P235/75R15
Top‐Off Gas
Air Inflate/Air Top‐Off:78881 mg
Air:78.1%
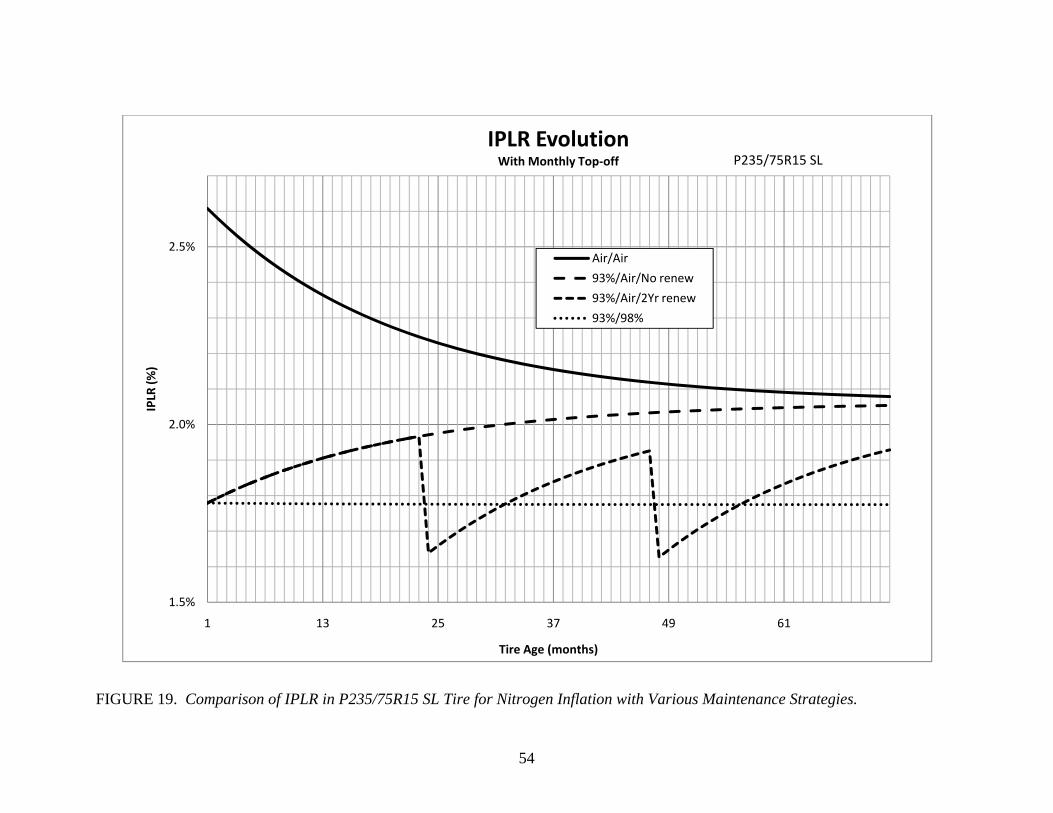
54
FIGURE 19. Comparison of IPLR in P235/75R15 SL Tire for Nitrogen Inflation with Various Maintenance Strategies.
1.5%
2.0%
2.5%
1 13 25 37 49 61
IPLR
(%)
Tire Age (months)
IPLR EvolutionWith Monthly Top‐off
Air/Air
93%/Air/No renew
93%/Air/2Yr renew
93%/98%
P235/75R15 SL
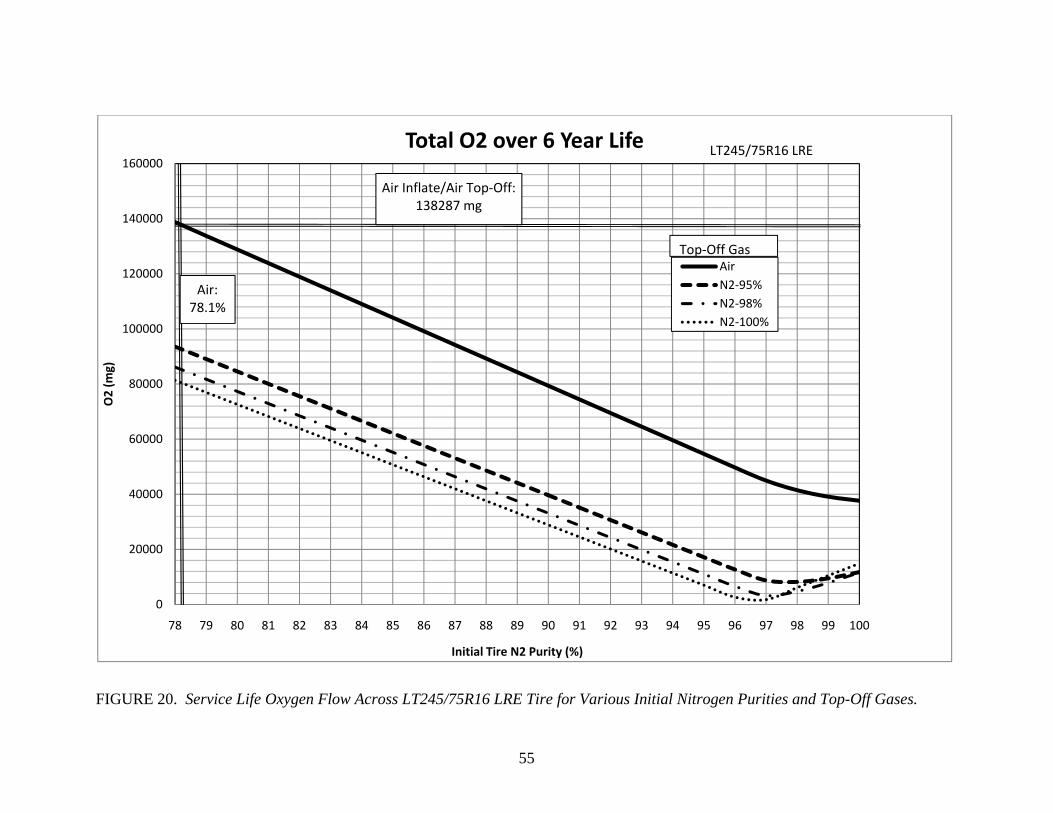
55
FIGURE 20. Service Life Oxygen Flow Across LT245/75R16 LRE Tire for Various Initial Nitrogen Purities and Top-Off Gases.
0
20000
40000
60000
80000
100000
120000
140000
160000
78 79 80 81 82 83 84 85 86 87 88 89 90 91 92 93 94 95 96 97 98 99 100
O2 (m
g)
Initial Tire N2 Purity (%)
Total O2 over 6 Year Life
Air
N2‐95%
N2‐98%
N2‐100%
LT245/75R16 LRE
Top‐Off Gas
Air Inflate/Air Top‐Off:138287 mg
Air:78.1%
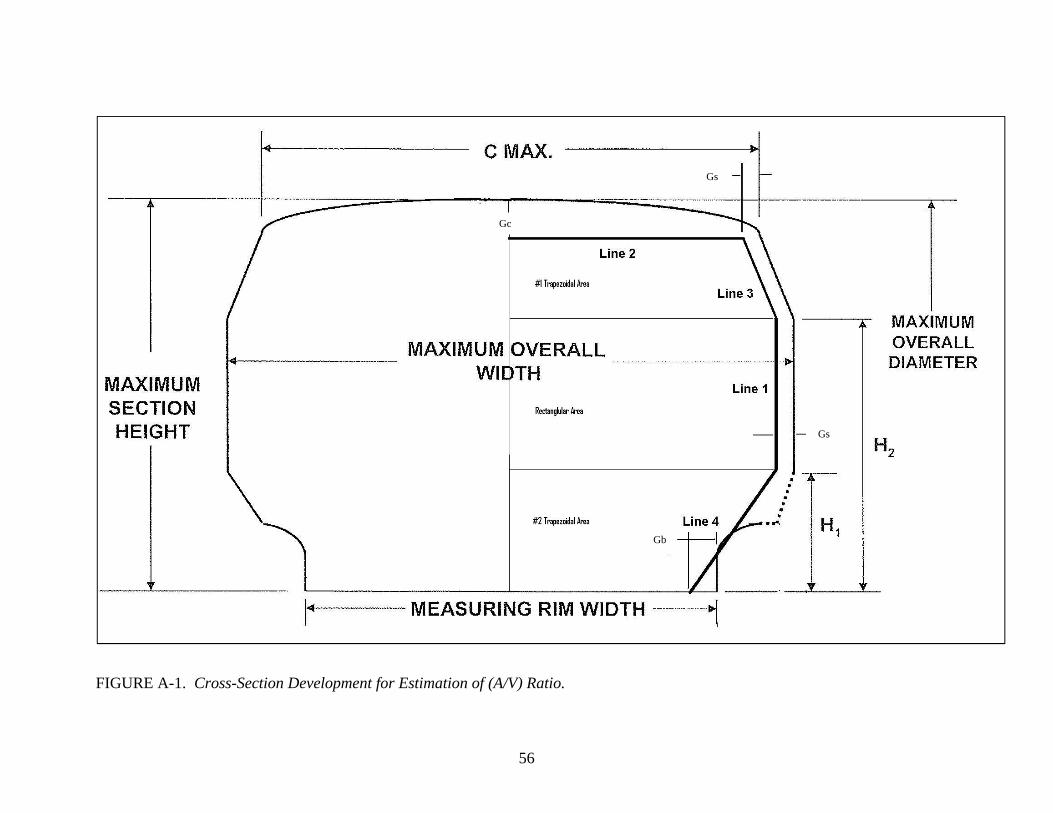
56
FIGURE A-1. Cross-Section Development for Estimation of (A/V) Ratio.
Gc
Gs
Gb
Gs
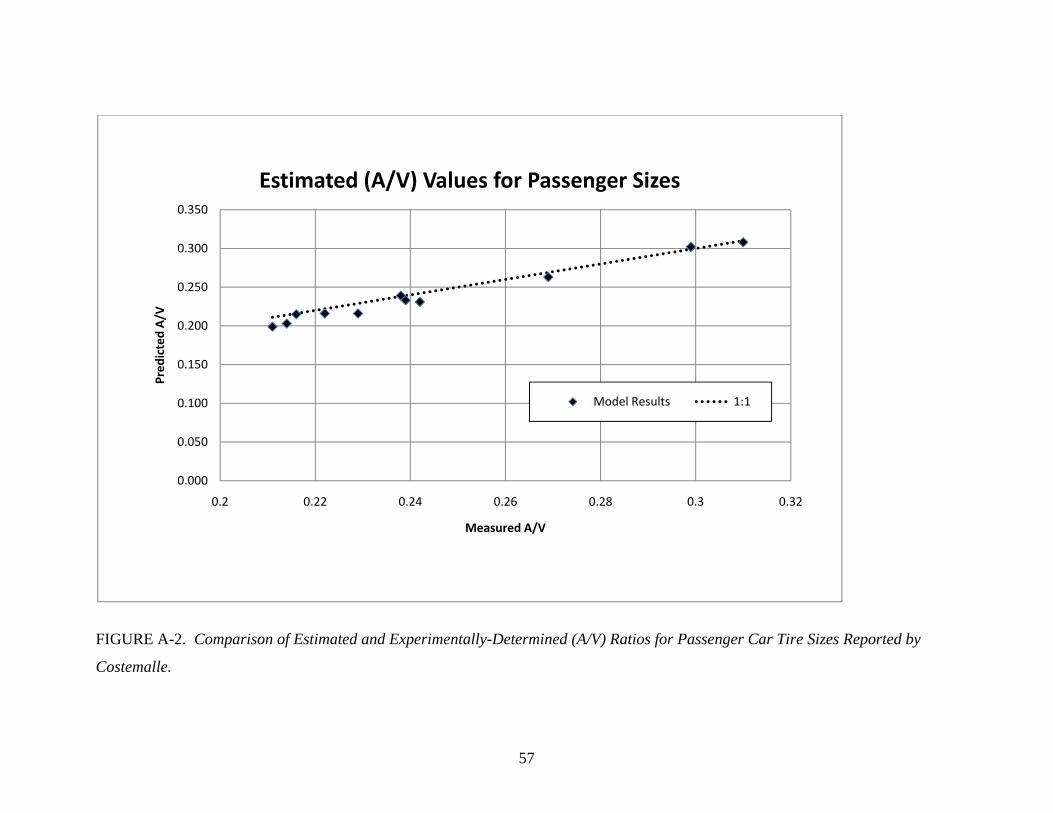
57
FIGURE A-2. Comparison of Estimated and Experimentally-Determined (A/V) Ratios for Passenger Car Tire Sizes Reported by
Costemalle.
0.000
0.050
0.100
0.150
0.200
0.250
0.300
0.350
0.2 0.22 0.24 0.26 0.28 0.3 0.32
Pred
icted A/V
Measured A/V
Estimated (A/V) Values for Passenger Sizes
Model Results 1:1