Embed Size (px)
Citation preview

C. Galy-Lacaux, C. Delon, K. Pienaar, A. Probst, M. Adon, V. Yoboué, B. Diop, L. Sigha,D. Laouali, A. AkpoLaboratoire d’Aérologie, CNRS, Toulouse France, ECOLAB, CNRS Toulouse France, University of Potchefstroom, Abidjan,Bamako, Yaoundé, Niger and Benin
7th INI international conference, Melbourne 4-8 December 2016
Nitrogen Emission and Deposition Budget in Africa

N Emission-Deposition budget in Africa: ecosystemic transectINDAAF DEBITS long term programmeN budget dry savanna-wet savanna-forestN budget in the sahelian ecosystem of Dahra in Senegal
Objective: To give an overview of the N activities in Africa in atmospheric chemistry
Presentation of the INDAAF programmeLong term deposition monitoring network since the 2000’s
A Global Assessment of Precipitation Chemistry and Deposition (2010-2014)A project of the WMO’s GAW SAG for TADFocus on important N-related results of the Global Assessment: Africa

Tropical atmospheric Chemistry includes:–
Why Study Atmospheric Chemistry in the tropics ?Why Study Atmospheric Chemistry in the tropics ?
N2ONONH3
Particles
Agriculture Pasture SoilsVegetation Biomass Burning
70% african savannas burned each yearNOx soils main contribution to O3 in West AfricaNOx from soils affect also O3 upper troposphere

In the future, South Asia, Africa and South America will be key regions to study.
Future challenges/ New approachesFuture challenges/ New approaches
2000 2030
Dentener et al. 2006

THE INDAAF PROGRAMMEInternational Network to study Deposition and Atmospheric chemistry in AFrica
Missions
The SNO National programme Label INSU/CNRS and label IRD (2016-2020)International programme WMO/GAW contributing network , IGAC-DEBITSWeb site and database http://idaf.sedoo.fr
Long term monitoring of thechemical composition of theatmosphere and of depositionfluxes.
Production of a unique dataset forthe african continent usinginternational standards of quality.

NOx, NH3Biomass burning(Liousse et al., 2010)
NOx, NH3 Domesticfires (Assamoi&Liousse, 2009)
NH3 Volatilization,(Schlecht et al., 1997,Mosier et al., 1998, FAO)
Biogenic NOemission from soils
(Delon et al., 2007)
Dry deposition NO2 - HNO3 - NH3(Adon et al. 2010)
Wet depositionNH4
+, NO3- (Laouali
et al., 2012)

Source: Vet et al. (2014). Atmospheric Environment, Volume 93, 1-116.http://www.sciencedirect.com/science/journal/13522310/93/supp/C
• World Meteorological Organization (WMO) GlobalAtmosphere Watch (GAW) Scientific AdvisoryGroup for Total Atmospheric Deposition (SAG-TAD)
• Data period: 2000 – 2007
• Measurement and modelling results
R. Vet, R. Artz, S. Carou, M. Shaw, C.-U. Ro, W. Aas, A. Baker,V. Bowersox, F. Dentener, C. Galy-Lacaux, A. Hou, J. Pienaar,R. Gillett, M. C. Forti, S. Gromov, H. Hara, T. Khodzher, N.Mahowald, S. Nickovic, P. Rao, N. Reid

Temporal Period2000 to 2007Two 3-year averaging periods:2000-2002 and 2005-2007
Spatial ScalesGlobalRegional: Africa, Asia, Oceania,Europe, North America,South America, Oceans
Method:Combination of measurementand modelling resultsCoordinated Model Studies Activities of theTask Force on Hemispheric TransportOf Air Pollution (TF HTAP):Ensemble mean 21 model results
Data:Regionally-representativenon-urban sites (470 sites)
• Africa and South America: Deposition of Biogeochemically Trace Species• Canada : Canadian Air and Precipitation Monitoring Network (CAPMoN)• East Asia : East Asia Network (EANET) Europe : European Monitoring and Evaluation Program (EMEP) Global : World Meteorological Organization’s Global Atmosphere Watch
Programme (WMO/GAW) United States :National Atmospheric Deposition Program (NADP) Other national networks : India, Russia
Integration of Data from the Major Wet Deposition Monitoring Networks

• N wet deposition 1.0 to 5.3 kg N/ha/a. Dry sav 1.7 to 3.4, wet savannas and forests: 3.6 to 5.3- N wet deposition in West Central Africa dominated by N in the form of NH4
+:: 63 to 70%• N Dry deposition dominates N wet deposition for all african ecosystems (2-8 kgN/ha/a)• Total N deposition is ranged from 7-8 dry savanna-8-9 wet savanna- 11kgN/ha/a forest
Wet + DryWet Dry

Comparison of deposition studies and modellingComparison of deposition studies and modelling
HTAP simulation Hemispheric Transport Air Pollution
15 - 45
15 - 355 - 15
5 - 15
10 - 2015 - 25
Wet+Dry Deposition of Noxidized+Nreduced (kg N/ha/yr)

Wet: wet depositionDry: dry depositionbio: biogenic emissionsBB: biomass burning emissionsBF: biofuel emissions,vol: volatilization.
N emission and deposition budget for the major ecosystems in West and Central Africa.The approach combines both unique experimental data based on the program (associated projects) and modeling studies,especially developed for SSA to estimate nitrogen atmospheric exchanges.
N Deposition – Emission budgetN Deposition – Emission budget
• Dry savannas ecosystems dominated by natural emissions of NOxfrom soils and NH3 volatilization from animal excreta.
• In wet savannas, contributions of natural and biomass burningnitrogen compounds sources are equivalent.
• In forested ecosystems, biomass burning sources becomedominant (72% of the total) and NH3 from volatilization remainslow. Galy and Delon, ERL, 2014
Biomass burning emissions of NH3 and NOx increase along the transect dry savanna/wet savanna/forest.
LEFE EC2CON cycle in the sahel

Dry savanna budget (in kgN.ha-1.yr-1)
9.01 (+/- 3.44);55%
7.40 (+/- 1,9);45%
Emission
Deposition
Wet savanna budget (in kgN.ha-1.yr-1)
8.38 (+/- 2.04);46%
9.60 (+/- 0.69);54% Emission
Deposition
Forest budget (in kgN.ha-1.yr-1)
8.54 (+/- 0.50);37%14.75 (+/- 2.36);
63%Emission
Deposition
Dry savanna budget (in kgN.ha-1.yr-1)
9.01 (+/- 3.44);55%
7.40 (+/- 1,9);45%
Emission
Deposition
Wet savanna budget (in kgN.ha-1.yr-1)
8.38 (+/- 2.04);46%
9.60 (+/- 0.69);54% Emission
Deposition
Forest budget (in kgN.ha-1.yr-1)
8.54 (+/- 0.50);37%14.75 (+/- 2.36);
63%Emission
Deposition
N Deposition – Emission budgetN Deposition – Emission budget• Emission sources of nitrogen compounds in
equilibrium with deposition fluxes in dry andwet savannas
• In forested ecosystems, the nitrogen budget isdominated by wet + dry deposition processes,influenced by biomass burning emissionscoming from the two hemispheres andtransported over the Central African forest.
• This work brings a new insight in depositionand emission regional budgets in remoteareas in Africa.
• Atmospheric N deposition fluxes represent asignificant nutrients input (from 8 to 14 kg.ha-
1.yr-1).• Uncertainties: importance of organic
compounds in wet deposition
13
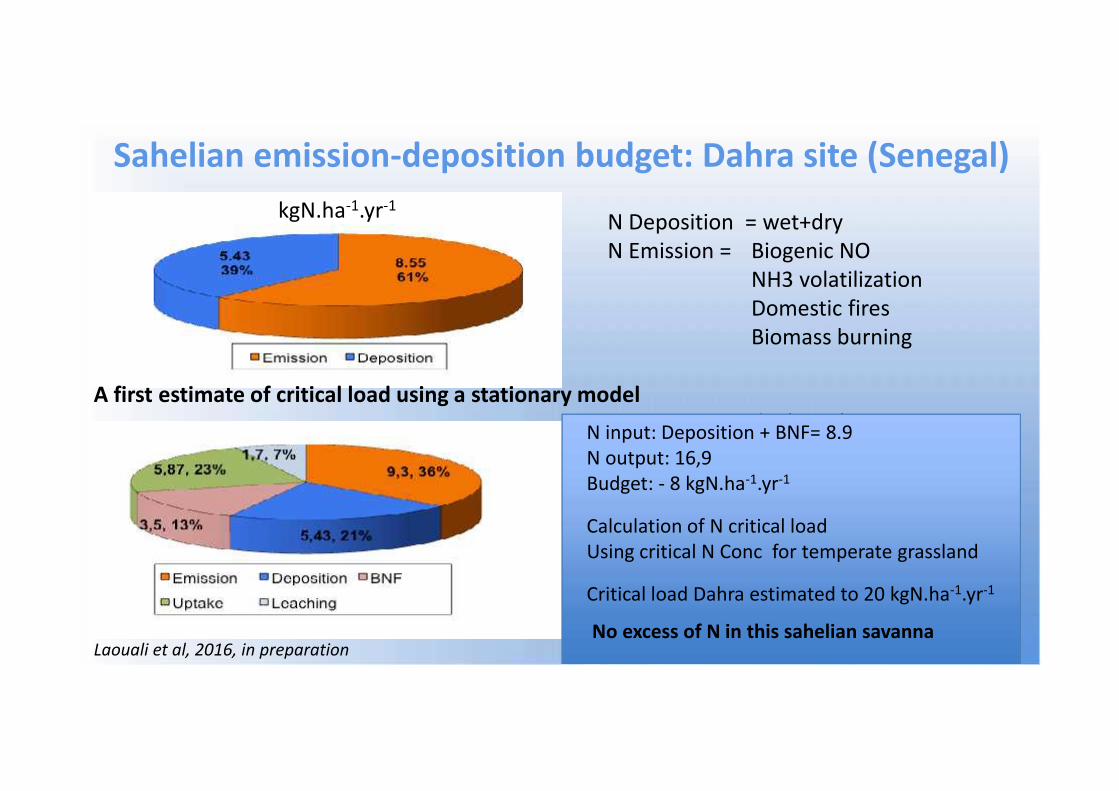
Sahelian emission-deposition budget: Dahra site (Senegal)N Deposition = wet+dryN Emission = Biogenic NO
NH3 volatilizationDomestic firesBiomass burning
N Deposition = wet+dry (3+2,4)N Emission = Biogenic NO (1.2)
NH3 volatilization (5,5)Domestic fires (0,4)Biomass burning (1,5)N2O from denitrification (0,5-1)
BNF : Biological Nitrogen Fixation (2-5)Uptake : animals + trees for growing (5-6,7)Leaching : N concentration in soil solutions* Water flux (1,7)
kgN.ha-1.yr-1
A first estimate of critical load using a stationary modelN input: Deposition + BNF= 8.9N output: 16,9Budget: - 8 kgN.ha-1.yr-1
Calculation of N critical loadUsing critical N Conc for temperate grassland
Critical load Dahra estimated to 20 kgN.ha-1.yr-1
No excess of N in this sahelian savannaLaouali et al, 2016, in preparation

INDAAF International Network to study Deposition and Atmospheric chemistry in AFricaWeb site and database http://idaf.sedoo.fr15 years of data
EADN : a GEF UNEP project «Equatorial Africa Deposition Network »12 sites around lake victoria
MMF TAD concept: an upcoming workshop (February 2017, Geneva)fusion data – models outputs for deposition maps products
WMO GAWA global Assessement of precipitation and deposition Vet et al, 2014. Overview paper 100pages,vol 93, Atmospheric Environment Data: http://ebas.nilu.no , http://wdcpc.org/
INMS Global Project for improving understanding of the global nitrogen towards theestablishment of an international managment system.Five demonstrations areas in the project Towards INMS: East Africa: lake victoria

THANKS FOR YOUR ATTENTION