Embed Size (px)
Citation preview

Nikola
Tesla
Journal
2016-
2017
2
We are proud to present this third edition of our annual student research journal. The Nikola Tesla STEM Journal enables Tesla STEM High School students to share their work with academic and business communities. The research projects in-cluded in this edition demonstrate both the depth and diversity of our studies.
Many thanks to the dedicated journal staff, talented student researchers, and outstanding Tesla STEM faculty. Your long hours and hard work make this
publication possible.
Journal Staff:
Chief Editors Karan Narula, Nichelle Kim
Assistant Editors Silvia Calinov, Audrey Tseng, Ben Zabback
Journal Promotion Akshita Khanna

3
A Novel Alternative for the Edwards SAPIEN Transcatheter Aortic
Heart Valve
Ashiana Dhanani, Anjali Sribalaskandarajah, Rahul Srivastava
5
Allowing the Rotational Ability of the Pivot Joint on the Distal End of
the Radius and Ulna Through Incorporating Technology to create...
Audrey C. Tseng, Salil Kanade
10
Comparative Analysis of Total Mercury Concentration in Salmon
Species Using Atomic Florescence
Yogitha Sunkara
15
Correlational Study between Asthma and Hodgkin’s Lymphoma
Erin Bethune, Maariyah Moinuddin, Midori Komi 23
Cost-Benefit Analysis of Biogas Generation
Stuart Brown, Eric Fan 29
Developing an Ankle-Joint Prosthesis for Total Ankle Arthroplasty Procedures and Replacement of the Synovial Hinge-Joint Nichelle Kim, Kanae Lancaster
34
Developing Solketal as an Additive for Jet Fuel: An Effective Approach to Reducing Glycerol Waste Andrea Dang, Sandra Militaru
39
Familiarity of Music and Its Effects on Stress Levels in Students Katherine Bo, Davina Lau, Michelle Yeh
43
Implementation of a Transcutaneous Electrical Nerve Stimulator Unit on a Mobilized System Katrine B. Bjorner, Emily R. Spencer
49
Performing Fluid Dynamic Analysis to Develop an Automated Valve to Halt Natural Gas Disasters Isaac M. Perrin, Anne L. Lee
57
TABLE OF CONTENTS

4
Plant Assisted Learning: The Effect of Epipremnum Aureum on
Student Cognition and Neural Oscillations
Christina L. Goto, Grace E. von Scheliha
67
Rear-End Collision Prevention System Shumaila Ahmad, Bryn J. Allesina-McGrory
78
The Development of a Wrist Prosthetic with an Application in Rowing Alissa Acheson, Megan Lawther
83
The Effect of Herd Behavior on Stock Market Prices – A Study of Investing Strategies Anna Gimera, Shreyas Kulkarni, Tyler Warden
86
Using Cutting Edge 3D Printer Technology to Create a Carpometacarpal Joint for an Arthritic Thumb Helen Maslen, Aimee Roseberry, Priyanka Taneja
90
Water Waves to Light Waves
Silvia I. Calinov 94
TESLA STEM HIGH SCHOOL 4301 228th Ave NE Redmond, WA 98053
425.936.2770
5
ABSTRACT Purpose: The purpose of the transcatheter heart valve technology is to provide an alter-nate, temporary solution for patients who are unable to tolerate an anticoagulation/antiplatelet processes or have active infec-tions, such as bacterial endocarditis. In many cases, patients are unable to go through open
heart surgery because of immunodeficient
disorders/conditions or their aortic wall is too fragile. To put in the valve, the patient will go through a minimally invasive procedure. Methods: The general structure of our tech-nology will include the synthetic tissue valve, a sheath, and a balloon to inflate a diseased valve. The function of the valve will be to pro-vide a feasible replacement to diseased aortic valves, after inflating the collapsed valve with a balloon “placeholder” until the valve is in-serted as a structural support. In doing so, normal blood flow will be restored, as a larger diameter artery will facilitate for such func-tions. Results: The main sense of originality and innovation that can be seen in our design is the fact that our valve is more cost-effective and ethical for those who are concerned with the use of xenogenic tissue. The bottom line of our redesigned aortic valve is that it brings a new level of patient autonomy and bioethics to the table; healthcare providers can now provide patients with a more ethically sound, ‘comfortable’, and affordable option for pa-tients who must undergo such procedures. Conclusion: With our synthetic tissue design,
we were able to subsidize the costs and facili-tate in making these valvular replacements more readily available and affordable, thus increasing the longevity of many lives. From a bioethics perspective, we have also utilized synthetic tissue, as opposed to other xeno-genic tissue due to the ethical concerns in-volving “the crossing of species boundaries”.
BACKGROUND
In the United States, one of the most common causes of death amongst the population is due to heart disease; specifically, sympto-matic aortic stenosis is a disease that many elderly individuals suffer from. If the cases are severe enough, they can be rendered life threatening, thus increasing the need for im-mediate treatment. Patients enduring severe cases of aortic stenosis have a survival rate of 20% at a span of five years without aortic valve replacement. This procedure is consid-ered to be the only effective treatment and has been evaluated as a Class One recommen-dation by the American College of Cardiology and the American Heart Association. Despite this, it has been found that up to 60% of pa-tients have not undergone the valve replace-ment procedure. The aortic valve replace-ment itself, uses open surgical techniques by using cardiopulmonary bypass and is consid-ered a method of standard care for sympto-matic patients with aortic stenosis. Transcath-eter aortic valve implantation has become a viable alternative for those who cannot
A NOVEL ALTERNATIVE FOR THE EDWARDS SAPIEN
TRANSCATHETER AORTIC HEART VALVE
Ashiana Dhanani, Anjali Sribalaskandarajah, Rahul Srivastava
6
withstand open surgical treatment due to contraindication or relatively high risk for perioperative morbidity or potential fatality. Both transfemoral and transapical transcathe-ter aortic valve implantation (TAVI) have been shown to be safe and effective.
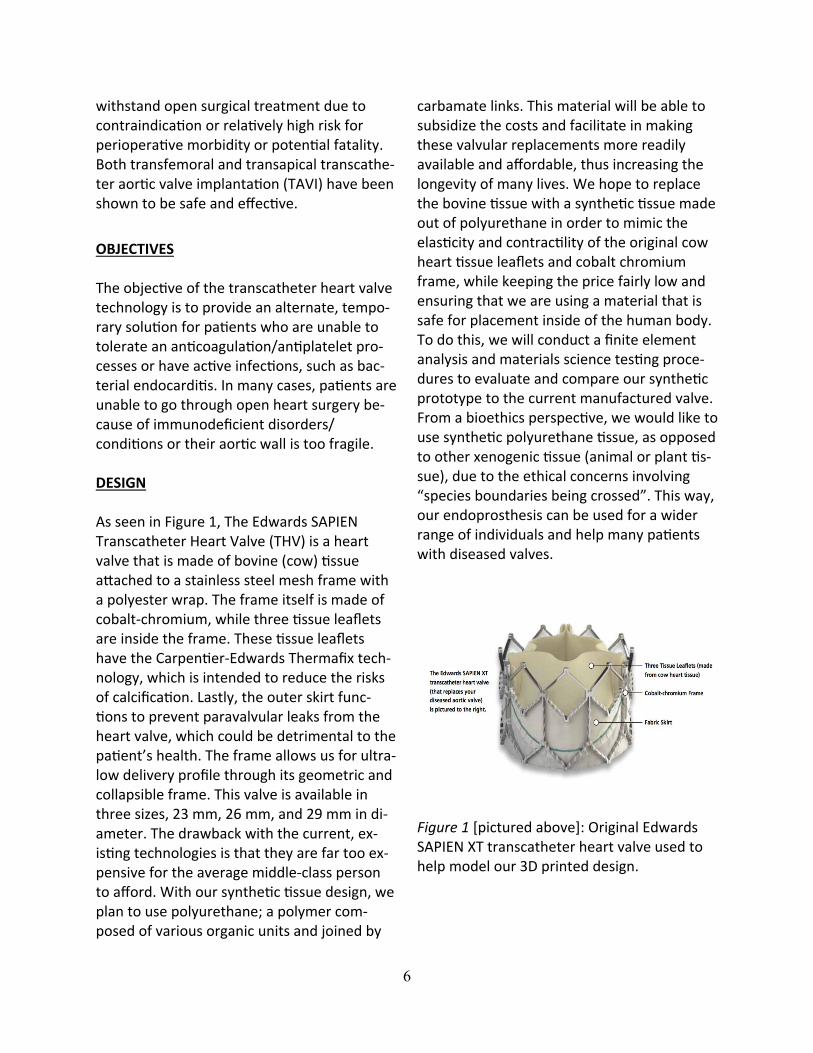
OBJECTIVES The objective of the transcatheter heart valve technology is to provide an alternate, tempo-rary solution for patients who are unable to tolerate an anticoagulation/antiplatelet pro-cesses or have active infections, such as bac-terial endocarditis. In many cases, patients are unable to go through open heart surgery be-cause of immunodeficient disorders/conditions or their aortic wall is too fragile. DESIGN As seen in Figure 1, The Edwards SAPIEN Transcatheter Heart Valve (THV) is a heart valve that is made of bovine (cow) tissue attached to a stainless steel mesh frame with a polyester wrap. The frame itself is made of cobalt-chromium, while three tissue leaflets are inside the frame. These tissue leaflets have the Carpentier-Edwards Thermafix tech-nology, which is intended to reduce the risks of calcification. Lastly, the outer skirt func-tions to prevent paravalvular leaks from the heart valve, which could be detrimental to the patient’s health. The frame allows us for ultra-low delivery profile through its geometric and collapsible frame. This valve is available in three sizes, 23 mm, 26 mm, and 29 mm in di-ameter. The drawback with the current, ex-isting technologies is that they are far too ex-pensive for the average middle-class person to afford. With our synthetic tissue design, we plan to use polyurethane; a polymer com-posed of various organic units and joined by
carbamate links. This material will be able to subsidize the costs and facilitate in making these valvular replacements more readily available and affordable, thus increasing the longevity of many lives. We hope to replace the bovine tissue with a synthetic tissue made out of polyurethane in order to mimic the elasticity and contractility of the original cow heart tissue leaflets and cobalt chromium frame, while keeping the price fairly low and ensuring that we are using a material that is safe for placement inside of the human body. To do this, we will conduct a finite element analysis and materials science testing proce-dures to evaluate and compare our synthetic prototype to the current manufactured valve. From a bioethics perspective, we would like to use synthetic polyurethane tissue, as opposed to other xenogenic tissue (animal or plant tis-sue), due to the ethical concerns involving “species boundaries being crossed”. This way, our endoprosthesis can be used for a wider range of individuals and help many patients with diseased valves.
Figure 1 [pictured above]: Original Edwards SAPIEN XT transcatheter heart valve used to help model our 3D printed design.
7
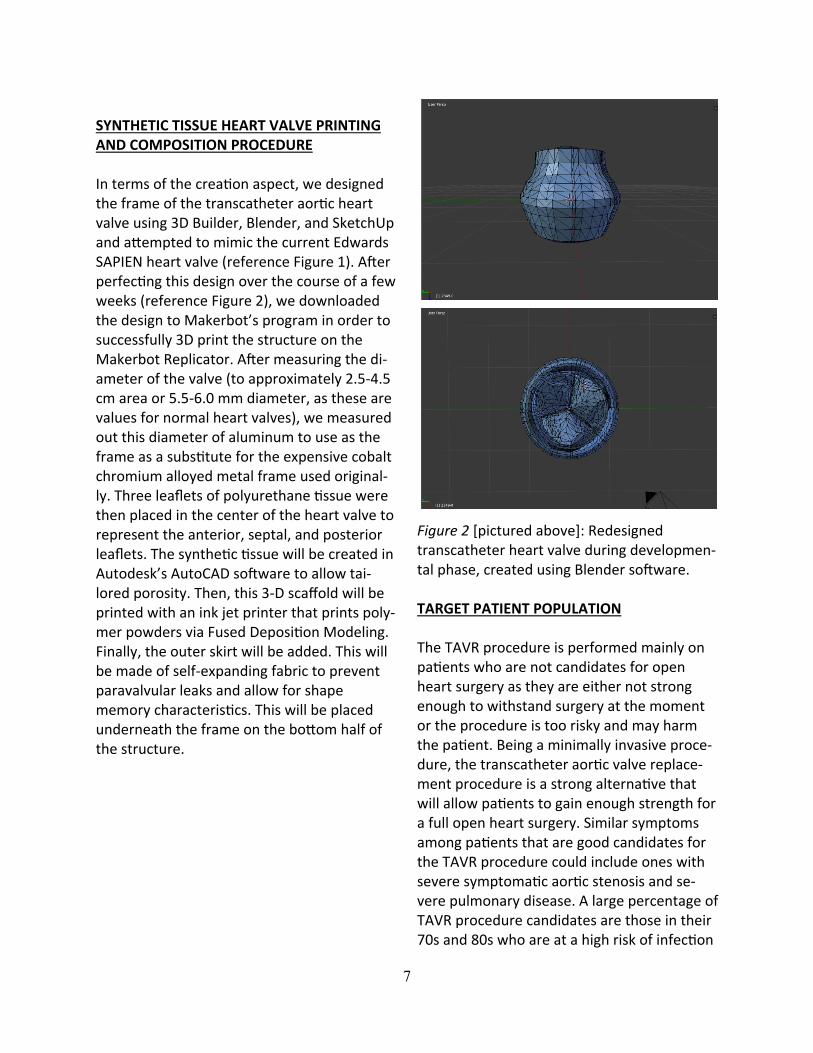
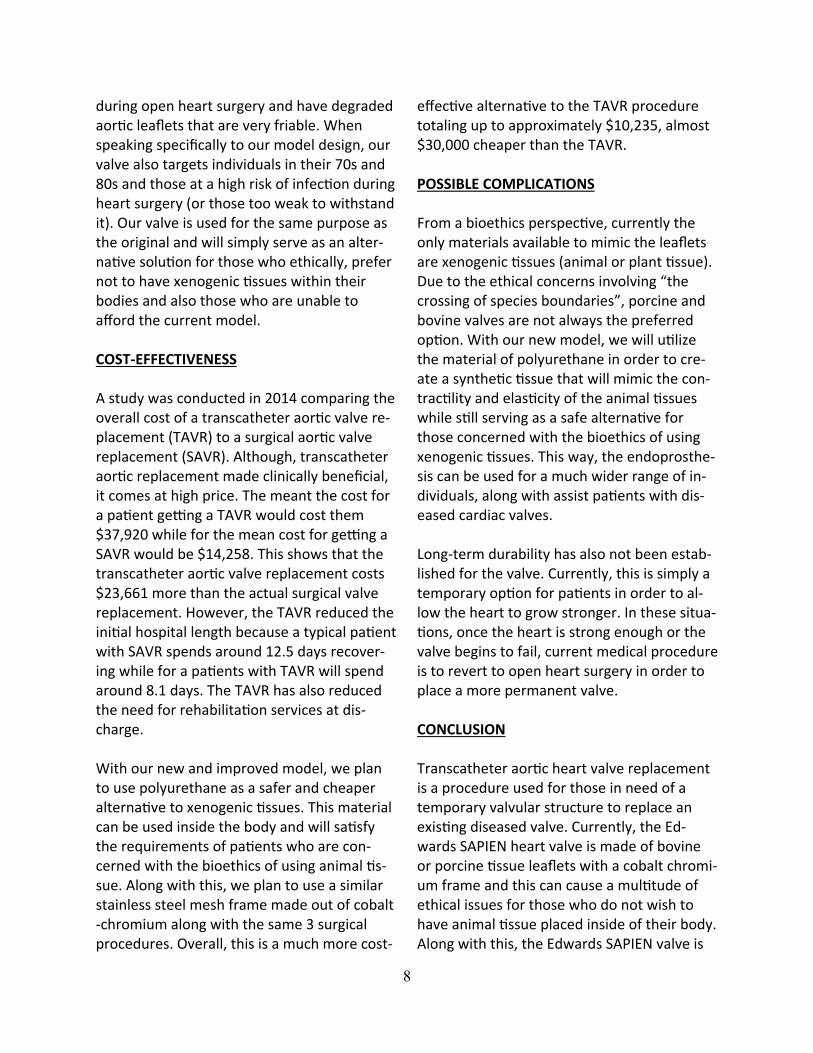
SYNTHETIC TISSUE HEART VALVE PRINTING AND COMPOSITION PROCEDURE In terms of the creation aspect, we designed the frame of the transcatheter aortic heart valve using 3D Builder, Blender, and SketchUp and attempted to mimic the current Edwards SAPIEN heart valve (reference Figure 1). After perfecting this design over the course of a few weeks (reference Figure 2), we downloaded the design to Makerbot’s program in order to successfully 3D print the structure on the Makerbot Replicator. After measuring the di-ameter of the valve (to approximately 2.5-4.5 cm area or 5.5-6.0 mm diameter, as these are values for normal heart valves), we measured out this diameter of aluminum to use as the frame as a substitute for the expensive cobalt chromium alloyed metal frame used original-ly. Three leaflets of polyurethane tissue were then placed in the center of the heart valve to represent the anterior, septal, and posterior leaflets. The synthetic tissue will be created in Autodesk’s AutoCAD software to allow tai-lored porosity. Then, this 3-D scaffold will be printed with an ink jet printer that prints poly-mer powders via Fused Deposition Modeling. Finally, the outer skirt will be added. This will be made of self-expanding fabric to prevent paravalvular leaks and allow for shape memory characteristics. This will be placed underneath the frame on the bottom half of the structure.
Figure 2 [pictured above]: Redesigned transcatheter heart valve during developmen-tal phase, created using Blender software.
TARGET PATIENT POPULATION The TAVR procedure is performed mainly on patients who are not candidates for open heart surgery as they are either not strong enough to withstand surgery at the moment or the procedure is too risky and may harm the patient. Being a minimally invasive proce-dure, the transcatheter aortic valve replace-ment procedure is a strong alternative that will allow patients to gain enough strength for a full open heart surgery. Similar symptoms among patients that are good candidates for the TAVR procedure could include ones with severe symptomatic aortic stenosis and se-vere pulmonary disease. A large percentage of TAVR procedure candidates are those in their 70s and 80s who are at a high risk of infection
8
during open heart surgery and have degraded aortic leaflets that are very friable. When speaking specifically to our model design, our valve also targets individuals in their 70s and 80s and those at a high risk of infection during heart surgery (or those too weak to withstand it). Our valve is used for the same purpose as the original and will simply serve as an alter-native solution for those who ethically, prefer not to have xenogenic tissues within their bodies and also those who are unable to afford the current model. COST-EFFECTIVENESS A study was conducted in 2014 comparing the overall cost of a transcatheter aortic valve re-placement (TAVR) to a surgical aortic valve replacement (SAVR). Although, transcatheter aortic replacement made clinically beneficial, it comes at high price. The meant the cost for a patient getting a TAVR would cost them $37,920 while for the mean cost for getting a SAVR would be $14,258. This shows that the transcatheter aortic valve replacement costs $23,661 more than the actual surgical valve replacement. However, the TAVR reduced the initial hospital length because a typical patient with SAVR spends around 12.5 days recover-ing while for a patients with TAVR will spend around 8.1 days. The TAVR has also reduced the need for rehabilitation services at dis-charge. With our new and improved model, we plan to use polyurethane as a safer and cheaper alternative to xenogenic tissues. This material can be used inside the body and will satisfy the requirements of patients who are con-cerned with the bioethics of using animal tis-sue. Along with this, we plan to use a similar stainless steel mesh frame made out of cobalt-chromium along with the same 3 surgical procedures. Overall, this is a much more cost-
effective alternative to the TAVR procedure totaling up to approximately $10,235, almost $30,000 cheaper than the TAVR. POSSIBLE COMPLICATIONS From a bioethics perspective, currently the only materials available to mimic the leaflets are xenogenic tissues (animal or plant tissue). Due to the ethical concerns involving “the crossing of species boundaries”, porcine and bovine valves are not always the preferred option. With our new model, we will utilize the material of polyurethane in order to cre-ate a synthetic tissue that will mimic the con-tractility and elasticity of the animal tissues while still serving as a safe alternative for those concerned with the bioethics of using xenogenic tissues. This way, the endoprosthe-sis can be used for a much wider range of in-dividuals, along with assist patients with dis-eased cardiac valves. Long-term durability has also not been estab-lished for the valve. Currently, this is simply a temporary option for patients in order to al-low the heart to grow stronger. In these situa-tions, once the heart is strong enough or the valve begins to fail, current medical procedure is to revert to open heart surgery in order to place a more permanent valve. CONCLUSION Transcatheter aortic heart valve replacement is a procedure used for those in need of a temporary valvular structure to replace an existing diseased valve. Currently, the Ed-wards SAPIEN heart valve is made of bovine or porcine tissue leaflets with a cobalt chromi-um frame and this can cause a multitude of ethical issues for those who do not wish to have animal tissue placed inside of their body. Along with this, the Edwards SAPIEN valve is

9
very costly and not affordable for the typical American household. The main sense of origi-nality and innovation that can be seen in our design is the fact that our valve will be much more cost-effective and ethical for those who are concerned with the use of xenogenic tis-sue due to the fact that we will be using syn-thetic polyurethane tissue, which is predicted to be much cheaper than the bovine or por-cine tissue alternative.

10
ABSTRACT Purpose: This engineering design focused on bringing back flexibility and mobility into the pivot joint attached on the distal end of the radius and ulna for patients that have experi-enced transradial (lower arm) amputation. Methods: To design a solution for transradial amputation for patients who were involved in movements that involved the rotation of the radius and ulna for non-contact sports such as tennis or instruments like the piano and vio-lin, brainstorming on paper began to formu-late the beginning of the pivot joint pros-thetic. Drafting took an estimated 2 weeks, and modelling began in Fusion 360. The first draft in Fusion 360 consisted of the pivot joint and the shell to encapsulate the stump of the remaining joint, and will later attach onto a brace to stabilize the prosthetic on the pa-tient’s arm. Future printing and retesting has moved from an external pivot joint with brace attachment to the implementation of a surgi-cally implanted artificial ulna and radius that incorporates the pivot joint and allows for maximum mobility. The prosthetic is expected to be completed by the beginning of April, aiming to provide the future of transradial prosthetics with increased mobility and low-ered cost for prosthetics. Conclusion: Our fi-nal product includes a synthetic radius and ulna that will be able to be surgically implant-ed into the patient’s existing humerus. The prosthetic is customizable by length and in the future, will contain revisions such as a
more accurate shaping of the radius and ulna and the creation of synthetic ligaments to hold the distal end of the radius in the ulna. BACKGROUND Currently in the US, it is cited by the CDC that 500 people a day lose a limb. There is an esti-mated 1.9 million people in the US that are living with a limb loss. Because hand and transradial (lower arm amputations) are so common, the activities that people can do after the loss of a hand, wrist, and lower arm are severely limited. We focused our efforts on changing a prosthetic that will enable the functionality of the pivot joint in the lower arm. Past models of prostheses include one for to-tal replacement arthroplasty of the elbow joint, consisting of a hinge joint with two in-tramedullary stems for insertion into the me-dullary canals of the humerus and the ulna. The free end of one of the stems has a se-cured partial cylinder inside, and the other stem has a cylindrical bearing member with an axial bore a pivot pin on the free end of the first stem to go through. A radial slot in the bearing member, slightly narrower than the pivot pin, allows the pin to be snapped into form the hinge joint. Another model has a bolt with an outer sliding surface on one part of the joint and a socket on the other part. The bolt is mounted such that it can pivot, and lubricated depressions are used in one of
ALLOWING THE ROTATIONAL ABILITY OF THE PIVOT JOINT ON THE DISTAL END OF THE RADIUS AND ULNA THROUGH INCORPORATING TECHNOLOGY
TO CREATE AN UNSUPPORTED ARTIFICIAL RADIUS AND ULNA
Audrey C. Tseng, Salil Kanade
11
the sliding surfaces where both ends of the socket are sealed . Other existing models of prosthetic elbow joints function in a similar way, with the pivot pin rotating to allow flex-ion of the prosthetic elbow replacement and axial rotation of the ulna part in the humeral part. To solve the current problem of the arm being able to move only in one way, our current prosthetic model would emulate a real fore-arm with two rod “bones” (the radius and ul-na). The inclusion of two rod bones would al-low for the rotational movement of the fore-arm and restore the full functionality of a reg-ular arm. Instead of having the forearm act as an extension to the preexisting arm like it does currently, we want to emphasize the pri-mary movement of the forearm. DESIGN Our design focuses on improving rotational ability of a prosthetic arm by using the knowledge of a pivot joint, the joint that con-nects the elbow to the forearm and allows a user to go into pronation and supination movements of everyday life at a lowered cost. Although there are motorized arms with myo-electronic features that allow for the rotation of the arm around a fixed location, the cost of these currently existing arms is significantly higher than a 3D-printed model. Our model increases the practicality of the technology we have today, and allows a greater popula-tion to access this type of prosthetic. Our first design started off with a drafted piv-ot joint that the user can insert the stump of their amputation into and that would be fur-ther secured with a brace. This would allow the attachment to the elbow and low upper arm stump and a prosthetic that will involve the pivot joint of the radius and ulna. The
brace, in our first design was drafted to in-clude felt bands with Velcro, pliable metal for movement, and a circular plastic piece which will act as a stabilizing rotating wheel for the elbow joint. A plate for the radius and ulna bone to be inserted into, screws for the nails to be attached, a rod that attaches the upper place to the lower control plate, and a loose attachment of rod on the bottom were includ-ed in this first SketchUp of our prosthetic so that when we moved to our program, Fusion 360, we would be able to quickly create what we had designed. When the modelling process began, it was difficult to create an extension for the stump to sit in and for the two bones of the radius and ulna to fit onto with a plate. We were able to draft the rotational part of the exten-sion that would hold the stump, and a secur-ing extra conic shape to fit against the per-son’s stump for comfort. The connection to the radius and ulna, however, had to be draft-ed on paper even further and electronically in sketchpads to determine if the design would be possible. The design we had created for our pivot joint was unable, after a trial and error run and the help of peers within weeks, to achieve the goal we wanted without having to be implant-ed surgically. After determining that our initial sketchup would be too challenging to create in the span of time we were given, we shifted the focus of our project towards creating a surgically implanted artificial ulna and radius to be included in the prosthesis. Our current design is simple, and includes a stationary ulna “bone” with a hollowed out posterior end so that the head of the radius can fit in and create the rotation along the y-axis. The ulna also includes two knobs of attachment, in which if surgically connected

12
to the humerus, would be able to hold a re-placement ligament that would go around both the radius and ulna to keep movement restricted to the y-axis. The ulna bone’s diam-eter is larger than the radius for the secure-ment of the movement of the radius, and also is able to attach to a hand prosthetic that can be compatible with our design. The radius of our design features a sphere that fits into the hollowed out cavity of the ulna, and this in turn allows the rotation of the rest of the bone around the ulna for pro-nation and supination. The radius is thinner in diameter, but at the ulnar notch of the radius, it flares out to fit closer with the ulna that is stationary. This allows for the attachment of ligament once the prosthetic attached surgi-cally, and will allow the user to use the move-ment of the existing attachment of the hu-merus to the rest of the radius and ulna. With the surgical implantation of our simpli-fied version of the radius and ulna, the user will have more control over the rotational ability of the prosthetic. The simplified version of the radius and ulna allows for the easy transition from bone to artificial bone, and rehabilitation would be significantly easier because of the extension of the radius and ulna our prosthetic provides to the hinge joint of the elbow and any remaining bone of the forearm.
13
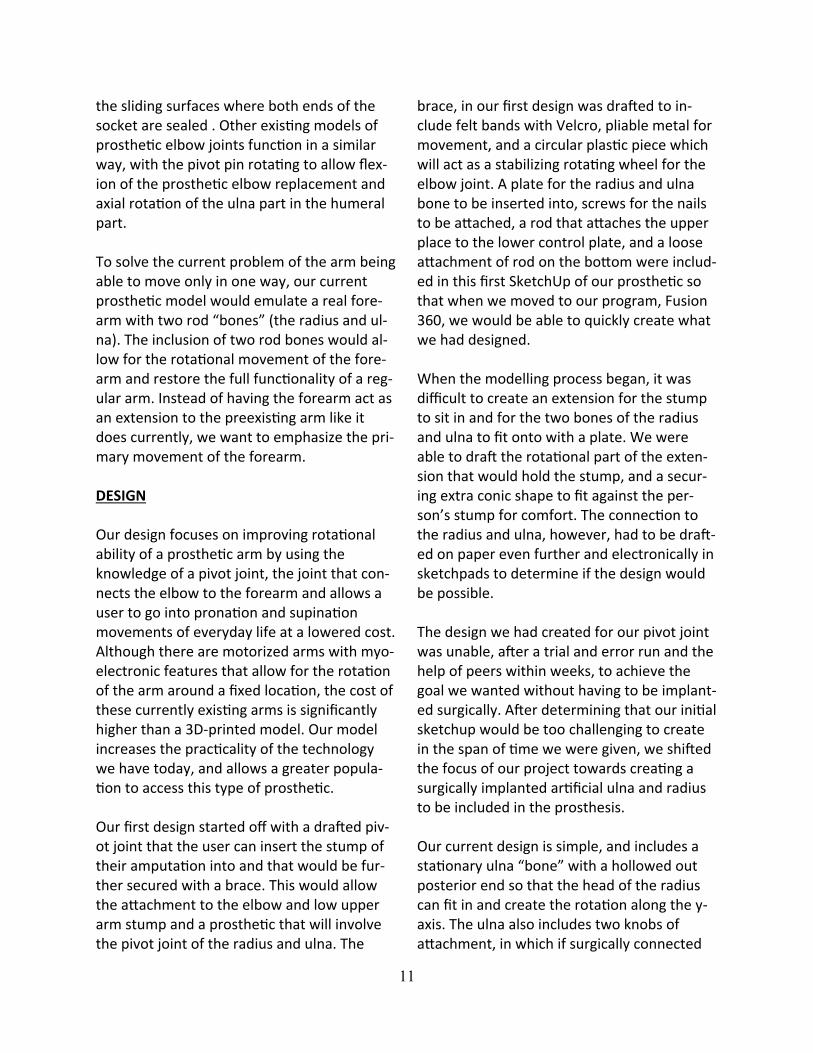
Figure 1: The original design of our prosthetic drafted on electronic sketchpad. Highlights of our first sketchup include the brace of support and allowing the stump of the amputated limb to control the rotational sliding movement of the radius and ulna.
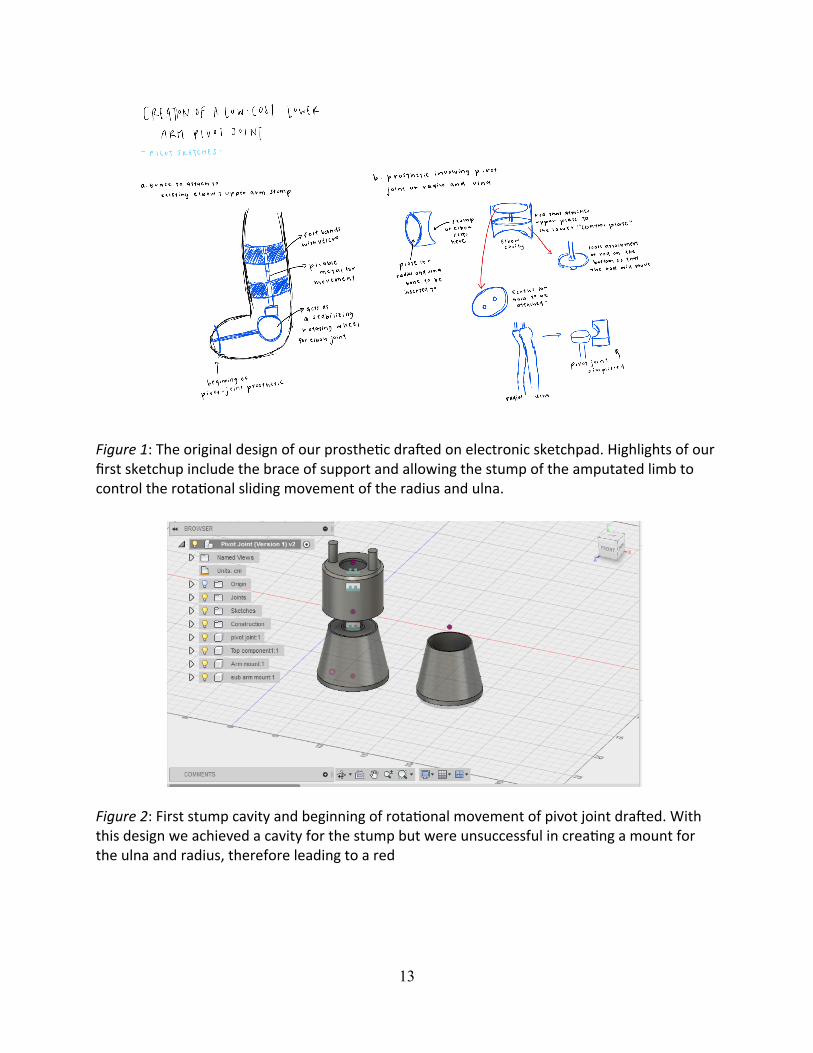
Figure 2: First stump cavity and beginning of rotational movement of pivot joint drafted. With this design we achieved a cavity for the stump but were unsuccessful in creating a mount for the ulna and radius, therefore leading to a red
14
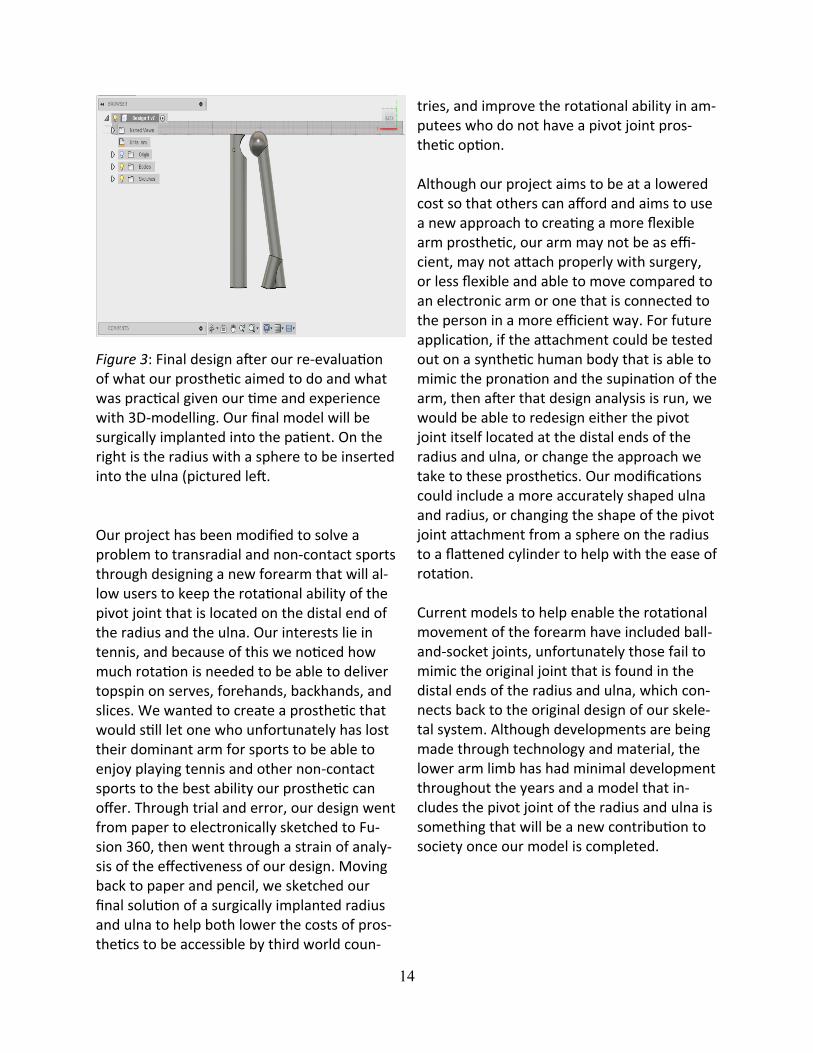
Figure 3: Final design after our re-evaluation of what our prosthetic aimed to do and what was practical given our time and experience with 3D-modelling. Our final model will be surgically implanted into the patient. On the right is the radius with a sphere to be inserted into the ulna (pictured left.
Our project has been modified to solve a problem to transradial and non-contact sports through designing a new forearm that will al-low users to keep the rotational ability of the pivot joint that is located on the distal end of the radius and the ulna. Our interests lie in tennis, and because of this we noticed how much rotation is needed to be able to deliver topspin on serves, forehands, backhands, and slices. We wanted to create a prosthetic that would still let one who unfortunately has lost their dominant arm for sports to be able to enjoy playing tennis and other non-contact sports to the best ability our prosthetic can offer. Through trial and error, our design went from paper to electronically sketched to Fu-sion 360, then went through a strain of analy-sis of the effectiveness of our design. Moving back to paper and pencil, we sketched our final solution of a surgically implanted radius and ulna to help both lower the costs of pros-thetics to be accessible by third world coun-
tries, and improve the rotational ability in am-putees who do not have a pivot joint pros-thetic option. Although our project aims to be at a lowered cost so that others can afford and aims to use a new approach to creating a more flexible arm prosthetic, our arm may not be as effi-cient, may not attach properly with surgery, or less flexible and able to move compared to an electronic arm or one that is connected to the person in a more efficient way. For future application, if the attachment could be tested out on a synthetic human body that is able to mimic the pronation and the supination of the arm, then after that design analysis is run, we would be able to redesign either the pivot joint itself located at the distal ends of the radius and ulna, or change the approach we take to these prosthetics. Our modifications could include a more accurately shaped ulna and radius, or changing the shape of the pivot joint attachment from a sphere on the radius to a flattened cylinder to help with the ease of rotation. Current models to help enable the rotational movement of the forearm have included ball-and-socket joints, unfortunately those fail to mimic the original joint that is found in the distal ends of the radius and ulna, which con-nects back to the original design of our skele-tal system. Although developments are being made through technology and material, the lower arm limb has had minimal development throughout the years and a model that in-cludes the pivot joint of the radius and ulna is something that will be a new contribution to society once our model is completed.
15
ABSTRACT Salmon are an essential part of diets despite their high affinity for mercury, a neurotoxin. This project compares the mercury levels of 3 separate species of salmon to see if their lev-els are toxic to humans. The separate species of fish were Atlantic, Chinook and Sockeye salmon (independent variable) and the de-pendent variable was the level of mercury contamination. 3 samples from each sample of fish were analyzed for mercury concentra-tion using a MERX-T machine. I hypothesized that Atlantic Salmon would have the highest levels. This experiment showed that Chinook Salmon has the highest levels of mercury with an average mercury concentration of 78.966667ng/g in comparison to the toxic lev-els of 1000ng/g. This study shows that salmon are indeed safe for human consumption. Keywords: atomic florescence, total mercury content, salmon, methylmercury, COMPARATIVE ANALYSIS OF TOTAL MERCURY CONCENTRATION IN SALMON SPECIES USING ATOMIC FLORESCENCE In the Puget Sound, Salmon are a keystone species to ecosystems, culture and he econo-my. Salmon’s presence in rivers serves as a general indicator of the health of the river. Since they are a migratory species, they pump vast amounts of marine nutrients from the ocean to the river. The Sockeye salmon, for example, contributes up to 170 pounds of
phosphorus, an essential nutrient, to Lake Illiamna. (Rahr, 2017). Salmon have been shown to bring around 25% of the nitrogen in trees which stimulates growth 3 times faster than areas without salmon. This is flow of nu-trients is critical because salmon are the only way that lakes such as the Illiamna get nutri-ents. This cycle of nutrients is critical since these nutrients help the natural vegetation grow. This vegetation helps sequester carbon as well provide other invaluable ecosystem services.
Salmon are also a keystone species in the di-verse Washington ecosystem. They are a cen-tral part of many organism’s diet, ranging from grizzly bears to orca whales. Without these, many of the food chains would not ex-ist.
Salmon are also an integral part of the indige-nous tribes’ culture. Due to abundant salmon runs, the native people once had one of the highest human populations. They have always held a sacred status in the tribes’ legends. Songs, festivals, customs have revolved around this fish. Entire tribes have based their way of life around the migratory fish. Now, even the locals see the salmon as a symbol of the pristine natural landscapes.
The State of Washington currently generates around 4.5 billion dollars in revenue solely from the salmon industry. (Rahr, 2017). Unfortunately, salmon levels are now only 3% of their historical abundance. (Rahr, 2017)
COMPARATIVE ANALYSIS OF TOTAL MERCURY CONCENTRATION
IN SALMON SPECIES USING ATOMIC FLORESCENCE
Yogitha Sunkara

16
This is due to a variety of reasons including habitat loss, loss of the gene pool and pollu-tants like mercury. These decrease holds grave consequences from the many people who depend on them. Every year, due to natural cycles and anthro-pogenic activity, mercury compounds find their way into commercial fish such as tuna ad mackerel. The primary species of mercury in fish is an organic compound known as methyl-mercury(CH3Hg). According to Su (2009) the compound is fat soluble and it binds to the cytosine in proteins in fish tissues forming a covalent bond. When fish are caught and sold commercially, the methylmercury is still pre-sent in their fat cells. Methylmercury has a greater ability to bio-accumulate and biomag-nified throughout each level of the food chain than other mercury species. According to Fol-ke (1995) Methylmercury is a known neuro-toxin and in the case of pregnant women with high levels, it has been known to lead to ab-normalities, various cancers and mental retar-dation in the fetus. Methylmercury in fish commonly accounts for over 90% of the total mercury present (Yung, Driscoll, & Ganglioin, 2011), total mercury concentration is commonly used as a “worst case scenario” concentration for fish. Current-ly, one of the most precise ways of detecting total mercury is through atomic florescence following EPA Method 1631 Appendix. This method involves beaming a ray of light that excites molecules and causes them to emit light which is then quantified to determine the concentration of mercury. The hypothesis of the experiment was that Atlantic salmon would have the highest mer-cury concentration of the three species since Atlantic salmon have a migration pattern through areas that are heavily polluted with
mercury. Atlantic salmon pass through the Atlantic Ocean which has high levels mercury contamination. Much of the salmon consumed by locals is indigenous to the area such as Sockeye, Chi-nook, Steelhead, Coho and Atlantic. Unfortu-nately, due to a history of industries with heavy metals many of the waters are full of contaminants such as PCBs and mercury. While mercury has gone from levels of 6.2 ppm to 2.7ppm in 2000, that is still over the toxic limit. Carp near Vancouver, Washington had mercury levels 3.5 times the EPA limit. In 2014, a study showed that mercury levels in the waters were nearly 300% over the EPA safe levels. Many of these chemicals are pre-sent in the Columbia River which is a major salmon spawning site. This showed an urgen-cy to see if wild salmon consumed by people was indeed safe to consume. LITERATURE REVIEWS As explained in “Environmental Chemistry and Toxicology of Mercury” by Yung, Driscoll, & Ganglioin (2011), Mercury, a toxic compound can get into waters and poison fish. It primari-ly is a byproduct of factories and coal based power pants. The mercury is a released as va-por and condenses over the ocean where smaller fish inject it. There are 2 forms of mer-cury, inorganic methyl mercury(CH3HG). This compound is fat and water soluble and don’t react with many acids. As the smaller fish pass through the food chain, the amount of mercu-ry accumulates and its concentration be-comes more toxic. By the time, it reaches the dinner table, it is often extremely toxic. Health effects of mercury are that it affects the nervous and the endocrine system and often by fatal. When the methylmercury is present in the water, there are a variety of key factors that

17
contribute how it’s ingested by the fish. Some key factors are water chemistry, nutrients, dissolved organic matter. The factor at which concentration of mercury is rising is known as the BCF (bioaccumulation factor). It is calcu-lated by taking the ratio of the total Hg(mercury) level in the organism as opposed to the water surrounded it. Hg presence in water and fish blood is affect-ed by the presence of dissolved organic matter. The matter has a capacity to bind to the cation methylmercury and sequester it from the water and blood. This is beneficial to the fish since it biodegrades the compound as well as reduces the net amount in the fish. This explanation breaks down how methyl-mercury finds its way into fish and long it stays there which was beneficial to the experi-ment since it provided a clear understanding of how mercury entered fish and how it re-mains there. Herger’s (2016) discusses a study to deter-mine the amount of mercury in fish in the 15 pacific northwest lakes. The study said that there were 3 primary ways for fish to intake mercury, from the water or from their diet. They typically don’t intake as much from the water since trace amounts of mercury was found in their gills. The study was analyzed using the EPA’s chemical analysis technique. The EPA initially freezes the fish to ensure that the mercury content doesn’t change since amount of mercury in the blood de-creases by half every day. They take a 1g sam-ple of partially thawed fish tissue and then analyzed using instrumental analysis such as thermal decomposition, AA spectroscopy and amalgamation. These liberate the mercury from the sample so it can be further investi-gated.
The results of the study were that the adult consumes around 17.g of fish a day and a healthy amount is 59.7g a week (around 2 fish meals).They also found that there is positive correlation between the fish size and the amount of mercury present in fish. There are also many negative and harmful side effects of eating toxic fish to humans such as irrepa-rable damage to the brain, heart, kidneys, lungs and immune system. These can often be fatal as mercury is a neurotoxin. This passage was useful in evaluating the ex-tent of average human consumption of fish as well as understanding the procedures in which the EPA analyzes fish for mercury con-tamination. Deng, Xiao, Liau, & Yang, (2015) discussed the variety of instrumental analysis techniques to calculate the concentration of methyl mercu-ry. A few being atomic absorption spectrosco-py, atomic emission spectroscopy, plasma mass spectroscopy. These systems have to extremely sensitive since the quantities of mercury present in the soil is very minute(0.07pg). For all of these techniques, they are able to accurately determine the concentra-tion but they can’t differentiate between inor-ganic and organic mercury compounds. They also require a precise sample from a partially thawed out fish tissue. The samples must be fresh and also blended together to be homog-enized. For accurate tests, they need highly pure water. The advantages of using these machines is that they are highly sensitive and pick up even trace quantities of mercury. They are also very cost effective and cheap. The devices use sil-ver to combine the compounds to make it easy for the devices to detect and pick up traces of mercury in the sample.
18
The significance of this was the exploration of various analyzation techniques as well as un-derstanding how each machine worked which is beneficial since these machines are used in all analysis labs. To collect data, the most precise way was to select 3 native fish species: King(Chinook), At-lantic and Sockeye. These fish were bought from a commercial store to accurately repre-sent the fish people eat. These fish were also all wild fish since farmed fish demonstrate different genetic and physical makeup. Of those three species, there were 3 different fish samples per fish, resulting in nine samples total. The 3 trials were to ensure accuracy and avoid any discrepancies in the data. The sam-ples were individually wrapped in plastics bags and frozen to ensure no contamination. The samples were prepped using the EPA Method 1631 Appendix. At the lab, one gram of each sample was taken and placed in a test tube. Each species had three blanks to ensure quality control in the machine, duplicates and an SRM. An SRM is a substance of known mer-cury concentration to cross check for any con-taminants in the machine. In this case, the known concentration was dried dogfish tissue. The blanks were also to ensure quality control in the experiment. The test tubes were then filled with nitric and sulfuric acid. These tubes were heated in a fume hood to avoid any nox-ious vapors. The digested test tubes were then filled with a mixture of Hydroxylamine hydrochloride and Stannous chloride. These samples were analyzed in a Merx-T machine. The machine reported the data in the forms of peaks. The peaks represented the raw data. The spike or the peak was an increase in mer-cury against the calibration. To calculate the content, the area under the curve was meas-ured. Each formula to calculate the area
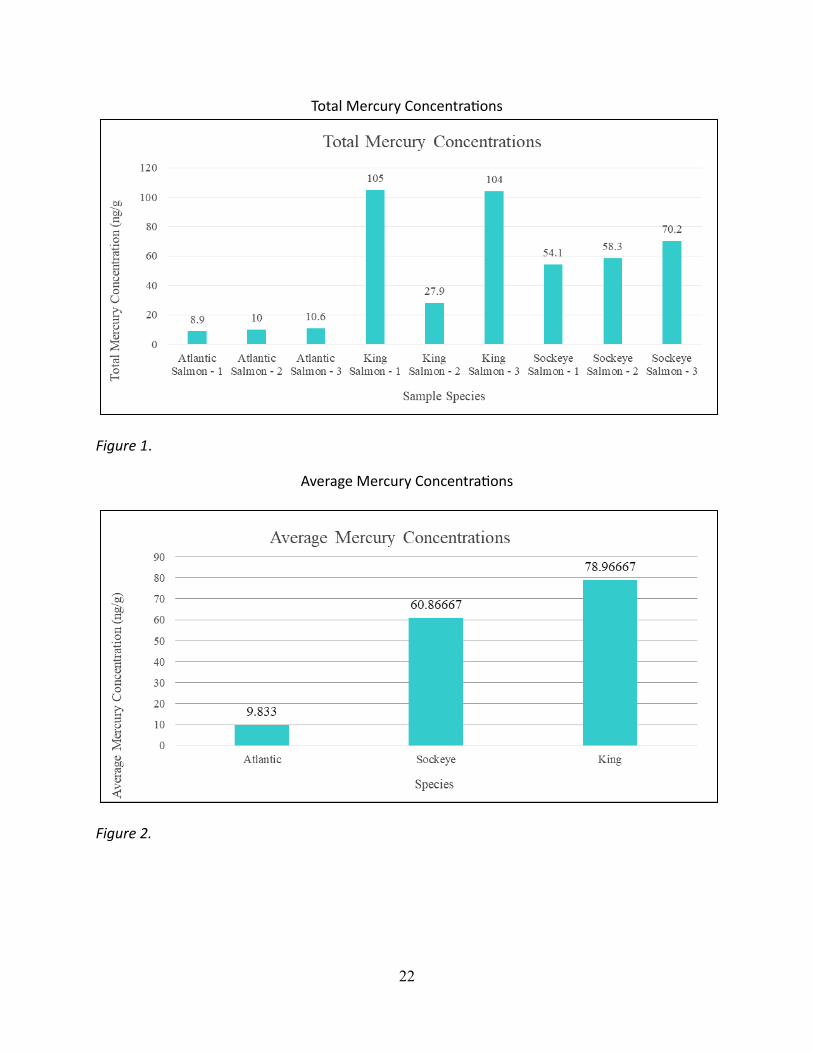
varies due to the size of the samples, the ali-quot of the samples and curve. Since the procedure had many duplicates, these were used to show the accuracy and precision of the data. The duplicates were compared using a relative percent difference. It’s similar to a margin of error. To be accu-rate, the relative percent difference had to be within 100% to 110%. All of the duplicates came back with a percent difference well within the range. The experiment showed that King(Chinook) salmon displayed the highest average mercu-ry concentration with 78.966667ng/g. Atlantic Salmon had the least average mercury con-centration with 9.8333333ng/g. For the Atlan-tic salmon, the data was very consistent. However, with Sockeye and King, there were 2 extraneous data points. In the Sockeye, most of mercury concentration was around 55ng/g except for one data point, 70.2ng/g. For the King salmon, the data was around 104ng/g except for one point that was 27.9. These data points heavily impacted the mean of the data. The standard deviation and the confidence interval for the data is shown in the table below. When the average fish size for each of the fish size was compared with the average mercury concentration, the data showed a positive trend. The same compari-son with weightinstead of fish size results in not as strong of a trendline. The King salmon had the highest average total mercury con-centration and was also the biggest fish in terms of size. POTENTIAL ERROR Despite the research proving to be statistically significant and showing a strong evidence that all three fish are well within the safe consumption range, there are some
19
confounding variable that may have affected the outcome of the research. CONFOUNDING VARIABLES The discrepancies in the research may arise from several confounding and uncontrolled variables in the research such as sample size tested. Sample Size. A widely accepted principle is that the larger the sample size, the more gen-eralizable the research. Having a large ample size also decreases the chance of having dis-crepancies in the data and reduces the margin of error. This experiment only had 3 trials per individual fish species which is an adequate number of trials but it does allow for anoma-lies. For example, of the 3 Chinook sample samples, 2 had reported levels of 104 and 105 nanograms per gram while the third sample had levels of around 28 nanograms. The out-side threw off the mean for fish and heavily affected the mean of the data as well as the standard deviation. A more representative data set would have more sample sizes. A rec-ommended number of trials per fish would be around 10.
Mercury is one of the most toxic chemicals for humans. It has been linked to fetus abnormal-ities and cancers. Seafood, is one of the most prevalent ways to get mercury poisoning. Salmon, a prevalent food source in Washing-ton is also exposed to mercury. I hypothesized that Atlantic salmon would have the highest total mercury content because it’s migratory pattern was in waters known to have high mercury concentration. However, the data shows that King salmon had the highest aver-age total mercury concentration with 78.966667ng/g. Atlantic salmon had the low-est mercury concentration with 9.833333ng/g. When comparing these mercury levels to
those that are dangerous to humans, salmon is very safe to eat. The toxic level of mercury is 1ppm or 1000ng/g. The FDA says that levels of mercury at 100ng/g to 500ng/g are the safe levels of mercury concentration thus proving that salmon are very safe to eat since they are well within the safe range. However, the lev-els of mercury contamination in King salmon are much higher than the average salmon concentration of 20ng/g. Despite this, all the tested species are very safe for human con-sumption.

20
Tables Table 1 Mercury Concentration Results
Note: The table above shows the various mercury concentration results for each of the sample species as well as their results, ID number, the analyte and the units of measurement.
Table 2
Species ID Number Analyte Mercury Concen- units
Atlantic -1 1707008-1 Hg 8.9 Ng/g
Atlantic -2 1707008-2 Hg 10 Ng/g
Atlantic -2
King-1
1707008-3
1707008-4
Hg
Hg
10.6
105
Ng/g
Ng/g
King-2 1707008-5 Hg 27.9 Ng/g
King-3 1707008-6 Hg 104 Ng/g
Sockeye-1
Sockeye-2
1707008-7
1707008-8
Hg
Hg
54.1
58.3
Ng/g
Ng/g
Ng/g

21
Statistical Analysis
Note: The table above shows the average mercury concentration for each species as well as the standard deviation and 95% confidence interval for one sample test.
Species Average Mercury Con- Standard Deviation 95% Confidence Inter-
Atlantic
King
9.833
78.96667
0.86216781
44.227857
8.35124741
(7.6923,11.9743)
(58.7256667, 67.007)
22
Total Mercury Concentrations
Figure 1.
Average Mercury Concentrations
Figure 2.

23
RATIONALE In 2016 alone there were 8,500 Hodgkin's Lymphoma diagnoses, which makes up 0.5% of all the cancer diagnoses in the US. In 2016, for adults 18+, there have been 17.7 million diagnosed cases of asthma, with 6.3 million of those cases being in children. Hodgkin’s Lymphoma is a cancer of the lymph system. Hodgkin's Lymphoma has been found to be more prevalent in people of higher socioeco-nomic status and people who were not attendees of daycare when they were young, which could lead to a lack of exposure to mi-crobes at a young dage. Hodgkin’s Lymphoma has also been found to be more common in people with a weakened immune system, for example because of HIV/AIDS, and in people taking medications that inhibit immune re-sponse for organ transplants. Asthma is shown to be more prevalent in people with a lower socioeconomic status and is an overre-action of the immune system. Based on these observations we plan to conduct a study in-vestigating any possible relationship between asthma and Hodgkin’s Lymphoma. If a nega-tive correlation were to be found, people with asthma would be less likely to contract Hodg-kin's Lymphoma. Finding a correlation could also lead to earlier detection of Hodgkin’s Lymphoma and a better understanding of how it works. It may indicate that the chance of getting Hodgkin’s Lymphoma is increased by a lack of microbe exposure or a less devel-oped immune system as well.
RESEARCH QUESTION Is there a negative correlation between Asth-ma and Hodgkin's Lymphoma? HYPOTHESIS If a person has a history of asthma, they are less likely to get Hodgkin's Lymphoma, be-cause they have generally been exposed to various microbes as a child. This contributes to having a strengthened immune system. EXPECTED OUTCOME There will be a negative correlation between Asthma and Hodgkin’s Lymphoma. WHO OR WHAT WILL PARTICIPATE We will use data from patients that have or had Hodgkin’s Lymphoma PROCEDURE
1. Email hospitals, specifically oncology departments requesting data on how many people have been diagnosed with Hodgkin’s Lymphoma and if each of those people have been clinically diagnosed with asthma or not, the pa-tient’s age range, and their gender.
2. Email hospitals requesting data on how many people have been clinically diagnosed with asthma and if each of
CORRELATIONAL STUDY BETWEEN ASTHMA AND
HODGKIN’S LYMPHOMA
Erin Bethune, Maariyah Moinuddin, Midori Komi

24
those people have been clinically diagnosed with Hodgkin’s Lymphoma or not, the pa-tient’s age range, and their gender.
3. List of potential hospitals to contact: 4. Organize data into this data table.
* 1 -- <35yrs,
* 2 -- 36yrs - 54yrs, 3 -- >55yrs
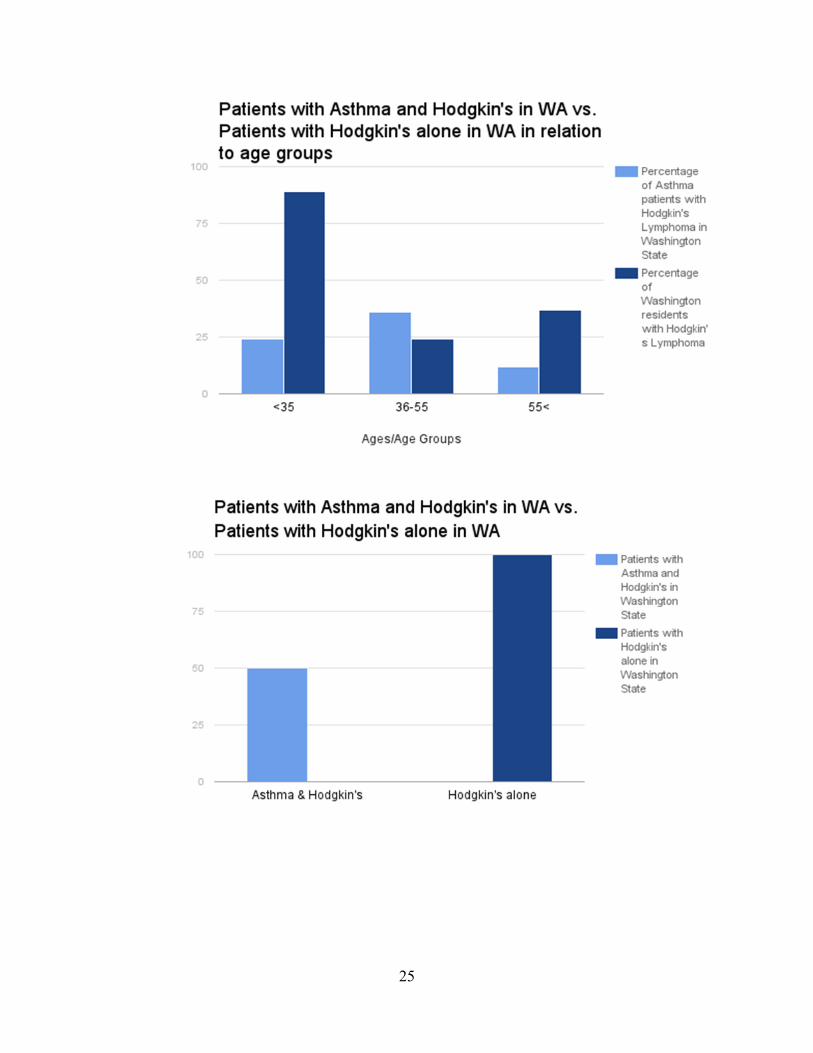
5. Make bar graphs of the data. Example graphs (not actual data): a. For data from asking patients that already have asthma also have Hodgkin’s
Lymphoma or not:
Hodgkin’s Lymphoma Asthma Age range Gender
Yes/No Yes/No 1/2/3 Male/Female
25
26
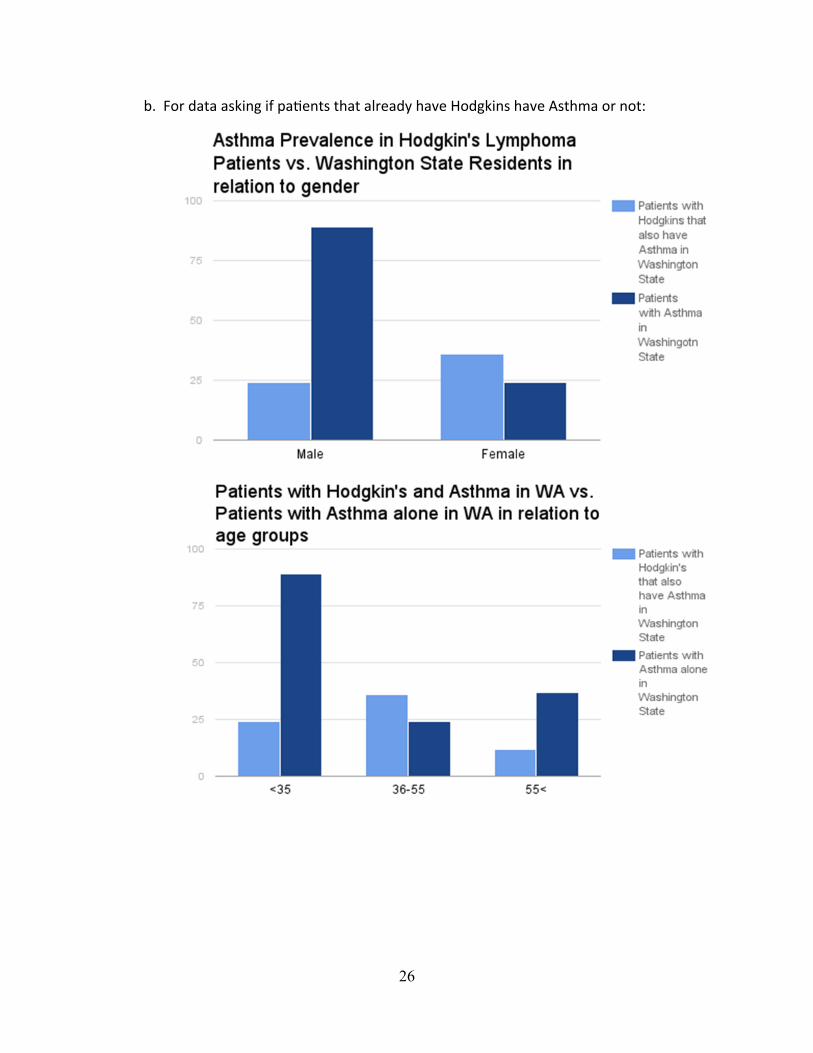
b. For data asking if patients that already have Hodgkins have Asthma or not:

27
DATA ANALYSIS
1. Create a chi square analysis in order to determine if results are statistically significant or not.
2. The chi square value will be found us-ing the equation (the observed value will be the statistics for asthma rates of people with Hodgkin's Lymphoma and the expected value will be the sta-tistics for asthma rates of the general population
3. Look at the chi square table under the row of degree of freedom of 1 and the chi square value (which was found in the previous step).
4. The column that the chi square value represents the P value.
5. If P value is equal or less than .05 the null hypothesis will be rejected and the results will be statistically signifi-cant.
6. Data will be analyzed through a chi square analysis. If the P value is less than or equal to .05 the null hypothe-sis will be rejected and the difference between asthma rates for Hodgkin's Lymphoma patients and the general population will be statistically signifi-cant.
28
POTENTIAL RISK No potential risk is associated with our study. PROTECTION OF PRIVACY Since all data will be anonymous and provid-ed for us by doctors at hospitals, it is unneces-sary to have consent forms signed by partici-pants. The data will be collected by requesting the information from hospitals. The data will be kept on a flash drive kept by group mem-bers. The only people that will have access to the data are the group members. After the study the data will only be used for under-standing the relationship between asthma and Hodgkin’s Lymphoma and will be present-ed at science fairs in WA state.
29
ABSTRACT There are numerous types of waste that have the potential to help the environment by providing an opportunity for individuals living in rural areas to use a sustainable source of energy through the practice of generating bio-gas from waste. Rural areas around the world have a high carbon footprint by virtue of be-ing forced into utilizing high-polluting energy sources such as coal and wood because homes and businesses in rural areas are off-grid; consequently, a significant amount of money is consumed in using unsustainable sources of energy. To solve this problem, we came up with an experiment involving biogas generation to uncover a type of waste with the greatest biogas output and cheapest rela-tive cost for the generation of sustainable en-ergy in rural areas. We tested our experiment by putting a specific type of waste with 500 liters of water in a biogas generator and re-cording the pressure of the chamber after 5 days of the conversion process. The independ-ent variable of our experiment is the type of material tested in the biogas generator (orange peels, food wastes such as potato and onion peels, and crop residues such as corn cob and corn husk) and the dependent varia-ble of our experiment is the cost-benefit ratio of each type of waste, which is calculated by dividing the biogas generated from the waste with the cost of the waste. After the testing process, we discovered that crop waste had the highest cost-benefit ratio at 5.77 psi/
dollar, while orange peel waste and food waste produced a cost-benefit ratio of 3.03 psi/dollar and 3.79 psi/dollar, respectively. Based on our data, we discovered that our results are not statistically significant with a p-value of 0.05-0.1, meaning that we cannot reject the null hypothesis. By discovering a type of waste that has a high biogas output and inexpensive cost, we met our objective of helping the environment by offering an op-portunity for individuals living in rural areas to use a sustainable source of energy. COST-BENEFIT ANALYSIS OF BIOGAS GENERATION Biogas is a combination of natural gas (CH4) and carbon dioxide (CO2), produced by anaer-obic decomposition of bacteria which in turn can be used as a renewable source of energy (Keith, Ge, Tracie, & Yebo, 2014). Biogas is passively generated in landfills around the world which inevitably exhausts greenhouse gases into the atmosphere, posing devas-tating consequences for the environment. By creating a biogas generator which acts like a miniature landfill, the waste can be used to generate energy, which not only reduces the effect that it has on the atmosphere, but cre-ates an opportunity for deprived individuals around the world in need of a sustainable source of energy.
COST-BENEFIT ANALYSIS OF BIOGAS GENERATION
Stuart Brown, Eric Fan
30
The societal impact of biogas generation from waste is astoundingly noteworthy. Most of the sources of energy come from firewood in rural areas around the world such as India and Pakistan, which becomes unsustainable over time (Syed, Muhammed, B., Muhammed, N, & Altaf, 2011). However, these rural areas also contain a number of crop and food wastes, which shines light on the potential to create a sustainable source of energy. Generating en-ergy through the process of converting waste at a large scale would be a major break-through in global energy production. For in-stance, in India, biogas plants have saved 4.4 million metric tons of fuel wood, helped cre-ate around 2.7 million kilowatts of electricity, and prevented 3.3 million pounds of carbon dioxide from entering the atmosphere (Dutta, 2015). There are numerous factors that contribute to the efficiency of biogas production, such as the percentage of organic material and the makeup of chemical components of our input sources. We hope that by finding a particular type of waste through our experiment, we can achieve our goals of helping the environ-ment by preventing greenhouse gases from being emitted into the atmosphere and providing an opportunity for individuals living in poor societies to use sustainable sources of energy. The objective of our project is to test multiple types of waste, from simple crop waste to high energy orange peels, to deter-mine which type of waste produces biogas most efficiently. We hypothesize that if we test multiple types of waste which can poten-tially be converted to biogas into a biogas generator, then orange peel waste will gener-ate biogas most efficiently.
BACKGROUND RESEARCH Biogas generators usually use a form of organ-ic waste to produce biogas through anaerobic digestion. Widely used materials are typically ones that have a high energy output and ones that are easily accessible, abundant, and cheap. Although there are numerous numbers of possible options of waste to test, we will only test a few sources that we postulate will potentially be the most suitable for the major-ity of countries to use: food waste, crop waste, and orange peel waste. First, an inex-pensive type of waste that households, res-taurants, and hotels produce is food waste. As the population and economy of the world has been growing, so has the food waste. China alone has produced 90 million tons of food waste in 2010 (Mao, Feng, Wang, & Ren, 2015). Food waste is increasingly making up a higher proportion of the waste around globe, making food waste an abundant source for biogas production. Another type of waste that is commonly used is unwanted crops from farms around the world. Crop waste is an astoundingly low-cost and plentiful source for biogas production, but has a very low biogas output. 95% of the biogas plants in Germany use crop waste as the input source for biogas generation because of how plentiful crop waste is (Budzianowski, 2011). Finally, a type of waste that is often used for biogas genera-tion is orange peel waste. Orange peels have little use to people and are usually thrown away, but have the potential to become a useful energy source. After orange peels have been dried and processed in factories, orange peels theoretically should produce the highest amount of biogas compared to any of the oth-er sources that we will test (Siles, Vargas, Gutiérrez, Chica, & Martín, 2016).
31
We know that for our project, we will use a small-scale biogas generator to measure bio-gas. We had the option of buying a biogas generator online made by other companies, or gathering materials and creating a biogas generator of our own. After contemplating this decision, we decided to create our own biogas generator because we concluded that we didn’t need such a high quality biogas gen-erator that is extremely expensive and in real-ity, unnecessary. We decided to create a -scale biogas generator, for it is beneficial to us in that we don’t have a high budget and it will suffice our need of measuring biogas out-put. We know that most of the biogas genera-tors other people created often contained a compartment for biogas production, a pipe for releasing the slurry produced, a gas valve, and an output pipe for the biogas that is pro-duced. By gathering a few simple workshop materials such as polyvinyl chloride (PVC) pipes and a large water tank, we will have all we need to build a biogas generator of our own. It is unclear exactly which type of waste will be most suitable for the majority of the countries around the world. Therefore, the heart of our project will be to determine the type of waste that produces the most energy using a homemade biogas digester. MATERIALS AND PROCEDURE Biogas generators come in a variety of propor-tions, ranging from household sized to indus-trial sized generators at factories built specifi-cally for biogas production. Generally, the more the generator costs, the more efficient the biogas generator is at producing energy. While we will be making a household genera-tor that will not be nearly as efficient as those found in factories, our biogas generator will be adequate for the experiment we are doing. Our generator will mainly be constructed of PVC piping since it is relatively cheap and easy
to clean out. All the piping will be held togeth-er with PL Premium, a type of industrial glue. Our reaction chamber for the generation of biogas will be a 700-liter water tank. A gas valve will be used to connect the reaction chamber to the biogas measuring instrument to measure the amount of biogas generated from a particular type of waste. ASSEMBLY The majority of steps in our project fall in the assembly of the biogas generator. The biogas generator is a very complex system which re-quires a lot of patience and precision to en-sure the generator works reliably. Before the initial construction of the biogas digester, it is important to obtain the necessary and proper materials. For the generator to work consist-ently, the whole system must not have any leaks, which may result from using the wrong type of materials. The first step in building the biogas generator is to use a black sharpie and drawing compass to mark a circle with a radius of 2 inches any-where in-between the edge and the middle of the lid and a circle with a radius of a half-inch in the middle of the lid. With these markings, use a hole saw to drill the marked circles with the appropriate bit size. Next, two feet below the top of the water tank, use a sharpie and compass to mark a circle with a half-inch radi-us. Use a hole saw with a radius of a half-inch to cut the marked area out. Finally, with all the cuts made, use sandpaper to smooth the edges of all the cuts that were made by the hole saw. With all the necessary holes made in the wa-ter tank, PVC pipes can be put and glued in the appropriate place. First, place the 2-feet long, half-inch PVC pipe into the cut that was made on the side of the water tank and nudge

32
the pipe halfway in the hole. Attach the half-inch PVC elbow on the PVC pipe on the inside of the water tank. On the outside part of the PVC pipe, attach the half-inch PVC ball valve, making sure the valve is closed. Next, attach the 4-feet long, 2-inch radius PVC pipe in the 2-inch radius hole on the lid. The PVC should go 3 feet through the hole. Make sure the PVC fits firmly in the lid, and then put the funnel on top of the PVC pipe. Finally, attach the gas valve to the hole created in the center of the lid. Plug the other end of the gas valve to the biogas measuring instrument. Now that all the parts are in place, everything can be glued together using PL Premium. With a pair of gloves on, spread PL Premium around where the PVC pipes meet the water tank on both the inside and the outside. Make sure PL Premium prevents any place that air can leak from the inside of the water tank. Set the glue to dry for at least 2 days, and then the biogas generator will be ready to use. PROCEDURE For each type of waste that we will test, there will be at least one trial for each type of waste. Depending on the time it takes for the conversion process to complete and the time that we have left to do the experiment, there could be multiple trials more accurate results. Once the generator is assembled, fill the gen-erator with 100 liters of water and 500 grams of the type of waste that is tested. The pro-cess of converting the waste to biogas will take about three weeks to complete, but it is necessary to monitor the biogas generator every day and take note of the patterns that biogas is generated. As soon as the biogas stops being generated, record the reading on the biogas measuring instrument. Once the measurement has been taken, dump the con-tents inside the biogas generator (which do
not harm the environment, but in fact act as a natural fertilizer). Clean out the water tank with water, and the biogas generator will be ready for the next type of waste to test. When all the materials have gone through a trial, compare the amount of biogas generat-ed of each material. Do a cost-benefit analysis for each type of waste by dividing the amount of biogas generated by the relative cost of the material. Use an approximation for the cost, since many materials (e.g. crop waste) are difficult to quantify. Once the cost-benefit analysis has been completed, determine which material has the least cost for the most benefit, and that will be the type of waste that generates biogas most efficiently. RESULTS Out of the three types of waste that we are testing for biogas energy output, we expect that orange peel waste will produce biogas most efficiently. When comparing the three types of waste, it is important to find out which type has the most amount of organic material. Organic material is one of the most significant factors in determining the efficien-cy of generating biogas (Arthur, Baidoo, & Antwi, 2010). The fact that orange peel waste contains the highest amount of organic mate-rial out of our three types of waste made us believe that orange peel waste will produce biogas most efficiently. During the experiment, a problem that we will likely run into is the biogas generator produc-ing biogas unreliably due to the fact that the generator was not built properly. For in-stance, it is very easy to miss a spot that needs to be glued. This will severely skew our results in comparing the efficiency that each type of waste generates biogas. Another problematic issue that we may run into is the
33
weather. Biogas is usually generated slower rate in colder conditions and faster in warmer conditions. This means that the weather can affect our results, giving us inaccurate data to compare the efficiency of each type of waste in generating biogas. DISCUSSION One possible error that could have occurred in this experiment is the improper amount of material that is put into the generator. It is likely that this will happen because it is ex-tremely difficult to weigh waste. This will re-sult in skewed results either positively or neg-atively depending on where the amount skewed from, whether it is more or less than 500 grams. Uncontrolled events could be that the temperature of our generator will likely fluctuate over the course of the experiment which will produce results that may be inaccu-rate, since overall the generator has to be kept relatively warm. However, it will natural-ly heat itself due to a byproduct of anaerobic digestion. This may produce less biogas than we were expecting since the bacteria will have to spend more energy keeping warm and less energy on actually generating biogas. If we were to repeat this experiment, we would keep the generator at a relatively con-stant temperature with a very precise scale (to measure the mass of the material) to stop any possible errors in conducting the experi-ment. Other experiments that should be con-ducted are the percent efficiency of our gen-erator and also how the temperature of the outside environment affects the amount of biogas that is produced. In turn, this will translate to real world applications of a biogas generator since it is very difficult in a home setting to keep the input material at a con-stant temperature.
CONCLUSIONS In theory, our experiment is in line with our hypothesis of orange peels generating the most amount of biogas for the least amount of mass (e.g. 500 grams). Orange peels should produce the most amount of biogas due to them being rich in carbohydrates and organic material and having only one type of material being put in, since crop and food waste both are a mix of various materials which will make the biogas production overall less efficient. Generally, the significance of our project is that biogas could be generated from crop waste and food waste but one of the better materials to use would be orange peel waste, which has practical application in the real world. Such an on-farm biogas generator that is fed exclusively crop waste will generate a renewable source of energy for not only elec-tricity, but also heat. Through this project, we have learned that biogas can be generated from a myriad of different materials and that even a domestic biogas generator will still generate biogas efficiently.
34
ABSTRACT Purpose: The purpose of our project was to design and create a prosthesis for a total an-kle arthroplasty with increased mobility and shock-absorbance for individuals in high-impact sports or activities. Methods: In order to draft our prosthesis design, we researched ankle prosthetics currently in the market and built our design using those as a reference. Using Trimble SketchUp to build our three-dimensional design, we created the prosthesis design and then to exported the file to the MakerBot software. Then, we used MakerBot 3D printers to print a scaled model of our an-kle joint using MakerBot PLA filament. Re-sults: Our design will include talus and tibial portions with projections that will insert into the bones to ensure stability. In addition, the top of the tibial component will have a cuff at the top of the projection for increased angle of horizontal rotation. The insert in between the two structures will be made out of polyu-rethane instead of polyethylene used in cur-rent designs for greater shock-absorbency and elasticity. We expect to see users of our prosthesis having better plantarflexion and dorsiflexion movement that is more similar to a standard ankle joint. In addition, the use of a more shock-absorbent material will allow users to participate in high-impact activities again after the replacement surgery. Conclu-sion: The components of our ankle-joint pros-thesis will allow users to regain use of their ankle that is much similar to a normal biologi-
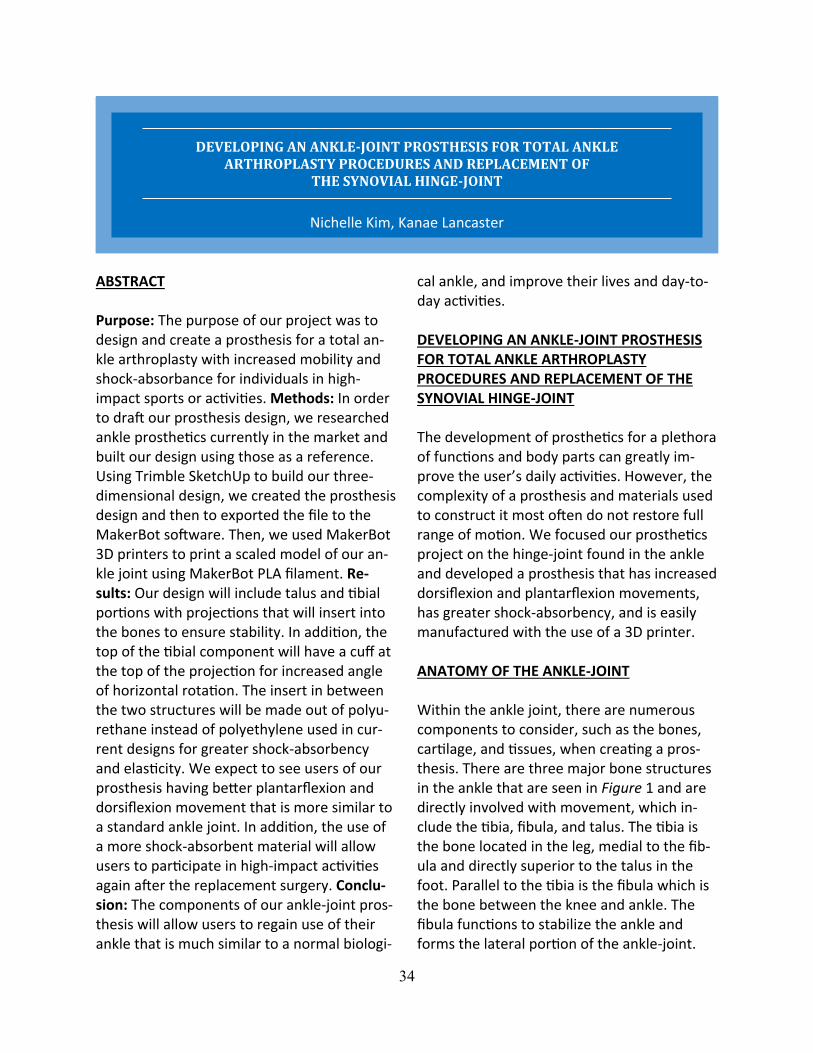
cal ankle, and improve their lives and day-to-day activities. DEVELOPING AN ANKLE-JOINT PROSTHESIS FOR TOTAL ANKLE ARTHROPLASTY PROCEDURES AND REPLACEMENT OF THE SYNOVIAL HINGE-JOINT The development of prosthetics for a plethora of functions and body parts can greatly im-prove the user’s daily activities. However, the complexity of a prosthesis and materials used to construct it most often do not restore full range of motion. We focused our prosthetics project on the hinge-joint found in the ankle and developed a prosthesis that has increased dorsiflexion and plantarflexion movements, has greater shock-absorbency, and is easily manufactured with the use of a 3D printer. ANATOMY OF THE ANKLE-JOINT Within the ankle joint, there are numerous components to consider, such as the bones, cartilage, and tissues, when creating a pros-thesis. There are three major bone structures in the ankle that are seen in Figure 1 and are directly involved with movement, which in-clude the tibia, fibula, and talus. The tibia is the bone located in the leg, medial to the fib-ula and directly superior to the talus in the foot. Parallel to the tibia is the fibula which is the bone between the knee and ankle. The fibula functions to stabilize the ankle and forms the lateral portion of the ankle-joint.
DEVELOPING AN ANKLE-JOINT PROSTHESIS FOR TOTAL ANKLE ARTHROPLASTY PROCEDURES AND REPLACEMENT OF
THE SYNOVIAL HINGE-JOINT
Nichelle Kim, Kanae Lancaster
35
The third and lower component of the ankle is the talus which is a small bone in the foot above the calcaneus that is mostly covered by articular cartilage. The superior part of the talus allows for the connection between the foot and leg.
Figure 1. Anatomy of the foot and ankle. This figure displays the various bones found in the ankle-joint and foot. Retrieved on April 2, 2017 from https://www.scoi.com/specialties/anatomy-ankle.
The ankle-joint is a type of synovial joint called a hinge joint that allows bones to move along one axis for flexing and extending. For the ankle, the hinge joint and ligaments around it allow for motion in the sagittal, cor-onal, and transverse body planes. It also has articular cartilage between the inferior ends of the fibula and tibia, and the synovial fluid found between these bones acts as a lubri-cant to decrease friction during movement. For those with ankle osteoarthritis, the carti-lage degrades and becomes thin which results in bone-on-bone movement and damage to the bones.
DETRIMENTAL EFFECTS OF TRAUMA ON THE ANKLE-JOINT The ankle is a crucial structure and the dorsi-flexion provides stability and mobility which is especially important in those who are highly active. Although it is a small part of our body, trauma or disease, such as ankle osteoarthri-tis, can be detrimental and impair an individu-al’s ability to walk properly. For soccer players and runners who damage their ankle due to developing arthritis from bone-cartilage trau-ma, metabolic disorders, fractures, or liga-ment ruptures from an accident, their normal-ly functioning ankle is lost and is replaced with limited motion, stiffness, pain, or even deformity. In addition, constant joint stress increases the chance of ankle osteoarthritis and professional ballet dancers and soccer players are at an even greater risk due to the constant strain put on their ankles. ANKLE ARTHROPLASTY PROCEDURES If the damage to the joint is severe and physi-cal therapy, injections, and medications are ineffective, an ankle arthroplasty, either par-tial or total, is an alternative which requires a prosthesis to be put in its place. When under-going an ankle arthroplasty, part of the talus and tibia bones are shaved down to remove the damaged portions. After enough room is made for the prosthesis, it is inserted as accu-rately as possible and additional holes are drilled in if needed. The prosthesis is then fit to the patient and adjusted to the correct size, angle, and location. While there are pre-cautions and disadvantages to acquiring a prosthesis, such as the recovery process and wearing down of the prosthesis itself, it has the potential to restore the majority of the movement to the ankle and significantly re-duce the receiver’s pain.
36
CURRENT ANKLE-JOINT PROSTHESIS DESIGNS ON THE MARKET In the market today, ankle prosthetics are commonly constructed and inserted using ti-tanium alloy, polyethylene, and bone cement. The different parts include the talar compo-nent which replaces the top portion of the talus bone, the tibial component which is placed at the end of the tibia, and a polyeth-ylene insert between the two bone replace-ments to allow movement between the two bone replacements and along the axis. Bone cement is also applied to the prosthesis seg-ments to secure and bind it to the patient’s bone. Although many of the prosthetics used today do make it easier to walk again and per-form daily activities, it does not restore the full movement that a biological ankle normal-ly has which can be unfavorable for highly-active individuals, such as athletes. A normal ankle has a range of motion for dorsiflexion of 13-33o and 23-56o for plantarflexion in the sagittal body plane. In comparison, a standard ankle-joint prosthesis, on average, is 10o for dorsiflexion movement and 20o for plantar-flexion, which is enough range for everyday tasks and walking, but extremely limiting for athletes in strong-shock sports or those with active lifestyles. OBJECTIVES OF OUR DESIGN For our design, we focused on increasing dor-siflexion and plantarflexion ranges of motion, partially restoring lateral and medial move-ment of the foot, and using a more shock-absorbent material for the insert for active individuals. Our goal was to increase the dor-siflexion to 12-15o and plantarflexion to 25-35o in contrast to 10o and 20o. As a result, we hoped to achieve an increase in flexibility and range of motion of the ankle-joint prosthesis so that the mobility of the ankle is closer to
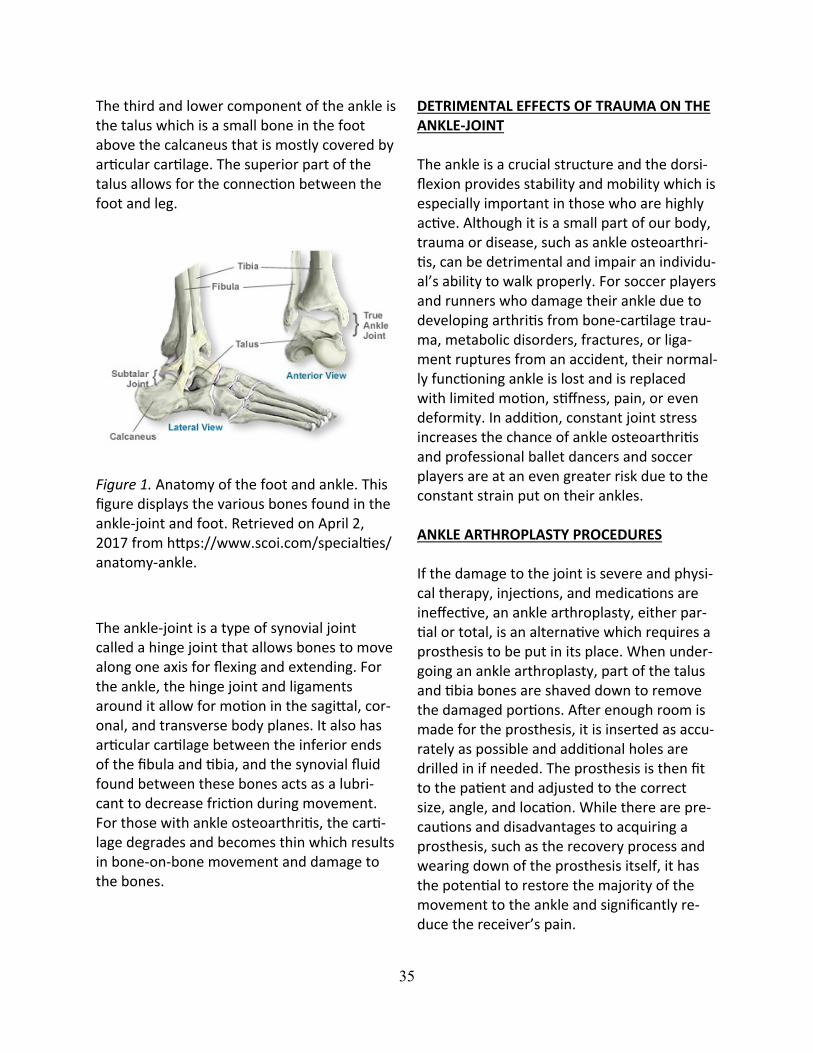
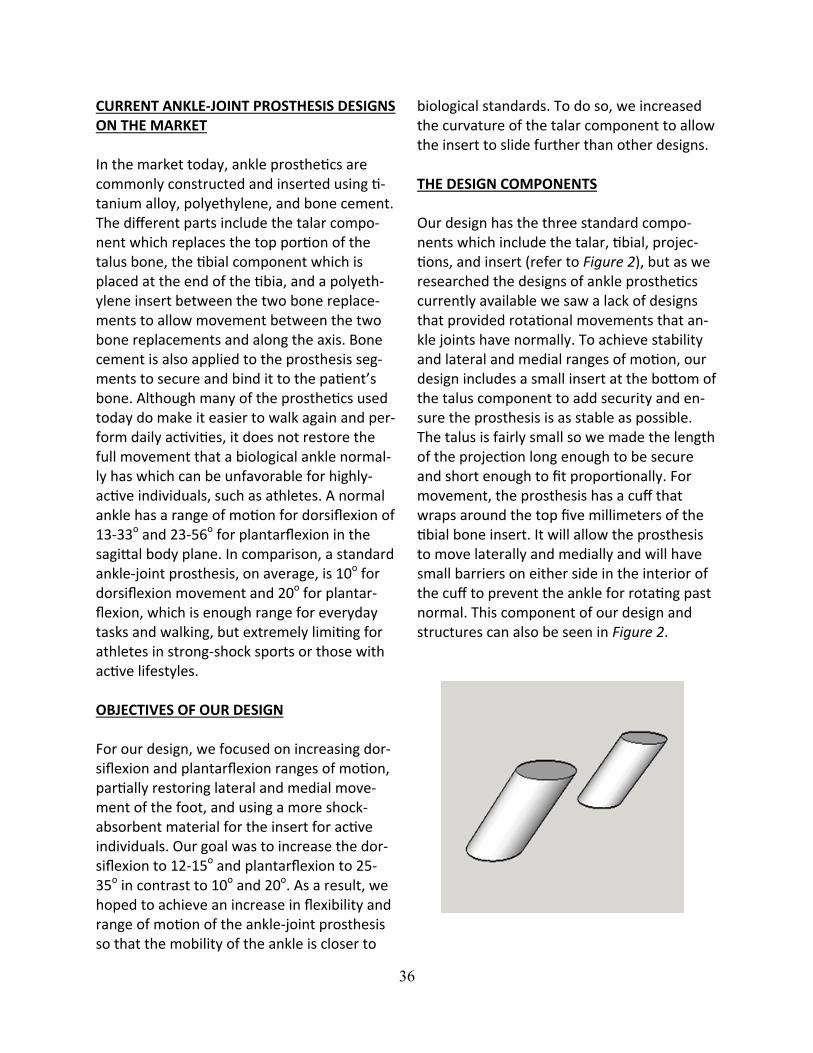
biological standards. To do so, we increased the curvature of the talar component to allow the insert to slide further than other designs. THE DESIGN COMPONENTS Our design has the three standard compo-nents which include the talar, tibial, projec-tions, and insert (refer to Figure 2), but as we researched the designs of ankle prosthetics currently available we saw a lack of designs that provided rotational movements that an-kle joints have normally. To achieve stability and lateral and medial ranges of motion, our design includes a small insert at the bottom of the talus component to add security and en-sure the prosthesis is as stable as possible. The talus is fairly small so we made the length of the projection long enough to be secure and short enough to fit proportionally. For movement, the prosthesis has a cuff that wraps around the top five millimeters of the tibial bone insert. It will allow the prosthesis to move laterally and medially and will have small barriers on either side in the interior of the cuff to prevent the ankle for rotating past normal. This component of our design and structures can also be seen in Figure 2.
37
Figure 2. Our design components. This figure shows the tibial and talar structures with the talar projections and tibial rotation cuff piec-es.
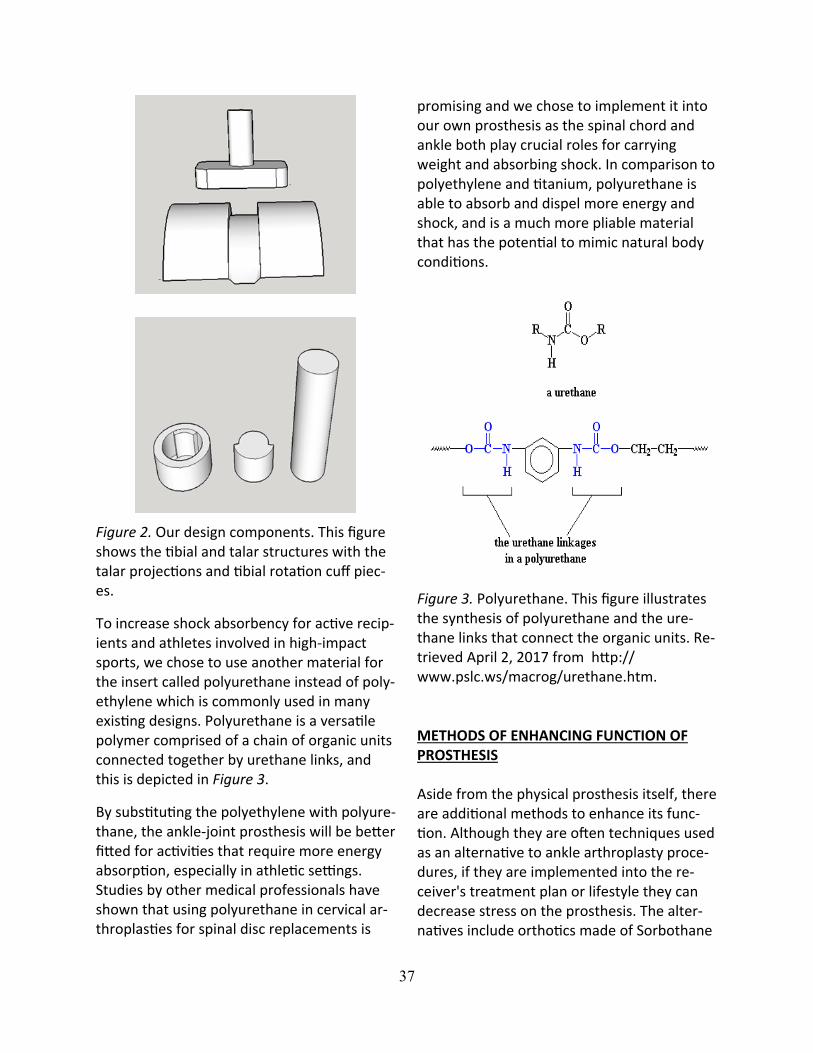
To increase shock absorbency for active recip-ients and athletes involved in high-impact sports, we chose to use another material for the insert called polyurethane instead of poly-ethylene which is commonly used in many existing designs. Polyurethane is a versatile polymer comprised of a chain of organic units connected together by urethane links, and this is depicted in Figure 3.
By substituting the polyethylene with polyure-thane, the ankle-joint prosthesis will be better fitted for activities that require more energy absorption, especially in athletic settings. Studies by other medical professionals have shown that using polyurethane in cervical ar-throplasties for spinal disc replacements is
promising and we chose to implement it into our own prosthesis as the spinal chord and ankle both play crucial roles for carrying weight and absorbing shock. In comparison to polyethylene and titanium, polyurethane is able to absorb and dispel more energy and shock, and is a much more pliable material that has the potential to mimic natural body conditions.
Figure 3. Polyurethane. This figure illustrates the synthesis of polyurethane and the ure-thane links that connect the organic units. Re-trieved April 2, 2017 from http://www.pslc.ws/macrog/urethane.htm.
METHODS OF ENHANCING FUNCTION OF PROSTHESIS Aside from the physical prosthesis itself, there are additional methods to enhance its func-tion. Although they are often techniques used as an alternative to ankle arthroplasty proce-dures, if they are implemented into the re-ceiver's treatment plan or lifestyle they can decrease stress on the prosthesis. The alter-natives include orthotics made of Sorbothane
38
which is a material made of synthetic viscoe-lastic urethane polymer and and weight con-trol. The Sorbothane orthotics would absorb much of the shock exerted when walking or during physical activity and support the arch-es of the foot. Furthermore, weight control can decrease the amount of stress applied due to body weight on the ankle-joint pros-thesis. The performance and effects of the prosthesis have the potential to be improved if one or both of these alternatives are used in conjunction with it. CONCLUSION We chose to focus on these three aspects of the design as they were greatly related to what we are trying to achieve in increasing the motion of the ankle, stability, and shock-absorbency. In hopes to make our prosthesis more affordable and have increased mobility, we have replaced many of the original materi-als for more effective substitutes and rede-signed the components. Another aspect of our design that sets our model apart from others is the range of motion that it has due to the increased curvature of the talus com-ponent, projections to provide a secure fit, and a cuff that provides lateral and medial rotation. This would allow the model to be more attractive to active individuals and ath-letes who have had a total or partial ankle ar-throplasty since their ability to have a normal-ly functioning ankle is not lost and replaced by impaired function, stiffness, pain, or even de-formity like other ankle prosthetics. The com-ponents of our design can be implemented into existing or future designs and although this is a design without any professional testing, it has the potential to change the lives of many total ankle arthroplasty patients who strive to improve and regain their lives.

39
ABSTRACT There are over 100,000 flights that cross the world every day. The total emissions amount to more than 2.4 million pounds of carbon dioxide released into the air every second from flights worldwide. We can reduce the amount of carbon dioxide in the atmosphere by increasing the efficiency of jet fuel. To do this, solketal can be added to the jet fuel for increased octane. Currently, there is an excess production of glycerol and biodiesel compa-nies pay for this waste to be disposed of. This waste, glycerol, can be combined with ace-tone to create a renewable additive called sol-ketal. By selling glycerol to pharmaceuticals or research labs for solketal production, bio-diesel companies can make money instead of losing money. The benefits of solketal as an additive for jet fuel are undeniable. Solketal's reduction of an enormous waste product, the economic viability, and reduction of emissions proves solketal can have a significant impact. In our experiment, we tested the addition of solketal by testing the fuel mixture's viscosity, energy content, flash point, freeze point, den-sity, and doctor test and compared it with jet fuel. Our test results showed that the solketal mixture met many parameters to be consid-ered jet fuel, but not all of them. However, there was 25% energy increase. Through fur-ther research, a mixture that fits all the pa-rameters can be found. Ultimately, solketal as a jet fuel additive is the solution to creating a use for the excess biodiesel waste, glycerol.
CSRSEF RESEARCH PAPER Since 1880 the global temperature over all land and ocean surfaces warmed roughly 1.53 degrees Fahrenheit according to the Intergov-ernmental Panel on Climate Change (Dokken, 2014, p.58). The rate of temperature increase has nearly doubled in the last 50 years and these temperatures are certain to go up fur-ther as stated by the IPCC (Dokken, 2014, p.58). This increase in temperature has many effects, including loss of habitat, increased risk for disease through mosquitoes, and ris-ing sea levels. The reason for the increase in temperature however, is a result from an in-crease number of greenhouses gases in our atmosphere. Emissions from an aircraft con-tribute to atmospheric pollution, consequent-ly increasing the efficiency of aircrafts would be a solution in reducing global climate change. There are over 100,000 flights that cross the world every day. The total emissions amount to more than 2.4 million pounds of carbon dioxide released into the air every second from flights worldwide according to new in-ternational calculations on global emissions published in 2016 in the journal Nature Cli-mate Change (Parry). We can reduce the amount of carbon dioxide in the atmosphere by increasing the efficiency of the jet fuel, specifically Jet-A fuel, which is one of the most widely used jet fuels. To do this, solketal can be added to the jet fuel for increased
DEVELOPING SOLKETAL AS AN ADDITIVE FOR JET FUEL: AN EFFECTIVE APPROACH TO REDUCING GLYCEROL WASTE
Andrea Dang, Sandra Militaru
40
octane. Solketal is a waste product from a bio-fuel plant which is why the system is efficient. The plants used in biofuel plants, like corn, remove carbon from the air when growing. The carbon eventually produces glycerol through transesterification. Then, with ABE (Acetone Butanol Ethanol) fermentation, ace-tone can be obtained. The combination of glycerol and acetone creates solketal. When the jet fuel-solketal combination is combusted by a plane, carbon is released back into the atmosphere completing the cycle. This amount of carbon released will be less than the amount released by an engine running on an unmixed jet fuel. Ultimately, the emissions released into the atmosphere will be reduced, resulting in a cleaner environment. Biodiesel is one of the main biofuels used worldwide. It is produced through the trans-esterification of vegetable oils or animal fat with methanol, under base catalysis condi-tions. In this process, glycerol or glycerin is formed as byproduct in approximately 10 wt% (Mishra, 2013, p.153). The overall world pro-duction of glycerin from biodiesel processing has reached 1.2 million tons in 2012, and the value is increasing significantly each year due to the widespread production of this biofuel (Pagliaro, 2012). In Brazil, biodiesel is currently being blended with the petrodiesel in 5% (v/v), yielding ap-proximately 250 thousand tons of glycerin per year. This value is much higher than the glyc-erin market in Brazil, in the order of 30 thou-sand tons per year, and it is imperative to the economical feasibility of the biodiesel pro-gram to drain this excess of glycerin (Pagliaro, 2012). Personal care products, soaps, pharma-ceuticals, and foods are the main sectors that make regular use of glycerin. However, they cannot absorb, alone, all the glycerin pro-duced from the biodiesel industry. Thus, it is
necessary to find new applications for this ex-cess of glycerin produced by the biodiesel in-dustry. Solketal, the ketal produced in the reaction of glycerol with acetone, improves the octane number and reduces gum formation in gaso-lines, either with or without ethanol (Wing, 2013, p.65). Therefore, it can be a potential oxygenated Jet-A fuel additive, especially in Brazil, where the major part of the gasoline comes from catalytic cracking, yielding a prod-uct with high concentration of olefins and, by this way, more susceptible to gum formation. EXPERIMENTAL ANALYSIS OF SOLKETAL In order to test if solketal can truly be able to be used as an additive for aviation fuel, we conducted a variety of experiments. The six most important roles in the quality of com-bustion inside the engine of an aircraft are viscosity, doctor test, freeze point, energy content, flash point, and density. We com-pared our solketal-Jet-A fuel combination with the properties of Jet-A by itself in order to see if solketal is a reliable additive for avia-tion fuel. Viscosity Analysis The viscosity of a fluid is a measure of its re-sistance to gradual deformation by shear stress or tensile stress. For liquids, it corre-sponds to the informal concept of "thickness" (Karim, 2013, p.11). It is impera-tive to keep the viscosity of fuel oil in the right range in order to get the right kind of engine efficiency. A high viscosity fuel oil leads to improper atomisation which in turn leads to incomplete combustion. High viscosity fuel prevents correct atomisation, which takes place in the fuel injectors. An efficient atomi-sation is the basic need for the healthy mixing
41
of fuel and heated air, without which, no igni-tion or combustion can be derived. Thus, it is absolutely important to set the viscosity value in the right range. Also, if viscosity is too high, an engine can be difficult to relight in flight. For this reason, jet fuel specifications place an upper limit on viscosity. Higher viscosities re-sult in higher line pressure drops, requiring the fuel pump to work harder to maintain a constant fuel flow rate (Lykins, 2005). We flipped over closable test tubes containing our fuel with ball bearings in our experiment in order to determine viscosity. The Doctor Test Analysis The doctor test is a very important test to ex-amine in jet fuel. The doctor test is the stand-ard test method for qualitative analysis for active sulfur species in fuels and solvents. It is important to conduct the doctor test because it's vital to see if the acidity was drastically different and would be physically different to the metals it is touching in the engine. In addi-tion, sulfur present as mercaptans or as hy-drogen sulfide in distillate fuels and solvents can attack many metallic and non-metallic materials in fuel and other distribution sys-tems. A negative result in the doctor test en-sures that the concentration of these com-pounds is insufficient to cause such problems in normal use. (Karim, 2013, p.13). We con-ducted the doctor test by passing it through the ASTM Test Method D 4952, and by look-ing at the fuel after passed through the test, you could determine if the fuel was negative or positive. Freeze Point Analysis The freeze point of a fuel simply tells us the temperature the fuel freezes at. It is very im-portant that the freeze point of aviation fuel is as low as possible because if the fuel for the
plane freezes then the plane cannot fly. Cold fuel temperatures may become a problem for a flight, for example on a 15+ hour New York to Hong Kong flight with a route passing over the arctic, the fuel for the plane may freeze. In addition, if the fuel for a plane is close to its freezing point, the pilot must interfere if the fuel temperature in the tanks becomes prob-lematic. We tested freeze point by using a freeze point machine. Energy Content Analysis Controlling the energy content of aviation fuel is a very important aspect of an efficient com-bustion. The energy content of aviation fuel is a description of the potential energy con-tained in a given fuel, measured per unit mass of that fuel, as specific energy, or per unit of volume of the fuel, as energy density (Karim, 2013, p.12). An aircraft turbine engine gener-ates power by converting chemical energy stored in the fuel into a combination of me-chanical energy and heat. Also, since space is at a premium in most aircrafts, the amount of energy contained in a given quantity of fuel is important. We used a Perkin Elmer 2400 Se-ries II CHNS/O Elemental Analyzer to measure the energy content of the solketal-Jet-A fuel combination. Flash Point Analysis The flash point is the lowest temperature at which the vapors above a flammable liquid will ignite on the application of an ignition source, which is why it is such an important aspect in aviation fuel. At the flash point tem-perature, just enough liquid has vaporized to bring the vapor-air space over the liquid above the lower flammability limit. The flash point is a function of the specific test condi-tions under which it is measured. The flash point of wide-cut jet fuel is below 0°C and is

42
not typically measured or controlled. The min-imum flash point of Jet A and Jet A-1 kerosine-type jet fuel is 38°C (Karim, 2013, p.12). We measured the flashpoint by using a Pensky-Martens Automated Flash Point Tester. Density Analysis In addition, it is vital to calculate the density of our aviation fuel. Density is the degree of consistency measured by the quantity of mass per unit volume. The relative weight of Jet-A fuel is around 6 lbs/US gallon (to be more pre-cise: 5.97 lbs/US gallon or in other words: 0.719 g/ml) at standard temperature (15 °C) (Robson 2011). We calculated the density of our solketal mix by dividing the mass of our fuel by the volume of our fuel. DATA ANALYSIS We tested six important properties of the Jet-A fuel-solketal mixture: density, viscosity, flash point, freeze point, energy content, and the doctor test. The solketal-jet fuel mixture passed the tests for density, flash point, freeze point, and energy content, however it did not pass for viscosity and the doctor test. The reason the mixture did not meet the pa-rameter for viscosity is because solketal is made of mostly of glycerol, which is very vis-cous. The max viscosity allowed is 8.0 cSt, but the Jet A fuel-solketal mixture had a viscosity of about 13.0 cSt. In future tests, a mixture less than 20% solketal can be found that meets the viscosity parameter. Because the energy content is 25% more efficient than reg-ular jet fuel, using less than 20% solketal in the mixture will hopefully still yield more en-ergy than regular jet fuel. This makes the sol-ketal fuel mixture a good future option for airlines. The fuel mixture didn't pass the doc-tor test but the solketal was 97% pure. Future tests should use 100% pure solketal and run
the doctor test again. Overall, the energy con-tent increase was the most significant achievement of this Jet-A fuel-solketal mix-ture. CONCLUSION In summary, solketal as an additive for jet fuel is very promising. With its high energy con-tent, the fuel mixture would result in more efficient jets because they would be getting more miles per gallon. This efficiency reduces emissions and results in a cleaner environ-ment. Also, with taxes on carbon, a jet using the standard 20% mixture of solketal in jet fuel would be paying 20% less. This provides an economic incentive for airlines in addition to the moral environmental. Overall, solketal as a jet fuel additive has many benefits: use of a waste product, economic viability, and it produces less emissions of greenhouse gases. If a solketal jet fuel mixture is perfected, it could be the jet fuel of the future.
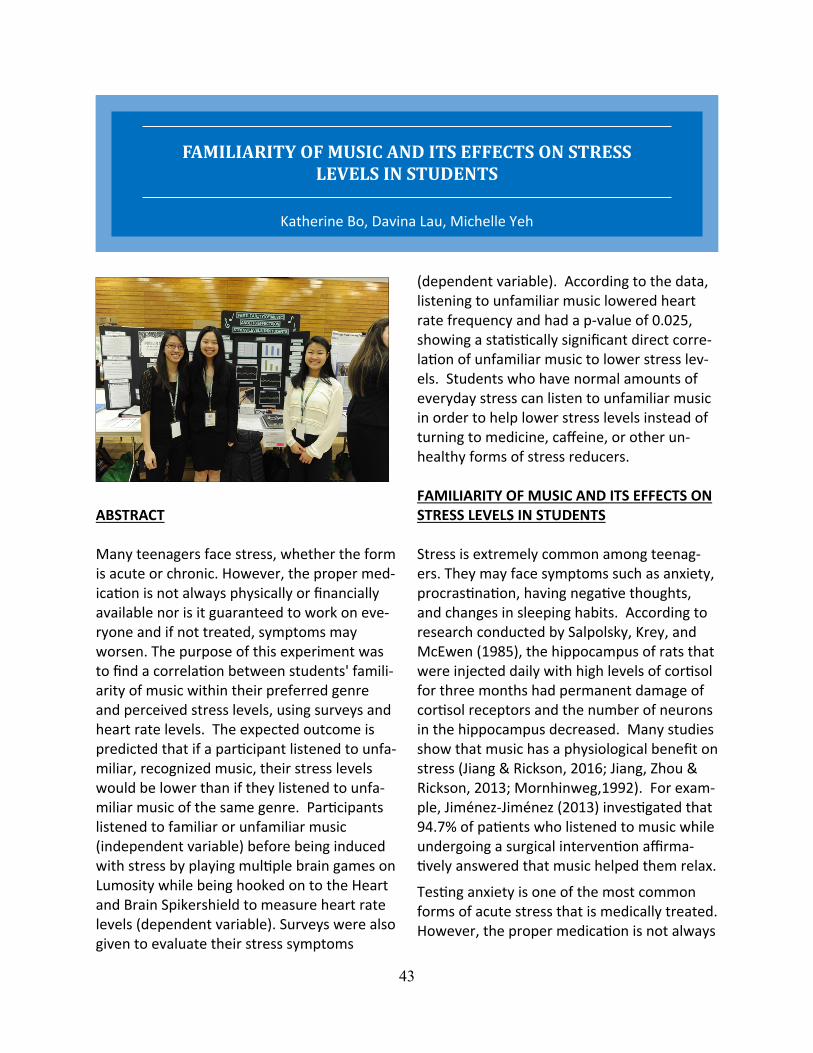
43
ABSTRACT Many teenagers face stress, whether the form is acute or chronic. However, the proper med-ication is not always physically or financially available nor is it guaranteed to work on eve-ryone and if not treated, symptoms may worsen. The purpose of this experiment was to find a correlation between students' famili-arity of music within their preferred genre and perceived stress levels, using surveys and heart rate levels. The expected outcome is predicted that if a participant listened to unfa-miliar, recognized music, their stress levels would be lower than if they listened to unfa-miliar music of the same genre. Participants listened to familiar or unfamiliar music (independent variable) before being induced with stress by playing multiple brain games on Lumosity while being hooked on to the Heart and Brain Spikershield to measure heart rate levels (dependent variable). Surveys were also given to evaluate their stress symptoms
(dependent variable). According to the data, listening to unfamiliar music lowered heart rate frequency and had a p-value of 0.025, showing a statistically significant direct corre-lation of unfamiliar music to lower stress lev-els. Students who have normal amounts of everyday stress can listen to unfamiliar music in order to help lower stress levels instead of turning to medicine, caffeine, or other un-healthy forms of stress reducers. FAMILIARITY OF MUSIC AND ITS EFFECTS ON STRESS LEVELS IN STUDENTS Stress is extremely common among teenag-ers. They may face symptoms such as anxiety, procrastination, having negative thoughts, and changes in sleeping habits. According to research conducted by Salpolsky, Krey, and McEwen (1985), the hippocampus of rats that were injected daily with high levels of cortisol for three months had permanent damage of cortisol receptors and the number of neurons in the hippocampus decreased. Many studies show that music has a physiological benefit on stress (Jiang & Rickson, 2016; Jiang, Zhou & Rickson, 2013; Mornhinweg,1992). For exam-ple, Jiménez-Jiménez (2013) investigated that 94.7% of patients who listened to music while undergoing a surgical intervention affirma-tively answered that music helped them relax.
Testing anxiety is one of the most common forms of acute stress that is medically treated. However, the proper medication is not always
FAMILIARITY OF MUSIC AND ITS EFFECTS ON STRESS LEVELS IN STUDENTS
Katherine Bo, Davina Lau, Michelle Yeh
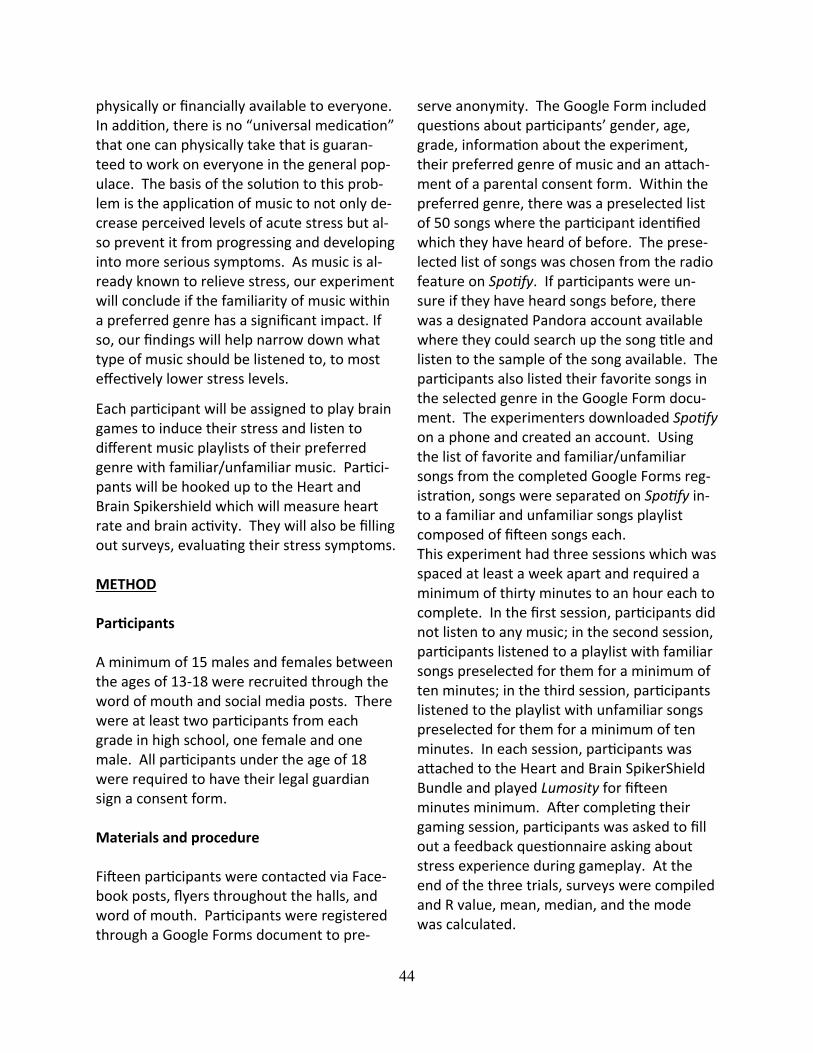
44
physically or financially available to everyone. In addition, there is no “universal medication” that one can physically take that is guaran-teed to work on everyone in the general pop-ulace. The basis of the solution to this prob-lem is the application of music to not only de-crease perceived levels of acute stress but al-so prevent it from progressing and developing into more serious symptoms. As music is al-ready known to relieve stress, our experiment will conclude if the familiarity of music within a preferred genre has a significant impact. If so, our findings will help narrow down what type of music should be listened to, to most effectively lower stress levels.
Each participant will be assigned to play brain games to induce their stress and listen to different music playlists of their preferred genre with familiar/unfamiliar music. Partici-pants will be hooked up to the Heart and Brain Spikershield which will measure heart rate and brain activity. They will also be filling out surveys, evaluating their stress symptoms. METHOD Participants A minimum of 15 males and females between the ages of 13-18 were recruited through the word of mouth and social media posts. There were at least two participants from each grade in high school, one female and one male. All participants under the age of 18 were required to have their legal guardian sign a consent form. Materials and procedure Fifteen participants were contacted via Face-book posts, flyers throughout the halls, and word of mouth. Participants were registered through a Google Forms document to pre-
serve anonymity. The Google Form included questions about participants’ gender, age, grade, information about the experiment, their preferred genre of music and an attach-ment of a parental consent form. Within the preferred genre, there was a preselected list of 50 songs where the participant identified which they have heard of before. The prese-lected list of songs was chosen from the radio feature on Spotify. If participants were un-sure if they have heard songs before, there was a designated Pandora account available where they could search up the song title and listen to the sample of the song available. The participants also listed their favorite songs in the selected genre in the Google Form docu-ment. The experimenters downloaded Spotify on a phone and created an account. Using the list of favorite and familiar/unfamiliar songs from the completed Google Forms reg-istration, songs were separated on Spotify in-to a familiar and unfamiliar songs playlist composed of fifteen songs each. This experiment had three sessions which was spaced at least a week apart and required a minimum of thirty minutes to an hour each to complete. In the first session, participants did not listen to any music; in the second session, participants listened to a playlist with familiar songs preselected for them for a minimum of ten minutes; in the third session, participants listened to the playlist with unfamiliar songs preselected for them for a minimum of ten minutes. In each session, participants was attached to the Heart and Brain SpikerShield Bundle and played Lumosity for fifteen minutes minimum. After completing their gaming session, participants was asked to fill out a feedback questionnaire asking about stress experience during gameplay. At the end of the three trials, surveys were compiled and R value, mean, median, and the mode was calculated.
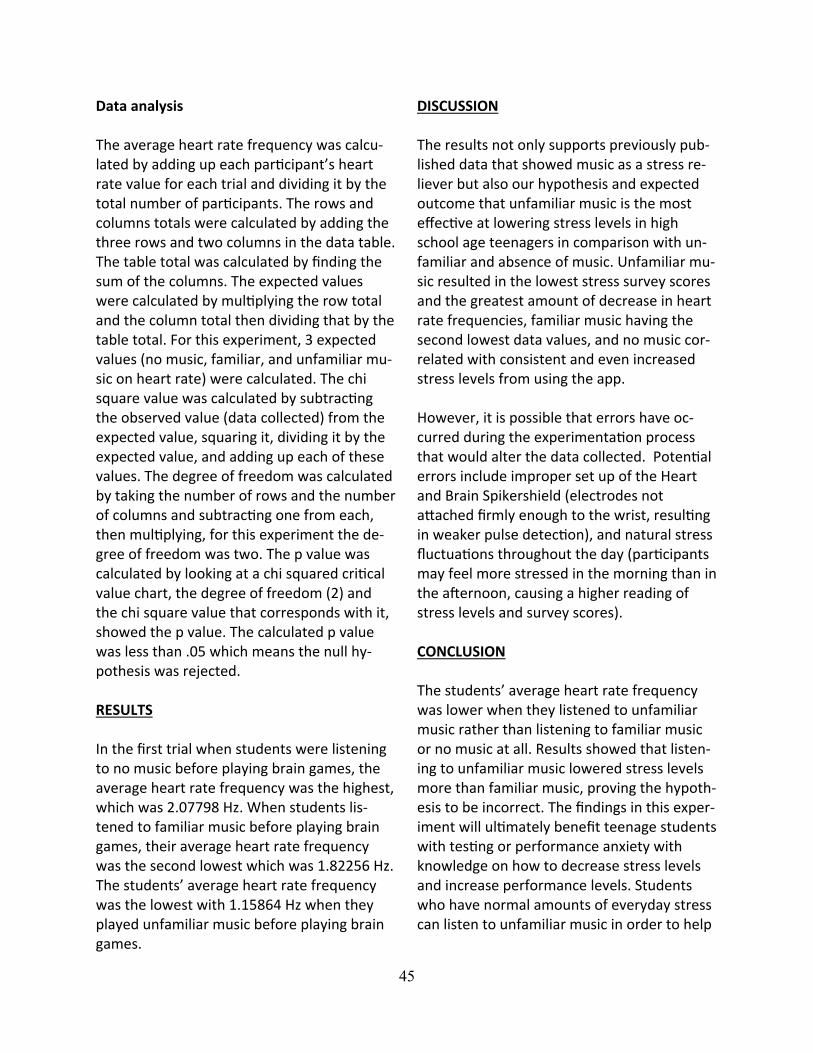
45
Data analysis The average heart rate frequency was calcu-lated by adding up each participant’s heart rate value for each trial and dividing it by the total number of participants. The rows and columns totals were calculated by adding the three rows and two columns in the data table. The table total was calculated by finding the sum of the columns. The expected values were calculated by multiplying the row total and the column total then dividing that by the table total. For this experiment, 3 expected values (no music, familiar, and unfamiliar mu-sic on heart rate) were calculated. The chi square value was calculated by subtracting the observed value (data collected) from the expected value, squaring it, dividing it by the expected value, and adding up each of these values. The degree of freedom was calculated by taking the number of rows and the number of columns and subtracting one from each, then multiplying, for this experiment the de-gree of freedom was two. The p value was calculated by looking at a chi squared critical value chart, the degree of freedom (2) and the chi square value that corresponds with it, showed the p value. The calculated p value was less than .05 which means the null hy-pothesis was rejected. RESULTS In the first trial when students were listening to no music before playing brain games, the average heart rate frequency was the highest, which was 2.07798 Hz. When students lis-tened to familiar music before playing brain games, their average heart rate frequency was the second lowest which was 1.82256 Hz. The students’ average heart rate frequency was the lowest with 1.15864 Hz when they played unfamiliar music before playing brain games.
DISCUSSION The results not only supports previously pub-lished data that showed music as a stress re-liever but also our hypothesis and expected outcome that unfamiliar music is the most effective at lowering stress levels in high school age teenagers in comparison with un-familiar and absence of music. Unfamiliar mu-sic resulted in the lowest stress survey scores and the greatest amount of decrease in heart rate frequencies, familiar music having the second lowest data values, and no music cor-related with consistent and even increased stress levels from using the app. However, it is possible that errors have oc-curred during the experimentation process that would alter the data collected. Potential errors include improper set up of the Heart and Brain Spikershield (electrodes not attached firmly enough to the wrist, resulting in weaker pulse detection), and natural stress fluctuations throughout the day (participants may feel more stressed in the morning than in the afternoon, causing a higher reading of stress levels and survey scores). CONCLUSION The students’ average heart rate frequency was lower when they listened to unfamiliar music rather than listening to familiar music or no music at all. Results showed that listen-ing to unfamiliar music lowered stress levels more than familiar music, proving the hypoth-esis to be incorrect. The findings in this exper-iment will ultimately benefit teenage students with testing or performance anxiety with knowledge on how to decrease stress levels and increase performance levels. Students who have normal amounts of everyday stress can listen to unfamiliar music in order to help

46
lower stress levels instead of caffeine, or oth-er unhealthy forms of stress reducers.
Nonetheless, it is possible that errors had oc-curred during the experimentation process that would alter the data collected. Potential errors include improper set up of the Heart and Brain Spikershield, meaning that elec-trodes were not attached firmly enough to the wrist, resulting in weaker pulse detection and natural stress fluctuations throughout the day, where participants may feel more stressed in the morning than in the afternoon, causing a higher reading of stress levels and survey scores. Overall, the implications of this experiment are promising. As the amount of stress in students increase, they will have a more effective and inexpensive solution of reducing stress by listening to unfamiliar music.

47
Tables Survey Scores and Heart Rate Levels in Each Participant
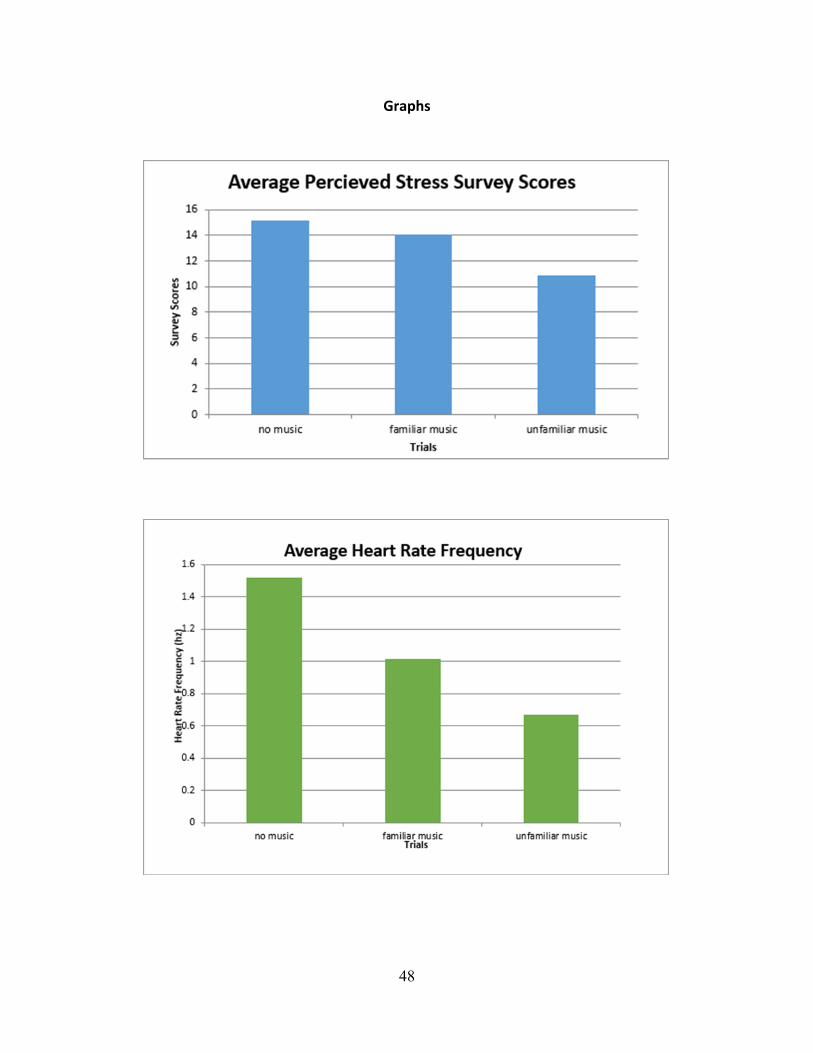
48
Graphs
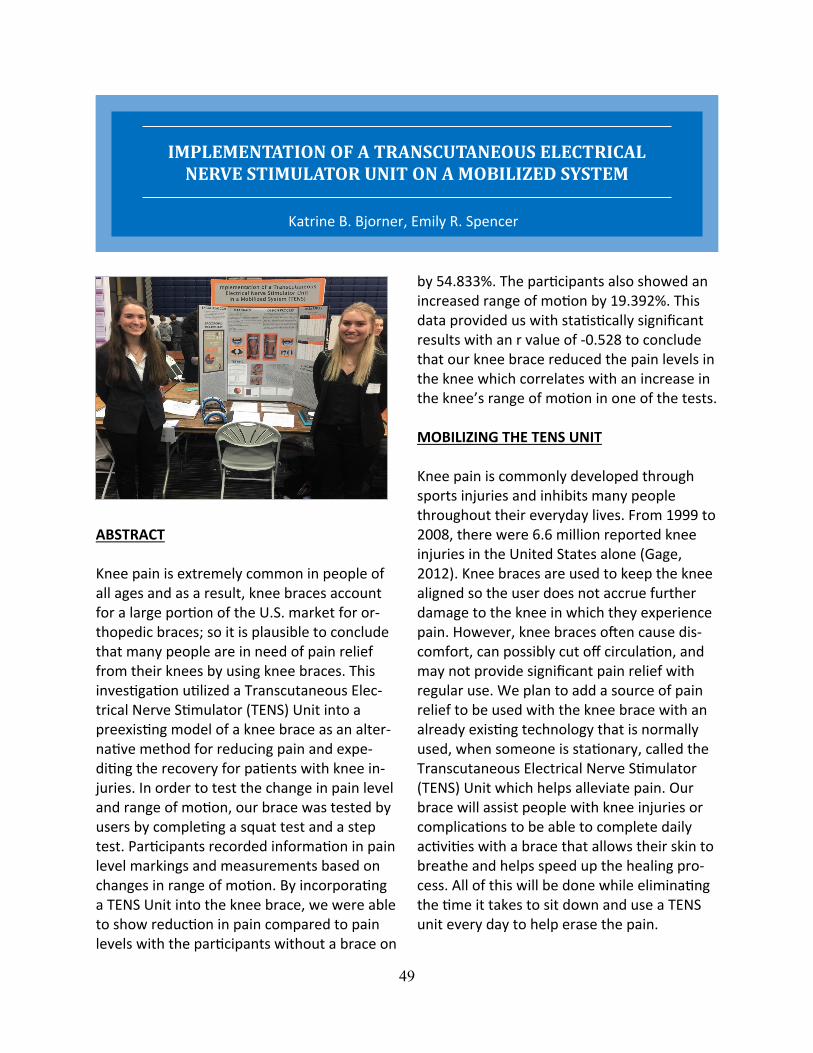
49
ABSTRACT Knee pain is extremely common in people of all ages and as a result, knee braces account for a large portion of the U.S. market for or-thopedic braces; so it is plausible to conclude that many people are in need of pain relief from their knees by using knee braces. This investigation utilized a Transcutaneous Elec-trical Nerve Stimulator (TENS) Unit into a preexisting model of a knee brace as an alter-native method for reducing pain and expe-diting the recovery for patients with knee in-juries. In order to test the change in pain level and range of motion, our brace was tested by users by completing a squat test and a step test. Participants recorded information in pain level markings and measurements based on changes in range of motion. By incorporating a TENS Unit into the knee brace, we were able to show reduction in pain compared to pain levels with the participants without a brace on
by 54.833%. The participants also showed an increased range of motion by 19.392%. This data provided us with statistically significant results with an r value of -0.528 to conclude that our knee brace reduced the pain levels in the knee which correlates with an increase in the knee’s range of motion in one of the tests. MOBILIZING THE TENS UNIT Knee pain is commonly developed through sports injuries and inhibits many people throughout their everyday lives. From 1999 to 2008, there were 6.6 million reported knee injuries in the United States alone (Gage, 2012). Knee braces are used to keep the knee aligned so the user does not accrue further damage to the knee in which they experience pain. However, knee braces often cause dis-comfort, can possibly cut off circulation, and may not provide significant pain relief with regular use. We plan to add a source of pain relief to be used with the knee brace with an already existing technology that is normally used, when someone is stationary, called the Transcutaneous Electrical Nerve Stimulator (TENS) Unit which helps alleviate pain. Our brace will assist people with knee injuries or complications to be able to complete daily activities with a brace that allows their skin to breathe and helps speed up the healing pro-cess. All of this will be done while eliminating the time it takes to sit down and use a TENS unit every day to help erase the pain.
IMPLEMENTATION OF A TRANSCUTANEOUS ELECTRICAL NERVE STIMULATOR UNIT ON A MOBILIZED SYSTEM
Katrine B. Bjorner, Emily R. Spencer

50
BACKGROUND RESEARCH Annually, about 2.5 million people are ad-mitted to hospitals because of knee inju-ries. The U.S. market for orthopedic braces and supports in 2011 was over $1.2 billion, growing at a 4.9% compound annual growth rate (CAGR) expected to reach $1.7 billion by 2018. Knee braces account for 71% of this market. Over-the-counter braces via stores and websites support the U.S. orthopedic brace industry, growing at a 5% CAGR (Wood, 2013). The demand comes from the want of protective medicine, non-invasive pain treat-ment, increasing popularity of sports, and for people who don’t want to take drugs to allevi-ate their pain. The problems with knee braces on the healthcare industry side would include the competition of alternative treatment methods and musculoskeletal problems, the cost and discomfort of the brace, and a prescription requirement or restricted reimbursement for many of these devices. The good news is that with all of the competition for new methods of treatment, the average selling price goes down. In the article “Knee Braces: Current Evi-dence and Clinical Recommendations for Their Use,” Paluska (2000) discusses that the key concept of a knee brace is to keep the knee aligned. This evidence is supported by data that has been collected over the years. To build upon this idea of keeping the knee aligned, reducing pain in the area while in mo-tion can be very beneficial in the long term. People with chronic knee pain typically have to use a TENS unit for 20 minutes to one hour each day, multiple times a day in order for their pain to become subtle so that they can continue to lead a normal life. If their pain can be reduced while they are in motion, there will be no need for them to sit around for extensive periods of time.
“Rehabilitation and Therapy,” found in Cur-rent Therapy in Sports Medicine, by Janssen (1985) gave us information about the cause of muscle soreness and how to treat it and de-crease its symptoms. One chapter (p. 276-281) discusses how overuse of the locomotor system can interfere with physical activities and how the skeletal muscle is a part of the body that has the general tendency to show these symptoms. The symptoms of overuse can occur right after you stop exercising with a peak intensity at 24-48 hours later. These muscles feel sore and are painful when you touch them or try to massage them. The area affected is entirely dependent on which areas you are exercising or what kind of exercise you do. For example, runners experience stiff-ness and soreness in the soleus (calf) and gas-trocnemius muscles (bottom). With these symptoms, the range of motion next to the joints is decreased due to not being able to stretch. There is a spasm theory based on spontaneous contraction of specific motor units where they experience the same symp-toms as listed before; the painful touch to the hardened muscle where there are localized hardened strands that have involuntary con-tracting motor units and in turn have the aforementioned pain. This theory has little support and many criticisms for the investiga-tions. The other theory discussed is based on the idea that exercise can cause structural damage to the muscle. This theory examines the processes that occur inside of the body that then result in an increased turnover rate for connective tissue. With this, investigations have confirmed that high intensity exercise can induce muscle soreness and cause dam-age to the connective tissues (Janssen, 1985). There have been a number of experiments outlining inflammation as a key factor in the pain of the muscle. These experiments con-firmed the theories that intensity and dura-

51
tion of exercise can determine the extent of the structural damage which tends to lead to muscle soreness. To combat these symptoms along with muscle/connective tissue deterio-ration, researchers suggest that you increase intensity of your workout gradually and warm up or stretch beforehand. To increase recov-ery, stretching and cooling down is key, along with massage of the muscles you used during the exercise. Electrical modalities, such as a TENS Unit are also used to speed up the re-covery process and decrease inflammation of the area. Trauma to soft tissue causes an in-crease in H3O+ ions which increases inflam-mation. Applying the electrical modalities after an injury can help relieve pain as well as inflammation. The end goal with electrical modalities is to regain the strength, flexibility, endurance, and proprioceptive reactions of a person that they had before the injury. With manual therapy and exercise progressions, fibers and ligament structure can help be re-paired. An example of this was discussed with a sprain of the medial collateral ligament of the knee, which is associated with tears in the patellar fibers which help with stability of the knee. This can cause the patellar to be in ab-normal position. Bracing can help restore the knee’s original position and help the damage fiber structure heal (Janssen, 1985). The significance of these findings from Cur-rent Therapy in Sports Medicine to our topic is that they explain the symptoms within an in-jury that we want to help treat, especially with an electrical modality. The TENS unit that we are using is a version of an electrical mo-dality that is used to maximize the potential of its analgesia. Using a brace alongside the TENS unit would allow the knee cap to be sta-bilized which is something we considered for another portion of our project that contains the TENS unit. With overuse comes pain that so many are experiencing. We want to focus
on people who have structurally damaged their knee(s), whether it be from an injury or overuse in order to help improve their mobili-ty. Our knee brace would be able to decrease the pain and inflammation (which is another source of the pain) that these people are ex-periencing. Our end goal is that our brace will help lead a more comfortable life so that peo-ple with knee pain will simply be able to do what they enjoy, without any knee pain. There are two different chapters (p. 255-259 & 277-296) from the book Clinical Sports Medicine by William A. Grana and Alexan-der Kalenak (1991) that are very relevant and contain important research for our project. There is a suggested seven step progression of rehabilitation for any type of injury ex-plained in these chapters. Step three is to maintain the range of motion. With an injured ligament, the stiffness properties may return to normal quickly; however, strength and en-ergy absorption require a longer time period that could extend for years. The chapters sup-port with statistics that a TENS unit is a prom-ising method in eliminating pain, increasing flexibility, and occasionally helping muscle strength under certain conditions. Increased flexibility is in the same category as increased range of motion (Grana, 1991). This research helps to prove that a TENS unit helps improve step three of the seven step progression of rehabilitation. “A transcutaneous electrical nerve stimulator (TENS) is classified as any electrical stimulator applied to the skin for purposes such as pain relief, wound healing, vascular response mod-ification, or muscle exercise” (Grana, 1991, p. 283). TENS units have been used to treat chronic intractable pain, post-surgical pain, and pain associated with active or post-trauma injury unresponsive to other standard pain therapies (BlueCross, 1982). These chap-
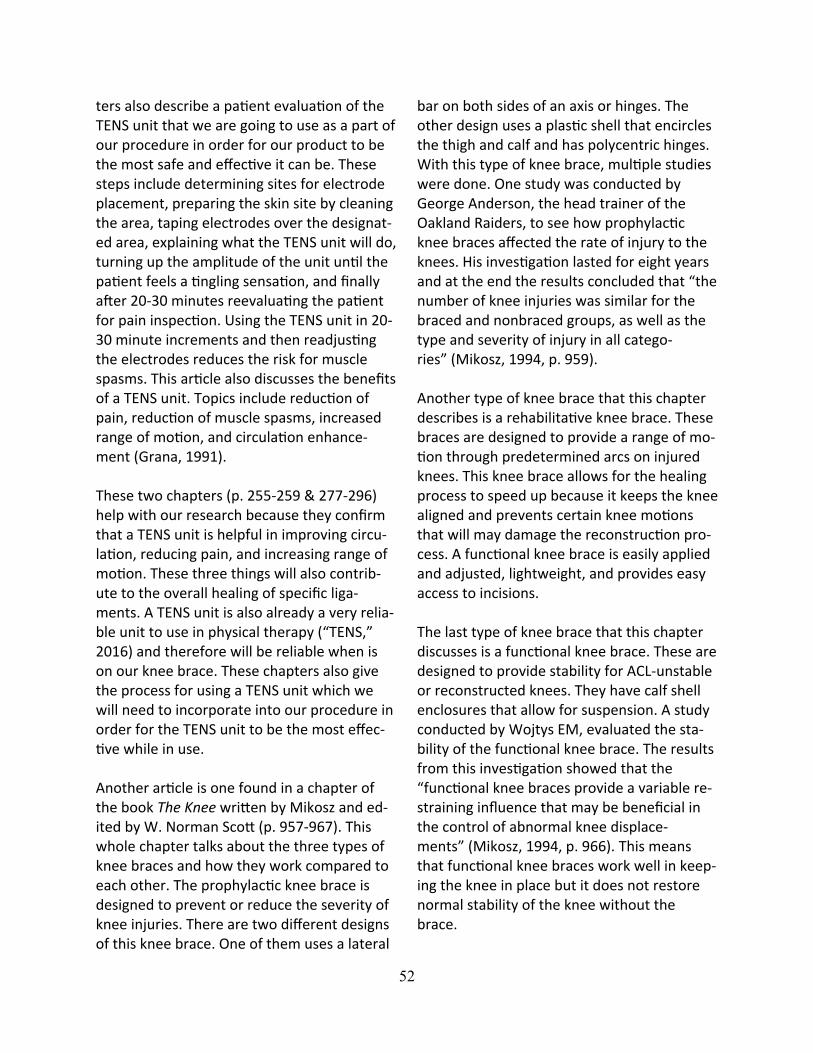
52
ters also describe a patient evaluation of the TENS unit that we are going to use as a part of our procedure in order for our product to be the most safe and effective it can be. These steps include determining sites for electrode placement, preparing the skin site by cleaning the area, taping electrodes over the designat-ed area, explaining what the TENS unit will do, turning up the amplitude of the unit until the patient feels a tingling sensation, and finally after 20-30 minutes reevaluating the patient for pain inspection. Using the TENS unit in 20-30 minute increments and then readjusting the electrodes reduces the risk for muscle spasms. This article also discusses the benefits of a TENS unit. Topics include reduction of pain, reduction of muscle spasms, increased range of motion, and circulation enhance-ment (Grana, 1991). These two chapters (p. 255-259 & 277-296) help with our research because they confirm that a TENS unit is helpful in improving circu-lation, reducing pain, and increasing range of motion. These three things will also contrib-ute to the overall healing of specific liga-ments. A TENS unit is also already a very relia-ble unit to use in physical therapy (“TENS,” 2016) and therefore will be reliable when is on our knee brace. These chapters also give the process for using a TENS unit which we will need to incorporate into our procedure in order for the TENS unit to be the most effec-tive while in use. Another article is one found in a chapter of the book The Knee written by Mikosz and ed-ited by W. Norman Scott (p. 957-967). This whole chapter talks about the three types of knee braces and how they work compared to each other. The prophylactic knee brace is designed to prevent or reduce the severity of knee injuries. There are two different designs of this knee brace. One of them uses a lateral
bar on both sides of an axis or hinges. The other design uses a plastic shell that encircles the thigh and calf and has polycentric hinges. With this type of knee brace, multiple studies were done. One study was conducted by George Anderson, the head trainer of the Oakland Raiders, to see how prophylactic knee braces affected the rate of injury to the knees. His investigation lasted for eight years and at the end the results concluded that “the number of knee injuries was similar for the braced and nonbraced groups, as well as the type and severity of injury in all catego-ries” (Mikosz, 1994, p. 959). Another type of knee brace that this chapter describes is a rehabilitative knee brace. These braces are designed to provide a range of mo-tion through predetermined arcs on injured knees. This knee brace allows for the healing process to speed up because it keeps the knee aligned and prevents certain knee motions that will may damage the reconstruction pro-cess. A functional knee brace is easily applied and adjusted, lightweight, and provides easy access to incisions. The last type of knee brace that this chapter discusses is a functional knee brace. These are designed to provide stability for ACL-unstable or reconstructed knees. They have calf shell enclosures that allow for suspension. A study conducted by Wojtys EM, evaluated the sta-bility of the functional knee brace. The results from this investigation showed that the “functional knee braces provide a variable re-straining influence that may be beneficial in the control of abnormal knee displace-ments” (Mikosz, 1994, p. 966). This means that functional knee braces work well in keep-ing the knee in place but it does not restore normal stability of the knee without the brace.
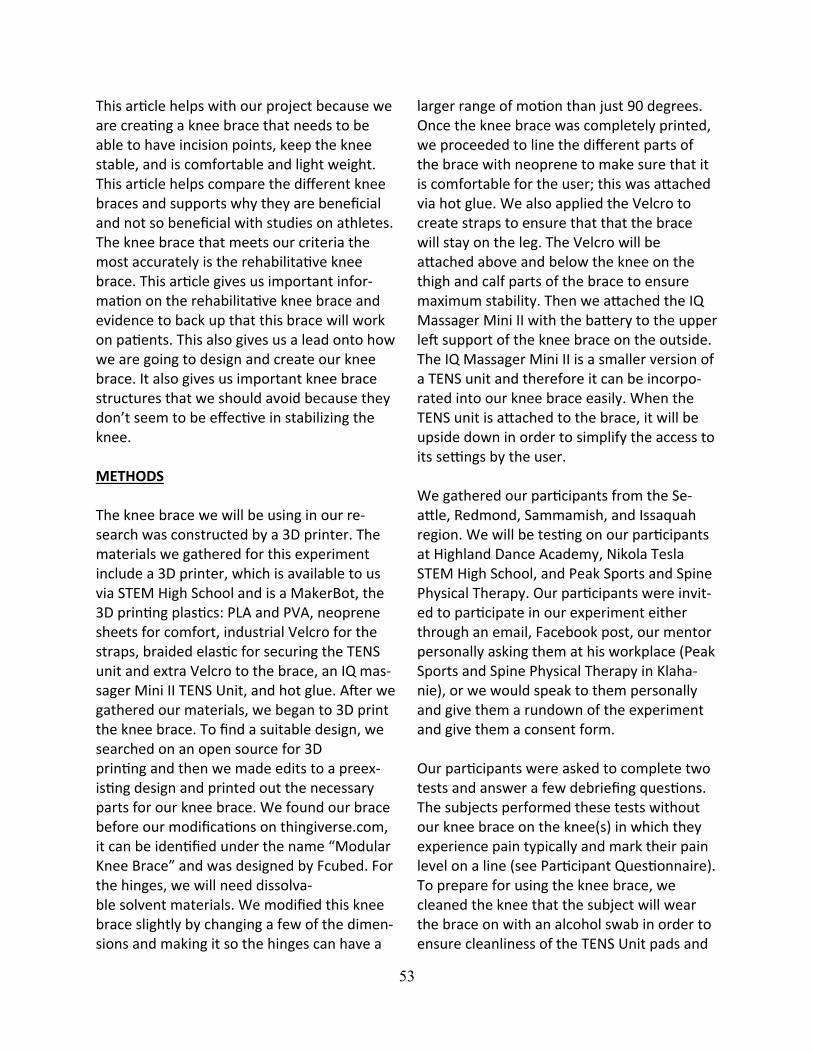
53
This article helps with our project because we are creating a knee brace that needs to be able to have incision points, keep the knee stable, and is comfortable and light weight. This article helps compare the different knee braces and supports why they are beneficial and not so beneficial with studies on athletes. The knee brace that meets our criteria the most accurately is the rehabilitative knee brace. This article gives us important infor-mation on the rehabilitative knee brace and evidence to back up that this brace will work on patients. This also gives us a lead onto how we are going to design and create our knee brace. It also gives us important knee brace structures that we should avoid because they don’t seem to be effective in stabilizing the knee. METHODS The knee brace we will be using in our re-search was constructed by a 3D printer. The materials we gathered for this experiment include a 3D printer, which is available to us via STEM High School and is a MakerBot, the 3D printing plastics: PLA and PVA, neoprene sheets for comfort, industrial Velcro for the straps, braided elastic for securing the TENS unit and extra Velcro to the brace, an IQ mas-sager Mini II TENS Unit, and hot glue. After we gathered our materials, we began to 3D print the knee brace. To find a suitable design, we searched on an open source for 3D printing and then we made edits to a preex-isting design and printed out the necessary parts for our knee brace. We found our brace before our modifications on thingiverse.com, it can be identified under the name “Modular Knee Brace” and was designed by Fcubed. For the hinges, we will need dissolva-ble solvent materials. We modified this knee brace slightly by changing a few of the dimen-sions and making it so the hinges can have a
larger range of motion than just 90 degrees. Once the knee brace was completely printed, we proceeded to line the different parts of the brace with neoprene to make sure that it is comfortable for the user; this was attached via hot glue. We also applied the Velcro to create straps to ensure that that the brace will stay on the leg. The Velcro will be attached above and below the knee on the thigh and calf parts of the brace to ensure maximum stability. Then we attached the IQ Massager Mini II with the battery to the upper left support of the knee brace on the outside. The IQ Massager Mini II is a smaller version of a TENS unit and therefore it can be incorpo-rated into our knee brace easily. When the TENS unit is attached to the brace, it will be upside down in order to simplify the access to its settings by the user. We gathered our participants from the Se-attle, Redmond, Sammamish, and Issaquah region. We will be testing on our participants at Highland Dance Academy, Nikola Tesla STEM High School, and Peak Sports and Spine Physical Therapy. Our participants were invit-ed to participate in our experiment either through an email, Facebook post, our mentor personally asking them at his workplace (Peak Sports and Spine Physical Therapy in Klaha-nie), or we would speak to them personally and give them a rundown of the experiment and give them a consent form. Our participants were asked to complete two tests and answer a few debriefing questions. The subjects performed these tests without our knee brace on the knee(s) in which they experience pain typically and mark their pain level on a line (see Participant Questionnaire). To prepare for using the knee brace, we cleaned the knee that the subject will wear the brace on with an alcohol swab in order to ensure cleanliness of the TENS Unit pads and
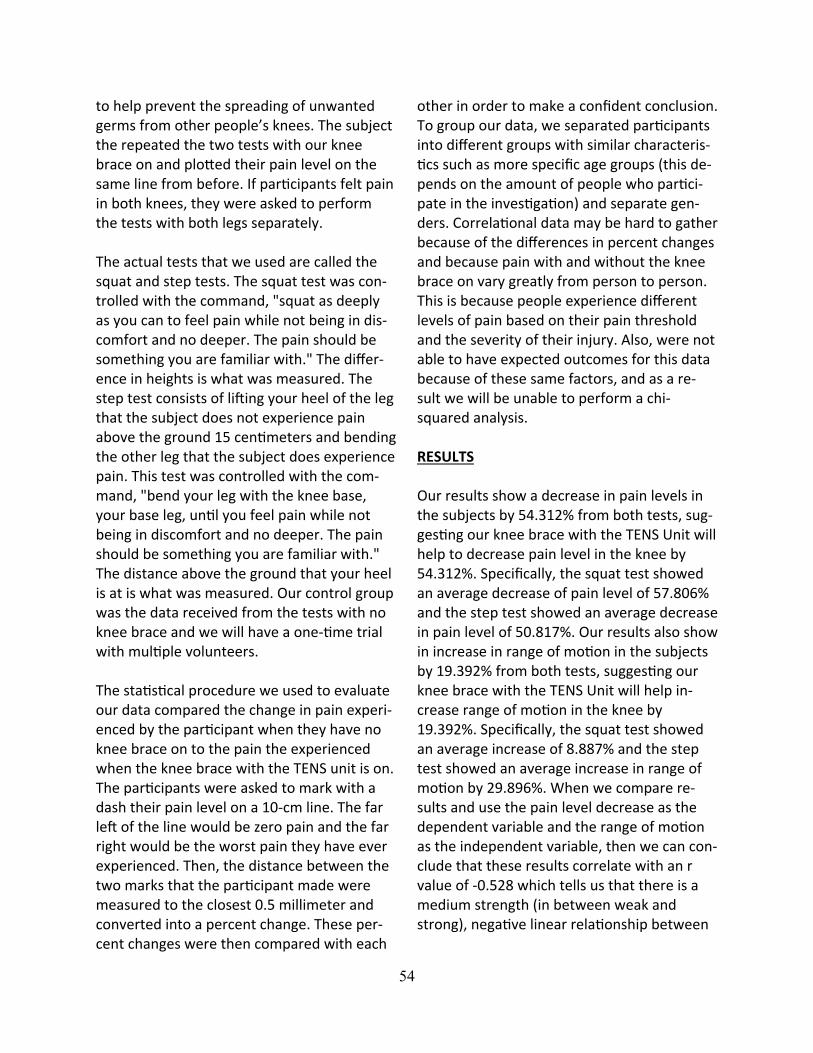
54
to help prevent the spreading of unwanted germs from other people’s knees. The subject the repeated the two tests with our knee brace on and plotted their pain level on the same line from before. If participants felt pain in both knees, they were asked to perform the tests with both legs separately. The actual tests that we used are called the squat and step tests. The squat test was con-trolled with the command, "squat as deeply as you can to feel pain while not being in dis-comfort and no deeper. The pain should be something you are familiar with." The differ-ence in heights is what was measured. The step test consists of lifting your heel of the leg that the subject does not experience pain above the ground 15 centimeters and bending the other leg that the subject does experience pain. This test was controlled with the com-mand, "bend your leg with the knee base, your base leg, until you feel pain while not being in discomfort and no deeper. The pain should be something you are familiar with." The distance above the ground that your heel is at is what was measured. Our control group was the data received from the tests with no knee brace and we will have a one-time trial with multiple volunteers. The statistical procedure we used to evaluate our data compared the change in pain experi-enced by the participant when they have no knee brace on to the pain the experienced when the knee brace with the TENS unit is on. The participants were asked to mark with a dash their pain level on a 10-cm line. The far left of the line would be zero pain and the far right would be the worst pain they have ever experienced. Then, the distance between the two marks that the participant made were measured to the closest 0.5 millimeter and converted into a percent change. These per-cent changes were then compared with each
other in order to make a confident conclusion. To group our data, we separated participants into different groups with similar characteris-tics such as more specific age groups (this de-pends on the amount of people who partici-pate in the investigation) and separate gen-ders. Correlational data may be hard to gather because of the differences in percent changes and because pain with and without the knee brace on vary greatly from person to person. This is because people experience different levels of pain based on their pain threshold and the severity of their injury. Also, were not able to have expected outcomes for this data because of these same factors, and as a re-sult we will be unable to perform a chi-squared analysis. RESULTS Our results show a decrease in pain levels in the subjects by 54.312% from both tests, sug-gesting our knee brace with the TENS Unit will help to decrease pain level in the knee by 54.312%. Specifically, the squat test showed an average decrease of pain level of 57.806% and the step test showed an average decrease in pain level of 50.817%. Our results also show in increase in range of motion in the subjects by 19.392% from both tests, suggesting our knee brace with the TENS Unit will help in-crease range of motion in the knee by 19.392%. Specifically, the squat test showed an average increase of 8.887% and the step test showed an average increase in range of motion by 29.896%. When we compare re-sults and use the pain level decrease as the dependent variable and the range of motion as the independent variable, then we can con-clude that these results correlate with an r value of -0.528 which tells us that there is a medium strength (in between weak and strong), negative linear relationship between

55
pain level and range of motion for our 19 par-ticipants. We are measuring the change in depths from the two tests (see Methods) as well as the pain level recorded by the participants which gives us unbiased and a biased data. An exam-ple of a participant's data will be given from the pain level, measured on the line:
The data collected will include two striations on the line. One is data from the test without the knee brace, this is the control to compare the experimental, and the other is data from the test with the knee brace, this is the exper-imental. DISCUSSION Our expected results were to see a negative change in pain level, from high pain to low pain, while using the 3D printed knee brace with the TENS unit while increasing the range of motion. This is a theoretical derived from the knowledge that knee brace helps keep the knee in line so it can speed up the healing process by preventing certain knee movements that may constrict reconstructing ligaments (Mikosz, 1994) as well as the re-search concluding with the TENS unit as an aide to improving circulation, reducing pain, and increasing range of motion (Grana, 1991).
An error of this experiment is bias from the participants. We aim to reduce this as much as possible by giving them a line to mark their pain level rather than have them verbally ex-plain what number their pain level is because it can become confusing and can make the data invalid. Another error of this experiment is mismeasurement of the two tests where the researchers didn’t accurately measure the deepness of the squat using the same point on the participant or the distance from the heel to the ground in the step test. We also aim to reduce as much human involvement from the researchers, so we have set phrases in order to minimize risk of injury in the pa-tients by having them push themselves too far and by possibly skewing the results. If we re-peated this project, we would search for more participants with a wider range of sex and age. Also, if we had a larger testing group, we could minimize sampling bias. Other experi-ments that could be conducted might be oth-er tests that engage the knee and more indi-vidual testing on the 3D printed knee brace to validate it as a supportive device to test with. CONCLUSIONS Our expected data was to find a statistical sig-nificance in the improvement of pain level in the knee from using just a knee brace to using the knee brace with the TENS unit turned on. This should support our engineering goal which is to design and construct a knee brace that functions properly and helps secure the knee in place while reducing pain and increas-ing the range of motion of the knee with a Transcutaneous Electrical Nerve Stimulator Unit. Our prototype met our design criteria by being a comfortable and functional knee brace (based off of participant recorded data) with the TENS unit.
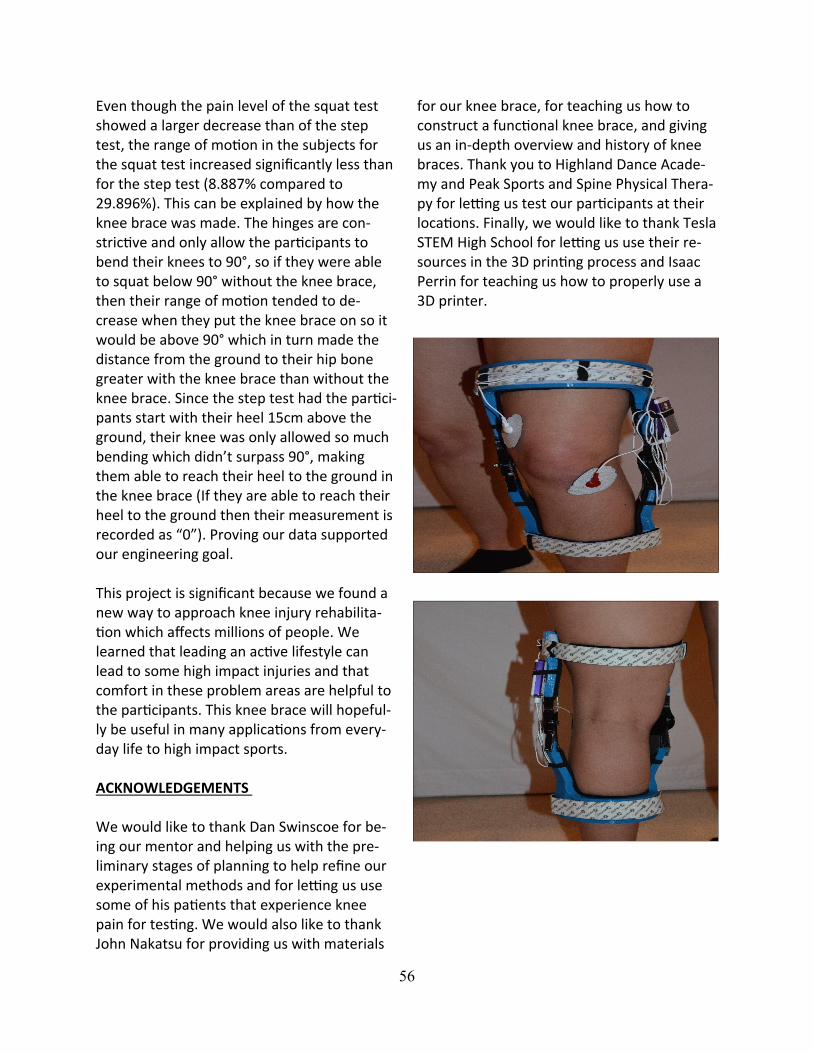
56
Even though the pain level of the squat test showed a larger decrease than of the step test, the range of motion in the subjects for the squat test increased significantly less than for the step test (8.887% compared to 29.896%). This can be explained by how the knee brace was made. The hinges are con-strictive and only allow the participants to bend their knees to 90°, so if they were able to squat below 90° without the knee brace, then their range of motion tended to de-crease when they put the knee brace on so it would be above 90° which in turn made the distance from the ground to their hip bone greater with the knee brace than without the knee brace. Since the step test had the partici-pants start with their heel 15cm above the ground, their knee was only allowed so much bending which didn’t surpass 90°, making them able to reach their heel to the ground in the knee brace (If they are able to reach their heel to the ground then their measurement is recorded as “0”). Proving our data supported our engineering goal. This project is significant because we found a new way to approach knee injury rehabilita-tion which affects millions of people. We learned that leading an active lifestyle can lead to some high impact injuries and that comfort in these problem areas are helpful to the participants. This knee brace will hopeful-ly be useful in many applications from every-day life to high impact sports. ACKNOWLEDGEMENTS We would like to thank Dan Swinscoe for be-ing our mentor and helping us with the pre-liminary stages of planning to help refine our experimental methods and for letting us use some of his patients that experience knee pain for testing. We would also like to thank John Nakatsu for providing us with materials
for our knee brace, for teaching us how to construct a functional knee brace, and giving us an in-depth overview and history of knee braces. Thank you to Highland Dance Acade-my and Peak Sports and Spine Physical Thera-py for letting us test our participants at their locations. Finally, we would like to thank Tesla STEM High School for letting us use their re-sources in the 3D printing process and Isaac Perrin for teaching us how to properly use a 3D printer.
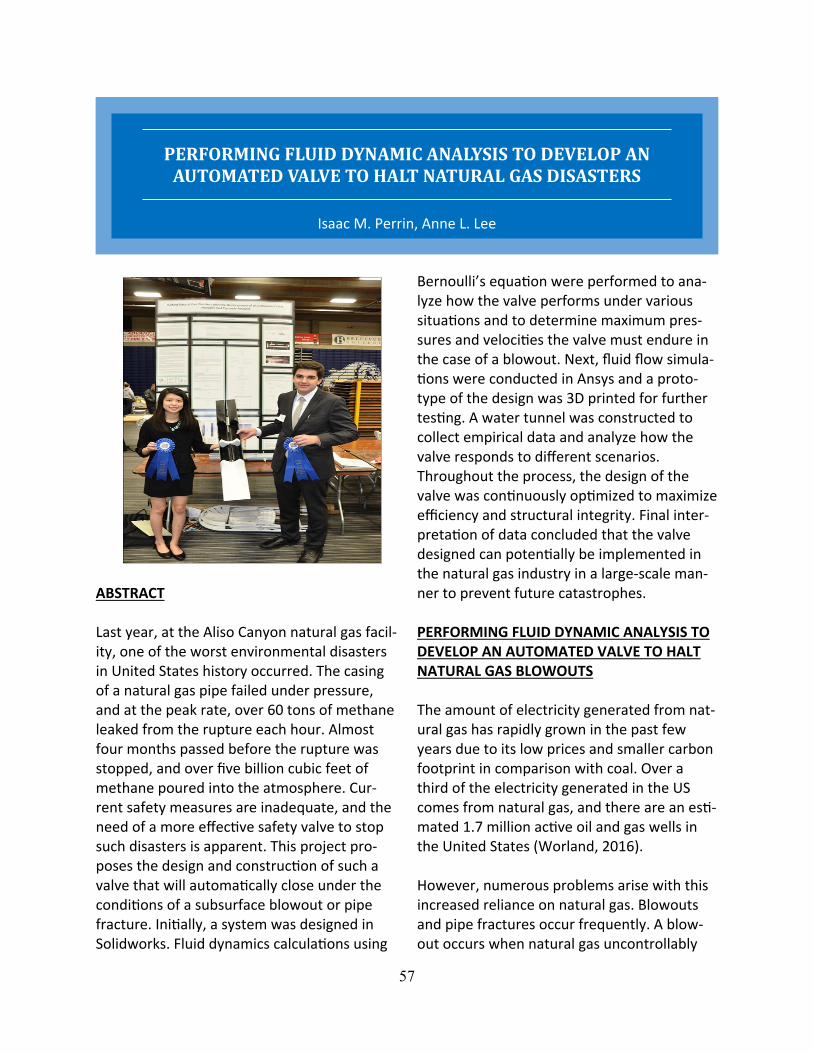
57
ABSTRACT Last year, at the Aliso Canyon natural gas facil-ity, one of the worst environmental disasters in United States history occurred. The casing of a natural gas pipe failed under pressure, and at the peak rate, over 60 tons of methane leaked from the rupture each hour. Almost four months passed before the rupture was stopped, and over five billion cubic feet of methane poured into the atmosphere. Cur-rent safety measures are inadequate, and the need of a more effective safety valve to stop such disasters is apparent. This project pro-poses the design and construction of such a valve that will automatically close under the conditions of a subsurface blowout or pipe fracture. Initially, a system was designed in Solidworks. Fluid dynamics calculations using
Bernoulli’s equation were performed to ana-lyze how the valve performs under various situations and to determine maximum pres-sures and velocities the valve must endure in the case of a blowout. Next, fluid flow simula-tions were conducted in Ansys and a proto-type of the design was 3D printed for further testing. A water tunnel was constructed to collect empirical data and analyze how the valve responds to different scenarios. Throughout the process, the design of the valve was continuously optimized to maximize efficiency and structural integrity. Final inter-pretation of data concluded that the valve designed can potentially be implemented in the natural gas industry in a large-scale man-ner to prevent future catastrophes. PERFORMING FLUID DYNAMIC ANALYSIS TO DEVELOP AN AUTOMATED VALVE TO HALT NATURAL GAS BLOWOUTS The amount of electricity generated from nat-ural gas has rapidly grown in the past few years due to its low prices and smaller carbon footprint in comparison with coal. Over a third of the electricity generated in the US comes from natural gas, and there are an esti-mated 1.7 million active oil and gas wells in the United States (Worland, 2016). However, numerous problems arise with this increased reliance on natural gas. Blowouts and pipe fractures occur frequently. A blow-out occurs when natural gas uncontrollably
PERFORMING FLUID DYNAMIC ANALYSIS TO DEVELOP AN AUTOMATED VALVE TO HALT NATURAL GAS DISASTERS
Isaac M. Perrin, Anne L. Lee
58
flows out from a well. Additionally, countless natural gas leaks occur around the country, though many go unreported. Mark Brown-stein, Vice President of the Environmental De-fense Fund’s climate and energy program, states that “unlike an oil spill, [a natural gas leak is] not immediately apparent to the gen-eral public that something’s amiss” (Rich, 2016). Natural gas is mostly composed of me-thane. A 2014 study by Stanford University suggested that methane emissions within the United States may be as much as 50 percent higher than the numbers reported by the En-vironmental Protection Agency (EPA) (Worland, 2016). The current natural gas blowout prevention systems are unreliable, and must be improved to prevent further dis-asters from occurring in the future. This pro-ject proposes the design of an automated safety valve that can halt natural gas blowout disasters. BACKGROUND LITERATURE REVIEW Currently, there are already several safety measures to prevent blowout disasters. Sub-surface safety valves (SSSV) can control the flow of methane in the case of a pipe failure or blowout. Though some natural gas drilling companies have employed these safety valves, many states only require these valves for wells within 300 feet of residential areas or within 100 feet of wilderness preserves and recreational areas (Ponsot, 2016). In addition, these valves are not an adequate safety meas-ure for preventing natural gas disasters. Most of the time, the safety valves are open to allow for the flow of natural gas, but the valves can close in the case of a blowout or other emergency situation. Two of the most common valves include the ball valve and the flapper valve, but both these current systems rely on hydraulic lines to actuate the internal
mechanisms that shut off the pipe, and can-not perform without active system control (Rich, 2016). In the case of larger blowouts, control over the valves can be completely lost, rendering the valve inoperable. When blowout preventers and all other safety measures fail, relief wells are drilled to inter-sect the leak of the well. Specialized liquids, often drilling mud and cement, are pumped down the relief well to stop the uncontrolla-ble flow by the damaged well. Current safety measures to prevent natural gas blowouts are clearly inadequate. There is tremendous need for the development of an innovative safety valve that will immediately shut off in the case of disaster without human interaction, leaving no room for human error. CASE STUDY: ALISO CANYON NATURAL GAS DISASTER On October 23, 2015, Southern California Gas (SoCalGas) informed the state of California of a massive natural gas leak at the Aliso Canyon natural gas storage facility. When the casing of the pipe failed under high pressure, the blowout of a wellhead that was connected to a vast underground natural gas storage sys-tem caused a massive leak. It took 112 days of efforts to finally stop the uncontrolled flow of natural gas, making the Aliso Canyon natural gas leak the worst accidental discharge of nat-ural gas in US history. The climate impact from the natural gas leak has had the largest climate impact for any single incident in US history as well, with a carbon footprint much larger than that of the disastrous Deepwater Horizon oil spill.

59
Figure 2. Bird’s Eye View of Aliso Canyon Dis-aster (Landon, 2015). At its peak, over 50,000 kg (60 tons) of gas leaked in a single hour. Over the course of the five months, over five billion cubic feet of me-thane was poured into the atmosphere. This is equivalent to the release of over 9 million metric tons of carbon dioxide or the burning of over one billion gallons of gasoline. The total emissions from the Aliso Canyon leak is equivalent to the annual methane emissions from a middle-sized European country. Alt-hough methane quickly dissipates into the atmosphere, its global warming potential is 84 times more potent than carbon dioxide. Hence, the emissions from the leak is calculat-ed to be equivalent to the annual emissions from nearly 600,000 cars.
Figure 3. Amount of methane leaked from Aliso Canyon (Rakker, 2017).
ENGINEERING GOALS The goal of this project is to design and con-struct a system that stop the flow of natural gas in the case of a disaster, such as the one at Aliso Canyon. A valve will be initially creat-ed on Solidworks, a Computer Aided Design software. Next, fluid dynamics analysis will be performed in Ansys. A prototype of the de-sign will be 3D printed for further analysis and testing for empirical data collection. The proposed system must have the structur-al integrity to withstand tremendous amounts of pressure. In addition, the cost of constructing such a design must be cost effective, with the potential to be applied to the natural gas industry in an economically feasible manner. Another objective of the project is for the constructed design to be automated. The valve will automatically close if a pipe begins to leak, leaving no room for human error. PROCEDURE OVERVIEW This project was divided into four main stag-es, as described below. The pressures and velocities that the valve must endure were calculated using Bernoulli’s equation, and were later used to design the valve and per-form fluid flow simulations. A prototype of a system was designed in Solidworks, and fluid dynamics simulations were run in Ansys. The design was repeatedly iterated throughout this process, and finally, empirical data was collected through testing of a physical proto-type through the use of a water tunnel sys-tem.
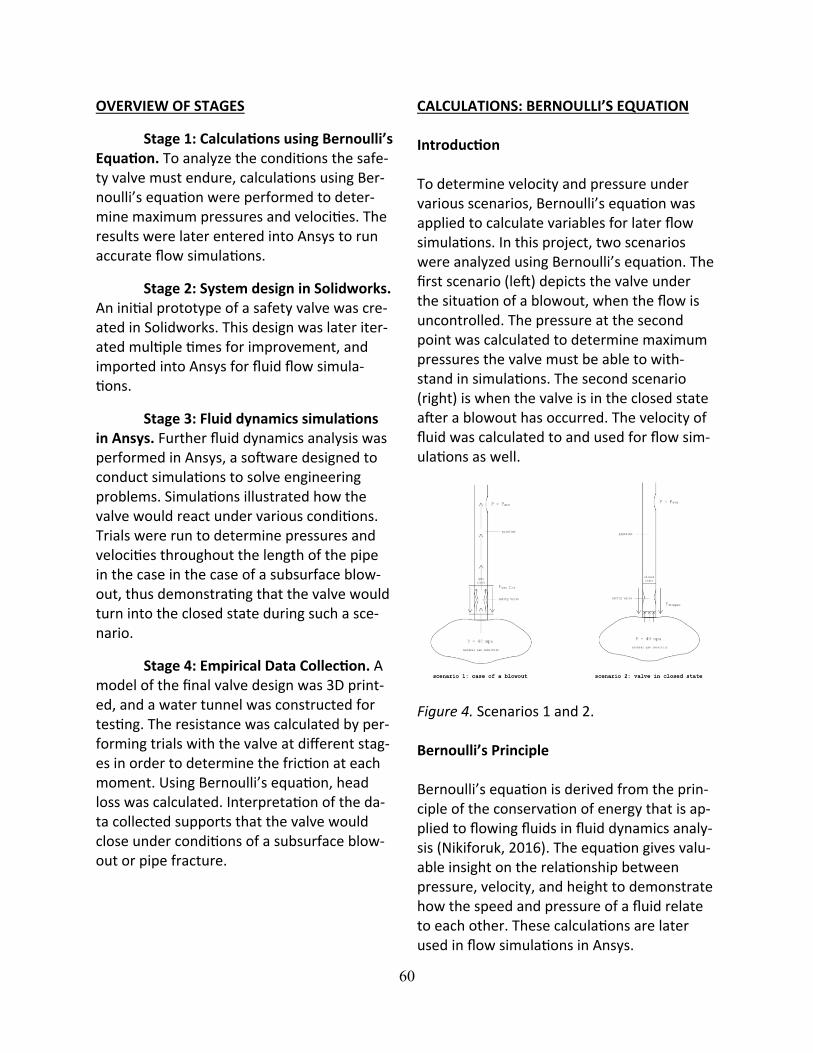
60
OVERVIEW OF STAGES
Stage 1: Calculations using Bernoulli’s Equation. To analyze the conditions the safe-ty valve must endure, calculations using Ber-noulli’s equation were performed to deter-mine maximum pressures and velocities. The results were later entered into Ansys to run accurate flow simulations.
Stage 2: System design in Solidworks. An initial prototype of a safety valve was cre-ated in Solidworks. This design was later iter-ated multiple times for improvement, and imported into Ansys for fluid flow simula-tions.
Stage 3: Fluid dynamics simulations in Ansys. Further fluid dynamics analysis was performed in Ansys, a software designed to conduct simulations to solve engineering problems. Simulations illustrated how the valve would react under various conditions. Trials were run to determine pressures and velocities throughout the length of the pipe in the case in the case of a subsurface blow-out, thus demonstrating that the valve would turn into the closed state during such a sce-nario.
Stage 4: Empirical Data Collection. A model of the final valve design was 3D print-ed, and a water tunnel was constructed for testing. The resistance was calculated by per-forming trials with the valve at different stag-es in order to determine the friction at each moment. Using Bernoulli’s equation, head loss was calculated. Interpretation of the da-ta collected supports that the valve would close under conditions of a subsurface blow-out or pipe fracture.
CALCULATIONS: BERNOULLI’S EQUATION Introduction To determine velocity and pressure under various scenarios, Bernoulli’s equation was applied to calculate variables for later flow simulations. In this project, two scenarios were analyzed using Bernoulli’s equation. The first scenario (left) depicts the valve under the situation of a blowout, when the flow is uncontrolled. The pressure at the second point was calculated to determine maximum pressures the valve must be able to with-stand in simulations. The second scenario (right) is when the valve is in the closed state after a blowout has occurred. The velocity of fluid was calculated to and used for flow sim-ulations as well.
Figure 4. Scenarios 1 and 2. Bernoulli’s Principle Bernoulli’s equation is derived from the prin-ciple of the conservation of energy that is ap-plied to flowing fluids in fluid dynamics analy-sis (Nikiforuk, 2016). The equation gives valu-able insight on the relationship between pressure, velocity, and height to demonstrate how the speed and pressure of a fluid relate to each other. These calculations are later used in flow simulations in Ansys.

61
Figure 5. Bernoulli’s equation. Solving for the First Scenario
Figure 9. Solving for pressure in the first scenario using Bernoulli’s equation.

62
Solving for the Second Scenario
Figure 10. Solving for velocity in the second scenario using Bernoulli’s equation
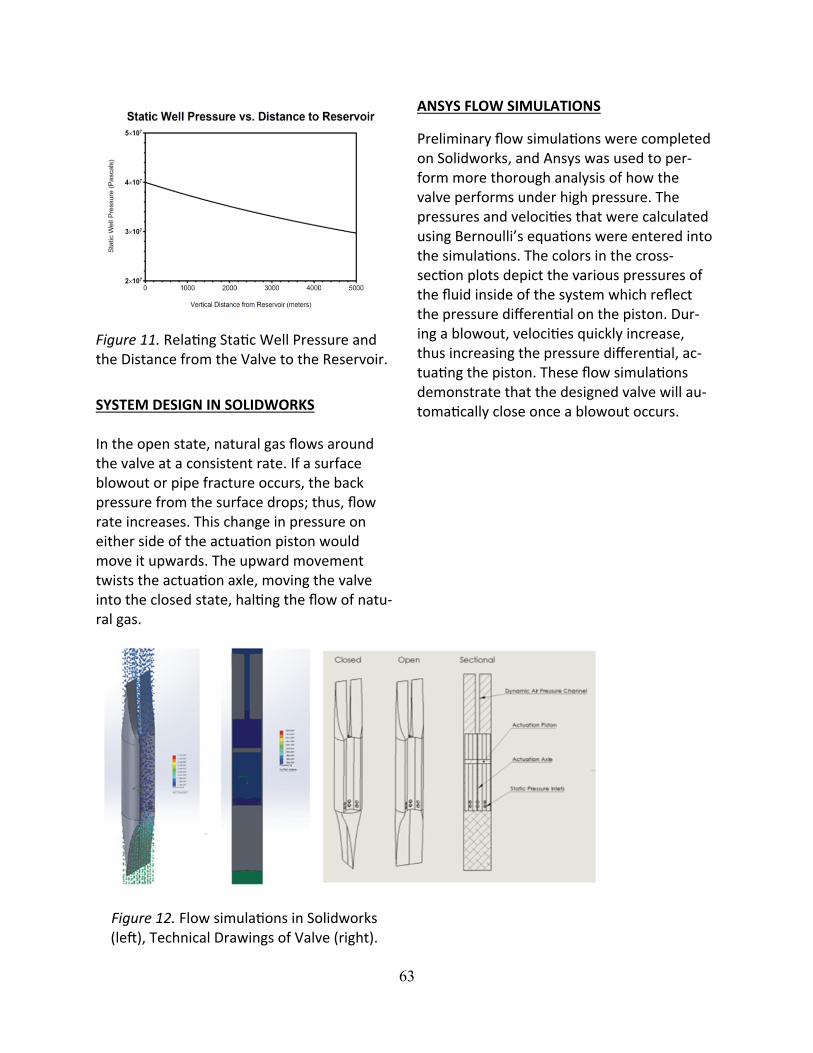
63
Figure 11. Relating Static Well Pressure and the Distance from the Valve to the Reservoir.
SYSTEM DESIGN IN SOLIDWORKS In the open state, natural gas flows around the valve at a consistent rate. If a surface blowout or pipe fracture occurs, the back pressure from the surface drops; thus, flow rate increases. This change in pressure on either side of the actuation piston would move it upwards. The upward movement twists the actuation axle, moving the valve into the closed state, halting the flow of natu-ral gas.
Figure 12. Flow simulations in Solidworks (left), Technical Drawings of Valve (right).
ANSYS FLOW SIMULATIONS
Preliminary flow simulations were completed on Solidworks, and Ansys was used to per-form more thorough analysis of how the valve performs under high pressure. The pressures and velocities that were calculated using Bernoulli’s equations were entered into the simulations. The colors in the cross-section plots depict the various pressures of the fluid inside of the system which reflect the pressure differential on the piston. Dur-ing a blowout, velocities quickly increase, thus increasing the pressure differential, ac-tuating the piston. These flow simulations demonstrate that the designed valve will au-tomatically close once a blowout occurs.
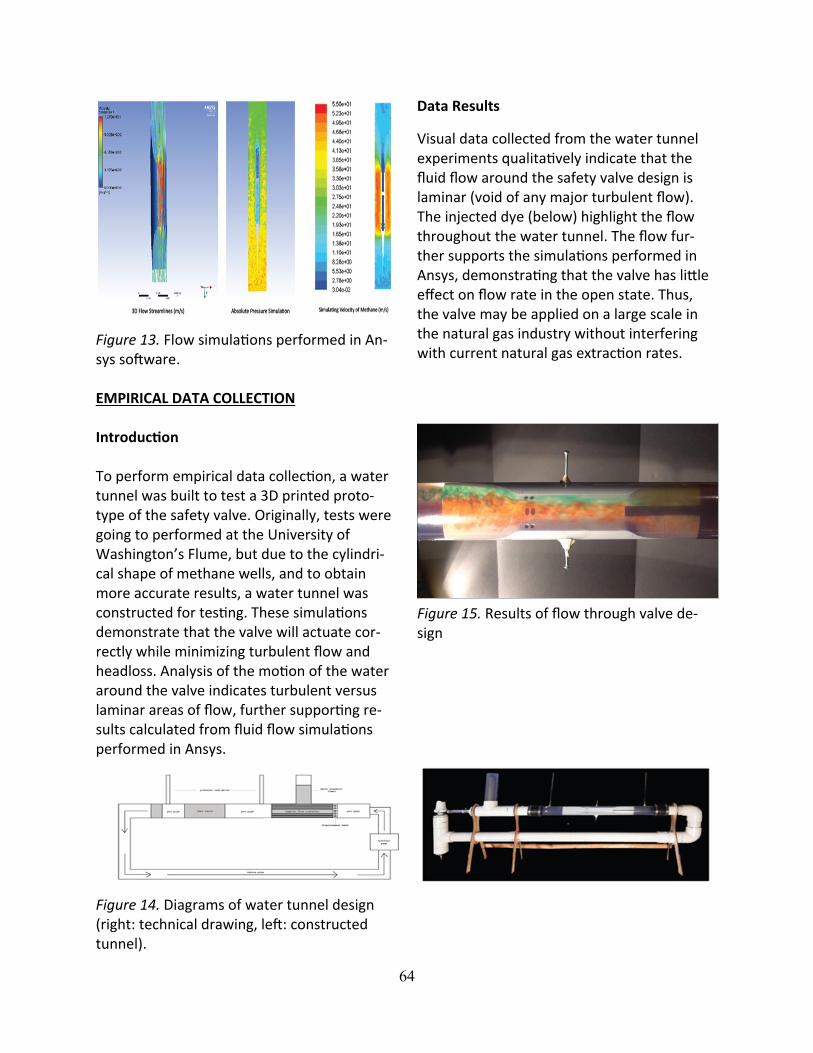
64
Figure 13. Flow simulations performed in An-sys software. EMPIRICAL DATA COLLECTION Introduction To perform empirical data collection, a water tunnel was built to test a 3D printed proto-type of the safety valve. Originally, tests were going to performed at the University of Washington’s Flume, but due to the cylindri-cal shape of methane wells, and to obtain more accurate results, a water tunnel was constructed for testing. These simulations demonstrate that the valve will actuate cor-rectly while minimizing turbulent flow and headloss. Analysis of the motion of the water around the valve indicates turbulent versus laminar areas of flow, further supporting re-sults calculated from fluid flow simulations performed in Ansys.
Figure 14. Diagrams of water tunnel design (right: technical drawing, left: constructed tunnel).
Data Results
Visual data collected from the water tunnel experiments qualitatively indicate that the fluid flow around the safety valve design is laminar (void of any major turbulent flow). The injected dye (below) highlight the flow throughout the water tunnel. The flow fur-ther supports the simulations performed in Ansys, demonstrating that the valve has little effect on flow rate in the open state. Thus, the valve may be applied on a large scale in the natural gas industry without interfering with current natural gas extraction rates.
Figure 15. Results of flow through valve de-sign
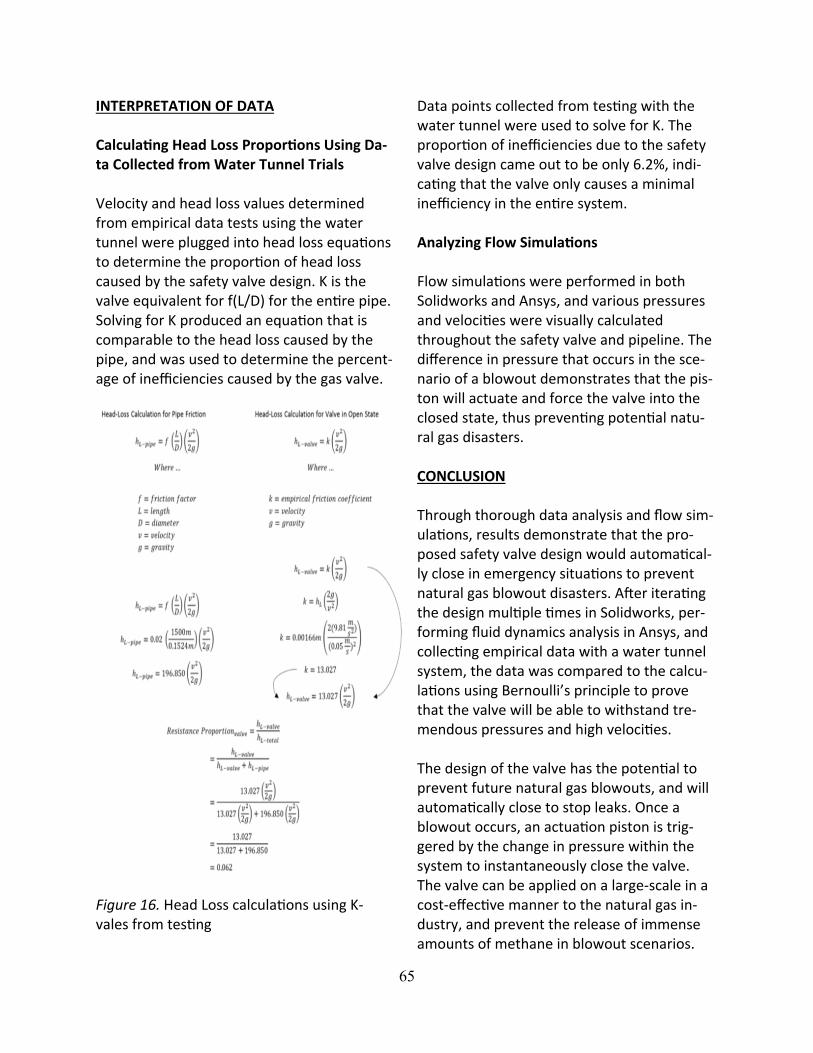
65
INTERPRETATION OF DATA Calculating Head Loss Proportions Using Da-ta Collected from Water Tunnel Trials Velocity and head loss values determined from empirical data tests using the water tunnel were plugged into head loss equations to determine the proportion of head loss caused by the safety valve design. K is the valve equivalent for f(L/D) for the entire pipe. Solving for K produced an equation that is comparable to the head loss caused by the pipe, and was used to determine the percent-age of inefficiencies caused by the gas valve.
Figure 16. Head Loss calculations using K-vales from testing
Data points collected from testing with the water tunnel were used to solve for K. The proportion of inefficiencies due to the safety valve design came out to be only 6.2%, indi-cating that the valve only causes a minimal inefficiency in the entire system. Analyzing Flow Simulations Flow simulations were performed in both Solidworks and Ansys, and various pressures and velocities were visually calculated throughout the safety valve and pipeline. The difference in pressure that occurs in the sce-nario of a blowout demonstrates that the pis-ton will actuate and force the valve into the closed state, thus preventing potential natu-ral gas disasters. CONCLUSION Through thorough data analysis and flow sim-ulations, results demonstrate that the pro-posed safety valve design would automatical-ly close in emergency situations to prevent natural gas blowout disasters. After iterating the design multiple times in Solidworks, per-forming fluid dynamics analysis in Ansys, and collecting empirical data with a water tunnel system, the data was compared to the calcu-lations using Bernoulli’s principle to prove that the valve will be able to withstand tre-mendous pressures and high velocities. The design of the valve has the potential to prevent future natural gas blowouts, and will automatically close to stop leaks. Once a blowout occurs, an actuation piston is trig-gered by the change in pressure within the system to instantaneously close the valve. The valve can be applied on a large-scale in a cost-effective manner to the natural gas in-dustry, and prevent the release of immense amounts of methane in blowout scenarios.
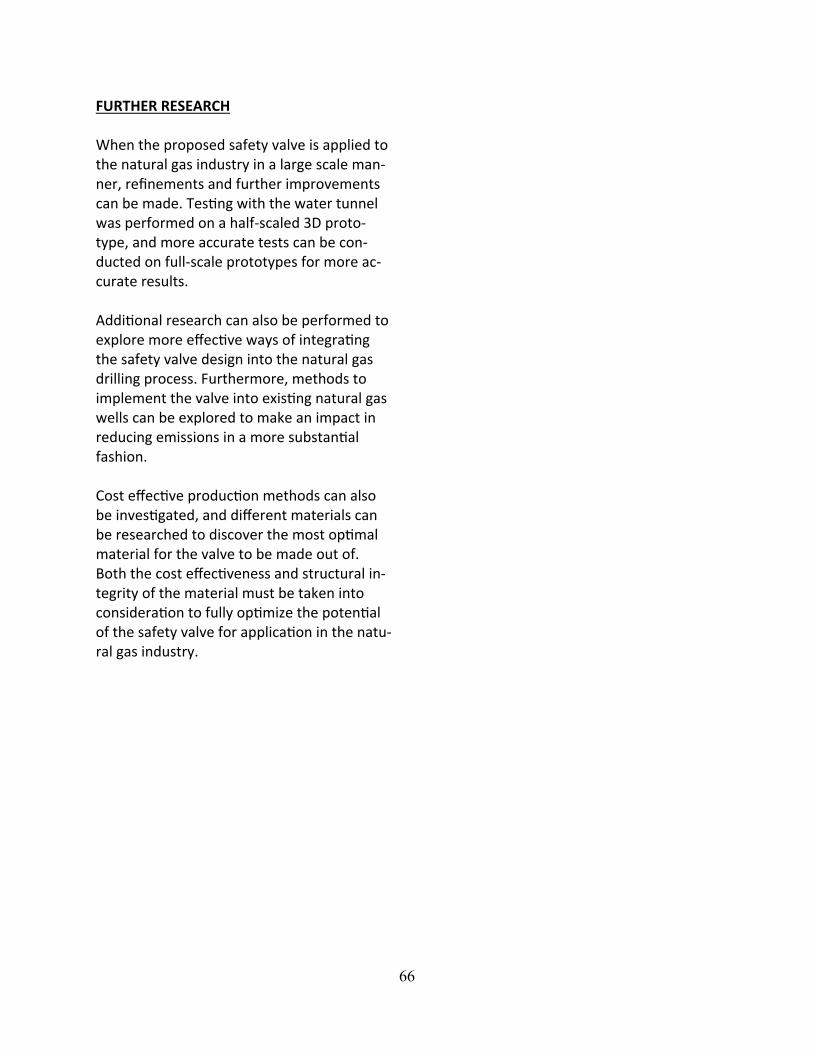
66
FURTHER RESEARCH When the proposed safety valve is applied to the natural gas industry in a large scale man-ner, refinements and further improvements can be made. Testing with the water tunnel was performed on a half-scaled 3D proto-type, and more accurate tests can be con-ducted on full-scale prototypes for more ac-curate results. Additional research can also be performed to explore more effective ways of integrating the safety valve design into the natural gas drilling process. Furthermore, methods to implement the valve into existing natural gas wells can be explored to make an impact in reducing emissions in a more substantial fashion. Cost effective production methods can also be investigated, and different materials can be researched to discover the most optimal material for the valve to be made out of. Both the cost effectiveness and structural in-tegrity of the material must be taken into consideration to fully optimize the potential of the safety valve for application in the natu-ral gas industry.
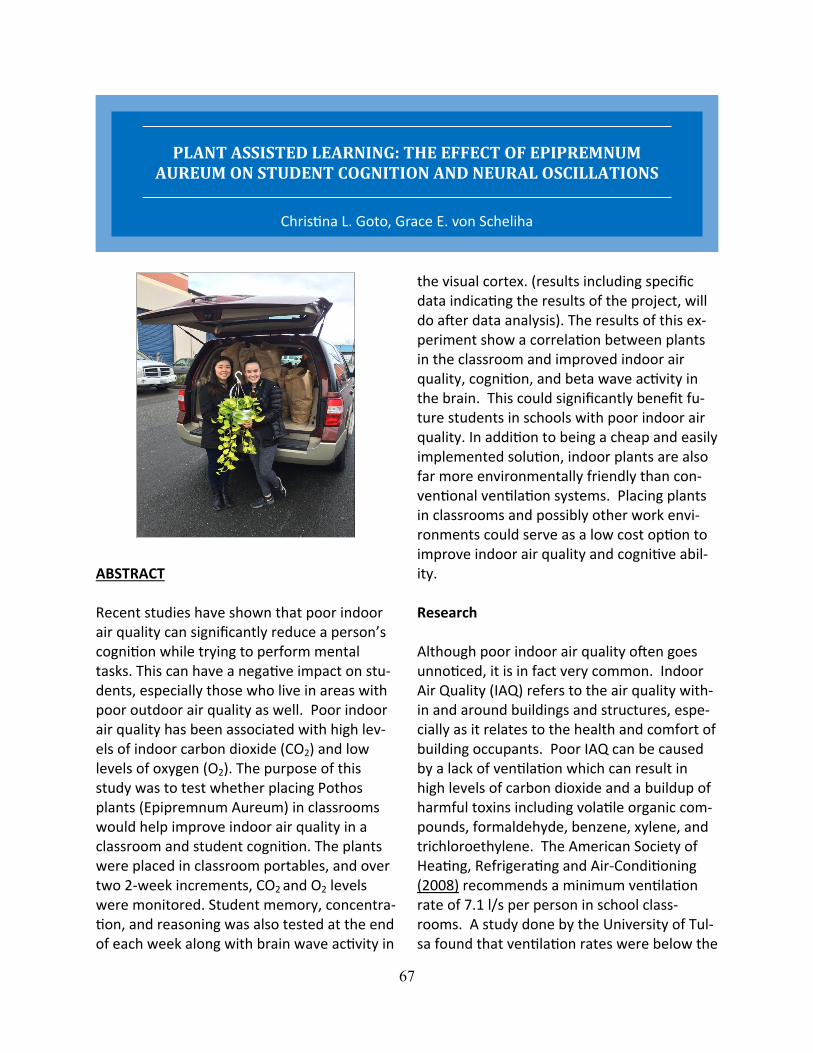
67
ABSTRACT Recent studies have shown that poor indoor air quality can significantly reduce a person’s cognition while trying to perform mental tasks. This can have a negative impact on stu-dents, especially those who live in areas with poor outdoor air quality as well. Poor indoor air quality has been associated with high lev-els of indoor carbon dioxide (CO2) and low levels of oxygen (O2). The purpose of this study was to test whether placing Pothos plants (Epipremnum Aureum) in classrooms would help improve indoor air quality in a classroom and student cognition. The plants were placed in classroom portables, and over two 2-week increments, CO2 and O2 levels were monitored. Student memory, concentra-tion, and reasoning was also tested at the end of each week along with brain wave activity in
the visual cortex. (results including specific data indicating the results of the project, will do after data analysis). The results of this ex-periment show a correlation between plants in the classroom and improved indoor air quality, cognition, and beta wave activity in the brain. This could significantly benefit fu-ture students in schools with poor indoor air quality. In addition to being a cheap and easily implemented solution, indoor plants are also far more environmentally friendly than con-ventional ventilation systems. Placing plants in classrooms and possibly other work envi-ronments could serve as a low cost option to improve indoor air quality and cognitive abil-ity. Research Although poor indoor air quality often goes unnoticed, it is in fact very common. Indoor Air Quality (IAQ) refers to the air quality with-in and around buildings and structures, espe-cially as it relates to the health and comfort of building occupants. Poor IAQ can be caused by a lack of ventilation which can result in high levels of carbon dioxide and a buildup of harmful toxins including volatile organic com-pounds, formaldehyde, benzene, xylene, and trichloroethylene. The American Society of Heating, Refrigerating and Air-Conditioning (2008) recommends a minimum ventilation rate of 7.1 l/s per person in school class-rooms. A study done by the University of Tul-sa found that ventilation rates were below the
PLANT ASSISTED LEARNING: THE EFFECT OF EPIPREMNUM AUREUM ON STUDENT COGNITION AND NEURAL OSCILLATIONS
Christina L. Goto, Grace E. von Scheliha
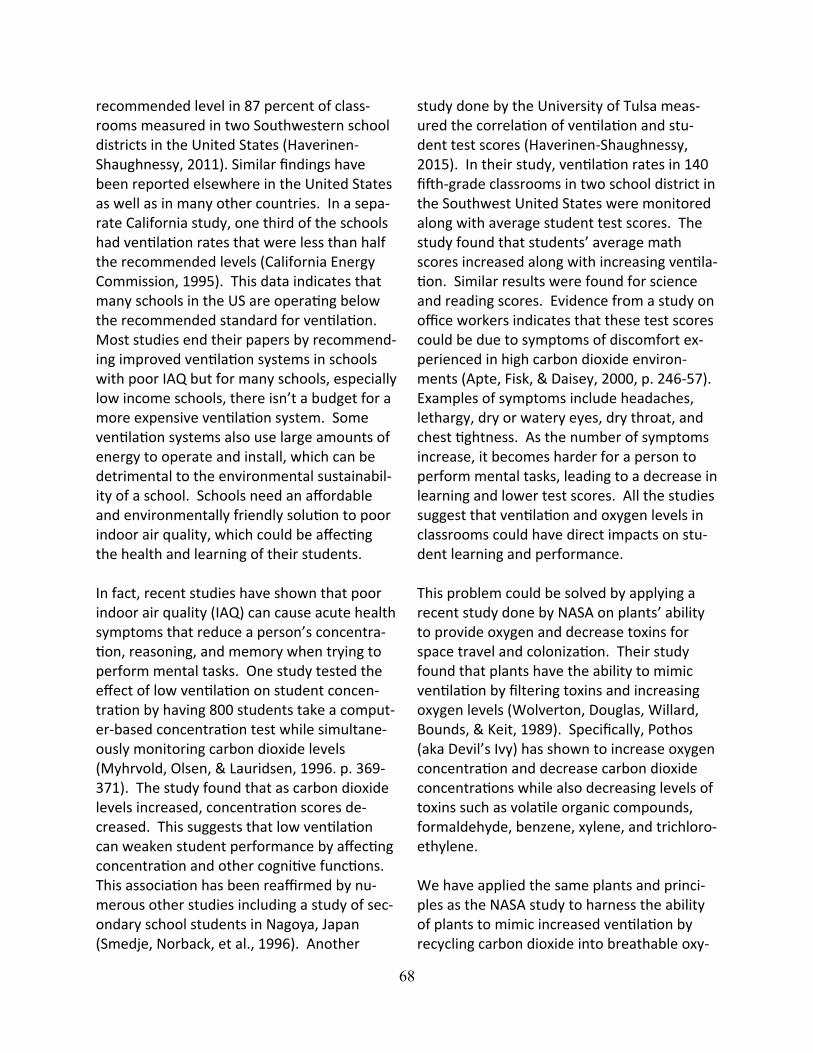
68
recommended level in 87 percent of class-rooms measured in two Southwestern school districts in the United States (Haverinen-Shaughnessy, 2011). Similar findings have been reported elsewhere in the United States as well as in many other countries. In a sepa-rate California study, one third of the schools had ventilation rates that were less than half the recommended levels (California Energy Commission, 1995). This data indicates that many schools in the US are operating below the recommended standard for ventilation. Most studies end their papers by recommend-ing improved ventilation systems in schools with poor IAQ but for many schools, especially low income schools, there isn’t a budget for a more expensive ventilation system. Some ventilation systems also use large amounts of energy to operate and install, which can be detrimental to the environmental sustainabil-ity of a school. Schools need an affordable and environmentally friendly solution to poor indoor air quality, which could be affecting the health and learning of their students. In fact, recent studies have shown that poor indoor air quality (IAQ) can cause acute health symptoms that reduce a person’s concentra-tion, reasoning, and memory when trying to perform mental tasks. One study tested the effect of low ventilation on student concen-tration by having 800 students take a comput-er-based concentration test while simultane-ously monitoring carbon dioxide levels (Myhrvold, Olsen, & Lauridsen, 1996. p. 369-371). The study found that as carbon dioxide levels increased, concentration scores de-creased. This suggests that low ventilation can weaken student performance by affecting concentration and other cognitive functions. This association has been reaffirmed by nu-merous other studies including a study of sec-ondary school students in Nagoya, Japan (Smedje, Norback, et al., 1996). Another
study done by the University of Tulsa meas-ured the correlation of ventilation and stu-dent test scores (Haverinen-Shaughnessy, 2015). In their study, ventilation rates in 140 fifth-grade classrooms in two school district in the Southwest United States were monitored along with average student test scores. The study found that students’ average math scores increased along with increasing ventila-tion. Similar results were found for science and reading scores. Evidence from a study on office workers indicates that these test scores could be due to symptoms of discomfort ex-perienced in high carbon dioxide environ-ments (Apte, Fisk, & Daisey, 2000, p. 246-57). Examples of symptoms include headaches, lethargy, dry or watery eyes, dry throat, and chest tightness. As the number of symptoms increase, it becomes harder for a person to perform mental tasks, leading to a decrease in learning and lower test scores. All the studies suggest that ventilation and oxygen levels in classrooms could have direct impacts on stu-dent learning and performance. This problem could be solved by applying a recent study done by NASA on plants’ ability to provide oxygen and decrease toxins for space travel and colonization. Their study found that plants have the ability to mimic ventilation by filtering toxins and increasing oxygen levels (Wolverton, Douglas, Willard, Bounds, & Keit, 1989). Specifically, Pothos (aka Devil’s Ivy) has shown to increase oxygen concentration and decrease carbon dioxide concentrations while also decreasing levels of toxins such as volatile organic compounds, formaldehyde, benzene, xylene, and trichloro-ethylene. We have applied the same plants and princi-ples as the NASA study to harness the ability of plants to mimic increased ventilation by recycling carbon dioxide into breathable oxy-
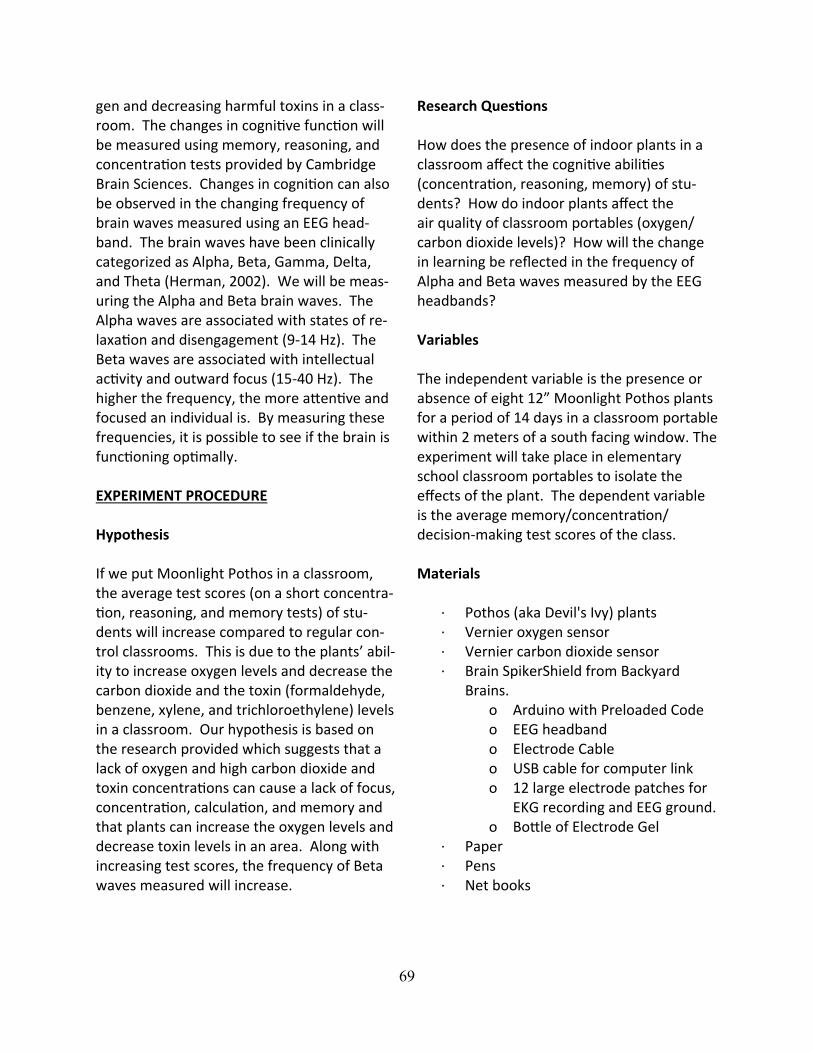
69
gen and decreasing harmful toxins in a class-room. The changes in cognitive function will be measured using memory, reasoning, and concentration tests provided by Cambridge Brain Sciences. Changes in cognition can also be observed in the changing frequency of brain waves measured using an EEG head-band. The brain waves have been clinically categorized as Alpha, Beta, Gamma, Delta, and Theta (Herman, 2002). We will be meas-uring the Alpha and Beta brain waves. The Alpha waves are associated with states of re-laxation and disengagement (9-14 Hz). The Beta waves are associated with intellectual activity and outward focus (15-40 Hz). The higher the frequency, the more attentive and focused an individual is. By measuring these frequencies, it is possible to see if the brain is functioning optimally. EXPERIMENT PROCEDURE Hypothesis If we put Moonlight Pothos in a classroom, the average test scores (on a short concentra-tion, reasoning, and memory tests) of stu-dents will increase compared to regular con-trol classrooms. This is due to the plants’ abil-ity to increase oxygen levels and decrease the carbon dioxide and the toxin (formaldehyde, benzene, xylene, and trichloroethylene) levels in a classroom. Our hypothesis is based on the research provided which suggests that a lack of oxygen and high carbon dioxide and toxin concentrations can cause a lack of focus, concentration, calculation, and memory and that plants can increase the oxygen levels and decrease toxin levels in an area. Along with increasing test scores, the frequency of Beta waves measured will increase.
Research Questions How does the presence of indoor plants in a classroom affect the cognitive abilities (concentration, reasoning, memory) of stu-dents? How do indoor plants affect the air quality of classroom portables (oxygen/carbon dioxide levels)? How will the change in learning be reflected in the frequency of Alpha and Beta waves measured by the EEG headbands? Variables The independent variable is the presence or absence of eight 12” Moonlight Pothos plants for a period of 14 days in a classroom portable within 2 meters of a south facing window. The experiment will take place in elementary school classroom portables to isolate the effects of the plant. The dependent variable is the average memory/concentration/decision-making test scores of the class. Materials
· Pothos (aka Devil's Ivy) plants · Vernier oxygen sensor · Vernier carbon dioxide sensor · Brain SpikerShield from Backyard
Brains. o Arduino with Preloaded Code o EEG headband o Electrode Cable o USB cable for computer link o 12 large electrode patches for
EKG recording and EEG ground. o Bottle of Electrode Gel
· Paper · Pens · Net books

70
Procedure
1. Distribute permission slips to students. Permission slips include information about the experiment, testing meth-ods that will be used on students and a space for student and parent signa-tures. Participation will be voluntary and all parents/guardians and students will reserve the right to withdraw from the study at any time for any reason without penalty.
2. Using a random number generator, classrooms will be randomly assigned to conduct either experimental or con-trol trials for the first two weeks. The experimental classrooms will be called Group A and the control classrooms will be called Group B.
3. Carbon dioxide and oxygen probes will be recalibrated prior to testing.
4. The initial carbon dioxide and oxygen concentration in each classroom will then be measured and recorded by teachers at times 8:30 am, 11:30 am, and 3:20 pm using carbon dioxide and oxygen probes.
5. Students should be given the online concentration/memory/reasoning tests.
a) At 11:00am, teachers give stu-dents links to take tests.
b) Classroom should be silent and everyone in the classroom should start at the same time.
c) Immediately after completing each test, students should rec-ord their scores on a sheet of paper, turned face down.
d) The teacher will collect the pa-pers.
e) Students should be instructed not to discuss scores.
f) Students should be instructed not to practice the tests at home.
6. Place 24 Epipremnum Aureum plants in Group A’s classrooms within two meters of a
window. The amount of plants are determined by the volume of the class (3 8" plants per 100 square feet). Group B classrooms stay the same.
7. After one week, the carbon dioxide concentrations will be measured and recorded again in both control and ex-perimental classrooms. Students in both groups will be asked to take the memory, concentration, and decision-making tests from www.cambridgebrainsciences.com at 11 am and their scores will be record-ed.
8. After one more week the carbon diox-ide concentrations will be measured and recorded again in both control and experimental classrooms. Students in both groups will be asked to take the memory, concentration, and decision-making tests from www.cambridgebrainsciences.com at 11 am and their scores will be record-ed.
9. The plants will then be removed from the experimental classrooms.
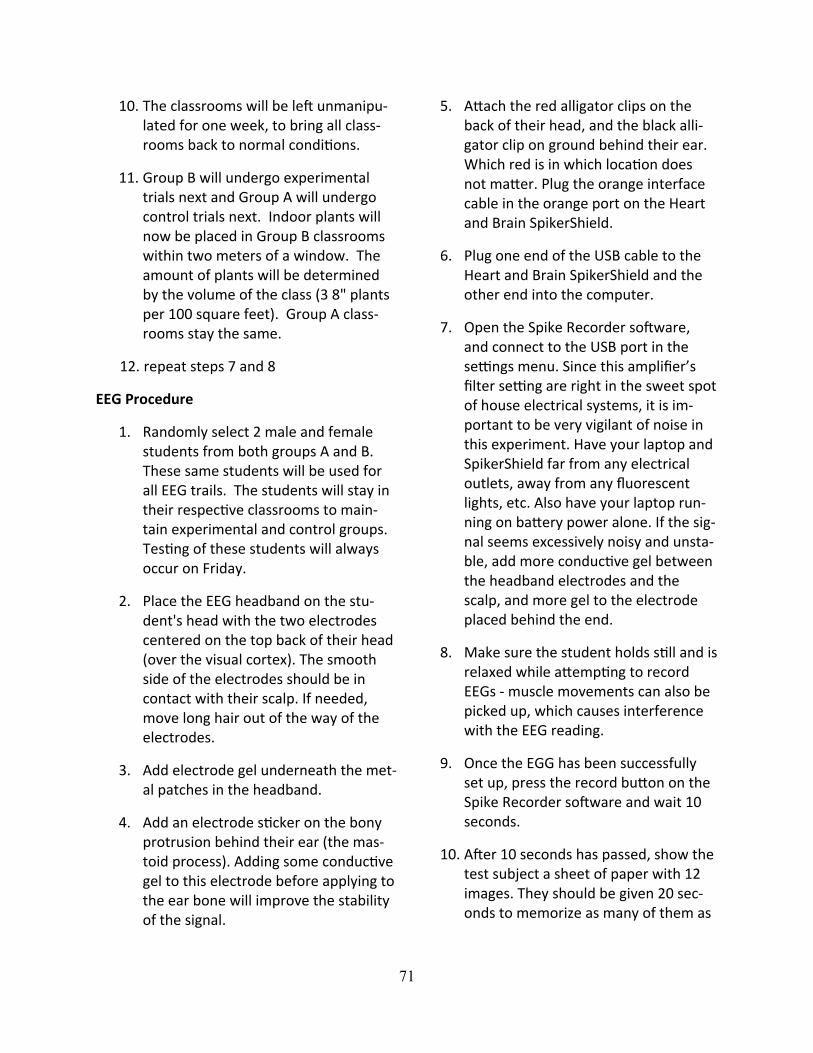
71
10. The classrooms will be left unmanipu-lated for one week, to bring all class-rooms back to normal conditions.
11. Group B will undergo experimental trials next and Group A will undergo control trials next. Indoor plants will now be placed in Group B classrooms within two meters of a window. The amount of plants will be determined by the volume of the class (3 8" plants per 100 square feet). Group A class-rooms stay the same.
12. repeat steps 7 and 8
EEG Procedure
1. Randomly select 2 male and female students from both groups A and B. These same students will be used for all EEG trails. The students will stay in their respective classrooms to main-tain experimental and control groups. Testing of these students will always occur on Friday.
2. Place the EEG headband on the stu-dent's head with the two electrodes centered on the top back of their head (over the visual cortex). The smooth side of the electrodes should be in contact with their scalp. If needed, move long hair out of the way of the electrodes.
3. Add electrode gel underneath the met-al patches in the headband.
4. Add an electrode sticker on the bony protrusion behind their ear (the mas-toid process). Adding some conductive gel to this electrode before applying to the ear bone will improve the stability of the signal.
5. Attach the red alligator clips on the back of their head, and the black alli-gator clip on ground behind their ear. Which red is in which location does not matter. Plug the orange interface cable in the orange port on the Heart and Brain SpikerShield.
6. Plug one end of the USB cable to the Heart and Brain SpikerShield and the other end into the computer.
7. Open the Spike Recorder software, and connect to the USB port in the settings menu. Since this amplifier’s filter setting are right in the sweet spot of house electrical systems, it is im-portant to be very vigilant of noise in this experiment. Have your laptop and SpikerShield far from any electrical outlets, away from any fluorescent lights, etc. Also have your laptop run-ning on battery power alone. If the sig-nal seems excessively noisy and unsta-ble, add more conductive gel between the headband electrodes and the scalp, and more gel to the electrode placed behind the end.
8. Make sure the student holds still and is relaxed while attempting to record EEGs - muscle movements can also be picked up, which causes interference with the EEG reading.
9. Once the EGG has been successfully set up, press the record button on the Spike Recorder software and wait 10 seconds.
10. After 10 seconds has passed, show the test subject a sheet of paper with 12 images. They should be given 20 sec-onds to memorize as many of them as
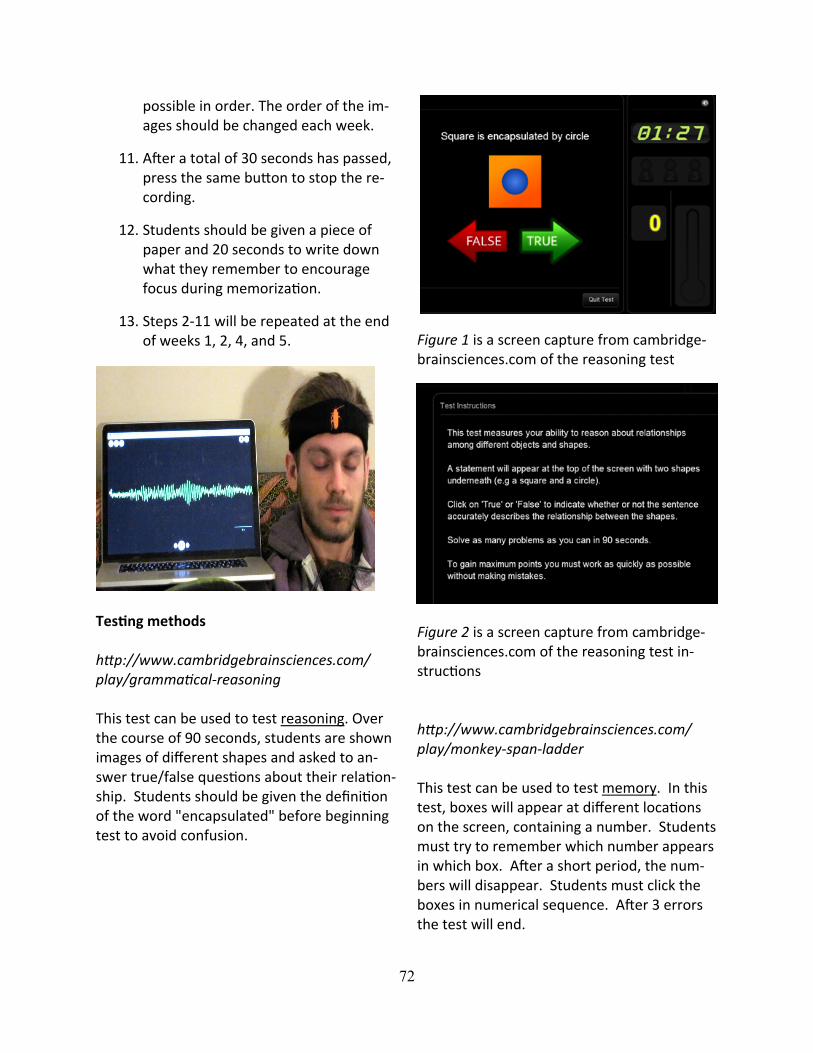
72
possible in order. The order of the im-ages should be changed each week.
11. After a total of 30 seconds has passed, press the same button to stop the re-cording.
12. Students should be given a piece of paper and 20 seconds to write down what they remember to encourage focus during memorization.
13. Steps 2-11 will be repeated at the end of weeks 1, 2, 4, and 5.
Testing methods http://www.cambridgebrainsciences.com/play/grammatical-reasoning This test can be used to test reasoning. Over the course of 90 seconds, students are shown images of different shapes and asked to an-swer true/false questions about their relation-ship. Students should be given the definition of the word "encapsulated" before beginning test to avoid confusion.
Figure 1 is a screen capture from cambridge-brainsciences.com of the reasoning test
Figure 2 is a screen capture from cambridge-brainsciences.com of the reasoning test in-structions http://www.cambridgebrainsciences.com/play/monkey-span-ladder This test can be used to test memory. In this test, boxes will appear at different locations on the screen, containing a number. Students must try to remember which number appears in which box. After a short period, the num-bers will disappear. Students must click the boxes in numerical sequence. After 3 errors the test will end.

73
Figure 3 is a screen capture from cambridge-brainsciences.com of the memory test
Figure 4 is a screen capture from cambridge-brainsciences.com of the memory test instruc-tions http://www.cambridgebrainsciences.com/play/rotation-task This test can be used to test concentra-tion. Two boxes will appear on the screen, each filled with red and green squares. Stu-dents must answer if the squares would be identical if you could rotate one of the pan-els.
Figure 5 is a screen capture from cambridge-brainsciences.com of the concentration test
Figure 6 is a screen capture from cambridge-brainsciences.com of the concentration test instructions
We have received consent from Cambridge Brain Sciences to use these tests in our experi-ment. EXPERIMENTAL ETHICS Human Participants The students tested were between ages 6 to 11 either in grades 2nd/3rd or 5th. They were a variety of races and genders. The races at Al-cott Elementary School are comprised of Asian 51.7%, African American 0.2%, Hispanic 3.5%, Caucasian 41.5%, and two or more rac-es 3.1%. The genders are comprised of male

74
53% and female 47%. Due to age, they are a vulnerable population and any testing will re-quire a parent/guardian’s approval. Recruitment Recruitment will occur at elementary schools in the portable classrooms. Participants will be invited to participate by their teacher. The teacher will hand out consent forms to be signed by a parent/guardian. Methods The methods of the study will be administer-ing 3 short (1 min. 30 sec.) concentration, memory, and reasoning tests. Afterwards participants will be asked to write their score on a piece of paper. Testing will happen once a week for two periods of two weeks each. Students who do not wish to participate will be allowed to read, color, draw, sleep, etc. Risk and Safety There are no health risks to the students or teachers. There is a psychological risk that the students will feel stress while taking the tests because they are timed and scored. We will ask the teachers to emphasize and make clear that the tests are anonymous and the scores are not important. We will also ask the students to not share their scores. This is to prevent any possible stress related to taking the tests. Protection of Privacy Protection of privacy will be ensured by hav-ing all testing be anonymous. Students will take the test and then write on a piece of pa-per their score (without their name). Teach-ers will collect the papers and scores will be totaled. EEG information will be recorded un-
der anonymous student labels. For example, student 1, student 2, student 3 etc. Photo release forms will be sent out. Informed Consent Prior to any testing, informed consent forms will be sent home, requiring student and parent/guardian signatures, acknowledging they understand the experiment and are will-ing to participate. The form will state that participation is voluntary and all parents/guardians and students will reserve the right to withdraw from the experiment at any time for any reason without penalty. Teachers will also inform students at the beginning of the experiment that participation is voluntary. DATA ANALYSIS Cognition and Air Quality Data Analysis The test performed was a cognition test that measured a student’s memory, reasoning, and concentration abilities. This was used to determine the effect of plants on student cog-nition. The data was gathered by having stu-dents complete a memory, reasoning, and concentration test on www.cambridgebrainsciences.com and then having students record their scores on a dis-tributed slip of paper. After documenting all raw data, outliers were omitted by removing all values less than or greater than 4 standard deviations from the mean. According to a staff scientist at Cambridge Brain Sciences, such scores aren’t impossible, but in a sample of our size they are more likely to be errors. The reasons for these errors could be an error in recording of scores or dishonesty of achieved score. The results of the study show a mean increase in memory scores of 0.27805 points which is 4.146%. The standard devia-tion of the change in scores is 0.18893 points.

75
The null hypothesis was that the scores would not be affected by the presence of the plants. This would result in a difference of scores of 0. The null hypothesis, mean value and stand-ard deviation were used to calculate the t-value. The equation for t-value is a one-variable statistics equation: t This equation was used to find a t-value of 3.89. The sample size was 7 classrooms. De-grees of freedom was calculated by using the equation: sample size – 1. The degree of free-dom is 6 (7 classrooms–1= 6). The t-value and degree of freedom were used to calculate the p-value. The p-value is 0.004038. Our alpha level is 0.05. 0.004038 > 0.05 meaning the increase in memory scores is statistically sig-nificant and the null hypothesis can be reject-ed. The same equations and calculations used for analyzing memory data were used for analyz-ing reasoning and concentration. The results of the reasoning test show a mean increase of 0.58158 points which is 5.543%. The standard deviation of the change in scores is 0.33922 points. The t-value is 4.555 and p-value is 0.001936 meaning the increase in reasoning scores is statistically significant and the null hypothesis can be rejected. The results of the concentration test showed a mean increase of 4.37737 points which is 6.011%. The standard deviation of the change in scores is 1.7666 points. The t-value is 6.556 and p-value is 0.000302 meaning the increase in reasoning scores is statistically significant and the null hypothesis can be rejected.
The same equations and calculations were used for analyzing carbon dioxide and oxygen data. The results of the carbon dioxide data show a mean change in the increase of carbon dioxide gas throughout the day of 154.9334 ppm. Standard deviation is 147.153475 ppm. T-value is 2.78563. P-value equals 0.0318 meaning the change in the increase of carbon dioxide throughout the day is statistically sig-nificant. The results of the oxygen data show a mean change in the decrease of oxygen gas throughout the day of 0.22536%. Standard deviation is 0.39297%. T-value is 1.517. P-value is 0.089994 meaning the data is not sta-tistically significant. This could be because of the small sample size which may have allowed for a high standard deviation caused by outli-ers. A greater change in oxygen gas may have been observed if the conditions had been more drastic with overall poorer indoor air quality in the control environment. EEG Data Analysis The EEG brain waves were quantified using the Spiker Recorder app which allows the user to set a range of amplitude and then counts the cycles within that range. The cycles can then be divided by time to calculate frequen-cy. The same equations and calculations used for cognitive tests and air quality data were used for analyzing EEG brain wave frequency data. The results of the EEG brain wave data show that most classes saw an increase in EEG brain wave frequency. The mean change in frequency was 2.098 Hz with a standard devi-ation of 4.055. The t-value was 1.369 and p-value is 0.11. This means the data was not statistically significant. This could be because of the small sample size because we only test-ed two kids from each class. It could also be caused by the fact that we tested brain waves from the visual cortex and not the frontal lobe or temporal lobe which are more closely asso-
76
ciated with learning and memory. A greater increase in brain wave frequency may have been observed if the conditions had been more drastic with overall poorer indoor air quality in the control environment. CONCLUSION We hypothesized that if 24 Moonlight Pothos (Epipremnum Aureum) plants are placed in portable classrooms for two weeks, the in-door carbon dioxide levels would decrease, and the oxygen levels, beta wave activity in the student’s brains, and their scores on memory, concentration, and reasoning tests would all increase. The results of the experi-ment supported the parts of the hypothesis showing that the cognition test scores would increase and carbon dioxide levels would de-crease, but there was not sufficient evidence to show increase in beta brain wave activity or indoor oxygen levels. The carbon dioxide lev-els decreased by a mean of 154.9334 ppm and had a P value of 0.0318. this means that the we can be 99.9682% certain when re-jecting our null hypothesis that plants would have no effect on carbon dioxide levels. Oxy-gen levels increased by a mean of 0.22536% but the P-value was too high for the data to be considered statistically significant. As for the cognitive tests; memory scores increased by 4.146%, Reasoning by 5.543%, and concen-tration by 6.011%. Using p-values we were able to determine that these are all statistical-ly significant. The majority of the classes saw an increase in brainwave frequency with a mean change of 2.098 Hz, but this cannot be considered statistically significant based off of the p-value. There are a few reasons why the EEG brainwave data could have turned out the way it did without any clear results. One reason could be that the EEG Headbands measured brain waves in the visual cortex, and not the frontal lobe or temporal lobe
which are more closely associated with learn-ing and memory. Another reason could be that the sample size was too small because we only tested two students from each class-room each week. It is unclear exactly why the oxygen data did not come out with significant results, but there were some confounding variables that could have played a role. The classrooms already had a fairly high oxygen concentration prior to testing, and it was up to the teachers to decide where in the room they took the tests, so oxygen levels through-out different parts of the room could have varied. A future improvement that could be made in this experiment would be closer su-pervision of the testing. Since the teachers were in charge of making sure the cognition and air quality measurements were taken, there could have been errors in the processes or problems with the technology used. It would also benefit the experiment to increase the sample size and time period. Since the plants were only allowed to sit in each class-room for 2 weeks, there wasn’t very much time for them to show any long-term effects. Overall, this research project was a success and it showed promising results of the bene-fits of indoor plants in classrooms. APPLICATION There are many ways in which this research can be applied to benefit both students, and those in indoor work environments. Although the classroom portables used in this experi-ment did have good indoor air quality to start with, this is not the case everywhere. For ex-ample, schools and offices in big cities already have the disadvantage of poor outdoor air quality. In fact, certain cities including Rome and Phoenix have up to 100 ppm or more of carbon dioxide in the air than the global aver-age of 400 ppm. This can negatively affect the air quality indoors, where there is generally a
77
significantly higher level of carbon dioxide al-ready present. However, it is not only the people in big cities that are hit hard by poor indoor air quality, but also those who just can’t afford efficient air ventilation systems. This is an issue because if fresh air isn’t being circulated into buildings, carbon dioxide can start to build up. This effect can be intensified in schools, where students are sitting and breathing in the same cramped classrooms for hours on end. Since high levels of carbon diox-ide have been shown to significantly decrease mental ability and cognition, this can be very detrimental to student learning. Although this is obviously not a problem that can be solved overnight, there are measures that can be taken to help reduce its impact. If plants were placed in schools, they could serve as a low cost option to reduce carbon dioxide levels in the classrooms. This could also help close the gap between the standard of learning for low income and high income students. Of course this wouldn’t solve everything, but it would be a step forward towards better classroom air quality and equality in classroom condi-tions. It would give lower income families and schools an inexpensive and very environmen-tally friendly tool to help improve their indoor air quality. As a result, both students and office workers alike could improve their con-centration, reasoning, memory and overall cognitive ability.
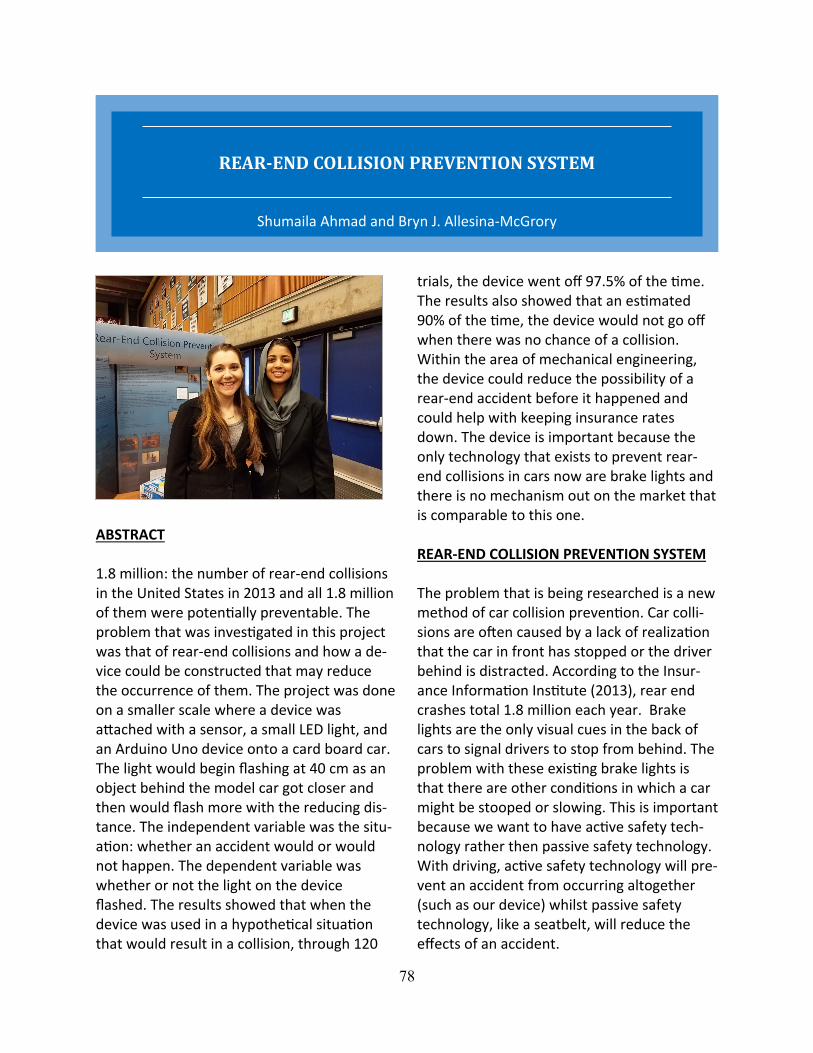
78
ABSTRACT 1.8 million: the number of rear-end collisions in the United States in 2013 and all 1.8 million of them were potentially preventable. The problem that was investigated in this project was that of rear-end collisions and how a de-vice could be constructed that may reduce the occurrence of them. The project was done on a smaller scale where a device was attached with a sensor, a small LED light, and an Arduino Uno device onto a card board car. The light would begin flashing at 40 cm as an object behind the model car got closer and then would flash more with the reducing dis-tance. The independent variable was the situ-ation: whether an accident would or would not happen. The dependent variable was whether or not the light on the device flashed. The results showed that when the device was used in a hypothetical situation that would result in a collision, through 120
trials, the device went off 97.5% of the time. The results also showed that an estimated 90% of the time, the device would not go off when there was no chance of a collision. Within the area of mechanical engineering, the device could reduce the possibility of a rear-end accident before it happened and could help with keeping insurance rates down. The device is important because the only technology that exists to prevent rear-end collisions in cars now are brake lights and there is no mechanism out on the market that is comparable to this one. REAR-END COLLISION PREVENTION SYSTEM The problem that is being researched is a new method of car collision prevention. Car colli-sions are often caused by a lack of realization that the car in front has stopped or the driver behind is distracted. According to the Insur-ance Information Institute (2013), rear end crashes total 1.8 million each year. Brake lights are the only visual cues in the back of cars to signal drivers to stop from behind. The problem with these existing brake lights is that there are other conditions in which a car might be stooped or slowing. This is important because we want to have active safety tech-nology rather then passive safety technology. With driving, active safety technology will pre-vent an accident from occurring altogether (such as our device) whilst passive safety technology, like a seatbelt, will reduce the effects of an accident.
REAR-END COLLISION PREVENTION SYSTEM
Shumaila Ahmad and Bryn J. Allesina-McGrory
79
According to an article published on Consum-er Reports (2015), "crash avoidance systems rely on a variety of sensors, cameras, laser, short- and long-range radar, or combinations of cameras and sensors" and we want to uti-lize sensors in our device. These that can be implemented in to the backs of cars as an add-on in order to sense when another vehicle is too close to the bumper. When the distance is decreased to a certain point, the sensor will rapidly flash an added light that would be in the upper back windshield near where many cars have brake lights currently installed. This would serve as a tool to get the attention of the driver in the car behind. This would also help prevent fender benders caused by dis-tracted drivers, especially ones who choose to text and drive. The driver's attention would be drawn to the flashing light in front of them instead of the distraction that caused them to look away from the road. As most new cars are computerized, we know there will be a certain element of computer science involved; possibly including writing code that would sig-nal the light to come on when the sensor de-tects an object within the set distance. We believe our technology can positively influ-ence the world and society because it will de-crease fender benders and alert drivers to possible collision impacts in front of them. This can be helpful to new drivers especially when learning how soon to slow down or how closely they should be to a vehicle when stopped or slowing. This project will investi-gate a new method of car collision preven-tion. In order to successfully construct the model, an Arduino Uno will be utilized, as well as a model car which will be a scaled version of what the actual product will be used in. This will be designed by first creating the sensor system and then writing the code to be used by the system. First, attach the ultrasonic sen-
sor to the breadboard. Now connect a series of pins on the sensor to the pins on the Ar-duino. Connect the ground pin of the sensor to the ground power of the Arduino Uno and the echo pin of the sensor to pin 12 on the digital side of the Arduino. Connect the trig pin of the sensor to pin 11 on the digital side of the Arduino. Connect the Vcc pin of the sensor to the 5V power of the Arduino. Solder the ground pin of the LED to an extension wire and the power pin of the LED to another extension wire. Connect the extension ground wire to the ground pin on the digital side of the Arduino. Connect the extension power wire to pin 13 on the digital side of the Ar-duino. Place the Arduino and breadboard in to the containment box and secure to the roof of the vehicle or model. Place the light in the rear window of the car. Using Arduino IDE de-fine the placement of the pins that will be used as variables. Define the variables as in-puts or outputs. Within the void loop deter-mine the distance of the object in centimeters using the ultrasonic sensor. Write an if else statement in which if the variable distance is less than 121.92 centimeters (4 feet) and greater than 80 centimeters, then it will flash the light every third of a second. Write anoth-er if else statement in which if the variable distance is less than 79 centimeters and great-er than 40 centimeters, then it will flash the light every sixth of a second. Write an if else statement in which if the variable distance is less than 40 centimeters and greater than 0 centimeters, then it will flash the light every tenth of a second. If the distance is greater than 121.92 centimeters then it will keep the light off. Due to the fact that we are not testing with real cars and rather models, we changed this distance to be 40 centimeters. Write a delay and then have the Arduino use the sensor to detect if an object is within in range again.
80
After constructing the model, it will be time for collecting the data. The data collection will begin by determining a perceived possible dis-tance at which a rear-end collision may occur (the distance when ours started to blink was 40 cm and it blinked faster as an object got closer). This will be an educated guess be-cause so many confounding variables are pre-sent in an actual collision, one cannot discern a specific number that will work for every time. The guess will be based upon gauging the distance a car cannot possibly stop after it has begun rolling and could be from inches to feet. Next, with the designed system fully pre-pared and the code made to cause it to flash, it will be attached to a model car and placed at the end of a treadmill. In order to keep speed conserved, the car will not be remote controlled as they do not always travel at the same speed. The car with the device will be placed at the end of a treadmill with another object of relatively the same size some length away from it. The object will be placed upon the treadmill. Then, the treadmill will be start-ed, with every trail conducted at the same speed (ours was 1 mile per hour), and as the car approaches the determined length of colli-sion, the device will be judged based upon whether the light flashes or not past a certain point. This will be the first situation. The next situation will be with the object stopping be-fore the determined length of collision and, as hypothesized, the device should not go off. The result will be collected and recorded in a data table. The data is stored in sets and each set has 30 trials for each group or situation (would or wouldn't cause an accident). In to-tal, there will be 4 sets and the number of tri-als will be 240, with 120 for the experimental group where the model car is within colliding distance and 120 for the controlled group for the model car is not within colliding distance. What is measured is whether or not the light on the device goes off.
After our data collection we analyzed each set of data (four per situation) and determined how often our device would signal that a crash would occur and how often it would not signal in a situation where a crash would not occur. You would start by compiling the data and with each set of 30 trials, divide the num-ber of times you get a (y) by 30 for the first situation. Average these four numbers and this is the percent of the time that the device worked correctly. For the second situation, divide the number of times you get a (n) by 30. Average the four sets for this situation and this is the number of times the light does not flash- meaning it does not signal a possible collision because there will not be one. We found that our device will signal that a crash will occur 97.5% of the time and this was based off of 120 trials where we tested to see if the light would go off once the oncom-ing object passed the 40 centimeters thresh-old. We also found that in 90% of situations that would not result in an accident, where the oncoming car doesn't pass the 40 centi-meters threshold, our device will correctly not go off. Given that our device successfully goes off 97.5% of the time in situations that would otherwise result in a rear-end collision, we have successfully designed and tested a de-vice that uses a yellow flashing light and an Arduino Uno to indicate to drivers when they are putting both themselves and other people in vehicles at risk for a rear end collisions. LITERATURE REVIEW There are many problems with current tech-nology implemented in to cars to prevent col-lisions. Older cars have none of this technolo-gy, and in the newer ones that do it is an im-perfect technology. The only visual cue in the rear of cars that is required and that can sig-nal when a car is breaking are the brake lights. Brake lights have many issues involved with
81
them as they are only signaled on when the service brakes are being used. There are other conditions in which a car will be slowing or stopped which the brake lights are not posi-tively signaled on. Some of these include: be-ing stopped, slowing down due to gravity (such as on a hill), or slowing down due to lack of using the acceleration. The company which wrote this article has two different solutions that they came up with. They used an open and closed loop systems to track the following vehicle as their two different solutions. The open loop was slightly more successful but is only triggered with the heavy use of brakes which did not occur in their real world testing. The open loop system uses measurements only from the vehicle implemented with the technology. The closed loop system uses these measurements as well as measure-ments of the car behind and how rapidly it is approaching the car in front. This system was slightly less successful in modeled testing be-cause it sent out false positives 5% of the time whereas the open loop system never sent out a false positive. Another aspect of their re-search that we might want to take in to ac-count was the brightness at night. We want our light to be bright enough to catch atten-tion but not so bright that is becomes an an-noyance or a discomfort for the drivers who will view it. Through testing, Consumer Reports found that collision avoidance technologies in cars currently rely on cameras and radars. These both have problems associated with them. Cameras can be effected by bad weather and can be influenced by rain especially. Radars are not as detailed in the image or as accurate as cameras but, stand up better in bad weath-er. The current crash avoidance systems in place in cars typically signal one of the follow-ing alerts: beeping, dashboard icon, haptic feedback, or other attention grabbers. When
these signals are triggered, it drastically de-creases the number and severity of car colli-sions. Some current technologies that are in cars to prevent crashes are automatic braking, lane departure warnings, headlights that fol-low path of travel, pedestrian and movement detection warnings, and many more. Some problems with current technology that we need to overcome with our technology are the fact that current technology only accounts for the car in which you are driving and not the vehicles or drivers of other cars. As well, older cars do not contain any of these tech-nologies used for collision prevention and many people can’t afford to buy a new car just for these advantages. If we create a tech-nology that can be easily implemented in to a car, this will solve this problem. Current colli-sion prevention technologies are not regulat-ed or required by any government agency and so they are typically only in higher end cars. There also are prototypes of rear detection sensors but, these are inaccurate in detecting how far the distance to the car behind is so we will have to achieve much more accuracy with our system. This article was written in accordance to pro-gress being made with cars and collision avoidance systems. Cars being manufactured today are being made to avoid accidents alto-gether (active safety technology) rather than made to protect the people within cars when they are in an accident (passive safety tech-nology). There have been multiple lawsuits against the United States Department of Transportation as they have made moves to delay the implementation of rear-end camer-as within all cars (something that will signifi-cantly lower the occurrence of “backover” accidents (when someone backs over another person because they cannot see behind them in a car)). Crash avoidance systems are also continually being implemented into cars, be-

82
ginning with luxury cars but now moving down to mid-price cars as well. These crash systems will generally warn the driver of an imminent car crash or will automatically apply the brakes. The Insurance Institute for High-way Safety also conducted testing upon vari-ous cars and their crash avoidance systems which are generally optional rather than standard equipment and can cause the car to cost more. This article plays well into our CSRSEF project because it brings light to the fact that there is legislation out there and people involved who are wanting to instill a safer way of driving and getting around in or-der to avoid accidents. This opens up a mar-ket for us to introduce our product into and with the lawsuits that have come about with the Department of Transportation, it shows that there are people out there who want change to happen and are willing to stand up for it. It also introduces an important point which is that while many car companies will work to prevent accidents from occurring in the front of the car using crash avoidance sys-tems, they will leave the back of the car un-attended. This will help to make our product more unique within the market as well be-cause it will serve to stop an accident from the back rather than the front, as is the way most systems work. This article discusses the computer that re-sides within cars and how it functions. As technology progresses, cars more so become computers rather than machines and are gen-erally controlled by a computer network. Within a car, this is called the Controller Area Network (CAN) and is a system of wires and software that acts between a vehicle’s com-puters and sensors. Throughout the car, vari-ous computers known as electronic control units (ECUs) are also located and these have various jobs and have sensors that detect var-iables like temperature, voltage, acceleration,
and such. The CAN comes into play when an ECU needs a signal from a sensor that is con-nected to an ECU somewhere else in the car and can let all the data continuously flow so it’s available. Before CAN was ever developed in the mid-‘80s, the prime mode of adding a new feature to a car was by attaching more wires to it which would be connected to a switch. This way was tedious and made the car heavier and thus the CAN was developed. When the bulk of the wires went away, it was replaced by the addition of CAN and program-ming within cars and needing to program more when a new product was to be added. Whilst this may create another problem, it served to make cars especially light and more efficient. The significance this article holds when it comes to our CSRSEF project is that it takes the reader into the structure and com-puter of the car and provides a brief insight into how all of that works. Since our project relates so closely to cars, it is very helpful to understand how the computer, specifically, of the car works in order to understand how to best implement our product within it. If it were ever to be integrated to a car, it would be connected to the CAN system and it is val-uable to know of that information so when we design our product, we design it in a way to may it easier to integrate it as well. We also know that the car would have to be further programmed to help the product function correctly and no extra wires would need to be added.
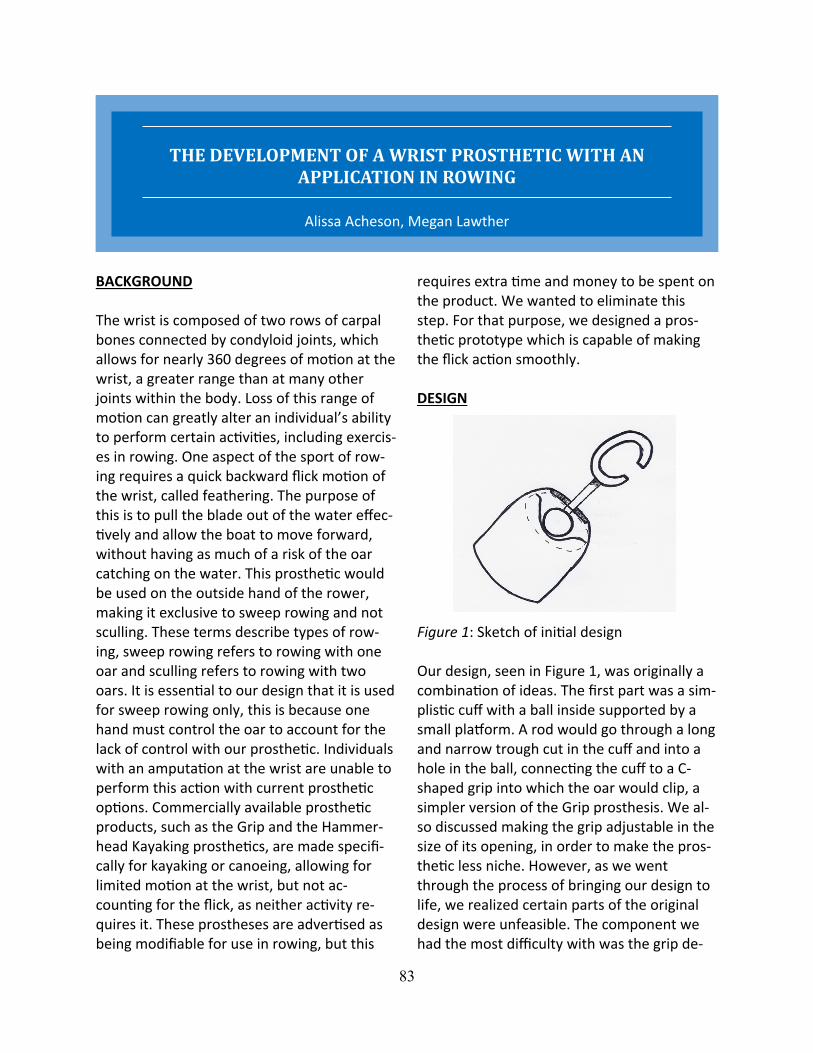
83
BACKGROUND The wrist is composed of two rows of carpal bones connected by condyloid joints, which allows for nearly 360 degrees of motion at the wrist, a greater range than at many other joints within the body. Loss of this range of motion can greatly alter an individual’s ability to perform certain activities, including exercis-es in rowing. One aspect of the sport of row-ing requires a quick backward flick motion of the wrist, called feathering. The purpose of this is to pull the blade out of the water effec-tively and allow the boat to move forward, without having as much of a risk of the oar catching on the water. This prosthetic would be used on the outside hand of the rower, making it exclusive to sweep rowing and not sculling. These terms describe types of row-ing, sweep rowing refers to rowing with one oar and sculling refers to rowing with two oars. It is essential to our design that it is used for sweep rowing only, this is because one hand must control the oar to account for the lack of control with our prosthetic. Individuals with an amputation at the wrist are unable to perform this action with current prosthetic options. Commercially available prosthetic products, such as the Grip and the Hammer-head Kayaking prosthetics, are made specifi-cally for kayaking or canoeing, allowing for limited motion at the wrist, but not ac-counting for the flick, as neither activity re-quires it. These prostheses are advertised as being modifiable for use in rowing, but this
requires extra time and money to be spent on the product. We wanted to eliminate this step. For that purpose, we designed a pros-thetic prototype which is capable of making the flick action smoothly. DESIGN Figure 1: Sketch of initial design Our design, seen in Figure 1, was originally a combination of ideas. The first part was a sim-plistic cuff with a ball inside supported by a small platform. A rod would go through a long and narrow trough cut in the cuff and into a hole in the ball, connecting the cuff to a C-shaped grip into which the oar would clip, a simpler version of the Grip prosthesis. We al-so discussed making the grip adjustable in the size of its opening, in order to make the pros-thetic less niche. However, as we went through the process of bringing our design to life, we realized certain parts of the original design were unfeasible. The component we had the most difficulty with was the grip de-
THE DEVELOPMENT OF A WRIST PROSTHETIC WITH AN APPLICATION IN ROWING
Alissa Acheson, Megan Lawther
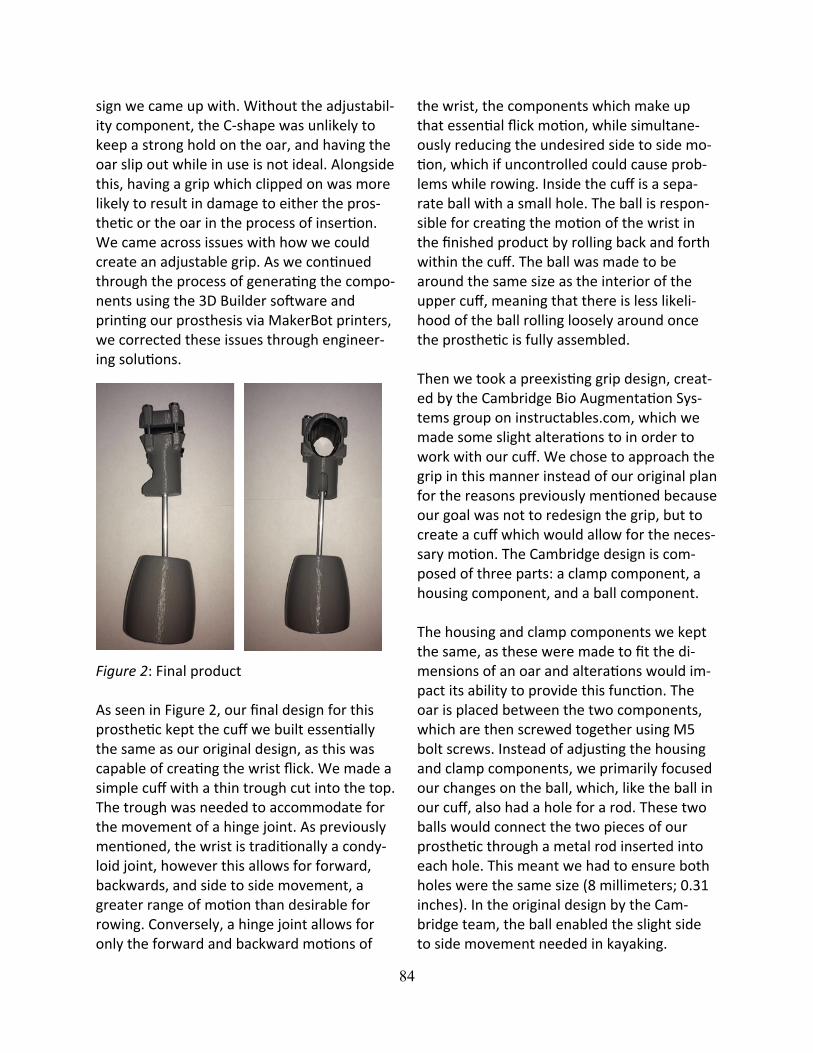
84
sign we came up with. Without the adjustabil-ity component, the C-shape was unlikely to keep a strong hold on the oar, and having the oar slip out while in use is not ideal. Alongside this, having a grip which clipped on was more likely to result in damage to either the pros-thetic or the oar in the process of insertion. We came across issues with how we could create an adjustable grip. As we continued through the process of generating the compo-nents using the 3D Builder software and printing our prosthesis via MakerBot printers, we corrected these issues through engineer-ing solutions.
Figure 2: Final product As seen in Figure 2, our final design for this prosthetic kept the cuff we built essentially the same as our original design, as this was capable of creating the wrist flick. We made a simple cuff with a thin trough cut into the top. The trough was needed to accommodate for the movement of a hinge joint. As previously mentioned, the wrist is traditionally a condy-loid joint, however this allows for forward, backwards, and side to side movement, a greater range of motion than desirable for rowing. Conversely, a hinge joint allows for only the forward and backward motions of
the wrist, the components which make up that essential flick motion, while simultane-ously reducing the undesired side to side mo-tion, which if uncontrolled could cause prob-lems while rowing. Inside the cuff is a sepa-rate ball with a small hole. The ball is respon-sible for creating the motion of the wrist in the finished product by rolling back and forth within the cuff. The ball was made to be around the same size as the interior of the upper cuff, meaning that there is less likeli-hood of the ball rolling loosely around once the prosthetic is fully assembled. Then we took a preexisting grip design, creat-ed by the Cambridge Bio Augmentation Sys-tems group on instructables.com, which we made some slight alterations to in order to work with our cuff. We chose to approach the grip in this manner instead of our original plan for the reasons previously mentioned because our goal was not to redesign the grip, but to create a cuff which would allow for the neces-sary motion. The Cambridge design is com-posed of three parts: a clamp component, a housing component, and a ball component. The housing and clamp components we kept the same, as these were made to fit the di-mensions of an oar and alterations would im-pact its ability to provide this function. The oar is placed between the two components, which are then screwed together using M5 bolt screws. Instead of adjusting the housing and clamp components, we primarily focused our changes on the ball, which, like the ball in our cuff, also had a hole for a rod. These two balls would connect the two pieces of our prosthetic through a metal rod inserted into each hole. This meant we had to ensure both holes were the same size (8 millimeters; 0.31 inches). In the original design by the Cam-bridge team, the ball enabled the slight side to side movement needed in kayaking.
85
However, this was undesirable for rowing. In order to combat this, we made the ball sta-tionary in the housing compartment. Outside of the components we 3D printed for our prosthetic, there were a few other materi-als needed to create our final product. These included a metal rod (approximately 10 centi-meters in length), four M5 bolts (40 millime-ters in length, fully threaded), and two pieces of bike inner tube. The rod connects the grip to the cuff, while the bolts connects the clamp and housing components of the grip around the oar shaft. The inner tube is put inside the clamp and housing components in order to prevent damage occurring to either the pros-thetic or the oar as a result of friction or as-sembly. SAFETY AND APPLICATIONS In order to reduce user discomfort and safety concerns, the cuff should easily slip on and off a prosthetic sleeve. The movement of the ball within the cuff is unlikely to be comfortable against the skin, so the use of a sleeve would hopefully help with that. Alongside this, we would include a waterproof fabric on the in-side of the cuff to help reduce discomfort as well and possibly a guard between the ampu-tees terminal end and the ball inside the cuff of our prosthetic. The ability of the cuff to easily slip of the wrist is important in case the boat were to capsize, we determined that it would be easier for the entire prosthetic to come off than creating a mechanism for the grip to detach from the cuff. We also looked into how the equipment would be affected by this new grip, and after consultation with an-other experienced rower, we determined a padding would be needed on the inside of the grip. This padding on the inside would prevent scratching on the oar and less wear on the actual prosthetic.
Of course, this is just a model of our design. Before attempting to mass produce this pros-thetic, we would need to ensure the comfort of the consumer. This would mean adjusting the size of the cuff to make sure it fit on the user’s wrist. When creating the cuff, we meas-ured the size of our own wrists, however, this size won’t be the same for every individual. This means we would need adjust for larger and smaller wrists and make sure we are measuring the wrist in a way which provides an accurate size. We would also need to make sure that prosthetic sleeve is enough protec-tion to make the ball in the cuff comfortable for the user. If not, we would need to adjust the cuff in order to provide extra space for padding. There shouldn’t be a need to adjust the grip, as any oar should fit in the housing and clamp components without an issue. Going forward, we could create a stronger model for use in other activities considering materials such as carbon fiber. One of these other activities would include, weightlifting, which makes use of a motion of the wrist which is essentially the same as that used in rowing. If our prosthetic was made of strong-er materials, than the design could be usable in that sport as well. Our design has yet to be put to the test, but we are looking into possibilities. Once that step is complete, we hope is to make this prosthetic available for free or relatively low cost.
86
ABSTRACT When you invest there is often a great amount of influence from famous fund man-agers. When they invest all the same as each other, they create herd behavior. This leads to the overvaluation/undervaluation of stocks which influence people’s purchasing deci-sions, leading to more uninformed investors, creating a market that has little to do with what a stock is worth. Herd Behavior creates volatility, which disrupts the business cycle and clogs the machine known as the econo-my. This makes it harder to evaluate the true state of economies worldwide affecting global politics. A market unaffected by herd mentali-ty will perform better as the basis for invest-ments will be founded on economic data and reasoning. We modified a Herd Behavior Calculator (HIX), and created an adjusted price that allows us to compare the simulated market without herd behavior to the actual market. After cal-culating a Return on Investment over a varia-ble course of time, we found that a market without herd behavior performed better. We can conclude that a market unaffected by herd mentality leads to a better situation for investors and this indicator helps people find what the true value of a stock. Investors can make better decisions while not being affect-ed by the uneducated decisions of others. THE EFFECT OF HERD BEHAVIOR ON STOCK MARKET PRICES
Conventional investing wisdom is that higher degrees of risk warrant higher rates of return. For example, a riskier loan carries a higher interest rate than a safer loan. When compar-ing individual stocks this conventional wisdom tends to hold true, however, when applied to the market as a whole we see quite the oppo-site. The market’s SPHB (high volatility stocks) and SPLV (low volatility stocks) and the indi-vidual stocks AMZN (Amazon) and WMT (Wal-Mart) are prime examples. While Walmart carries a far lower risk of dropping, and has a relatively steady incline, Amazon is seen to have a larger deal of investors who’ve joined in despite the large risk of a plummet in value. There is currently a general HIX (Herd Behav-ior Index) in place that can be used, however, it is not ideal in a significant portion of stock market situations, and isn’t necessarily opti-mized for use in a global stock market. Researching factors like corporate leadership, and company history, we hope to use various market indicators to give a statistical analysis. Understanding the way people follow large investing waves helps us see the inefficiency of current investors’ mindsets and under-scores the need for a better comprehension of the herd behavior causes and consequenc-es, and even more so, a way to use these to achieve an improved efficiency in an individu-al investing separately from the herd.
THE EFFECT OF HERD BEHAVIOR ON STOCK MARKET PRICES A STUDY OF INVESTING STRATEGIES
Anna Gimera, Shreyas Kulkarni, Tyler Warden
87
BACKGROUND RESEARCH Herd behavior is defined, financially, as the “comovement of members in a group without planned direction.” This definition has been synonymous throughout several studies run by researchers over recent years following the topic. Herd behavior from an investment standpoint opposes the very purpose of investments. Typically, the idea is that a manager at hand would sift through all of the relevant infor-mation and then come to a rational conclu-sion regarding what decision he’ll make for his investments (Scharfstein & Stein, 2000). However, herd behavior could dissuade a manager from following through with his own contrarian, despite rational decision, in fear of a damaged reputation. As cited from Keynes in Scharfstein and Stein’s study, “Worldly wis-dom teaches that it is better for reputation to fail conventionally than to succeed unconven-tionally.” Thus implying that some managers put reputation as a higher priority than actual success in their decisions. The paper also puts an emphasis on the idea that managers will take comfort in failing with the mass. This way, they are not singled out in any event. They would rather ignore the likely outcome if they see that everyone else is focused on the less likely alternative. This study vaguely mimics the study by Holmstrom (1982), where he, too, made a model identifying how man-agers would make decisions given a theoreti-cal scenario. Our second model (Kim, Lee, Choi & Ahn, 2013) provides two different models for anal-ysis, essentially disproving the two in such a way that disinhibits them to accurately be used as a prediction.
Essentially, the model analyzes the different factors of investment, including “Timing and Information Structure” and “Managerial Ob-jectives” that determine an initial conception of what decision to make. Then, they take “Herding Equilibria” into account, and com-pare it with the decisions previously men-tioned, and attempt to separate “Equilibria with Reputational Concerns.” They discuss three essential propositions regarding reputa-tional concerns, indicating that there is a ra-tionality, irrationality, and unpredictable igno-rance to the managers altogether, varying on some level of ability and experience. Unlike Scharfstein and Stein’s study, the latter collaboration addressed the implied correla-tion index (CIX) and the herd behavior index (HIX). The former is defined as “the ratio of the sum of the weighted covariance to that of the weighted variance between stocks.” How-ever, to use CIX appropriately (to predict cor-relation) you have to apply the corresponding implied volatilities to the portfolios. Since CIX is so generalized as to just measuring correla-tion, though, you must use the latter. Such is defined as “the ratio of the estimate of the variance of the real market index to that un-der extreme herd behavior.” This is better for spotting the effects of herding, but not so great at the larger scale comparisons. Thus, by using both CIX and HIX, hypothetically, they could get the balance between measur-ing a generalized future correlation, but also incorporating the herd behavior aspects of the study. However, they go through a com-prehensive, structured description of why this cannot represent an intercontinental global market. Instead, they introduce RHIX as the revised HIX, which depends solely on the pure covariance terms. They list the countries they use, and the proportional stock market differences between them and their prices. Going on to compare the RHIX of different

88
countries and continents, they propose that RHIX be used for empirical analysis instead of the typical CIX and HIX. Thus proving the struggles between choosing a type of algo-rithm between different scenarios in the stock market, and the demand for a standardized method of turning herd behavior into an ad-vantage without taking a financial hit. In this way, our first study attempted to dis-prove the current herd behavior index, and our second found that herd behavior varies depending on the economic setting, some-thing that Scharfstein and Stein failed to rec-ognize in their analysis that could've led them to a faulty conclusion. Although Kim, Lee, Choi, and Ahn do introduce the idea that herd behavior isn't seen so much in the stocks as in the investors, which Scharfstein and Stein on-ly lightly touched upon. However, neither of them address the idea of the common populus, such as the media, and those following it. In the same way, they do not incorporate the history of a stock, inves-tor, or company into their analyses. Thus, using these two sources, we found that taking in the setting, as well as the perception, results from the news that could sway the market, and most critically, the histories of all factors regarded in a transaction would pro-duce the most effective algorithm for calcu-lating herd behavior. METHODS AND MATERIALS In our experiment, we plan to create a new algorithm for predicting the outcome of stocks in reference to herd behavior, thus providing the user with an idea of when to make what decisions regarding putting in in-vestments, and pulling them out, or staying out altogether. Instead of working from
scratch, we will be weaving together other indexes, such as the risk factor index, or RSI. This means we will be required to use a series of data points from the stock histories, to lay a foundation on which we’ll build our own algorithm. In this case, we’ll be using histori-cal data derived from Yahoo Finance and we will be doing our data analysis and computa-tion in Microsoft Excel. These are the only materials we need, are to provide us access to these programs/websites. In this respect, we can download the histori-cal data regarding the past 20 years of the stock in question from Yahoo Finance, or as long as the stock has been around, if less than 20 years. Then, we’d sort the data from the earliest to the latest date, in chronological order. We’d calculate the price change be-tween days, separating them into positive and negative, allowing us to then calculate the EMA (up and down) as a simple average of the first 14 days. This sets 14 days as our in-terval. Following the calculations of the EMA, we’d calculate the RSI (Risk Index), and store the date, and the price of days that go below 30 or above 70, which subsequently become our buy and sell dates, respectively. We cal-culated the percent changes between the buy and sell dates, and modify a $1000 sequence to simulate the money being traded. After this, we calculate the MACD for each day, sim-ilar to how we did for the RSI, but by creating two EMAs for time periods 12 and 26. Then, we subtracted the 26 day period EMA from the 12 day period EMA, to calculate a new EMA of a 9 day period, which represents our MACD line. Afterwards, we recorded the in-terval lengths between RSI and MACD line crosses, frequency, and distance apart to de-termine how impacted a stock is by herd behavior. Lastly, we compared HB (High vola-tility) and LV (Low volatility) stocks of like sec-tor to determine which trade set works the
89
best over specific time periods using correla-tion coefficients. RESULTS Using this algorithm in excel, we are able to see which stock will yield a higher profit with the security of being a safe investment. Since the algorithm’s data is directly from Yahoo stock, we can also view the behavior of stocks from years ago. Our algorithm also helps us detect when herd mentality is being played out, and when a jump in stock price or a steady increase is not-ed. This often tells us that people are jumping on and wanting certain stock just because the stock seems to be popular. The algorithm will also show us major jumps in the stock’s price that may have occurred. One sole proprietor of our algorithm is the seamless way that RSI and MACd are shown. Both show the curve and trajectory of the stock price in the future. DISCUSSION Our research reinforces the idea that just be-cause someone else is investing doesn't mean that when you invest you will revive a profit. Herd mentality can be quite difficult to catch when it occurs as people are so involved in it. Our research may hopefully make it easier to detect herd mentality in the stock market and have investors stray away from the main-stream popular stocks. Instead of investing in new companies it is safer to stick with the old-er ones. An example of this is people in-vesting in Chipotle vs McDonald's. To the novice investor Chipotle seems like the right place to make a profit, however immediately after the E. Coli outbreak the stock plummet-ed. On the contrary McDonald's stock has
been the same for years, only dropping or increasing a couple points.
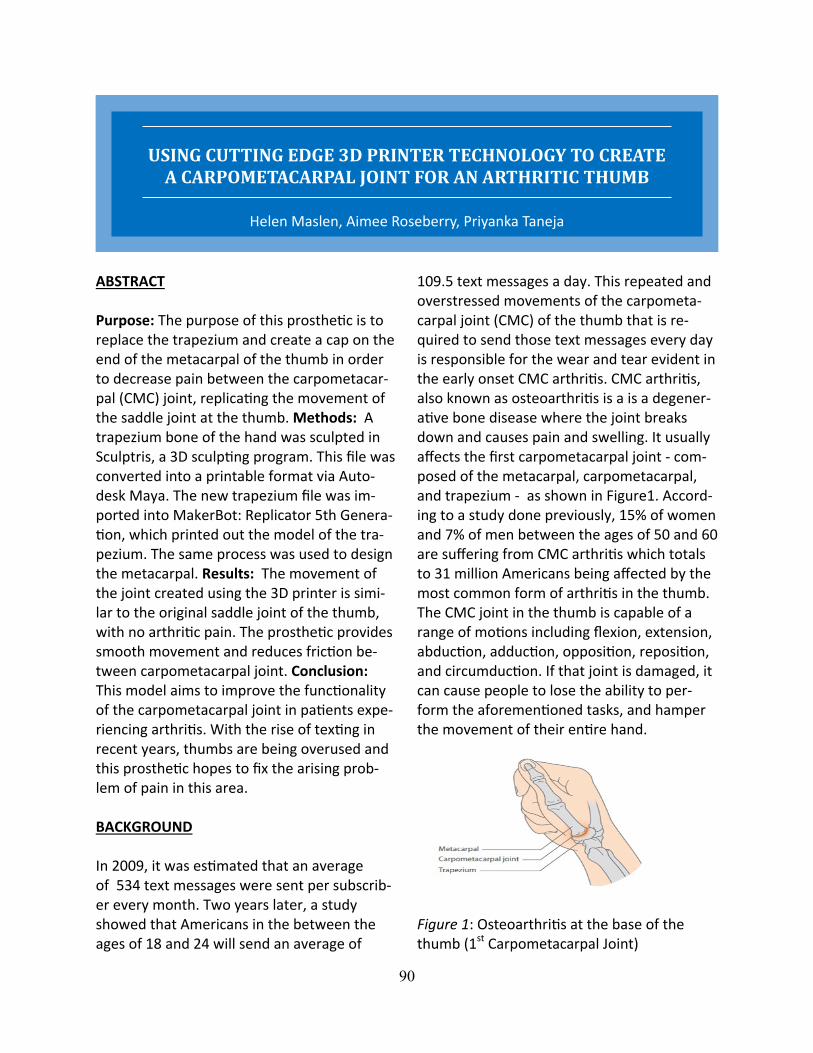
90
ABSTRACT Purpose: The purpose of this prosthetic is to replace the trapezium and create a cap on the end of the metacarpal of the thumb in order to decrease pain between the carpometacar-pal (CMC) joint, replicating the movement of the saddle joint at the thumb. Methods: A trapezium bone of the hand was sculpted in Sculptris, a 3D sculpting program. This file was converted into a printable format via Auto-desk Maya. The new trapezium file was im-ported into MakerBot: Replicator 5th Genera-tion, which printed out the model of the tra-pezium. The same process was used to design the metacarpal. Results: The movement of the joint created using the 3D printer is simi-lar to the original saddle joint of the thumb, with no arthritic pain. The prosthetic provides smooth movement and reduces friction be-tween carpometacarpal joint. Conclusion: This model aims to improve the functionality of the carpometacarpal joint in patients expe-riencing arthritis. With the rise of texting in recent years, thumbs are being overused and this prosthetic hopes to fix the arising prob-lem of pain in this area. BACKGROUND In 2009, it was estimated that an average of 534 text messages were sent per subscrib-er every month. Two years later, a study showed that Americans in the between the ages of 18 and 24 will send an average of
109.5 text messages a day. This repeated and overstressed movements of the carpometa-carpal joint (CMC) of the thumb that is re-quired to send those text messages every day is responsible for the wear and tear evident in the early onset CMC arthritis. CMC arthritis, also known as osteoarthritis is a is a degener-ative bone disease where the joint breaks down and causes pain and swelling. It usually affects the first carpometacarpal joint - com-posed of the metacarpal, carpometacarpal, and trapezium - as shown in Figure1. Accord-ing to a study done previously, 15% of women and 7% of men between the ages of 50 and 60 are suffering from CMC arthritis which totals to 31 million Americans being affected by the most common form of arthritis in the thumb. The CMC joint in the thumb is capable of a range of motions including flexion, extension, abduction, adduction, opposition, reposition, and circumduction. If that joint is damaged, it can cause people to lose the ability to per-form the aforementioned tasks, and hamper the movement of their entire hand.
Figure 1: Osteoarthritis at the base of the thumb (1st Carpometacarpal Joint)
USING CUTTING EDGE 3D PRINTER TECHNOLOGY TO CREATE A CARPOMETACARPAL JOINT FOR AN ARTHRITIC THUMB
Helen Maslen, Aimee Roseberry, Priyanka Taneja
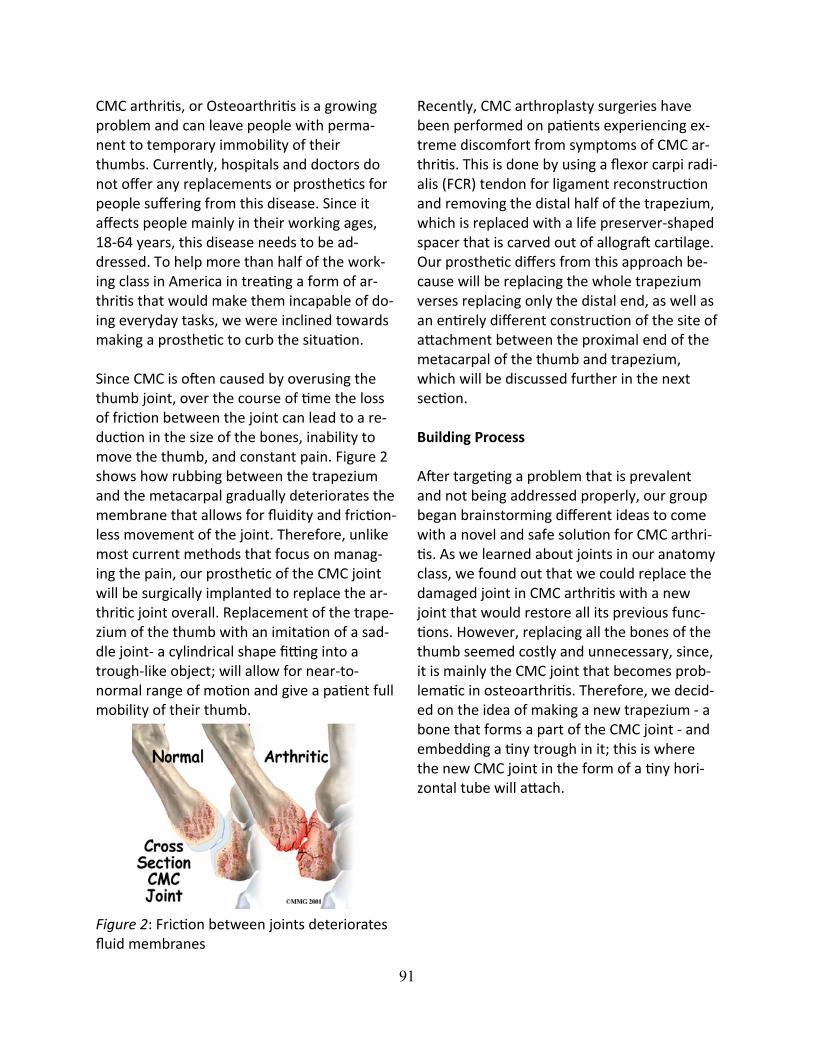
91
CMC arthritis, or Osteoarthritis is a growing problem and can leave people with perma-nent to temporary immobility of their thumbs. Currently, hospitals and doctors do not offer any replacements or prosthetics for people suffering from this disease. Since it affects people mainly in their working ages, 18-64 years, this disease needs to be ad-dressed. To help more than half of the work-ing class in America in treating a form of ar-thritis that would make them incapable of do-ing everyday tasks, we were inclined towards making a prosthetic to curb the situation. Since CMC is often caused by overusing the thumb joint, over the course of time the loss of friction between the joint can lead to a re-duction in the size of the bones, inability to move the thumb, and constant pain. Figure 2 shows how rubbing between the trapezium and the metacarpal gradually deteriorates the membrane that allows for fluidity and friction-less movement of the joint. Therefore, unlike most current methods that focus on manag-ing the pain, our prosthetic of the CMC joint will be surgically implanted to replace the ar-thritic joint overall. Replacement of the trape-zium of the thumb with an imitation of a sad-dle joint- a cylindrical shape fitting into a trough-like object; will allow for near-to-normal range of motion and give a patient full mobility of their thumb. Figure 2: Friction between joints deteriorates fluid membranes
Recently, CMC arthroplasty surgeries have been performed on patients experiencing ex-treme discomfort from symptoms of CMC ar-thritis. This is done by using a flexor carpi radi-alis (FCR) tendon for ligament reconstruction and removing the distal half of the trapezium, which is replaced with a life preserver-shaped spacer that is carved out of allograft cartilage. Our prosthetic differs from this approach be-cause will be replacing the whole trapezium verses replacing only the distal end, as well as an entirely different construction of the site of attachment between the proximal end of the metacarpal of the thumb and trapezium, which will be discussed further in the next section. Building Process After targeting a problem that is prevalent and not being addressed properly, our group began brainstorming different ideas to come with a novel and safe solution for CMC arthri-tis. As we learned about joints in our anatomy class, we found out that we could replace the damaged joint in CMC arthritis with a new joint that would restore all its previous func-tions. However, replacing all the bones of the thumb seemed costly and unnecessary, since, it is mainly the CMC joint that becomes prob-lematic in osteoarthritis. Therefore, we decid-ed on the idea of making a new trapezium - a bone that forms a part of the CMC joint - and embedding a tiny trough in it; this is where the new CMC joint in the form of a tiny hori-zontal tube will attach.
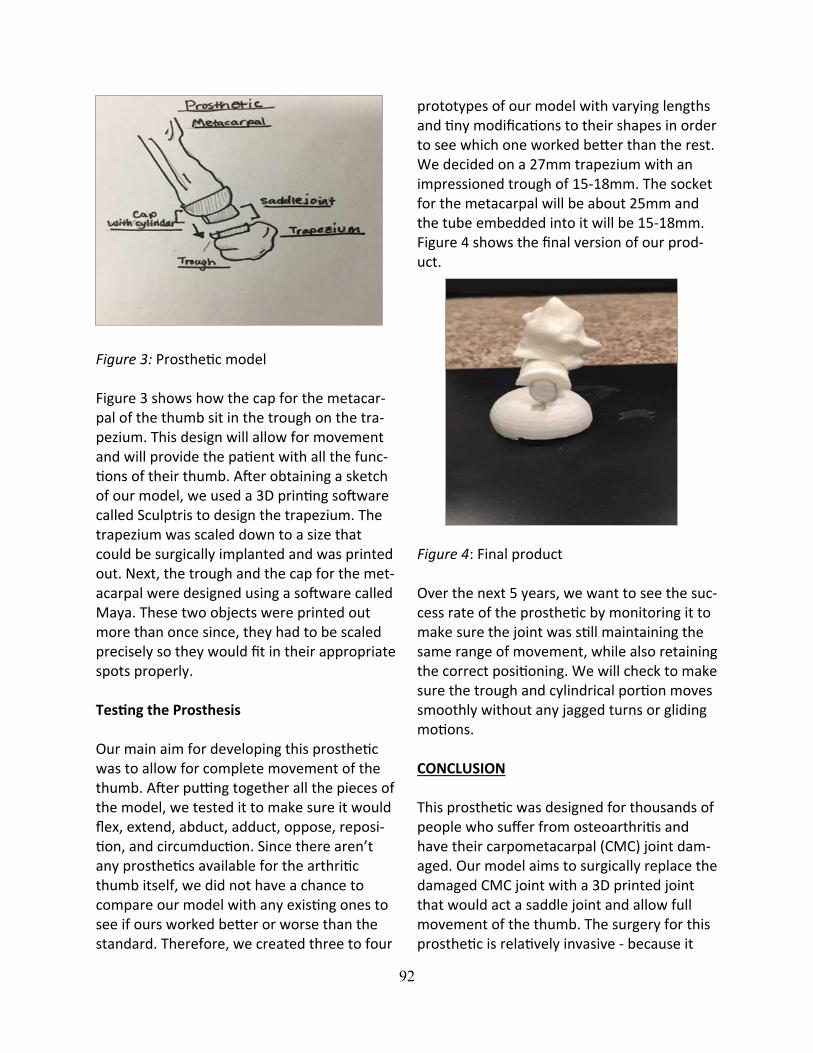
92
Figure 3: Prosthetic model Figure 3 shows how the cap for the metacar-pal of the thumb sit in the trough on the tra-pezium. This design will allow for movement and will provide the patient with all the func-tions of their thumb. After obtaining a sketch of our model, we used a 3D printing software called Sculptris to design the trapezium. The trapezium was scaled down to a size that could be surgically implanted and was printed out. Next, the trough and the cap for the met-acarpal were designed using a software called Maya. These two objects were printed out more than once since, they had to be scaled precisely so they would fit in their appropriate spots properly. Testing the Prosthesis Our main aim for developing this prosthetic was to allow for complete movement of the thumb. After putting together all the pieces of the model, we tested it to make sure it would flex, extend, abduct, adduct, oppose, reposi-tion, and circumduction. Since there aren’t any prosthetics available for the arthritic thumb itself, we did not have a chance to compare our model with any existing ones to see if ours worked better or worse than the standard. Therefore, we created three to four
prototypes of our model with varying lengths and tiny modifications to their shapes in order to see which one worked better than the rest. We decided on a 27mm trapezium with an impressioned trough of 15-18mm. The socket for the metacarpal will be about 25mm and the tube embedded into it will be 15-18mm. Figure 4 shows the final version of our prod-uct. Figure 4: Final product Over the next 5 years, we want to see the suc-cess rate of the prosthetic by monitoring it to make sure the joint was still maintaining the same range of movement, while also retaining the correct positioning. We will check to make sure the trough and cylindrical portion moves smoothly without any jagged turns or gliding motions. CONCLUSION This prosthetic was designed for thousands of people who suffer from osteoarthritis and have their carpometacarpal (CMC) joint dam-aged. Our model aims to surgically replace the damaged CMC joint with a 3D printed joint that would act a saddle joint and allow full movement of the thumb. The surgery for this prosthetic is relatively invasive - because it

93
requires the insertion a new joint into the body - but is better in the long run because it will completely eliminate the arthritic thumb joint and remove all the pain associated with it. It also does not pose any serious life-threatening consequences. Therefore, this design provides a cost efficient and accessible way to treat patients whose thumbs have be-come damaged either because of arthritis or any other complication.
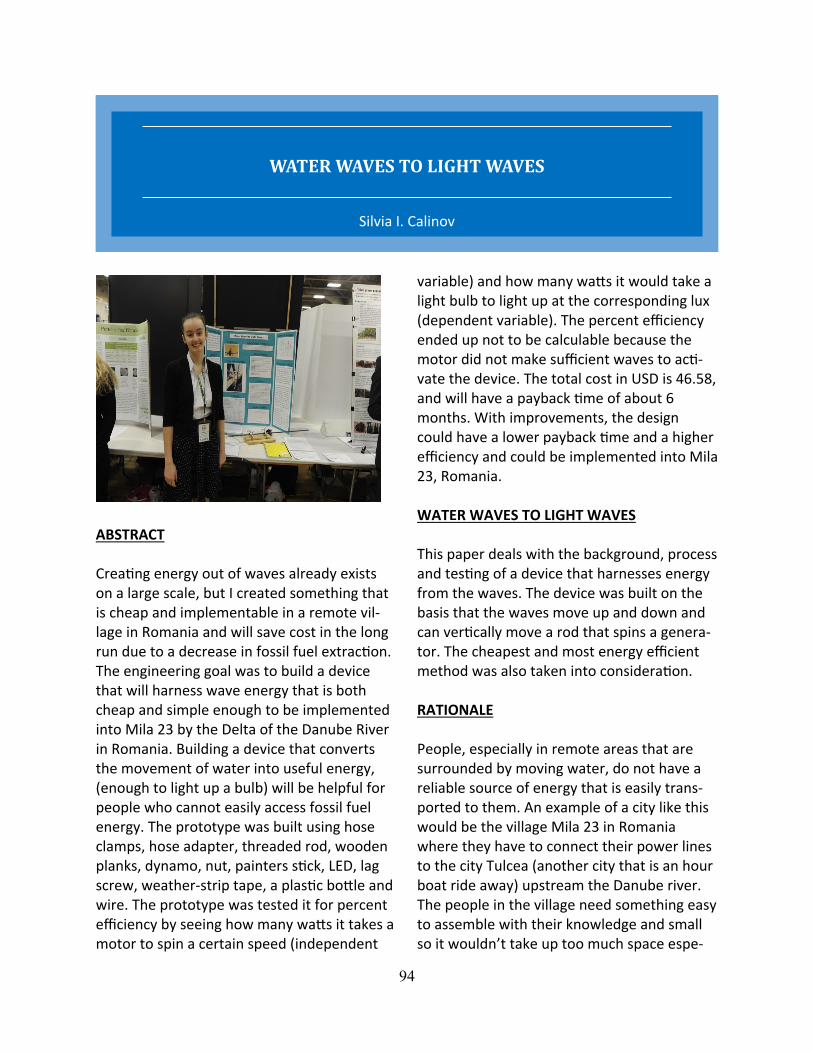
94
ABSTRACT Creating energy out of waves already exists on a large scale, but I created something that is cheap and implementable in a remote vil-lage in Romania and will save cost in the long run due to a decrease in fossil fuel extraction. The engineering goal was to build a device that will harness wave energy that is both cheap and simple enough to be implemented into Mila 23 by the Delta of the Danube River in Romania. Building a device that converts the movement of water into useful energy, (enough to light up a bulb) will be helpful for people who cannot easily access fossil fuel energy. The prototype was built using hose clamps, hose adapter, threaded rod, wooden planks, dynamo, nut, painters stick, LED, lag screw, weather-strip tape, a plastic bottle and wire. The prototype was tested it for percent efficiency by seeing how many watts it takes a motor to spin a certain speed (independent
variable) and how many watts it would take a light bulb to light up at the corresponding lux (dependent variable). The percent efficiency ended up not to be calculable because the motor did not make sufficient waves to acti-vate the device. The total cost in USD is 46.58, and will have a payback time of about 6 months. With improvements, the design could have a lower payback time and a higher efficiency and could be implemented into Mila 23, Romania. WATER WAVES TO LIGHT WAVES This paper deals with the background, process and testing of a device that harnesses energy from the waves. The device was built on the basis that the waves move up and down and can vertically move a rod that spins a genera-tor. The cheapest and most energy efficient method was also taken into consideration. RATIONALE People, especially in remote areas that are surrounded by moving water, do not have a reliable source of energy that is easily trans-ported to them. An example of a city like this would be the village Mila 23 in Romania where they have to connect their power lines to the city Tulcea (another city that is an hour boat ride away) upstream the Danube river. The people in the village need something easy to assemble with their knowledge and small so it wouldn’t take up too much space espe-
WATER WAVES TO LIGHT WAVES
Silvia I. Calinov
95
cially in transporting it to the village. A device that creates energy from moving water would be a perfect way to get clean energy that doesn’t hurt the environment around them. This device would only be a way for the village to get cleaner and cheaper energy, but it is not the only thing they should rely on. A prob-lem with relying on the device is if something breaks or the river freezes over, they will no longer have electricity. Energy from Tulcea would still be their backup way of getting en-ergy, as a solution to this problem. Ideally, a larger scale device for Mila 23 would have a high impact on each individual’s income. Each month, the average household in Romania pays about $100 per month (converted from Romanian Lei) on their electricity bill (“Cost of Living in Romania,” 2009-17). The average sal-ary of people living in Mila 23 conditions is about $300 per month (“Romania | Economic Indicators,” 2016). If the device manages to decrease the monthly bill by 20%, that would be $20 a month saved, or 6.6%. A possible ex-tension of this project would be a device like this that could also help in larger cities, if they are placed near a large body of moving water. This would reduce the amounts of pollutants in the atmosphere from coal and oil extrac-tion. Engineering Goals The engineering goal is to build a device that will harness energy from mainly the waves that is cheap and simple enough to be imple-mented into Mila 23 by the Danube in Roma-nia. If I build a device that creates energy from moving water, it can help big cities as well as little villages because it can reduce the environmental and health costs of burning fossil fuels. It would reduce the hidden costs in energy since the pollutants in the atmos-phere create health problems for people which then have to pay for health care. Ac-
cording to 2013 data, 41.68% of energy from Romania has to be extracted which effects many health conditions (Raport Național 2013, 2014 July 31, p. 74). Taking small steps, similar to the device that converts water ener-gy into useful energy could slowly reduce the amount of pollutants coming from those ex-tractions and in turn reduce health costs. Ide-ally, there is one device for every two or three households that is placed right outside of their houses on the nearest dock, and the powerlines wouldn’t run very far which doesn’t create resistance. PROCESS The process will include the design process, a list of the materials used to build and a proce-dure on how to build it. It will also explain what most materials are used for in the de-vice. Design Concept sketching was the first part of the design process, it included drawing a lot of images and preliminary sketches of the final product. Once the final design was chosen, there was a dimensional diagram that was drawn (see Figure 1). Materials The materials are hose clamps, hose adapter, threaded rod, wooden planks, dynamo, nut, painters stick, LED, lag screw, weather-strip tape, a plastic bottle and wire. For exact cost references, see Table 1.
96
Procedure The device should be set up so the vertical movement spins one end of the dynamo which generates energy. The vertical move-ment comes from the waves moving the floating bottle up and down and then the hose clamps are set up for ensuring there is only one direction of movement. Everything is secured down with hose clamps or lag screws. The whole device itself is also adjustable to accommodate how deep the water goes from the dock. It can also be drilled into the station-ary dock so it is continuously in use. (see Fig-ure 2). TESTING There were two parts to testing the device. Part one consisted of simulating waves in a bathtub with an inconsistent amount of hu-man power moving the water. The device was also not held in place while the waves were being simulated. The LED lit up sporadically, but there was nothing that was being meas-ured and tracked because of the inconsisten-cy. The second part to testing was using a pro-grammed underwater motor which ran at three different speeds to generate waves in a sink. The slow speed was set to 90° rotation every second, medium speed was set to 90° rotation every half second, and the fast speed was set to 90° rotation every one tenth of a second. The motor created waves in a sink which the device was set on to create the en-ergy from the vertical movement. The lux of the LED was then supposed to be recorded in a table with the corresponding motor speed and the watts it takes the motor to spin that speed.
Analysis The analysis was done in four parts. Part one consisted of determining if the human pow-ered wave simulator in a bathtub was enough to light the bulb. The results show that it was very inconsistent and unable to reliably pro-duce energy to light up the bulb. Part two was done by calculating the differ-ence in watts it takes the motor to spin the three different speeds, and the number of watts it would take the bulb to light up the corresponding lux. This would also calculate a percent efficiency of the device. The motor size and power was not enough to create sufficient waves in the sink, so therefore the device was not able to be properly tested. Part three of analysis was the cost analysis. This was done by calculating the payback time of the device by comparing how much the ini-tial cost was to how much is saved per day. Activating the device by hand gives off enough power to light up 10 watts of light. The cost per kilowatt hour in Romanian Lei is 4.5 and the exchange rate for that to U.S. dollars is 4.3. Calculated out, it is 1.05 U.S. dollars per kilowatt hour. The projected cost of the device after it is built is 46.58 U.S. dollars, and assum-ing the light bulb is run for 24 hours a day, 24 hours times 10 watts divided by 1000 to make it into kilowatts, gives me 0.24 kilowatt hours saved per day. In U.S. dollars, that is 25 cents a day. Assuming every month has 30 days, you save $7.50 per month. $46.58 divided by $7.5 per month is 6.21 months to pay back the de-vice (See Figure 3).
97
Part four was calculating how much fossil fuel extraction can be saved. Assume there is only one device, and it runs continuously for 24 hours, and it gives of 10 watts continuously. The energy in kilowatt hours is the power in watts times the time period divided by 1000. The watts times the number of hours run is 10 times 24, which is 240 watts per hour. Divide that by 1000 to make it kilowatts per hour, and the answer is 0.24 kilowatt hours in a day, with one device running continuously. This mean that within the time frame of about 4 days, this device can save 1 kilowatt hour of electricity which is equivalent to 1 pound of coal. Every year, 91.25 kilowatts of energy, al-so 91.25 pounds of coal, can be saved with one device running continuously, and this is done by dividing 365 (days*kilowatt) by 4 days, which leaves the answer in kilowatts. The average household of Romania used 1674 kilowatt hours of electricity in 2014 (“Energy Efficient Indicators”, 2016). This rounds to 5.45% of energy that can be saved each year with one device in one household. Having multiple devices can increase the total per-centage saved using the device and decrease the overall demand of electricity from the mainland of Tulcea which will decrease coal extraction costs as well.
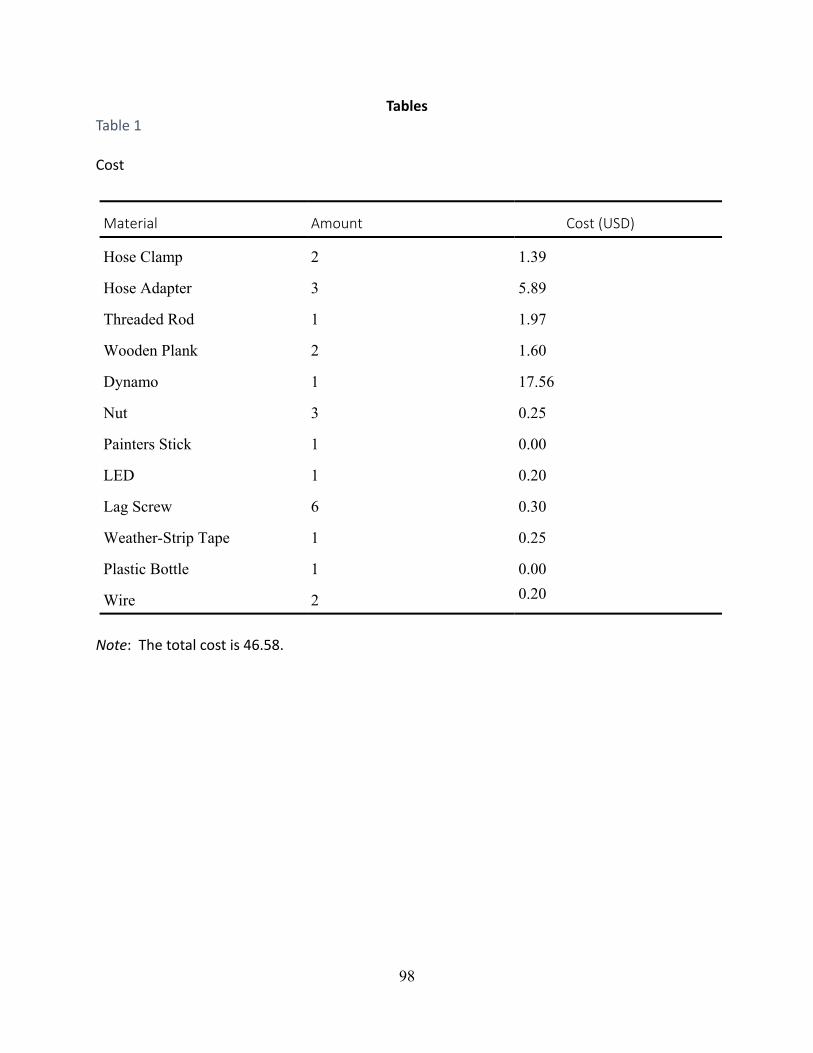
98
Tables Table 1
Cost
Note: The total cost is 46.58.
Material Amount Cost (USD)
Hose Clamp 2 1.39
Hose Adapter 3 5.89
Threaded Rod 1 1.97
Wooden Plank 2 1.60
Dynamo 1 17.56
Nut 3 0.25
Painters Stick 1 0.00
LED 1 0.20
Lag Screw 6 0.30
Weather-Strip Tape 1 0.25
Plastic Bottle 1 0.00
Wire 2 0.20
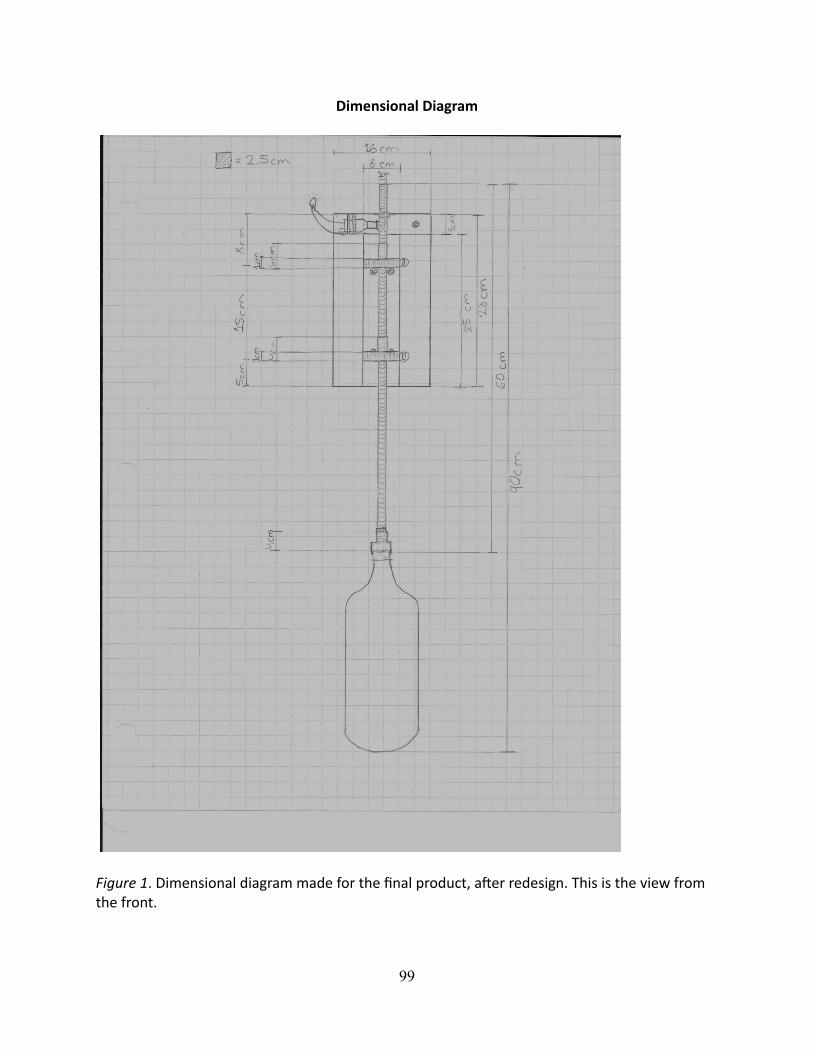
99
Dimensional Diagram
Figure 1. Dimensional diagram made for the final product, after redesign. This is the view from the front.
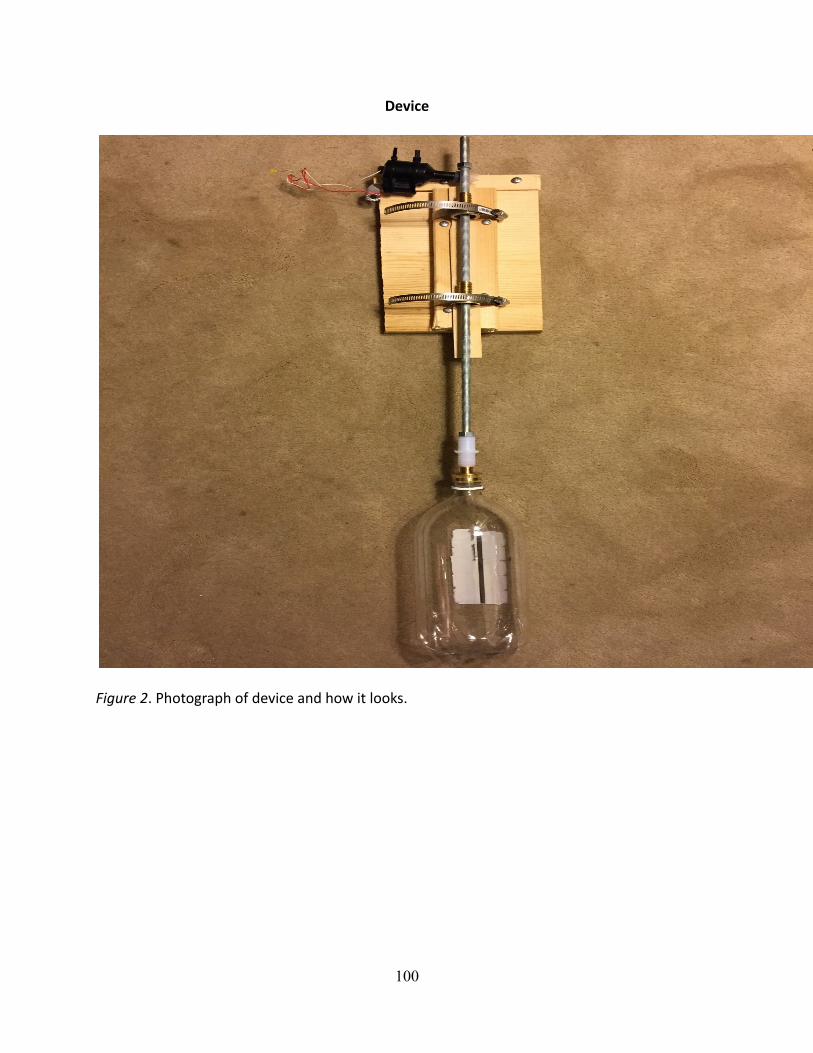
100
Device
Figure 2. Photograph of device and how it looks.
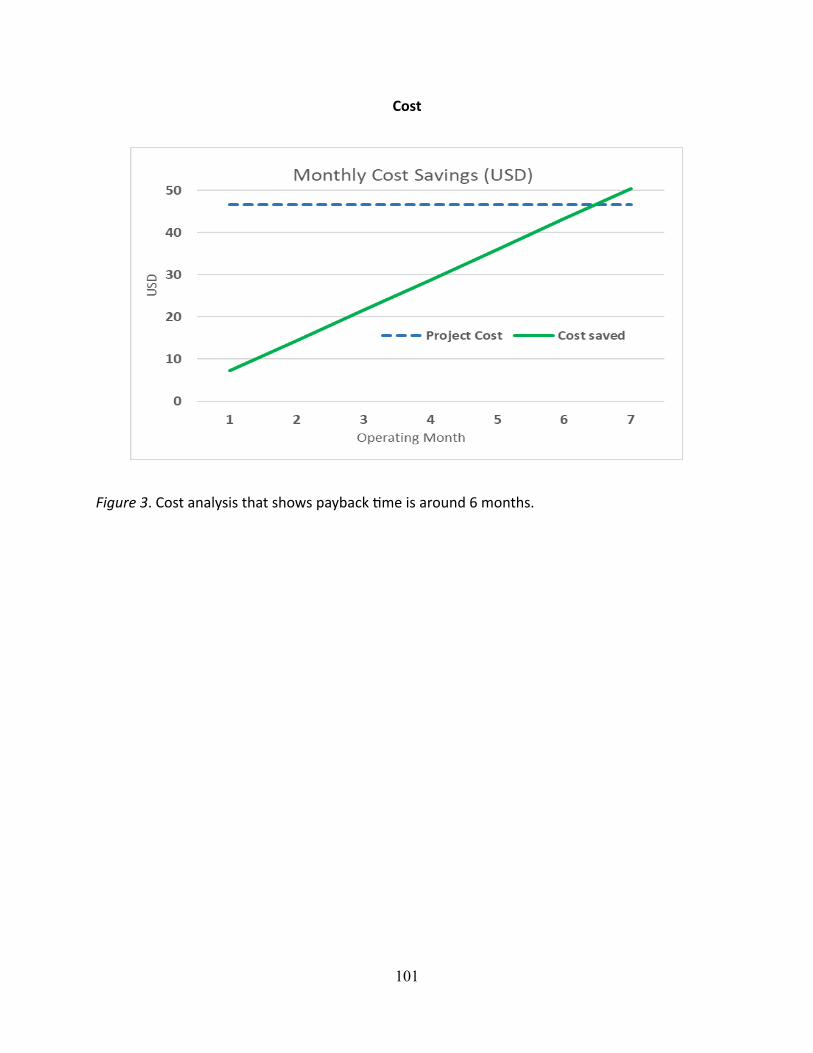
101
Cost
Figure 3. Cost analysis that shows payback time is around 6 months.