Embed Size (px)
DESCRIPTION
Nigel_Cross_-_Engineering_Desi.pdf
Citation preview


Engineering Design Methods Strategies for Product Design
THIRD EDITION
Nigel Cross
The Open University, Mi/ton Keynes, UK
JOHN WILEY & SONS, LTD Ch iches te r - New Y o r k . Weinheim • B r i s b a n e . S i n g a p o r e . Toronto

Copyright © 2000 John Wiley & Sons Ltd, The Atrium, Southem Gate, Chichester, West Sussex PO 19 8SQ, England
Telephone (+44) 1243 779777
Email (for orders and customer service enquiries): [email protected] Visit our Home Page on www.wileyeurope.com or www.wiley.com
Reprinted September 2001, November 2003, July 2004, June 2005
All Rights Reserved. No part of this publication may be reproduced, stored in a retrieval system or transmitted in any form or by any means, electronic, mechanical, photocopying, recording, scanning or otherwise, except under the terms of the Copyright, Designs and Patents Act 1988 or under the terms of a licence issued by the Copyright Licensing Agency Ltd, 90 Tottenham Court Road, London Wl T 4LP, UK, without the permission in writing of the Publisher. Requests to the Publisher should be addressed to the Permissions Department, John Wiley & Sons Ltd, The Atrium, Southern Gate, Chichester, West Sussex PO 19 8SQ, England, or emailed to [email protected], or faxed to (+44) 1243 770571.
This publication is designed to provide accurate and authoritative information in regard to the subject matter covered. It is sold on the understanding that the Publisher is not engaged in rendering professional services. If professional advice or other expert assistance is required, the services of a competent professional should be sought.
Other Wiley Editorial Offices
John Wiley & Sons Inc., 111 River Street, Hoboken, NJ 07030, USA
Jossey-Bass, 989 Market Street, San Francisco, CA 94103-1741, USA
Wiley-VCH Verlag GmbH, Boschstr. 12, D-69469 Weinheim, Germany
John Wiley & Sons Australia Ltd, 33 Park Road, Milton, Queensland 4064, Australia
John Wiley & Sons (Asia) Pte Ltd, 2 Clementi Loop #02-01, Jin Xing Distripark, Singapore 129809
John Wiley & Sons Canada Ltd, 22 Worcester Road, Etobicoke, Ontario, Canada M9W 1L1
Wiley also publishes its books in a variety of electronic formats. Some content that appears in print may not be available in electronic books.
Library of Congress Cataloging-in-Publication Data
Cross, Nigel, 1942- Engineering design methods: strategies for product design / Nigel Cross - 3rd ed.
p. cm Includes bibliographical references and index. ISBN 0-471-87250-4 1. Engineering design. 1. Title
TA174.C76 2000 620'.0042-dc21
00-043339
British Library Cataloguing in Publication Data
A catalogue record for this book is available from the British Library
ISBN 10:0-471-87250-4 (H/B) ISBN 13:978-0-471-87250-4 (H/B)
Typeset in 10%/12½ pt Palatino by Aarontype, Bristol. Printed and bound in Great Britain by Antony Rowe Ltd, Chippenham, Wiltshire. This book is printed on acid-free paper responsibly manufactured from sustainable forestry in which at least two trees are planted for each one used for paper production.

Acknowledgments
The author and publisher gratefully acknowledge the following sources and permissions to reproduce figures.
Figure 1: T.A. Thomas, Technical Illustration, McGraw-Hill. Figure 2: J. Fenton, Vehicle Body Layout and Analysis, Mechanical Engineering Publications. Figure 3: A.L.H. Dawson. Figure 4: A. Howarth. Figure 6: S. Dwarakanath & L. Blessing, in Analysing Design Activity, Wiley. Figure 7: Biblioteca Ambrosiana, Milan. Figure 8: C. Moore and Van Nostrand Reinhold. Figure 10: M.J. French, Conceptual Design for Engineers, The Design Council. Figures 11, 12, 13: B. Hawkes & R. Abinett, The Engineering Design Process, Longman. Figures 16, 25, 34, 35, 39, 42, 43, 53, 64, 65, 66: G. Pahl & W. Beitz, Engineering Design, The Design Council/ Springer-Verlag. Figures 17, 18: VDI-Verlag. Figure 19: L. March, The Architecture of Form, Cambridge University Press. Figure 23: J.C. Jones, Design Methods, Wiley. Figure 26: E. Tjalve, A Short Course in Industrial Design, Butterworth. Figure 27: S. Pugh, Total Design, Addison Wesley. Figures 32, 33: E. Krick, An Introduction to Engineering, Wiley. Figures 36, 3 7, 38: V. Hubka, M.M. Andreasen & W.E. Eder, Practical Studies in Systematic Design, Butterworth. Figure 44: S. Love, Planning and Creating Successful Engineered Designs, Advanced Professional Development. Figure 45: K. Hurst, Engineering Design Principles, Edward Arnold. Figures 46, 69: D.G. Ullman, The Mechanical Design Process, McGraw-Hill. Figures 47, 48: R. Ramaswamy & K. Ulrich, in Design Theory and Methodology 92, ASME. Figures 49, 50: J.R. Hauser & D. Clausing, Harvard Business Review. Figure 52: K.W. Norris, in Conference on Design Methods, Pergamon. Figures 54, 55: V. Hubka, Principles of Engineering Design, Butterworth. Figures 56, 57: K. Ehrlenspiel, in ICED 87, Heurista. Figures 58, 59: M. Tovey & S. Woodward, Design Studies, Elsevier Science. Figure 63: U. Pighini, Design Studies, Elsevier Science. Figures 67, 68: M. Shahin, Design Studies, Elsevier Science. Figures 70, 71, 72: K. Ulrich & S. Eppinger, Product Design and Development, McGraw-Hill. Figures 73, 74:

viii Acknowledgments
T.C. Fowler, Value Analysis in Design, Van Nostrand Reinhold. Figures 75, 76: Engineering Industry Training Board. Figure 77: A.H. Redford, Design Studies, Elsevier Science. Figures 78, 79, 80: The Open University. Figure 86: British Standards Institution. Figure 87: Richard Heame.

Introduction
This book offers a strategic approach and a number of tactics as aids for designing successful products. It is intended primarily for use by students and teachers of engineering design and indus- trial design. Its main emphasis is on the design of products that have an engineering content, although most of the principles and approaches that it teaches are relevant to the design of all kinds of products. It is essentially concerned with problem formulation and the conceptual and embodiment stages of design, rather than the detail design which is the concern of most engineering texts. The book can most effectively be used in conjunction with projects and exercises that require the exploration and clarification of design problems and the generation and evaluation of design solutions.
This third edition of the book has been fully revised and updated. The book has been structured more explicitly into its three parts, and two new chapters have been added: Chapter 2 on Design Ability, and Chapter 13 on Product Development. Chapter 2 develops and extends some brief content in the previous editions, drawing upon research into the nature of design ability by the author and others. Chapter 13 puts product design into the broader context of the business process of planning and developing new products. In the Design Methods chapters (Chapters 5-11), several new examples of the application of design methods in practice have been introduced.
The contents of the book are divided into three parts. Part One, Understanding Design, provides an overview of the nature of design activity, designers' natural skills and abilities, and models of the design process. Chapter I introduces the kinds of activities that designers normally undertake, and discusses the particular nature and structure of design problems. Chapter 2 considers and discusses the cognitive abilities that designers call upon in tackling design problems, and outlines some of the issues involved in learning and developing these 'designerly' skills and abilities. Chapter 3 reviews several of the models of the design process which have been developed in order to help designers structure

x Introduction
their approach to designing, and suggests a new hybrid, integrative model that combines both the procedural and the structural aspects of the nature of design.
Part Two, Doing Design, explains the details of how to do design, at various stages of the design process. Chapter 4 reviews the new field of design methods, describes a number of methods that help to stimulate creative design thinking, and introduces the rational methods which are presented in the following chapters. Chapters 5 to 11 constitute a manual of design methods (the tactics of design), presented in an independent-learning format, i.e. students can be expected to learn the principle features of the methods directly from the book. These seven chapters follow a typical procedural sequence for the design process, providing instruction in the use of appropriate methods within this pro- cedure. Each chapter presents a separate method, in a standard format of a step-by-step procedure, a summary of the steps and a set of practical examples concluding with a fully worked example. The seven methods included are:
objectives tree
function analysis
performance specification
quality function deployment
morphological chart
weighted objectives
value engineering
Part Three, Managing Design, is concerned with managing the design process, from the viewpoint of both the product designer and the business manager. Chapter 12 outlines a strategic approach to the design process, utilizing the most appropriate combination of creative and rational methods to suit the designer and the design project. Reflecting the approach that is implicit throughout the book, the emphasis is on a flexible design response to problems and on ensuring a successful outcome in terms of good product design. Chapter 13 puts the role of design into a broader perspective of new product development, showing that successful product design

Introduction xi
is framed on the one side by business strategy and on the other side by consumer choice.
The book embodies a concept of 'product design' that combines the two more traditional fields of engineering design and indus- trial design: the new concept of 'industrial design engineering'. Although intended primarily for students of product des ign- no matter whether their courses are biased more towards engineering or industrial design - the book is also useful as an introduction to design for the many teachers and practitioners in engineering who found this subject sadly lacking in their own education.

Part One
Understanding Design

The Nature of Design
Design Activities
People have always designed things. One of the most basic characteristics of human beings is that they make a wide range of tools and other artefacts to suit their own purposes. As those purposes change, and as people reflect on the currently-available artefacts, so refinements are made to the artefacts, and sometimes completely new kinds of artefacts are conceived and made. The world is therefore full of tools, utensils, machines, buildings, furni- ture, clothes, and many other things that human beings apparently need or want in order to make their lives better. Everything around us that is not a simple untouched piece of Nature has been designed by someone.
In traditional craft-based societies the conception or 'designing' of artefacts is not really separate from making them; that is to say, there is usually no prior activity of drawing or modelling before the activity of making the artefact. For example, a potter will make a pot by working directly with the clay, and without first making any sketches or drawings of the pot. In modern industrial societies, however, the activities of designing and of making artefacts are usually quite separate. The process of making something can- not normally start before the process of designing it is complete. In some cases- for example, in the electronics industry- the period of designing can take many months, whereas the average period of making each individual artefact might be measured only in hours or minutes.
Perhaps a way towards understanding this modern design activity is to begin at the end; to work backwards from the point where designing is finished and making can start. If making cannot

4 The Nature of Design
start before designing is finished, then at least it is clear what the design process has to achieve. It has to provide a description of the artefact that is to be made. In this design description, almost nothing is left to the discretion of those involved in the process of making the artefact; it is specified down to the most detailed dimensions, to the kinds of surface finishes, to the materials, their colours, and so on.
In a sense, perhaps, it does not matter how the designer works, so long as he or she produces that final description of the proposed artefact. When a client asks a designer for 'a design', that is what they want: the description. The focus of all design activities is that end-point.
Communication of designs
The most essential design activity, therefore, is the production of a final description of the artefact. This has to be in a form that is understandable to those who will make the artefact. For this reason, the most widely-used form of communication is the drawing. For a simple artefact, such as a door-handle, one drawing would prob- ably be enough, but for a larger more complicated artefact such as a whole building the number of drawings may well run into hundreds, and for the most complex artefacts, such as chemical process plants, aeroplanes or major bridges, then thousands of drawings may be necessary.
These drawings will range from rather general descriptions (such as plans, elevations and general arrangement drawings) that give an 'overview' of the artefact, to the most specific (such as sections and details) that give precise instructions on how the artefact is to be made. Because they have to communicate precise instructions, with minimal likelihood of misunderstanding, all the drawings are themselves subject to agreed rules, codes and con- ventions. These codes cover aspects such as how to lay out on one drawing the different views of an artefact relative to each other, how to indicate different kinds of material, and how to specify dimensions. Learning to read and to make these drawings is an important part of design education.
The drawings will often contain annotations of additional information. Dimensions are one such kind of annotation. Written instructions may also be added to the drawings, such as notes on the materials to be used (as in Figure 1).

Design Activites 5
' \
l l
~ ~ \' I
: Ii
II
,.~.,~
.,~ .. •
,~.. ~
-_~
:I-: II"
i ;~i -
,. ~'
i
\,\ \
o ,...,
I,l,
bO
.,l,
bO
. .,.it i,l.,
.,1, b
O
0 .,..,
> 0 0 E
N
.,..~
0 ,,,.~
E
E
0 Ill =

6 The Nature of Design
Other kinds of specifications as well as drawings may also be required. For example, the designer is often required to produce lists of all the separate components and parts that will make up the complete artefact, and an accurate count of the numbers of each component to be used. Written specifications of the standards of workmanship or quality of manufacture may also be neces- sary. Sometimes, an artefact is so complex, or so unusual, that the designer makes a complete three-dimensional mock-up or proto- type version in order to communicate the design.
However, there is no doubt that drawings are the most useful form of communication of the description of an artefact that has yet to be made. Drawings are very good at conveying an understanding of what the final artefact has to be like, and that understanding is essential to the person who has to make the artefact.
Nowadays it is not always a person who makes the artefact; some artefacts are made by machines that have no direct human operator. These machines might be fairly sophisticated robots, or just simpler numerically-controlled tools such as lathes or milling machines. In these cases, therefore, the final specification of a design prior to manufacture might not be in the form of drawings but in theform of a string of digits stored on a disk, or in computer software that controls the machine's actions. It is therefore possible to have a design process in which no final communication drawings are made, but the ultimate purpose of the design process remains the communication of proposals for a new artefact.
Evaluation of designs
However, for the foreseeable future, drawings of various kinds will still be used elsewhere in the design process. Even if the final description is to be in the form of a string of digits, the designer will probably want to make drawings for other purposes.
One of the most important of these other purposes is the checking, or evaluating, of design proposals before deciding on a final version for manufacture. The whole point of having the pro- cess of design separated from the process of making is that proposals for new artefacts can be checked before they are put into production. At its simplest, the checking procedure might merely be concerned with, say, ensuring that different components will fit together in the final design; this is an attempt to foresee possible

Design Activites 7
errors and to ensure that the final design is workable. More complicated checking procedures might be concerned with, say, analysing the forces in a proposed design to ensure that each component is designed to withstand the loads on it (Figure 2); this involves a process of refining a design to meet certain criteria such as maximum strength, or minimum weight or cost.
This process of refinement can be very complicated and can be the most time-consuming part of the design process. Imagine, for example, the design of a bridge. The designer must first propose the form of the bridge and the materials of which it will be made. In order to check that the bridge is going to be strong enough and stiff enough for the loads that it will carry, the designer must analyse the structure to determine the ways in which loads will be carried by it, what those loads will be in each member of the struc- ture, what deflections will occur, and so on. After a first analysis, the designer might realize, or at least suspect, that changing the locations or angles of some members in the bridge will provide a more efficient distribution of loadings throughout the whole struc- ture. However, these changes will mean that the whole structure will have to be re-analysed and the loads recalculated.
In this kind of situation it can be easy for the designer to become trapped in an iterative loop of decision-making, where improve- ments in one part of the design lead to adjustments in another part which lead to problems in yet another part. These problems may mean that the earlier 'improvement' is not feasible. This iteration is a common feature of designing.
Nevertheless, despite these potential frustrations, this process of refinement is a key part of designing. It consists, firstly, of ana- lysing a proposed design, and for this the designer needs to apply a range of engineering science or other knowledge. In many cases, specialists with more expert knowledge are called in to carry out these analyses. Then, secondly, the results of the analysis are evaluated against the design criteria: does the design come within the cost limit, does it have enough space within it, does it meet the minimum strength requirements, does it use too much fuel, and so on. In some cases, such criteria are set by government regulations, or by industry standards; others are set by the client or customer.
Many of the analyses are numerical calculations, and therefore again it is possible that drawings might not be necessary. However, specialists who are called in to analyse certain aspects of the design

8 The Nature of Design
Rear Front Luggage 2 persons 2 persons suspension suspensIon
50kg 182kg 182kg of engine 38kg of engine 74kg
Qkg Mgn.kg
210 -50
105 -25
0 0
- 1 0 5 2 5
-210 50
-315 75
-420 100
-525 125
Figure 2 Evaluation: calculation of the shear forces and bending moments in the body of a small automobile

Design Activites 9
will almost certainly want a drawing, or other model of the design, before they can start work. Visualizations of the proposed design may also be important for the client and designer to evaluate aspects such as appearance, form and colour.
Generation of designs
Before any of these analyses and evaluations can be carried out the designer must, of course, first generate a design proposal. This is often regarded as the mysterious, creative part of designing, the client makes what might well be a very brief statement of require- ments, and the designer responds (after a suitable period of time) with a design proposal, as if conjured from nowhere. In reality, the process is less 'magical' than it appears.
In most cases, for instance, the designer is asked to design something similar to that which he or she has designed before, and therefore there is a stock of previous design ideas on which to draw. In some cases only minor modifications are required to a previous design.
Nevertheless, there is something mysterious about the human ability to propose a design for a new (or even just a modified) artefact. It is perhaps as mysterious as the human ability to speak a new sentence, whether it is completely new, or just a modification of one heard, read or spoken before.
This ability to design depends partly on being able to visualize something internally, in 'the mind's eye', but perhaps it depends even more on being able to make external visualizations. Once again, drawings are a key feature of the design process. At this early stage of the process, the drawings that the designer makes are not usually meant to be communications to anyone else. Essentially, they are communications with oneself, a kind of think- ing aloud. As the example of the concept sketch for the 1950s Mini car shows (Figure 3), at this stage the designer is thinking about many aspects together, such as materials, components, structure and construction, as well as the overall form, shapes and functions.
Exploration of designs
At the start of the design process, the designer is usually faced with a very poorly defined problem; yet he or she has to come up with a well-defined solution. If one thinks of the problem as a territory, then it is largely unexplored and unmapped, and perhaps

'1 l::l The Nature of Design
!f
- _ ~ , ~ .....
Figure 3
~ _
7 ~
ii ii ii !iiiiiii! ii i iiill !I !I
; ~ v f
z:
?5;' ......
Generation: Concept sketch for the Mini car by its designer Alec Issigonis
imaginary in places! As Jones (1981) has suggested, and as will be discussed in Chapter 12, it is therefore appropriate to think of the designer as an explorer, searching for the undiscovered 'treasure' of a satisfactory solution concept.
Equally, if one thinks of all potential solutions as occupying a kind of .solution space, then that, too, is relatively undefined and perhaps infinite. The designer's difficulties are therefore two-fold: understanding the problem and finding a solution.
Often these two complementary aspects of design (problem and solution) have to be developed side-by-side. The designer makes a solution proposal and uses that to help understand what the problem really is and what appropriate solutions might be like. The very first conceptualizations and representations of problem and solution are therefore critical to the kinds of searches and other

Design Problems 11
procedures that will follow, and so to the final solution that will be designed.
The exploration of design solution-and-problem is also often done through early sketching of tentative ideas. It is necessary because normally there is no way of directly generating an optimum solution from the information provided in the design brief. Quite apart from the fact that the client's brief to the designer may be rather vague, there will be a wide range of criteria to be satisfied, and probably no single objective that must be satisfied above all others, as suggested in the problem-solution 'explora- tion' in Figure 4.
Design Problems
Design problems normally originate as some form of problem statement provided to the designer by someone else, the client or the company management. These problem statements, normally called a design brief, can vary widely in their form and content. At one extreme, they might be something like the statement made by President Kennedy in 1961, setting a goal for the USA, 'before the end of the decade, to land a man on the moon and bring him back safely'. In this case, the goal was fixed, but the means of achieving it were very uncertain. The only constraint in the brief was one of time - before the end of the decade. The designers were given a completely novel problem, a fixed goal, only one con- straint, and huge resources of money, materials and people. This is quite an unusual situation for designers to find themselves in!
At the other extreme is the example of the brief provided to the industrial designer Eric Taylor, for an improved pair of photographic darkroom forceps. According to Taylor, the brief originated in a casual conversation with the managing director of the photographic equipment company for which he worked, who said to him, 'I was using these forceps last night, Eric. They kept slipping into the tray. I think we could do better than that.' In this case, the brief implied a design modification to an existing product, the goal was rather vague, 'that [they] don't slip into the tray', and the resources available to the designer would have been very limited for such a low-cost product. Taylor's re-design provided

'12 The Nature of Design
T I I I G~JlIPOll11' l SOl.All I L I I ' I R I I o~I~I~, CAI~
t
/I,"~,~.,
r
: i , .
! ~ ~ 7 ~ / , ~, .
t ~
t
:' n ~ d ) " , j
(
~ ~ ~ ,4,-
,,~ ~ I ~
.,w,4 ~ 4 r .,~.,i / ¢ 2 r r . ~ , . ~ ~.~,p e , , ~ , e',~ .
Figure 4 Exploration: an example of problem and solution being explored together for the Africar, a simple but robust automobile suitable for conditions in developing countries
ridges on the handles of the forceps, to prevent them slipping against the side of the developing-tray.
Somewhere between these extremes would fall the more normal kind of design brief. A typical example might be the follow- ing brief provided to the design department by the planning

Design Problems 13
department of a company manufacturing plumbing fittings. It is for a domestic hot and cold water mixing tap that can be operated with one hand. (Pahl and Beitz, 1984).
One-handed water mixing tap
Required: one-handed household water mixing following characteristics:
tap with the
Throughput 101/min Maximum pressure 6 bar Normal pressure 2 bar Hot water temperature 60°C Connector size 10mm
Attention to be paid to appearance. The firm's trade mark to be prominently displayed. Finished product to be marketed in two years' time. Manufacturing costs not to exceed DM 30 each at a production rate of 3000 taps per month.
What these three examples of design problems have in common is that they set a goal, some constraints within which the goal must be achieved, and some criteria by which a successful solution might be recognized. They do not specify what the solution will be, and there is no certain way of proceeding from the statement of the problem to a statement of the solution, except by designing. Unlike some other kinds of problem, the person setting the prob- lem does not know what the answer is, but they will recognize it when they see it.
Even this last statement is not always true; sometimes clients do not recognize the design solution when they see it. A famous example of early Modem Architecture was the Tugendhat House in Brno, Czechoslovakia, designed in 1930 by Ludwig Mies van der Rohe. Apparently the client had approached the architect after seeing some of the rather more conventional houses that he had designed. According to Mies van der Rohe, when he showed the surprising new design to the client, 'He wasn't very happy at first. But then we smoked some good cigars.., and we drank some glasses of a good Rhein wine.., and then he began to like it very much.'

t 4 The Nature of Design
So the solution that the designer generates may be something that the client 'never imagined might be possible', or perhaps even 'never realised was what they wanted'. Even a fairly precise prob- lem statement gives no indication of what a solution must be. It is this uncertainty that makes designing such a challenging activity.
Ill-defined problems
The kinds of problem that designers tackle are regarded as ill-defined or ill-structured, in contrast to well-defined or well- structured problems such as chess-playing, crossword puzzles or standard calculations. Well-defined problems have a clear goal, often one correct answer, and rules or known ways of proceeding that will generate an answer. The characteristics of ill-defined problems can be summarised as follows.
There is no definitive formulation of the problem When the problem is initially set, the goals are usually vague, and many constraints and criteria are unknown. The problem context is often complex and messy, and poorly understood. In the course of problem-solving, temporary formulations of the problem may be fixed, but these are unstable and can change as more information becomes available.
Any problem formulation may embody inconsistencies The problem is unlikely to be internally consistent; many conflicts and inconsistencies have to be resolved in the solution. Often, inconsistencies emerge only in the process of problem-solving.
Formulations of the problem are solution-dependent Ways of formulating the problem are dependent upon ways of solving it; it is difficult to formulate a problem statement without implicitly or explicitly referring to a solution concept. The way the solution is conceived influences the way the problem is conceived.
Proposing solutions is a means of understanding the problem Many assumptions about the problem, and specific areas of uncertainty can be exposed only by proposing solution concepts. Many constraints and criteria emerge as a result of evaluating solution proposals.

Problem Structures t 5
There is no definitive solution to the problem Different solutions can be equally valid responses to the initial problem. There is no objective true-or-false evaluation of a solu- tion; but solutions are assessed as good or bad, appropriate or inappropriate.
Design problems are widely recognised as being ill-defined problems. It is usually possible to take some steps towards improv- ing the initial definition of the problem, by questioning the client, collecting data, carrying out research, etc. There are also some rational procedures and techniques which can be applied in helping to solve ill-defined problems. However, the designer's traditional approach, as suggested in some of the statements about ill-defined problems listed above, is to try to move fairly quickly to a potential solution, or set of potential solutions, and to use that as a means of further defining and understanding the problem.
Problem Structures
However, even when the designer has progressed well into the definition of a solution, difficulties in the problem structure may well still come to light. In particular, sub-solutions can be found to be inter-connected with each other in ways that form a pernicious, circular structure to the problem, e.g. a sub-solution that resolves a particular sub-problem may create irreconcilable conflicts with other sub-problems.
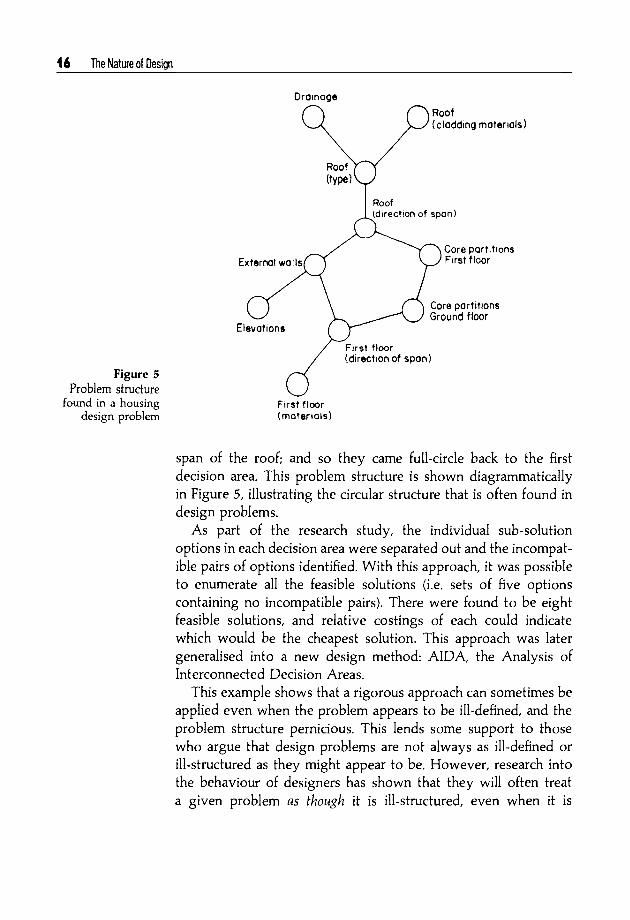
An example of this pernicious problem structure was found in a study of housing design by Luckman (1984). The architects identified five decision areas, or sub-problems, concerned with the directions of span of the roof and first floor joists, and the provision of load-bearing or non-load-bearing walls and partitions at ground- and first-floor levels. Making a decision in one area (say, the direction of roof span) had implications for the first-floor partitions, and therefore the ground-floor partitions, which had implications for the direction of span of first-floor joists, and therefore for which of the external walls would have to be designed to be load-bearing. This not only had implications for the design of the external wall elevations, but also for the direction of
4 6 The Nature of Design
Drainage Roof (cladding materials)
External walls
Roof (type)
Roof (direction of span)
Core part~hons First floor
Figure 5 Problem structure
found in a housing design problem
Elevations
First floor (matertols)
Core partit,ons Ground floor
First floor (direction of span)
span of the roof; and so they came full-circle back to the first decision area. This problem structure is shown diagrammatically in Figure 5, illustrating the circular structure that is often found in design problems.
As part of the research study, the individual sub-solution options in each decision area were separated out and the incompat- ible pairs of options identified. With this approach, it was possible to enumerate all the feasible solutions (i.e. sets of five options containing no incompatible pairs). There were found to be eight feasible solutions, and relative costings of each could indicate which would be the cheapest solution. This approach was later generalised into a new design method: AIDA, the Analysis of Interconnected Decision Areas.
This example shows that a rigorous approach can sometimes be applied even when the problem appears to be ill-defined, and the problem structure pernicious. This lends some support to those who argue that design problems are not always as ill-defined or ill-structured as they might appear to be. However, research into the behaviour of designers has shown that they will often treat a given problem as though it is ill-structured, even when it is

Problem S
tructures 1
7
E
0 Q,I
> o o,..~
C3
I l t I t ~
<s
S
1~
s S
e,t
z <',
I~ ,,o
~ 0
.<
.o V
m
:3
18 The Nature of Design
presented as a well-structured problem, so that they can create something innovative.
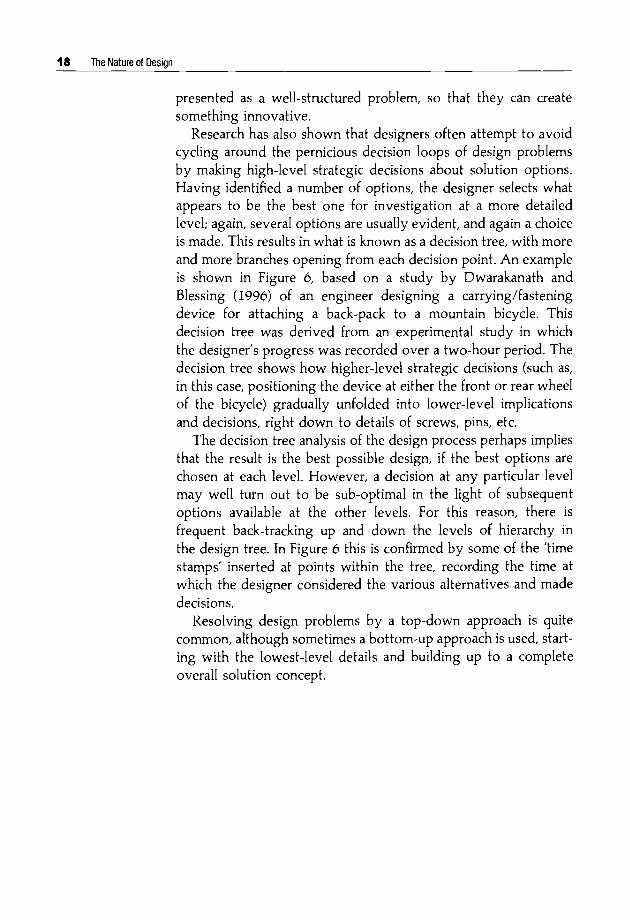
Research has also shown that designers often attempt to avoid cycling around the pernicious decision loops of design problems by making high-level strategic decisions about solution options. Having identified a number of options, the designer selects what appears to be the best one for investigation at a more detailed level; again, several options are usually evident, and again a choice is made. This results in what is known as a decision tree, with more and more branches opening from each decision point. An example is shown in Figure 6, based on a study by Dwarakanath and Blessing (1996) of an engineer designing a carrying/fastening device for attaching a back-pack to a mountain bicycle. This decision tree was derived from an experimental study in which the designer's progress was recorded over a two-hour period. The decision tree shows how higher-level strategic decisions (such as, in this case, positioning the device at either the front or rear wheel of the bicycle) gradually unfolded into lower-level implications and decisions, right down to details of screws, pins, etc.
The decision tree analysis of the design process perhaps implies that the result is the best possible design, if the best options are chosen at each level. However, a decision at any particular level may well turn out to be sub-optimal in the light of subsequent options available at the other levels. For this reason, there is frequent back-tracking up and down the levels of hierarchy in the design tree. In Figure 6 this is confirmed by some of the 'time stamps' inserted at points within the tree, recording the time at which the designer considered the various alternatives and made decisions.
Resolving design problems by a top-down approach is quite common, although sometimes a bottom-up approach is used, start- ing with the lowest-level details and building up to a complete overall solution concept.

Design Ability
What Designers Say
The wish to design things is inherent in human beings, and design is not something that has always been regarded as needing special abilities. It is only with the emergence and growth of industrial societies that the ability to design has become regarded as a specialised talent. Although there is so much design activity going on in the world, the ways in which people design are actually rather poorly understood. It has been thought that perhaps many people possess design ability to some degree, but that only a few people have a particular design 'talent'. However, there is now a growing body of knowledge about the nature of designing, about design ability and how to develop it, and about the design process and how to improve it.
When designers are asked to discuss their abilities, and to explain how they work, a few common themes emerge. One theme is the importance of creativity and intuition in design, even in engineering design. For example, the architect and engineering designer Jack Howe has said:
I believe in intuition. I think that's the difference between a designer and an engineer... I make a distinction between engineers and engi- neering designers... An engineering designer is just as creative as any other sort of designer.
Some rather similar comments have been made by the industrial designer Richard Stevens:
A lot of engineering design is intuitive, based on subjective thinking. But an engineer is unhappy doing this. An engineer wants to test;
20 Design Ability
test and measure. He's been brought up this way and he's unhappy if he can't prove something. Whereas an industrial designer.., is entirely happy making judgements which are intuitive.
Another theme that emerges from what designers say about their abilities is based on the recognition that problems and solutions in design are closely interwoven; that the solution isn't always a straightforward answer to the problem. For example, the furniture designer Geoffrey Harcourt commented on one of his creative designs like this:
As a matter of fact, the solution that I came up with wasn't a solution to the problem at all. I never saw it as that. . . But when the chair was actually put together (it) in a way quite well solved the problem, but from a completely different angle, a completely different point of view.
A third common theme to emerge is the need to use sketches, drawings or models of various kinds as a way to explore the problem and solution together. The conceptual thinking processes of the designer seem to be based on the development of ideas through their external expression in sketches. As the engineer- architect Santiago Calatrava said:
To start with you see the thing in your mind and it doesn't exist on paper and then you start making simple sketches and organising things and then you start doing layer after layer.., it is very much a dialogue.
This dialogue occurs through the designer's perception of the sketched concepts, and reflection on the ideas that they represent and their implications for the resolution of the problem. The designer responds to the perceptions, reflections and implications, and so the dialogue between internal mental processes and external representations continues.
The quotations above are taken from interviews conducted with a number of successful and eminent designers by Davies (1985) and Lawson (1994). The designers' comments support some of the hypotheses that have emerged from more objective observational studies of designers at work, and other research that has been
How DesignersThink 21
conducted into the nature of design. Some of this research reflects the view that designers have a particular 'designerly' way of thinking and working.
How Designers Think
In an experimental research study, Lawson (1984) compared the ways in which designers (in this case architects) and scientists solved the same problem. The scientists tended to use a strategy of systematically trying to understand the problem, in order to look for underlying rules which would enable them to generate an optimum solution. In contrast, the designers tended to make initial explorations and then suggest a variety of possible solu- tions until they found one that was good, or at least satisfac- tory. The evidence from the experiments suggested that scientists problem-solve by analysis, whereas designers problem-solve by synthesis; scientists use 'problem-focused strategies' and designers use 'solution-focused strategies'.
Some other studies have also suggested that designers tend to use conjectures about solution concepts as the means of devel- oping their understanding of the problem. Darke (1984) found that designers impose a primary generator onto the problem, in order to narrow the search space and generate early solution concepts. This primary generator is usually based on a tightly-restricted set of constraints or solution possibilities derived from the design problem. Since 'the problem' cannot be fully understood in isola- tion from consideration of 'the solution', it is natural that solution conjectures should be used as a means of helping to explore and understand the problem formulation. Making sketches of solution concepts is one way that helps the designer to identify their conse- quences, and to keep the problem exploration going, in what Sch6n (1983) called the 'reflective conversation with the situation' that is characteristic of design thinking.
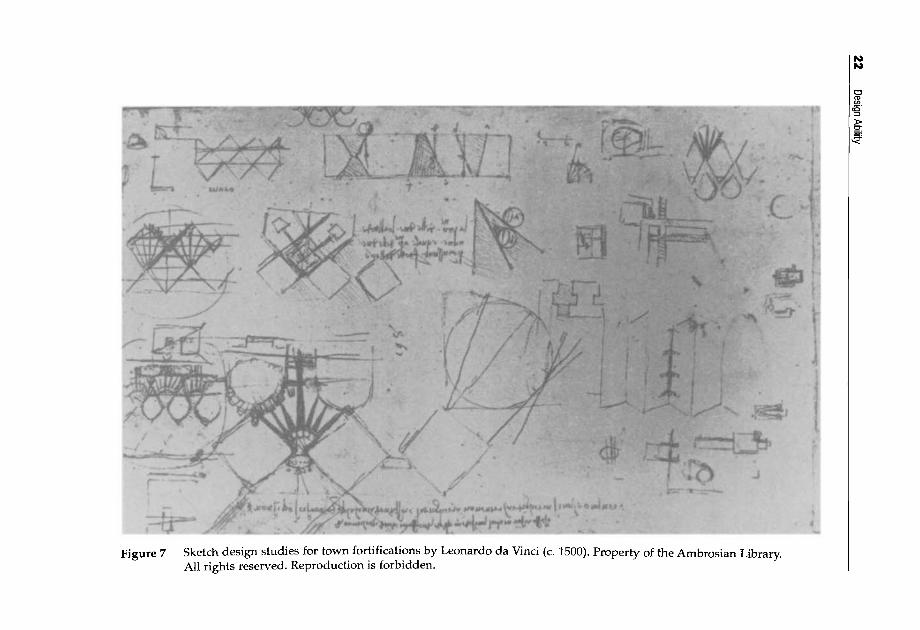
Drawing and sketching have been used in design for a long time, certainly since long before the Renaissance, but the period since that time has seen a massive growth in the use of drawings, as designed objects have become more complex and more novel. Many of Leonardo da Vinci's drawings of machines and inventions
22 Design Ability
• ........ ~
.~
! ¸
:-~ -
: i~ i: 2: : i ~::̧ :'::!!:~i~!!i:i:i!/
:¸:
~k
~~
,~,~
,~
ii~!~
i~~
~-~
-~
~ ~ ~: ......... ~
~!~i~i::~i ~:~:~-~-:~ !~:i~ ~:I~!I ~

How Designers Think 23
from the Renaissance period show one of the key aspects of design drawings, in terms of their purpose of communicating to someone else how a new product should be built, and also how it should work. Some of Leonardo's design drawings also show how a drawing can be not only a communication aid, but also a thinking and reasoning aid. For example, Leonardo's sketches for the design of fortifications (Figure 7) show how he used sight-lines and missile trajectories as lines to set up the design of the fortifications, and how his design thinking was assisted by drawing. In such drawings we see how the sketch can help the designer to consider many aspects at once; we see plans, elevations, details, trajectory lines, all being drawn together and thus all being thought about, reasoned about, all together.
Half a millenium later, we still see designers using essentially similar types of sketch to aid their design thinking. The early concept sketches for a house design by the contemporary architect Charles Moore (Figure 8) show similar kinds of representations as those used by Leonardo: plan, elevation and section all being considered together with considerations of structure and calcula- tions of dimensions and areas.
What might we learn about the nature of design thinking from looking at examples of what designers sketch? One thing that seems to appear is that sketches enable designers to handle different levels of abstraction simultaneously. Clearly this is something important in the design process. We see that designers think about the overall concept and at the same time think about detailed aspects of the implementation of that concept. Obviously not all of the detailed aspects are considered early on, because if they could do that, designers could go straight to the final set of detailed drawings. So they use the concept sketch to identify and then to reflect upon critical details, particular details that they realise might hinder or somehow significantly influence the final implementation of the complete design. This implies that, although there is a hierarchical structure of decisions, from overall concept to details, designing is not a strictly hierarchical process; in the early stages of design, the designer moves freely between different levels of detail.
The identification of critical details is part of a more general facility that sketches provide, which is that they enable identifica- tion and recall of relevant knowledge. As the architect Richard

24 Design Ability
t~Y iG~
4
.)
~ Z'~ f :' "
Figure 8 Sketch design
drawings for a small house by the
architext Charles Moore (c. 1960)
!
MacCormac has said about designing, 'What you need to know about the problem only becomes apparent as you're try- ing to solve it.' There is a massive amount of information that may be relevant, not only to all the possible solutions for a design problem, but simply to any possible solution. Any possible
Learning to Design 25
solution in itself creates the unique circumstances in which these large bodies of information interact, probably in unique ways for any one possible solution. So these large amounts of information and knowledge need to be brought into play in a selective way, being selected only when they become relevant, as the designer considers the implications of the solution concept as it develops.
Because the design problem is itself ill-defined and ill-structured, a key feature of design sketches is that they assist problem structuring through the making of solution attempts. Sketches incorporate not only drawings of tentative solution concepts but also numbers, symbols and text, as the designer relates what he knows of the design problem to what is emerging as a solution. Sketching enables exploration of the problem space and the solu- tion space to proceed together, assisting the designer to converge on a matching problem-solution pair. Problem and solution co-evolve in the design process.
Designers' use of sketches therefore gives us some considerable insight into the nature of design thinking and the resolution of design problems. These problems cannot be stated sufficiently explicitly such that solutions can be derived directly from them. The designer has to take the initiative in finding a problem starting point and suggesting tentative solution areas. Problem and solu- tion are then both developed in parallel, sometimes leading to a creative redefinition of the problem, or to a solution that lies out- side the boundaries of what was previously assumed to be possible.
Solution-focused strategies are therefore perhaps the best way of tackling design problems, which are by nature ill-defined. In order to cope with the uncertainty of ill-defined problems, the designer has to have the self-confidence to define, redefine and change the problem as given, in the light of solutions that emerge in the very process of designing. People who prefer the certainty of structured well-defined problems will never appreciate the delight of being a designer!
Learning to Design
An appropriate use of the 'solution-focused' approach to design is something that seems to develop with experience. Experienced

26 Design Ability
designers are able to draw on their knowledge of previous exemplars in their field of design, and they also seem to have learned the value of rapid problem-exploration through solution- conjecture. In comparison, novice designers can often become bogged down in attempts to understand the problem before they start generating solutions. For them, gathering data about the problem is sometimes just a substitute activity for actually doing any design work.
However, novice designers are also frequently found to become fixated on particular solution concepts. Early solution concepts are often found to be less than satisfactory, as problem exploration continues. Novice designers (and sometimes more experienced ones) can be loath to discard the concept and return to a search for a better alternative. Instead, they try laboriously to design-out the imperfections in the concept, producing slight improvements until something workable but perhaps far from ideal is attained. Some- times it can be much more productive to start afresh with a new design concept.
Another difference between novices and experts is that novices will often pursue a depth-first approach to a problem: sequentially identifying and exploring sub-solutions in depth, and amassing a number of partial sub-solutions that then somehow have to be amalgamated and reconciled, in a bottom-up process. Experts usually pursue predominantly breadth-first and top-down strate- gies, as recorded in the example of the expert designer's decision tree in Figure 6 (Chapter 1).
Experienced designers, like any skilled professionals, can make designing seem easy and intuitive. Because skilled design in practice therefore often appears to proceed in a rather ad hoc and unsystematic way, some people claim that learning a systematic process does not actually help student designers. However, a study by Radcliffe and Lee (1989) did show that a systematic approach can be helpful to students. They found that the use of more efficient design processes (following closer to an ideal sequence) correlated positively with both the quantity and the quality of the students' design results. Other studies have tended to confirm this.
From studies of a number of engineering designers, of varying degrees of experience and with varying exposures to education in systematic design processes, Fricke (1996) found that designers

Learning to Design 2 7
following a 'flexible-methodical procedure' tended to produce good solutions. These designers worked reasonably efficiently and followed a fairly logical procedure, whether or not they had been educated in a systematic approach. In comparison, designers either with a too-rigid adherence to a systematic procedure (behaving 'un- reasonably' methodically), or with very unsystematic approaches, produced mediocre or poor design solutions. Successful designers (ones producing better quality solutions) tended to be those who:
• clarified requirements, by asking sets of related questions which focused on the problem structure
• actively searched for information, and critically checked given requirements
• summarised information on the problem formulation into requirements and partially prioritised them
• did not suppress first solution ideas; they held on to them, but returned to clarifying the problem rather than pursuing initial solution concepts in depth
• detached themselves during conceptual design stages from fixation on early solution concepts
• produced variants but limited the production and kept an overview by periodically assessing and evaluating in order to reduce the number of possible variants.
The key to successful design therefore seems to be the effective management of the dual exploration of both the 'problem space' and the 'solution space'.
Designing is a form of skilled behaviour. Learning any skill usually relies on controlled practice and the development of techniques. The performance of a skilled practitioner appears to flow seamlessly, adapting the performance to the circumstances without faltering. However, learning is not the same as per- forming, and underneath skilled performance lies mastery of technique and procedure.

The Design Process
Descriptive Models
There have been many attempts to draw up maps or models of the design process. Some of these models simply describe the sequences of activities that typically occur in designing; other models attempt to prescribe a better or more appropriate pattern of activities.
Descriptive models of the design process usually identify the significance of generating a solution concept early in the process, thus reflecting the solution-focused nature of design thinking. This initial solution conjecture is then subjected to analysis, evaluation, refinement and development. Sometimes, of course, the analysis and evaluation show up fundamental flaws in the initial conjec- ture and it has to be abandoned, a new concept generated and the cycle started again. The process is heuristic: using previous experience, general guidelines and rules of thumb that lead in what the designer hopes to be the right direction, but with no absolute guarantee of success.
In Chapter 1 I developed a simple descriptive model of the design process, based on the essential activities that the designer performs. The end-point of the process is the communication of a design, ready for manufacture. Prior to this, the design proposal is subject to evaluation against the goals, constraints and criteria of the design brief. The proposal itself arises from the generation of a concept by the designer, usually after some initial exploration of the ill-defined problem space. Putting these four activity types in their natural sequence, we have a simple four-stage model of the design process consisting of: exploration, generation, evaluation and communication.

30 The Design Process
Figure 9 A simple four-stage model of the design
process
EXPLORATION
GENERATION
EVALUATION
COMMUNICATION
This simple four-stage model is shown diagrammatically in Figure 9. Assuming that the evaluation stage does not always lead directly onto the communication of a final design, but that some- times a new and more satisfactory concept has to be chosen, an iterative feedback loop is shown from the evaluation stage to the generation stage.
Models of the design process are often drawn in this flow- diagram form, with the development of the design proceeding from one stage to the next, but with feedback loops showing the iterative returns to earlier stages which are frequently necessary. For example, French (1985) has developed a more detailed model of the design process, shown in Figure 10, based on the following activities: analysis of problem; conceptual design; embodiment of schemes; detailing. In the diagram, the circles represent stages reached, or outputs, and the rectangles represent activities, or work in progress.
The process begins with an initial statement of a need, and the first design activity is analysis of the problem. French suggests that
the analysis of the problem is a small but important part of the over- all process. The output is a statement of the problem, and this can have three elements:

Descriptive Models 3 t
Figure 10 French's model of the design process
Conceptual design
Anolys,s of problem
Conceptual design
Embodiment of schemes
Detailing
• a statement of the design problem proper
• limitations placed upon the solution, e.g. codes of practice, statutory requirements, customers' standards, date of completion, etc.
• the criterion of excellence to be worked to.
These three elements correspond to the goals, constraints and criteria of the design brief. The activities that follow, according to French, are then as described below.
This phase takes the statement of the problem and generates broad solutions to it in the form of schemes. It is the phase that makes the greatest demands on the designer, and where there is the most scope

32 The Design Process
for striking improvements. It is the phase where engineering science, practical knowledge, production methods and commercial aspects need to be brought together, and where the most important decisions are taken.
Embodiment of schemes
In this phase the schemes are worked up in greater detail and, if there is more than one, a final choice between them is made. The end product is usually a set of general arrangement drawings. There is (or should be) a great deal of feedback from this phase to the conceptual design phase.
Detailing This is the last phase, in which a very large number of small but essential points remain to be decided. The quality of this work must be good, otherwise delay and expense or even failure will result; computers are already reducing the drudgery of this skilled and patient work and reducing the chance of errors, and will do so increasingly.
These activities are typical of conventional engineering design.
Figures 11, 12 and 13 illustrate the type of work that goes on in
each stage. The illustrations are examples from the design of a
I 6~(t 1~._...__...__.2r,,,,....E~ z ~ l~[t O,",J~, ¢ i ~ se,-,,-
< Conceptual design: I . ~ ~ t "c~ ">,, l l # ~ t , "~ ("1~ ,I It"'!¢ ~ ( ~ L alternatives for the L '1~ ~, ~,,al~ s ~-~--

Descriptive Models $8
Mo
0¢ U,'vl
P('o,,~ t~¢a¢i,,qs \
5F.,,o,.~ t.. 5¢,-o~ ',,,t~.,,._,
Wols ~o r ~S~(~ ~-~s,o~,'~
i . . ) . ~ /
O(~L~_ 5c,o,p M~-.,,,s o~ A--ow '1~'
Figure 12 Embodiment design: one concept developed in more detail
I

34 The Design Process
small concrete mixer (Hawkes and Abinett (1984)). Conceptual design is shown in Figure 11, where three alternatives are pro- posed for the drive connection from the motor to the mixing drum. Embodiment design is shown in Figure 12, where concept (c) is developed in terms of how to support and assemble the motor, drum, pulleys, etc. Figure 13 shows a small example of detail design, in which the motor mounting plate is redesigned from a welded T-shape to a channel section U-shape, after tests of a prototype found excessive vibration occurring in the original.
Prescriptive Models
As well as models that simply describe a more-or-less con- ventional, heuristic process of design, there have been several attempts at building prescriptive models of the design process. These latter models are concerned with trying to persuade or encourage designers to adopt improved ways of working. They usually offer a more algorithmic, systematic procedure to follow, and are often regarded as providing a particular design methodology.
Many of these prescriptive models have emphasised the need for more analytical work to precede the generation of solution concepts. The intention is to try to ensure that the design problem is fully understood, that no important elements of it are over- looked, and that the real problem is identified. There are plenty of examples of excellent solutions to the wrong problem!
These models have therefore tended to suggest a basic structure to the design process of analysis-synthesis-evaluation. These stages were defined by Jones (1984) in an early example of a systematic design methodology, as follows.

Prescriptive Models 3§
• Evaluation: evaluating the accuracy with which alternative designs fulfil performance requirements for operation, manufacture and sa]es before the final design is selected.
This may sound very similar to a conventional design process, but the emphases here are on performance specifications logically derived from the design problem, generating several alternative design concepts by building-up the best sub-solutions and making a rational choice of the best of the alternative designs. Such appar- ently sensible and rational procedures are not always followed in conventional design practice.
A more detailed prescriptive model was developed by Archer (1984), and is summarised in Figure 14. This includes interactions with the world outside of the design process itself, such as inputs from the client, the designer's training and experience, other sources of information, etc. The output is, of course, the communi- cation of a specific solution. These various inputs and outputs are shown as external to the design process in the flow diagram, which also features many feedback loops.
Within the design process, Archer identified six types of activity.
• Programming: establish crucial issues; propose a course of action.
• Data collection: collect, classify and store data.
• Analysis: identify sub-problems; prepare performance (or design) specifications; reappraise proposed programme and estimate.
Trolmng
1 P ° ri ; -
Experience
]

36 The Design Process
Figure 15 Archer's three-phase
summary model of the design process
Analytical phase
Creative phase
Executive phase
!:!:i:i:i:i:i:i:i: Analysis !!iiii!iiii!!i!i!i!! 1
!ii!!!ii!iii ' ii,,i,,, i ii !i|! iiiiiiiiiiiiliiiiiii!iiii!!i',i!
Communication
Programming
Data collection
l
Observation Measurement Inductive reasoning
Evaluation Judgement Deductive reasoning Decision
Description Translation Transmission
• Synthesis: prepare outline design proposals.
• Development: develop prototype design(s); prepare and execute validation studies.
• Communication: prepare manufacturing documentation.
Archer summarized this process as dividing into three broad phases: analytical, creative and executive (Figure 15). He suggested that:
One of the special features of the process of designing is that the analytical phase with which it begins requires objective observation and inductive reasoning, while the creative phase the heart of it
Prescriptive Models 37
I I I I I I I I I I . .~- . I I I I
e -
.9 i
0
o I o
o
t -
O
E I L
o l " I
I I
Task
Clarify the task Elaborate the specification
Specification
-)
Identify essential problems Establish function structures Search for solution principles Combine and firm up into concept variants Evaluate against technical and economic criteria
t Concept >
Develop preliminary layouts and form designs Select best preliminary layouts Refine and evaluate against technical and economic criteria
Preliminary layout >
Optimize and complete form designs
o Q .
E -o e-
o
l o_~
T o
o
0 ¢ -
e ~
o
. _ L ' ~
• "o o
E • . _ l - -
.9
=o "6
8
r~

38 The Design Process
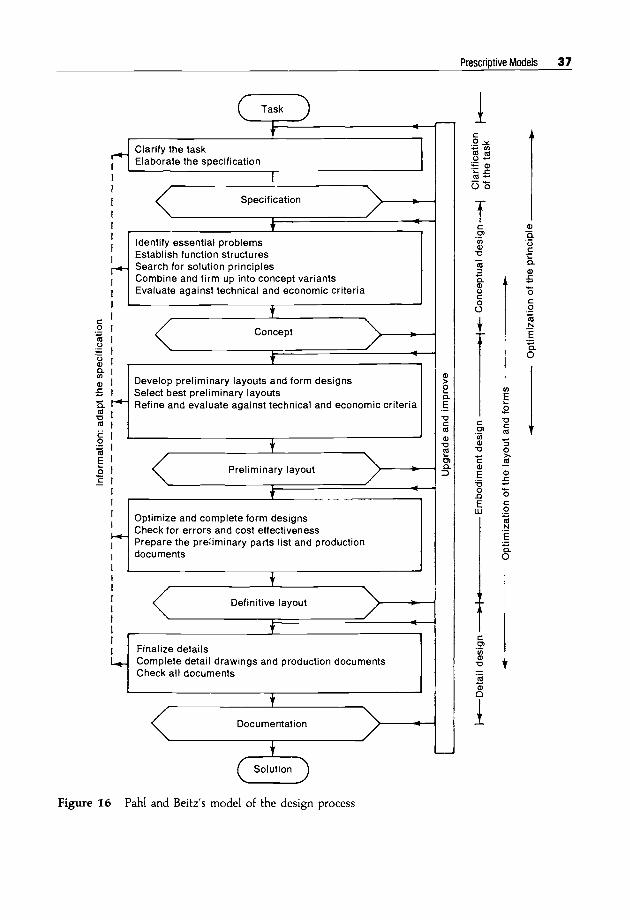
offered by Pahl and Beitz (1984)(Figure 16). It is based on the following design stages.
• Clarification of the task: collect information about the requirements to be embodied in the solution and also about the constraints.
• Conceptual design: establish function structures; search for suitable solution principles; combine into concept variants.
• Embodiment design: starting from the concept, the designer deter- mines the layout and forms and develops a technical product or system in accordance with technical and economic considerations.
• Detail design: arrangement, form, dimensions and surface prop- erfies of all the individual parts finally laid down; materials speci- fied; technical and economic feasibility re-checked; all drawings and other production documents produced.
Considerable work on these kinds of model and on other aspects of rationalising the design process has been done in Germany. The professional engineers' society, Verein Deutscher Ingenieure (VDI), has produced a number of VDI Guidelines in this area, including VDI 2221: Systematic Approach to the Design of Tech- nical Systems and Products. This Guideline suggests a systematic approach in which 'The design process, as part of product creation, is subdivided into general working stages, making the design approach transparent, rational and independent of a specific branch of industry'.
The structure of this general approach to design is shown in Figure 17, and is based on seven stages, each with a particular output. The output from the first stage, the specification, is regarded as particularly important, and is constantly reviewed, kept up-to-date and used as a reference in all the subsequent stages.
The second stage of the process consists of determining the required functions of the design, and producing a diagram- matic function structure. In stage 3 a search is made for solu- tion principles for all sub-functions, and these are combined in accordance with the overall function structure into a principal solution. This is divided, in stage 4, into realisable modules and a

Prescriptive Models 39
Stages Results
Task
,i Clarify and define the task
i
Determine functions and their structures
1 Search for solution | principles and their J combinations
1 ]
Divide into realizable | modules _1
Develop layouts of key modules
Complete overall layout
_
Prepare production and 1_ • . . . . operating instructions I-
1 , ,
f , , ,
C Further realization -'~
~ / Specification / [
~ / Function structure /
7 Principal solution /
.o0u,estructure - /
= / Preliminary layouts / , , ,
- / Definitive layout / . . . . . . . . .
/__ / Product . . . . documents /

40 The Design Process
into a set of preliminary layouts. These are refined and developed in stage 6 into a definitive layout, and the final product documents are produced in stage 7.
In the Guideline it is emphasised that several solution variants should be analysed and evaluated at each stage, and that there is a lot more detail in each stage than is shown in the diagram. The following words of warning about the approach are also given:
It is important to note that the stages do not necessarily follow rigidly one after the other. They are often carried out iteratively, returning to preceding ones, thus achieving a step-by-step optimisation.
The VDI Guideline follows a general systematic procedure of first analysing and understanding the problem as fully as possible, then breaking this into sub-problems, finding suitable sub-solutions and combining these into an overall solution. The procedure is shown diagrammatically in Figure 18.
This kind of procedure has been criticised in the design world because it seems to be based on a problem-focused, rather than a solution-focused approach. It therefore runs counter to the designer's traditional ways of thinking.
A more radical model of the design process, which recognizes the solution-focused nature of design thinking, has been suggested by March (1984) (Figure 19). He argued that the two con- ventionally understood forms of reasoning - inductive and deduc- tive - only apply logically to the evaluative and analytical types of activity in design. However, the type of activity that is most particularly associated with design is that of synthesis, for which there is no commonly acknowledged form of reasoning. March drew on the work of the philosopher Peirce to identify this missing concept of abductive reasoning. According to Peirce
Deduction proves that something must be; induction shows that something actually is operative; abduction suggests that something may be.
It is this hypothesizing of what may be, the act of synthesis, that is central to design. Because it is the kind of thinking by which designs are generated or produced, March prefers to call it productive reasoning. Thus his model for a rational design process is a 'PDI

Prescriptive Models 4 t
Overall problem
Figure 18 The VDI 2221
model of development from
problem to solution
~ r
/ .
/
. /_ . . . . . . . . . . "_.,
,J F - - - ' m 7
/ / ,,,,
/ /
. Sub-problems
~ -~/ '-/~ Individual problems
i / Individual solutions /
Sub-solutions
Overall solution

42 The Design Process
Figure 20 The symmetrical ~Overoll problem ~ ~ ~Overall so!ut,on
relationships . . . . of problem/ ~ , Z~
sub-problems/sub- solutions/solution (Sub-P:oblems ~ ~ _~ (Sub- solut,ons
in design
In this model the first phase, productive reasoning, draws on a preliminary statement of requirements, and some presuppositions about solution types in order to produce, or describe, a design proposal. From this proposal and established theory (e.g. engineer- ing science) it is possible deductively to analyse, or predict, the performance of the design. From these predicted performance characteristics it is possible inductively to evaluate further supposi- tions or possibilities, leading to changes or refinements in the design proposal.
An Integrative Model
Certainly it seems that in most design situations it is not possible, or relevant, to attempt to analyse the problem ab initio and in abstract isolation from solution concepts; the designer explores and

Part Two
Doing Design

New Design Procedures
Systematic Procedures
There may be differences in their preferred models, but the pro- ponents of new models of the design process all agree that there is a need to improve on traditional ways of working in design.
There are several reasons for this concern to develop new design procedures. One is the increasing complexity of modern design. A great variety of new demands is increasingly being made on the designer, such as the new materials and devices (e.g. elec- tronics) that become available and the new problems that are presented to designers. Many of the products and machines to be designed today have never existed before, and so the designer's previous experience may well be irrelevant and inadequate for these tasks. Therefore a new and more systematic approach is needed, it is argued.
A related part of the complexity of modem design is the need to develop team work, with many specialists collaborating in and contributing to the design. To help coordinate the team, it is necessary to have a clear, organised approach to design, so that specialists' contributions are made at the right point in the process. Dividing the overall problem into sub-problems in systematic

46 New Design Procedures
setting up the manufacturing plant, buying-in raw materials, and so on, are so high that the designer cannot afford to make mistakes: the design must be absolutely right before it goes into production. This means that any new product must have been through a careful process of design. Other kinds of large, one-off designs, such as chemical process plants, or complex products such as aeroplanes, also need to have a very rigorous design process to try to ensure their safe operation and avoid the catastrophic con- sequences of failure.
Finally, there is a more general concern with trying to improve the efficiency of the design process. In some industries there is a pressing need to ensure that the lead-time necessary to design a new product is kept to a minimum. In all cases, it is desirable to try to avoid the mistakes and delays that often occur in conven- tional design procedures. The introduction of computers already

Design Methods 4 7
seems that some of these new meth6ds can become over-
formalized, or can be merely fancy names for old common-sense techniques. They can also appear to be too systematic to be useful in the rather messy and often hurried world of the design office. For these kinds of reasons, many designers are still mistrustful of the whole idea of design methods.
The counter-arguments to that view are based on the reasons for adopting systematic procedures, outlined above. For instance, many modern design projects are too complex to be resolved satisfactorily by the old conventional methods. There are also too many errors made with conventional ways of working, and they are not very useful where team work is necessary. Design methods try to overcome these kinds of problems, and above all they try to ensure that a better product results from the new design process. They can also be good practice methods for student designers, offering a training in certain ways of thinking and proceeding

48 New Design Procedures
get your thoughts and thinking processes out of your head and into the charts and diagrams that commonly feature in design methods. This externalizing is a significant aid when dealing with complex problems, but it is also a necessary part of team work, i.e. providing means by which all the members of the team can see what is going on and can contribute to the design process. Getting a lot of systematic work out of your head and onto paper also means that your mind can be more flee to pursue the kind of thinking it is best at: intuitive and imaginative thinking.
Design methods therefore are not the enemy of creativity, imagination and intuition. Quite the contrary: they are perhaps more likely to lead to novel design solutions than the informal, internal and often incoherent thinking procedures of the conven- tional design process. Some design methods are, indeed, techniques specifically for aiding creative thought. In fact, the general body of design methods can be classified into two broad groups: creative methods and rational methods.
Creative Methods
There are several design methods which are intended to help stimulate creative thinking. In general, they work by trying to

Creative Methods 49
The role of the group leader in a brainstorming session is to ensure that the format of the method is followed, and that it does not just degenerate into a round-table discussion. An important prior task for the leader is to formulate the problem statement used as a starting point. If the problem is stated too narrowly, then the range of ideas from the session may be rather limited. On the other hand, a very vague problem statement leads to equally vague ideas, which may be of no practical use. The problem can often be usefully formulated as a question, such as 'How can we improve on X?'.
In response to the initial problem statement, the group members are asked to spend a few minutes - in silence - writing down the first ideas that come into their heads. It is a good idea if each mem- ber has a pile of small record cards on which to write these and subsequent ideas. The ideas should be expressed succinctly, and written one per card.
The next, and major, part of the session is for each member of the group, in turn, to read out one idea from his or her set. The most important rule here is that no criticism is allowed from any other member of the group. The usual responses to unconven- tional ideas, such as 'That's silly' or 'That will never work', kill off spontaneity and creativity. At this stage, the feasibility or otherwise of any idea is not important; evaluation and selection will come later.
What each group member should do in response to every other

§8 New Design Procedures
solution areas and one or two novel ideas result from a brain- storming session then it will have been worthwhile.
Participating in a brainstorming session is rather like playing a party game; and like a party game it only works well when everyone sticks to the rules. In fact, all design methods only work best when they are followed with some rigour, and not in a sloppy or half-hearted fashion. The essential rules of brainstorming are as follows.
• No criticism is allowed during the session.
• A large quantity of ideas is wanted.
• Seemingly-crazy ideas are quite welcome.
• Keep all ideas short and snappy.
• Try to combine and improve on the ideas of others.
Example: container lock
This example shows how brainstorming can be applied to the task of creating a new solution to an old problem: the locking of containers (the large goods containers transported by lorries). The conventional solution is a padlock, but then the key for the pad- lock also has to be either transported together with the container (hence presenting an obvious security problem) or sent separately to the recipient (possibly getting lost). In practice, it seems that most container padlocks opened with bolt-cutter, because

Creative Methods 51
giant stapler and staple-remover
ceramic bolt that can be smashed
glass bolt that sounds alarm when smashed
lorry driver swallows the key
a 'puzzle' lock that can only be opened by a very skilled person
Some of these are fairly 'obvious' ideas, but getting them out of your head can sometimes seem to free the mental space for other ideas to come. Others are 'crazy' ideas, such as the lorry driver swallowing the key; in such a case, everyone knows where the key is, but has to wait a couple of days before it can be recovered! (another sort of 'time lock', as the proposer explained!) There is also an example in the list of one idea building upon another: the glass bolt that sounds an alarm when smashed was a response to the ceramic bolt idea, but based also on fire alarm buttons that are activated by smashing the glass cover.
In reviewing this list of ideas several novel concepts come to mind, but perhaps most appealing is the simplicity of adapting

52 New Design Procedures
The use of analogical thinking has been formalized in a creative design method known as Synectics. Like brainstorming, synectics is a group activity in which criticism is ruled out, and the group members attempt to build, combine and develop ideas towards a creative solution to the set problem. Synectics is different from brainstorming in that the group tries to work collectively towards a particular solution, rather than generating a large number of ideas. A synectics session is much longer than brainstorming, and much more demanding. In a Synectics session, the group is encouraged to use particular types of analogy, as follows:
Direct analogies These are usually found by seeking a biological solution to a similar problem. For example, Brunel's observation of a shipworm forming a tube for itself as it bored through timber is said to have led him to the idea of a caisson for underwater constructions; Velcro fastening was designed on an analogy with plant burrs.
Personal analogies The team members imagine what it would be like to use oneself as the system or component that is being designed. For example, what would it feel like to be a motorcar suspension unit; how would I operate if I were a computerised filing system?
Symbolic analogies Here poetic metaphors and similies are used to relate aspects of

Creative Methods 53
reformulation of the problem. The problem as understood is then used to guide the use of analogies again, but this time to 'make the familiar strange'. Unusual and creative analogies are sought, which may lead to novel solution concepts. The analogies are used to open up lines of development which are pursued as hard and as imaginatively as possible by the group.
Example: forklift truck
A design team looking for new versions of a company's forklift trucks focused on the problem area of using such trucks in warehouses for the stacking and removal of palletted goods. Conventional forklift trucks have to face head-on to the stacks in order to place and lift the pallets, and then be manoeuvered again within the aisle between the stacks in order to move to another location or to exit the warehouse. This means that the aisles have to be quite wide, using up warehouse space.
This example shows how Synectics thinking can be used in the approach to such a problem. Direct analogies could be used to 'make the strange familiar', i.e. to familiarise the team with the new problem. For instance, analogies of the movement of snakes might be explored, leading to the problem as understood being the need for a truck to twist sinuously in its manoeuvring. To 'make the

54 New Design Procedures
magnify, minify, modify, unify, subdue, subtract, add, divide, multiply, repeat, replace, relax, dissolve, thicken, soften, harden, roughen, flatten, rotate, rearrange, reverse, combine, separate, substitute, eliminate.
Random input Creativity can be triggered by random inputs from whatever source. This can be applied as a deliberate technique, e.g. opening a dictionary or other book and choosing a word at random and using that to stimulate thought on the problem in hand. Or switch on a television set and use the first visual image as the random input stimulus.
Why? Why? Why? Another way of extending the search space is to ask a string of 'why?' questions about the problem, such as 'why is this device necessary?' 'why can't it be eliminated?', etc. Each answer is followed up, like a persistent child, with another 'why?' until a dead end is reached or an unexpected answer prompts an idea for a solution. There may be several answers to any particular 'why?', and these can be charted as a network of question-and- answer chains.
Counter-planning This method is based on the concept of the dialectic, i.e. pitting an idea (the thesis) against its opposite (the antithesis) in order to generate a new idea (the synthesis). It can be used to challenge a conventional solution to a problem by proposing its deliberate opposite, and seeking a compromise. Alternatively, two com-

Creative Methods 55
Psychologists have studied accounts of creative thinking from a wide range of scientists, artists and designers. In fact, as most people have also experienced, these highly creative individuals generally report that they experience a very sudden creative insight that suggests a solution to the problem they have been working on. There is a sudden illumination, just like the light-bulb flashing on that cartoonists use to suggest someone having a bright idea.
This creative 'Ah-ha!' experience often occurs when the individual is not expecting it, and after a period when they have been thinking about something else. This is rather like the common phenomenon of suddenly remembering a name or word that could not be recalled when it was wanted.
However, the sudden illumination of a bright idea does not

56 New Design Procedures
The sudden illumination is often referred to as a creative leap, but it is perhaps not helpful to think of creative design as relying on a flying leap from the problem space into the solution space. The creative event in design is not so much a leap from problem to solution as the building of a bridge between the problem space and the solution space by the identification of a key solution concept. This concept is recognised by the designer as embody- ing a satisfactory match of relationships between problem and solution.
Rational Methods
More commonly regarded as design methods than the creativity techniques are the rational methods which encourage a systematic approach to design. Nevertheless, these rational methods often have similar aims to the creative methods, such as widening the search space for potential solutions, or facilitating team work and group decision-making. So it is not necessarily true that rational methods are somehow the very opposite of creative methods.
Many designers are suspicious of rational methods, fearing that they are a straitjacket, or that they stifle creativity. This is a misunderstanding of the intentions of systematic design, which is meant to improve the quality of design decisions, and hence of the end product. Creative methods and rational methods are comple-
Rather than the
check- the do. try
overlook of items
until participa-
contribute sugges- task
allocating

Rational Methods 57
separate sections of the list to different members of the team. In these respects, it is a model for most of the rational design methods. In design terms, a checklist may be a list of questions to be asked in the initial stages of design, or a list of features to be incorporated in the design, or a list of criteria, standards, etc., that the final design must meet.
There is a wide range of rational design methods, covering all aspects of the design process from problem clarification to detail design. The next seven chapters present a selection of the most relevant and widely-used methods, also covering the whole design process. The selected set is detailed below, with the stage in the design process shown on the left, and the method relevant to this stage on the right.
Clarifying objectives
Establishing functions
Setting requirements
Determining characteristics
Objectives tree Aim: to clarify design objectives and sub-objectives, and the relationships between them.
Function analysis Aim: to establish the functions required, and the system boundary, of a new design.
Performance specification Aim: to make an accurate specification of the performance required of a design solution.
Quality function deployment Aim: to set targets to be achieved for the engineering characteristics of a product, such that they satisfy customer

58 New Design Procedures
Evaluating alternatives
Improving details
Weighted objectives Aim: to compare the utility values of alternative design proposals, on the basis of performance against differentially weighted objectives.
Value engineering Aim: to increase or maintain the value of a product to its purchaser while reducing its cost to its producer.
As we shall discuss in Chapter 12, these seven stages of design and their accompanying design methods should not be assumed to constitute an invariate design process. However, Figure 21 suggests how they relate to each other and to the symmetrical problem-solution model developed in Chapter 3. For example, clarifying objectives (using the objectives tree method) is appro- priate both to understand the problem-solution relationship and to develop from the overall problem into sub-problems.
~'-Overall ~ < ~ problem "T .... . r '~l~ Overall "~ - i ~ / L So~'onJ

Rational Methods 59
This model of designing integrates the procedural aspects of design with the structural aspects of design problems. The procedural aspects are represented by the sequence of methods (anti-clockwise, from top left), and the structural aspects are repre- sented by the arrows showing the commutative relationship between problem and solution and the hierarchical relation- ships between problem/sub-problems and between sub-solutions/ solution.
In the following seven chapters, each of the seven methods included in the model is presented in a step-by-step procedure, followed by a number of short practical examples and a more complete worked example. The examples show that such methods are often adapted to suit the particular requirements of the task in hand. Although it is important not to follow any method in a slavish and unimaginative fashion, it is also important that an effort is made to follow the principles of the method with some rigour. No beneficial results can be expected from slipshod attempts at 'method'.

Clarifying Objectives
When a client, sponsor or company manager first approaches a designer with a product need, it is unlikely that the need will be expressed very clearly. The client perhaps knows only the type of product that is wanted, and has little idea of the details, or of the variants that might be possible. Or the need might be much vaguer still: simply a problem that needs a solution.
The starting point for a design is therefore very often an ill- defined problem, or a rather vague requirement. It will be quite rare for a designer to be given a complete and clear statement of design objectives. Yet the designer must have some objectives to work towards. The outcome of designing is a proposal for some means to achieve a desired end. That end is the set of objectives that the designed object must meet.
An important first step in designing therefore is to try to clarify the design objectives. In fact, it is very helpful at all stages of designing to have a clear idea of the objectives, even though those

62 Clarifying Objectives
The objectives tree method offers a clear and useful format for such a statement of objectives. It shows the objectives and the general means for achieving them which are under considera- tion. It shows in a diagrammatic form the ways in which different objectives are related to each other, and the hierarchical pattern of objectives and sub-objectives. The procedure for arriving at an objectives tree helps to clarify the objectives and to reach agree- ment between clients, managers and members of the design team.
The Objectives Tree Method
Procedure
Prepare a list of design objectives
The brief for a design problem is often very aptly called that: it is a very brief statement! Such brevity may be because the client is very uncertain about what is wanted, or it may be because he or she assumes that the designer perfectly understands what is wanted. Another alternative is that the client wishes to leave the designer with as much freedom as possible. This might sound like a distinct advantage to the designer, but can lead to great frustration when the client decides that the final design proposal is definitely

The Objectives Tree Method 63
low risk of damage to work-piece or tool
automatic cut-out on overload
This kind of list can be generated simply at random as you think about the objective, or in discussion within the design team. The client may also have to be asked to be more specific about objectives included in the design brief.
The types of question that are useful in expanding and clarify- ing objectives are the simple ones of 'why?' 'how?' and 'what?' For instance, ask 'why do we want to achieve this objective?', 'how can we achieve it'?.' and 'what implicit objectives underlie the stated ones?' or 'what is the problem really about?'
Order the list into sets of higher-level and lower-level objectives As you expand the list of objectives it should become clear that some are at higher levels of importance than others. Sub-objectives for meeting higher-level objectives may also emerge, and some
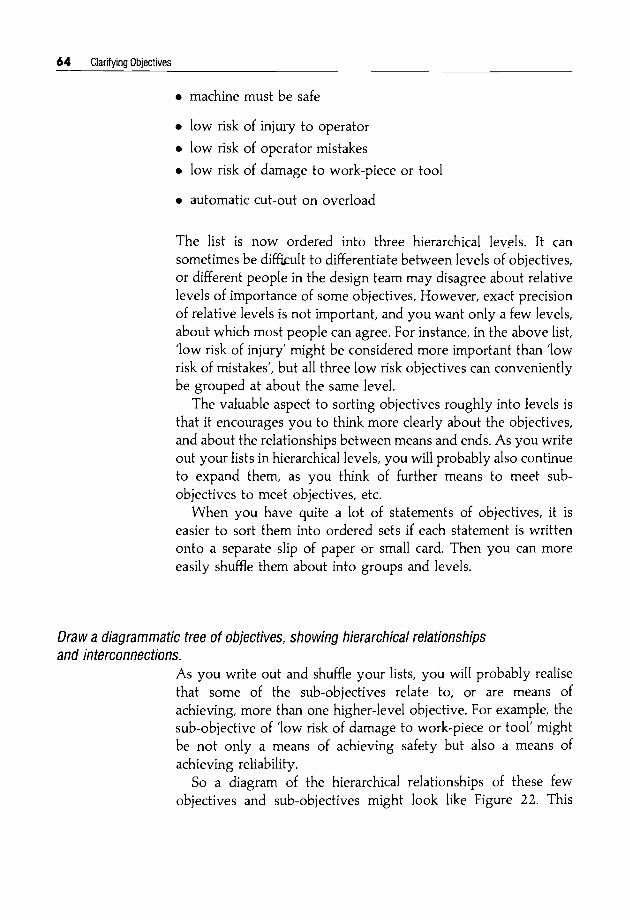
64 Clarifying Objectives
• machine must be safe
• low risk of injury to operator
• low risk of operator mistakes
• low risk of damage to work-piece or tool
• automatic cut-out on overload
The list is now ordered into three hierarchical lev.els. It can sometimes be difficult to differentiate between levels of objectives, or different people in the design team may disagree about relative levels of importance of some objectives. However, exact precision of relative levels is not important, and you want only a few levels, about which most people can agree. For instance, in the above list, 'low risk of injury' might be considered more important than 'low risk of mistakes', but all three low risk objectives can conveniently be grouped at about the same level.
The valuable aspect to sorting objectives roughly into levels is that it encourages you to think more clearly about the objectives, and about the relationships between means and ends. As you write out your lists in hierarchical levels, you will probably also continue to expand them, as you think of further means to meet sub- objectives to meet objectives, etc.
When you have quite a lot of statements of objectives, it is easier to sort them into ordered sets if each statement is written onto separate slip of small card. Then

The Objectives Tree Method 65
Figure 22 Hierarchical diagram of
relationships between objectives
Machine must be safe
! !
Low risk I Low risk [Low risk of of injury to ! of operator ]damage to
I
operator mistakes Iworkpiece or tool I
Automatic cut-out on overload
i i i I I !
II I I i I
l I

66 Clarifying Objectives
As with many other design methods, it is not so much the end product of the method (in this case, the tree diagram) which is itself of most value, but the process of working through the method. The objectives tree method forces you to ask questions about objec- tives, such as 'What does the client mean by X?' Such questions help to make the design objectives more explicit, and bring them into the open for discussion. Writing the lists and drawing the tree also begins the process of suggesting means of achieving the design objectives, and thus of beginning the process of devising potential design solutions.
Throughout a project, the design objectives should be stated as clearly as the available information permits; the objectives tree facilitates this.
Summary The aim of the objectives tree method is to clarify design objectives and sub-objectives, and the relationships between them. The procedure is as follows.
I o Prepare a list of design objectives. These are taken from the design brief, from questions to the client, and from discussion in the design team.
, Order the list into sets of higher-level and lower-level objectives. The expanded list of objectives and sub-objectives is grouped roughly into hierarchical levels.

The Objectives Tree Method 67
transport design team for proposals for 'a modern system, such as a monorail, which would prevent traffic congestion in the city from getting any worse and preferably remove it altogether.'
The only clear objective in this statement is 'To prevent traffic congestion.., from getting any worse. . . ' What are the implicit objectives behind the desire for 'a modern system, such as a monorail'7 Traffic congestion might be held constant or reduced by other means.
Be recognized as acceptable by the City Authority
ESSENTIAL OBJECTIVES 1
Ensure that City Authority gets credit for the system
1 Ensure that travel | facilities in city |
/
do not cause | major complaints /
Ensure that travel facilities are a matter of pride to most citizens
Ensure that citizens will pay only taxes needed
ORIGINAL BRIEF
Be located in present congested areas
Prevent traffic congestion from getting worse and preferably
Cost no more than stated amount in local taxes

68 Clarifying Objectives
By questioning their clients, the design team uncovered objec- tives such as a desire to generate prestige for the city and to reflect a progressive image for the city authority. There was also a wish simply to reduce complaints from citizens about the existing traffic system. It was also discovered that only certain types of new system would be eligible for a subsidy from central government.
The design team were able to draw up an expanded and hierarchically-ordered set of objectives, as shown in Figure 23. In particular, they identified a number of high-level essential objectives which were not explicitly stated in the original brief. By identifying these objectives, the designers clarified the project and the limitations that there might be on the range of alternative solutions. (Jones, I981).
Example 2: Regional transport system Another example from transport design is shown here, for a larger regional system. The designers started from the clients' vague definition of 'a convenient, safe, attractive system', and expanded each objective in turn. For example convenience was defined in terms of low journey times and low out-of-pocket costs for users. The latter objective can be met by appropriate pricing policies; low journey times can be met by a variety of sub-objectives, as shown on the left-hand side of the objectives tree in Figure 24.
Two aspects of attractiveness were defined: user and non-user aspects. The user aspects were subdivided into comfort, visual appeal and internal noise, whereas the non-user aspects were exter- nal noise and visual obtrusiveness.
The safety objective was defined to include deaths, injuries and property damage. The sub-objectives to these show how sub- objectives can contribute to more than one higher-level objective.

The Objectives Tree
Q)
u}
>
>
._
o .
w-
/1• ~
I /A ~'51
/ io
[
~ I
Ill o
~ O
l
O
/ ~E,.O~
"r"

70 Clarifying Objectives
q Reliable operation
Good • reproducibility
/j l~ °futr°rque-time
N Tolerance of overloading
High mechanical safety
Low wear of moving parts
I Low susceptibility to vibrations
Few disturbing factors

The ObjectivesTree Method 71
As before, a typically vague requirement of a 'reliable and simple testing device' can be expanded into a much more detailed set of objectives (Figure 25). 'Reliability' is expanded into reliable operation and high safety. 'Simple' is expanded into simple pro- duction and good operating characteristics; the latter is further defined as easy maintenance and easy handling; and so on.
In a case such as this, first attempts at expanding the list of objectives would probably produce statements at all levels of generality. For example, asking 'What is meant by simple?' would have been likely to produce statements in random order such as 'easy maintenance', 'small number of components', 'simple assembly', etc. Drawing these out in the hierarchical tree structure shows how they relate together (Pahl and Beitz, 1984).
Example 4: Automatic teamaker The objectives tree method can also be used in designing a relatively simple device such as an automatic teamaker. In this example, a distinction is made between functions and means. Each function is an objective, which may be achieved by a number of different means or sub-objectives. Thus the function 'combine water and tea leaves' could be achieved by adding the water to the tea, adding the tea to the water, or bringing them both together into one receptacle (Figure 26).
This is a variation on the objectives tree as described earlier and demonstrated in the other examples, and might more accurately be called a functions tree. However, the same principles apply of breaking-down objectives into sub-objectives, or functions into means, and ordering them into a hierarchical tree. This application of the tree structure approach helps to ensure that all the possible means of achieving a function (or objective) are considered by the

72 Clarifying Objectives
.w
4-,
i
u o QJ
Z ~
m
Ix. ~
< '4)
(",1
= .,,N

The Objectives Tree Method 7 3
Enable in/out
Provide protection
!~ F Pr°vide opening I
Open" LI Pivot ] door [1 [ door l
LI Push/pull l door
j Close "1 Keep i - iL door j
weather outlL I Provide i [ seal 1
Provide safety ~-
[ Mileage I
I Rust resistant J Figure 27 [Good appearance]
A function tree for a car door [Good room inside I
Against
Safe' direc!i°n '1
When "" [ Correct ] open I amount !
Safe ! force I
when losing
strong I Against I J[ latch l
theft ] qlnaccessible] l lock l
Why ?
How ?

74 Clarifying Objectives
• reliable
• convenient
• robust
• standardized range
These are all still rather high-level and general objectives, so it is necessary to investigate such statements further. In this case it was possible to investigate the problems experienced with the existing pumps. It was found that they were sometimes affected by cracking and leakages due to the stresses caused by the thermal expansion of the pipes to which they were connected. This appeared to be the main problem to which the requests for robust- ness and reliability were aimed.
Similarly, investigating the convenient objective revealed a further - two sub-objectives; firstly that the pumps should be easy to install and replace, and secondly that they should occupy the minimum space. It was realized that the standardization of sizes and dimensions in the range could be a means of helping to achieve these objectives, as well as reducing manufacturing costs.
The expanded list of objectives therefore looked like this:
• Reliable • Convenient
• Robust
• Resistant to external mechanical stresses
• Unaffected by thermal expansion of pipes
• Easy to install and replace
• Occupy minimum space
• Standardized range
A key design principle to emerge from considering the means of achieving these objectives was that the inlet and outlet ports should always be in-line, to avoid the thermal expansion problems. Such system, coupled with small base size and modular dimen-

The Objectives Tree Method 7§
Figure 28 Objectives tree for
the pump
I Resistant to external mechanical stresses
I I . ..
Unaffected by thermal expansion of pipes
Installed in-line with pipelines
I a°bus-'~ 1 ! C°nvenient ]
Easy to I Occ,,pies[ instal and ! minie~Um t repla :e [ spa(
• ~ ~ • :~:~i~i~ ~I~I~!~I~
~ ~:~ i ~ ~i
Modular range of sizes

76 Clarifying Objectives
Design Council, the pump is 'almost a diagram of its problem statement: intake and discharge are aligned, motor, coupling and the stage-built pump are aligned on an axis at right angles to the installation surface, and the pump pressure is increased by adding to the number of stages, i.e. a change in height. The pump is installed directly on the pipeline, occupying a minimum of space.'

Establishing Functions
We have seen from the objectives tree method that design problems can have many different levels of generality or detail. Obviously, the level at which the problem is defined for or by the designer is crucial. There is a big difference between being asked to design a telephone handset and to design a telecommunica- tion system.
It is always possible to move up or down the levels of generality in a design problem. The classic case is that of the problem to design a doorknob. The designer can move up several levels to that of designing the door or even to designing a means of ingress and egress and find solutions which need no doorknob at all, but this is of no use to a client who manufactures doorknobs! Alternatively, the designer can move down several levels, investi- gating the ergonomics of handles or the kinematics of latch mechanisms, perhaps again producing non-doorknob solutions which are functional improvements but which are not what the client wanted.
However, there are often occasions when it is appropriate to question the level at which a design problem is posed. A client may be focussing too narrowly on a certain level of problem definition, when a resolution at another level might be better, and reconsidering the level of problem definition is often a stimulus to the designer to propose more radical or innovative types of solution.
So it is useful to have a means of considering the problem level at which a designer or design team is to work. It is also very useful if this can be done in a way that considers, not the potential type of solution, but the essential functions that a solution type will be
Copyright © 2000 John Wiley & Sons Retrieved from: www.knovel.com

78 Establishing Functions
required to satisfy. This leaves the designer free to develop alterna- tive solution proposals that satisfy the functional requirements.
The function analysis method offers such a means of consider- ing essential functions and the level at which the problem is to be addressed. The essential functions are those that the device, product or system to be designed must satisfy, no matter what physical components might be used. The problem level is decided by establishing a 'boundary' around a coherent sub-set of functions.
The Function Analysis Method
Procedure
Express the overall function for the design in terms of the conversion of inputs into outputs
The starting point for this method is to concentrate on what has to be achieved by a new design, and not on how it is to be achieved. The simplest and most basic way of expressing this is to represent the product or device to be designed as simply a 'black box' which converts certain inputs into desired outputs. The black box con- tains all the functions which are necessary for converting the inputs into the outputs (Figure 30).
It is preferable to try to make this overall function as broad as possible at first; it can be narrowed down later if necessary. It would be wrong to start with an unnecessarily limited over-

The Function Analysis Method 79
This kind of questioning is known as widening the system boundary. The system boundary is the conceptual boundary that is used to define the function of the product or device. Often, this boundary is defined too narrowly, with the result that only minor design changes can be made, rather than a radical rethinking.
It is important to try to ensure that all the relevant inputs and outputs are listed. They can all usually be classified as flows of either materials, energy or information, and these same classi- fications can be used to check if any input or output type has been omitted.
Break down the overall function into a set of essential sub-functions Usually, the conversion of the set of inputs into the set of outputs is a complex task inside the black box, which has to be broken down into sub-tasks or sub-functions. There is no really objective, systematic way of doing this; the analysis into sub-functions may depend on factors such as the kinds of components available for specific tasks, the necessary or preferred allocations of functions to machines or to human operators, the designer's experience, and so on.
In specifying sub-functions it is helpful to ensure that they are all expressed in the same way. Each one should be a statement of a verb plus a noun; for example, 'amplify signal', 'count items', 'separate waste', 'reduce volume'.

80 Establishing Functions
Figure 31 A transparent box
model
r
v
Inputs
J 'TRANSPARENT BOX'
. . . . w m |Sub- 1 .~ ]Sub- L ~
. . . . |function l ] r ]function I m
" t i | .. ,
N /Sub- i_ [Sub- [ ~ - 1function ~ function ] I
Function
to juggle inputs and outputs, and perhaps redefine some sub- functions so that everything is connected together. It is useful to use different conventions, i.e. different types of lines, to show the different types of input and output, i.e. flows of materials, energy

The Function Analysis Method 81
a mechanical component, or an electronic device. One of the interesting design possibilities opened up by electronic devices such as microprocessors is that these can often now be substituted for components that were previously mechanical devices or per- haps things that could only be done by human operators. The function analysis method is a useful aid in these circumstances because it focusses on functions, and leaves the physical means of achieving those functions to this later stage of the design process.
Summary
Function analysis The aim of function analysis is to establish the functions required, and the system boundary, of a new design. The procedure is as follows.
1. Express the overall function for the design in terms of the conversion of inputs into outputs. The overall black box function should be broad, widening the system boundary.
2. Break down the overall function into a set of essential sub- functions. The sub-functions comprise all the tasks that have to be performed inside the black box.
3. Draw a block diagram showing the interactions between sub- functions. The black box is made transparent, so that the

82 Establishing Functions
st-ock of ~ A empty sacks
Wagon
Scale
C 9 ~ Sticher
Warehouse stacks
F
Wagon

The Function Analysis Method 83
In this example, the company wanted to try to reduce the relatively high costs of handling and storing the feedstuffs. A designer might tackle this task by searching for very direct ways in which each part of the existing process might be made more cost-effective. However, a broader formulation of the problem (the overall function) was represented in the following stages
I. transfer of feed from mixing bin to bags stored in warehouse
2. transfer of feed from mixing bin to bags loaded on truck
3. transfer of feed from mixing bin to consumers' storage bins
4. transfer of feed ingredients from source to consumers' stor- age bins
This broadening of the problem formulation is shown diagram- matically in Figure 33.
Each different formulation suggests different kinds of solution, with the broadest formulation perhaps leading to the complete elimination of the handling, storing and loading sub-functions (Krick, 1976).
Stacked bags of

84 Establishing Functions
Example 2: Packing carpet squares
This example shows another flow process: the packing of loose carpet squares into lots. The designers first broke down the overall function into a series of principal sub-functions (Figure 34). Some auxiliary functions then became clear. For example, the input from
~.!'.:.:,: - .................................... f IL l ~ Loose carpet ,,,~:.. !ilii :ii. ove ral i.. squares Carpet squares stamped out ~!:::i:i:: function i:ii::i!:] packed of the length - in lots
_A,~_
C h e ~ k - - ~ C o u n t ' ' H co o, Material - !ienOth l ] l°t tcuts I - I qua,,ty ] lsquares inlots ] l Pack
Figure 34
Material flow r--] Main Function System boundary
Analysis of principal functions for the packing of carpet squares
I Send signal I I to combine I~ [ Supply packing I [-I n squares I I
II into one lot I 1 I material I IL Jl L J , , t
, ~ J ~ S t a m p .. . . . ~ - - H ~ { h Separate~ Check ~ Count Combine Pack Despatch Material from length offcuts J l quality l ~ 1 inlot s
r----- "I r . . . . "I I Remove I I Rem°ve I
i offcuts I I rejects I

The Function Analysis Method 85
the separate stamping machine includes off-cuts which have to be removed; reject squares must also be removed; materials must be brought in for packaging. The sub-function 'count squares' could also be used to give the signal for packaging lots of a specified number (see Figure 35) (Pahl and Beitz, 1984).
Example 3: Automatic teamaker
This example is a further development of the project for the design of an automatic teamaking machine, started in the objectives tree method (Figure 26). The fundamental process to be achieved by such a machine is to convert cold water and tea leaves into hot tea (there will also be a need to remove waste tea leaves after the brewing process). This overall function is shown in black box form in Figure 36.
After considering various alternative processes by which the overall function can be achieved, the designer settled on the process shown as a flow diagram of sub-functions in Figure 3 7(a). Various necessary auxiliary functions then became apparent, par- ticularly to do with controlling the heating and brewing processes. The resulting function analysis diagram is shown in Figure 38 (Hubka et al., 1988).
(a) i Tea
Leaves

86 Establishing Functions
REGULATE X ihe heating.1 .,~
HEAT -\ ./,,/] UNITE \ /' theiater_ X I teaandwaterX /- t
/ energy to heat \
Energy (electrical)
REGULATE X
ALihL eo 'nfw US'\ °hi- \/SEPARATE\ " ~! I ,,. Tea / infusion \ i / tia and leavesXLeaves i
ACTIVATE X he separation \ ] \,\1
SUPPORT X subsystems\ " ' I "J
Figure 38 Function analysis for the automatic teamaker

The Function Analysis Method 87
Problem formulation
Overall function Measure and indicate continuously changing quantities of liquid
Primary sub-functions Receive, channel and tndicate signal
'Change signal' may be required as a further sub-function
Requirements Measure and indicate continuously changing quantities of liquid in containers of unspecified stze and shape
Requirements Measure and indicate continuously changing quantities of liquid in containers of unspecified stze and shape and supply outstde energy
System boundary When output signal is already electrical (and existing indicating Instruments to be used)
Function structure
. . . . J Measure and indicate ] . . . . Lquantities of liquid ]
.-.=,.l Receive - Lsigna; }
q Channel i - j i n d i c a t e | signal ] [ s i g n a l j - ' ~
IReceive L j C h a n g e - - " ~ ~ [ s i g n a l t
r t .~, Adjust - - I • I I [slgnal - - - £ - ~
dRece,ve ÷1Chang~ - [s!gnal ]- [s,gnai ~-
q Channel L_~'lndicate" L~ signal ]
I I I I
r- J - - - - - 1 .~ I3orrect , Channel L J-Indicate
Ls~ TM J - 4 - ] - "" signal ] 1 signal
I t " . . . . _ .~j Adjust -~ I
I Lslgnal ~ I
- - C - T ---~] Receive L _~-Channe', ~_ .~j~-Correct ~L_ J-Channel L . ~ Indicate L -
[s,gna_l ] [ s i g n a l j L~g_n~ _ ~ | s igna l _ l t ~ _ ± _ J _ _ , Supply outside i
L energy _d
L ~ ~ 1 1 r - " ' t I
I Adjust a t I -I-Lsi_gn~, _ __. I
I IReceIve j 'Channel .~j C~ec' t- i L.]'ehannel indicate L ...~- -l '~[signal_ -J- [signal F I sinnal I- : Isignal . , = " ~ - - - - ' J j '- . ] - 4 s i g nal J
~- I Supply outside 1 Lenergy.. _ _ j

88 Establishing Functions
Figure 40 Black box model of a washing machine
Soiled clothes Washer
Clean clothes
r
Dirt
Inputs Function Outputs
a means of achieving this separation, and that a further stage must therefore be the conversion of clean (wet) clothes to clean (dry) clothes. Even further stages involve pressing and sorting clothes. The inputs and outputs might therefore be listed like this:
Inputs Soiled clothes
Outputs (Stage 1) Clean clothes
Dirt (Stage 2) Dry clothes
Water (Stage 3) Pressed clothes
Soiled
Dirty Water Moist water air
....... I la - I I
i Clean

The Function Analysis Method 89
The essential sub-functions, together with the conventional means of achieving them, for converting soiled clothes into clean and pressed clothes would therefore be as follows.
Essential sub-functions Loosen dirt Separate dirt from clothes Remove dirt Remove water Dry clothes Smooth clothes
Means of achieving sub-functions Add water and detergent Agitate Rinse Spin Blow with hot air Press
A block diagram with main and subsidary inputs and outputs might look like Figure 41. The development of washing machines has involved progressively widening the system boundary, as shown in the figure. Early washing machines simply separated the dirt from the clothes, but did nothing about removing the excess water from the clothes; this was left as a task for the human opera- tor, using either a hand or mechanical wringing of the clothes. The inclusion of a spin-drying function removed the excess water, but still left a drying process. This is now incorporated in washer- driers. Perhaps the smoothing of clothes will somehow be incorpo- rated in future machines (although this need has been reduced by the use of artificial fabrics in clothes).

Setting Requirements
Design problems are always set within certain limits. One of the most important limits, for example, is that of cost: what the client is prepared to spend on a new machine, or what customers may be expected to pay as the purchase price of a product. Other common limits may be the acceptable size or weight of a machine; some limits will be performance requirements, such as an engine's power rating; still others might be set by statutory legal or safety requirements.
This set of requirements comprises the performance specifica-

92 Setting Requirements
designer must search. Later on in the design process, the perfor- mance specification can be used in evaluating proposed solutions, to check that they do fall within the acceptable boundaries.
The performance specification method is intended to help in defining the design problem, leaving the appropriate amount of freedom so that the designer has room to manoeuvre over the ways and means of achieving a satisfactory design solution. A specification defines the required performance, and not the required product. The method therefore emphasizes the perfor- mance that a design solution has to achieve, and not any particular physical components which may be means of achieving that performance.
The Performance Specification Method

The Performance Specification Method 93
central heating with radiators, ducted warm air, etc. There might even be freedom to move away from the concept of an appliance to alternative forms of heating such as conservatories that trap solar heat; or to ways of retaining heat, such as insulation. At the intermediate level, the designer would have a much more limited freedom, and might only be concerned with different types of appliance, say, different heater types such as radiators or con- vectors, or different fuel types. At the lowest level, the designer would be constrained to considering different features within a particular type of appliance, such as its heating element, switches, body casing, supports, etc.
Determine the level of generafity at which to operate Considering the different levels of generality might lead either to a broadening or a narrowing of initial product concepts or of the design brief. The second step of the method is therefore to make a decision on the appropriate level.

94 Setting Requirements
include such things as comfort, portability and durability, and key features such as speed, cost and safety.
Performance attributes are usually similar to, or derived from, the design objectives and functions. So if you have already pre- pared an objectives tree or a functions analysis, these are likely to be the source of your initial list of performance attributes.
A most important aspect to bear in mind when listing perfor- mance attributes is that they should be stated in a way which is independent of any particular solution. Statements of attributes made by clients or customers are often couched in terms of solu- tions, because they value some performance aspect which is embodied in the solution but they have not separated the attribute from a particular embodiment. Such solution-based rather than performance-based statements are usually unnecessarily restrictive of solution concepts.
For example, a client might suggest that the material for a particular surface area should be ceramic tiles, because that is a

The Performance Specification Method 95
State succinct and precise performance requirements for each attribute Once a reliable list of attributes has been compiled, a performance specification is written for each one. A specification says what a product must do; not what it must be. Again, this may well require some careful research; it is not adequate simply to guess at performance requirements, nor just to take them from an existing solution type. Wherever possible, a performance specification should be expressed in quantified terms. Thus, for example, a maxi- mum weight should be specified, rather than a vague statement such as lightweight. A safety specification (say, for escape from a vehicle) should state the maximum time allowable for escape in an emergency, rather than using terms like rapidly or readily.
Also, wherever possible and appropriate, a specification should set a range of limits within which acceptable performance lies. So a specification should not say 'Seat height: 425 mm' if a range between 400 mm and 450 mm is acceptable. On the other hand, spurious precision is also to be avoided: do not specify 'A con- tainer of volume 21.2 l' if you mean to refer to a waste-paper bin of 'Approximately 300 mm diameter and 300 mm high'.

96 Setting Requirements
Changes
Specification
for One-handed mlx=ng tap
Requirements
1 Throughput (mixed flow) max. 10 I/mm at 2 bar
2 Max. pressure 10 bar (test pressure 15 bar as per DIN 2401)
3 Temp. of water: standard 60°C, 100°C (short-time)
4 Temperature setting independent of throughput and pressure
5 Permissible temp. fluctuation +5°C at a pressure diff. of +5 bar between hot and cold supply
6 Connection: 2 x Cu pipes, 10 x 1 ram, I = 400 mm
7 Single-hole attachment e 35 + - 2 mm, basin thickness 0-18 mm (Observe bas=n dimens=ons DIN EN 31, DIN EN 32, DIN 1368)
8 Outflow above upper edge of basra: 50 mm
9 To fit household bas=n
10 Convertible into wall fitting
11 L0ght operatton (children)
12 No external energy
13 Hard water supply (drinking water)
Page 1
Responsible

The Performance Specification Method 97
4. State succinct and precise performance requirements for each attribute. Wherever possible, specifications should be in quantified terms, and should identify ranges between limits.
Examples
Example 1: One-handed mixing tap
This example is a specification for a domestic water mixing tap that can be operated with one hand (Figure 42). The initial design brief for this project was given in Chapter 1. Notice how the brief has been considerably expanded, as the design team has researched the problem. Some details in the brief have changed (for example, the maximum pressure) as a result of establishing the national standards that apply to such a product. The range of users has also been taken into account (requirement 11, light operation for children), as have safety considerations (requirements 18-20). The project time-scale has also been included in the specification. The 'D or W' column on the left distinguishes between demands and wishes in the specification (Pahl and Beitz, 1984).
Example 2: Fuel gauge
This problem was formulated by the client at the lowest level of generality: the design of a particular type of fuel gauge for use in motor vehicles. The initial general formulation of the problem statement was.
A gauge to measure continuously changing quantities of liquid in containers of unspecified size and shape, and to indicate the

9 8 Setting Requirements
D Changes or
W
i w
Specification
Fuel gauge
Requirements
1. Conta=ner, connection, distance
Volume: 20-1601
Shape fixed or unspecified (rig=d)
Material: steel or plastic
Con nection to container:
Flange connection
Top connection
Side connectaon
H = 150-600 mm
d = o71mm, h = 20mm
Distance from conta=ner to ~ndlcator:
~= 0m, 3 -4m
1-20 m
Contents, temperature range, mater=al
Liquid
Petrol or diesel
Signal, energy
' H L
Operating range Storage enwronment
- 25 to + 65°C - 40 to + 100°C
Output of transmztter: etectnc s~gnal (voltage change with quant=ty change)
Available source of energy: d.c. at 6, 12, 24 V
Voltage var=at~on - 15 to + 25%
Output szgnal accuracy at max. , 3%
±2%
(together w=th ~ndicator error ± 5%)
Page 1
ResponsiVe

The Performance Specification Method 99
. . . . . .
D Changes or
W
Specification
for Fuel gauge
Requirements
Possibility of s0gnal calibratnon w:th full conta0ner
Min0mum measurable content: 3% of maximum value
Reserve lank conlents by special s0gnal
4. Operating condihons
Forward accelerat0on ± 10 m/s 2
SIdeways acceleration ± 10 m/s 2
Upward accelerataon (vibrahon) up Io 30 m/s 2
Shocks ~n forward direcl0on w~thout damage up to 30 m/s 2
Forward tilt up to ± 300
Sideways tilt max. 450
Tank not pressurazed (ventilated)
5. Test requirements
Salt spray tests for ~ns=de and outs0de components according to client's requ=rements
Page 2
Responsible

t O0 Setting Requirements
• connection to top or side of container
• operates at various distances from container
• measures petrol or diesel liquid
• accurate signal
• reliable operation
The design team went on to develop a full performance speci- fication, as shown in Figure 43. As in the previous example, they also distinguished between demands (D) and wishes (W)(Pahl and Beitz, 1984).
Example 3: This example shows the development of a performance specifica- Electric toothbrush tion for a consumer product: an electric toothbrush. The problem is
set at the intermediate level of generality, i.e. a new type of tooth- brush, but it has novel features which require precise performance specifications.
The designers listed the new product's attributes mainly in terms of a set of user needs.
Physiological needs
Social needs
Clean teeth better than a handbrush, massage gums, reduce decay, hygienic family sharing, electrical and mechanical safety, etc.
Sweet breath and white teeth (symbolic needs for social

The Performance Specification Method 101
Example 4: Seat suspension unit
Technical needs
Time needs
Diameter, length, brush size, amplitude, frequency, weight, running time, reliability, useful life, etc.
Needed for Christmas market
Resources exchanged $1 per person is the lowest cost alternative, but electric razors sell for twenty times the price of a manual razor, so probably $20 will be paid for an electric toothbrush
The performance specification was then drawn up as a set of design objectives with corresponding criteria, as shown in Figure 44 (Love, 1980).
The design task in this example was to modify the design of seats in industrial vehicles, such as excavators and loaders, to incorporate a suspension mechanism. Historically, machines of this type did not have much suspension other than that provided by the vehicle's pneumatic tyres. However, drivers of such vehicles (construction vehicles, farm tractors, etc.) have been frequently found to suffer back troubles and injuries. In some cases, injuries were worsened by the need for the driver to turn in the seat to observe lateral and rear as well as forward operations. The design objectives were therefore to provide a suspension mechanism for the operator's seat, to

402 Setting Requirements
Objectives
1. To be attractive, suitable for sale primarily in the gift market and secondly as a personal purchase.
2. The technical functions are to be at least as good as past 'family' models of brand X.
3. To be saleable in the United States and Canada.
4. The timing objective is that the pro- duct be ready for sale to the Christmas trade in the nearest feasible season.
Criteria
la. Attractiveness of overall design and packag- ing to be judged better than brands X and Y by more than 75% of a representative con- sumer panel.
lb. Decorator colours to be the same as our regular products.
lc.
2a.
Package can be displayed on counter area of 75 x 100mm.
Technical functions to be judged at least as good as the past 'family' model of brand X by dental consultant, Dr J.P.
2b.Amplitude to be between 2 and 3 mm.
2c. Frequency to be 15 + 5 cycles/s.
2d. Battery life to be minimum of 50 m~n. when tested according to standard XYZ.
2e, etc., for other technical aspects such as weight, impact strength, frequency of repair, dimensions . . . .
. Must meet UL and CSA standards for safety (a crucial criterion).
4. The time milestones, backing up from October production are to be: • mock-up approval--2 months • tooling release--6 months

The Performance Specification Method '103
DEFINITIONS PERFORMANCE REQUIREMENTS: The mechanism must allow full adjustment of the seat position. To comply with ISO 4253 these adjustments are rotate through i 80 degrees in either direction. 80 mm up and down in the vertical plane and 150 mm front and back in the horizontal plane. Increments of adjustment must be less than 30 degrees and 25 mm respectively. The natural frequency of vibration of the combined seat and operator must be <2.5 Hz. Isolation criteria for class 3 seats as set by ISO 7096. The mechanism must still operate with the machine on a 30 degree slope in any direction. Suspension travel must be vertical and a maximum of 110 mm. Amplitudes must be limited under resonant conditions and step inputs. The temperature range during operauon is between - I0 and +50*C and whilst stored could drop to -30°C. The humidity will range from 0 to 80%. The suspension mechanism will also be subJected to rain. snow and heavy organic and mineral grime. The ex-works cost of the mechanism must be <£30. The target population of operators is to be restricted to people between the ages of 19 and 65. Sizes, weights and strengths are to be between the 5th and 95th percentiles. For example. adjustment must accommodate drivers in the weight range of 60 to 130 kg. The quality of the mechanism must be consistent with the rest of the machine. The required design life is I0 000 hours of operation. The required reliability is 90% over the 10000 hours of operation. The appearance must be as rugged as the rest of the machine. The weight of the complete mechanism must be <50 kg. The maximum overall size is 0.5 x 0.5 x 0.5m. In the horizontal plane the mechanism must have a radius about the centre of rotation <300 mm. The mechanism.must be capable of being fitted to the full range of seat bases and machine floors. MANUFACTURE REQUIREMENTS:
The machine will be assembled on a ten stage assembly line. The mechanism will be assembled prior to installation as tar as is possible. Installation must take <20 minutes. The mechanism is to be manufactured and finished in-house. Any materials can be used as long as they comply with other statements in this specification, 6000 are to be produced each year. ACCEPTANCE STANDARDS-

104 Setting Requirements
The initial level of generality for this problem has been set by the client's request for the design of a new, portable fax machine: it is a particular product type, and so the designer has some freedom to generate new product ideas, rather than just being constrained to product features.
There are many specialised attributes which would have to be researched and specified, such as the industry communication stan- dards, scanning and printing devices to be incorporated, etc. We shall concentrate here primarily on the key attribute of 'portable'. What exactly does this mean? We need to know what features of portability might be important to potential purchasers and users of the fax machine.
We therefore interview a range of fax machine users, and poten- tial new users of a portable facility, about their needs. Typical users for a portable fax machine are business representatives, engineers or others who have to travel in their work and communicate with their head office or other locations by means of documents such as drawings, order forms, etc. From this it emerges that there are two distinct aspects to portability. The first is, quite simply, that the machine can be carried and used comfortably and easily. The second aspect is that the purpose of a portable machine is that it can be used in a wide variety of different locations (e.g. clients' offices, construction sites and suppliers' factories). The portability attribute is therefore strongly related to usability of the machine in such environments.
Further research with users is necessary to develop performance specifications for both of these aspects of portability. For example,

The Performance Specification Method t I)5
lounge. Therefore the machine must be small but stable. Does some potential use include during meetings or conferences (e.g. by journalists faxing press releases)? In that case its operation should be silent or very quiet. Does it include out-of-doors use? In that case there might be weatherproofing requirements, or the user might be wearing gloves, with implications for the design of buttons, controls, paper feed mechanisms, etc.
Obviously, in many locations there is no available power source, and so a portable fax machine must have its own batteries. However, it may be that salespeople and others often use the fax machine in their cars, and therefore the car battery could be used through the cigarette-lighter socket. Another aspect of perfor- mance that emerges is that use of the fax machine will very often be in conjunction with a mobile telephone, and therefore must have connectors to enable them to plug into these as well as into conventional telephone sockets (and there is no need for the fax machine itself to incorporate a telephone). One other aspect to emerge from discussion with potential users is that the fax machine could be useful in conjunction with a portable computer, both as a scanner of documents for entering into the computer and as a printer. Appropriate sockets and connectors are therefore also necessary for this.
In fact it transpires that the concept of a portable fax machine can be rethought as a portable modem/scanner/printer for use in con- junction with a lap-top computer and/or mobile telephone. It may be that the designers will want to suggest to the client something that is a kind of new product alternative, rather than being just a new product type.
An outline performance specification for the 'portability' attri- bute is therefore developed as follows:
Can be carried in one hand; preferably has a carrying handle
Weight not more than 4 kg, including batteries

106 Setting Requirements
Weatherproof against rain showers when not in use
Silent in use, no warning/function bleepers, etc.
Displays and controls legible in low-light environments
Compatible with fixed and mobile telephones
Compatible with portable computers
Power sources: mains, own battery, car cigarette-lighter socket
Copyright © 2000 John Wiley & Sons Retrieved from: www.knovel.com

Determining Characteristics
In determining a product specification, conflict and misunder- standing can sometimes arise between the marketing and the engineering members of the design team. This is usually because they focus on different interpretations of what should be speci- fied. Managers and market researchers tend to concentrate more on specifying the desirable attributes of a new product (usually from the viewpoint of customer or client requirements), whereas designers and engineers concentrate more on a product's engineer- ing characteristics (usually in terms of its physical properties).
The relationship between characteristics and attributes is in fact a very close one, and confusion can be avoided if this relation-

408 Determining Characteristics
for quality is recognized as a major factor in determining the commercial success of a product.
A comprehensive method for matching customer requirements to engineering characteristics is the quality function deployment method (QFD). 'Quality function deployment' is a direct trans- lation of the Japanese characters Hin Shitsu, Ki No, Ten Kai. In Japanese the phrase means something like the strategic arrange- ment (deployment) throughout all aspects of a product (functions) of appropriate characteristics (qualities) according to customer demands.
The QFD method recognizes that the person who buys (or who most influences the buying decision for) a product is the most important person in determining the commercial success of a product. If customers do not buy it, then the product, however well-designed it may be, will be a commercial failure. Therefore the voice of the customer has priority in determining the product's attributes. This means taking care to identify who the customers are, to listen carefully to what they say, and to determine the product's engineering characteristics in the light of this.
As it is presented here, QFD is essentially concerned with the translation of customer requirements into engineering character- istics. However, because it is a comprehensive method, aspects of QFD can be used at various stages of the design process, and it also draws features from several other design methods.

The Quality Function Deployment Method t 09
customers are asked to inspect the products and give their thoughts and reactions.
Usually, of course, customers will talk about products both in terms of general attributes and specific characteristics; obser- vations ranging from 'It's easy to use' to 'I don't like the colour'. As in the performance specification method, it may be neces- sary to interpret the more general statements into more precise statements of requirements, but it is important to try to identify and to preserve the customers' wishes and preferences, rather than to reinterpret their observations into the designer's per- ceptions of what the customers 'really mean'. For this reason, words and phrases actually used by customers are often retained in statements of product attributes, even though they may seem to be vague and imprecise.
Determine the relative importance of the attributes
Of course, not all the identified product attributes will be equally important to customers. For example, 'easy to use' may be regarded as much more important than 'easy to maintain'. Also, some requirements (as noted in the performance specification method) may be demands or absolute requirements (e.g. safe to use) rather than relative preferences.
The design team will want to know which attributes of their product design are ones that most heavily affect customers' perceptions of their product, and so it is necesssary to establish the relative importance of those attributes to the customers them- selves. Again market research methods can help to establish these relative preferences, and provide confirmation of whether what customers say they want is actually reflected in what they buy.
Some relatively simple techniques also be used in order to

110 Determining Characteristics
Evaluate the attributes of competing products Customers often make judgements about product attributes in terms of comparisons with other products. For example, a car buyer may say that Car A 'feels more responsive than Car B'. This use of comparisons is perfectly understandable, given that customers are not usually experts and can only guess at what is possible in product design through observation of what some products actually achieve. Market research information is also often collected by methods of comparison between products.
In a competitive market, therefore, the design team has to try to ensure that its product will satisfy customer requirements better than the competitor products. The performance of the competition is therefore analysed, particularly with regard to those product attributes that are weighted high in relative importance. Some of these performance measures will be objective and quantitative, whereas some will be subjective comparisons as made by cus- tomers. However, even when objective measures can be made, these should be checked against the customers' perceptions, which may not correspond with the objective measures.
In designing a new product, there may not be many competitor products, but that would be unusual; most product designs have to compete against existing products already on the market. In those cases where a design team is redesigning or improving an existing product, this step in the procedure not only highlights where improvements to the design team's product may be necessary, but also where this current product already has advantages over the competition, which should be maintained. The performance scores

The Quality Function Deployment Method 111
overall weight of a car, as well as its engine torque, will influence its responsiveness.
The engineering characteristics must be real and measurable characteristics over which the engineering designer has some control. It is understandable for customers to be rather vague about their requirements, or to express them in frustratingly subjective terms, but the engineering designer can only work with the quantitative parameters of identifiable engineering character- istics. It is through the adjustment of the parameters of those characteristics that the designer influences the performance and/or the customer's perception of the product. Therefore it is often necessary to put considerable effort into identifying the relevant engineering characteristics and ensuring that each of these can be expressed in measurable units.
Of course, not all engineering characteristics affect all product attributes, and drawing up a matrix will enable the team to identify which characteristics do affect which attributes. It is usual to list the attributes together with their relative weights vertically, down the left edge of the matrix, and the characteristics horizontally, along the top edge. The attributes thus form the rows of the matrix, and the characteristics form the columns. Each cell of the matrix represents a potential interaction or relationship between an engineering characteristic and a customer requirement.
Down the right edge of the matrix can be listed the results of the evaluation of competing products, showing the scores achieved against the product attributes for the competing products and the design team's own current product. Along the bottom

112 Determining Characteristics
will have a strong influence on some attributes, while other char- acteristics might only have a weak influence.
The design team therefore works methodically through the matrix, and records in the matrix cells where a relationship occurs, and the strength of that relationship. Sometimes numbers are used to represent the strength of the relationship (e.g. 6 for a strong relationship, 3 for a medium-strength relationship, 1 for a weak relationship), or symbols can be used. When numbers are used, it is possible to enter a second value in each cell, which is the relative weight of the attribute multiplied by the strength of the relation- ship. The large scores among these values enable the design team easily to identify where the adjustment of engineering character- istics will have a large influence on customers' overall perception of the product. However, unless accurate measures of the strength of the relationships can be established, it must be remembered that there is a spurious accuracy implied by the numbers.
Identify any relevant interactions between engineering characteristics It is often the case that engineering characteristics interact with each other, particularly in terms of their influence on cutomers' perceptions of the product. For example, a more powerful engine is also likely to be heavier, thus increasing the vehicle weight, and so not necessarily increasing its perceived 'responsiveness'. These interactions can be either negative or positive.
A simple way of checking these interactions is to add another section to the interaction matrix. This new section is usually added on top of the existing matrix, and because it provides a triangular-

The Quality Function Deployment Method 113
customer perceptions of their product and of competing products, and how the engineering characteristics of the product relate to customer requirements. In this step of the procedure, the team determines the targets that can be set for the measurable param- eters of the engineering characteristics in order to satisfy customer requirements or to improve the product over its competitors.
Of course, in a competitive situation it is important to know what the competitors achieve on the characteristics of their product, so detailed investigation of competitor products may be necessary. The design team can then set targets for themselves which would be better than the competition. Sometimes it may be necessary to conduct trials with customers in order to determine what would be acceptable target figures to set. This is similar to determining values in a performance specification.
Summary The aim of the quality function deployment method is to set targets to be achieved for the engineering characteristics of a product, such that they satisfy customer requirements. The pro- cedure is as follows.
1. Identify customer requirements in terms of product attributes. It is important that 'the voice of the customer' is recognized,

114 Determining Characteristics
5. Identify the relationships between engineering characteristics and product attributes. The strength of the relationships can be indicated either by symbols or numbers; using numbers has some advantages, but can introduce a spurious accuracy.
6. Identify any relevant interactions between engineering char- acteristics. The roof matrix of the house of quality provides this check, but may be dependent upon changes in the design concept.
7. Set target figures to be achieved for the engineering char- acteristics. Use information from competitor products or from trials with customers.
Examples
Example 1: Bicycle splashguard
This is a relatively simple product, but it illustrates how consider- able effort can be necessary in designing to satisfy customer requirements even for simple products. It is a design for a new product type, a detachable splashguard for the rear wheel of mountain bikes. Normally such bicycles have no mudguards, but for circumstances in which the rider does not wish to dirty his or her clothes (from water and mud thrown up at the rear), a detachable splashguard was thought to be a potentially desirable product.
Figure 46 shows the QFD interaction matrix prepared for this

The Quality Function Deployment Method t t 5
Bicycle splas~)gard
K e c l ~ v, a ter off r ider •
F.a,,~ to a t tach 7 Y 3
La,,~ to det~'h 4 ~ t/
Bench ENGINEER REQUIREMENTS marks
I ~" = - i ,,
== ~ ~ ~ ~, ~ - -
+ G + + + ~ + .+
- 9 v 4 - 5 -
3 3 9 " - i - 4 -
3 3 I 5
Fa,,t to attach 3 q 3 3 3
Fa,,t to detach I 3 ~ 3 3 L
( 'an attach when < bike ~s dir ty "
( a n detach when ",= hike is dirt~ I 3 3 t:: ,. J
Not mar Ill I I I I I Interface
-- mlth hike Nt+t catch 7 9 water, etc . . . . .
Not rattle 8 I I 3 ::i
Not wobble 7 I l 3 =.
~. Not I'~nd 4 I I 3
-- Long life I I I I 3
Lightweight 7 3
Not rclea.~ accicl~ntallv I(!
I 4
I 5
I 3
I 5
3 5
3 5
3 3
9 2 2
3 3 NIA
3 2
.~ 3
5 NIA
F0t Mo',I hike~ 7 4 5
~ i t h rider
'~ train
~J th light,, & gcncrah)r "
5 I
5 3
4 4
4 3

116 Determining Characteristics
However, they decided to make comparisons with two other possible means of avoiding dirt being splashed onto the rider: a fixed mudguard and a raincoat. The evaluations of these alterna- tives are given down the right edge of the matrix.
Engineering characteristics for a splashguard design were then established, related to the desired product attributes. For example, the 'easy to attach' attribute could be measured by: the number of steps needed to attach, the time needed to attach, the number of parts needed, and the number of standard tools needed. These characteristics (called engineer requirements in the example) are listed along the top of the matrix, and values for the strength of the relationship between characteristics and attributes are shown in the appropriate cells of the matrix.
Finally, along the bottom of the matrix are listed the units by which the engineering characteristics can be measured, and the targets set for the new product design in comparison with those achieved by the alternatives. The design team thus established a thorough understanding of this novel design problem and deter- mined a set of measurable targets to achieve in their design (Ullman, 1992).
Example 2: Cordless drill
This example refers to a project to design a hand-held cordless drill for the professional market. It is used to demonstrate some of the principles of QFD, especially the house of quality interaction matrices, shown in Figure 47.

The Quality Function Deployment Method 117
Roof (P l r t ia l ly completed)
i/ , . . . .
C A q ~ . ~ J * .-... -. . . =3
o I , ' - ,4.
C a n u s e t o o l c o n t i n u o u s l y 25 . . . . . . . . . . . . .
T o o l Is p o w e r f u l 2 5 9 9 .
T o o l i l l m u l t i - - p u r p o s e 20 6 6 . . . . . . . . .
T o o l Is e a s y t o h a n d l e 2 0
T o o , I . , o . g - , o ~ t , n ~ J l i I I I I I I
I m p u t e d I m p o r t a n c e ~}~'i l t 1 . 5 1 . 5 . . . . . . ~.'-.~ ;,.-,~:, U n i t s : ~ ~ i t W N m
C o m p e t l t o r Va , I . u e s , ,:.',;;~;./,,i;~! T a r g e t s :~4.':~;.:.i
=:l
o
o t'u
,4- m
9 3
.?
. - . . .
_ . J m
8 I"-- ,4-
9
9
1 .0 1.1 1 . 0
k d k g h r s
" =~ ~ . 5 9 i6oo
ECs
B o d y
Suppl4rr~ lnt l ry Information

118 Determining Characteristics
Max Power
Torque
Output ~ Overall
Mass ~ . ciency
Tool Life
PERFORMANCE METRICS ~"
Figure 48 cordless &ill
" Motor
. , _ INTERMEDIATE..,... VARIABLES
_- Motor Mass
- Rated Power v
Winding Resistance Torque Constant Voltage Internal Resistance Battery Mass Peak Power
Energy
Transmission Efficiency
- Transmission Mass
o Heat Sink Capacity Heat Sink
" 0
Mass Causality
=•'•"•'--.• _ Motor
~ Choice
Number of Cells
Battery Technology
Transmission Ratio
Number of Speeds
Heat Sink r...- - - - - ' ' ' - ~ Size
DESIGN VARIABLES
The network of physical properties influencing the engineering characteristics of the
PR IMAR Y SECON DAR Y TER TIAR Y
Good operation in use
Easy to open and close door
Isolation
- Easy to close from outside Stays open on a hill Easy to open from outside Doesn't kick back Easy to close from inside
" Easy to open from inside
Doesn't leak in rain No road noise Doesn't leak in car wash
~ . No wind noise Doesn't rattle

The Quality Function Deployment Method 119
from research on customer requirements. Using the objectives tree method enabled primary, secondary and tertiary levels of customer requirements to be identified and sorted into attribute 'bundles'. The relative importance weight of each attribute was also determined by market research surveys.
Using hall tests, customer perceptions of two competing prod- ucts were established in comparison with their perceptions of the design team's own existing product. These customer perceptions were scored on a five-point scale, with a score of 5 representing the perceived best performance and 1 representing the worst.
Part of the final and fully developed house of quality is shown in Figure 50. The customer perceptions of the performance of competing products are shown graphically on the right.
Objective measures of the relevant engineering characteristics were determined, and are shown below the matrix for the current and two competing products. Positive and negative interactions between ECs are shown in the matrix roof. Finally, on the bottom line are the targets set for a redesign of the car door, after con- siderations not only of imputed importance but also the technical difficulty and estimated cost of making improvements on the current design (Hauser and Clausing, 1988).
Worked example." Fan heater
A domestic fan heater provides a portable heat source for warming the air in domestic interiors. It is a typical product for which satisfactory technical performance has also to be matched by ease of use. Customer-valued attributes are therefore strongly influenced by engineering characteristics. Typical user require-

'120 Determining Characteristics
C U S T O M E R ATTRIBUTES
. . . .
© w
_J ~o <C3 U J 7
<
__A ©
OPEN-CLOSE EFFORT
L 1 = g m ¢~ o
ILl
SEALING- INSULATION
O "1:} E
c "
. ~ ~ O
~ ~ ~ . . . - ~ g ,- ~. a . . . o - .~_ o
-~ ° ~ 5 ° . ~ ~ _ ~ o ~
I + + I I + + + +
Easy to close from outside 7 v ' v' ~, , -
Stays open on a hill 5 ~1' iv"
Easy to open from outside 3
Doesn't kick back 3 ,/ ,/ ,/ )~ . .
. .
Doesn't leak in rain 3 I / ..
No road noise 2 ,/ #" V' .,
Relat ionships
Strong positive
4' Medium positive
,x Medium negatwe
X Strong negative
Customer percept ions
I 2 3 4 5
I '~ '1 . , . . . . . ~ 1 J
L_ I . , 1 ~ 1
I I ~ l !
I 1 ~ 1 I ~"~-- u •
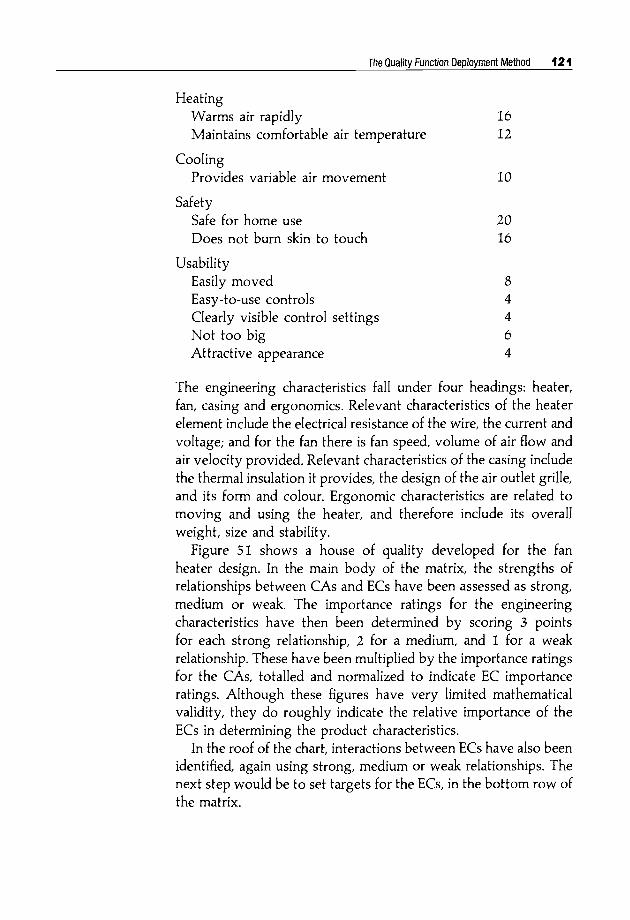
The Quality Function Deployment Method 121
Heating Warms air rapidly Maintains comfortable air temperature
Cooling Provides variable air movement
Safety Safe for home use Does not bum skin to touch
16 12
10
20 16
Usability Easily moved 8 Easy-to-use controls 4 Clearly visible control settings 4 Not too big 6 Attractive appearance 4
The engineering characteristics fall under four headings: heater, fan, casing and ergonomics. Relevant characteristics of the heater element include the electrical resistance of the wire, the current and voltage; and for the fan there is fan speed, volume of air flow and air velocity provided. Relevant characteristics of the casing include the thermal insulation it provides, the design of the air outlet grille, and its form and colour. Ergonomic characteristics are related to moving and using the heater, and therefore include its overall weight, size and stability.
Figure 51 shows a house of quality developed for the fan

422 Determining Characteristics
Relationships:
strong •
medium 0
weak A
),
._ ~ r- ~--~ ~ ' ~ ~ ~ ~ ~i~ o ~ ~ == ~E -- "- "O "0
I I 1 1
|rannimrY m )mmmmir mi
Dmml2
ImmmmmmmBDmmnmm mmmmmmmmnmmmmmm
Customer Attributes
Warms air rapidly 16
Maintains comfortable air'temp.- - 12
Provides variable air movement 10
Safe for home use 20 ,, Does not burn skin to touch"- 16
_.. Easily m o v e d 8
Easy to use controls 4
Clearly visible control settings 4
Not too big 6
Attractive appearance 4
CA importance
EC importance
Units
Targets
A A
A A
A •0A
A
O
5] 9 7 7 3 6 10 10 7 10 7 3 2 3 5 5-
f l A V IZR n m/s!m'a r/s; n "/m, mm Kg mm
Comparisons
I 2 3 4 5
L [
]
mr] B L
f
7
J u
B i
. .[
"1 A
E
[]
[
s
[--] Competitor A
[ ] C o m p e t i t o r B

Generating Alternatives
The generation of solutions is, of course, the essential and central aspect of designing. Whether one sees it as a mysterious act of creativity or as a logical process of problem solving, the whole purpose of design is to make a proposal for something new, some- thing which does not yet exist.
The focus of much writing and teaching in design is therefore on novel products or machines, which often appear to have arisen spontaneously from the designer's mind. However, this overlooks the fact that most designing is actually a variation from or modi- fication to an existing product or machine. Clients and customers usually want improvements rather than novelties.
Making variations on established themes is therefore an impor- tant feature of design activity. It is also the way in which much cre- ative thinking actually develops. In particular, creativity can often be seen as the re-ordering or re-combination of existing elements.
This creative re-ordering is possible because even a relatively small number of basic elements or components can usually be combined in a large number of different ways. A simple example of arranging adjacent squares into patterns demonstrates this:
No. of squares No. of distinct shape arrangements 2 1 3 2 4 5 5 12 6 35

124 Generating Alternatives
The number of different arrangements (i.e. patterns or designs) soon becomes a combinatorial explosion of possibilities.
The morphological chart method exploits this phenomenon, and encourages the designer to identify novel combinations of elements or components. The chart sets out the complete range of elements, components or sub-solutions that can be combined together to make a solution. The number of possible combinations is usually very high, and includes not only existing, conventional solutions but also a wide range of variations and completely novel solutions.
The main aim of this method is to widen the search for possible new solutions. Morphology is the study of shape or form; so a morphological analysis is a systematic attempt to analyse the form that a product or machine might take, and a morphological chart is a summary of this analysis. Different combinations of sub- solutions can be selected from the chart, perhaps leading to new solutions that have not previously been identified.
The Morphological Chart Method

The Morphological Chart Method 125
For each feature or function list the means by which it might be achieved These secondary lists are the individual sub-solutions which, when combined, one from each list, form the overall design solution. These sub-solutions can also be expressed in rather general terms, but it is probably better if they can be identified as actual com- ponents or physical embodiments. For instance, if one of the functions of a vehicle is that it has motive power, then the different means of achieving this might be engines using different fuels, e.g. petrol, diesel, electricity or gas.
The lists of means can include not only the existing and con- ventional components or sub-solutions of the particular product, but also new ones that you think might be feasible.
Draw up a chart containing all the possible sub-solutions The morphological chart is constructed from the previous lists. At first, this is simply a grid of empty squares. Down the left-hand side are listed the essential features or functions of the product, i.e. the first list made earlier. Then across each row of the chart is entered the appropriate secondary lists of sub-solutions or means

t :26 Generating Alternatives
some will be feasible new solutions; and some, possibly a great number, will be impossible solutions, for reasons of practicality or because particular pairs of sub-solutions may be incompatible.
If the total number of possible combinations is not too large, then it may be possible to list each combination, and so to set out the complete range of solutions. Each potential solution can then be considered, and one or more of the better solutions (for reasons of cost, performance, novelty or whatever criteria are important) chosen for further development.
If, as is more likely, the total number of possible combinations is very large, then some means has to be found of reducing this to

The Morphological Chart Method 127
Support
stability
Drive < ~ ~ Resistance
Control
Characteristics
Gravitational force
Meons .
B C
1 Support Land Water Air __ i I T _ 1 , ! ~ x ! [ i i r / A ' I ' i I !
2 Drive Land Water Air .. / l l '" 1 i ,:%M L . . I r ! " / A "_I- ]' • I
3 Stability Land Water Air / i • l ~ l ,N'SL _ I I 1 ] . "/~11 i i ] • - [ . . . .
4 Control Land Water Air

'128 Generating Alternatives
4. Identify feasible combinations of sub-solutions. The total num- ber of possible combinations may be very large, and so search strategies may have to be guided by constraints or criteria.
Examples
Example 1 Vehicle configurations
A simple example of morphological analysis applied to vehicle configurations arose in the course of the design of vehicles for land and water speed record attempts, where it was necessary to define acceptable vehicle configurations. The functions of such vehicles were defined as: support, drive, stability and control.
In each case, the means of achieving these functions were classified as land, water or air. The resulting morphological chart is shown in Figure 52. You might like to try identifying com- binations other than those defining a car, a boat or an aeroplane,
~ ns
Sul~-funchons~ I 2 3 I,

The Morphological Chart Method t 29
e.g. a landyacht, a windsurf board, a hovercraft or a hydrofoil (Norris, 1963).
Example 2: Potato harvesting machine
An improvement to the often rather abstract and wordy form of morphological charts can be made by using, where possible, pictorial representations of the different means for achieving the functions. An example is shown in Figure 53: a morphological chart for a potato harvesting machine. One selected combination of sub-solutions is highlighted in the chart. Notice that two sub- solutions are chosen for the sub-function 'separate stones'. This suggests either that each of these two sub-solutions is not really
23 33 43
Partial Functions
ENABLE 1 connection
wi th workpiece
ENABLE rotational movemen t
ENABLE tilting movemen t
Form interlocking
Rotational gu i dance
sliding iournal bearing
cyl inder
Act ion Principles/Families of Function-carriers
Force locking (fr ict ion) . . . . .
wedge
mechanical - -
screw or bolt 4
pneumatic
hang from above
hydraulic ,..
magnetic
rolling bearing
'u;::,,o:'n
ENABLE height adiustment
LOCK state
DRIVE (by hand)
CONTROL of movement
Show position
r straight line I screw thread A lever mechanism
guidance,
bearing, ~ '~ r----
I i,, sliding ~ i + ~ I or rol l ing , ..,
~ k
hold directly ~ form interlocking ------~ .e. by hand.
weight of ratchet within workpiece hole- pin mechanism guidance
force locking (friction) screw screw with washer.
wedge, brake block
Direct
/
gear wheel \ pair
through /~ through drive locking mechanism (ratchet)
/ /
mechanical /
line scale pointer scale .....
L
with mechanical advantage device - - ~ -
J band, lever rack and helical gears worm and rope, eccentric pinion (crossed) worm-wheel chain cam
. . . . .
optical electronic mechanical stop
4 - -
, ,
Figure 54 Morphological chart for a welding positioner, with one possible combination of sub-solutions picked out by the zig-zag line
Copyright © 2000 John Wiley & Sons Retrieved from: www.knovel.com

130 Generating Alternatives
adequate on its own, or else that the morphological chart itself has not really been constructed carefully enough; perhaps 'separate stones' is not just one sub-function, but needs to be more carefully defined (Pahl and Beitz, 1984).
Example 3: Welding positioner
A welding positioner is a device for supporting and holding a workpiece and locating it in a suitable position for welding. Figure 54 shows a morphological chart for such a device, using words augmented by sketch diagrams. One possible combination of sub-solutions is indicated by the zig-zag line through the chart. Even then, it was found that there were alternatives for the actual embodiment of some of the sub-solutions. For example, the sketches in Figure 55 show alternative configurations for the chosen means of enabling the tilting movement (Hubka, 1982).
Example 4: Shaft coupling
This example shows that even small components can be usefully subject to morphological analysis. The example is that of a shaft coupling similar to the conventional Oldham coupling, which transmits torque even in the case of radial and axial offsets of the shafts. Figure 56 shows a part of the morphological chart that was drawn up. One solution type (A) was analysed into its components and elements (presented here in columns, rather than rows) and the various sub-solutions listed in pictures and words. Two new
Concept Notei Function carriersl for functions 21 ,31 , 4 1 , 2 2 , 3 2 , 4 2 , 2 3 , 3 3 , 4 3 , are compatible
©t
©
t ©
©
°t I

The Morphological Chart Method 131
<
Tronsfer element
Combination
0 0 0 0
Combination
® ® ® ® n
0 0 0 0
Drive component
,
Analysis RetoJning element
0
0 Sphere
r
Driven component
Ring
I I
Rope
Variation
Figure 56 Part of a morphological chart for a shaft coupling
®
CENTERING OF THE STEERING CAGE
, , . . . . , , , ,
TORSION GUARD OF THE CAGE
RADIALLY SLOPED CARRIER
DRIVEN SHAFT
TRANSFER BEARING

t 3:= G
enerating Alternatives
!!i~ ~ i~i ii ¸̧ ̧
~T ~
~
i~ ..... ~!~
~i ~¸• ~
~!'~i ~~ ~ ~
~ ~!~i~ ....
~!Ti~i~!~i~i~i~!!,~ ~,
~ii
!~
~ ~ o
i~m ~m

~i! ~̧ !~ i ~''~~~~~'~"~
~ ~i~i ~: ~!i~, ~ ~. ~. ~i
!~ - ~~"~ ~~-~
i!ii i

134 Generating Alternatives
Example 5: Field maintenance machine
alternative combinations (B and C) are shown by the different sets of dots in the squares of the chart. One of these (B) was devel- oped and patented as a novel design, as shown in the Figure 57 (Ehrlenspiel and John, 1987).
This example shows an adaptation of the principles of morpho- logical analysis. It is concerned solely with the form arrangement, or configuration, of the essential basic elements of the product, and represents the alternative configurations in purely graphical terms. The example is that of a sports field maintenance machine, and the morphological analysis shown in Figure 58 explores the alterna- tives for configuring the elements of operator, engine, driven wheels and non-driven wheels, and the possible disposition of these on one, two or three vertical levels. The sketches show alter- native layouts for either a three- or four-wheel machine, with the arrangement options systematically varied to generate all possible design configurations.
The options were evaluated against design criteria, and one preferred option developed, as shown in Figure 59 (Tovey, 1986).
i ~~~~~~!~114•~~ ~~i~~~i 2
Figure 5 9 Design sketch for
one preferred option derived from
the morphological analysis
~ii ~ii~i~ ~ ~ ~ i ~I̧̧ ~i~117 i:ii~ ~ ,~

The Morphological Chart Method t 3.5
Worked example: Forklift truck This example is concerned with finding alternative versions of the conventional forklift truck used for lifting and carrying loads in factories, warehouses, etc. If we investigate a few of these machines we might identify the essential generic features as follows:
• means of support which allows movement
• means of moving the vehicle
• means of steering the vehicle
• means of stopping the vehicle
• means of lifting loads
• location for operator
These features seem to be common to all forklift trucks, although different versions have different means of achieving the functions. For example, most such trucks run on wheels (means of support) that allow the vehicle to go anywhere on a flat surface, but some are constrained to run on rails.
When we look at the means of moving the vehicle, we might conclude that this is too general a feature and we decide that it should be broken down into separate features for: the means of propulsion (normally driven wheels), the power source (such as

136 Generating Alternatives
Feature
Support
Propulsion
Power
Transmission
Steering , ,
Stopping
Lifting
Operator
Means
Wheels
Driven wheels
Electric
Gears and shafts
Turning wheels
Brakes
Hydraulic ram
Seated at front
Track
Air thrust
Petrol
Belts
Air thrust
Reverse thrust
Rack and pinion
Seated at rear
Air cushion
Moving cable
Diesel
Chains
Rails
Ratchet
Screw
Standing
Slides
Linear induction
Bottled gas
Hydraulic
Chain or rope hoist
Walking
Pedipulators
Steam
Flexible cable
Remote control
Figure 60 Morphological chart for forklift trucks
A morphological chart incorporating these lists is shown in Fig- ure 60. You might like to calculate how many possible different solution combinations there are in this chart.
There are a staggering 90 000 possible forklift truck designs in the chart. Of course, some of these are not practicable solutions, or else they imply incompatible options, for example, an air cushion vehicle could not have steering by wheels. A typical, conventional forklift truck would comprise the following set of options from the chart.
Support Wheels Propulsion Driven wheels Power Diesel engine Transmission Gears and shafts Steering Turning wheels Stopping Brakes Lifting Rack and pinion Operator Seated at rear

The Morphological Chart Method 137
The inclusion of a few unconventional options in the chart suggest some possiblities for radical new designs. For instance, the idea of 'pedipulators' (i.e. walking mechanisms similar to legs and feet) might lead to designs suitable for use on rough ground such as building sites, or even machines capable of ascending flights of steps.
The chart can also be used to help generate somewhat less fanciful but nonetheless novel design ideas. For example, the idea of using rails for steering might well be appropriate in some large warehouses, where the rails could be laid in the aisles between storage racks. The vehicle would have wheels for support and for providing propulsion. It would be electrically powered since it would be used indoors. One of the problems of electric vehicles is the limited battery power, so we might propose that our new design would pick up power from a live electric rail, like subway trains. This might be feasible in a fully-automated warehouse which would not have the safety problems associated with people
Feature
Support
Propulsion
Power
Transmission
Steering
Stopping , , .
Lifting
Operator
Means
Gears and shafts
Turning wheels
Hydraulic ram
Track
Air thrust
Petrol
Air cushion
Moving cable
. .
Diesel
Slides
Seated at front
Linear induction
' ~ , . _ Chains , - , , ~ . . . . . .
Air thrust
" Reverse thrust
. , .
Rack and pinion
Ratchet
Standing Seated at rear
Bottled gas
Hydraulic
Chain or rope hoist
L
Walking
Pedipulators , - -
Steam
Flexible cable
Figure 61 One selected combination of sub-solutions from the morphological chart
Copyright © 2000 John Wiley & Sons Retrieved from: www.knovel.com

438 Generating Alternatives
having to cross the rails. The operator feature would therefore be remote control. A compatible set of sub-solutions for this new design therefore becomes:
Support Wheels Propulsion Driven wheels Power Electric motor Transmission Belt Steering Rails Stopping Brakes Lifting Screw Operator Remote control
This set is shown as a selection from the morphological chart in Figure 61.

0 Evaluating Alternatives
When a range of alternative designs has been created, the designer is then faced with the problem of selecting the best one. At various points in the design process there may also be decisions of choice to be made between alternative sub-solutions or alternative features that might be incorporated into a final design. Choosing between alternatives is therefore a common feature of design activity.
Choices can be made by guesswork, by intuition, by experience, or by arbitrary decision. However, it is better if a choice can be made by some more rational, or at least open, procedure. Not only will the designer feel more secure in making the choice, but others involved in decision making, such as clients, managers and col- leagues in the design team, will be able to participate in or assess the validity of the choice.
If some of the previous design methods have already been used in the design process, then there should be some information available which should guide a choice between alternatives. For example, design proposals can be checked against criteria estab- lished by the performance specification method; and if design objectives have been established by the objectives tree method then these can be used in the evaluation of alternative designs.
In fact, the evaluation of alternatives can only be done by considering the objectives that the design is supposed to achieve. An evaluation assesses the overall value or utility of a particular design proposal with respect to the design objectives. However, different objectives may be regarded as having different values in comparison with each other, i.e. may be regarded as being more important. Therefore it usually becomes necessary to have some means of differentially weighting objectives, so that the per- formances of alternative designs can be assessed and compared

140 Evaluating Alternatives
The weighted objectives method provides a means of assessing and comparing alternative designs, using differentially-weighted objectives. This method assigns numerical weights to objectives, and numerical scores to the performances of alternative designs measured against these objectives. However, it must be empha- sized that such weighting and scoring can lead the unwary into some very dubious arithmetic. Simply assigning numbers to object- ives, or objects, does not mean that arithmetical operations can be applied to them. For instance, a football player assigned the number 9 is not necessarily three times as good as, or worth three times as much as a player assigned the number 3, even though he may score three times as many goals! Arithmetical operations can only be applied to data which have been measured on an interval or ratio scale.
The Weighted Objectives Method
Procedure
List the design objectives In order to make any kind of evaluation it is necessary to have a set of criteria, and these must be based on the design objectives, i.e. what it is that the design is meant to achieve. These object- ives should have been established at an early point in the design process. However, at the later stages of the process (when evalua- tion becomes especially important) the early set of objectives may well have become modified, or may not be entirely appropriate to the designs that have actually been developed. Some clarification of the set of objectives may therefore be necessary as a preliminary stage in the evaluation procedure.
The objectives will include technical and economic factors, user requirements, safety requirements, and so on. A comprehensive list should be drawn up. Wherever possible, an objective should be
made of Some
design; about
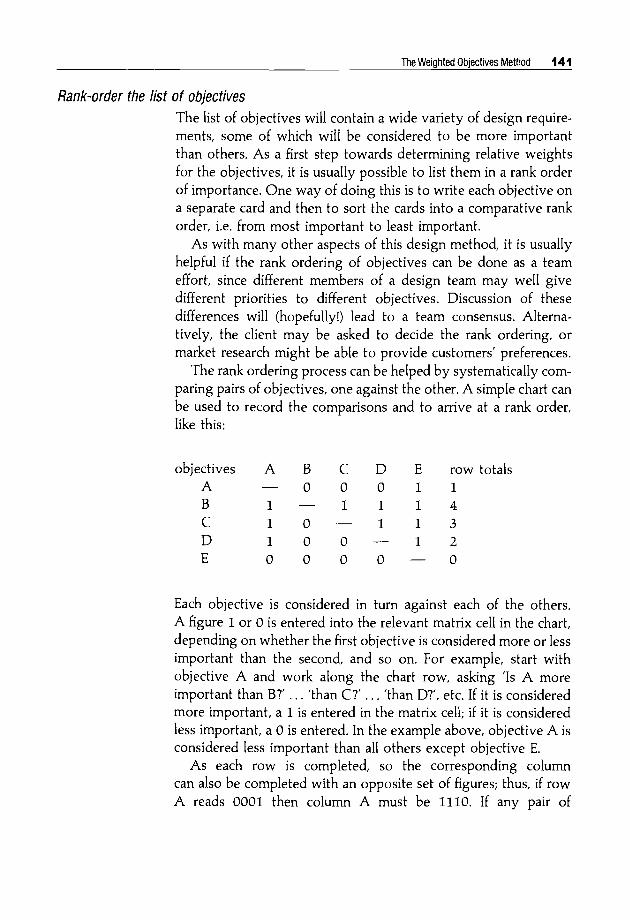
The Weighted Objectives Method 141
Rank-order the list of objectives The list of objectives will contain a wide variety of design require- ments, some of which will be considered to be more important than others. As a first step towards determining relative weights for the objectives, it is usually possible to list them in a rank order of importance. One way of doing this is to write each objective on a separate card and then to sort the cards into a comparative rank order, i.e. from most important to least important.
As with many other aspects of this design method, it is usually helpful if the rank ordering of objectives can be done as a team effort, since different members of a design team may well give different priorities to different objectives. Discussion of these differences will (hopefully!) lead to a team consensus. Alterna- tively, the client may be asked to decide the rank ordering, or market research might be able to provide customers' preferences.
The rank ordering process can be helped by systematically com- paring pairs of objectives, one against the other. A simple chart can be used to record the comparisons and to arrive at a rank order, like this:
objectives A B C D E row totals A ~ 0 0 0 1 I B 1 ~ 1 I I 4 C I 0 I 1 3 D 1 0 0 ~ 1 2 E 0 0 0 0 0
Each objective is considered in turn against each of the others. A figure 1 or 0 is entered into the relevant matrix cell in the chart, depending on whether the first objective is considered more or less important than the second, and so on. For example, start with

t 4 2 Evaluating Alternatives
1 objectives is considered equally important, a i can be entered in both relevant squares.
When all pairs of comparisons have been made, the row totals indicate the rank order of objectives. The highest row total indicates the highest priority objective. In the example above, the rank order therefore emerges as:
B
C D A E
It is here that one of the first problems of ranking may emerge, where relationships may not turn out to be transitive. That is, objective A may be considered more important than objective B, and objective B more important than objective C, but objective C may then be considered more important than objective A. Some hard decisions may have to be made to resolve such problems!
A rank ordering is an example of an ordinal scale; arithmetical operations cannot be performed on an ordinal scale.
Assign relative weightings to the objectives The next step is to assign a numerical value to each objective, representing its weight relative to the other objectives. A simple way of doing this is to consider the rank-ordered list as though the objectives are placed in positions of relative importance, or value, on a scale of, say, 1 to 10 or 1 to 100. In the example above, the rank-ordered objectives might be placed in relative positions on a scale of 1 to 10 like this:
I0 B 9

The Weighted Objectives Method 143
The most important objective, B, has been given the value 10, and the others are then given values relative to this. Thus, objective C is valued as about 70% of the value of objective B; objective A is valued twice as highly as objective E; etc. The corresponding scale values are the relative weights of the objectives. (Note that the highest and lowest ranked objectives are not necessarily placed at the absolute top and bottom positions of the scale.)
If you can achieve such relative weightings, and feel confident about the relative positions of the objectives on the scale, then you have converted the ordinal rank-order scale into an interval value scale, which can be used for arithmetic operations.
An alternative procedure is to decide to share a certain number of points, say 100, among all the objectives, awarding points on relative value and making trade-offs and adjustments between the points awarded to different objectives until acceptable relative allocations are achieved. This can be done on a team basis, with members of the team each asked to allocate, or 'spend', a fixed number of total points between the objectives according to how highly they value them. If 100 points were allocated among objectives A to E in the earlier example, the results might be:
B 35 C 25 D 18 A 15 E 7
An objectives tree can be used to provide what is probably a more reliable method of assigning weights. The highest-level overall objective is given the value 1.0; at each lower level the sub- objectives are then given weights relative to each other but which also total 1.0. However, their 'true' weights are calculated as a fraction of the 'true' weight of the objective above them.
This is clarified by Figure 62. Each box in the tree is labelled with the objective's number (O0, O1, O~1, etc.), and given two values: its value relative to its neighbours at the same level, and its 'true' value or value relative to the overall objective. Thus, in the example overleaf, objectives 02 and 03 are given values relative to each other of 0.67:0.33; but their true values can only total 0.5

144 Evaluating Alternatives
Level
3 r 112\
I , I
.
,,
1 1 I I I
I I
0.09 + 0.25 + 0.16 + 0.09 + 0.04 + 0.04 + 0.08
Figure 62 Use of an objectives tree for assigning relative weights to sub-objectives
+ 0.25= 1.0
(the true value of objective O~) and are therefore calculated as 0.67 x 0.5 = 0.34 and 0.33 x 0.5 = 0.16.
Using this procedure it is easier to assign weights with some consistency because it is relatively easy to compare sub-objectives in small groups of two or three and with respect to a single higher- level objective. All the tree weights add up to 1.0, and this also ensures the arithmetical validity of the weights.
Establish performance parameters or utility scores for each of the objectives
It is necessary to convert the statements of objectives into parameters that can be measured, or at least estimated with some

The Weighted Objectives Method t 45
Some parameters will not be measurable in simple or quantifiable ways, but it may be possible to assign utility scores estimated on a points scale. The simplest scale usually has five grades, represent- ing performance that is
• far below average
• below average
• average
• above average
• far above average
Often, a five-point scale (0-4) is too crude, and you will need to use perhaps a nine-point (0-8) or eleven-point (0-10) scale. The degrees of performance assessed by an eleven-point and a five- point scale might be compared as in Table 1.
Both quantitative and qualitative parameters can be compared together on a points scale, representing the worst to best possible performance range. For example, the fuel consumption and, say, the comfort of a motorcar could be represented on a seven-point scale as in Table 2.
Care must be taken in compiling such point scales, because the values ascribed to the parameters may not rise and fall linearly. For example, on the scale above, the value of decreasing fuel consumption is assumed to increase linearly, but it might well be regarded as more valuable to provide improvements in fuel consumption at the lower end of the scale rather than the upper end. That is, the utility curve for a parameter might be an expo- nential or other curve, rather than linear.
Calculate and compare the relative utility values of the alternative designs The final step in the evaluation is to consider each alternative design proposal and to calculate for each one a score for its performance on the established parameters. Once again, the participation of all members of the design team is recommended (and especially those whose views ultimately count, such as customers!), since different solutions may be scored differently by different people.
The raw performance measures or points scores on each parameter for each alternative design must be adjusted to take

t 46 Evaluating Alternatives
Table 1 Comparison of eleven-point and five-point evaluation scales . . . . . . .
Eleven-point Meaning Five-point Meaning scale scale
totally useless solution
1 inadequate solution 0 inadequate
2 very poor solution
3 poor solution 1 weak
4 tolerable solution
5 adequate solution
6 satisfactory solution satisfactory
7 good solution
8 very good solution 3 good
9 excellent solution
10 perfect or ideal solution •
4 excellent
Table 2 Comparison of quantitative and qualitative parameters
Points Fuel consumption Comfort (miles/gallon)
0 <28 very uncomfortable 1 29 poor comfort 2 33 below average comfort 3 3 7 average comfort 4 41 above average comfort 5 45 good comfort 6 > 46 very comfortable
account of the different weights of each objective. This is done by simply multiplying the score by the weight value, giving a set of adjusted scores for each alternative design which indicates the relative 'utility value' of that alternative for each objective.
These utility values are then used as a basis of comparison between the alternative designs. One of the simplest comparisons

The Weighted Objectives Method 147
that can be made is to add up the utility value scores for each alternative. These total scores then allow the alternatives to be ranked in order of overall performance.
Other comparisons are possible, such as drawing graphs or histograms to represent the utility value profiles of the alternative designs. These visual, rather than numerical, comparisons present a 'picture' which may be easier to absorb and reflect on. They also highlight where alternatives may be significantly different from each other in their performance.
The benefit of using this evaluation method often lies in making such comparisons between alternatives, rather than using it simply to try to choose the best alternative. Many rather contentious weightings, points scores and other decisions will probably have been made in compiling the evaluation, and some of the arithmetic may well be highly dubious. The best overall utility value may therefore be highly misleading; but the discussions, decisions, rankings and comparisons involved in the evaluation are certain to have been illuminating.
Summary The aim of the weighted objectives method is to compare the utility values of alternative design proposals, on the basis of per- formance against differentially weighted objectives. The procedure is as follows.
1. List the design objectives. These may need modification from an initial list; an objectives tree can also be a useful feature of this method.
2. Rank order the list of objectives. Pair-wise comparisons may help to establish the rank order.
3. Assign relative weightings to the objectives. These numerical values should be on an interval scale; an alternative is to assign relative weights at different levels of an objectives tree, so that all weights sum to 1.0.
4. Establish performance parameters or utility scores for each of the objectives. Both quantitative and qualitative objectives should be reduced to performance on simple points scales.

448 Evaluating Alternatives
B
Sub-function
, ,
G
I i i
Offers space, support, protection for people and luggage
Generates the power for transmission
Supports people in a safe and comfortable way
Offers space for luggage
E1 For entry and ex,t
E.. For v~ews outside
Changes d~rect~on of F car driving
Function carrier
, , ,
Body and frame of car
Task
, , , ,
Optimal form for car
Motor and trans- mission
Seals
Optimal position for motor
Optimal disposition for seats
Luggage room
Optimal position and higher capacity of luggage room
Doors
Windows
Optimal number, dimensions and position of doors and windows
Steering Optimal syslern disposition
of steertng system
Aesthetic evaluation
Principle of evaluation
Internal space
Protective ability
Available space
Complexity of transmission
Safety
Comfort
Possibility of getting 4seats
Space used for luggage
Internal room
Facilities for entry, exit and putting in luggage Visibility for driver and passengers
Position of motor Complexity of steering system
Cost evaluation
Safely evaluation ,
Total sum
Order of merit , , ,
NOTES 1 Evaluallon marks 0 unacceptable, 1-3 still acceptable; 4-6 79 good. 10 very good (optimal solution)
2 Total sum (mark . we~ghleng factor) 3 "The marks in parentheses are for the car with two seats
, , , ,
fair;
Figure 63 Evaluation chart for alternative concepts for a small city car
Weight; factor
012
0 08
0 08
0 08
0 08
0 08
0 08
016
0 24
Type 1
5
7 8
5 4
7 7
9
4
4 5
5 48 5 88
9 7

The Weighted Objectives Method 149
Type 2
8
i 8 9
Type 3
5
Type4
IO
, .
8 I0
, ~ - , ,
Type 5 Type 6
, , ; . . . . , =
7 3
8 9 7 I0
,5 6 ,5 6 9 I0 ,5 6
9 8 3 I I0 9 8 6
I0 9 6 6 I0 9 7
9 I0 9 I0
5
6 64 6 96 . .
3 2
7 8 7
2 3
5 32 5 64
7
6 . r
"3(5) "3(6} 5 . . . . .
"6 96 "7 12 (7 44) 17 84) 6 04
10 8 2 I 6 . . . . .
7
6
4

'1 §0 Evaluating Alternatives
5. Calculate and compare the relative utility values of the alter- native designs. Multiply each parameter score by its weighted value. The best alternative has the highest sum value; comparison and discussion of utility value profiles may be a better design aid than simply choosing the best.
Examples
Example 1: City car
In this example, a design team undertook a study of the 'city car' concept, i.e. a small runabout for use in cities or other limited- journey purposes. Many different solutions have been developed to this problem, with varying degrees of success. The design study included an analysis of the features of the many previous examples of city car designs, as well as market research, town planning and engineering criteria, etc. As a part of the design study, the designers drew up a morphological chart of six basic types of city car and the variants within each type for aspects such as the positioning of the engine. This total set of variants was then evaluated, using weighting factors and an evaluation of each variant on a scale of 0 to 10 (Figure 63). From this, car type 4 emerges as the preferred basic form, and was used as the concept for more detailed design work (Pighini et at., 1983).
Example 2: Test rig
This example is taken from the project for the design of a laboratory rig to carry out impulse-load tests on shaft connectors. A thorough evaluation was made of a number of alternative designs, based on the objectives tree which was presented earlier in the objectives tree method (Example 3, Figure 25).
The objectives and sub-objectives at different levels were weighted in the manner described in the procedure (see Figure 64). The design team then went on to devise measurable or assessable parameters for all of the objectives, as indicated in the comparison chart (Figure 65).
Utility values were calculated for each objective, for each of four alternative designs. The second alternative (variant V2) emerges as the best solution, with an overall utility value of 6.816. However, variant V3 seems quite comparable, with an overall utility value of 6.446. A comparison of the value profiles of these two alterna- tives was therefore made. This is shown in Figure 66, where the

The Weighted Objectives Method t § t
Reliable and simple testing device
/
= 1 IWll 1 W1 [
laoo~ 1 I /Low wear of
Irepr°ducibil ity/ lmoving" parts lot torque-time | . - ..... r - l cu rve _J' - - - - - - - / / I I.,,,, = !,,.,,,,,=1 . . . . / Reliable / I Io.7 Io.281
- I °perati°n J"-'-I ;- ~ . . . . i I~,, - - I ." _ • I ITolerance of I I LOw -11 - --11 - . |suscept ib i l i ty L~.4 [ 0 . 4 | qove r l oad lng I ---It° vibrati°n s
o.s 1o. ,41 . . . . I I I Few disturbing
High I factors mechanical i - - .
~ [ , ,safety I I LW1113 = IW11113 = - I 0.3 10.084 . . . . W121 -- Wl121 -- ' I I
High safety 0.7 0.21 L
-- , _ _
~0.3 I0.3 ioperator |1 [Small number I [errors J l ~.,~ - ~1,~ --~ q°'c°m0°nents 1 [0.3 !°.°? I ~.,,~,,=I,,,,1,=! . . . .
l °.s l °-°3 1
l IoW~,~, = lw,,~, .~ io.o~=I . . . .
lS'mple q | c o m p o n e n t ,, ! 0ro°uct,on ,-
s,mo,e ] 1 production . 0.06
[ w,== I~,,~=1 i Simple 0 1 0 1 assembly
• [ . . J L ' W132 = l W1132 "- 0.4 l 0.0¢
~Low c o m p l e x i t y 1
~,components J ~~,2- Iw,13,2 • ,o o,2--~ Many standard !and bought-out parts :'flY1313 "" ]W11313 = 0.3 [0:18
r•mEaSy ]i Ieuickexchange~ aintenance / I I °f test I j , I --' lc°nnecti°ns l
Good operating i P.~ I °.°6 F 0.6 10.084 1 characteristics
w14" |Wl • accessibility - ~4 Easy handling . 0.2 j 0.:~ of measunng
' s=~--'[~w,Stems ~ I L . ~ . . . .
I w,,~ =I w,,,, ,,d:--lw,,,~ =! [°- 7 1°!4_J [0.4 lo.os6 I . . . .
0.056
0.14
0.084
0.12 0.21 0.09
0.03
- - - 0.012
0.018
0.04 0.06
0.084
. . . . 0.056
~ w = l
Figure 64 Weighted values assigned to an objectives tree for the impulse-load testing machine

t 52 Evaluating Alternatives
0 o ' o o : " ' 0
o o
6 ' 0 ' 0 0 0 i
: I
A
o d
o ~ ~ ~ o ~ _ ~ - o • e ~ o -- v > > " ~ -- -~ -~
CO 0 ~ I ~ ~" ~ ~g~ 0
0 0 o o ~ 0 0 o 0
e - c-
- - ~ , i - - ~--
o co o o o o ,~- ~o o o co
o o 0 o ~ c~ 0 0 0 0 0 0
-- .-~,
o ~ o ~ ~o ~ ~o ~ - ~ - = _ ~ - ~ ~ - . _
co o co o o o o ~ ~ o o
0 0 0 o o o 0 o o 0 0
~p
c- __ o
~p
~0
0
E
~o
~0 ..4
>
M.4
~o
o M.4
U
0 ..-4
0
LJ

The Weighted Objectives Method '1 §3
v,.2
v o r i o n t v2. 0WV z = 6 8 2
, I- ,"
I- ;.
[ ! I / / / Z / / / I ~ N . N N N N N N I . . . . . j . , ' - - ~ "
P / Z / / / / / / / / / / / / / , , \ \ \ \ \ \ \ \ \ \ \ \ h , ' t '-' xN\\\\\\\\\\"x'q
* , i ) ' / v " / V ' / v Y _ / V ' / v ' / v ' / \ N I \ N \ N I \ N J \ N I \ M N ' q I , 10 9 8 7 6 5 4 3 2 1 0 1 2 3 4 5 6 7 8 9 I0 I V7"3
Vor iont V 3 0 1 4 " 1 / 3 ' = 6 45
Figure 66 Value profiles for alternative test rig designs V2 and V3
Example 3: Swivel joint
thickness of each bar in the chart represents the relative weight hof each objective, and its length represents the score for that objective achieved by the particular design.
The chart shows that V2 has a more consistent profile than V3, with fewer relatively weak spots in its profile. V2 therefore seems to be a good, all-round design, and the comparison confirms it as being the best of the alternatives. However, improvement of V3 in perhaps just one or two of its lower-scoring parameters might easily push it into the lead (Pahl and Beitz, I984).
This problem was the design of a swivel joint used in an under- water marine environment as part of a current-metering system. A previous design was considered unsuitable because of its high cost and poor performance (especially the high friction between adjacent moving parts).
Three different new designs were developed (Figure 67) and evaluated by weighted objectives. Figure 68 shows the evaluation chart; each design is scored on a 0 to 10 scale for each objective, and each score is multiplied by a weighting factor to give a utility value. Because of the nature of the problem, cost factors were given relatively high weights, while strength was low-weighted. This was because the operational loads were not severe, and the materials were chosen more for resistance to corrosion than for loading stresses.

t §4 Evaluating Alternatives
0
"0
0 o®
~.
,, ,,
=_
~
,, ~
o~
~'~
~ ~
, ®
. g
®._o._~
0 --
I~_
_
0 Q
.. I-..-
.ILl
I II
i 111
~ ~ ---~° ~
. ~
x~ ,-~
~ ~
'~N
~._~._.
~ g'~
.~. -~ g_®
._
~'~
Q~
o g
~. ~
~ ~ ~,._~
¢~o
n h
i"- ~
rr <
~...J
,~
OO
Q_'T
"
I I I
I_lllllll
- ~
_
t.-
N ~
t" r"
~ ---
U.
a. llla
<m
Q-
I
¢;
._>
0 bO .,.-4
QJ
Q;
> . ,...,
0~
E
1 111..11 !l
g ~
_ --.
-~
~\\\\~-'X%
-<X'X
\~ .~

The Weighted Objectives Method 155
Design criteria Weight Design 1 Design 2 Design 3
W* S U s u s u
1 Cost Materials 6 8.5 0.51 Seals 2 8 0 16 Bearings 4 9 0.36 Washers 1 7.5 0.07 Squeeze packing 2 9 0,18 Bolts 1 9 0 09 Labour 6 8 0 48 Tools and equipment 6 8 0 48 Indirect cost 20 8.5 1.7 Marketing 2 7 0 14
2 Performance Sealing 9 8 0 72 Smoothness 9 5 0 45 Alignment 6 5 0.3 Growth formation 2 8 0 16 Maintenance 4 8 0 32
3 Manufacturing Ease 5 8.5 0.42 Time 5 9 0.45 Assembly 5 9 0.45
4 Strength 5 8 0 4
5.5 0,33 7 0.42 8 0 16 8 0 16
5 0.2 8 0,28 7 5 0.07 7 5 0 07 9 0,18 9 0.18 9 0.09 8 0 08 5 0 3 7.5 0.45 5 0 3 7.5 0.45 7 14 75 15 8 0.16 9 0 18
8 0.72 8 0.72 9 0.81 8.5 0.76 7 0 42 8 0.48 8 0.16 8 0.16 8 0 32 8 0 32
7 0.35 7.5 0.37 4.5 0.22 7.5 0.37 6.5 0 32 8 0.4 9.5 0.47 9 5 0.47
The overall utility 7 84 6.98 7.82
°W = percentage weight of each criterion (from 100) S = score of quality of each design (from 10) U = utility (weighted score) of design = W x S

t 5 6 Evaluating Alternatives
evaluate these alternative concepts and select the best for develop- ment, a method similar to weighted objectives was used.
This variant on the standard method uses a datum design concept, against which all the others are compared. The datum may be chosen from the new alternatives under consideration, or an existing design may be used as the datum. In this example,
Easy attach
Wt ! i l I!! . , p ,
7 + + +
IV V V!
+ + S
Easy detach 4 + + + + S
Fast attach
Fast detach . . .
Attach when dirty
Detach when dirty , .
Not mar
Not catch water
Not rattle .
Not wobble
Not bend
Long life
Lightwcight
Not release :tccidcntall~,
Fits most bikcs
Streamlined
3 + + +
1 + + + , ,
3 + + +
I +
I0 + + + . . • .
7 - +
7 - - - - S
4 - S
+ + S T
+ + S U
+ S S , . ,
+ S +
+ S S
S
w
11 - S S . . . . .
7 + S S
10 + S S S . .
7 + S S S
5 - S - +
S S
S S
S S
Vi i
D
A
M
L . . . .

The Weighted Objectives Method t.57
a standard bicycle mudguard with quick-release attachments was chosen as the datum.
The set of design objectives and their weights were determined in the QFD analysis. For each objective, each alternative design concept was then judged as either better (+), worse ( - ) or the same (s), in comparison to the datum. The decision matrix is shown in Figure 69. Totals for the + signs and - signs are given for each concept at the bottom of the matrix. A weighted overall total for each concept is calculated by summing the positive and negative weights of the relevant objectives.
In this example, concept 2 emerged as the clear leader. How- ever, it has to be remembered that this is in comparison with the datum, and that direct comparisons between the alternative con- cepts themselves should also be made. Concept 2 was therefore selected as a new datum and comparisons made with concepts 4 and 5. This check confirmed that concept 2 was the preferred alternative (Ullman, 1992).
Worked example: Reusable syringe
This example is a medical product: a general purpose, reusable syringe for patients' self-use at home, allowing them to make regular injections of drugs. It is important that the quantity of drug to be injected is precisely controlled, and a major segment of the users of such a syringe is elderly people. Accurate and easy

t 58 Evaluating A
lternatives
! -,.
--!
tM
~ ~
0
. _
.
.m
o~
O O Q~
I o
-f- o
o o
o
I +
o o
+ I
o
o o
-I- i
o o
+
CO
(X
l
O
O
O
O
O
O
O
I !
+ o
o I
o
o I
o o
o I
+
o o
o o
o +
-I-
"._.~.-- .._
O
~ '~
-
z: =
= ~
>, E
>,,..
cO
~ O
~
~ O
w
w
I~
O
O
w
B
..
O
I'-- O
tO
tO
• .'-" ~
04
~ O
+ b
I
E E
E
o co
o ~ r,-
I
• - C
O
I
C~
,---
O
O
....
Z I~

The Weighted O
bjectives Method
159
III
0 0
"~r~ d
d d
d d
d o
-t'- 0
.... r~
co -~
c~ 1,-
o,._. I'1
:,~
'~
" C
O
14") (")
CO
0~1
CO
(11
0 Z
0 0
"0
c~
c~
•
Z
.-o
d c;
o d
o o
o c6
ILl
e-
..
..
00
Itl "~
n
"
, ,
,_~
0 0
o r.z)
c5 °
c5 c~
c5 c;
o ~
> --
>
r"
C~
L
0 ~
~t"
~'J
I~,
~"
• 0
~'~ "~r~
o d
d o
d d
o ~
z 0
~ ;,.
o --G
. .."
u ,<
.
..
.
~ c~ C
~
if" e
..
..
..
..
~
I~
tO
0 I~
ur)
0 0
f~j
I~
C
• - ~'-
(~I
~'-
~ ~--
.--
0 .,-,
m
=.- o>, >,
,~ ~
o I-
0
>
.,-q [-.T.-I
i-I L~
I.i =
.i..i L

q 60 Evaluating Alternatives
(..,~,M ~ba,q'c,H
(b)
wl t~
Figure 72 (a) Original sketches for syringe design concepts D and F; (b) Sketch of the combined concept DF selected for design development

The Weighted Objectives Method t 6'!
A design team has produced seven alternative initial design con- cepts for the syringe, based on a variety of means and mechanisms for setting and measuring the dosage and activating the injection. The team needs to evaluate the different concepts and choose one for final development.
The design team prepares an evaluation matrix for the seven initial concepts (Figure 70). The evaluation criteria (design objectives) are listed down the left of the matrix, and the seven alternatives (identified by a brief descriptor) are listed along the top. One concept (D, a relatively simple solution) is chosen as the datum, or reference concept against which the others will be rated. Each alternative concept is then compared with the datum, and is rated 'better than' (+), 'equal to' (0) or 'worse than' (-), on each of the design criteria. These ratings are summed for each concept, net scores are calculated, and the resultant relative rankings are entered at the bottom of the matrix.
Although concept A emerges as the top-ranked concept, the team recognize that some of the apparently weaker concepts may nevertheless contain good features that might be usable in a final concept, and so they consider combining ideas to produce further new design concepts. They notice that concepts D and F might be combined to remove several of their 'worse than' ratings, and they consider that concept G could be revised to improve its handling. A new evaluation matrix is therefore prepared, for comparison of the two top-ranked original concepts, A and E, the combined concept DF, and the improved concept G+ (Figure 71).
In this final evaluation matrix, the design objectives (selection criteria) are weighted relative to each other. Concept A is chosen as the datum, or reference concept, and given a rating score of 3 points on each criterion. The other concepts are then rated against this datum: 5 points for 'much better' and 4 points for 'better' than the datum, 3 points for 'same', 2 points for 'worse' and 1 point for 'much worse' than the datum. Weighted scores are calculated and summed, leading to rank positions for the four concepts, at the bottom of the matrix. The combined concept DF (shown in Figure 72) emerges as the preferred concept for final development (Ulrich and Eppinger, I995).

"1"1 Improving Details
A great deal of design work in practice is concerned not with the creation of radical new design concepts but with the making of modifications to existing product designs. These modifications seek to improve a product: to improve its performance, to reduce its weight, to lower its cost, to enhance its appearance, and so on. All such modifications can usually be classified into one of two types; they are either aimed at increasing its value to the purchaser or at reducing its cost to the producer.
The value of a product to its purchaser is what he or she thinks the product is worth. The cost of a product to its producer is what it costs to design, manufacture and deliver it to the point of sale. A product's selling price normally falls somewhere between its cost to the producer and its value to the purchaser.
Designing is therefore essentially concerned with adding value. When raw materials are converted into a product, value is added over and above the basic costs of the materials and their pro- cessing. How much value is added depends on the perceived worth of the product to its purchaser, and that perception is substan- tially determined by the attributes of the product as provided by the designer.
Of course, values fluctuate depending on social, cultural, technological and environmental contexts, which change the need for relevance or usefulness of a product. There are also complex psychological and sociological factors which affect the symbolic or esteem value of a product. However, there are also more stable and comprehensible values associated with a product's function, and it is principally these functional values which are of concern to the engineering designer.
The value engineering method focuses on functional values, and aims to increase the difference between the cost and value of a
Copyright © 2000 John Wiley & Sons Retrieved from: www.knovel.com

164 Improving Details
product: by lowering cost or adding value, or both. In many cases, the emphasis is simply on reducing costs, and the design effort is concentrated onto the detailed design of components, on their materials, shapes, manufacturing methods and assembly processes. This more limited version of the method is known as value analysis. It is usually applied only to the refinement of an existing product, whereas the broader value engineering method is also applicable to new designs or to the substantial redesign of a product. Value analysis particularly requires detailed information on component costs.
Because of the variety and detail of information required in value analysis and value engineering, they are usually conducted as team efforts, involving members from different departments of a company, such as design, costing, marketing, production depart- ments, etc.
The Value Engineering Method
Procedure
List the separate components of the product, and identify the function served by each component
One of the ways in which companies seek to better their rivals' products is to buy an example of the competing product, strip it down to its individual components, and try to learn how their own product might be improved in both design and manufacture. This is one way of learning some of a competitor's secrets without resorting to industrial espionage.
The same sort of technique is at the heart of value engineering and value analysis. The first analytical step in the method is to strip a product down to its separate components, either literally and physically, or by producing an itemised parts list and drawings. However, parts lists and conventional engineering drawings are of limited value in understanding and visualizing the components, the ways in which they fit together in the product overall, and how they are manufactured and assembled. So if an actual product, or a prototype version, is not available for dismantling, then something like exploded diagrams of the product are helpful in showing

The Value Engineering Method 165
components in three-dimensional form and in their relative locations or assembly sequences.
The purpose of this first step in the procedure is to develop a thorough familiarity with the product, its components and their assembly. This is particularly important if a team is working on the project, since different team members will have different views of the product, and perhaps only limited understandings of the components and their functions. So it is necessary to go through an exhaustive analysis of the sub-assemblies and individual com- ponents, and how they contribute in functional terms to the over- all product.
Sometimes it is not at all clear what function a component serves or contributes to! This may be found particularly in pro- ducts which have had a long life and may have gone through many different versions: some components may simply be redundant items left over from earlier versions. However, it may also be the case that components have been introduced to cope with problems that arose in the use of the product, and so any components which may appear to be redundant should not be dismissed too readily. Sometimes redundancy is even deliberately designed in to a product in order to improve its reliability.
The objective of this step in the procedure is to produce a complete list of components, grouped as necessary into sub- assemblies with their identified functions. In value engineering, rather than the more limited value analysis applications of this method, a similar objective applies, even though the ultimate intention might be to develop a completely new product, rather than just to make improvements to an existing product. In this case, the starting point might be an existing product against which it has been decided to compete in the market, or an archetypal or hypothetically typical version of the proposed new product.
Determine the values of the identified functions
Questions of value are, of course, notoriously difficult. They are the stuff of political debate and of subjective argument between individuals. Reaching agreement in a team on the value of par- ticular product functions therefore may not be easy. However, it must be remembered that the value of a product means its value as perceived by its purchaser. So the values of product functions must be those as perceived by customers, rather than by designers or

t 66 Improving Details
manufacturers. Market research must therefore be the basis of any reliable assessment of the values of functions.
The market prices of different products can sometimes pro- vide indicators of the values that customers ascribe to various functions. For instance, some products exist in a range of different versions, with more functions being incorporated in the products at the higher end of the range. Differences in prices should therefore reflect differences in the perceived values of the additional functions. However, customers are likely to perceive a product as a total entity, rather than as a collection of separate functions, and subjective factors such as appearance are often of more importance than objective functional factors. It is said that the solidity of the 'clunk' made by closing a car door is one of the most important factors influencing a customer's perception of the value of a motorcar.
Considerable efforts have been put into trying to quantify perceived values or benefits, particularly in connection with the cost-benefit analysis method used in planning. For example, in transport planning some of the benefits of a new road or bridge can be quantified in terms of the time saved by travellers in using the new facility. Attempts are then made to convert all such benefits (and costs) into monetary terms, so that direct com- parisons can be made.
Despite the difficulty of assessing values, it is necessary to make the best attempt one can to rationalize and express the perceived values of component functions. It may be pointless to reduce the costs of components if their values are also being reduced, so that the product becomes less desirable (or valuable) to prospective purchasers. If quantified and reliable estimates of values cannot be made, then at least simple assessments of high/medium/low value can be attempted.
Determine the costs of the components
Surprising though it may seem, it is not always easy for a company to determine the exact costs of components used in products. The company's accounting methods may not be sufficiently specific for itemised component costs to be identifiable. One of the useful by- products of a value analysis or value engineering exercise, there- fore, can be the improvement of costing methods. Team working in the exercise again becomes particularly relevant, because reliable

The Value Engineering Method 167
cost information at sufficient detail may only be obtainable by synthesizing information from different departmental specialists.
It is not sufficient to know just the cost of the material in a com- ponent, or even its bought-in cost if it is obtained from a supplier. The value analysis team needs to know the cost of the component as an element of the overall product cost, i.e. after it is fully finished and assembled into the product. Therefore, as well as material or bought-in costs there are labour and machine costs to be added for the assembly processes. It is sometimes suggested that factory overhead costs should also be added, but these can be very difficult to assign accurately to individual components, and instead can perhaps be assumed to be spread equally over all components.
It is important not to ignore low-cost components, particularly if they are used in large numbers (e.g. screws or other fasteners). Even a relatively small cost reduction per item can amount to a substantial overall saving when multiplied by the number of components used.
As well as determining the absolute costs of components, their relative or percentage costs in terms of the total product cost should also be calculated. Attention might then be focussed on components or sub-assemblies which represent a significant por- tion of the total cost.
Search for ways of reducing cost without reducing value, or of adding value without adding cost
This fundamental design stage calls for a combination of both critical and creative thinking. The critical thinking is aimed at what the design is, and the creative thinking is aimed at what it might be. The concept of stripping down a competitor's product to look or ways of improving on it is a useful one to bear in mind at this stage. It is usually easier to be critical of, and to suggest improvements to someone else's design rather than one's own, and it is this kind of creative criticism that is needed at this final stage.
Attempts to reduce costs usually focus on components and on ways of simplifying their design, manufacture or assembly, but the functions performed by a product should also be looked at critically, because it may be possible to simplify them, reduce their range, or even eliminate them altogether if they are of limited value to the purchaser.

168 Improving Details
There are some general strategies which can be applied in order to direct the search for ways of reducing costs. The first is to concentrate on high-cost components, with a view to substitut- ing lower-cost alternatives. The second is to review any com- ponents used in large numbers, since small individual savings may add up to a substantial overall saving. A third strategy is to identify components and functions which are matched as high- cost/high-value, or low-cost/low-value, since the aim is to achieve high-value functions with low-cost components. One particular technique is to compare the cost of a component used in the design with the absolute lowest-cost means of achieving the same func- tion; large differences suggest areas for cost reduction, even though the lowest-cost version may not be a viable option.
A checklist of cost-reduction guidelines is as follows.
Eliminate Can any function, and therefore its components, be eliminated altogether? Are any components redundant?
Reduce Can the number of components be reduced? Can several components be combined into one?.
Simplify Is there a simpler alternative? Is there an easier assembly sequence? Is there a simpler shape?
Modify Is there a satisfactory cheaper material? Can the method of manufacture be improved?
Standardize Can parts be standards rather than specials? Can dimensions be standardized or modularized? Can components be duplicated?
Although the value analysis approach tends to emphasize reducing costs, ~he broader value engineering approach also looks for ways of adding value to a product. For example, rather than eliminating functions, as suggested above, value engineering might seek ways of improving or enhancing a product's functions. Nevertheless, the aim is always to increase the value/cost ratio.
One of the most significant means of adding value to a pro- duct, without necessarily increasing its cost, is to improve its ease

The Value Engineering Method t 69
of use. This has become particularly evident with the preference for personal computers which are found to be user friendly. In this case, the friendliness perhaps applies more to the com- puter's software than its hardware, or at least to the combination of software and hardware such that use of the computer seems natural and easy. However, similar principles can be applied to all machines; their use should be straightforward, clear and com- fortable. There is a considerable body of knowledge in the field of ergonomics which can be applied to these user aspects of machine design.
Other attributes which commonly contribute to the quality or value of a product are as follows.
Utility Performance on aspects such as capacity, power, speed, accuracy or versatility
Reliability Freedom from breakdown or malfunction; performance under varying environmental conditions
Safety Secure, hazard-free operation
Maintenance Simple, infrequent or no maintenance requirements
Lifetime Except for disposable products, a long lifetime which offers good value for the initial purchase price
Pollution Little or no unpleasant or unwanted by-products, including noise and heat
Finally, there is a whole class of value attributes related to aesthetics. This includes not only the appearance of a product (colour, form, style, etc.) but also aspects such as surface finish and feel to the touch.
Evaluate alternatives and select improvements
The application of value analysis or value engineering should result in a number of alternative suggestions for changes to the

170 Improving Details
product design. Some of these alternatives might well be incom- patible with each other, and in fact all suggestions should be carefully evaluated before selecting those which can be shown to be genuine improvements.
Summary
The aim of the value engineering method is to increase or maintain the value of a product to its purchaser while reducing its cost to it producer. The procedure is as follows.
1. List the separate components of the product, and identify the function served by each component. If possible, the actual product should be disassembled into its components; exploded diagrams and component-function charts are more useful than parts lists.
. Determine the values of the identified functions. These must be the values as perceived by customers.
, Determine the costs of the components. These must be after fully finished and assembled.
4. Search for ways of reducing cost without reducing value, or of adding value without adding cost. A creative criticism is necessary, aimed at increasing the value/cost ratio.
5. Evaluate alternatives and select improvements.
Examples
Example 1 Ceiling diffuser
Substantial cost savings can often be made even on relatively simple products. Although the cost-per-unit may not be great, the total savings can be large when a large number of units is involved. In this example, the product is a $10 ceiling diffuser, the device which covers the ceiling ouput points of heating and air conditioning systems. Its function is to help spread the air flow into the room, and to look attractive.
Informal discussions with a number of users and customers (including installers) to determine their likes and dislikes about the

The Value Engineering Method '17'1
Example 2: Ignition system
exist:ing diffuser revealed several areas where t:he designers felt
t:ha~ t:here were mismatches bet:ween manufacturing costs and
perceived value I:o I:he customers of cert:ain de~ails. The designers'
recomrnendat:ions for changes are given in Figure 73.
The changes result:ed in reducing mat:erial costs by 24% and
labour costs by 84%, saving t:he company nearly $500000.
Funct:ional and aest:hetic improvements also resulted from ~he
redesign. These, plus a 20% price reduction, helped achieve a sig-
nifican~ increase in t:he company's market: share (Fowler, 1990).
The product under invest:igat:ion in t:his example was a I200 horse- power engine, used primarily in compressor syst:ems. The engine
incorporat:ed several features or subsystems, not provided by
compet:itors. One of t:hese was a t:ot:ally shielded ignit:ion syst:em, t:o
prevent: any possibility of a spark igniting any flammable gas
Function Cost Design Change Style product Minimize housekeeping
$1.34 (13%) $0.05 (0.5%)
Ensure stability $1.36 (13%)
Ease installation and simplify adjustment
$1.07 (10%)
Protect shipments $0.86 (8%)
Delete the cenlcr cone. Users complained about ceiling smudging caused by air output. The team reshaped the remaining three cones to feather the air gradually, to pre- vent it from contacting the ceiling around the dif- fuser.
Team referred to its function-cost worksheet and found that half of the webs, web clips and rivets, all of the springs, and much of the assembly labour was to ensure stability. Changed to two wireforms with two of the legs spot-welded to a newly designed ccnlcr cone.
Both of these functions are performed by access areas in the cones, to permit the use of a screw- driver to attach the unit to the ductwork and to adjust the ductwork damper after installation. Installation access areas were deleted, since modem installation does not require screw at- tachment. A hole was added to permit damper adjustment.
The prestudy discussions with users/customers revealed that diffusers were invariably ordered in pairs. The shipping carton was redesigned to carry two units at a significant cost reduction.
Figure 73 Value analysis of an air conditioning ceiling diffuser
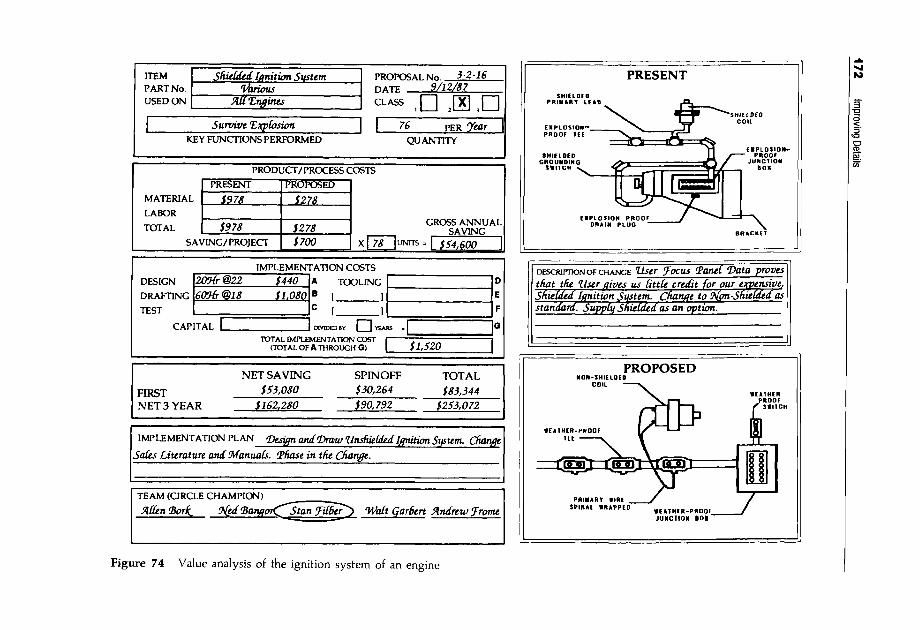
172 Im
proving Details
oo
~
o --~
a: _
m
I v~
,.., - :[
I ..~0
-,I~
~_ ~
~
0~
i
U.I
t~
~t ~
~J
0
zg m
• ,r
II
I <
.J
<
<
U~
~! ~
a uj
u. --
, ..-
m
i
I o
o I
I,~_
c,I
ZO
t ,-IV
t
i
q
!- I
z
< u.l
o~
¢
)o
II
I. i
I
Eo
E )..I I ;E
e~
l
.,"4
bB
O
Ub
o .,..q .4
., . ,...~
b~
.,..~
QJ
o ~J3 .,.-~
> =
,i,q
;,T.,

The Value Engineering Method t 7 3
Example 3: Air valve
around the engine. The company assumed that this was a valued feature of its engine. However, questionnaires to a panel of users, as part of a value engineering exercise, revealed that the shielded ignition system was not rated highly as a feature by the users.
Figure 74 shows the value analysis report drawn up by the design team. They proposed changing to an unshielded ignition system, with the shielded system offered as a higher-cost option for those customers who wanted it. The estimated cost of making the change was only $1520 for design and drafting. Gross annual saving was $54 000, with a $253 000 net saving over the first three years (Fowler, 1990).
This example, the value analysis of an aircraft air valve (Figure 75), shows how components and functions can be costed in a com- parison table or matrix. Components often contribute to several different or related functions, and hence the cost of a particular functions is often spread across several components. The kind of component/function cost matrix shown in Figure 76 allows the designer to analyse in detail these often complex relationships. When a component contributes to more than one function, it may be difficult to break down its overall cost into precise part-costs per function. Approximate but well-informed estimates then have to be made.
The analysis in this example revealed the relatively high cost of the 'connect parts' function, as well as the redundancy of some elements. A redesign enabled some substantial reductions to be
Figure 75 Cost analysis of an
aircraft air valve
Ports or assemblies
Banjo assembly
Valve bOdy
Spring
Diaphragm assembly
Cover
Lug
Nuts, bOlts and washers
Assembty cost
Total
Cost((:)
1 07
662
039
2 14
224
010
234
4 58
,f.1948 -I
Servo air
Diaphragm IH __ •

1 7 4 Improving Details
(a)
Parts
Banjo assembly
Valve body
Spring
Diaphragm assembly
Cover
Lug
Nuts, bolts and washers
Assembly
Total
% total
High or low
04
O6
10
01
7 - ,
Iv
01
O4
10 1'1 07
51 57 34
0.4
2 82
0 1 094
1 • 1.2
p, .,
214
4 58
0 1 1208
' i !os 62o
08
01
02
O2
01
01
09 06
46 31
O8
0.1
0 34
"047 O6
"0 39
0.1
• 0 1
i2. i067 ,09 ,
6 4 3 4 5 6
H . . . .
1 07 5 _ . .
6 62 34 0
039 20
214 110
224 11 5
0 1 0.5 .,
234 120
4 58 23 5
19 48 100 0
(b)
Pa~s
Cover and connection . . . . .
Body assembly
Diaphragm assembly
Valve assembly
Fasteners, nut bolts, etc
Total
0 15 025
015 020 025 0
,~ Iv "" - •
0 15 0 10 0 25 0 . . . . .
0.05 0 05 0
0 50 0 55 1 05 0
050 0 10
45
20
05
80
0 25 0 30
0 45} 0 40
Iv •
0 25 0.10
~, 0 151
1 04
2 14 080
015
0 25 .,,
0 2O
031
09
0 06
0 O3
r
0 O3 r
0 O5
017
% total 72 79 15 1 116 309 116 132 25
High or low I t~
1 76 25 5
2 18 31 5
1 28 185
066 95
1 0 4 1 5 0
692 1000
1
[
Figure 76 (a) Function/cost analysis matrix for the air valve; (b) function/cost analysis matrix for the redesigned air valve
made, with a total cost saving of over 60% (Engineering Industry Training Board).
Example 4: Piston
The elimination of unnecessary parts can be a significant factor in reducing the overall cost of an assembly, and is a principal focus of value analysis. Figure 77 shows the redesign of a small piston

The Value Engineering Method 17 5
oz ~ ~ (~) Screw ( Z ~ ( steel ) ~ _ - ?
O3 Cover (steel)
0 4 Scr,n 0 (s tee l ) - - - -
Piston StOp (nylon)
PistOn (olum|n,um) ~ - -
0 7 Moin block (plostic)
\
O2 ShOp-On cover ond stop ( plost ic )
0 3 Sprinq (steel)
0 4
Piston ( aluminium )
Originol design for piston ossembly Redesigned piston assembly
Figure 77 Redesign of a piston assembly to reduce the number of components
Example 5: Tubular heater
assembly, eliminating or combining several parts that were in the original. Separate fasteners should be eliminated wherever possible, and it was found in this example that the two screws could be eliminated by changing the cover plate from steel to plastic with a snap-fit onto the main block. The cover was also redesigned to incorporate the piston stop in a one-piece item. In the redesign, the number of parts was thus almost halved, resulting in reduced material and assembly costs with no loss of performance and an aesthetically improved product (Redford, 1983).
In a company manufacturing various kinds of electrical appliance, its range of tubular heaters was selected for a value engineering exercise. These heaters are simple and robust and used mainly

176 Improving Details
0 L L
03 03 >, ,,< z
I.- cat) 0 o z 0 I.- 0 z
U. .
0
Basic function D/£..~ / ,o,4"r E
FlEA 7"
l 11 f z" Item
T , be assy. 2~.1
E t e ~ , e ~ ~ssy. $.r ~e# 0.6
T~r~. col/,=r assV. 1~,.~
Cov~r ~ssy. /~ I
f l ~ a / a ssV o.S o.5
M /e r co ,,ne c/o,- I:t,t"
4'-.a
Cost of
item
Cost of function ://-~, ~ :7 77-~' 4,-o #.
% of total cost 3/ z5 :~e e 5
Cost sequence (~) (~) 0 ( ~ ( ~ _ .
p %
.z ~, . I
.~2 . 2
4".1
1 . 0
/ 'P'.o
13'.,r
qq.~
Figu re 78 Funct ion/cost analysis of the tubular heater
in industrial and office premises to provide background heat. The product range consists of similar tubes of various lengths providing various heat outputs at a standard wattage per unit length.
A component/function/cost analysis, shown in Figure 78, revealed that the largest parts and labour cost was accounted for by what was regarded as the third most important func- tion: that of providing the power connection. A closer examina- tion of this function revealed two distinct sub-functions: firstly, providing an interconnector to allow tubes to be banked together on one mains connection; and secondly, providing a complex terminal connection.
An ideas-generating session produced suggestions for redesign which are shown in Figures 79 and 80. The moulded inter- connector was replaced with three separate wires and a cover piece (Figure 79), which also enabled the terminal itself to be considerably simplified (Figure 80). Together, the modifications resulted in a cost reduction of 21%.

The Value Engineering Method '17 7
R E P O R T S U M M A R Y F O R M
Project .... . .H.e..¢.~. t.u..~......S ..7~.. • ......................................... Date ......................
I tem ~ & ,,/e~co.,,.ed~r
Present
/
1,
~r~-~ ~,~z r~ e/,=,te
(,,,~/~._.Z ,.)
- D M C c~.~,ress;o. ~o.lde_Z bo@
Proposed
/ ,..res u,;/g sp-,~te
mo./ded .~ro.d
C o m m e n t s
as ~e k¢,.,,,~¢,;., /,.o/.o~/ s.~o,.,. &t~,.. ~ s h .4=¢e sk-, . , ,~e ,v.apa~.l ~ ~e e,,s~r P, /.,rt=ll /~,1 Y~e p . e ~ . t .,eYJf.,i' =~,¢' /~e.e /s a,, ,~,/v,'ove,,/ ,/,i,e,,c~,,ee
Additional Costs Material Labour benefits
Present I.~. 0 p O- 8f ,..
Proposed ,~.O p
Difference i / ~ % Savin(. ~ ~
Ophb~al
Total
4a.Op
Imp lementa t ion t ime ...... .~.....~.o....~d.{. ......... Cost £ ./.9..9..0. ..........................................
Quant i t y per year ..... ..7.~.0..00. ................. Expec ted life ..... 5....y.r.;.. ....................
1st year sav ings £ ..~..6..0..0.0.. ........................ Annua l sav ings £ ...Z..7.0..0..0 ...............
Figure 79 Proposals for redesign of the tube interconnector

'17 8 Improving Details
R E P O R T S U M M A R Y F O R M
Pro jec t ..... .H'..e.a ~...t.,. ~.e...5"..~ ............................................ Da te .......................
I tem "7~r~/~ a[ cover acre,,,l,/y
Presen t P r o p o s e d
. ~cce¢ ~
0 #,r~.,',,,,;~,s ~ r.
2.1 fa,~ 7,,~ m ,',, t ~ l
C o m m e n t s
t, J e ;,,fec~o,,n ed,,,, prop,,~,t/ sl, o,,,,, e=,-h~,.
i,~t,d/=~;, o, ,,,,,,;,,,y t,,.~),.,,~. L,///~ , ~ , , y , /~ =p fe . ,= , ,e
Total
/ q .6
oo.y
costs Material Labour Additional benefits
, . ,
Present /0 .6 Q-0 ~.-06~¢G0" Proposed 5"-Z j?.o jr~,,<.4hr e~.
Differencej~.......- ~ ' f ~ % S a v i n g ~ ~ .
Implementation time ....... ~..~..o..,,.?.d..~. ........... Cost £ ../.5o...o ..............................................
Q u a n t i t y pe r y e a r .... ./.~..o.,....o...o...o.. ................... E x p e c t e d life .....5"...y.r~.- ............................
1st y e a r s a v i n g s £ ..~./...#.;..5.0.. ° .................... A n n u a l sav i ngs £ .~./.6;.~..°..0. ...............
Figure 80 Proposals for redesign of the terminal cover assembly
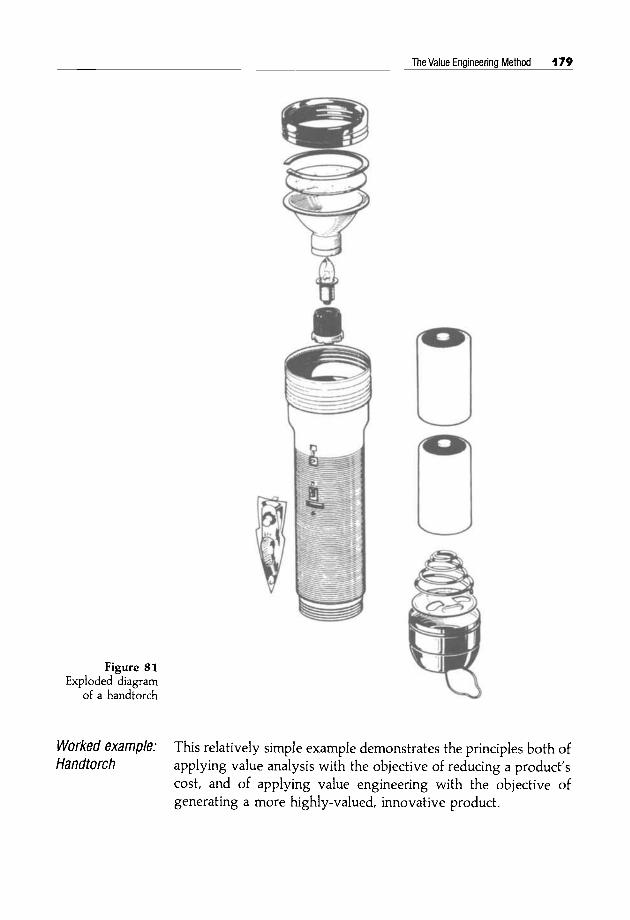
The Value Engineering Method 179
Figure 81 Exploded diagram
of a handtorch
Worked example: Handtorch
This relatively simple example demonstrates the principles both of applying value analysis with the objective of reducing a product's cost, and of applying value engineering with the objective of generating a more highly-valued, innovative product.

180 Improving Details
Figure 81 shows how both value analysis and value engineering projects might start, with an exploded diagram of the product, which in this case is a conventional handtorch. The diagram shows the separate components and indicates how they are assembled together in the complete product.
Market research showed that two main aspects of a torch are highly valued by users. These are: firstly, the quality of the emitted light, perceived by users as being influenced by (apart from battery power) the bulb and the reflector; and secondly the ease of use of the torch, determined by the torch body and the switch. One low- valued feature of this particular torch design was the hanging loop on the base of the torch, which was hardly used at all and thus thought by most users to be redundant.
The components, their functions and perceived values are listed in Table 3, with values categorized simply as high, medium or low.
Table 3
Component Function Value Cost (£)
Original Redesign
Cap Washer Glass
Protect bulb and reflector Medium 0.16 0.08
Reflector Project light beam High 0.I2 0.12
Bulb Provide light High 0.10 0.10
Bulb holder Hold bulb, provide electrical contact Low 0.05 0.05
Torch body Contain batteries, locate parts, provide hand grip
High 0.26 0.26
Switch Provide electrical interrupt High 0.08 0.08
Spring washer Provide pressure on batteries Low 0.10 0.10
Cap Protect batteries Medium 0.10
Loop Provide for hanging Low 0.03
Total £1.00 £0.79

The Value Engineering Method 181
I~ is useful ~o note ~haf some components which may be imporfanf to the technical performance of the product are not necessarily perceived as of high value by users; examples here include fhe bulbholder and the pressure spring in the base.
A value analysis exercise led fairly quickly to some suggested modifications which would lower the product's cost without lowering its value. The reflector cover seemed to be too com- plicafed, wifh i~s ~hree separafe components, glass, washer and screw-on retainer. A one-piece clear plastic cap was suggested as an alternative. The base of the torch also seemed to be a rather complicated assembly, and again a one-piece plastic screw-on cap was suggested, with an integral plastic tongue spring to provide the pressure on the batteries, and the hanging loop eliminated. A proposal was also made to eliminate the swi{ch, with electrical
F i g u r e 8 2
T h e D u r a b e a m
h a n d t o r c h
~ t ~ ~ _ ~ ~.~_,~ ~ ~ , ~ ~ ~ ~ ~<~5~ ~ ~ : _ , ~ , ~ ~ • ~ _- J~o ~ - * f > ~ ~ ~ ~ ~ : :~ _~,~:~ ~ :~7 ~ ' i , : ~ / ~ ' ~ ..~4.~% ~ ~ ~ _, ~ ~ , , ~ . ~ _ ~ i ¢ ~ ~ ~ _ ~ ~ - ~ ~ _ ~ ~ ~ , ~ : ~ : ~
~ ~ • .---,-~. ~ .~w~ , ~ - ~ , ~ - . ~ ~ ~ , ~ ~ ~ " i ~ ~ ~ ~ i ~

182 Improving Details
interrupt being provided instead by twisting the head of the torch. However, on evaluation it was decided that this was not very convenient for the user, and risked losing the highly-valued ease of use of the thumb-switch.
Table 3 shows that the costed redesign indicated a potential saving in manufacturing costs of approximately 20%.
A more comprehensive value engineering exercise would have concentrated on the high-value aspects of the torch as perceived by users, and would have sought to improve these features, to enhance them, or to generate innovations related to them. The high-value features of the torch are to do with its light beam and its handling.
Some research with users might well have found that the conventional torch has some shortcomings in these areas. For instance, it seems basically designed to throw a moderately wide beam over a fairly large distance - such as for illuminating a foot- path. However, most use of a torch these days is for closer illumi- nation such as finding a keyhole or making emergency repairs on a motorcar engine. In the latter type of case, it is important to be able to place the torch down, leaving one's hands free, and to direct the beam to the appropriate spot. The conventional, cylin- drical torch is poorly-designed for this; it is also inconveniently shaped for carrying in a pocket or handbag.
The novel Durabeam torch (Figure 82) illustrates how these principles might have been applied in the design of a new product. The batteries are placed side-by-side instead of end-to-end, creat- ing a flat, rectangular, compact body shape. The thumb-switch has been eliminated by using a 'flip-top' mechanism which acts as a switch and which also allows the angle of direction of the beam to be adjusted.

Part Three
Managing Design

"1 Design Strategies
What is a Design Strategy?
Using any particular design method during the design process will often appear to be diverting effort from the central task of designing. However, this is exactly the importance of using such a method; it involves applying some thought to the way in which the problem is being tackled. It requires some strategic thinking about managing your design process.
A design strategy describes the general plan of action for a design project and the sequence of particular activities (i.e. the tactics, or design methods) which the designer or design team expect to take to carry through the plan. To have a strategy is to be aware of where you are going and how you intend to get there. The purpose of having a strategy is to ensure that activities remain realistic with respect to the constraints of time, resources, etc., within which the design team has to work.
Many designers seem to operate with no explicit design strategy. However, having no apparent plan of action can be a strategy, of sorts! It might be called a random search strategy, and might very well be appropriate in novel design situations of great uncertainty, where the widest possible search for solutions is being made. Examples of such novel situations might be trying to find applica- tions for a completely new material, or designing a completely new machine such as a domestic robot.
For these kinds of situations, an appropriate strategy would be to search (at least to begin with) as widely as possible, hoping to find or generate some really novel and good ideas. The relevant tactics would be drawn mainly from the creative methods.
At the opposite extreme Lo random search would be a com- pletely predictable or prefabricated sequence of tried-and-tested

186 Design Strategies
actions. Such a strategy would be appropriate in familiar and well- known situations.
Again, it might not seem to be an explicit strategy, simply because it involves following a well-worn path of conventional activities. Examples of appropriate situations for such a strategy might include designing another variation of the machine that the designer's employer always makes, or designing a specific and conventional type of product for an identified sector of the market.
In such situations, the design strategy would be aimed at narrowing the search for solutions and quickly homing-in on a satisfactory design. Relevant tactics would be drawn from conventional techniques and the rational methods.
Strategy styles The random search and prefabricated strategies represent two extreme forms. In practice, most design projects require a strategy that lies somewhere between the two extremes, and contains elements of both.
The random search strategy represents a predominantly diver- gent design approach; the prefabricated strategy represents a pre- dominantly convergent approach. Normally, the overall aim of a design strategy will be to converge onto a final, evaluated and detailed design proposal, but within the process of reaching that final design there will be times when it will be appropriate and necessary to diverge, to widen the search or to seek new ideas and starting points.
The overall design process is therefore convergent, but it will contain periods of deliberate divergence (Figure 83). Psychologists have suggested that some people are more naturally convergent thinkers and some are more naturally divergent thinkers. These preferred thinking styles mean that some designers may be happier with one kind of strategy style rather than with another; one person may prefer a more convergent style, whereas another may prefer a more divergent style. Alternatively, in a team context, designers with one preferred style may come to the fore in certain stages of the design process, and others may come to the fore at other stages.
Convergent thinkers are usually good at detail design, at evaluation and at selecting the most appropriate or feasible pro- posal from a range of options. Divergent thinkers are usually good

What is a Design Strategy? ¶ 87
.~ Divergence __ ~e~Convergence~t( Divergence/~Convergence ~. II II II !
I ~ Ij II II J
Track of Ill i ~ II I I I ! designer's ~ I Jl ~ II Jl i attention { I ~ ,,. I ~
t II I
Jl II JJ I
• Solution
Figure 83 The overall design process is convergent, but it includes periods of both convergence and divergence
at concept design and at the generation of a wide range of alternatives. Clearly both kinds of thinking are necessary for successful design. Unfortunately, much engineering (and other) education tends to promote and develop only convergent thinking.
As well as convergent and divergent, other kinds of thinking style have also been identified by psychologists, and may also have importance in design and in the structuring of design strategies. One of the most important dichotomies in thinking style appears to be that between serialist and holist. A serialist thinker prefers to proceed in small, logical steps, tries to get every point clear or decision made before moving on to the next, and pursues a straight path through the task, trying to avoid any digressions. A holistic thinker prefers to proceed on a much broader front, picking up and using bits of information that are not necessarily connected logically, and often doing things out of sequence.
Another distinction that has been made between styles of thinking is that between linear and lateral thinking. Linear thinking proceeds quickly and efficiently towards a perceived goal, but may result in getting stuck in a rut, while lateral thinking entails a readiness to see, and to move to, new directions of thought.
The dichotomies of thinking style suggested by the psychol- ogists tend to fall into two groups:
Convergent Divergent Serialist Holist Linear Lateral

188 Design Strategies
There is even some evidence to suggest that there is a fundamental dichotomy between the thinking styles of the two hemispheres of the human brain. The left hemisphere predominates in rational, verbal, analytic modes of thought, while the right hemisphere predominates in intuitive, nonverbal, synthetic modes of thought. Differences in thinking styles therefore appear to be an inherent characteristic of human beings. Most people tend towards a pre- ference for one style rather than another; but no-one is exclusively limited to just one style. In particular, it is actually important to be able to change from one style to another in the course of a design project.
However, many models of the design process, such as those discussed in Chapter 3, do tend to present design as a linear serialistic process. This may be off-putting, and even counter- productive to those designers whose own preferred thinking style tends more towards the lateral and holistic. What is needed is a more flexible and strategic approach to designing, which identifies and fosters the right kind of thinking at the right time, and within the context of the particular design project.
Strategy analogies
To convey this more flexible approach to design strategies and tactics, some authors have resorted to the use of analogies. For example, Jones (1981) has suggested that a designer is like an explorer searching for buried treasure.
A new problem is like an unknown land, of unknown extent, in which the explorer searches by making a network of journeys. He has to invent this network, either before he starts or as he proceeds. Design methods are like navigational tools, used to plot the course of a journey and maintain control over where he goes. Designing, like navigation, would be straightforward if one did not have to depend on inadequate information in the first place. Unlike the explorer's, the designer's landscape is unstable and imaginary, it changes form according to the assumptions he makes. The designer has to make as much sense as he can of every fragmentary clue, so that he can arrive at the treasure without spending a lifetime on the search. Unless he is very unlucky, or very stupid, he will come across the treasure long before he has searched every inch of the ground.

What is a Design Strategy? 189
Koberg and Bagnall (1974) have suggested that the designer is like a traveller, and that 'the design process is a problem-solving journey':
A general rule is to find and use those methods which best fit the problem as well as the abilities of the problem solver. It's a task similar to that of selecting the route, side roads and overnight stops for an auto trip. Just as any competent trip planner would examine the alternative routes on a map, and read through several brochures, books or articles before choosing a route for his trip, so should the problem solver review the methods available, and not be afraid to adapt any of them to his special needs.
Instead of exploring or travelling, I prefer an analogy based on football. A design team, like a football team, has to have a strategy. The football team's strategy for defeating the opposi- tion will consist of an agreed plan to use a variety of plays or moves (i.e. techniques or methods), to be applied as the situa- tion demands. During the game, the choice of a move, and whether or not it is successful, will depend on the specific cir- cumstances, on the skill of the players, and on the response of the opposition.
The repertoire of moves used in a game is partly decided in advance, partly improvised on the field, and also amended at the half-time briefing by the team coach. The coach's role is important because he maintains a wider view of the game than the players can actually out there on the field. In designing, it is necessary to adopt a similar role from time to time, in reviewing the project's strategy and progress.
For you as an individual designer, or member of a design team, tackling your problem and reaching your goal will involve both the strategic skills of the coach and the tactical skills of the player. Also, like the team, you will have to make on-field and half-time reviews of your strategy to ensure that your problem does not defeat you! A design strategy, therefore, should provide you with two things: a framework of intended actions within which to oper- ate; and a management control function enabling you to adapt your actions as you learn more about the problem and its responses to your actions.

190 Design Strategies
Frameworks for Action
One framework, complete with appropriate methods identified and located within it has already been suggested. That was the procedural model of the design process that I outlined in Chapter 4:
Stage in the design process 1. Clarifying objectives
2. Establishing functions
3. Setting requirements
4. Determining characteristics
5. Generating alternatives
6. Evaluating alternatives
7. Improving details
Appropriate method Objectives tree
Function analysis
Performance specification
Quality function deployment
Morphological chart
Weighted objectives
Value engineering
If it seemed to be appropriate to the specific project in hand, then you could adopt this as a complete prefabricated strategy. It comprises a seven-stage framework covering the design process from client objectives through to detail design, and a suitable tactic (a design method) for each stage. You could, of course, add or substitute for methods in each stage. For example, you could use brainstorming instead of a morphological chart as a way of generating alternative solutions; you could use the conventional design-by-drawing method instead of, or perhaps as well as, value engineering or analysis at the stage of detail design.
However, this particular framework does imply that the design process is going to be a fairly straightforward, step-by-step process. It implies a linear design process. A design strategy that is more suited to a lateral approach might be something like this:
Io
Stage Divergent problem exploration
2. Structuring of problem
3. Convergence on solution
Tactics to be used Morphological chart Brainstorming
Objectives tree
Performance specification Synectics
Another framework might be adopted from the general pattern of the creative process, as outlined in Chapter 4. This might be developed as follows:
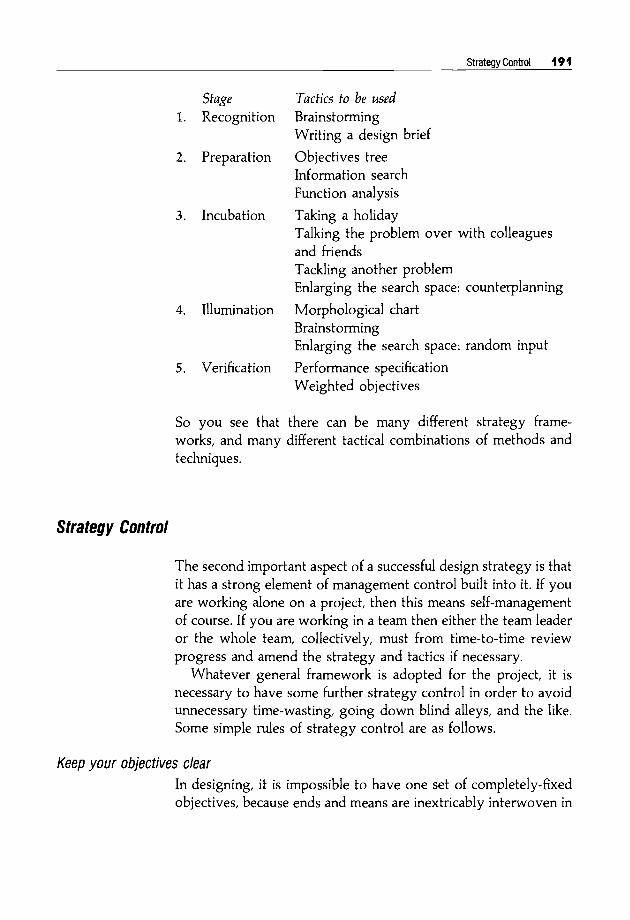
Strategy Control 191
,
Stage Recognition
2. Preparation
3. Incubation
4. Illumination
5. Verification
Tactics to be used Brainstorming Writing a design brief
Objectives tree Information search Function analysis
Taking a holiday Talking the problem over with colleagues and friends Tackling another problem Enlarging the search space: counterplanning
Morphological chart Brainstorming Enlarging the search space: random input
Performance specification Weighted objectives
So you see that there can be many different strategy frame- works, and many different tactical combinations of methods and techniques.
Strategy Control
The second important aspect of a successful design strategy is that it has a strong element of management control built into it. If you are working alone on a project, then this means self-management of course. If you are working in a team then either the team leader or the whole team, collectively, must from time-to-time review progress and amend the strategy and tactics if necessary.
Whatever general framework is adopted for the project, it is necessary to have some further strategy control in order to avoid unnecessary time-wasting, going down blind alleys, and the like. Some simple rules of strategy control are as follows.
Keep your objectives clear In designing, it is impossible to have one set of completely-fixed objectives, because ends and means are inextricably interwoven in

192 Design Strategies
the product you are designing. A creative resolution of a design problem often involves changing some of the original objectives. However, this does not mean that it is impossible to have any clear objectives at all. On the contrary, it is important to have your objectives clear at any time (probably in the form of an objectives tree), but also to recognize that they can change as your pro- ject evolves.
Keep your strategy under review Remember that your overall aim is to solve the design problem in a creative and appropriate way, not doggedly to follow a path you have set for yourself that might be leading nowhere! A design strategy needs to be flexible, adaptable and intelligent; so review it regularly. If you feel that your actions are not being very productive, or that you are getting stuck, then pause to ask yourself if there is not a better way of proceeding. Have confidence in adapting the tactics, the methods and techniques, to your own ways of working and to the aims and progress of the project.
Involve other people Different people see a problem in different ways, and it is often true that 'two heads are better than one'. If you are getting stuck, one of the easiest ways to sort out what is going wrong is to explain the project to someone else, a colleague or a friend. Other people, of course, are also able to offer ideas and different viewpoints on the problem which may well suggest ways to change your approach.
Keep separate files for different aspects There will, almost certainly, be times when you are having to work on several different aspects of a project in parallel; so keep separate files which allow you to switch rapidly from one aspect to another, or to take in a new piece of information in one area without distracting your work on another. One very useful file to keep is 'solution ideas'. You will probably come across or have ideas for solutions at all times throughout the project, but you will need to keep them filed until you are ready to turn your whole attention to solution concepts or details.

Setting Strategies and Choosing Tactics '!93
Setting Strategies and Choosing Tactics
The following short exercises are intended to give some practice in devising strategic frameworks and selecting appropriate tactical methods or techniques.
Each exercise need only take 5-10 minutes.
Exercise 1 Your company manufactures industrial doors of various kinds. With the increased availability of electronic devices, remote controls and so on, the company has decided to produce a new range of automatically-operated doors. You have been asked to propose a set of prototype designs that will establish the basic features of this new range. Outline your design strategy and tactics.
Exercise 2 Your company manufactures packing machinery. One of the company's most valued customers is about to change its product range and will therefore need to replace its packing machinery. You will be responsible for designing this new machinery. Outline your design strategy and tactics.
Exercise 3 You have just been appointed design consultant to a company manufacturing office equipment. Its sales have fallen drastically because its designs have failed to keep up with modem office equipment trends. To re-establish its position the company wants a completely new product that will be a step ahead of all its rivals. You have to suggest what the new product should be, and produce some preliminary design proposals for a Board meeting in two weeks' time. Outline your design strategy and tactics.
Discussion of exercises
Industrial doors The change from manual to automatic doors implies that there could be scope for rethinking the scope of the company's current

194 Design Strategies
range, perhaps to include some door types that were not pre- viously included. It is therefore worth putting some divergent search effort into the early stages of the design project. It is also important not to overlook the features of existing doors that are valued by customers, so quality function deployment could be used to identify the critical characteristics. My suggested strategy would be as follows.
Io
Framework Problem exploration
2. Problem specification
3. Alternative solutions
4. Selection of alternatives
Tactics Brainstorming Synectics
Quality function deployment
Morphological chart
Weighted objectives
Packing machinery This appears to be a straightforward case of redesigning an established product. There is no apparent need for radically new design concepts, so fairly conventional methods can be used. My suggested strategy would be as follows.
Framework 1. Customer requirements/problem
specification
2. Alternative solutions/evaluation of alternatives
3. Detail design
Tactics Performance specification
Value engineering
Conventional design-by-drawing
Office equipment This problem does suggest the need for some radical design thinking, and pretty quickly! Creativity techniques would there- fore feature strongly in the strategy. Following the generation of ideas, I think that I might try to use a modified version of the objectives tree method in a final, more convergent stage, and to work this into my presentation to the board to relate the choice of alternatives to the company's objectives. My suggested strategy would be as follows.

Setting Strategies and Choosing Tactics 19§
.
Framework Divergent search
2. Alternative solutions
3. Convergent selection
Tactics Enlarging the search space: why-why-why? Function analysis
Brainstorming Morphological chart
Objectives tree
I hope that these brief examples give an indication of how to adopt a strategic approach to product design, using a variety of methods as the tactics of designing. The important points to remember are to devise a strategy that responds to the particular problem and situation, to keep your strategy flexible and to review its effectiveness from time to time during the design project.
Product Development
Product Design
The examples of product designs that have been included in this book have ranged from one-off engineering structures such as test rigs and packaging machines, through major mass-production machines such as motor cars and computers, to more modest consumer products such as torches and bicycle splashguards. The range of examples and the scope of the book therefore reflect a concept of product design that traditionally has been divided between the two (often conflicting) camps of engineering design and industrial design.
Conflicts have sometimes arisen between these two camps because of misconceptions about each other's roles. Engineering designers sometimes see industrial designers as mere stylists who add the external casing and the pretty colours to the machines that they have engineered; and industrial designers sometimes see engineering designers as the suppliers of crude mechanisms that they then have to try to convert into usable products. Of course, different products require a different mix of skills; in some products the engineering element may be relatively small, whereas in others it is very large. This mix of engineering and industrial design contributions in different products is often shown diagramatically as in Figure 84.
However, the increasing competition in consumer product markets and the growing awareness of the importance of design for the market has led to reinforcement of the view that successful product design can only be accomplished by an integration of the skills of both engineering and industrial designers. Products that are well engineered but are difficult to use, ugly or unsafe, are not well designed products. Neither are products that are attractively

t 98 Product Development
<
[ -
z ~ ii!i~iiii~i~i~i~i~i~iiiiii~i~i!!!i!~!~!iii~i~i!~iiiii~!iii!i!i!iiiiii!ii!iiii~i~ii~ z
iiiii!i ii!i! i !if!!! i !i ! i ii ! i! I i! !!!ii i! iii! !i iii!i i i! !i!i i !ii fill ill! l ightiilg Icicphone cicctric waslfi rig motor car maclfi ue tool fitting hmidsc! drill maclfinc
Figure 84 The traditional view of varying contributions of engineering and industrial design in different kinds of products
styled but are unreliable, flimsy and difficult to maintain and reuse. Good product design practice is therefore converging towards the industrial design engineer, a designer (or design team) with knowledge and skills from both engineering and industrial design.
Product Planning
Whether a particular product is seen as an exercise predominantly in engineering design or in industrial design, it is important to realize that design is only a part of a larger process of pro- duct planning and development. This larger process extends from the business strategy of the client company, through the manu- facturing, marketing and distribution of the product. Ultimately, the commercial success of a product depends on the purchasing decision of the consumer.
From the consumer's point of view, there is little input that he or she can make to product planning and design. The important decisions are taken by others, and all that the consumer can do is to exercise some choice between products at the point of sale. Collectively, however, consumers are extremely important to manufacturers. The mass of consumers, all making their individual purchase decisions, constitute the market for which the manu- facturers plan their products. They engage in market research of various kinds and they respond to the pressures exerted by their more successful competitors in the market. The manufacturers

Product Planning 199
producer "F consumer
business strategy
T product policy
~--designer--I~
new product evaluate use
and choose product
Marketing feedback
Figure 85 The roles of producer, consumer and designer
must constantly review and develop their business strategies, of which one of the most important elements is their strategy for introducing new products.
The situation is shown diagramatically in Figure 85. The manufacturer or producer's role starts from the establishment of a business strategy, from which new product policies and plans are developed, and specific products are then designed and manu- factured. The consumer's (rather limited) role is to choose and use the available products. The consumer's decisions are, however, influential on future new product development, through the feedback loop of market research.
Clearly, this diagram is an inadequate representation of the full set of activities in product planning, specification, design, development and manufacture. The new product box bridges a huge region in the middle between the producer's product planning options and the consumer's purchase choice. Major sections of the whole new product development process lie in this region.
The producer's product plan will only identify broad ranges or types of products; for instance, a hi-fi manufacturer's product plan might identify only the suggestion of producing a source component to add to its product range, such as a CD-player or audio-cassette player; a vacuum cleaner manufacturer's product plan might identify only a need to replace their mid-range model within a certain time period.
From these broad plans it is necessary to generate some speci- fic product ideas. These ideas might range from improvements to or redesigns of existing products, through suggestions for new additions to a product range, to completely new innovative products. The ideas might come from the company management,

200 Product Development
design teams, marketing departments, or even directly from con- sumers. Given the variety of ideas and potential new products, a screening and selection process will be necessary to reduce the variety down to a smaller number of ideas which can be sub- jected to feasibility analyses. Eventually, a new product proposal emerges in the form of a product design brief and specification.
Given the brief for the new product proposal, the activities of product design proper can start. The key role of design in the overall process of product development is shown in Figure 86, from British Standard BS 7000 'Guide to Managing Product Design'.
The design brief is the link between the initial phase of identi- fying the need or motivation for the product and the creation phase of design, development and production. The design stage itself leads to a definition of a particular/specific product, which is then subject to further development and refinement before going into full-scale production. This development stage will consist of planning for the production and marketing of the product, as well as refinements in the detailed engineering of the product, its materials specification, and so on.
Design, production and marketing used to be thought of as rather separate activities. The designers would despatch their drawings to the production engineers, who would decide how to make the product, perhaps making some major changes in order to simplify the production process, and then pass the prototypes onto the marketing personnel, who would decide how to sell the product. It is now recognized that design, production and market- ing development must proceed in parallel and with mutual inter- action, if satisfactory and successful products are to reach the market on time.
The stages of design and development in Figure 86, therefore, should result in a product definition which includes not only the refined and detailed product design, but also plans for the pro- duction and marketing of the product. These plans will be implemented in the later production and distribution stages.
Product design therefore plays its essential role within a much broader process of new product creation. Product designing starts with the design brief and ends with the refined product definition. (In fact, of course, it may also at times be extended both into earlier phases of product planning and into later phases of product realization.) The overall process of new product creation can be

Product Planning 20 t
MOTIVATION NEED
CREATION
OPERATION
DISPOSAL
J
I
C_ TRIGGER
.... ~i~
PRODUCT PLANNING
FEASIBILITY STUDY
)
oEs,om ..... i l l
DEVELOPMENT
PRODUCTION (manufacture.assembly,test)
J
'1 (pack aging.tr anspor t, insfallafion.commissioningl
. .~~- ,. ..... ...''
(_ 1 OPERA TION (USE)
It Figure 86 The product development process according to BS 7000
lin f ernal/e x fern al)
PRODUCT IDEA
PROJECT PROPOSAL
DESIGN BRIEF
PRODUCT DEFINITION
REFINED PRODUCT DEFINITION
UNUSED PRODUCT
INSTALLED PRODUCI
USED PRODUCT
RECYCLED ELEMENTS SCRAP

202 Product Development
regarded as comprising three phases. First there is a phase of product planning in which product policy is formulated and ideas sifted. This is followed by the product design phase (including plans for manufacture and marketing). Finally there is the product realization phase, including manufacture, distribution and sales.
Product Innovation
Most companies have a continuous programme of product development, within which they seek to maintain and increase their product sales by continually introducing improved and updated versions of their products. However, occasionally radi- cally new products appear on the market, products of a completely new type or form. Examples of such product innovations include ball-point and fibre-tip pens, pocket calculators, motor scooters, personal computers, video cassette players and video cameras, etc. As well as these many successes, there are also frequent failures, product innovations that do not become economic successes, and that are soon forgotten. Product innovation is therefore a risky business, and it is not surprising that most companies prefer to stick to the safer ground of gradual product evolution. However, the rewards of successful innovation can be substantial, and so many companies are attracted, or find it necessary to venture into it.
A success story: the Sony Walkman
A classic example of successful product innovation is the Sony Walkman, the personal stereo audio-cassette (and later CD) player. There are now hundreds of different versions of this product type, made by dozens of different companies, but the first version was introduced by Sony in 1979. It seems difficult to believe now, but before that date there was no comparable product, and the millions of us that now own them simply did not know that we wanted such a product!
In the 1970s Sony was already a major manufacturer of electronic products such as radios, televisions, video and audio recorders. There are differing stories about the origin of the Walk- man concept; some say that it originated with one or other of the company's co-founders, Akio Morita and Masaru Ibuka, one of

Product Innovation 203
whom wanted to listen to music while he played golf, and the other who wanted to listen to good quality stereo music while travelling on aeroplanes; others say that the concept originated from fierce internal competition between divisions of the company and from its general product development strategies towards miniaturization and personalization. In any case, it was still a risky decision to try to sell to the public a new style of recording machine, that could only play back and not record! This was a decision that was taken by Akio Morita, the company chairman. One of the common features of radical product innovation is that there is an influential 'product champion' within the company, who pushes for the product against its critics, and in Sony there was no- one more influential than Morita.
The Walkman did not just appear out of the blue, but it did have an unconventional development history within Sony. Its pre- decessor was the Pressman, a portable, pocket-sized, cassette tape- recorder aimed specifically, as its name suggests, at journalists. According to Morita, Ibuka had complained to him that the con- ventional portable stereo cassette player and headphones were far too heavy and cumbersome. Morita then instructed engineers in the Sony tape recorder division to use the Pressman as a basis for a new portable system. Unfortunately, the Pressman was a monaural machine, and the engineers could only find the space inside it for the stereo circuits by omitting its recording circuits. Morita reckoned that the lack of a recording function would not be important; the new portable system would be used for playback only. The crucial second step was to combine development of the new stereo cassette player with another project already being developed in Sony, lightweight miniature headphones. It was this combination that satisfied Ibuka's desire for a lightweight system. Both Morita and Ibuka began using early versions of this new system during activities such as playing golf and aeroplane travelling, hence the stories that arose.
At first Sony had no idea just how successful the Walkman con- cept would be. They certainly did not know that Walkman would become a generic product name, like Biro for ball-point pens or Hoover for vacuum cleaners. Only in Japan was it launched as the Walkman; in the USA it was called the Soundabout, in Scandinavia the Freestyle and in Britain the Stowaway. Only as it became such a major success did the rather strange Japanese-English of

204 Product Development
Walkman become established as the product's world-wide name. Sony had discovered, or created, a whole new market, and without doing any market research!
A failure story: the Sinclair C5
Most product innovations that fail simply fade into obscurity and are forgotten. In contrast, the Sinclair C5 became notorious as an example of failure, probably largely because its inventor-designer Clive Sinclair was well-known with a reputation for radical and usually successful innovations in electronic products such as minia- ture TVs and personal computers.
The C5 was a different type of product, an electrically-assisted tricycle (Figure 87). Sinclair had been interested in electric vehicles before, and had done some previous design work on a range of electric vehicles, including a two-seater called the C10. The
Figure 87 The Sinclair C5 electrically-assisted tricycle

Technology Push and Market Pull 205
stimulus for the C5 arose from some changes in UK road traffic regulations. These defined a new class of two- or three-wheeled electrically-assisted pedal vehicles, which could be used on the roads by anyone over the age of 14, without licence or insurance. This market niche would include, for example, electrically-assisted bicycles, but the C5 was a radically different concept. It was designed by teams of experienced engineers (for instance, the chassis and transmission were developed by Lotus Cars), and was progressive in both technology (e.g. the polypropylene body shell was the largest mass-produced injection-moulded assembly at that time) and ergonomics (e.g. the low seating position, with handle- bar below the knees).
The C5 was launched in January 1985 with considerable publi- city and promotion. The new company Sinclair Vehicles expected to sell 100 000 units per year, but production was discontinued in August 1985 with only about 5000 sold. Sinclair Vehicles went into receivership in October 1985, having lost £8.6 million.
Despite the clever engineering and design of the C5 it was a disastrous commercial failure. Clearly the concept was wrong, and people simply would not be persuaded that driving/pedalling it among other traffic would make them feel 'secure, but exhilarated' as the advertising claimed! Although some marketing research was done for the C5, this was after the essential concept had already been decided, and appeared to be mainly to aid promotion.
Technology Push and Market Pull
Many radical product innovations seem to be based on new technology. For example, pocket calculators, personal computers and many other new electronics-based products were made pos- sible by the development of the microprocessor chip. However, as we have seen in the success and failure stories, people's willingness to buy new products is the ultimate deciding factor; if people do not want the product then it fails. There are also many examples of new product development that do not depend on new technology but on recognizing what people want or need, whether that is recyclable packaging, stacking hi-fi systems or dish washers, etc. There are therefore two strong aspects to new product devel-

206 Product Development
opment: the push that comes from new technology and the pull of market needs.
These two aspects are usually called technology push and market pull. Technology itself, of course, does not do any pushing; that comes from the developers and suppliers of the new tech- nology, and from the makers of the new products. In practice, a lot of new product development is influenced by a combination of both technology push and market pull.
Many companies prefer to work on the market-pull model, using market research to identify customers' wants and needs. The technology-push view, on the other hand, emphasizes that innovations can create new demands and open up new markets. Market research usually cannot identify demands for products that do not yet exist.
This has been recognized particularly by those companies that try to plan new product development in terms of both techno- logical seeds and customer needs; success depends on matching seeds with needs. However, even when a market need and a
Figure 88 Opportunities for
new product development and
innovation
current market
new market
current new technology technology
j ii!••••i••!iii•••!i•i•i•ii•i!iii!•i••ii•i•iiiiiii•i!•iii•iii!•!!•!•iiii•iiiiiiiiii!ii••i••••i!iii•ii•
...................................................... ~,~,~,~,~~,~i ................ iiiiiiiiiiiiiiiiiiiiiiiiiiiiiiiiiiiiiiiiiiiiiiiiiiiiiiiiiiiiiiiiii~:
~iiii~i!i!i~!iii~i~iii~!iii~i!~i!~i~iii~i!ii~!i~!ii!i!i~i!!i~iii~i!!i~ii!iiiii~ii~!!i~i~i~iii~!iii!!~i~!~i!~!!!!!~!!ii~ii!!~!iii~ i ii!! i i i i!!i!! i!ii!iiiiiii !iiiiiiiiiiiii!!iiiiiiiii!iilj !iiiiiiiiiili!iiiiiiiiiiiiiiiiiiiii!!iiiiii!i!iiiiiiiiiiiiii!iiiill i!!!!iiiiiiii!i!iiiiii!i!!!! ilij i~iiiii~iiii~iiiiiiiiiii~iii~iiiiiiiiii~i~iiiii~iiii~iiii~i~ii~i!illiii~iiiiiiiii~iiii~!ii~ii~iii~i~iii~iii!!!iiiiiiiiiiii~iiii!~!i!i!i!iiiii~iii~ii~i~iiiiii~
iii!ii!iiiiii!i~!~!!~i~!~!~!~i!i~ii~ii~ii~i~!~i~i~iii~!~iiii!~i~ii~i~i!iii;i~iiiii i~i~i~i~i~i~;~i~i~i~i~i~i~i~i~i~i~i~i~i~i~i~i~i~i~i~i~i~i~i~i~i~i~;i~i~i~i~i~i~i~~iii~ technology i ~ii i:j::::i: i : push i j ......... i
liiiii !i i/;i ilililili ili!:,; .i! ii!ii! ! !
market pull

Technology Push and Market Pull 207
technology seed can be matched, and a new product concept identified, there is no guarantee that a product will actually be developed. It may require far too much financial investment, for example, or a product champion may not emerge or be success- ful within the company. Another reason is that some product concepts are actually suppressed by companies and organizations that have a strong vested interest in maintaining the markets for their existing products. This is particularly true of industries with a heavy capital investment in the continued production of a particular product type. The motor industry, for example, failed to support the development of alternative vehicles, such as electric cars, until it began to see such innovations as potentially important to its survival.
Some opportunities for new product development lie in the region where an already-developed technology can meet an undeveloped market, while others lie in the region where new technology can be applied in an already developed market (Figure 88). A third region, for the most radical (and risky) product innovations, is where new technology and new market opportu- nities might be developed together. The Sony Walkman and Sinclair C5 were both examples of the latter.

Index
added value 163, 168 air valve example 173 algorithmic procedure 34 analogies 52
see also strategy analogies analysis 7, 30, 34 attributes 93, 107, 108
bicycle splashguard example 154
black box model 78 brainstorming 48 breadth-first approach 26
114,
car door examples 71, 117 carpet squares packing system
example 84 ceiling diffuser example 170 characteristics 107, 110 checklist 56 city car example 148 combinatorial explosion 124, 125 communication of designs 4 conceptual design 31, 32, 38 constraints 13 consumers 199, 201 container lock example 50 convergent approach 186 cordless drill example 116 cost-benefit analysis 166 costs 166 craft design 3 creative design 36 creative methods 48 creative process 55 creativity 19, 48, 53, 123 criteria 7, 11, 13, 14
decision tree 18 demands and wishes 94 depth-first approach 26 descriptive models 29
design ability 19 design activities 3 design brief 11, 201 design methodology 34 design objectives 61, 139, 140
see also objectives tree design problems 11, 25 design process 3, 6, 7, 9, 29, 30, 34,
40, 59, 185, 186, 188, 190 design strategy 185 design tactics 185, 190 design thinking 21, 25, 186 detail design 32, 38 divergent approach 186 drawings 4, 6, 9, 20, 21
electric toothbrush example 100 embodiment design 32, 38 evaluation of designs 6, 34, 139 experienced designers 25 exploration of designs 9 externalizing 47, 56
fan heater example 119 feed delivery system example 8I field maintenance machine
example 134 fixation 26 forklift truck examples 53, 135 formalizing 47, 56 fuel gauge example 85 , 97 function analysis 57, 71, 78, 124
generation of designs 9 goals 13
handtorch example 179 heuristic procedure 29 house of quality 112, 116, 119, 121
ignition system example 171 ill-defined problems 14, 16

212 Index
industrial design integrative model intuition I9 iteration 7
197 42
manufacture 164, 167 market pull 207 market research 107, 109, 180, 199,
207 measurement scales 140, 142, 143 mixer tap example 97 morphological chart 58, 124
novice designers 26
objectives tree 57, 62, 117, 139
performance specification 5 7, 92, 139
piston example 174 portable fax machine example 102 potato harvesting machine
example 128 prescriptive models 34 primary generator 21 problem focused strategy 21 problem structure 15 product champion 204, 208 product design 197, 203 product development 197 product innovation 203 product planning 199 pump example 71
quality function deployment 57, 108
rational methods 56
search space 53 seat suspension unit example shaft coupling example 129 Sinclair C5 205, 209
101
sketches 20, 21, 23 solution space 10, 92 solution-focused strategy 21, 25,
29, 40 Sony Walkman 204, 209 specification 6, 107
see also performance specification strategies
design 185 problem focused 21 solution focused 21, 25, 29, 40
strategy analogies 188 strategy control 191 strategy styles 186 swivel joint example 149 synectics 51 synthesis 34 syringe example 156 system boundary 79 systematic procedure 26, 38, 45
team work 45, 166, 185, 189 teamaker example 71, 85 technology push 207 test rig example 69, 149 thinking styles 186, I87 transparent box model 79 transport systems examples tubular heater example 175
66, 69
utility values 149
value, values 163, 165 value analysis 164 value engineering 58, 164 vehicle configurations example 128 visualization 9 voice of the customer 107, 113, 114
washing machine example 86 weighted objectives 58, 140 welding positioner example 128

References and Sources
Archer, L. B., 1984, Systematic Method for Designers. In: N. Cross (Ed.), Devel- opments in Design Methodology, Wiley, Chichester.
Darke, J., 1984, The Primary Generator and the Design Process. In: N. Cross (Ed.), Developments in Design Methodology, Wiley, Chichester.
Davies, R., 1985, A Psychological Enquiry into the Origination and Implementation of Ideas. MSc Thesis, Dept. of Management Sciences, University of Manchester Institute of Science and Technology.
Dwarakanath, S. and Blessing, L., 1996, Ingredients of the Design Process. In: N. Cross, H. Christiaans and K. Dorst (Eds), Analysing Design Activity, Wiley, Chichester.
Ehrlenspiel, K. and John, T., 1987, Inventing by Design Methodology. Inter- national Conference on Engineering Design, American Society of Mechanical Engineers, New York.
Engineering Industry Training Board, Value Engineering, E.I.T.B., London. Fricke, G., 1996, Successful individual approaches in engineering design.
Research in Engineering Design, 8, pp. 151-165. Fowler, T. C., 1990, Value Analysis in Design, Van Nostrand Reinhold, New
York. French, M. J., 1985, Conceptual Design for Engineers, Design Council, London. Hauser, J. R. and Clausing, D., 1988, The house of quality. Harvard Business
Review, May-June. Hawkes, B. and Abinett, R., 1984, The Engineering Design Process, Pitman,
London. Hubka, V., 1982, Principles of Engineering Design, Butterworth, London. Hubka, V., Andreasen, M. M. and Eder, W. E., 1988, Practical Studies in
Systematic Design, Butterworth, London. Hurst, K., 1999, Engineering Design Principles, Arnold, London. Jones, J. C., 1981, Design Methods, Wiley, Chichester. Jones, J. C., 1984, A Method of Systematic Design. In: N. Cross (Ed.), Develop-
ments in Design Methodology, Wiley, Chichester. Koberg, D. and Bagnall, J., 1974, The Universal Traveler, Kaufmann, Los Altos,
California. Krick, E., 1976, An Introduction to Engineering, Wiley, New York. Lawson, B., 1984, Cognitive Strategies in Architectural Design. In: N. Cross (Ed.),
Developments in Design Methodology, Wiley, Chichester. Lawson, B., 1994, Design in Mind ,Butterworth-Heinemann, Oxford. Love, S. F., 1980, Planning and Creating Successful Engineered Designs, Advanced
Professional Development, Los Angeles, California. Luckman, J., 1984, An Approach to the Management of Design. In: N. Cross (Ed.),
Developments in Design Methodology, Wiley, Chichester. March, L. J., 1984, The Logic of Design. In: N. Cross (Ed.), Developments in Design
Methodology, Wiley, Chichester.

210 References and Sources
Norris, K. W., 1963, The Morphological Approach to Engineering Design. In: J. C. Jones and D. Thomley (Eds), Conference on Design Methods, Pergamon, Oxford.
Pahl, G. and W. Beitz, 1984, Engineering Design, Design Council, London. Pighini, U., et al., 1983, The determination of optimal dimensions for a city car.
Design Studies, 4, No. 4. Pugh, S., 1991, Total Design, Addison Wesley, Wokingham. Radcliffe, D. and Lee, T. Y., 1989, Design methods used by undergraduate
engineering students. Design Studies, 10, No. 4. Ramaswamy, R. and Ulrich, K., 1992, Augmenting the House of Quality with
Engineering Models. In: D. L. Taylor and L. A. Stauffer (Eds), Design Theory and Methodology, American Society of Mechanical Engineers, New York.
Redford, A. H., 1983, Design for assembly. Design Studies, 4, No. 3. Schon, D. A., 1983, The Reflective Practitioner, Basic Books, New York. Shahin, M. M. A., 1988, Application of a systematic design methodology.
Design Studies, 9, No. 4. Simon, H. A., 1984, The Structure of Ill-structured Problems. In: Cross, N. (Ed.),
Developments in Design Methodology, Wiley, Chichester. Tjalve, E., I979, A Short Course in Industrial Design, Newnes-Butterworths,
London. Tovey, M., 1986, Thinking styles and modelling systems. Design Studies, 7,
No. 1. Ullman, D.G., 1992, The Mechanical Design Process, McGraw-Hill, New York. Ulrich, K. T. and Eppinger, S. D., 1995, Product Design and Development,
McGraw-Hill, New York.