Embed Size (px)
Citation preview
Promoter: Prof. Dr. Ir. Erik Duval
Mentor:Sven Charleer
Niels DelestinneMSc in Applied Informatics
nielsdelestinne.wordpress.com
“Second screen” application for nature documentaries
01/04/2015

1. Goal of this thesis
2. Recap
3. Progress (since last presentation)
4. Planning
5. Statistics
6. Demo
Table of contents
T307: description
With this thesis we investigate whether users can gain added value by using a second screen application when watching a nature documentary on TV.
Design, develop and evaluate the impact on the user of (a) second screen application(s).
Goal of this thesis
Research question / Problem definition
Goal of this thesis
Creating added value and increasing the interaction
without negatively affecting the viewing experience.

1. Goal of this thesis
2. Recap
3. Progress (since last presentation)
4. Planning
5. Statistics
6. Demo
Table of contents
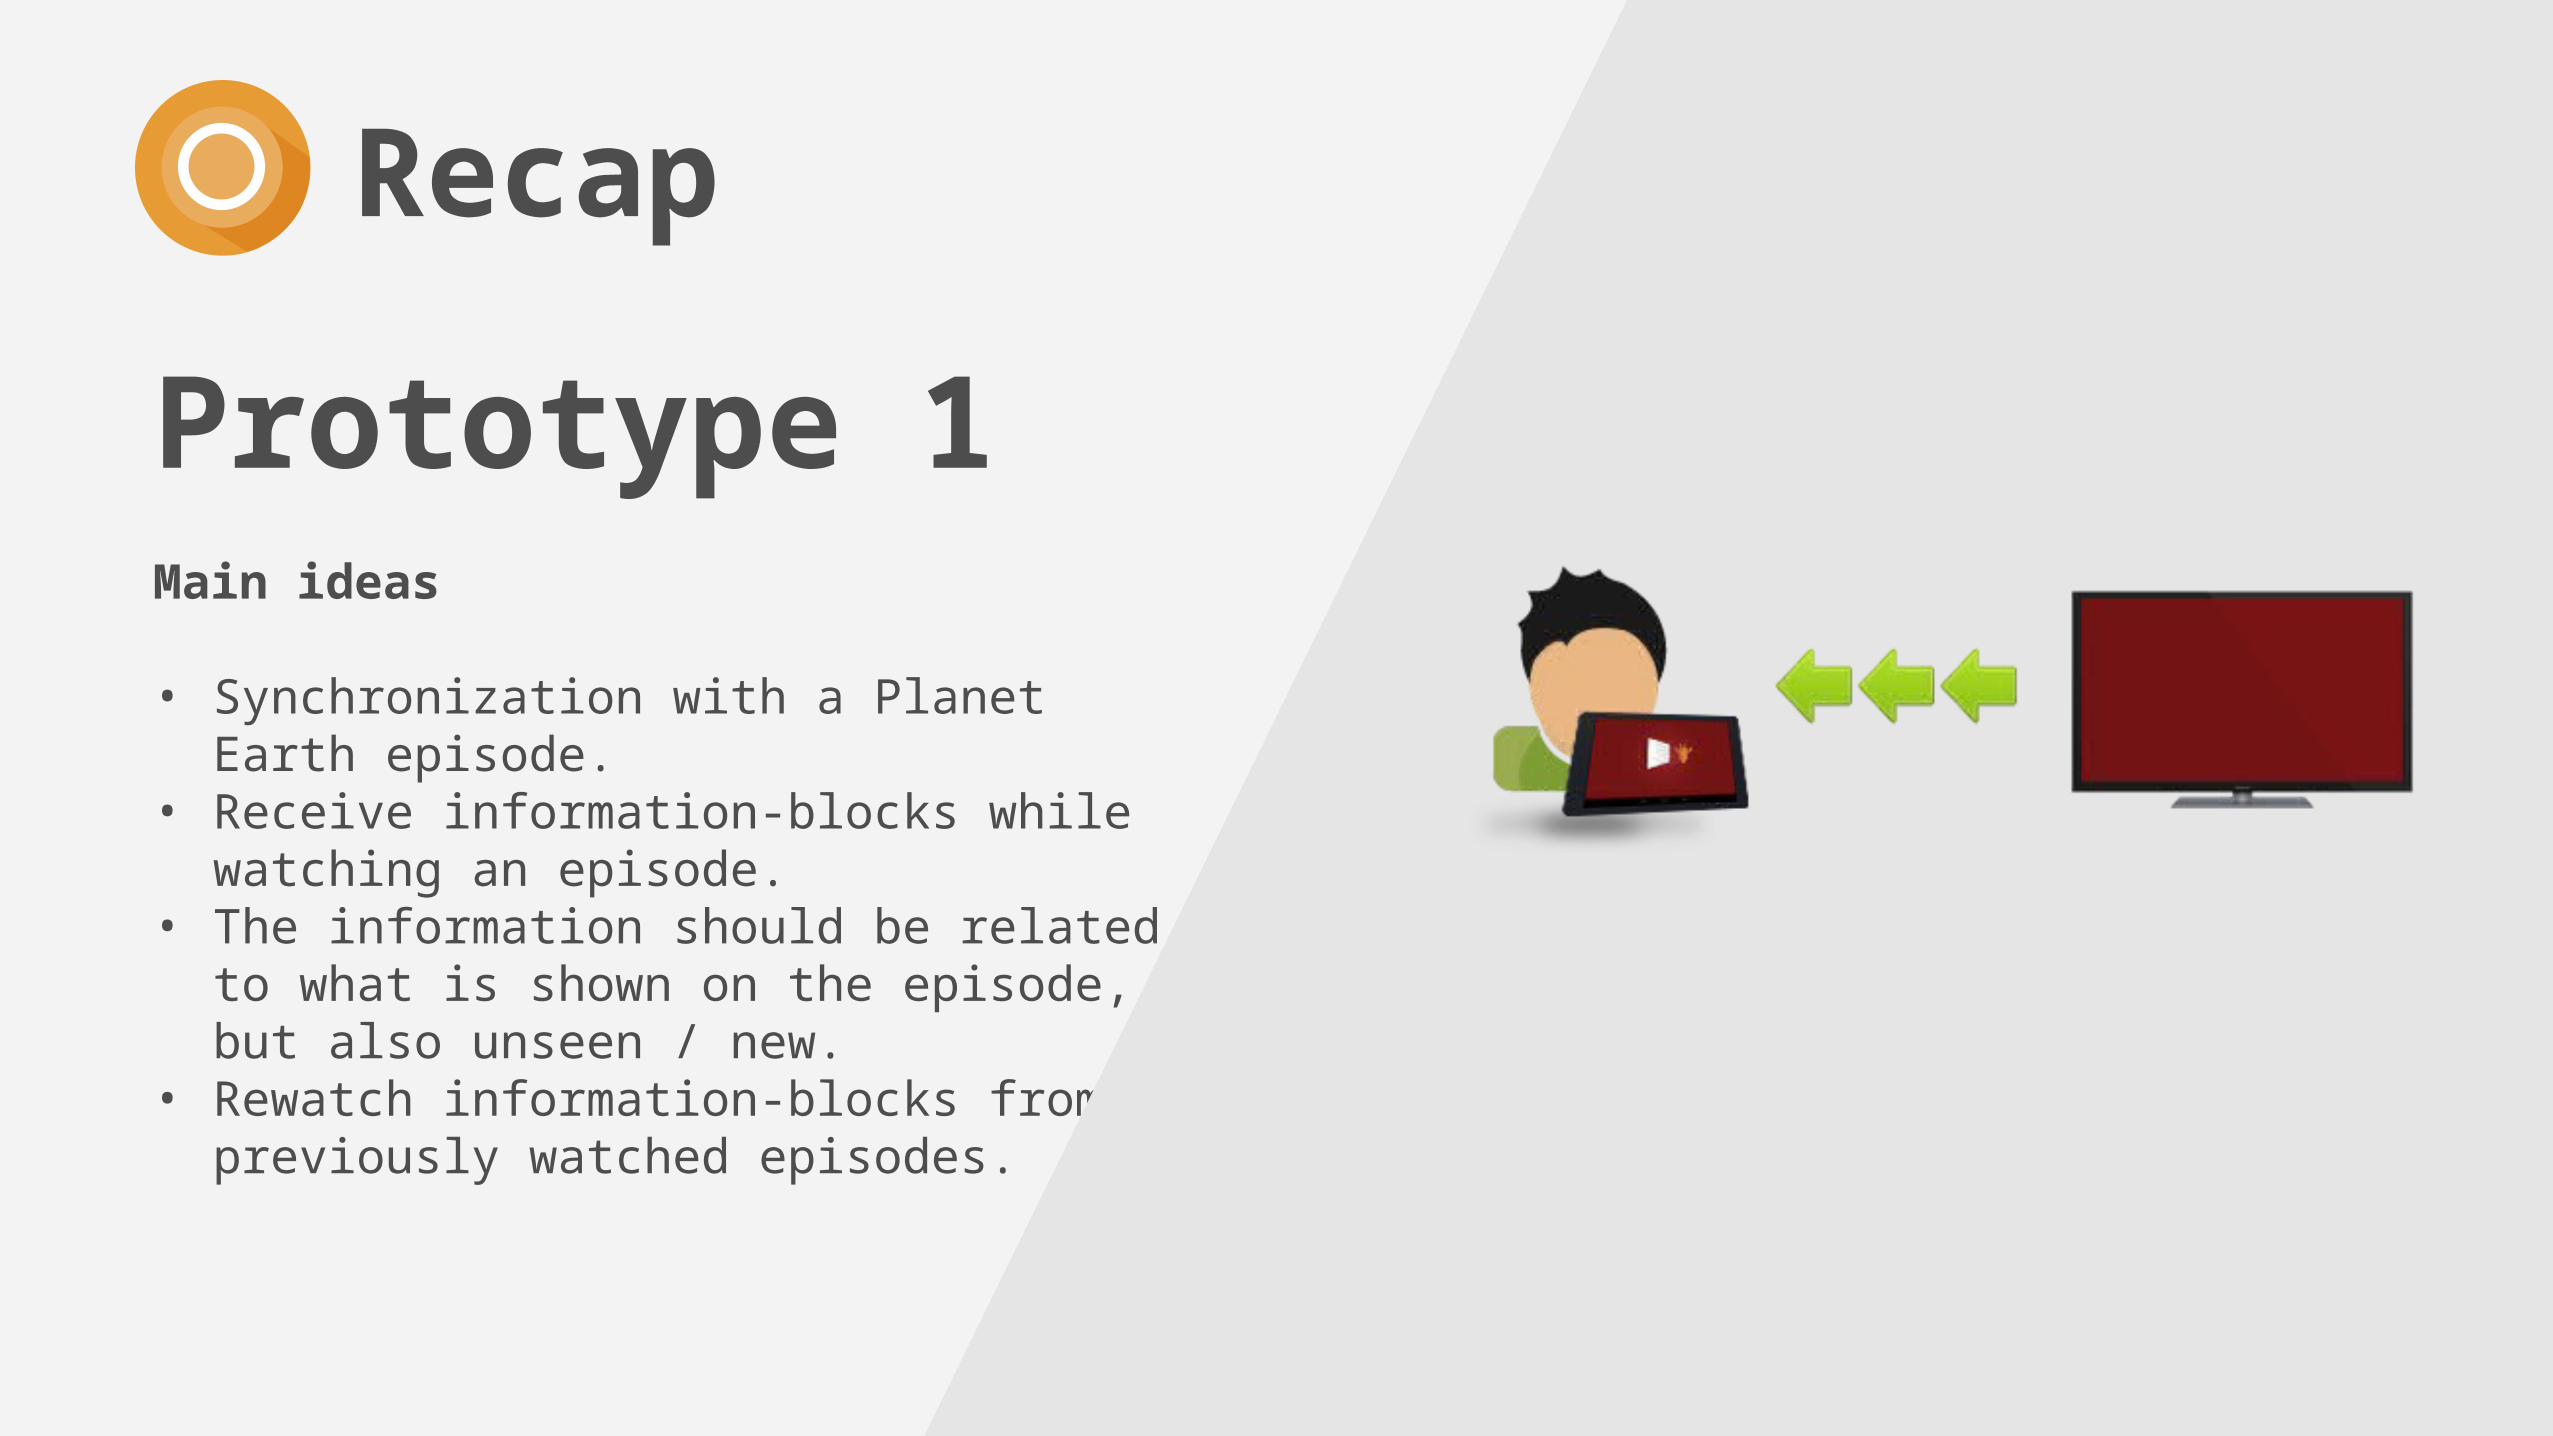
Prototype 1Main ideas
• Synchronization with a Planet Earth episode.
• Receive information-blocks while watching an episode.
• The information should be related to what is shown on the episode, but also unseen / new.
• Rewatch information-blocks from previously watched episodes.
Recap
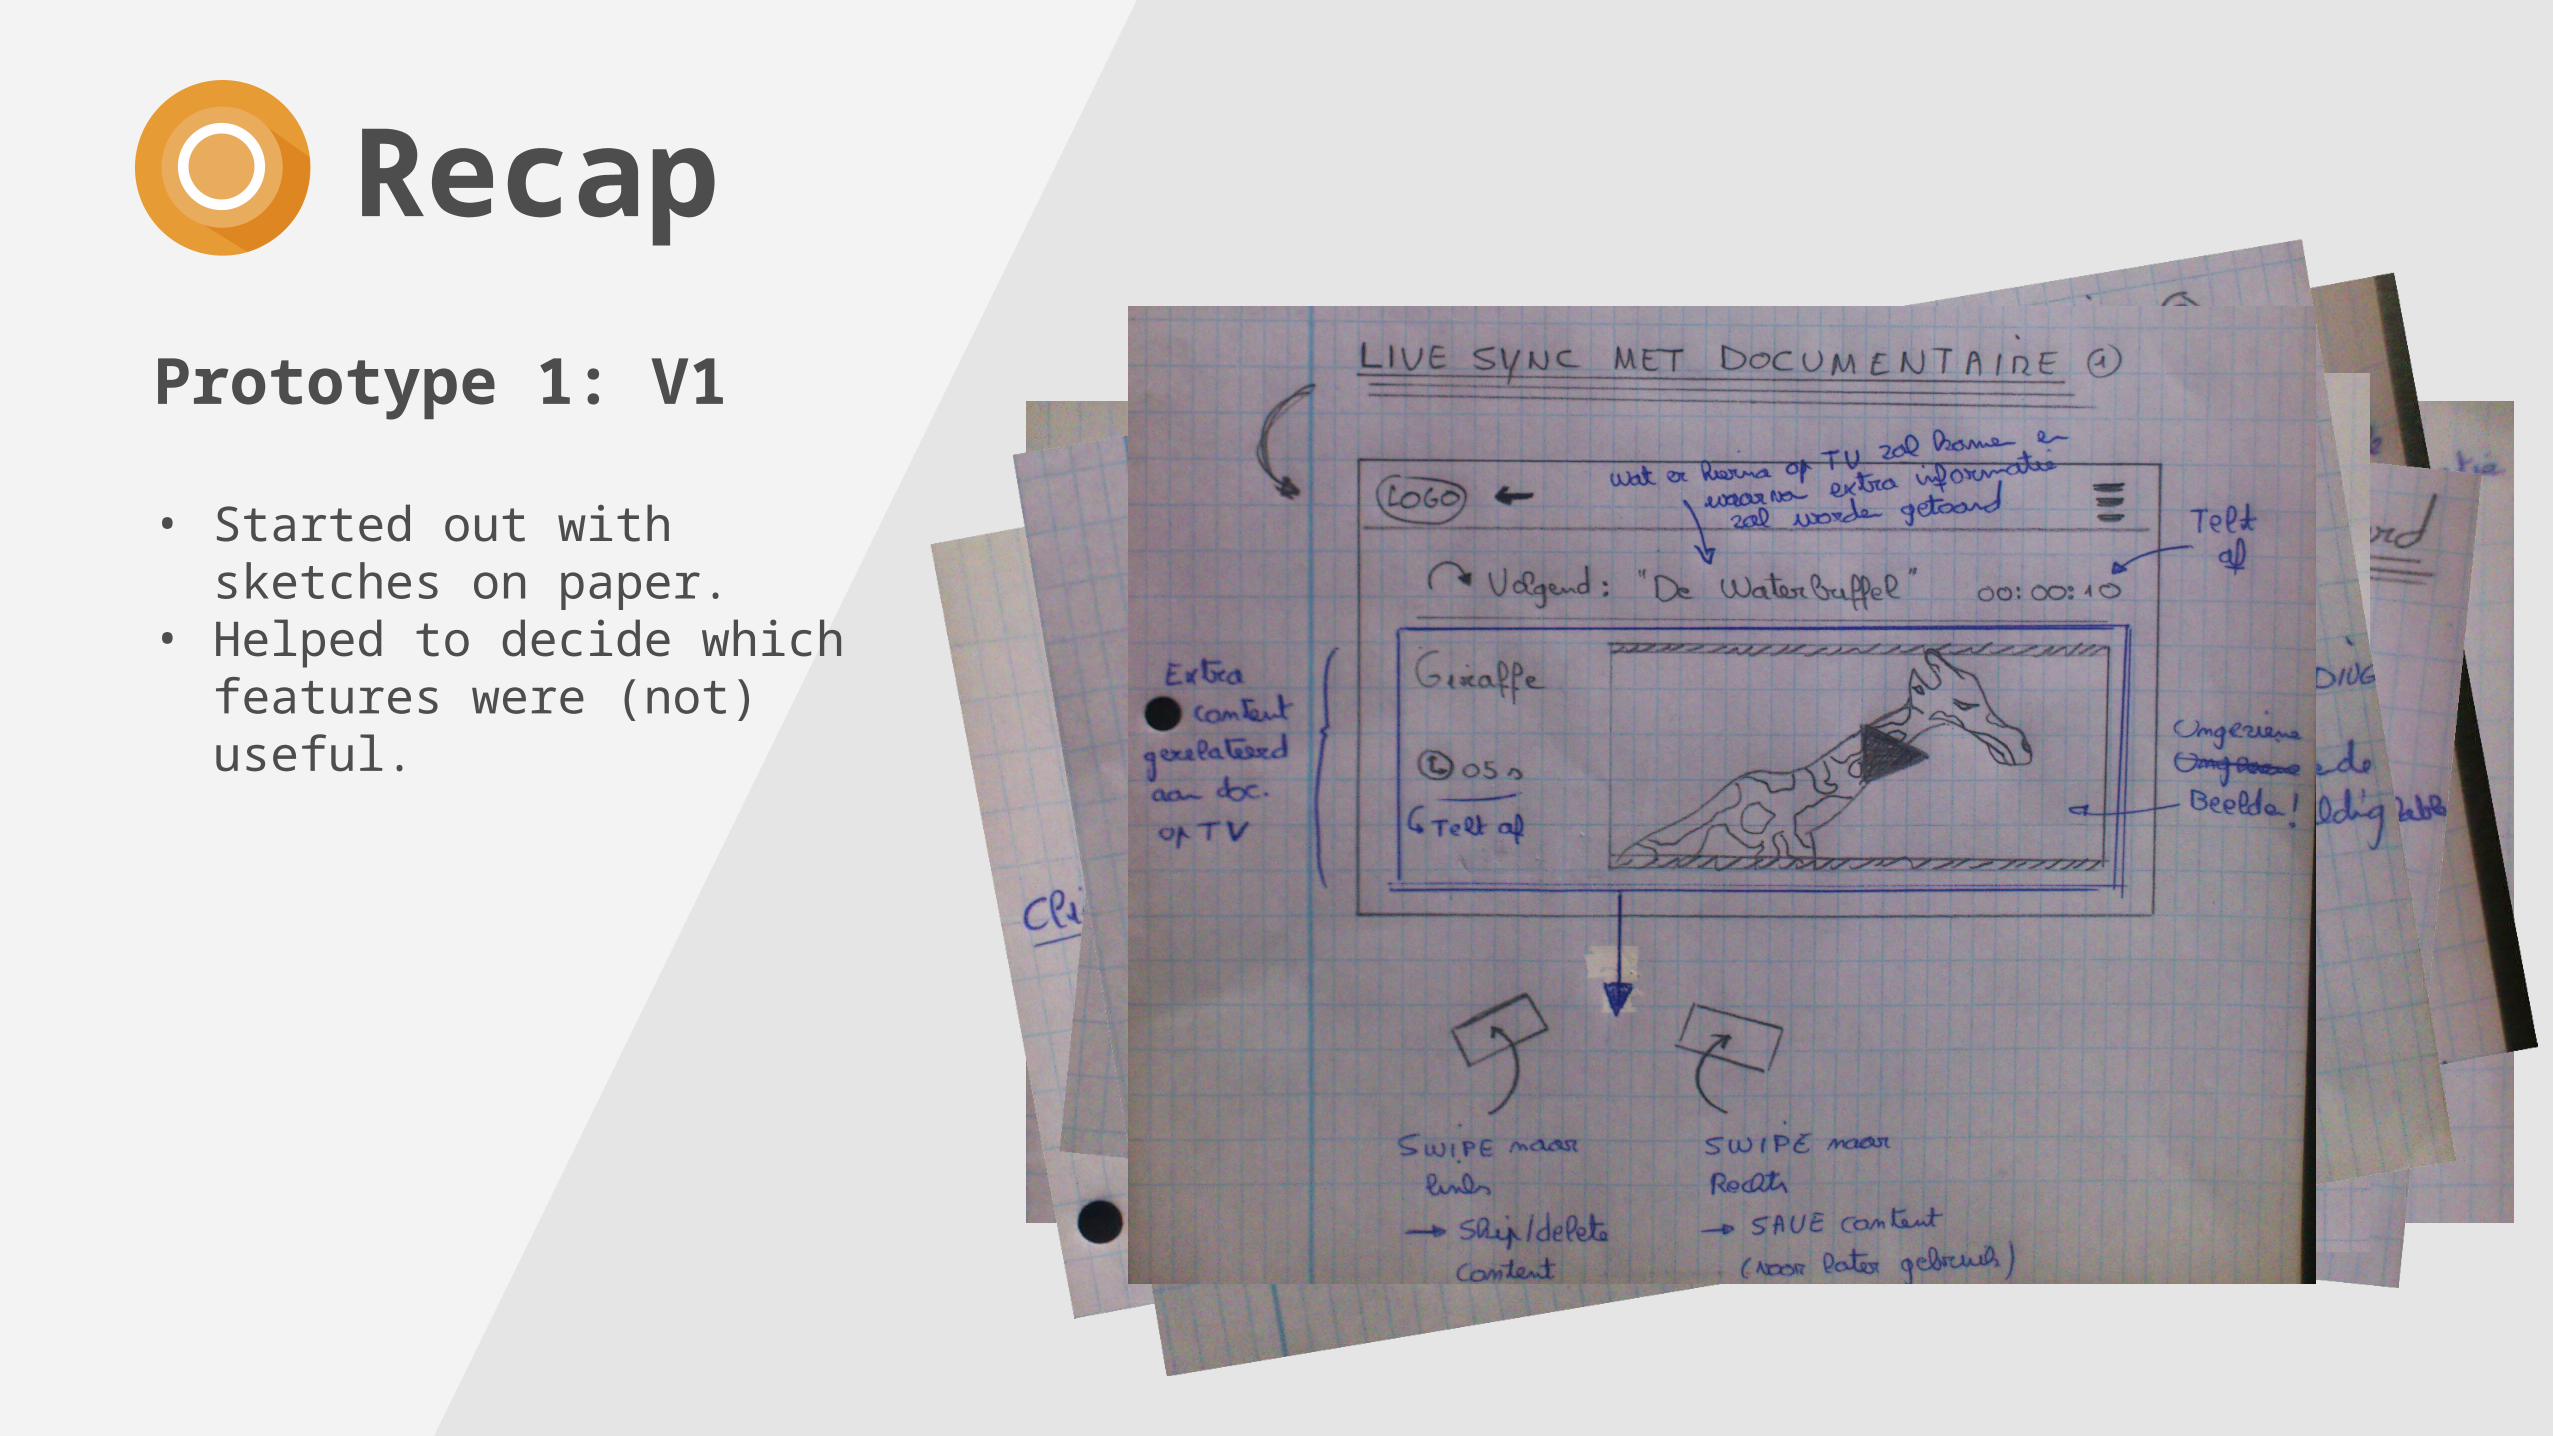
Prototype 1: V1
• Started out with sketches on paper.
• Helped to decide whichfeatures were (not)useful.
Recap
Recap
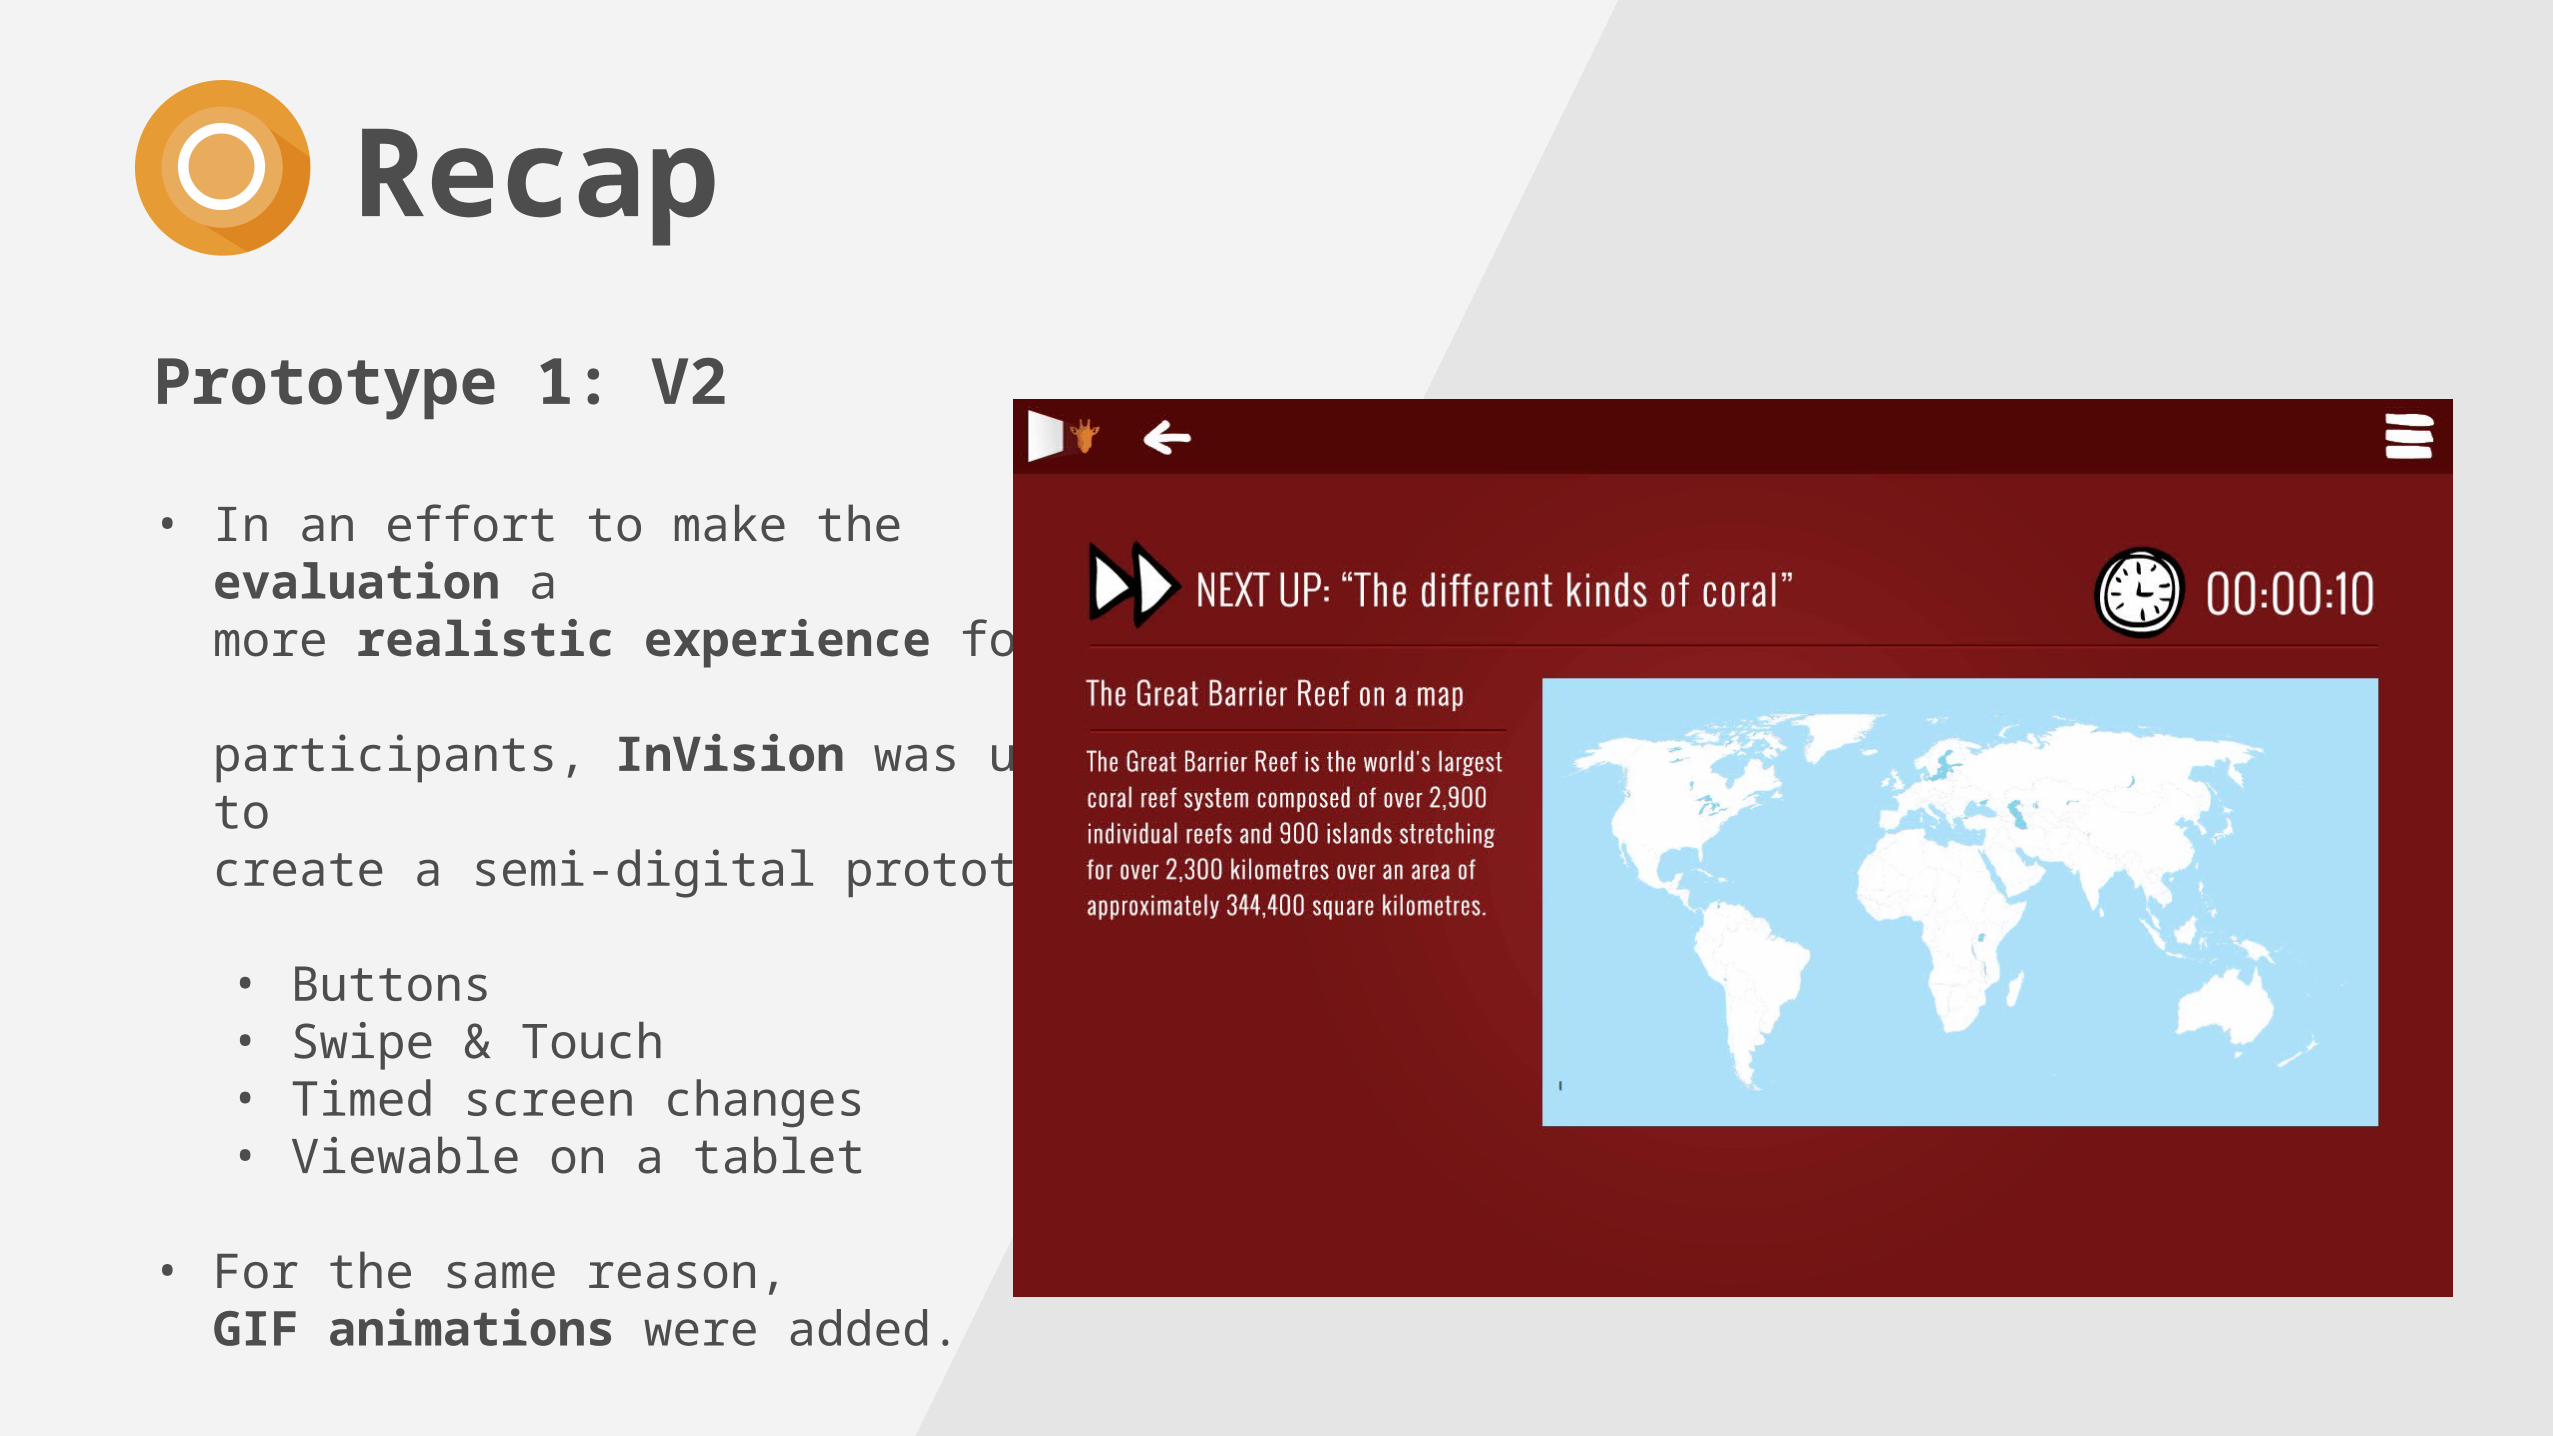
Prototype 1: V2
• In an effort to make the evaluation a more realistic experience for the participants, InVision was used tocreate a semi-digital prototype.
• Buttons• Swipe & Touch• Timed screen changes• Viewable on a tablet
• For the same reason, GIF animations were added.
Recap
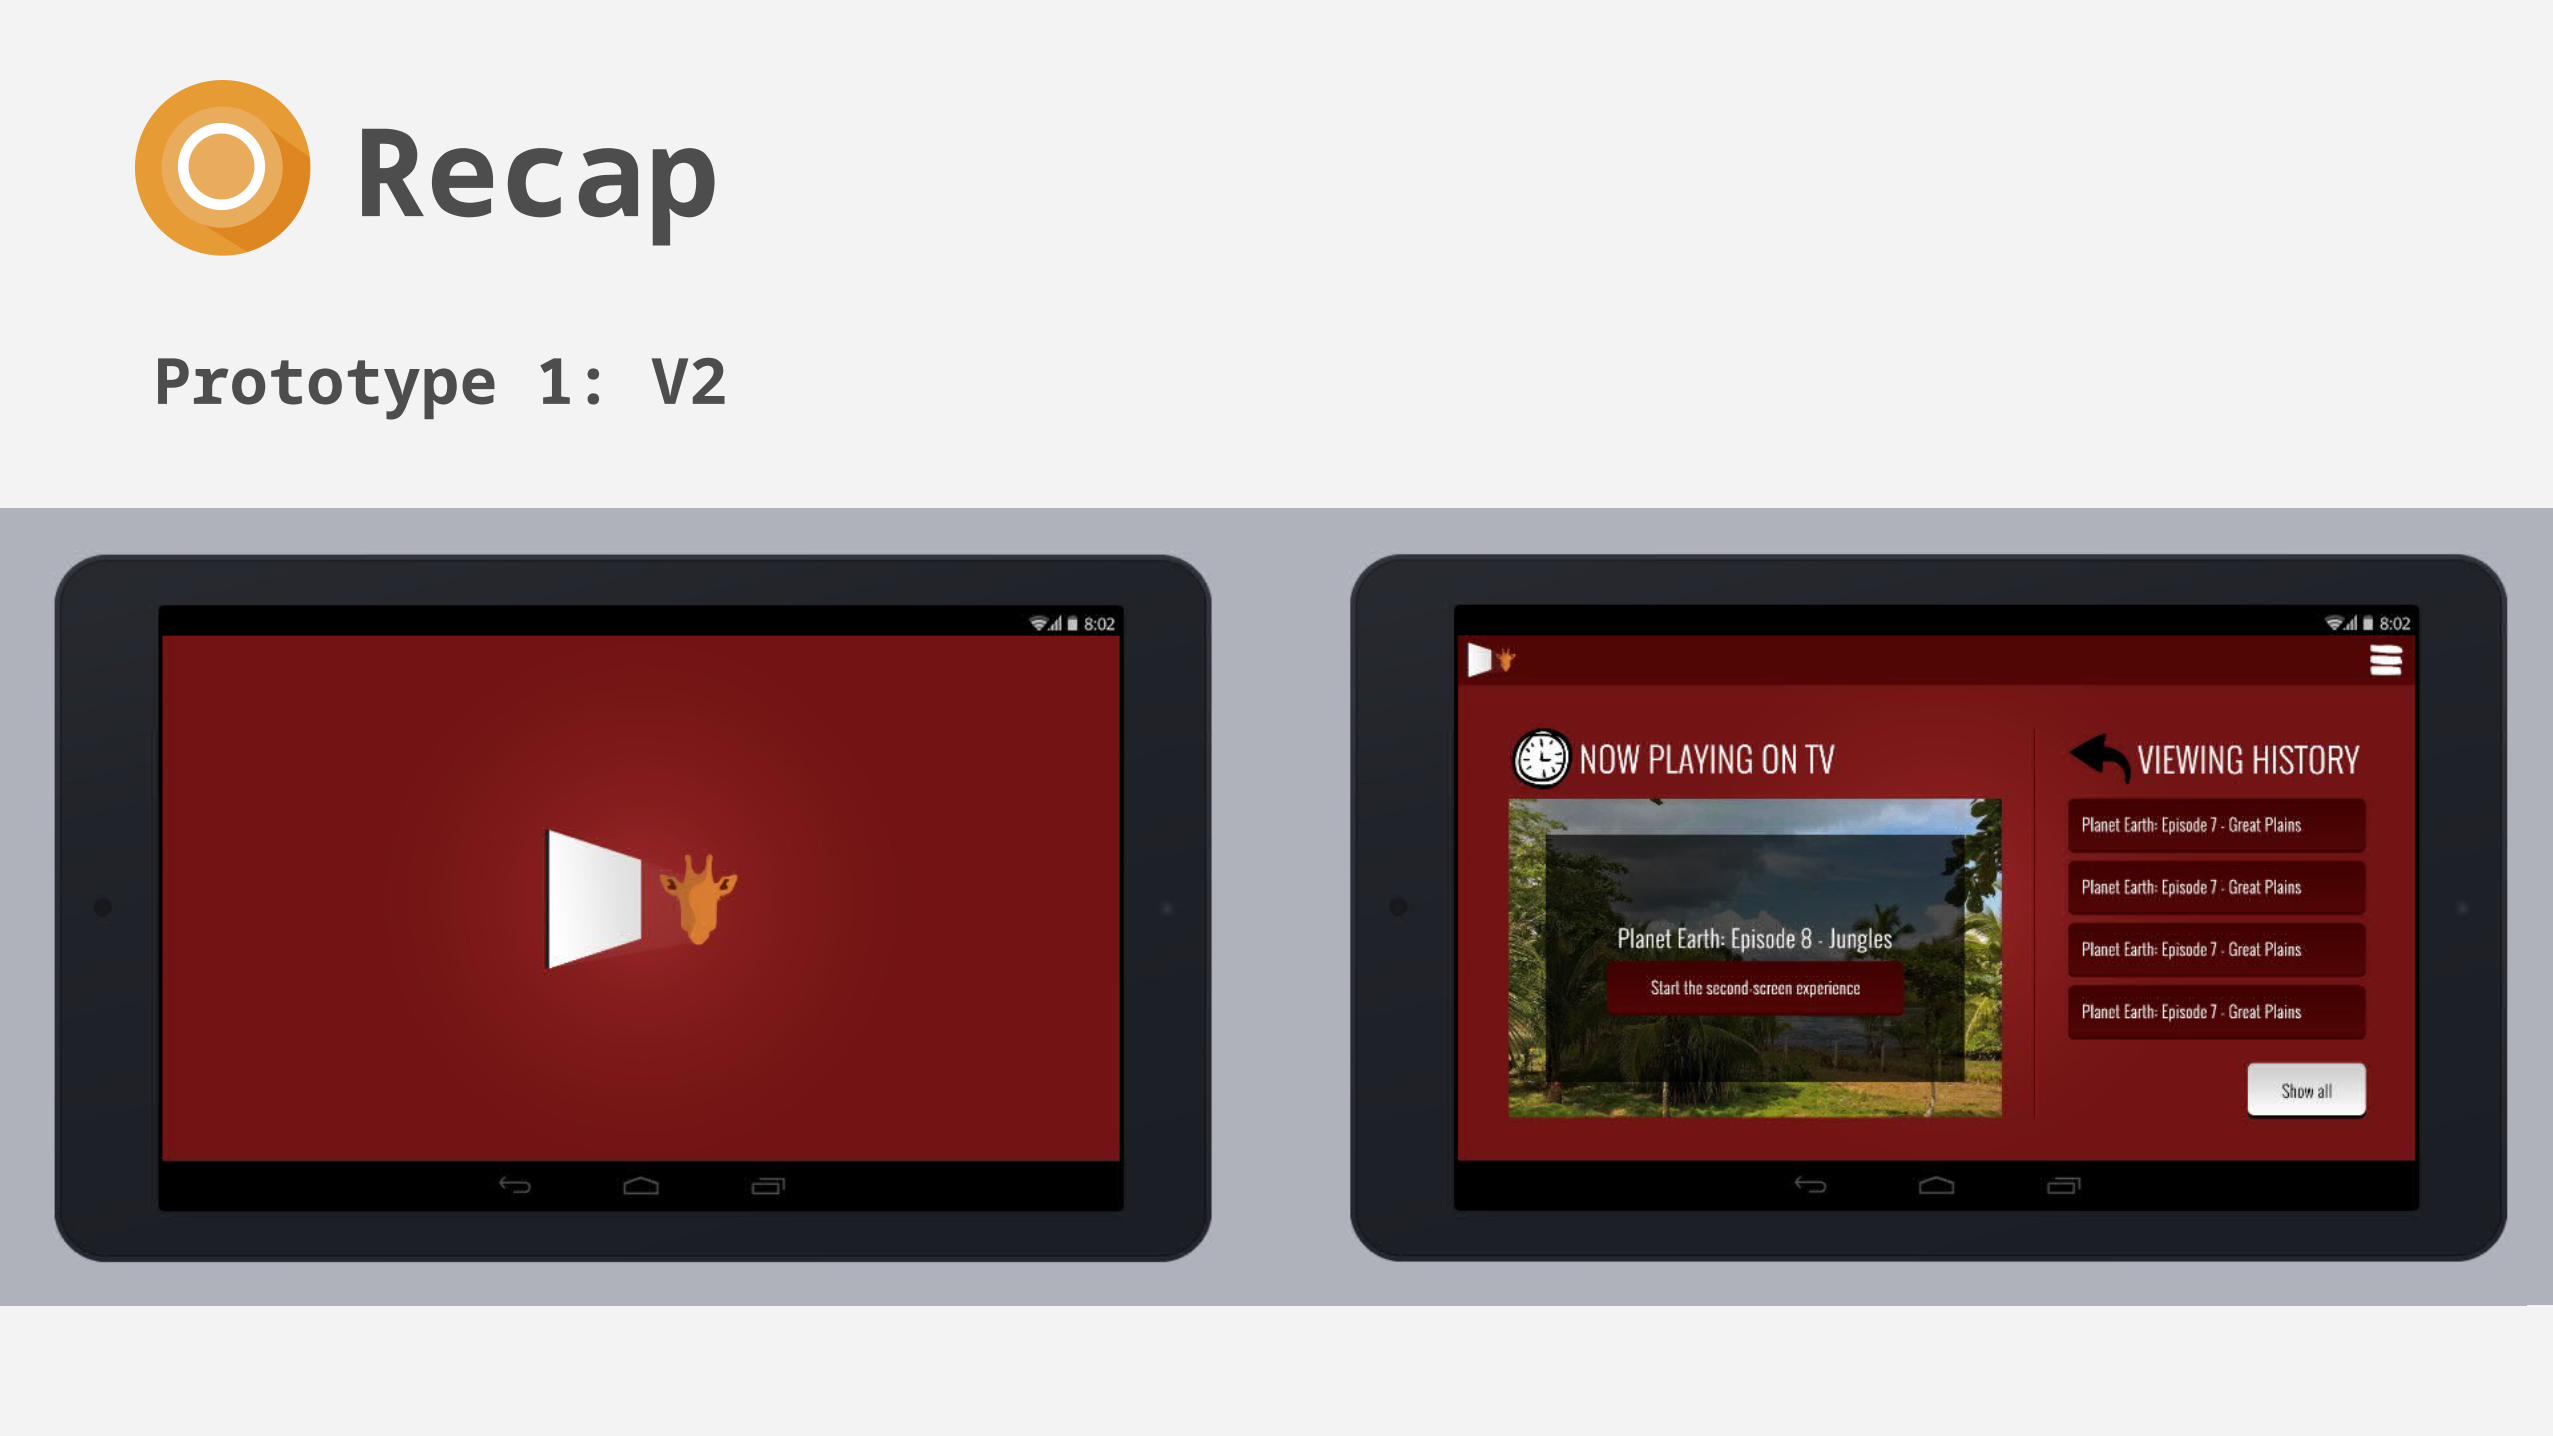
Prototype 1: V2
Recap
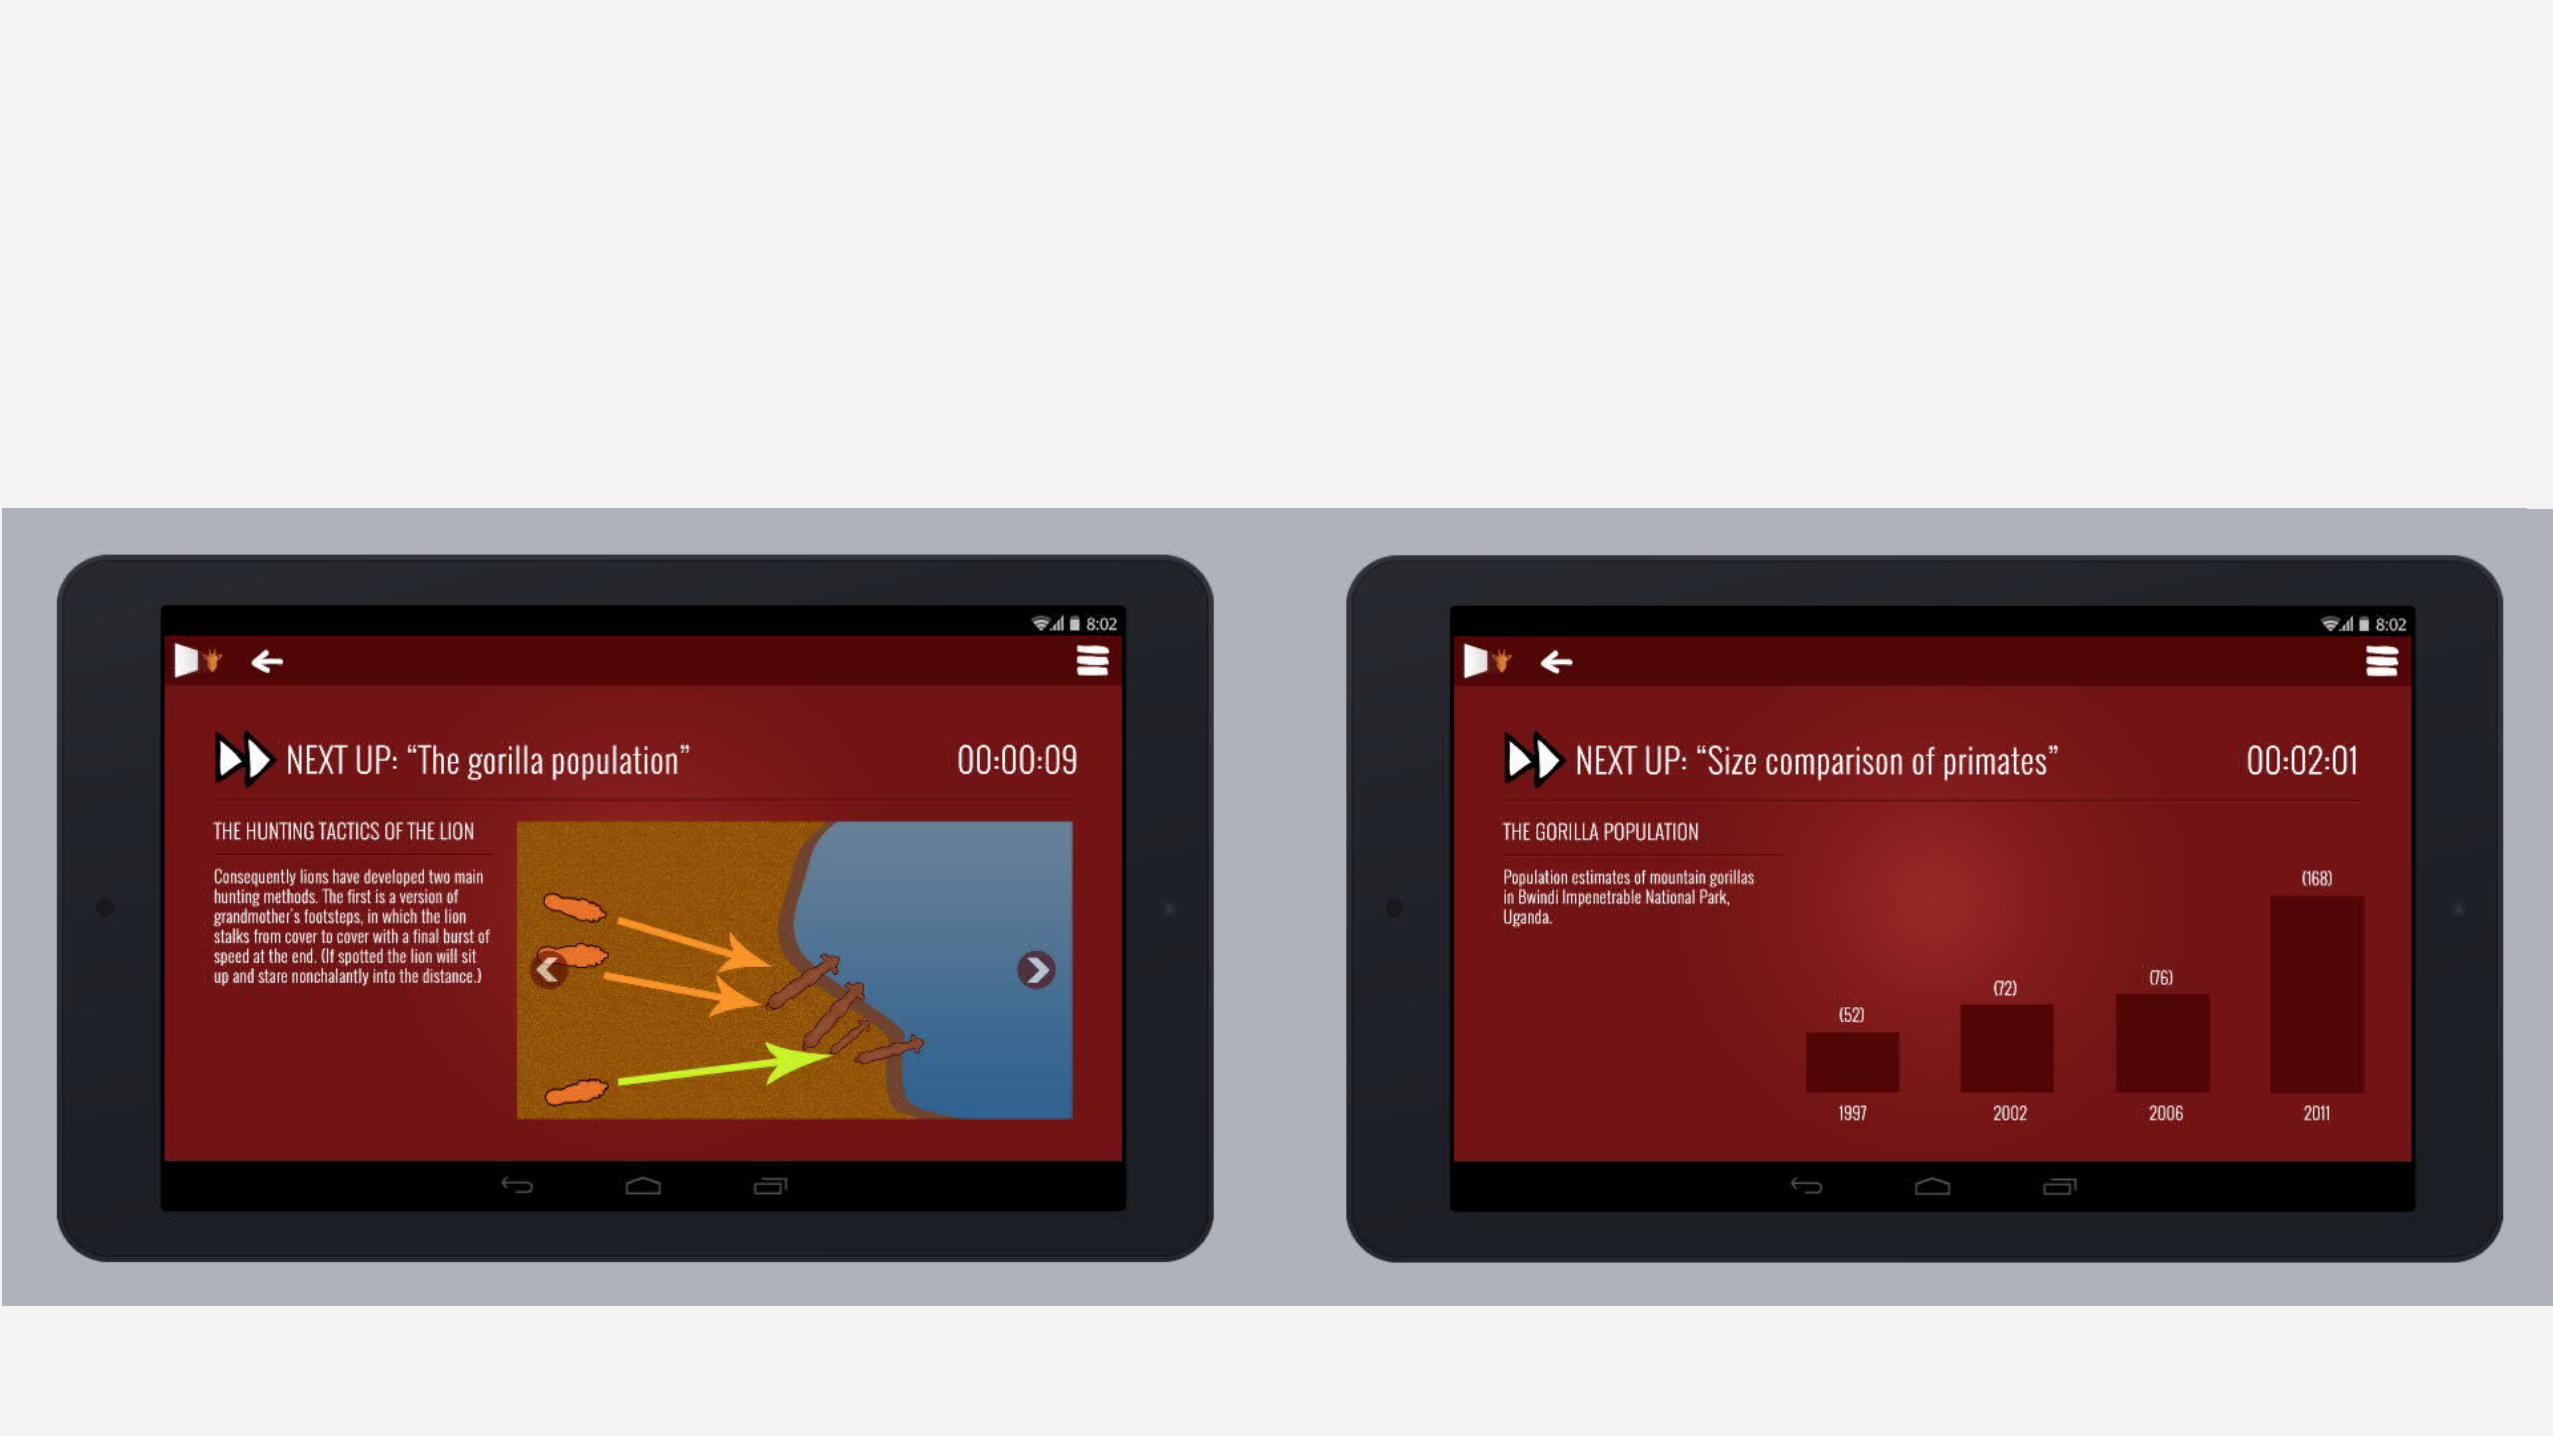
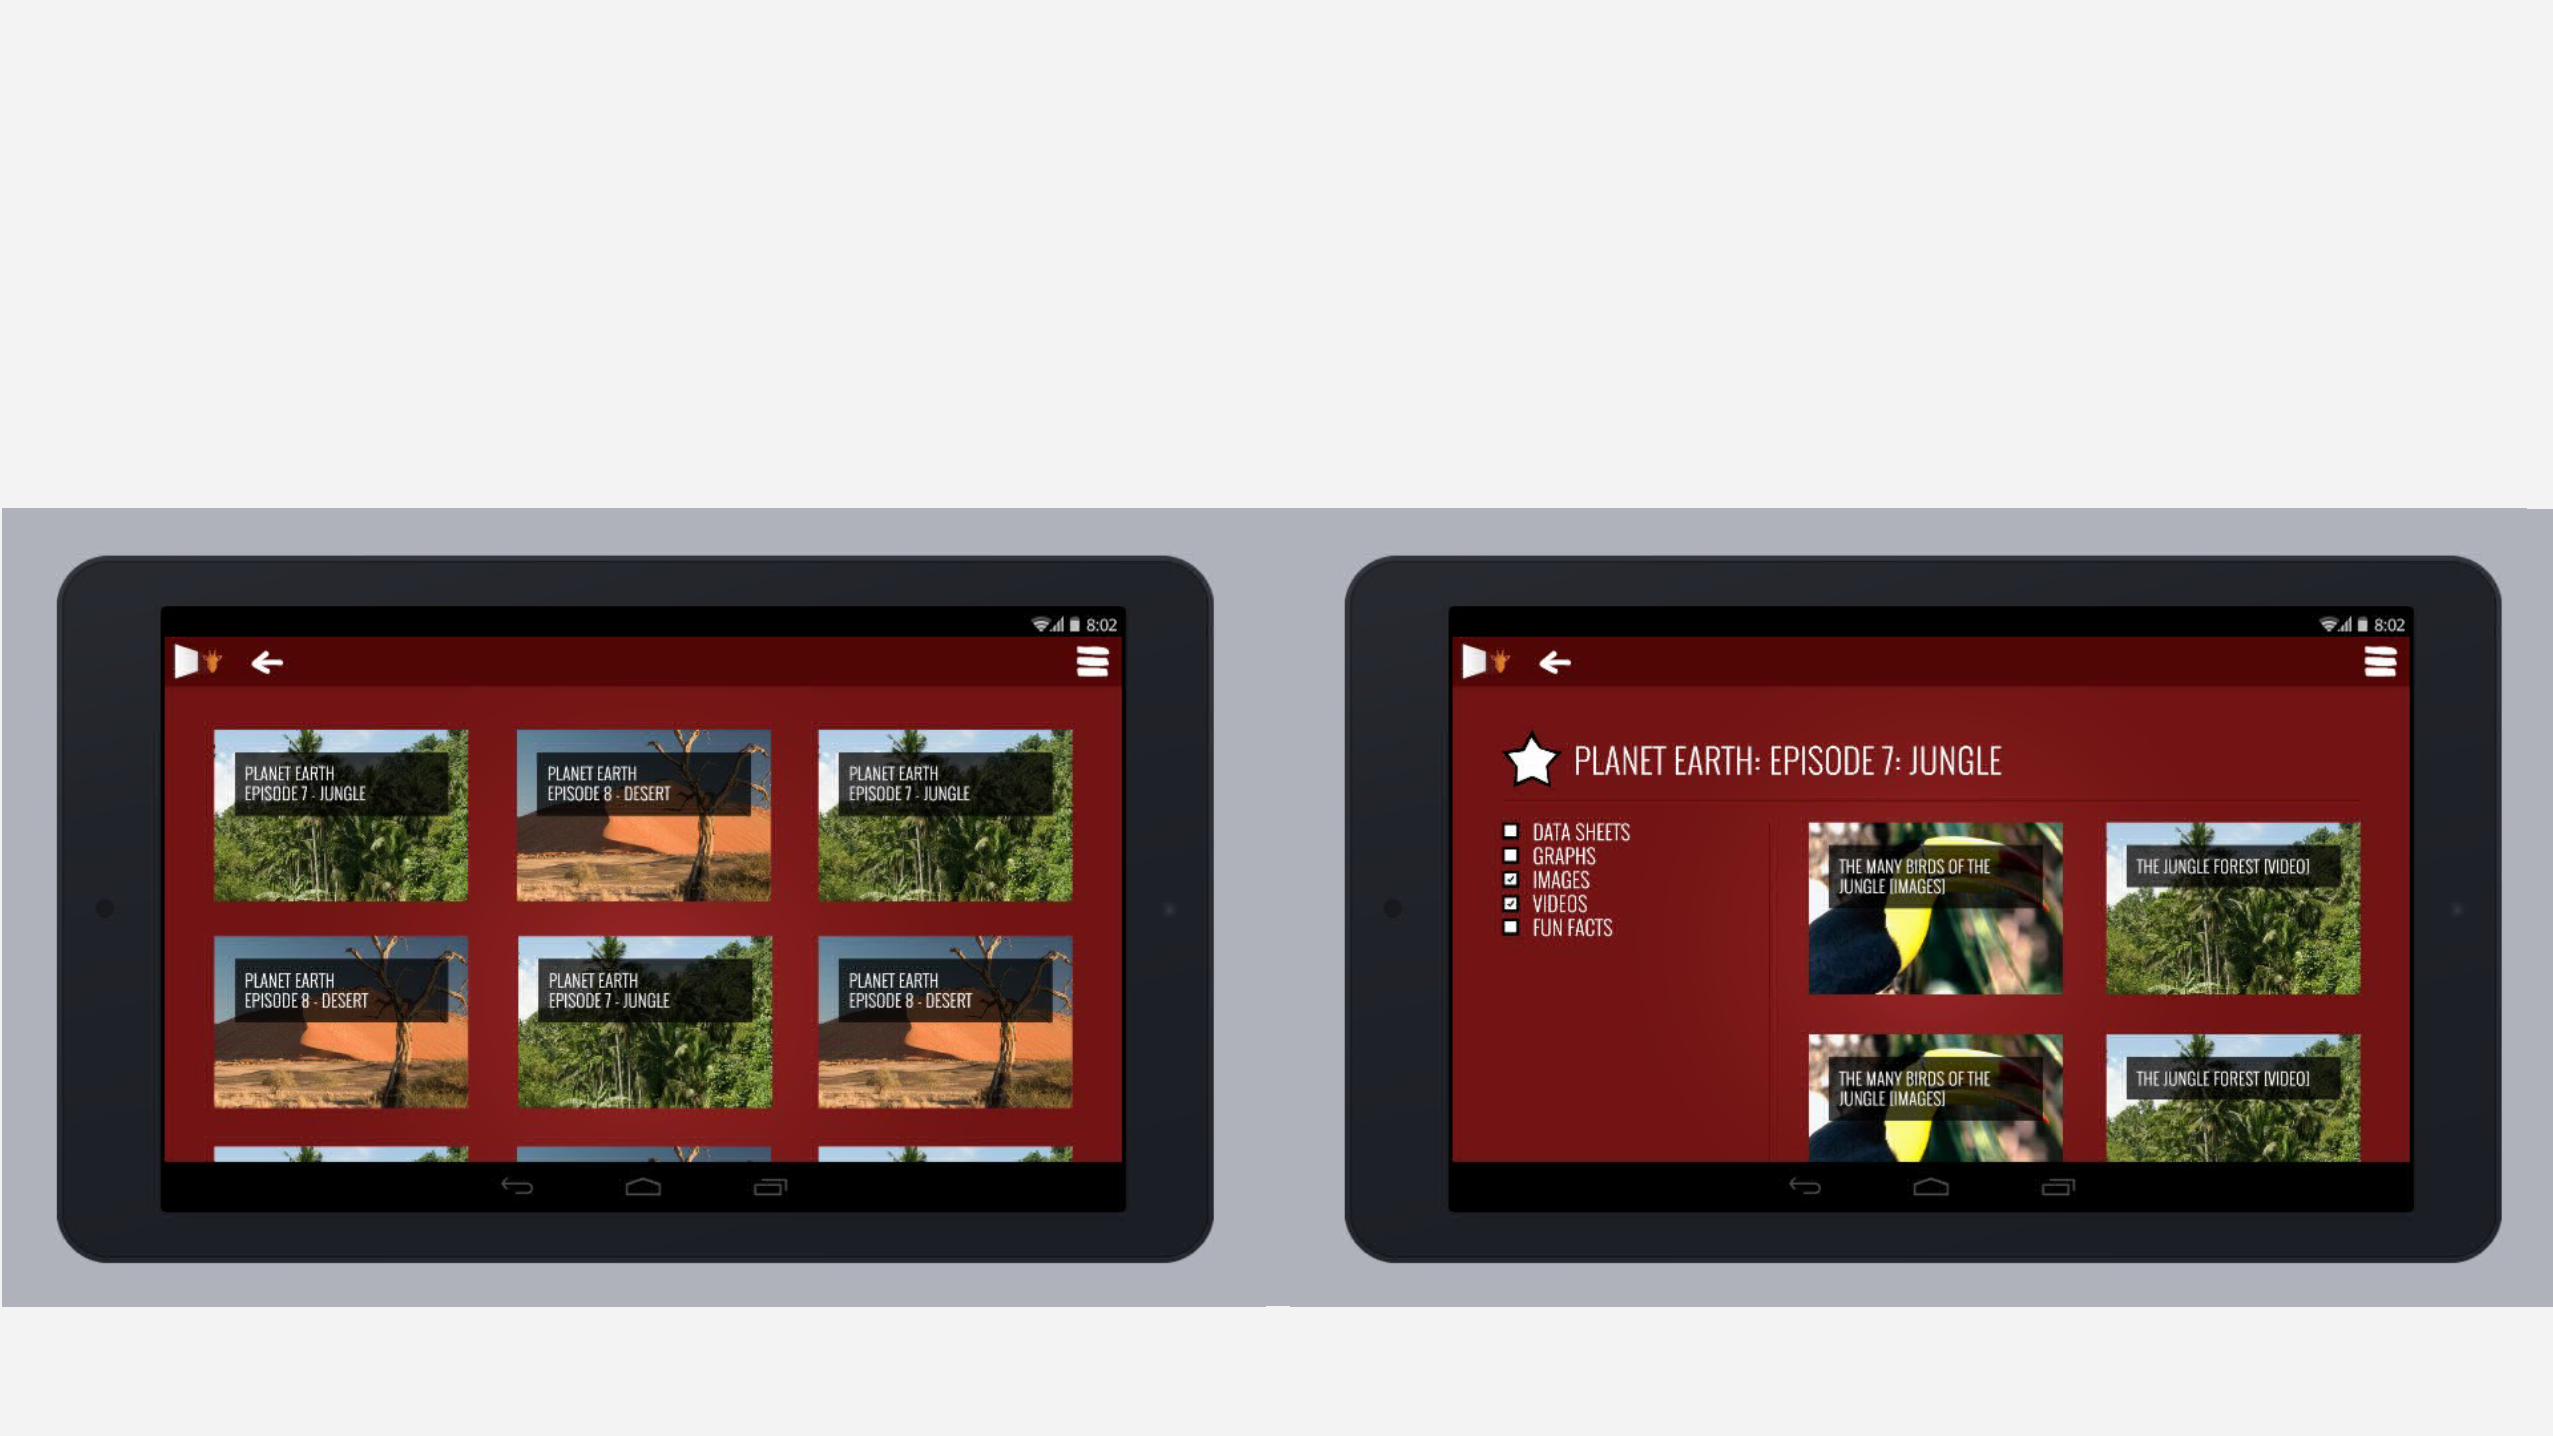
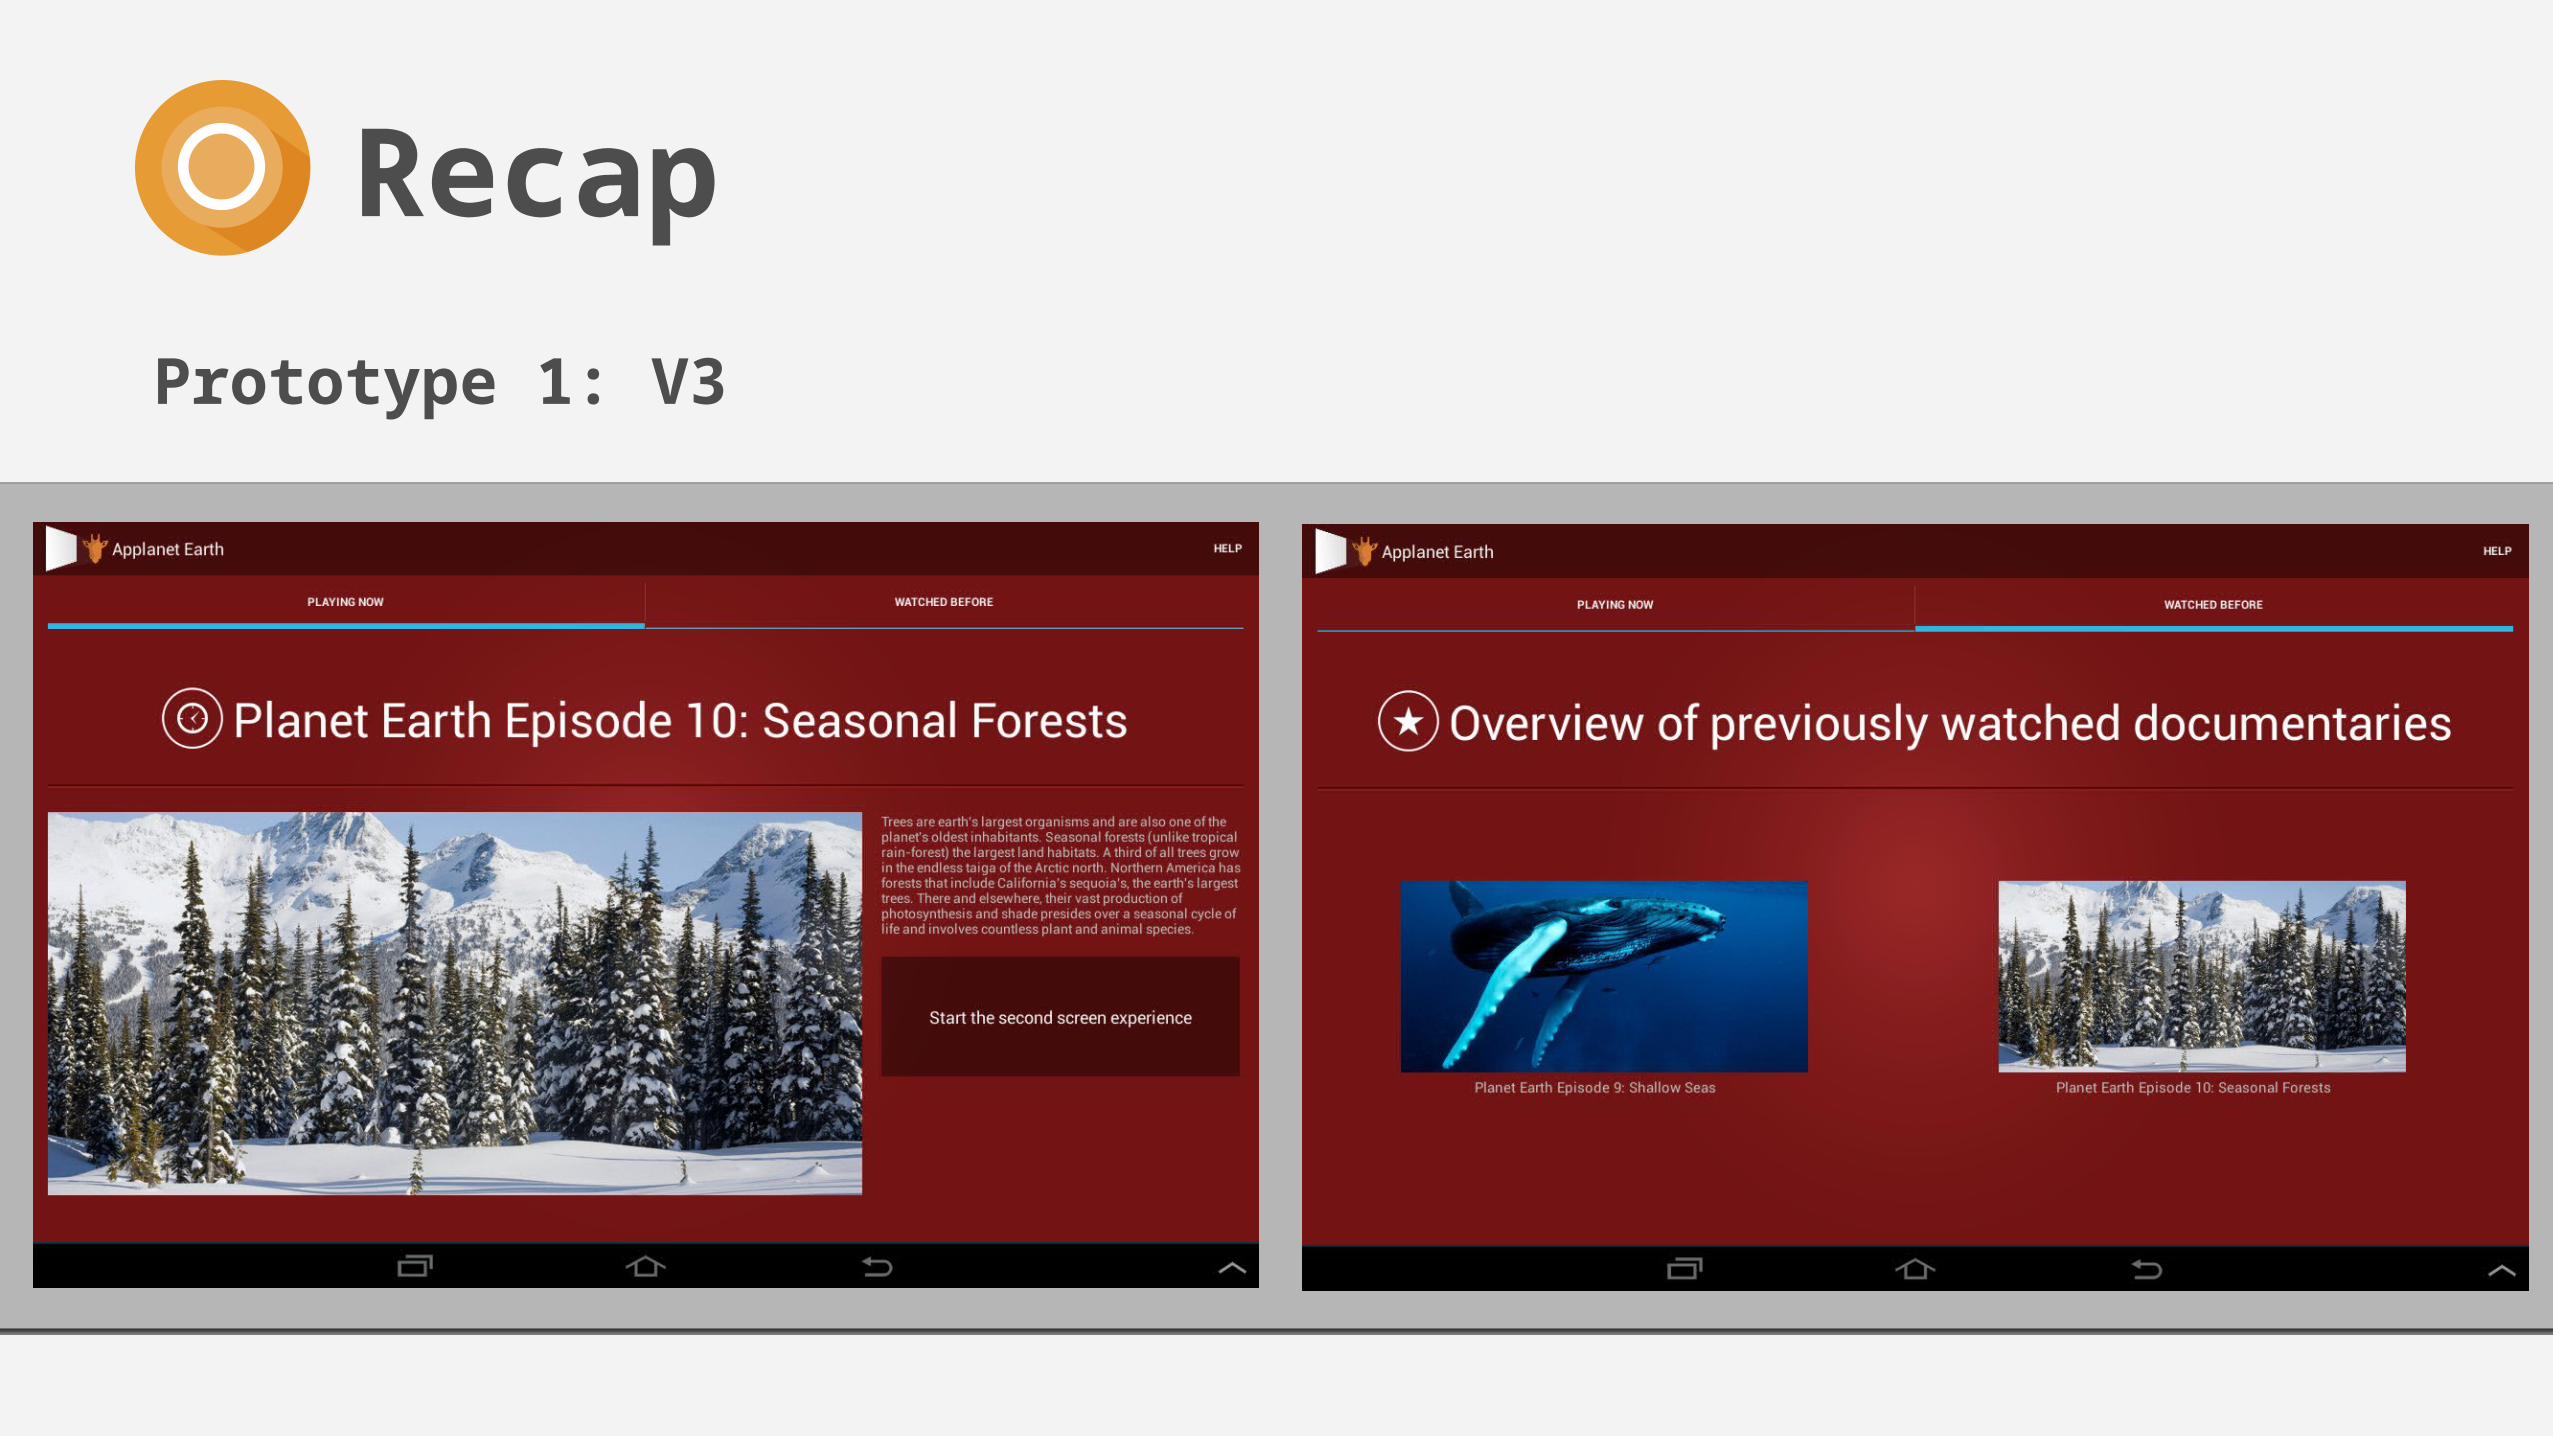
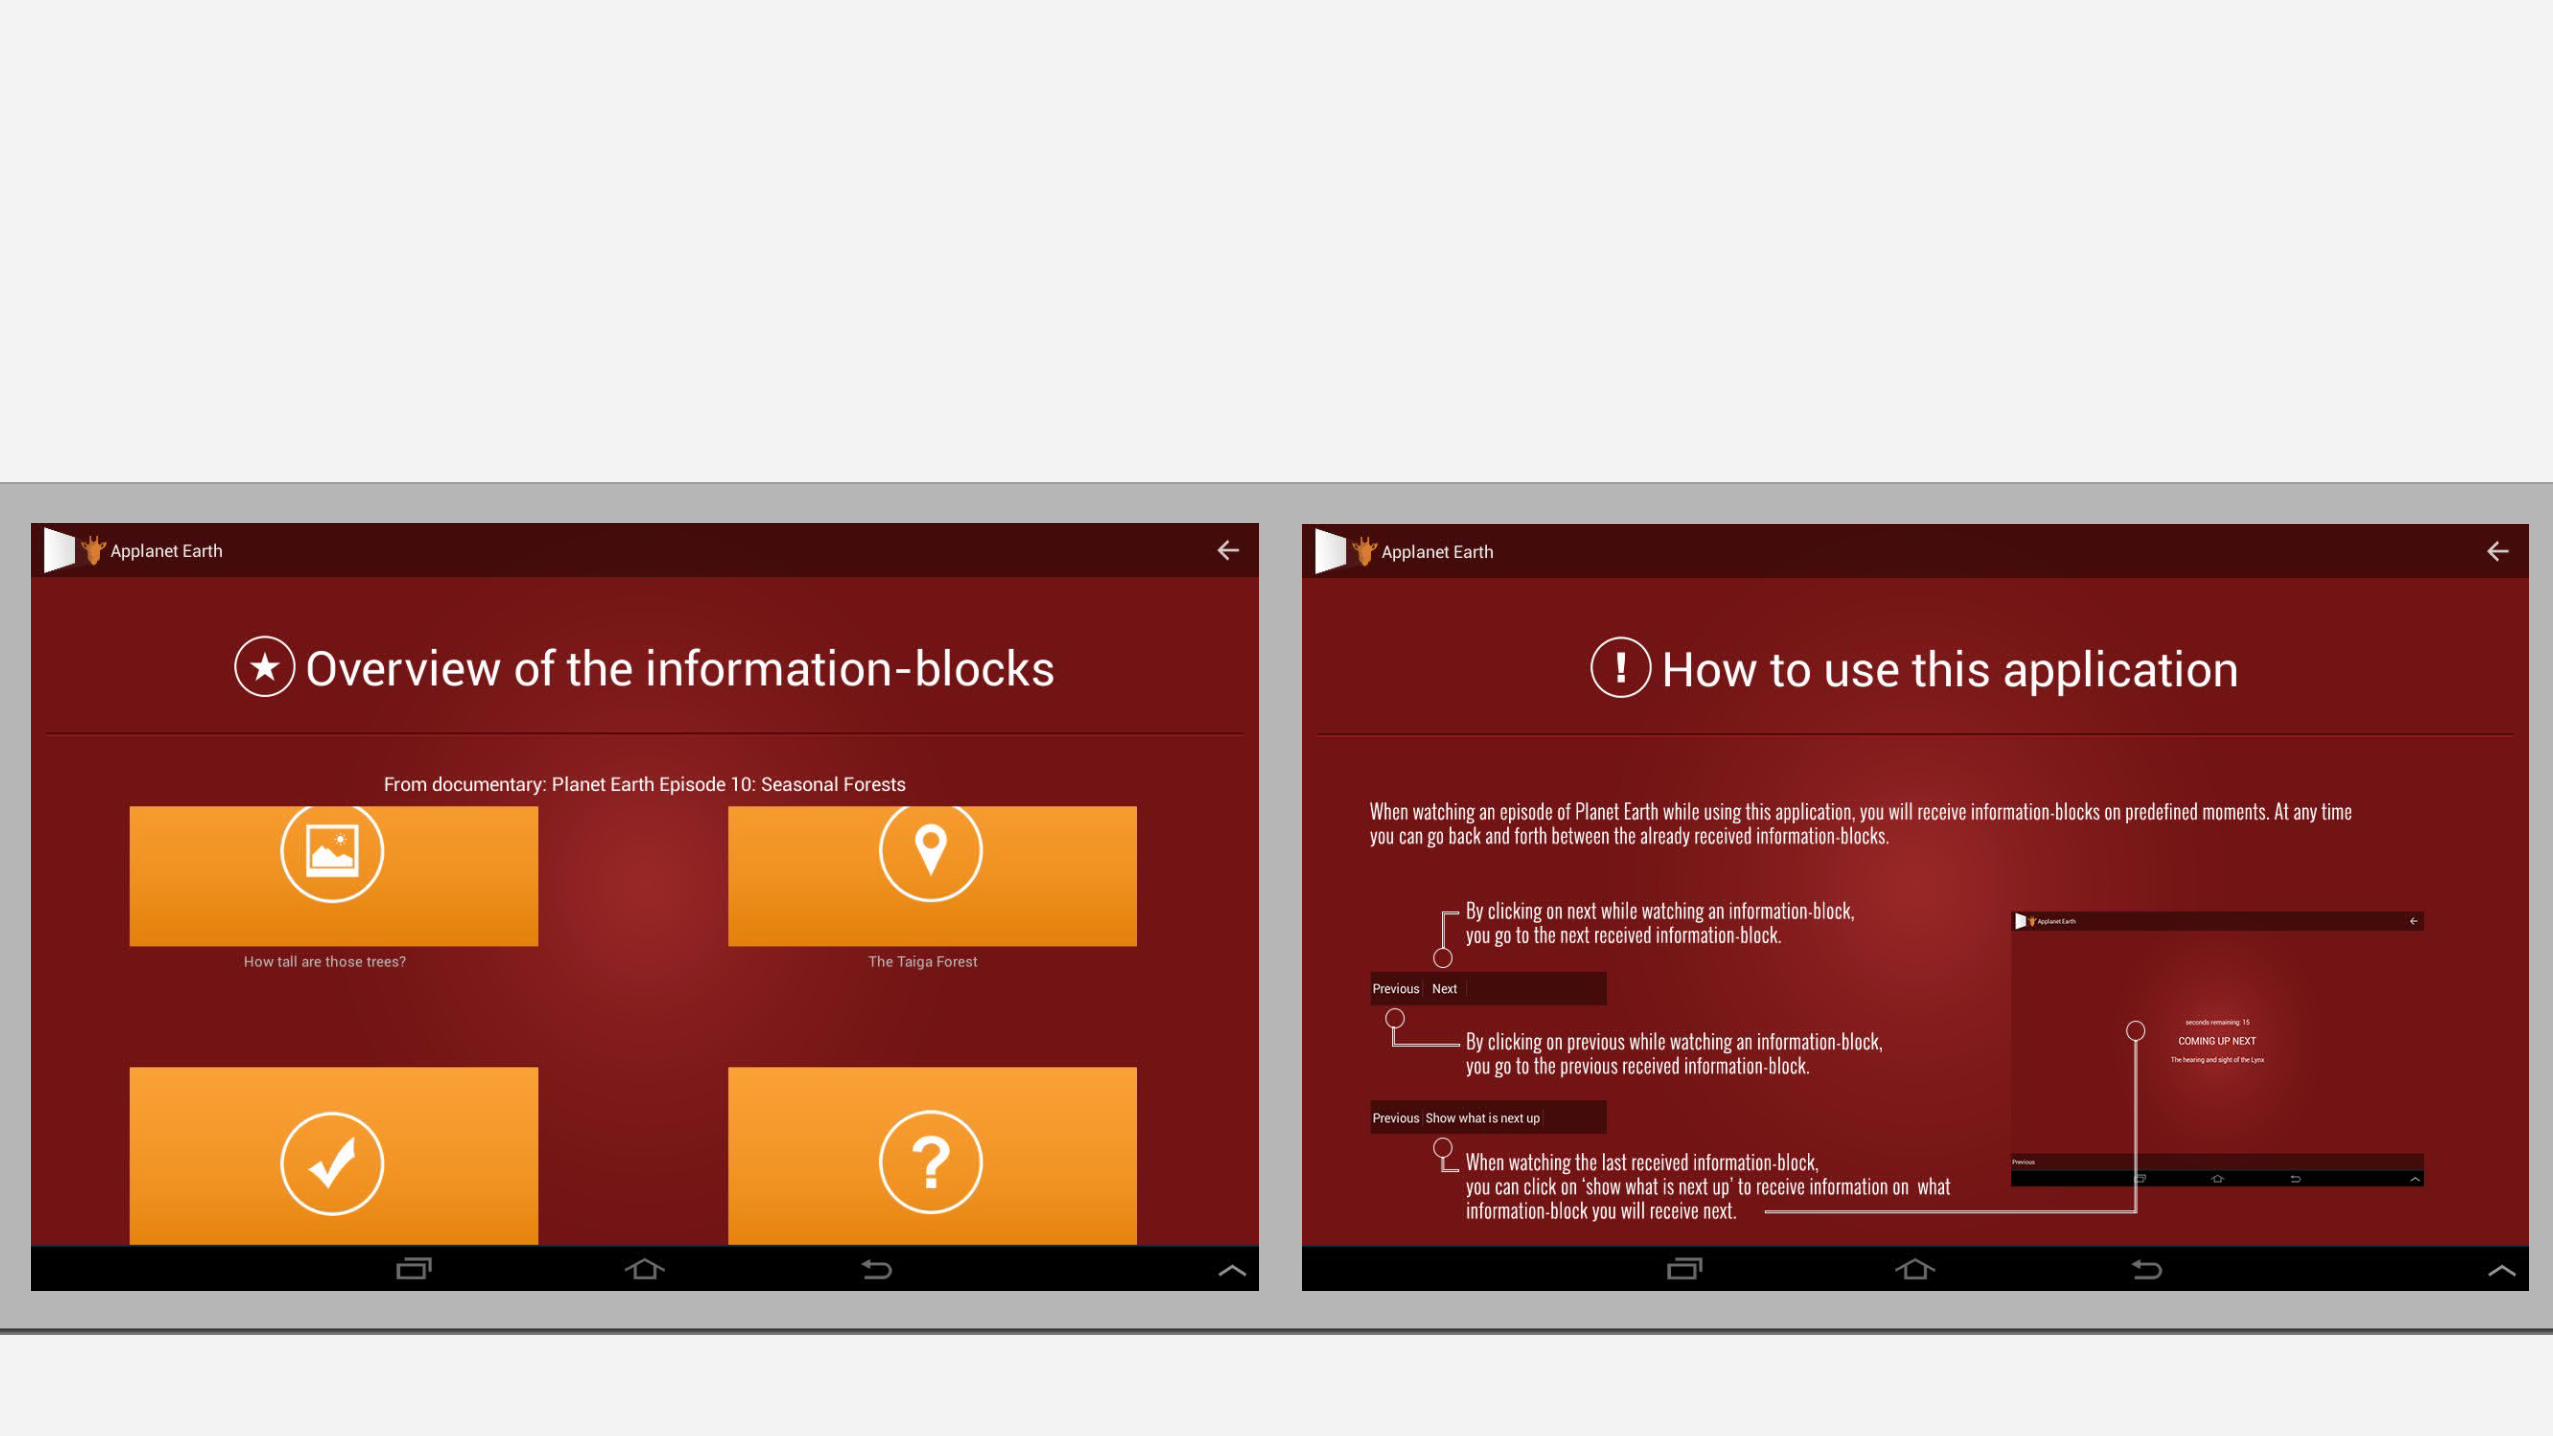
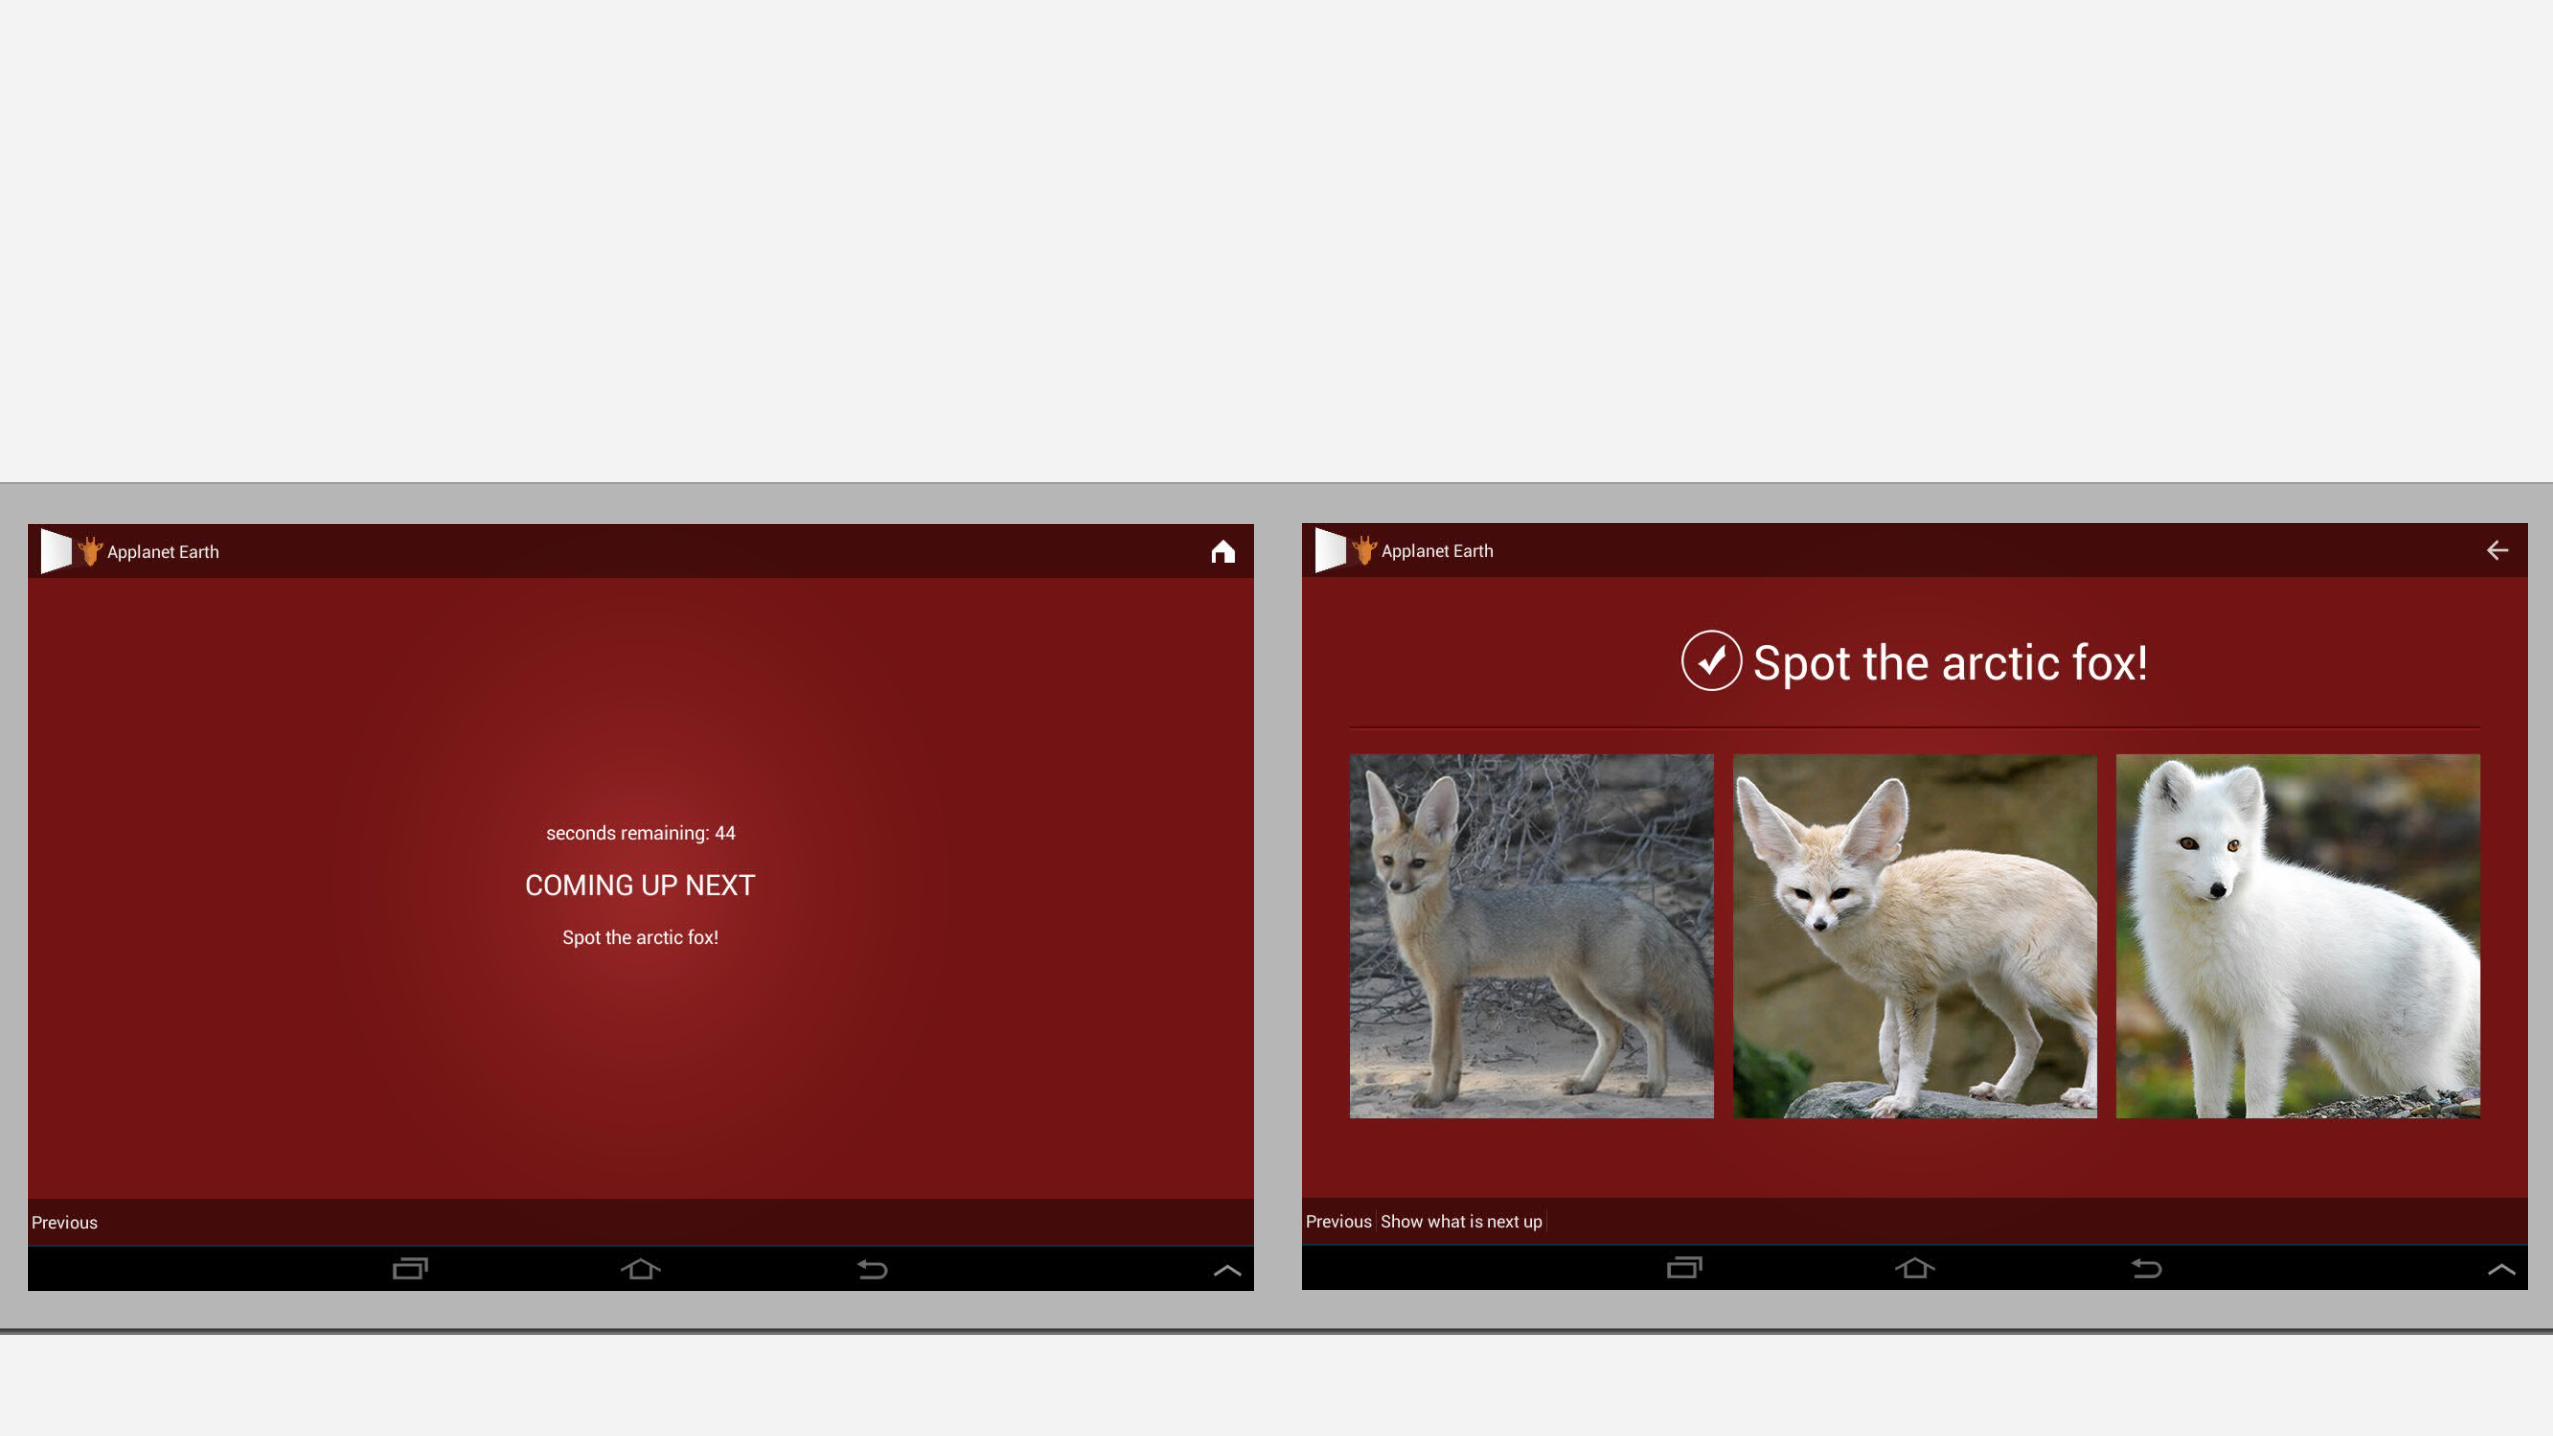
Prototype 1: V3
• 100% digital prototype• Native Android application• Fully synchronized• Few elements hard coded• Data dynamically loaded and
displayed from database
Recap
Prototype 1: V3
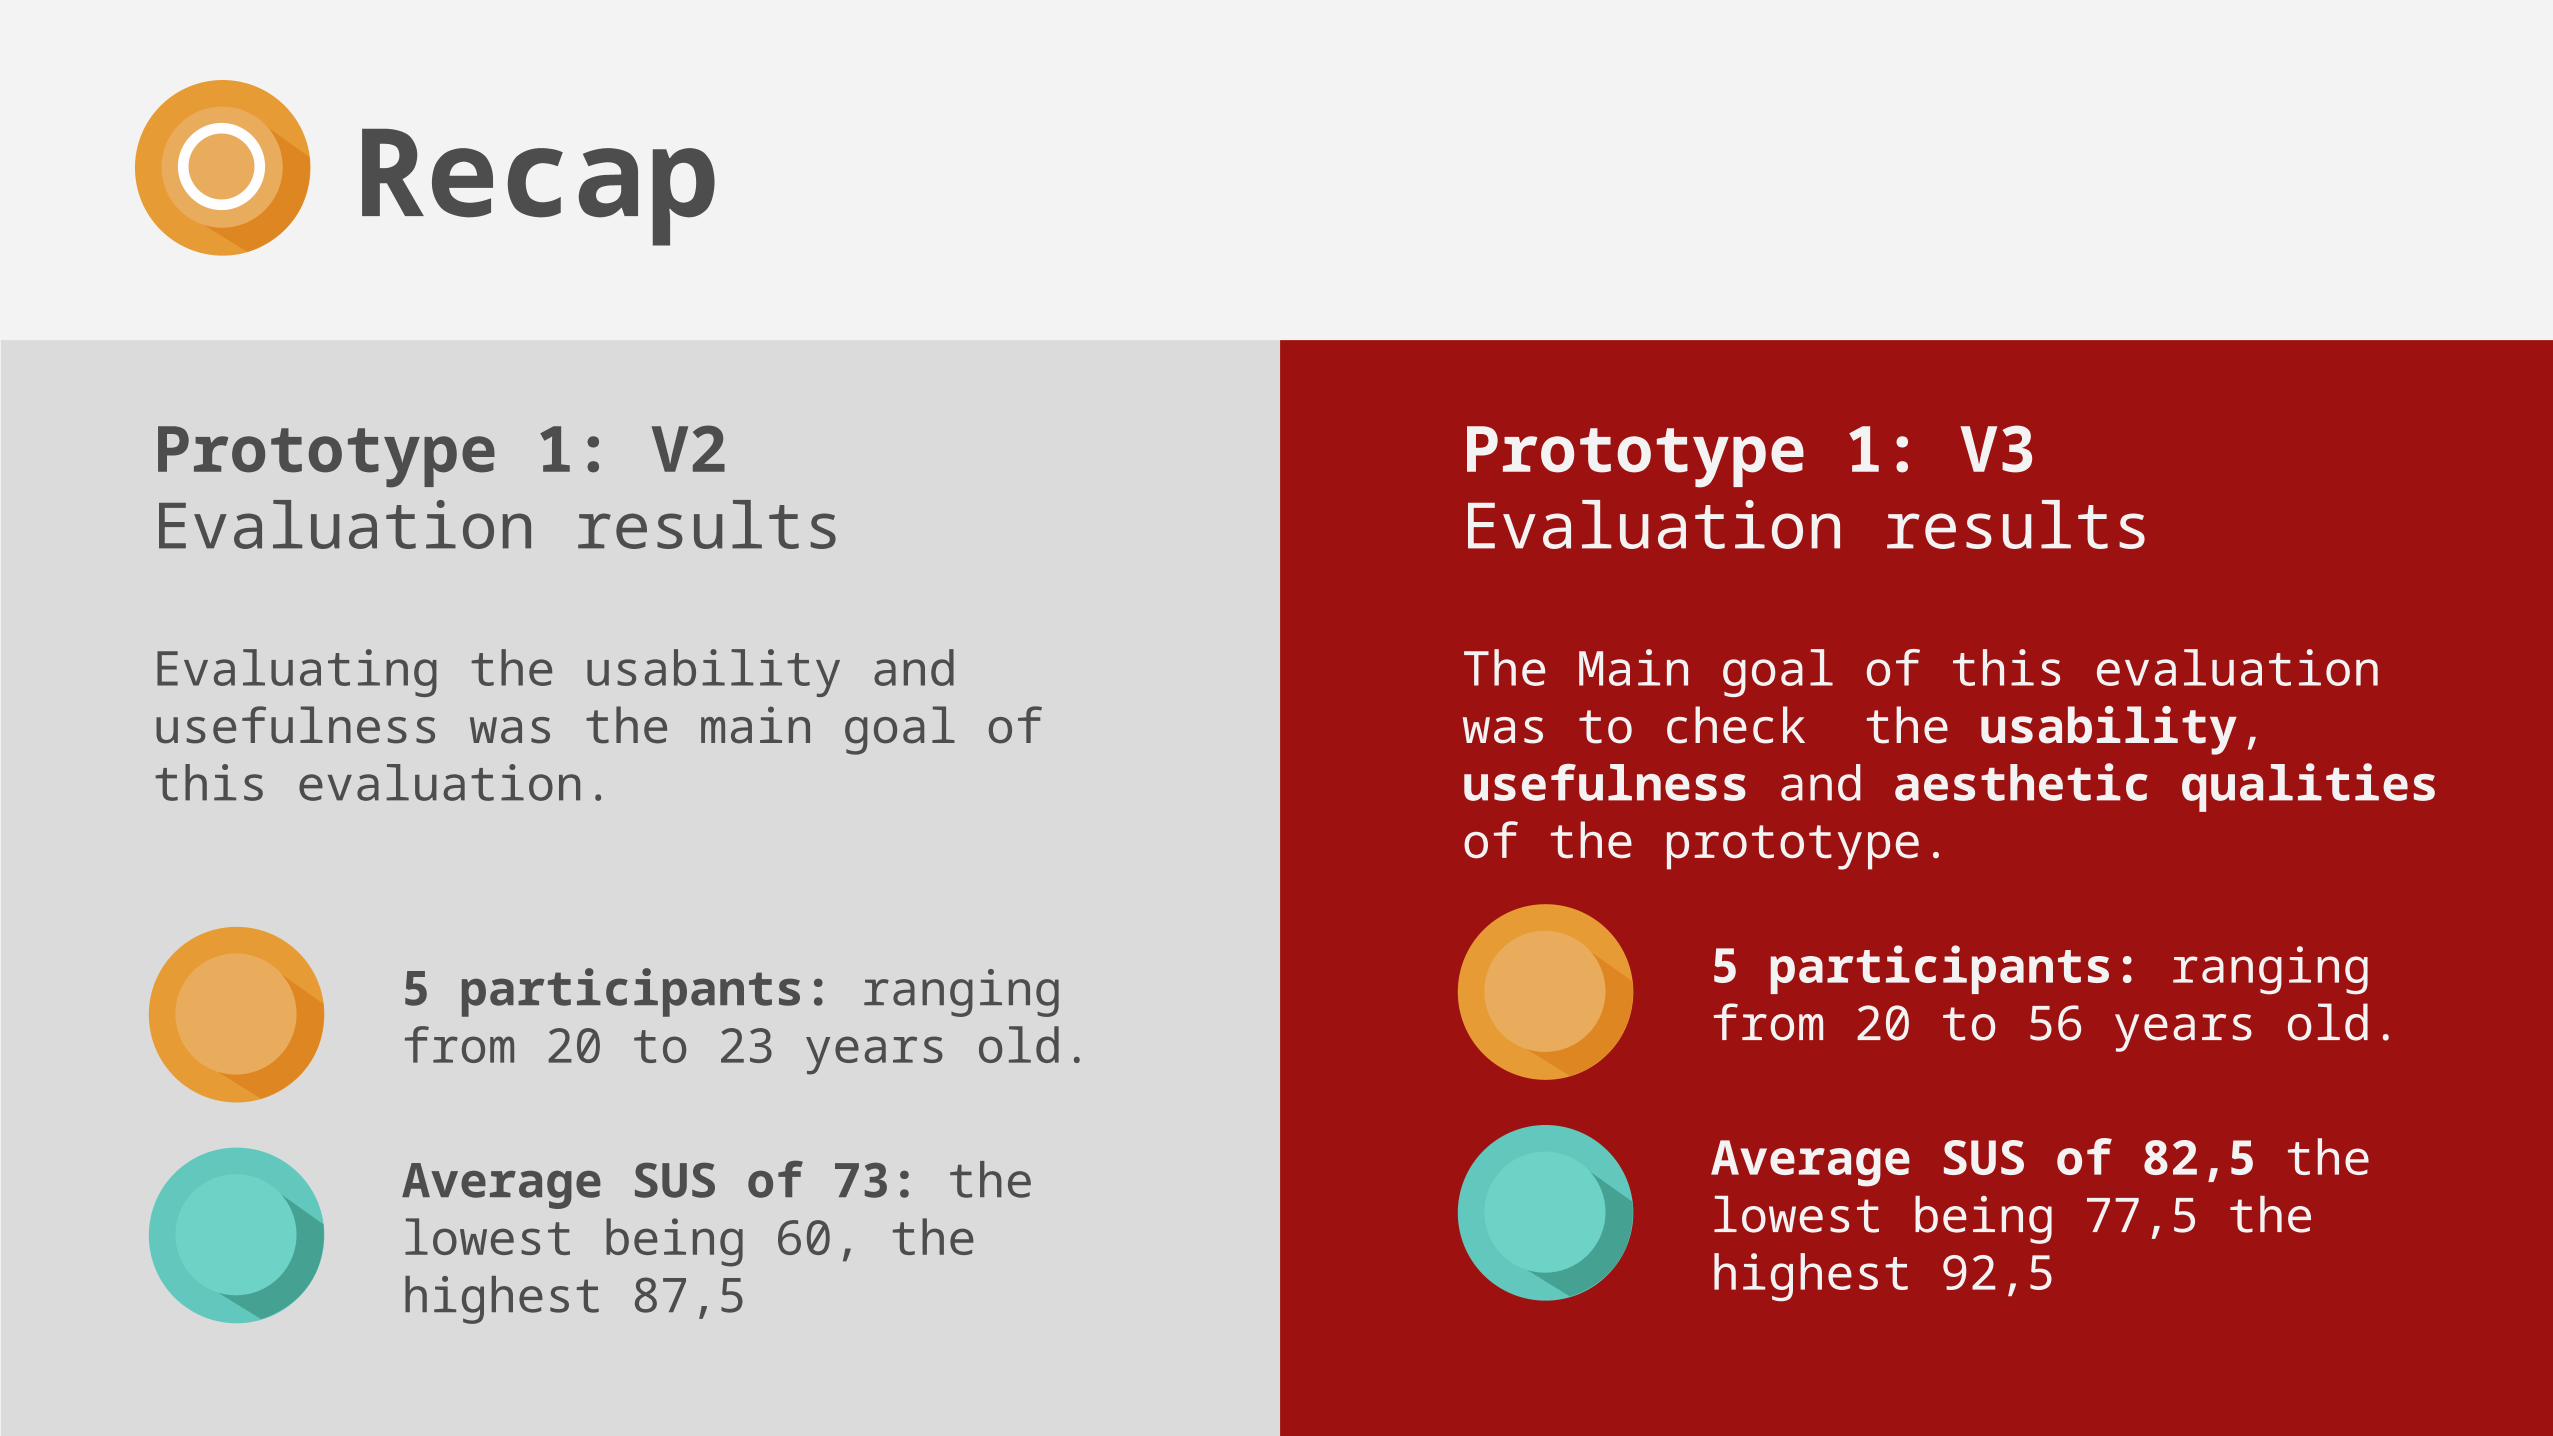
Prototype 1: V2Evaluation results
Evaluating the usability and usefulness was the main goal of this evaluation.
5 participants: ranging from 20 to 23 years old.
Average SUS of 73: the lowest being 60, the highest 87,5
Recap
Prototype 1: V3Evaluation results
The Main goal of this evaluation was to check the usability, usefulness and aesthetic qualities of the prototype.
5 participants: ranging from 20 to 56 years old.
Average SUS of 82,5 the lowest being 77,5 the highest 92,5
1. Goal of this thesis
2. Recap
3. Progress (since last presentation)
4. Planning
5. Statistics
6. Demo
Table of contents
Progress
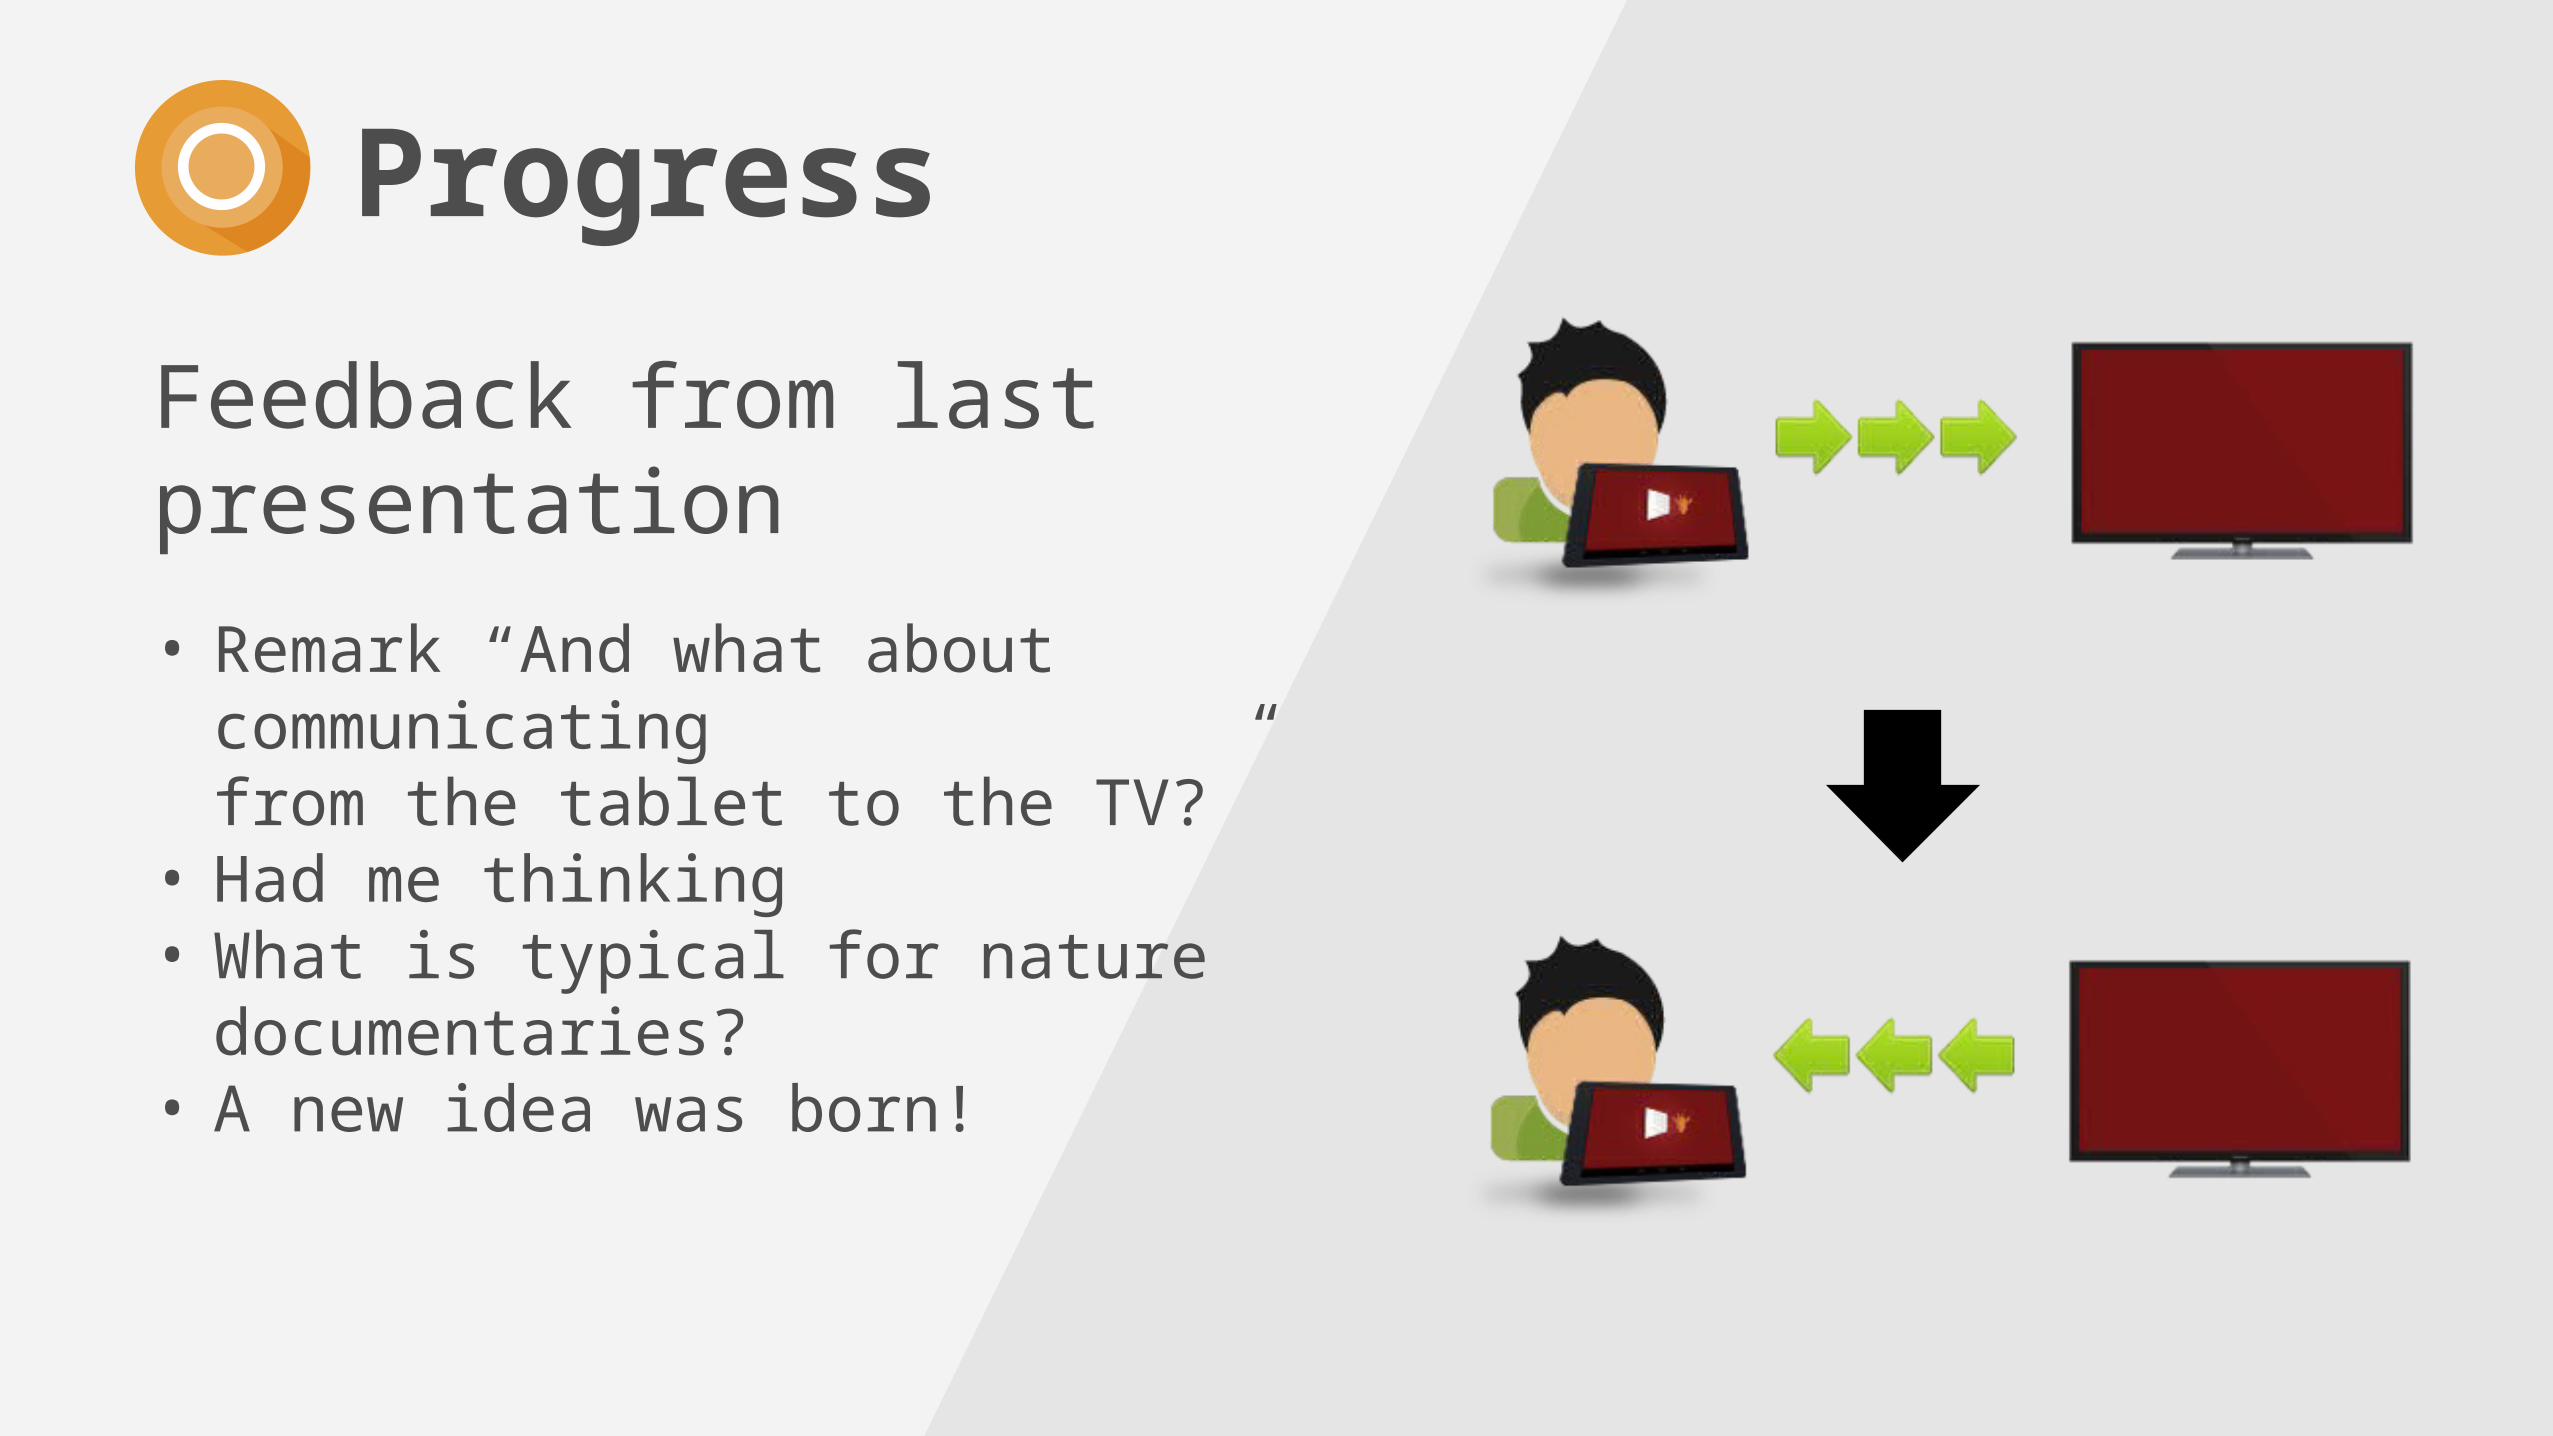
Feedback from last presentation
• Remark “And what about communicating from the tablet to the TV?”
• Had me thinking• What is typical for nature
documentaries?• A new idea was born!
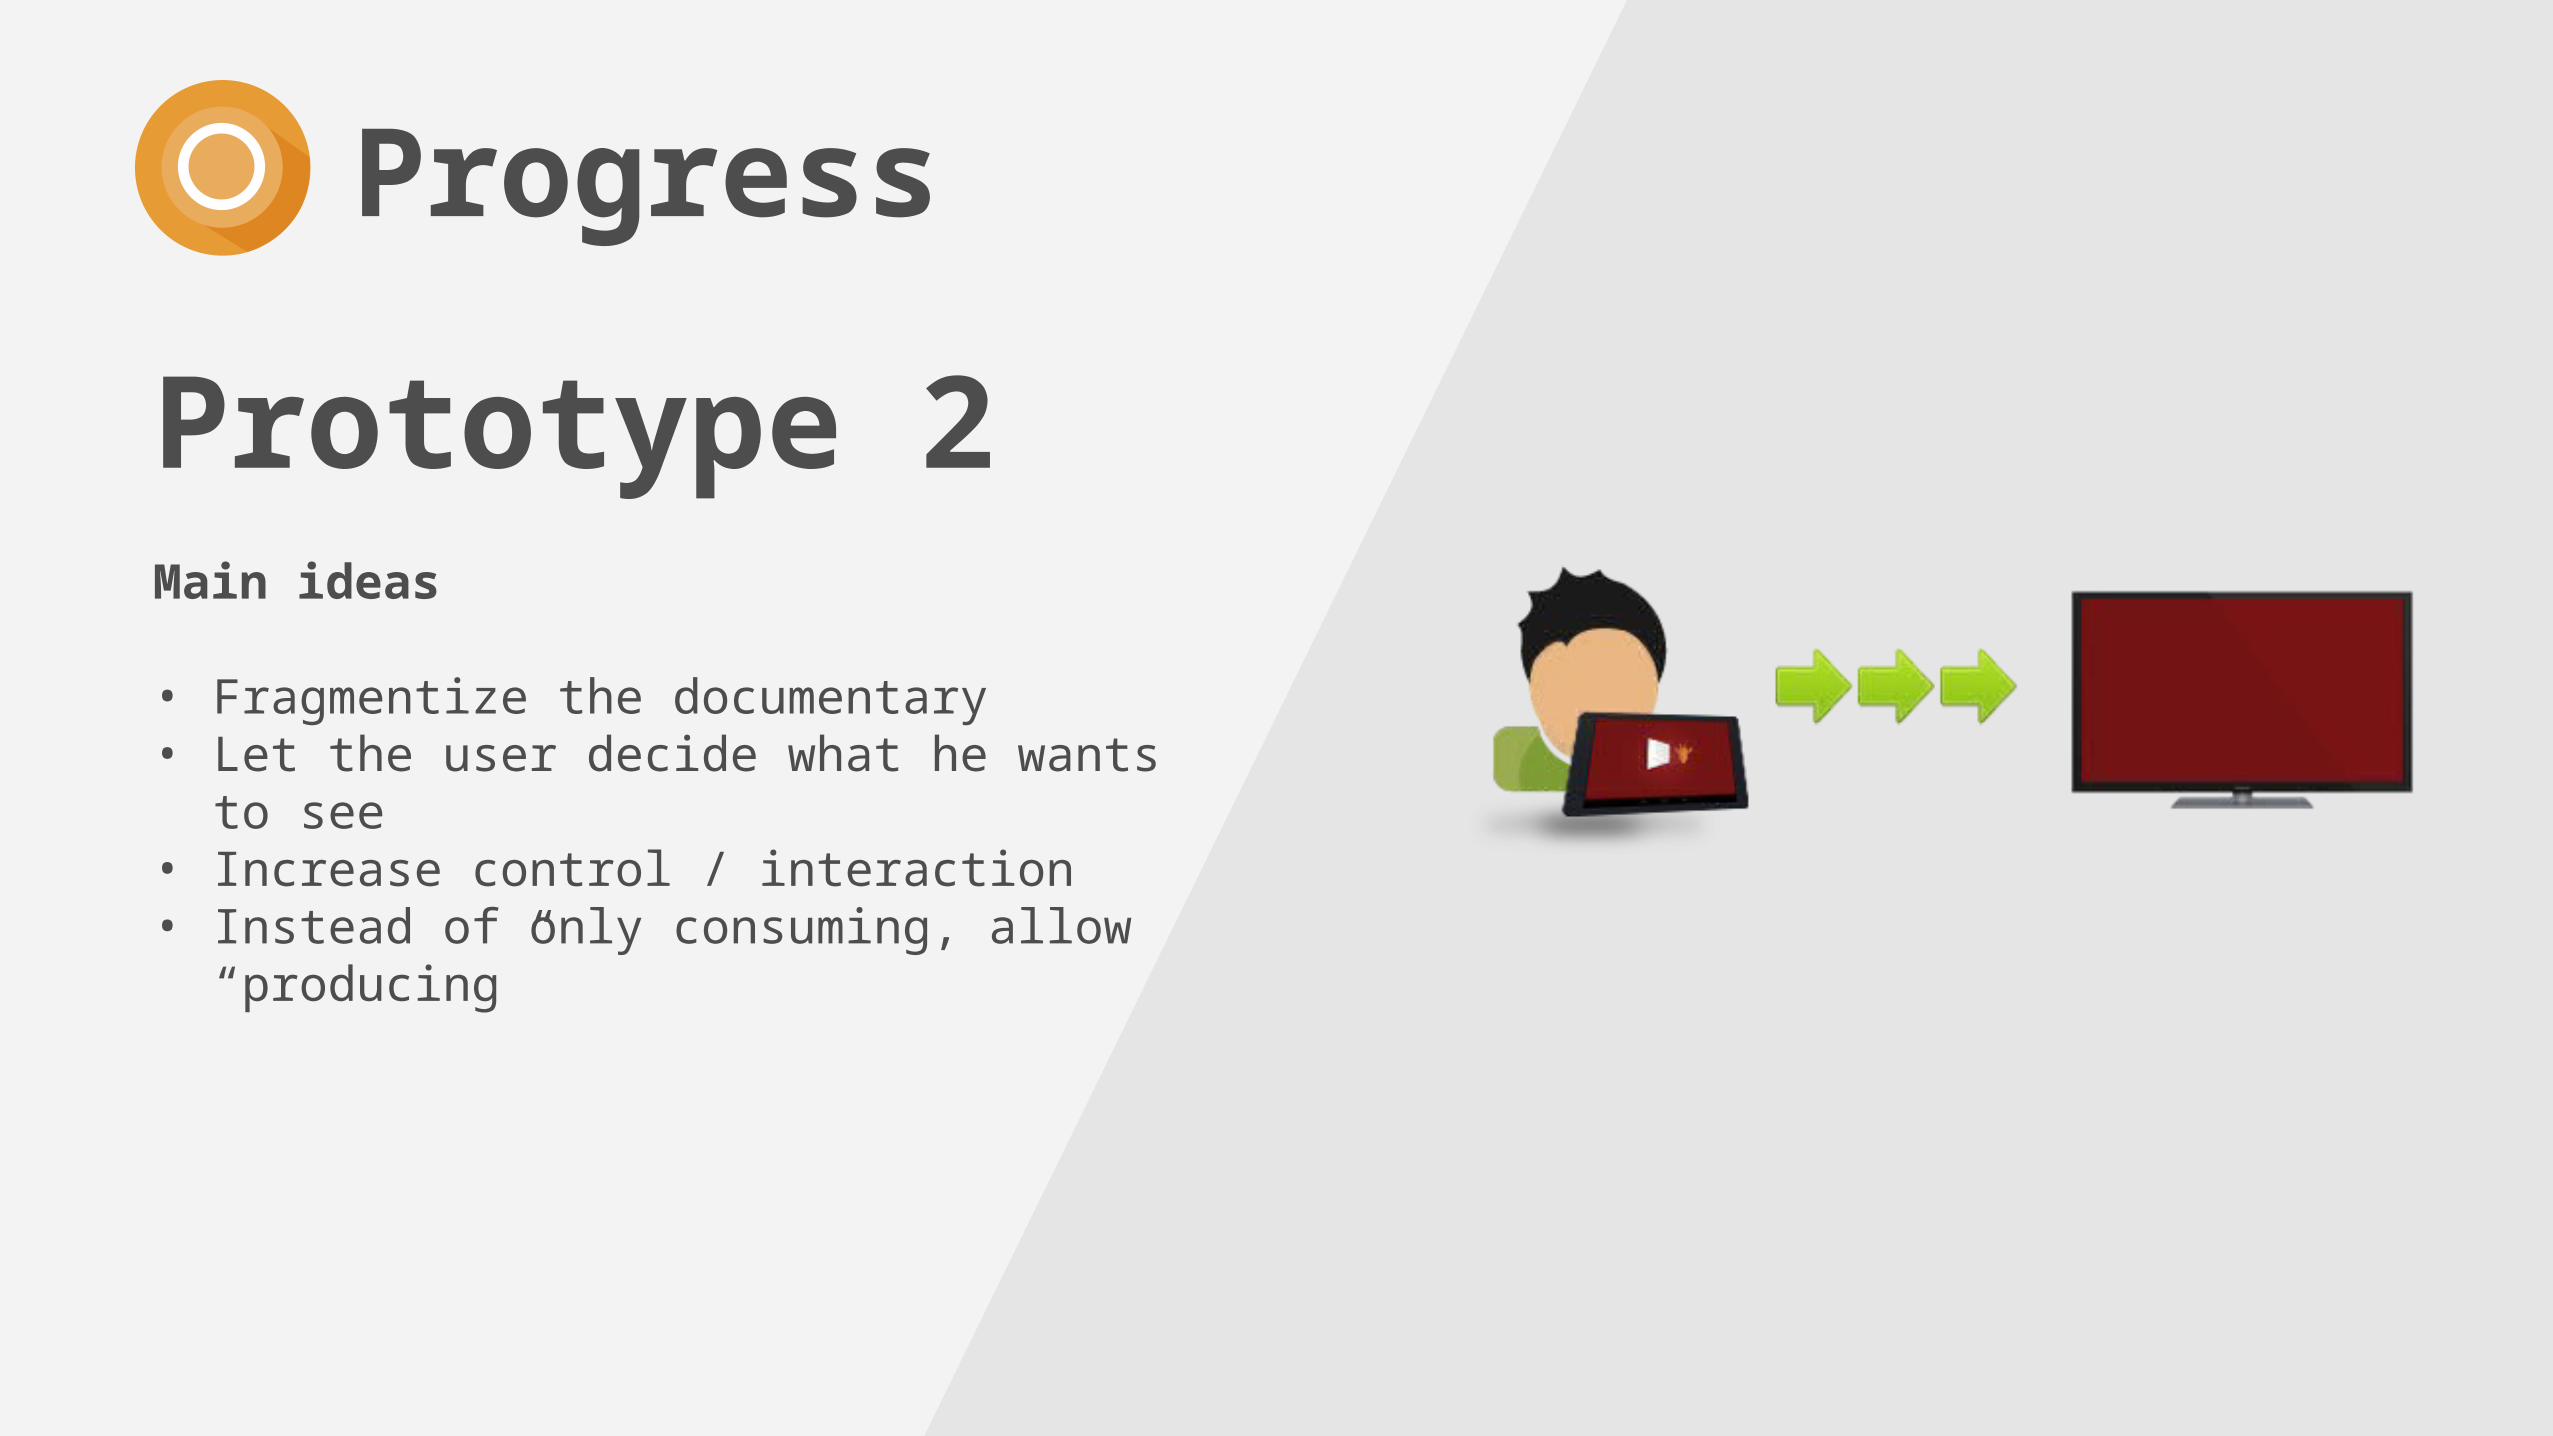
Prototype 2Main ideas
• Fragmentize the documentary• Let the user decide what he wants to
see• Increase control / interaction• Instead of only consuming, allow
“producing”
Progress
Progress
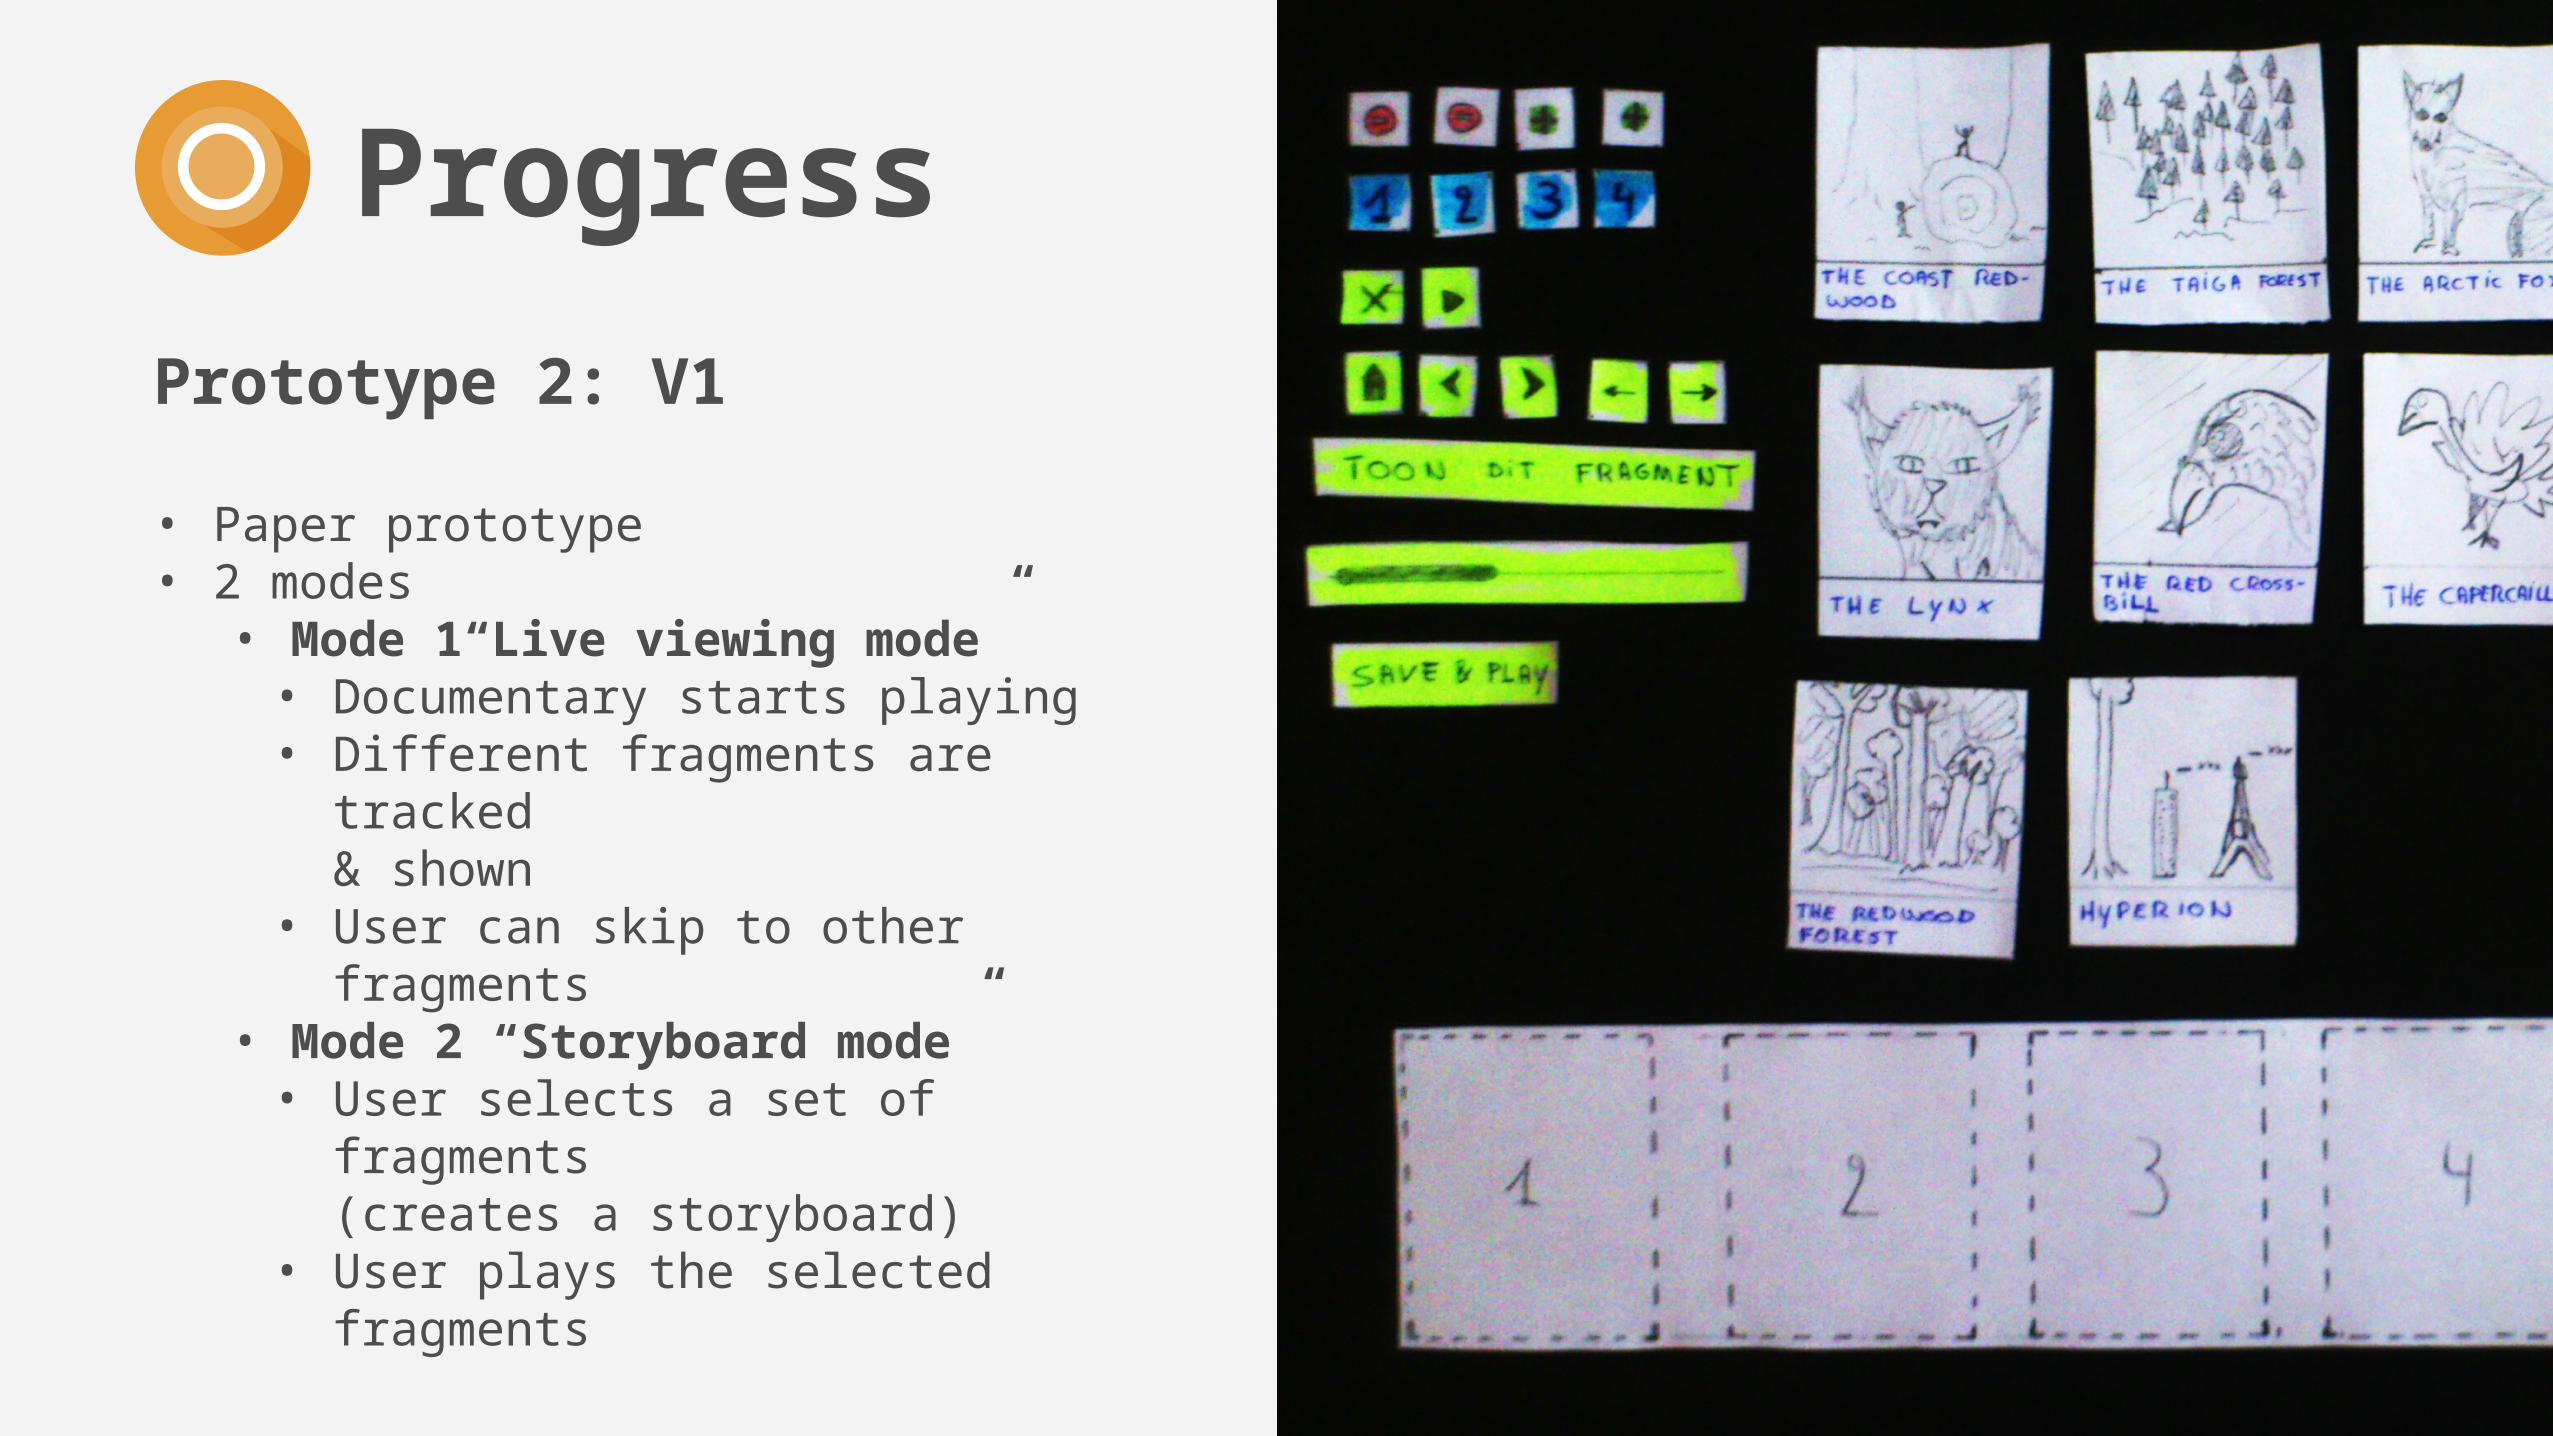
Prototype 2: V1
• Paper prototype• 2 modes
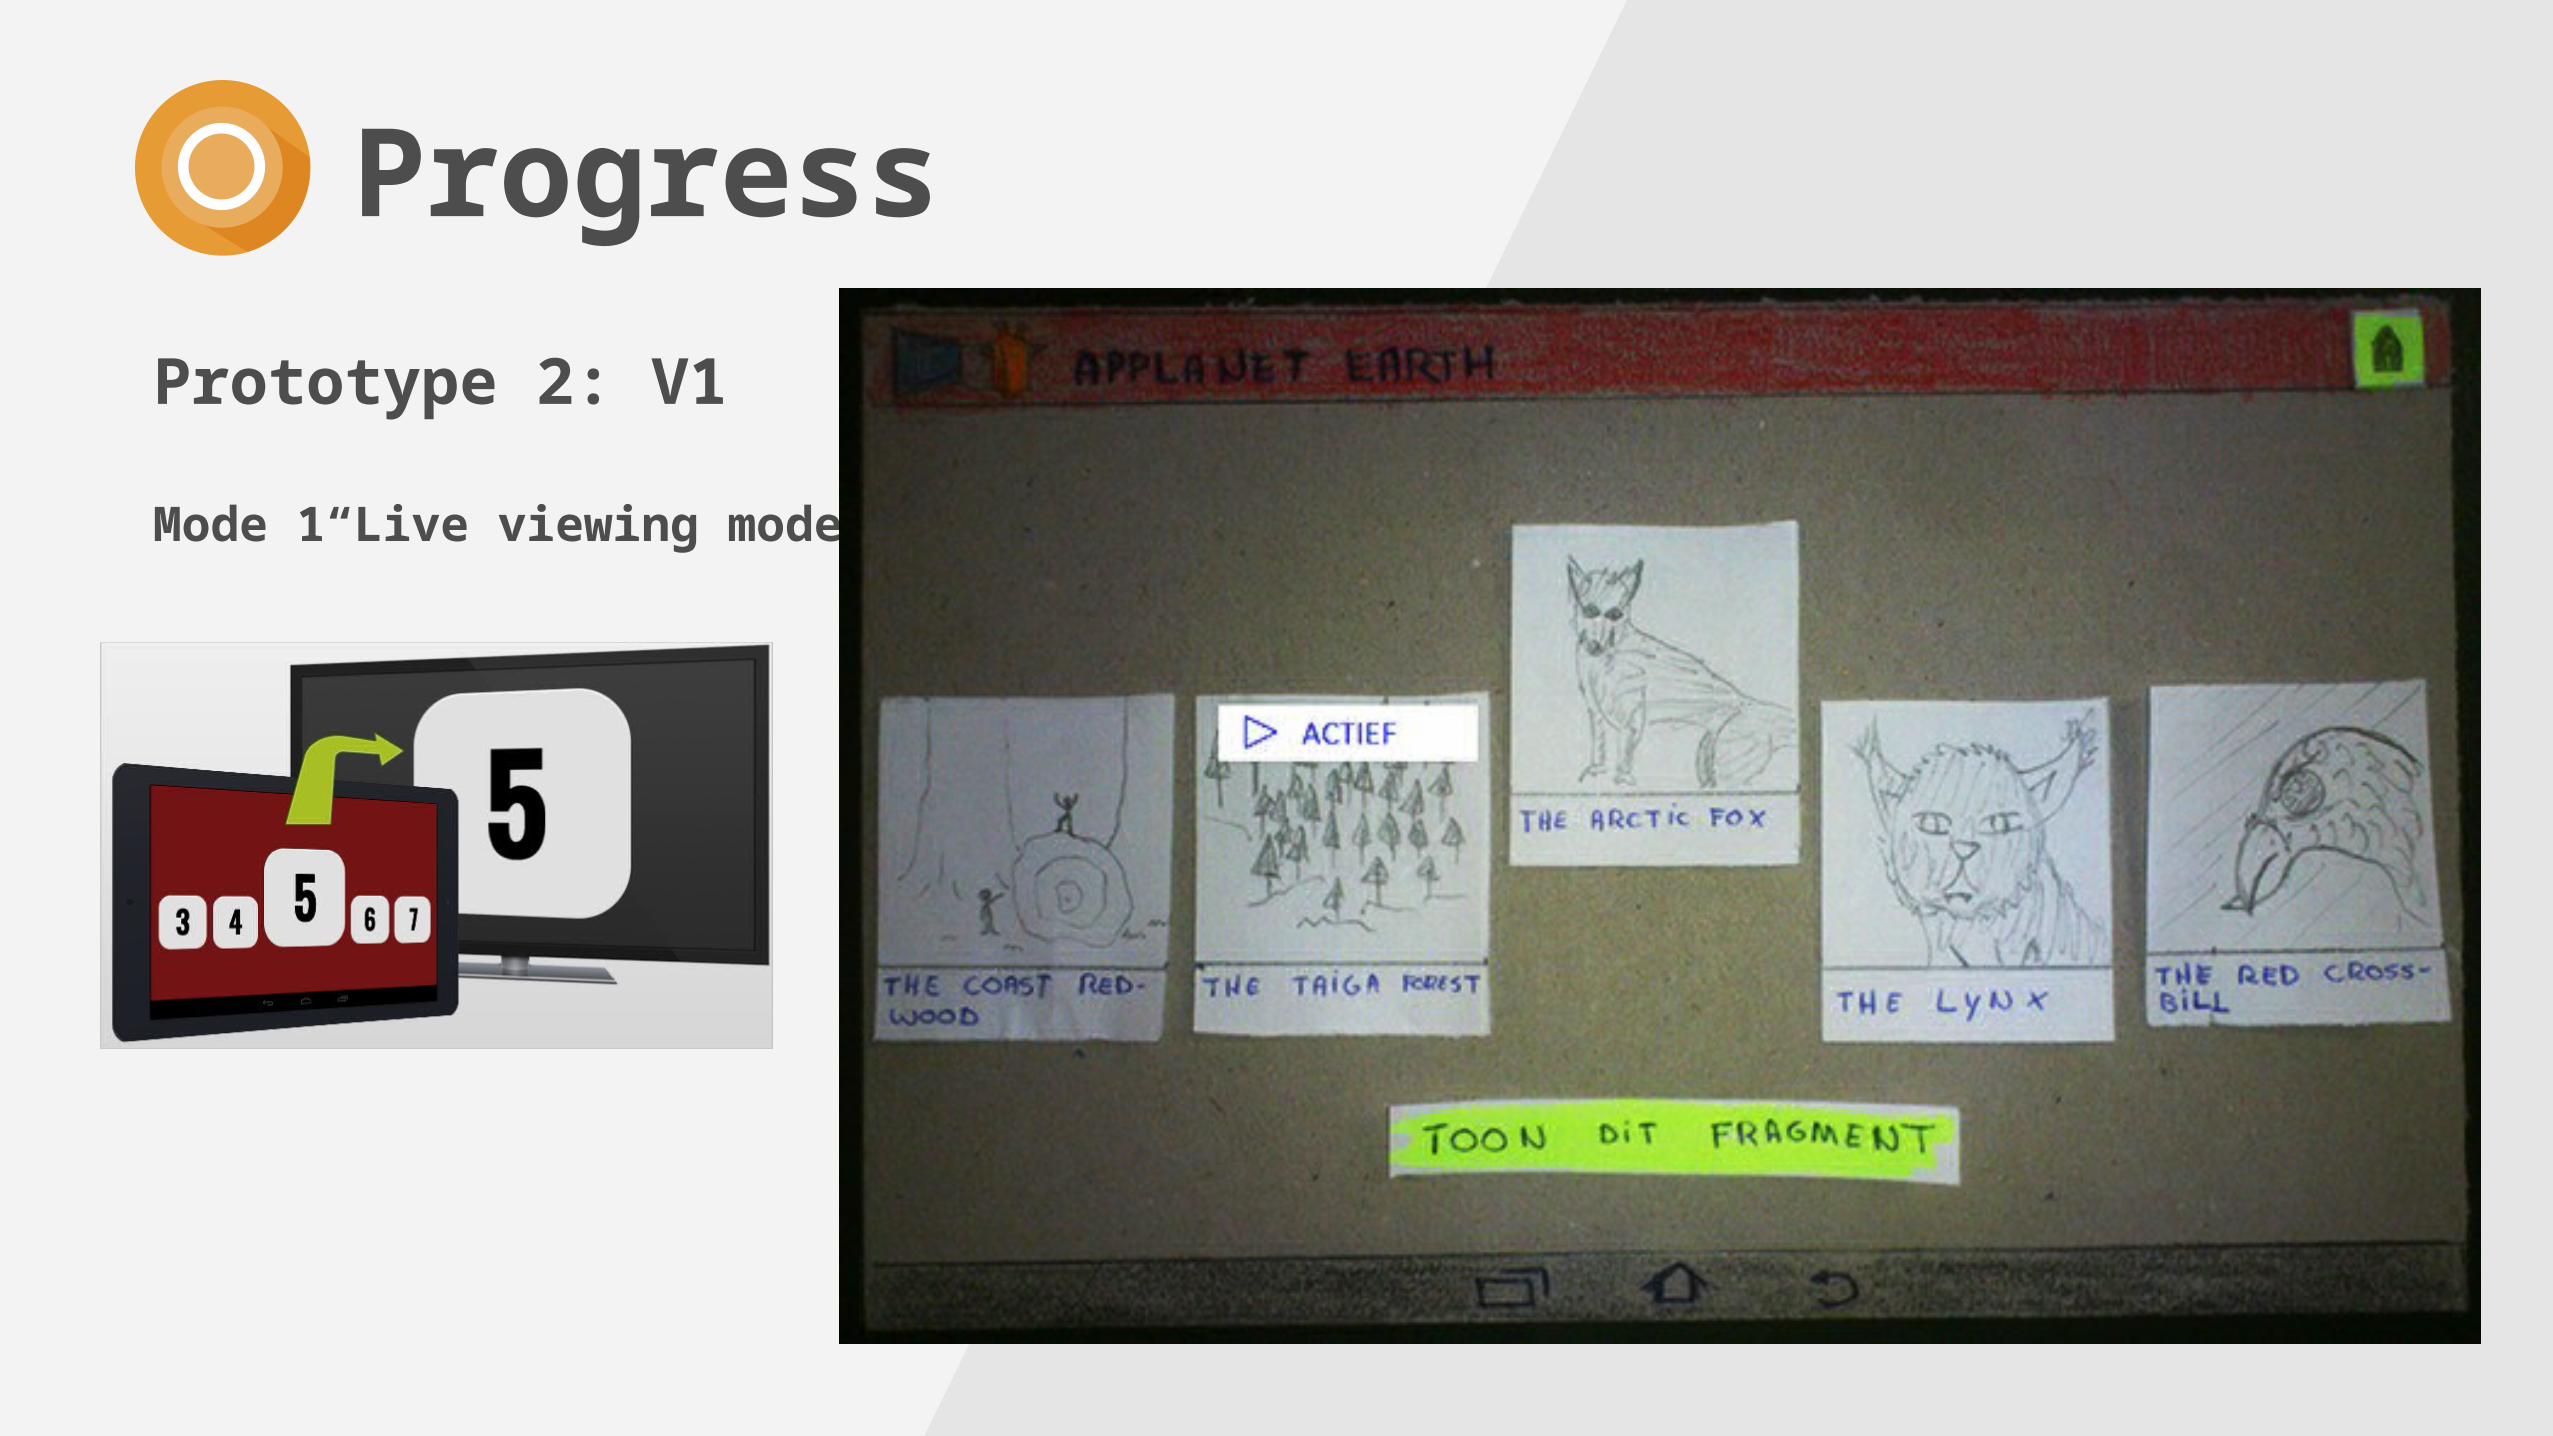
• Mode 1“Live viewing mode”• Documentary starts playing• Different fragments are tracked
& shown• User can skip to other fragments
• Mode 2 “Storyboard mode”• User selects a set of fragments
(creates a storyboard)• User plays the selected fragments
Progress
Prototype 2: V1
Mode 1“Live viewing mode”
Progress
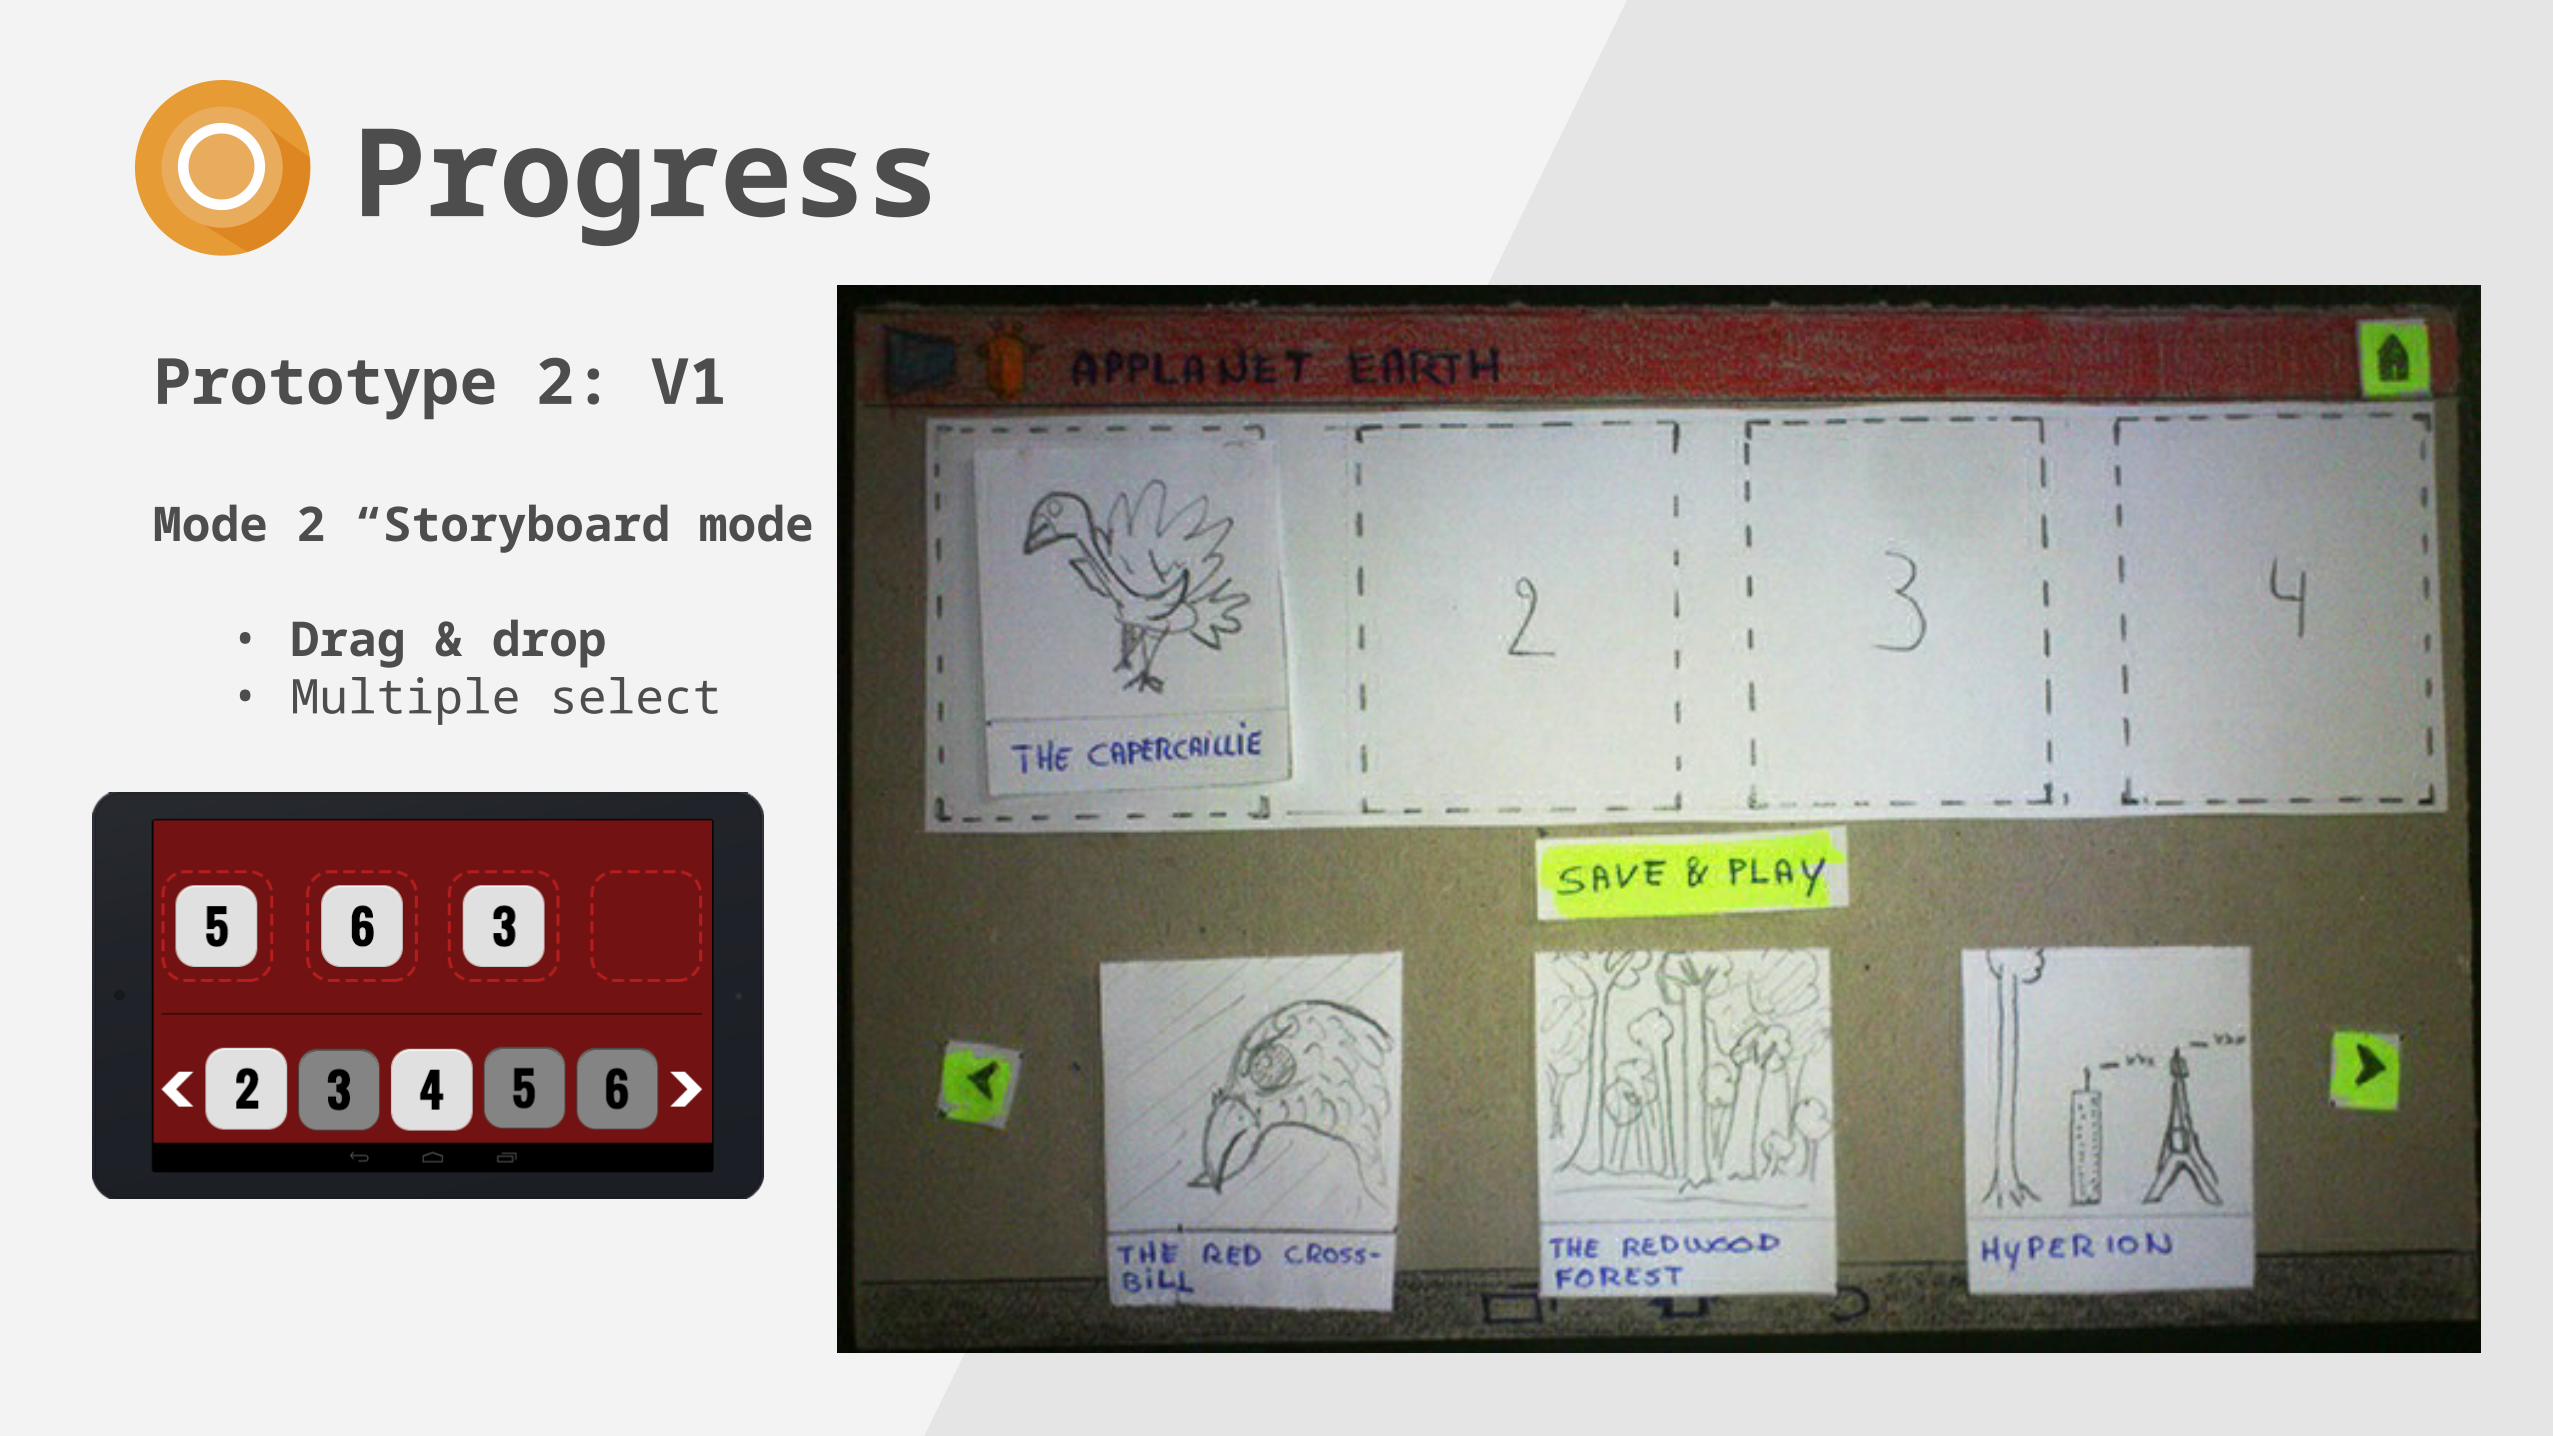
Prototype 2: V1
Mode 2 “Storyboard mode”
• Drag & drop• Multiple select
Progress
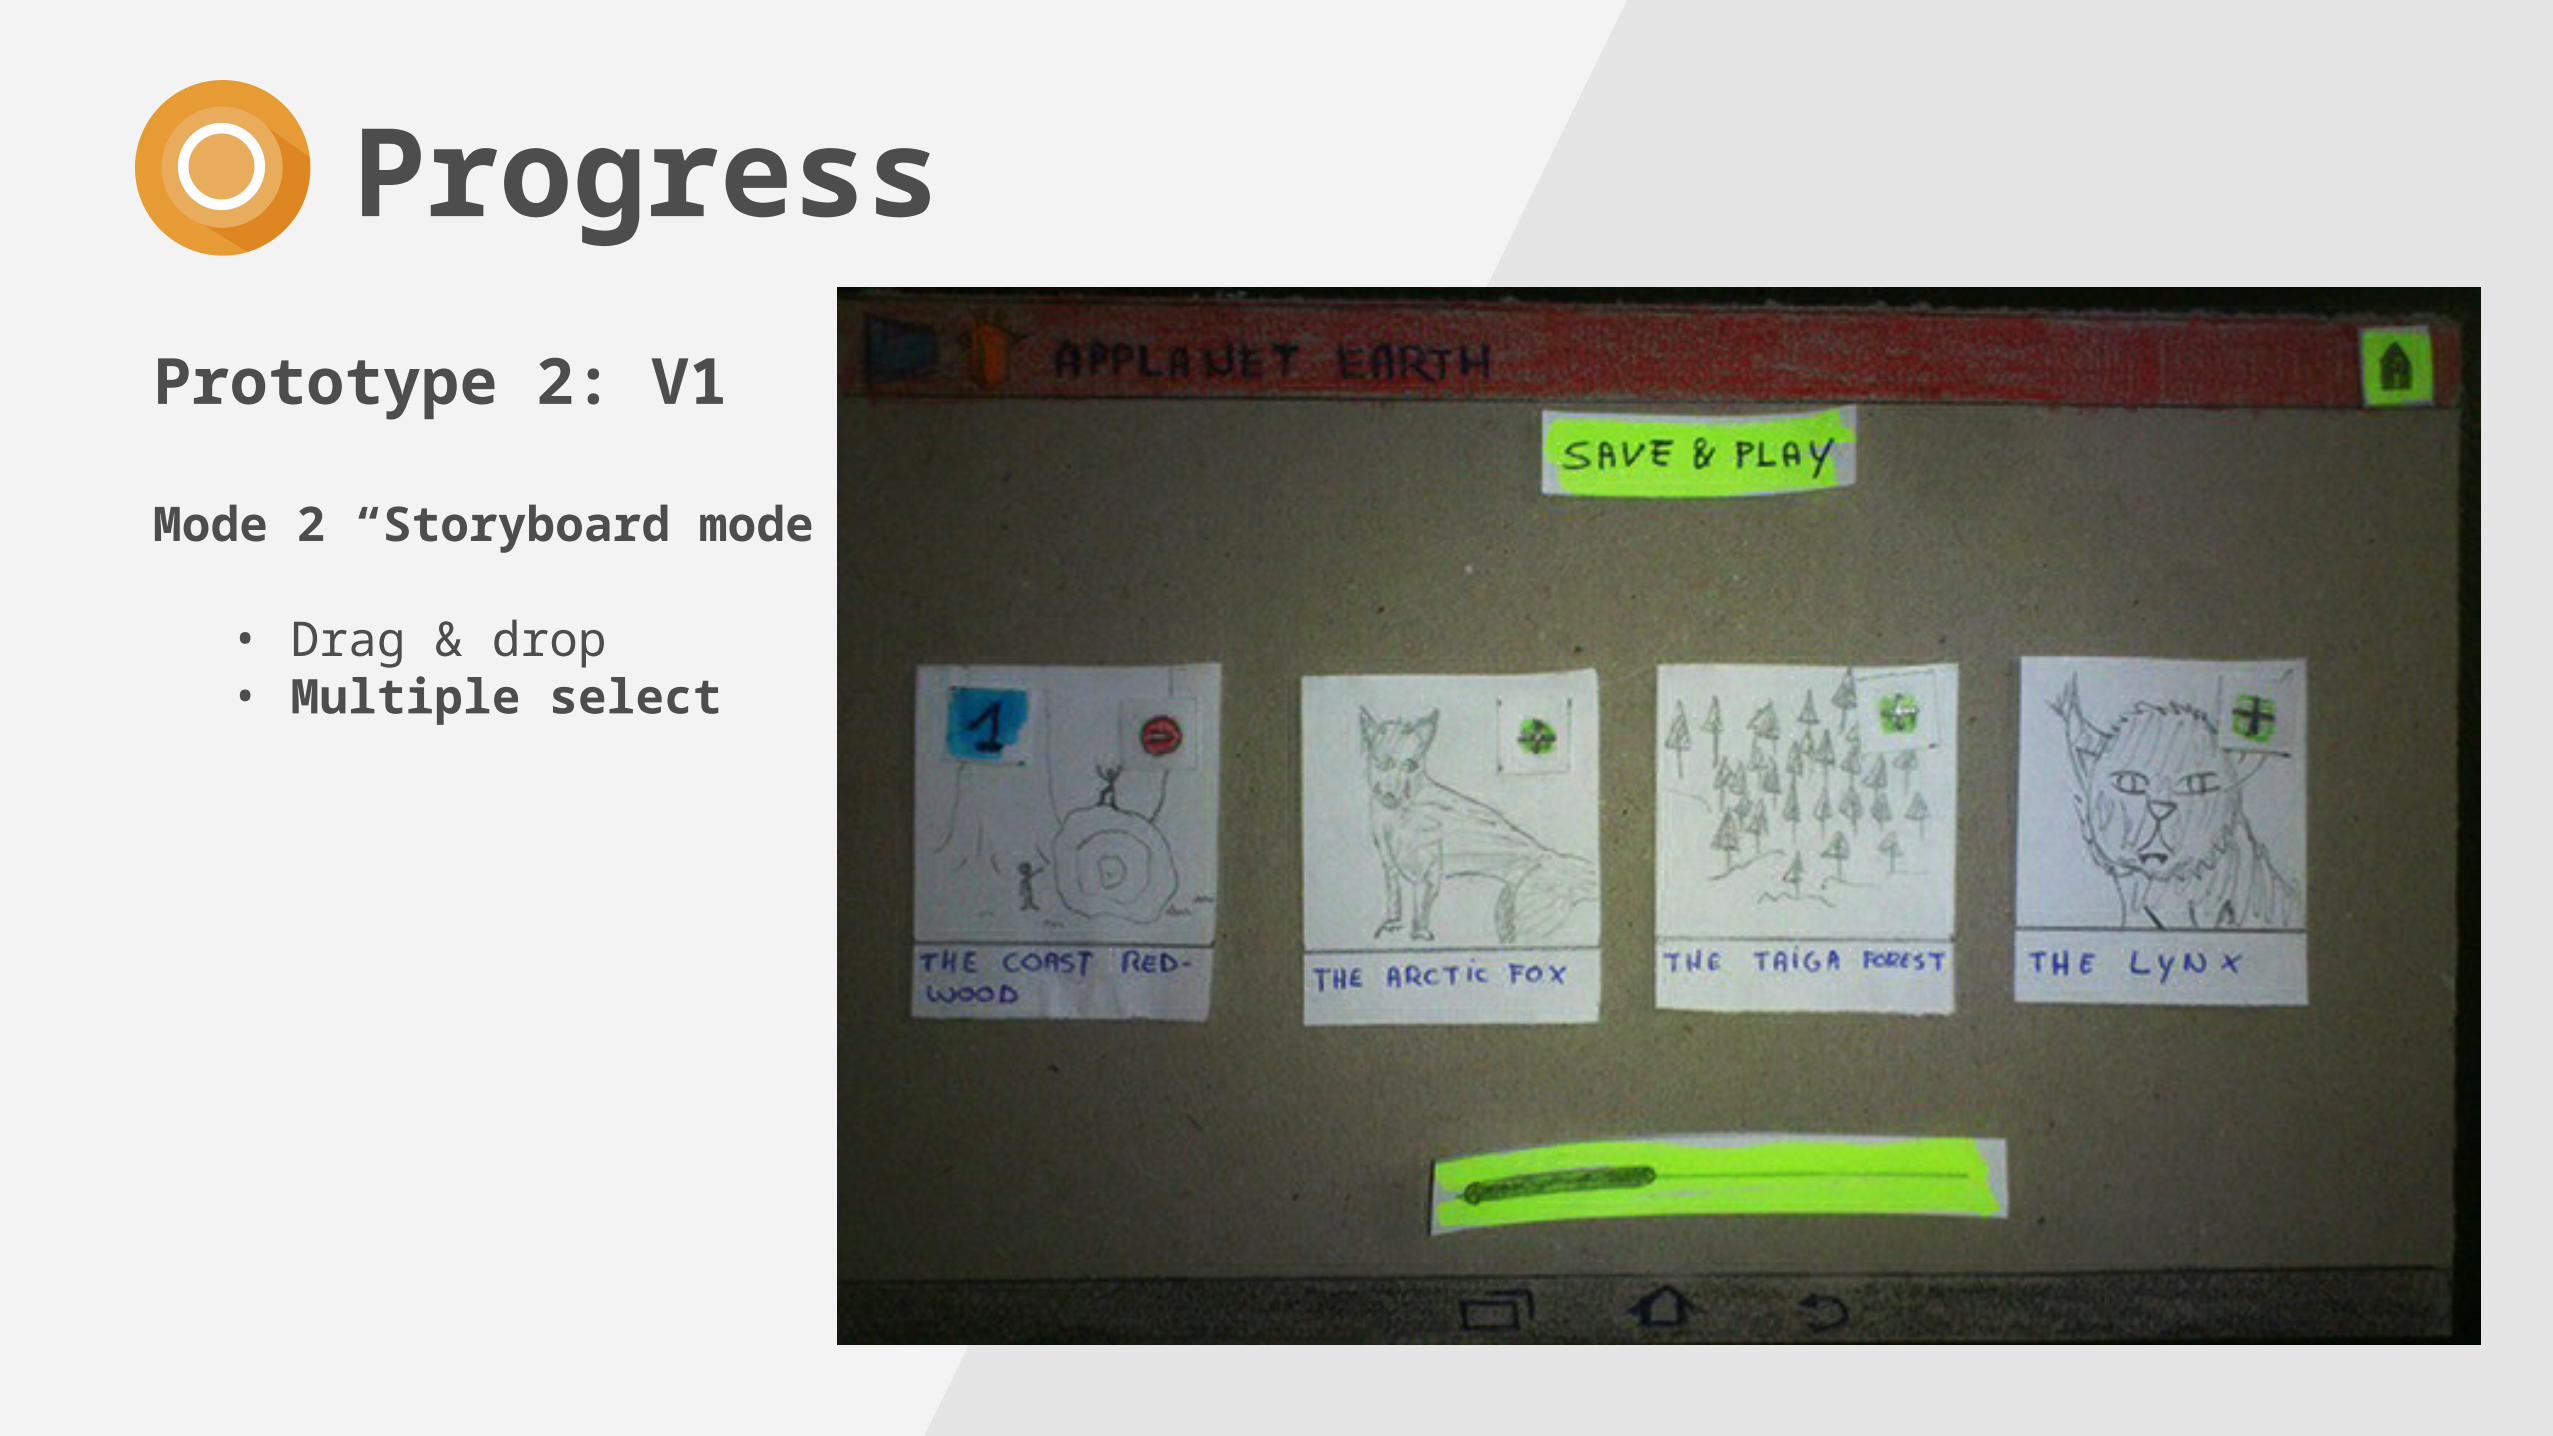
Prototype 2: V1
Mode 2 “Storyboard mode”
• Drag & drop• Multiple select
Progress
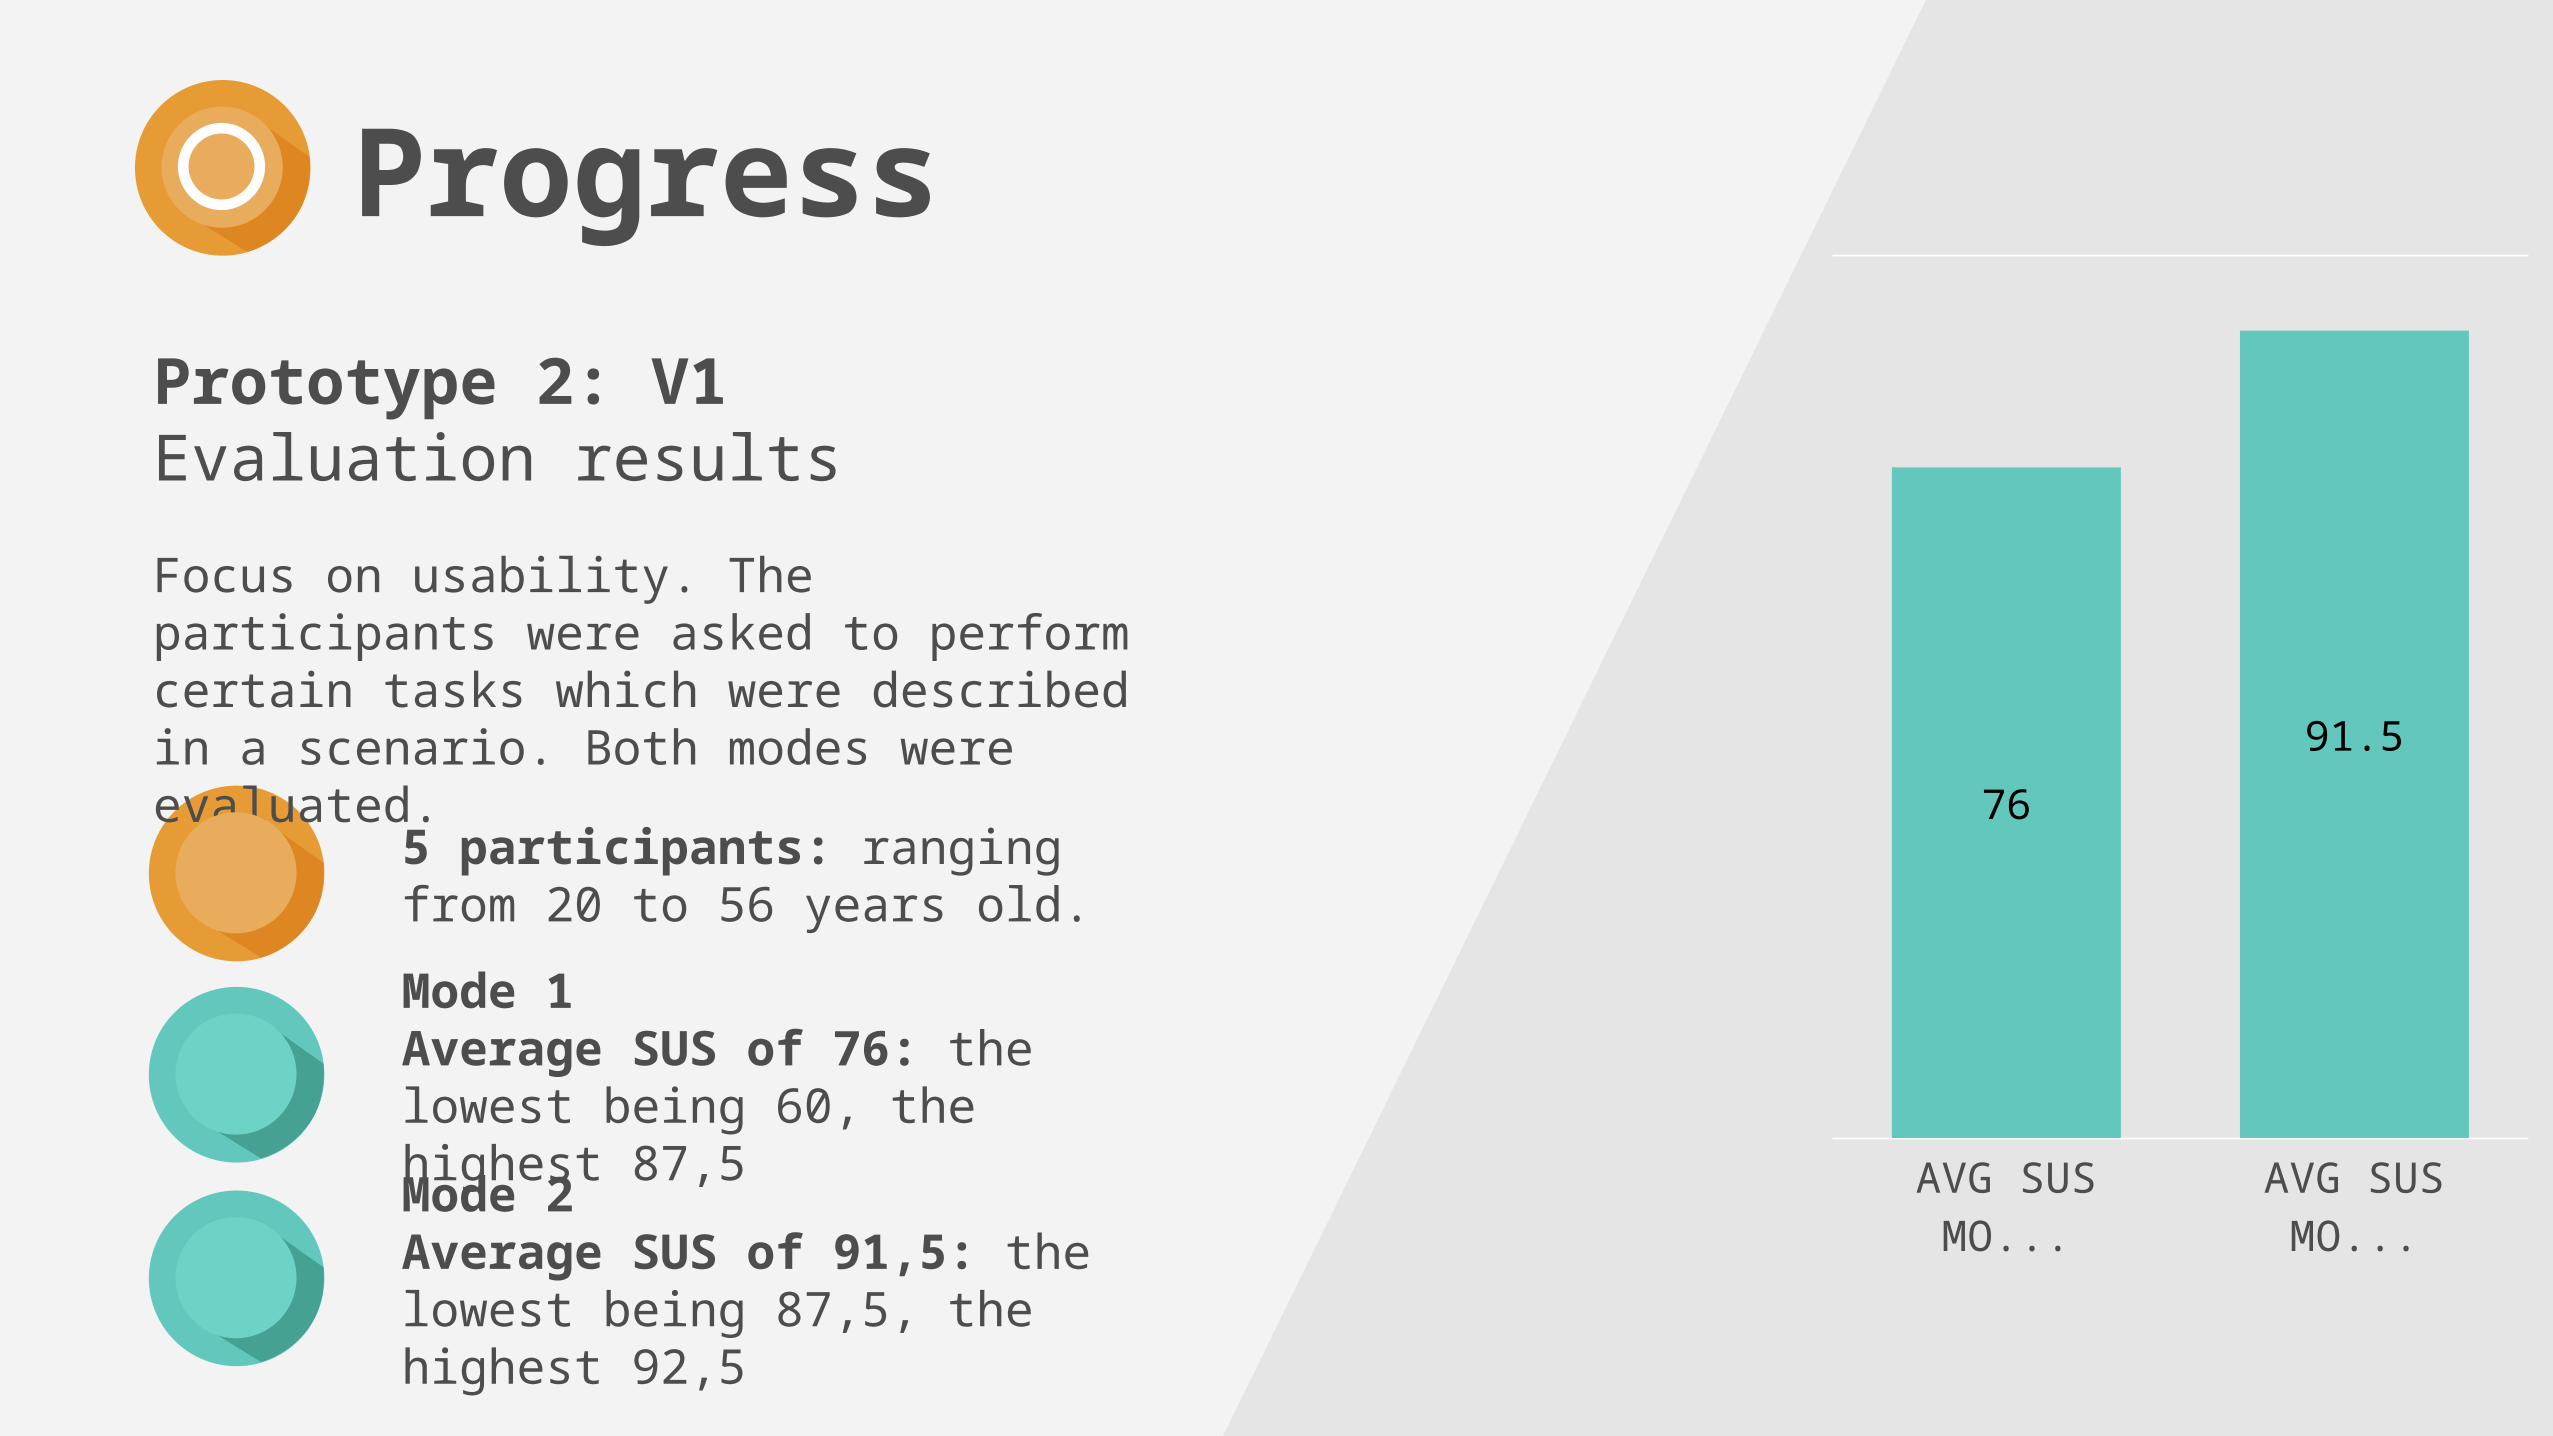
Prototype 2: V1Evaluation results
Focus on usability. The participants were asked to perform certain tasks which were described in a scenario. Both modes were evaluated.
5 participants: ranging from 20 to 56 years old.
Mode 1Average SUS of 76: the lowest being 60, the highest 87,5Mode 2Average SUS of 91,5: the lowest being 87,5, the highest 92,5
AVG SUS MODE 1
AVG SUS MODE 2
76
91.5
Progress
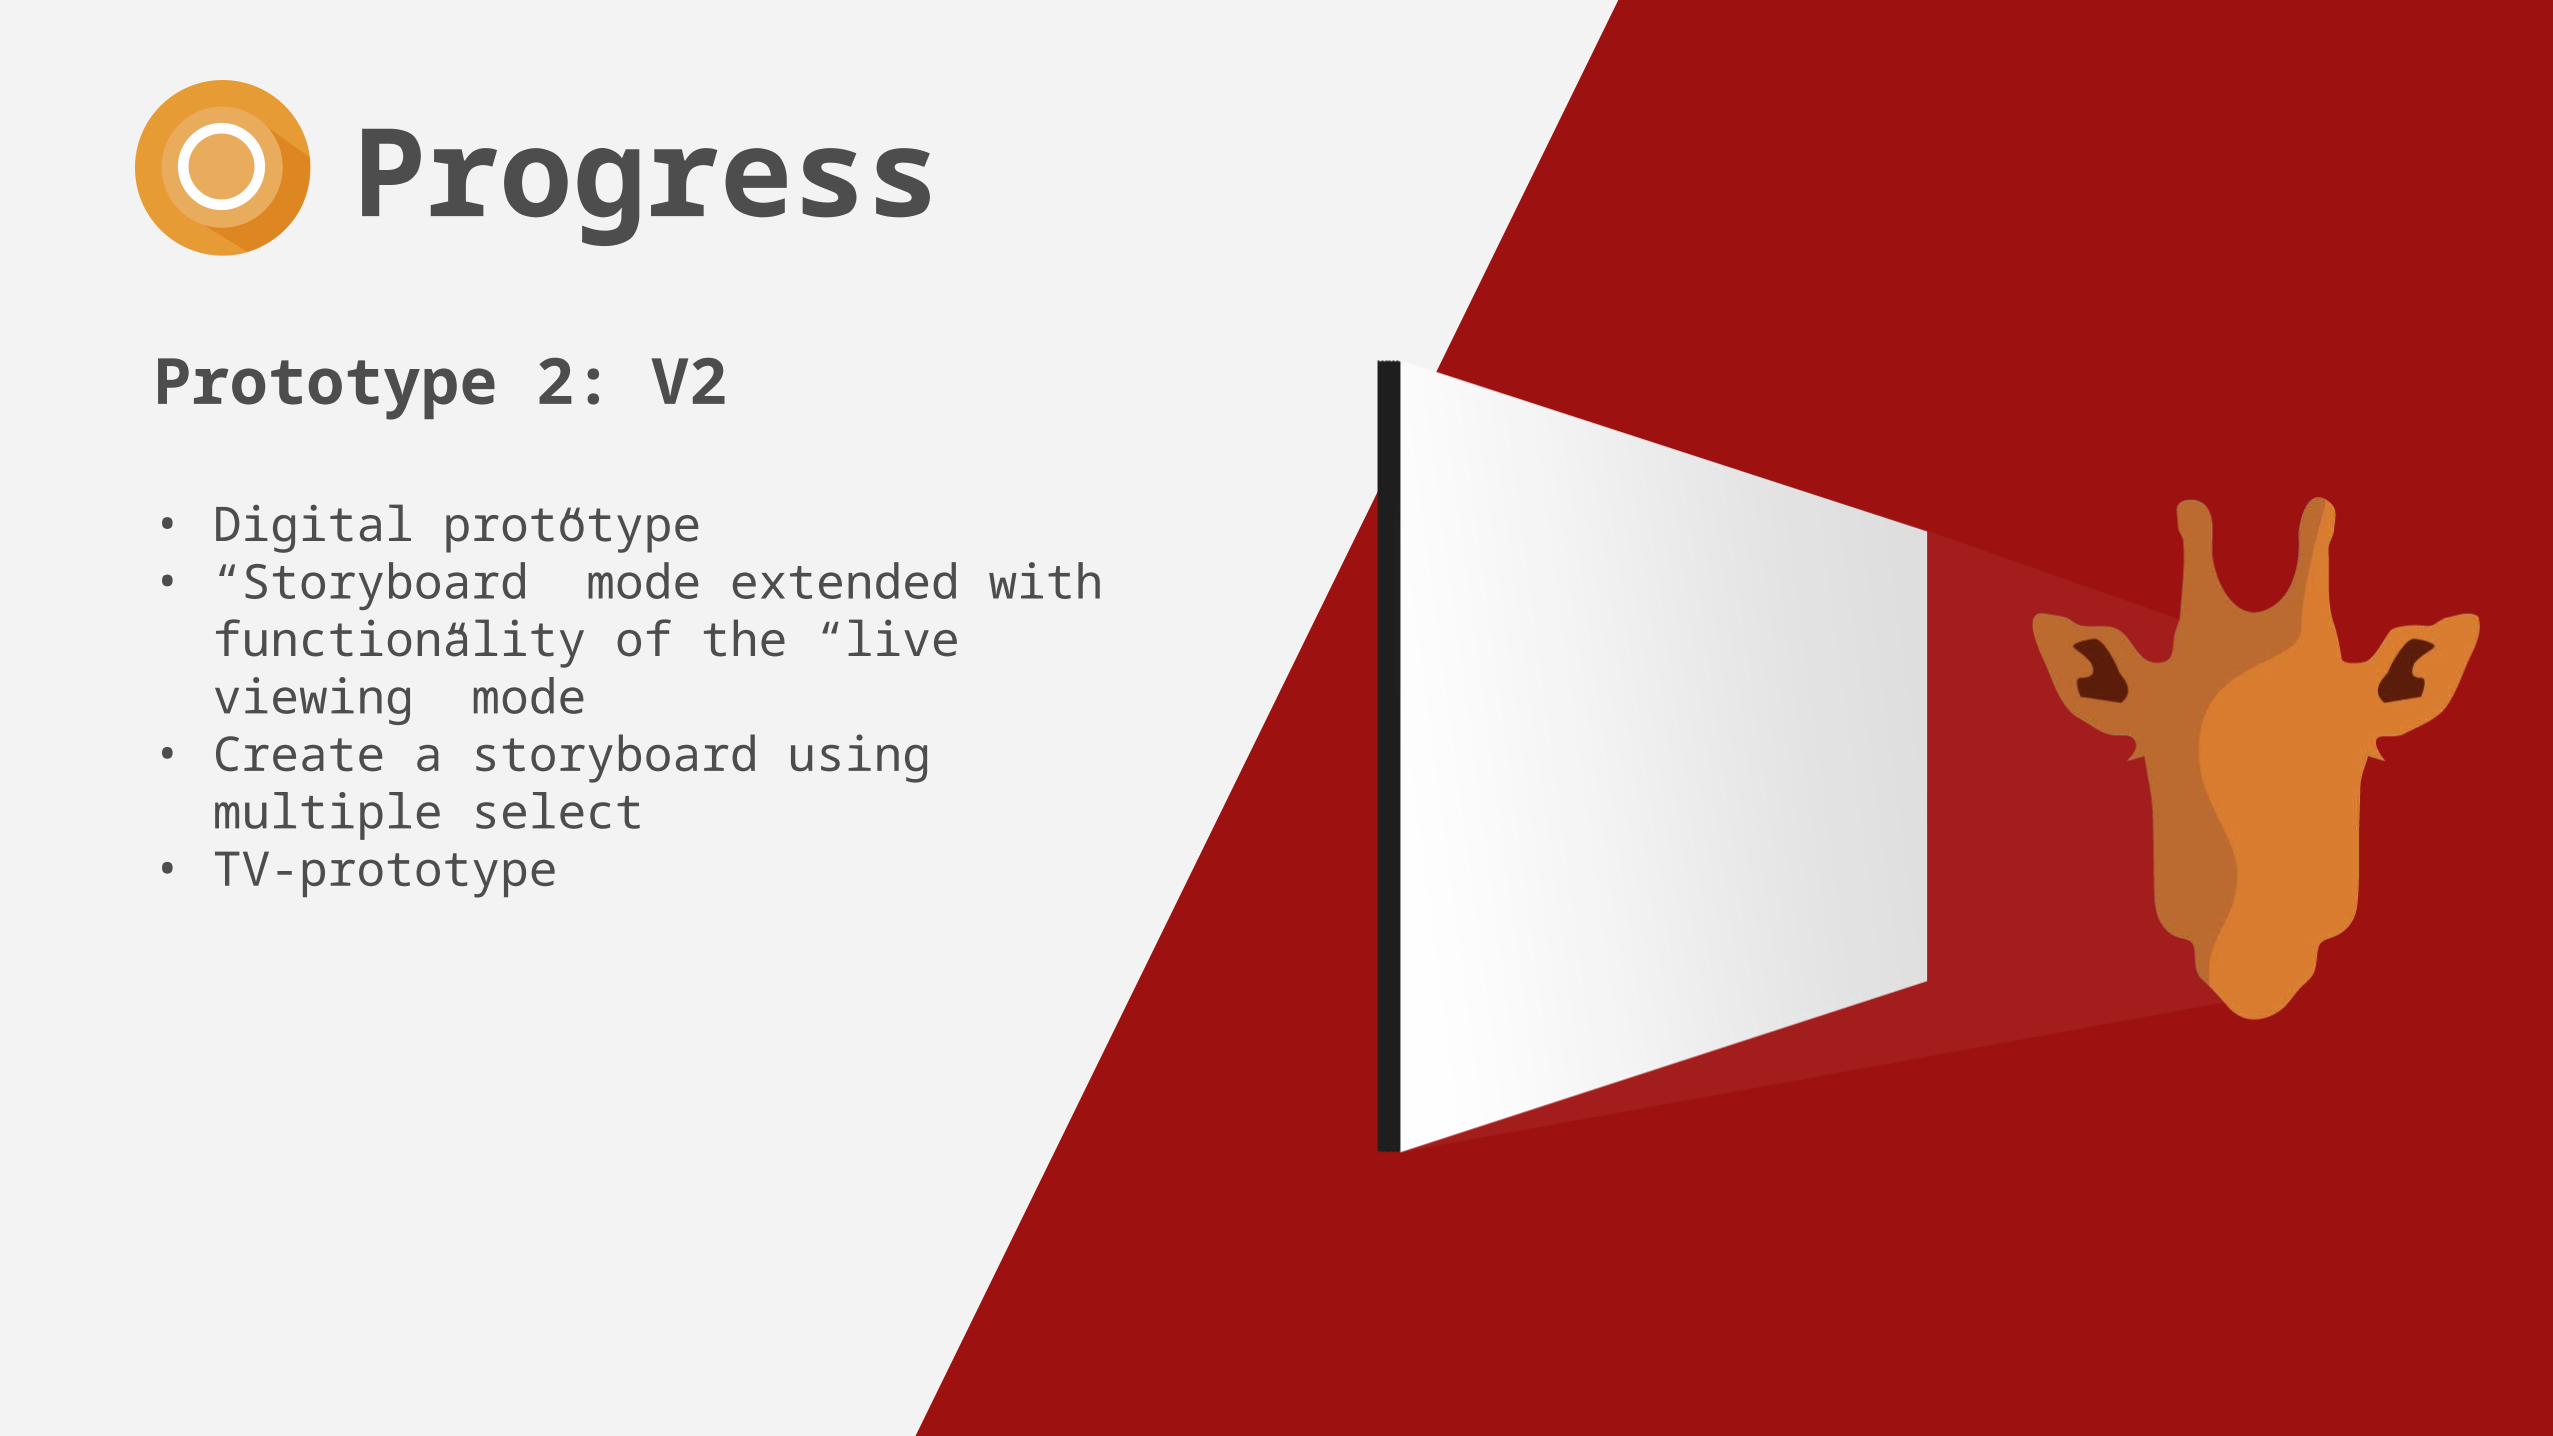
Prototype 2: V2
• Digital prototype• “Storyboard” mode extended with
functionality of the “live viewing” mode• Create a storyboard using multiple
select• TV-prototype
Progress
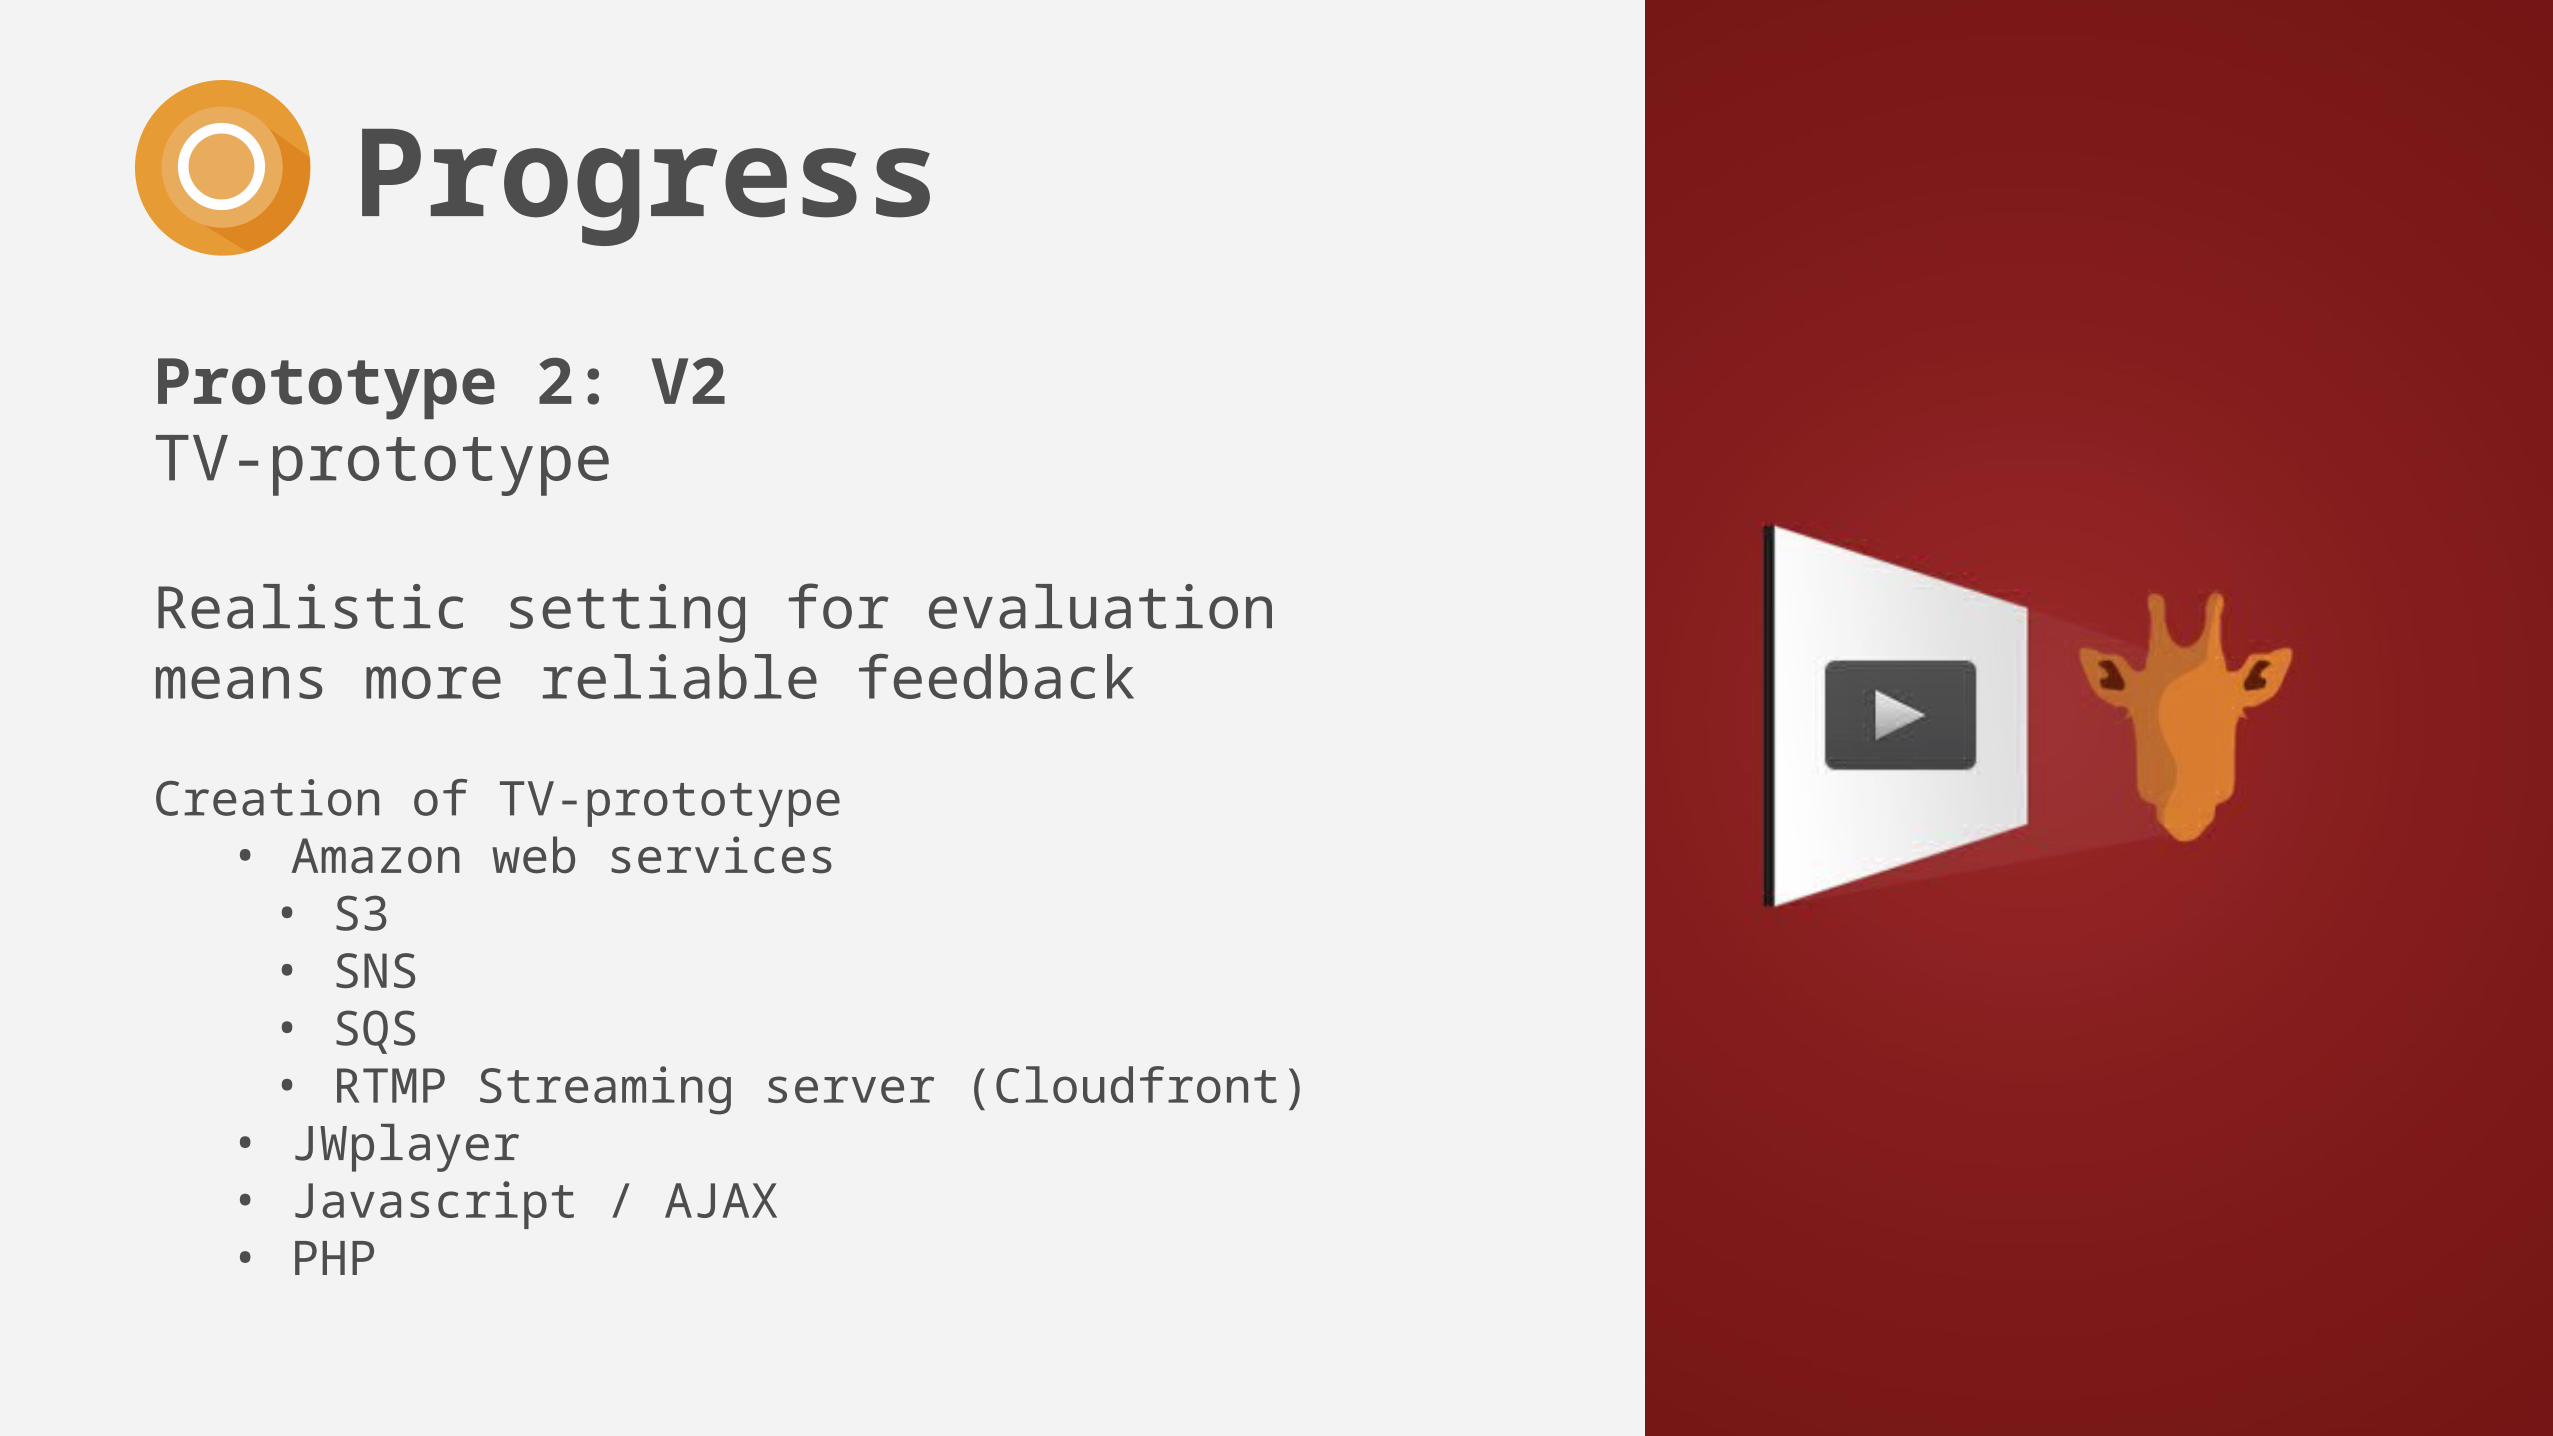
Prototype 2: V2TV-prototype
Realistic setting for evaluation means more reliable feedback
Creation of TV-prototype• Amazon web services• S3• SNS• SQS• RTMP Streaming server (Cloudfront)
• JWplayer• Javascript / AJAX• PHP
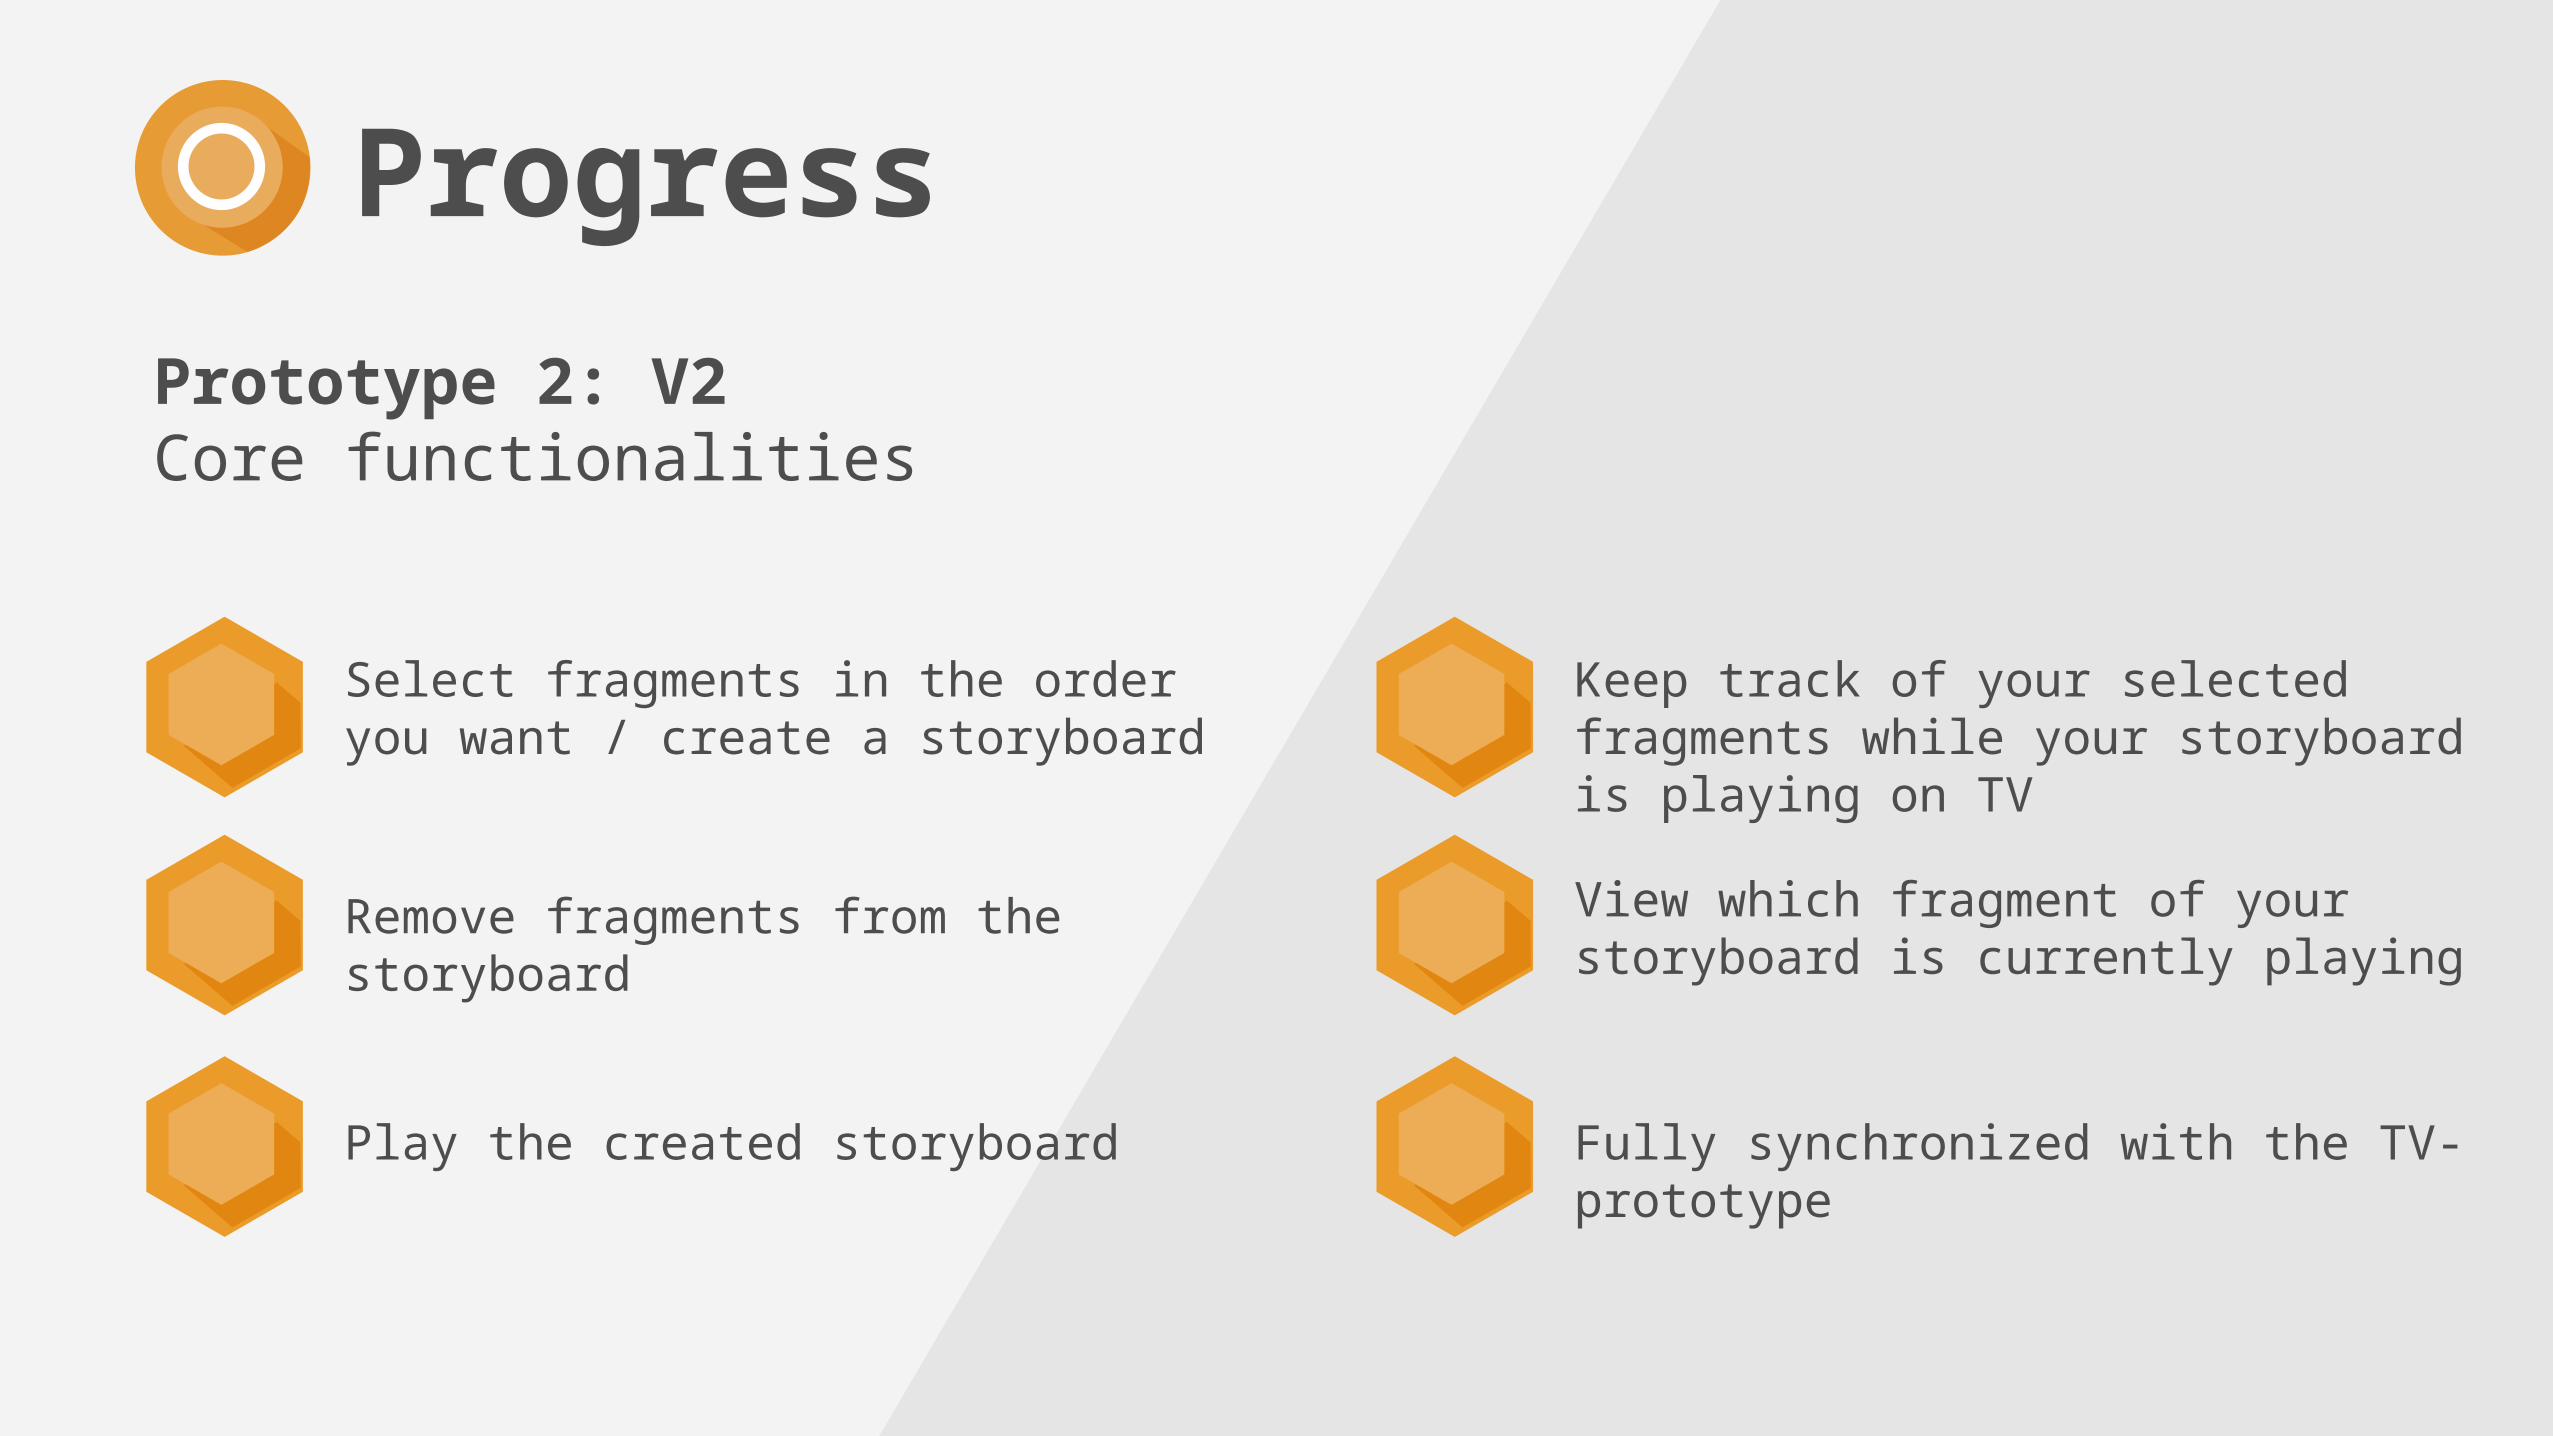
Prototype 2: V2Core functionalities
Select fragments in the order you want / create a storyboard
Progress
Remove fragments from the storyboard
Play the created storyboard
Keep track of your selected fragments while your storyboard is playing on TV
View which fragment of your storyboard is currently playing
Fully synchronized with the TV-prototype
Progress
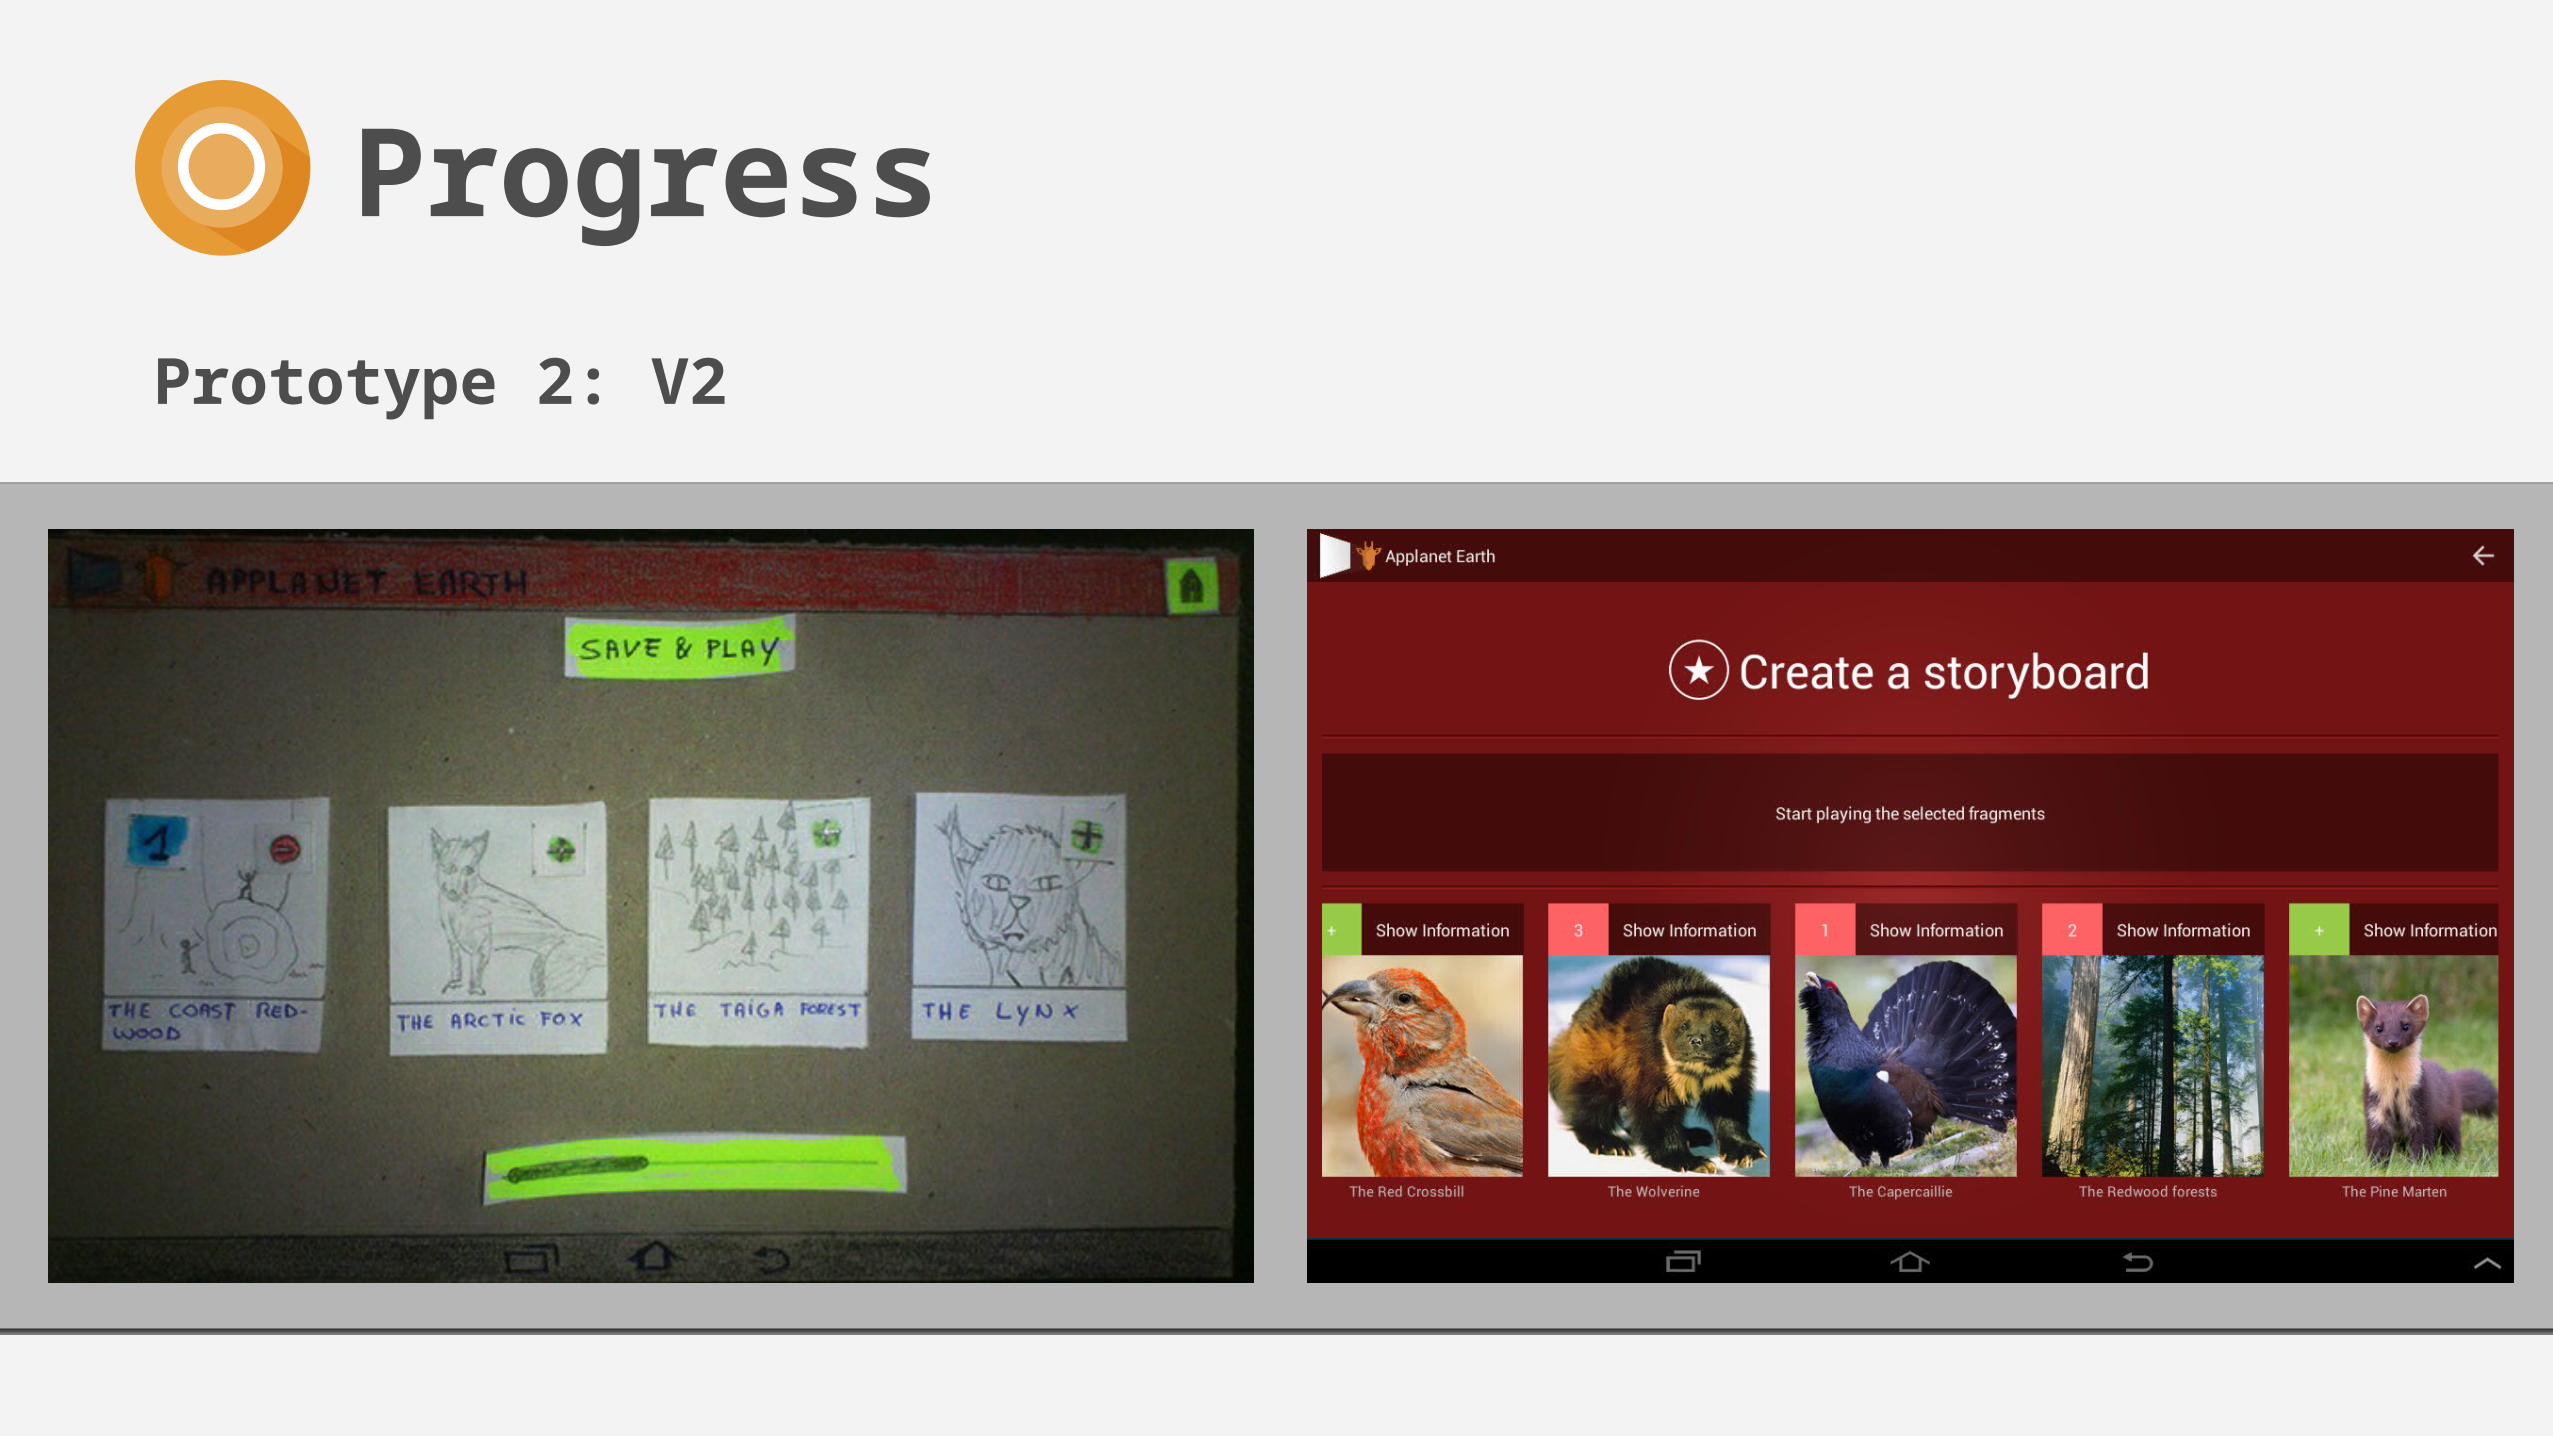
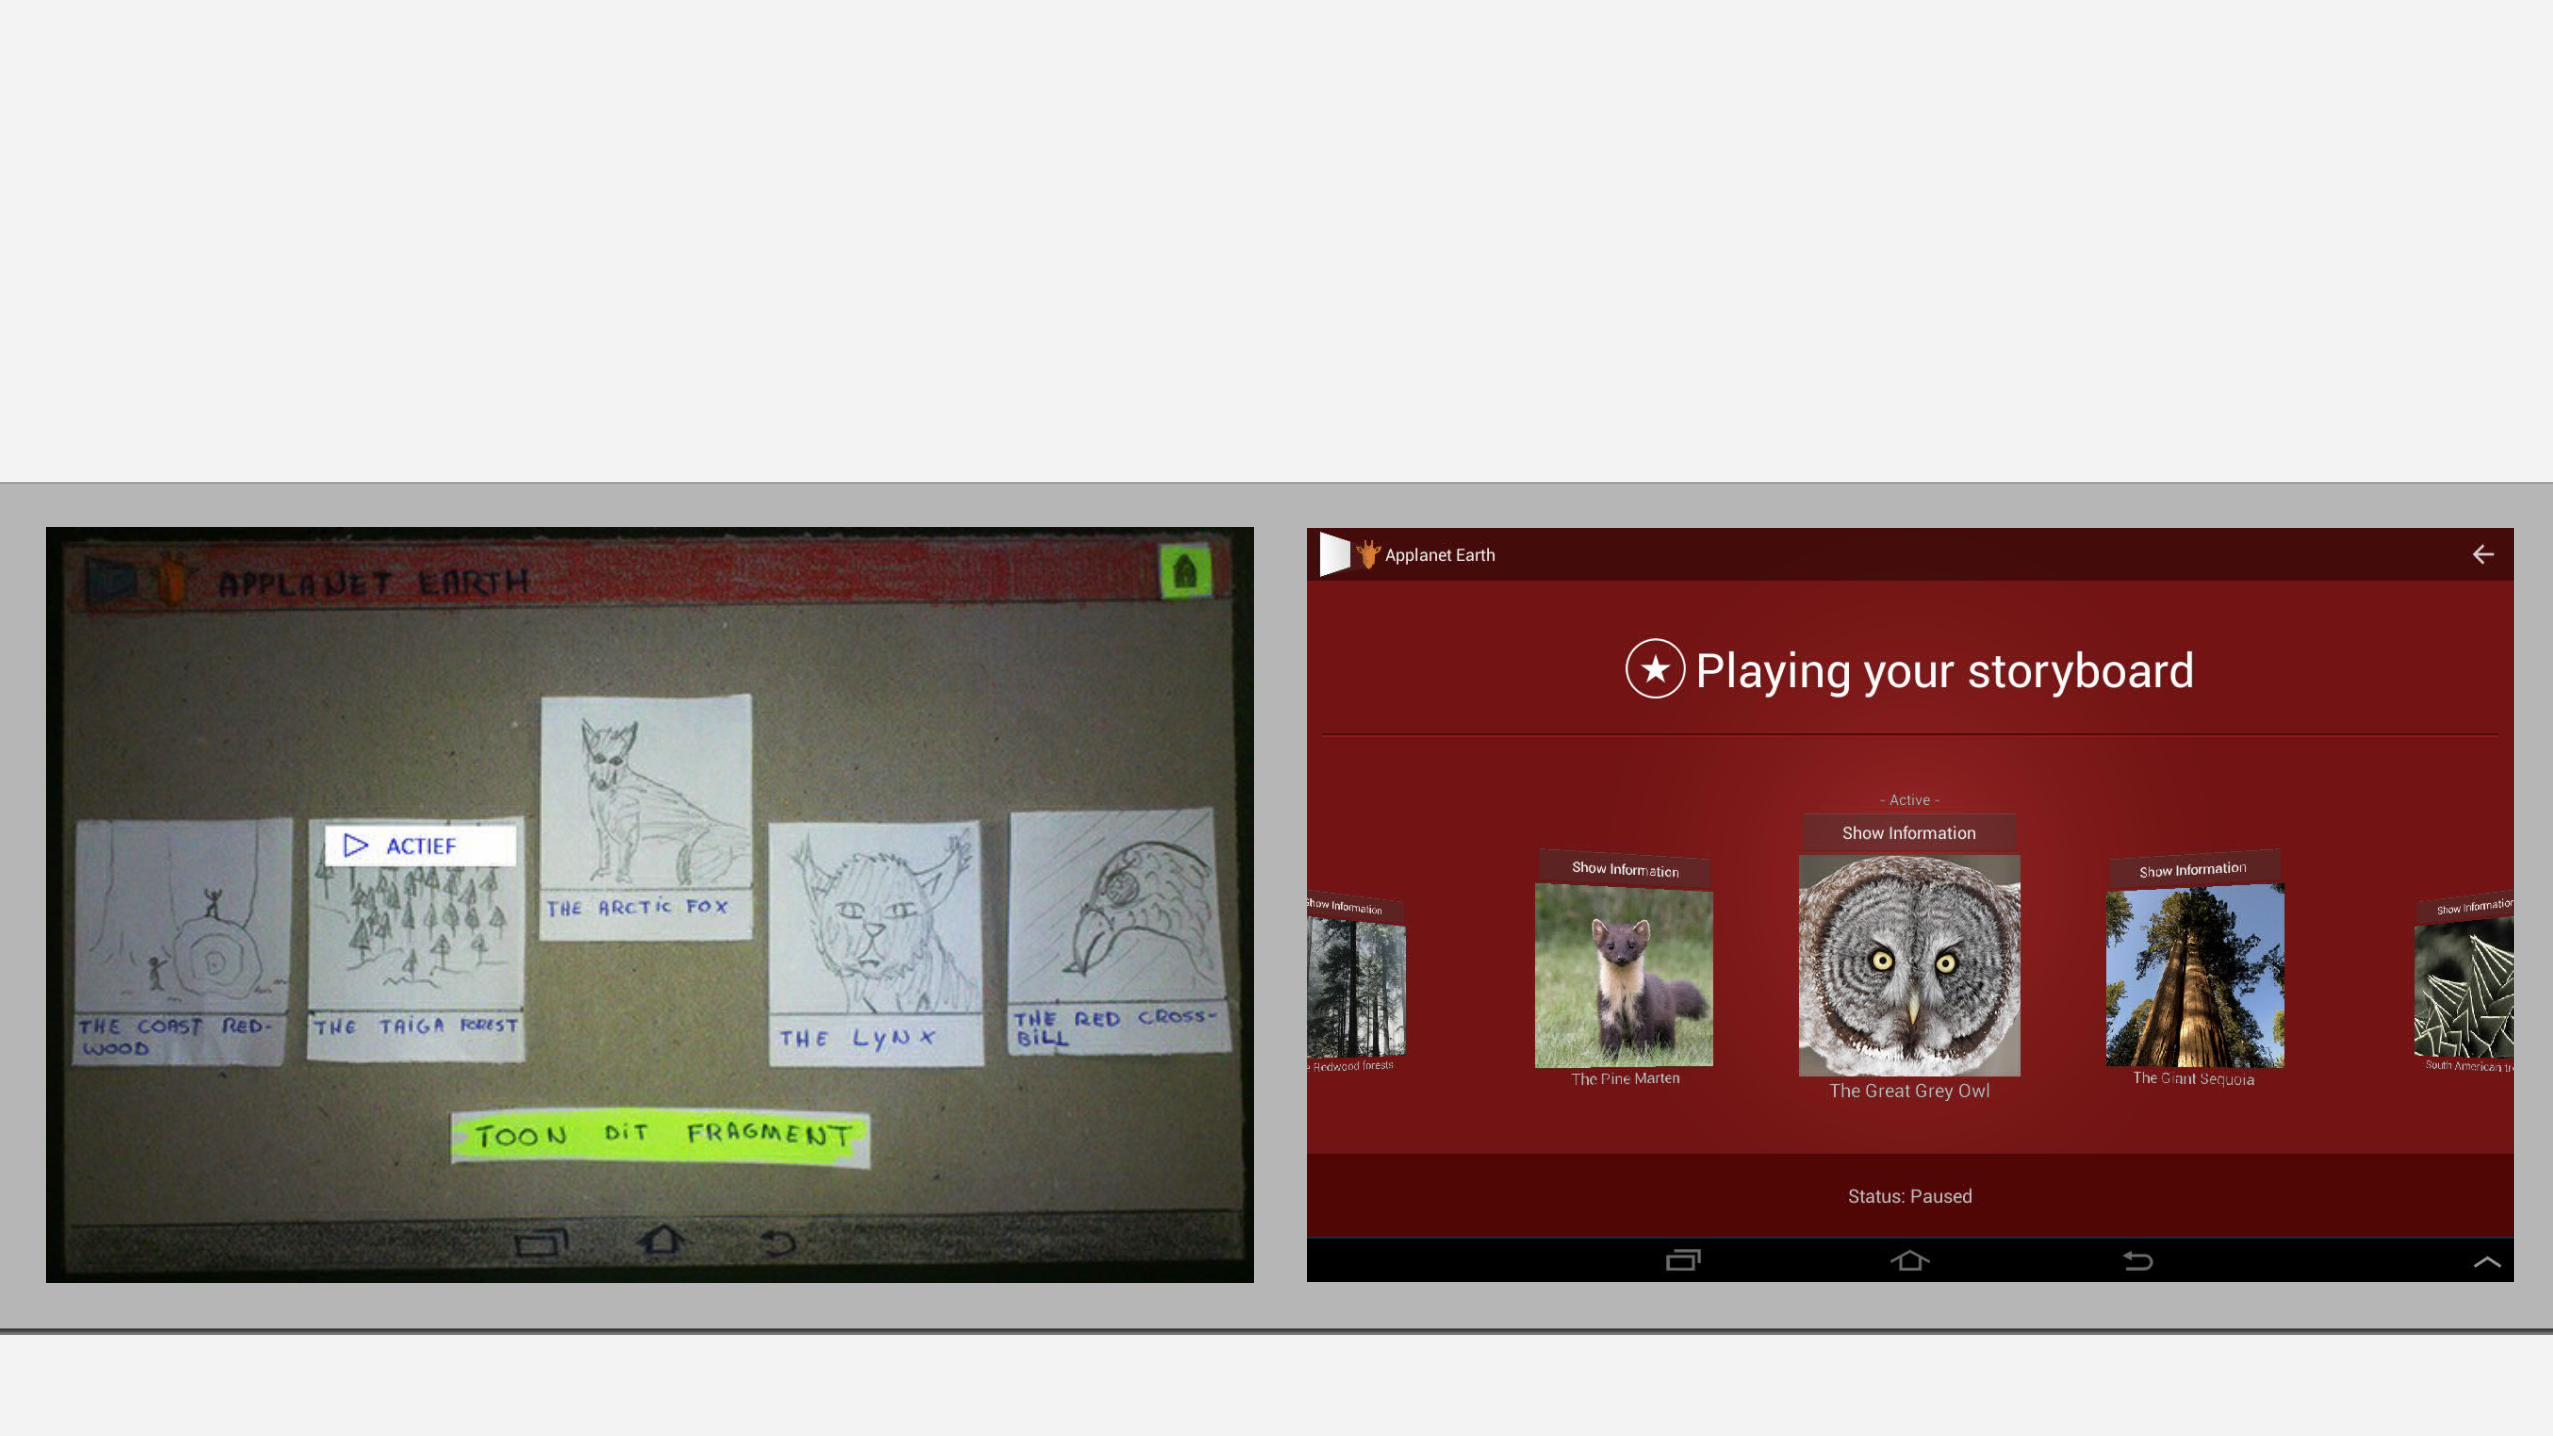
Prototype 2: V2
Prototype 2: V2Evaluation results
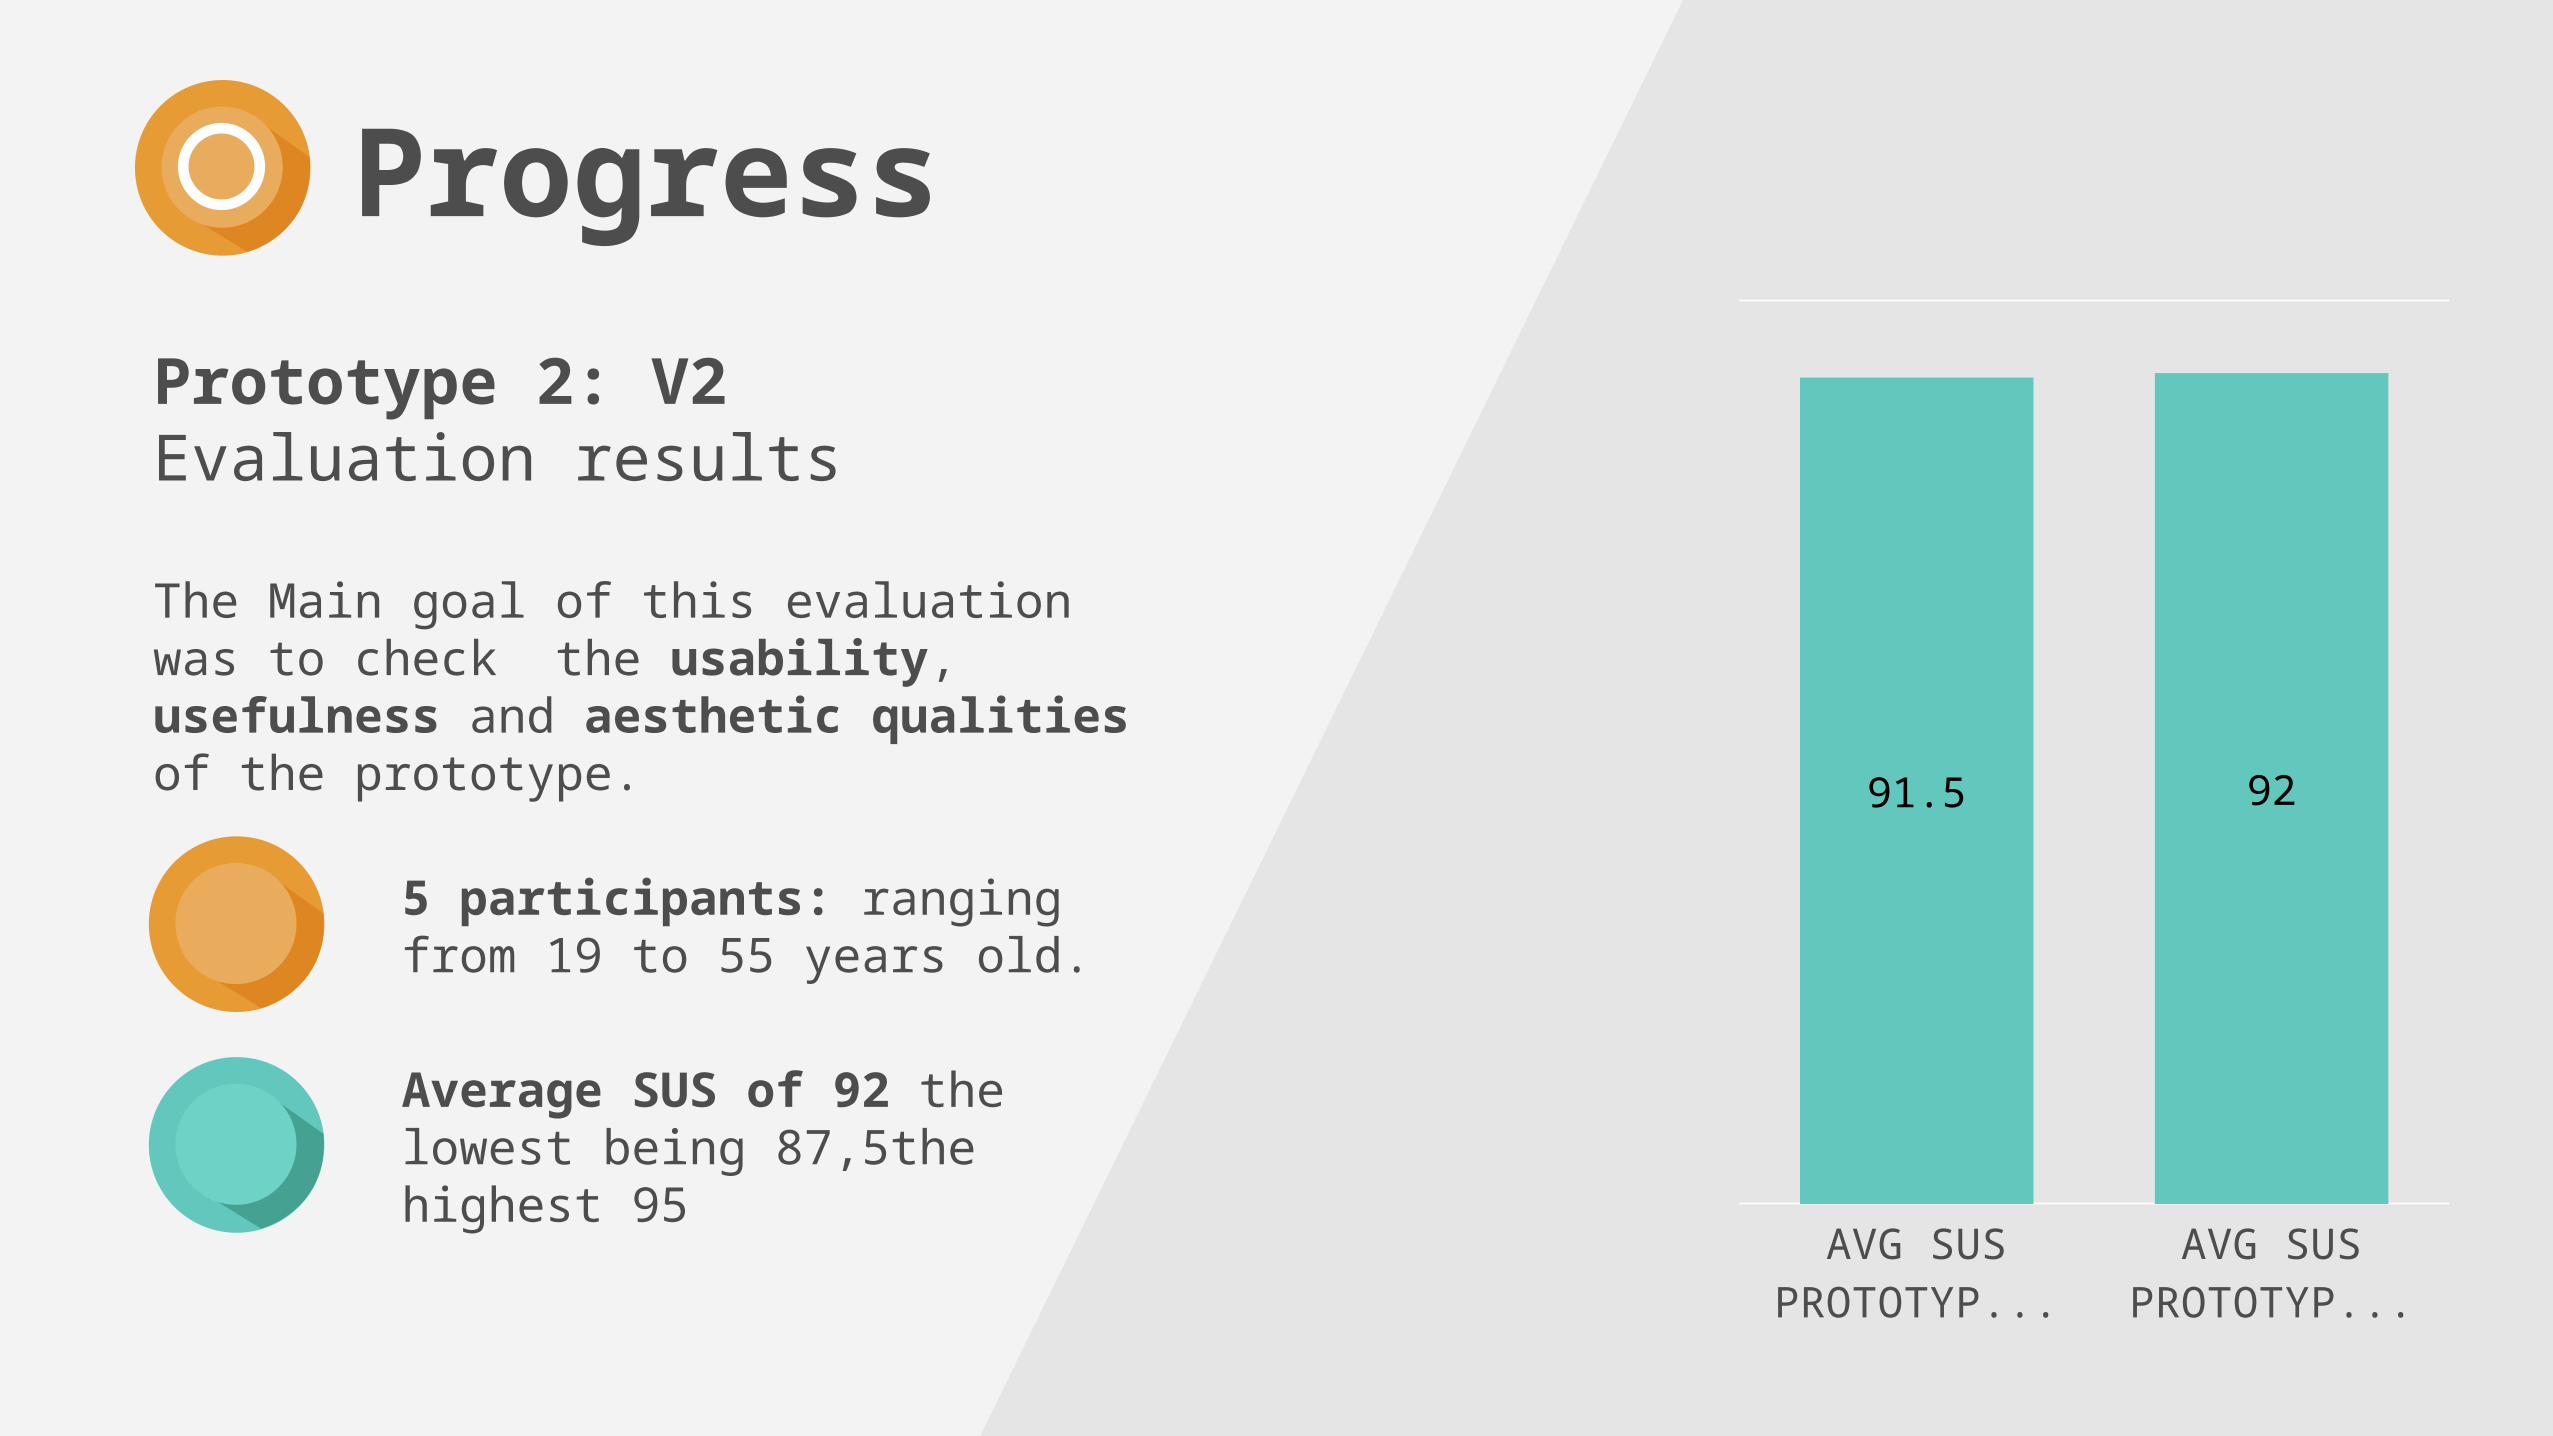
The Main goal of this evaluation was to check the usability, usefulness and aesthetic qualities of the prototype.
5 participants: ranging from 19 to 55 years old.
Average SUS of 92 the lowest being 87,5the highest 95
Progress
AVG SUS PROTOTYPE 2
- V1
AVG SUS PROTOTYPE 2
- V2
91.5 92
Progress
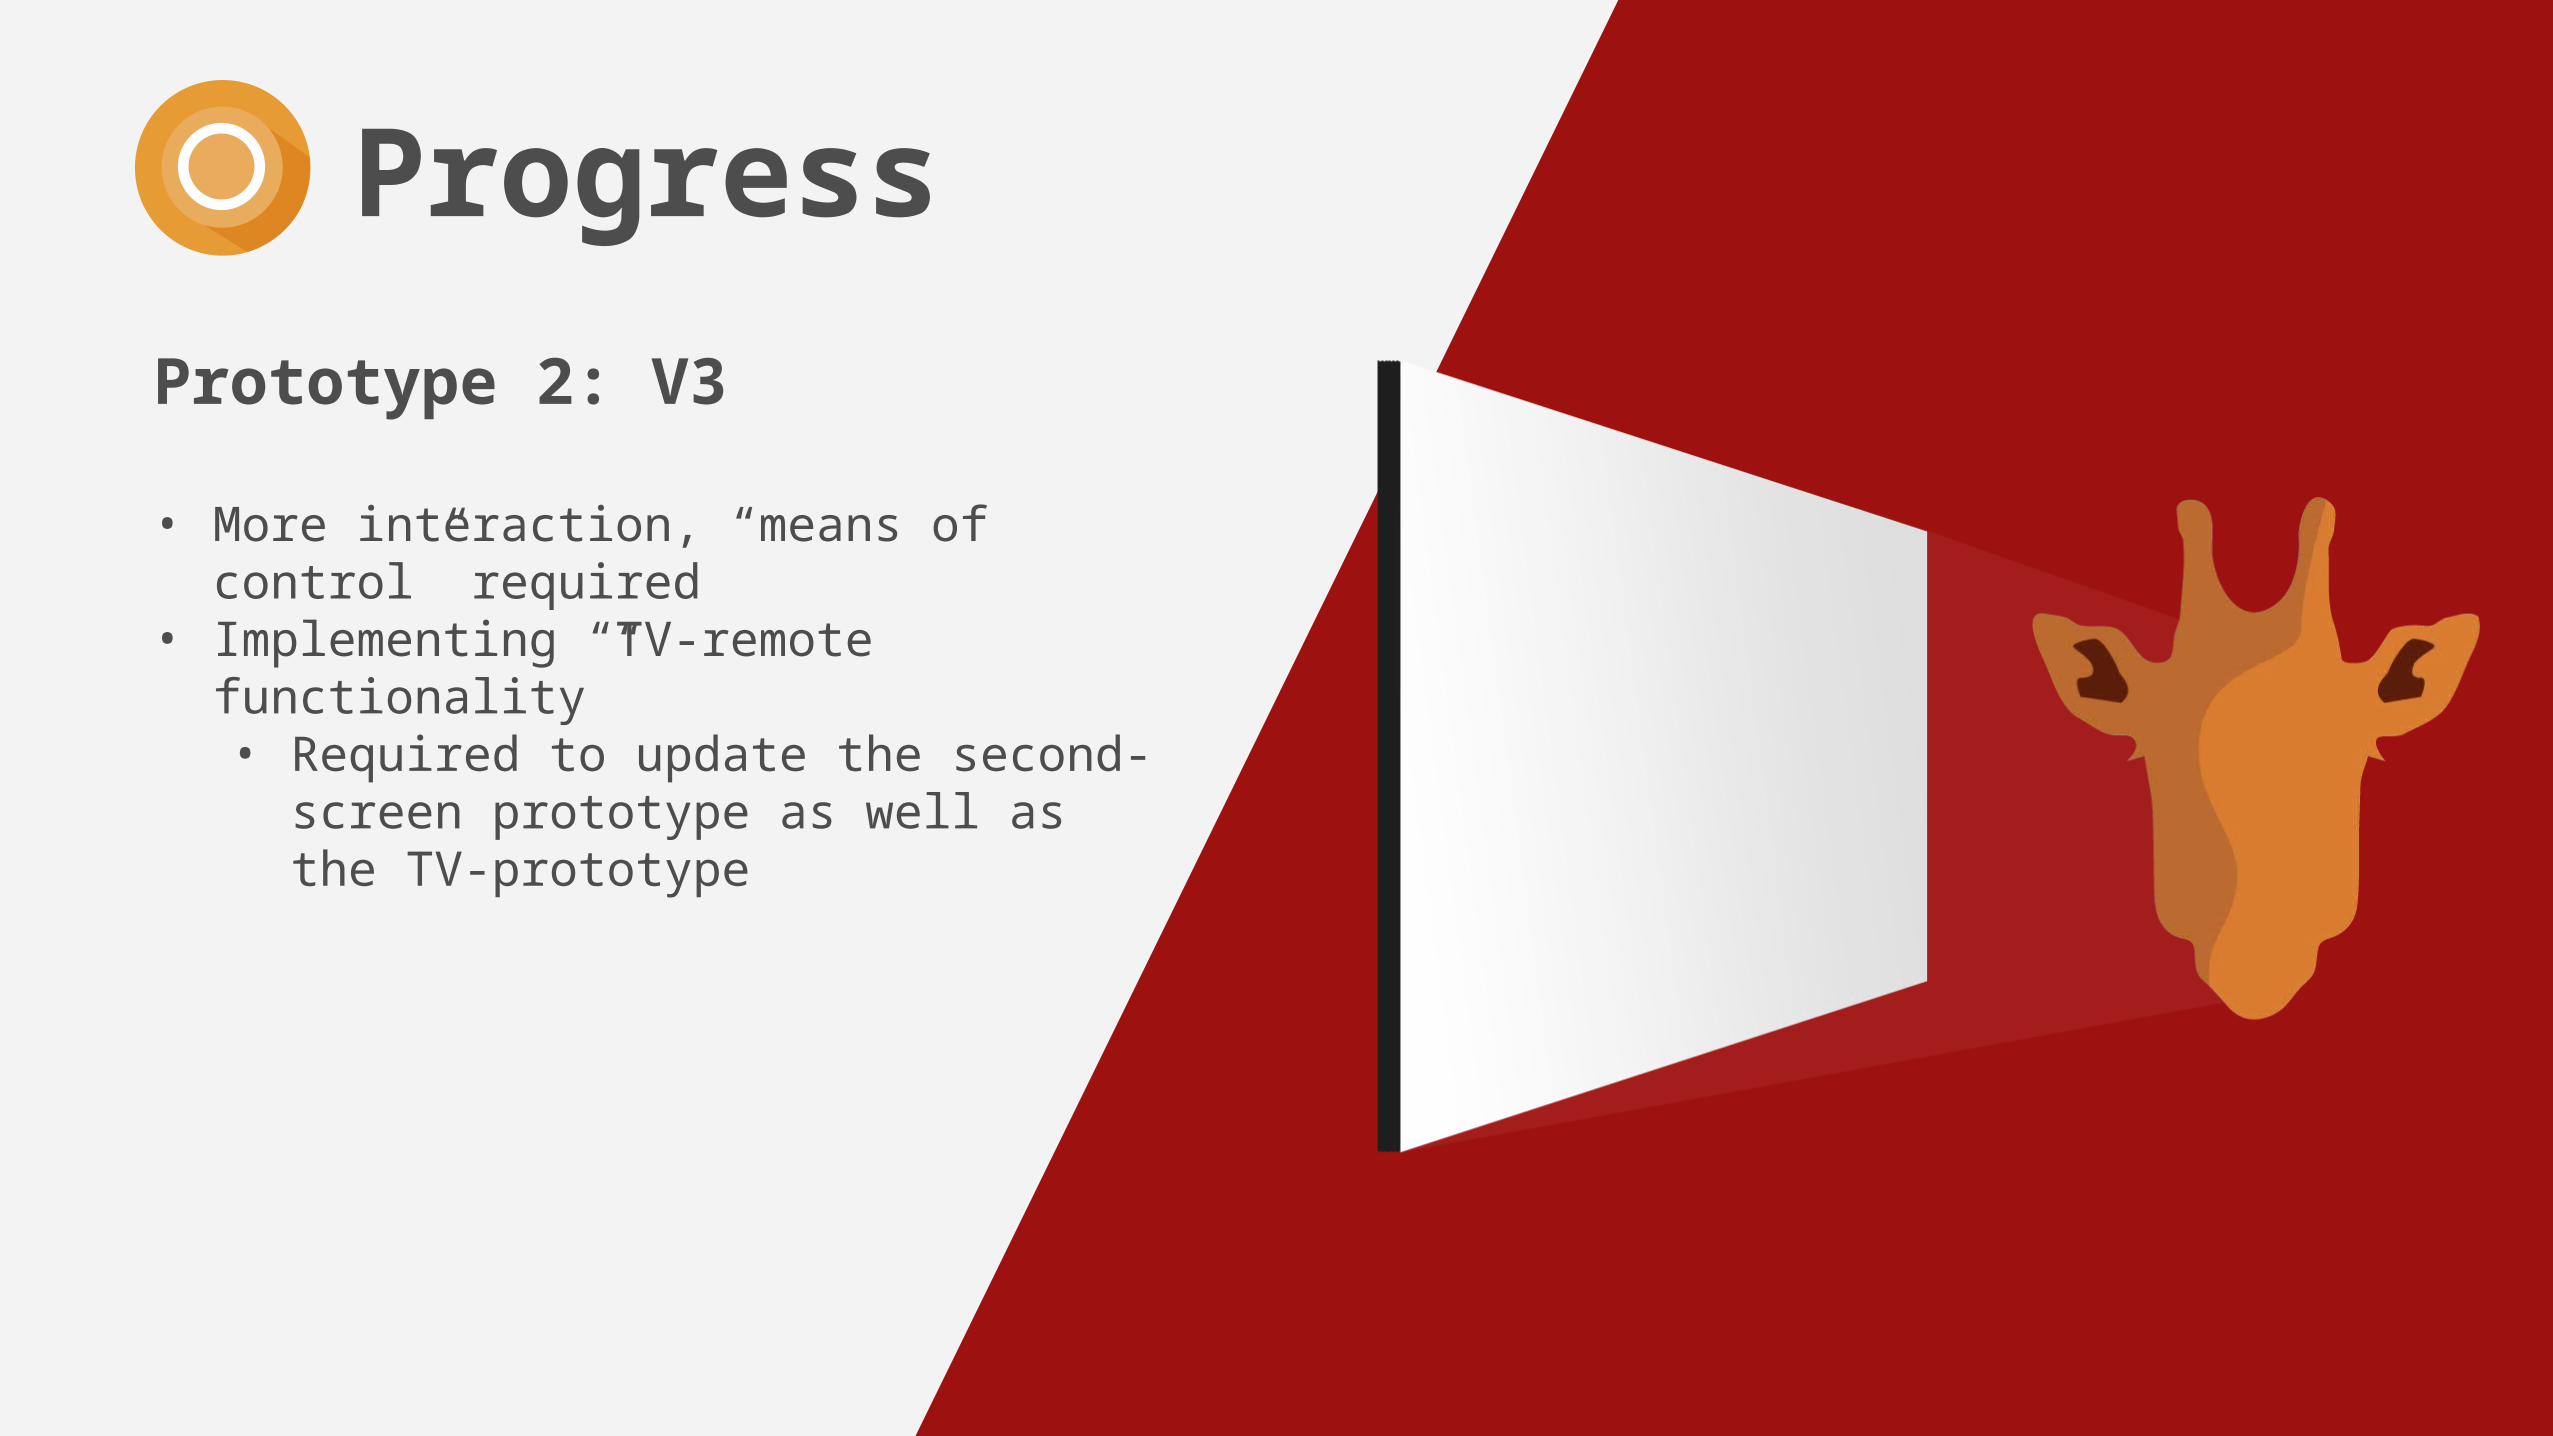
Prototype 2: V3
• More interaction, “means of control” required
• Implementing “TV-remote functionality”• Required to update the second-
screen prototype as well as the TV-prototype
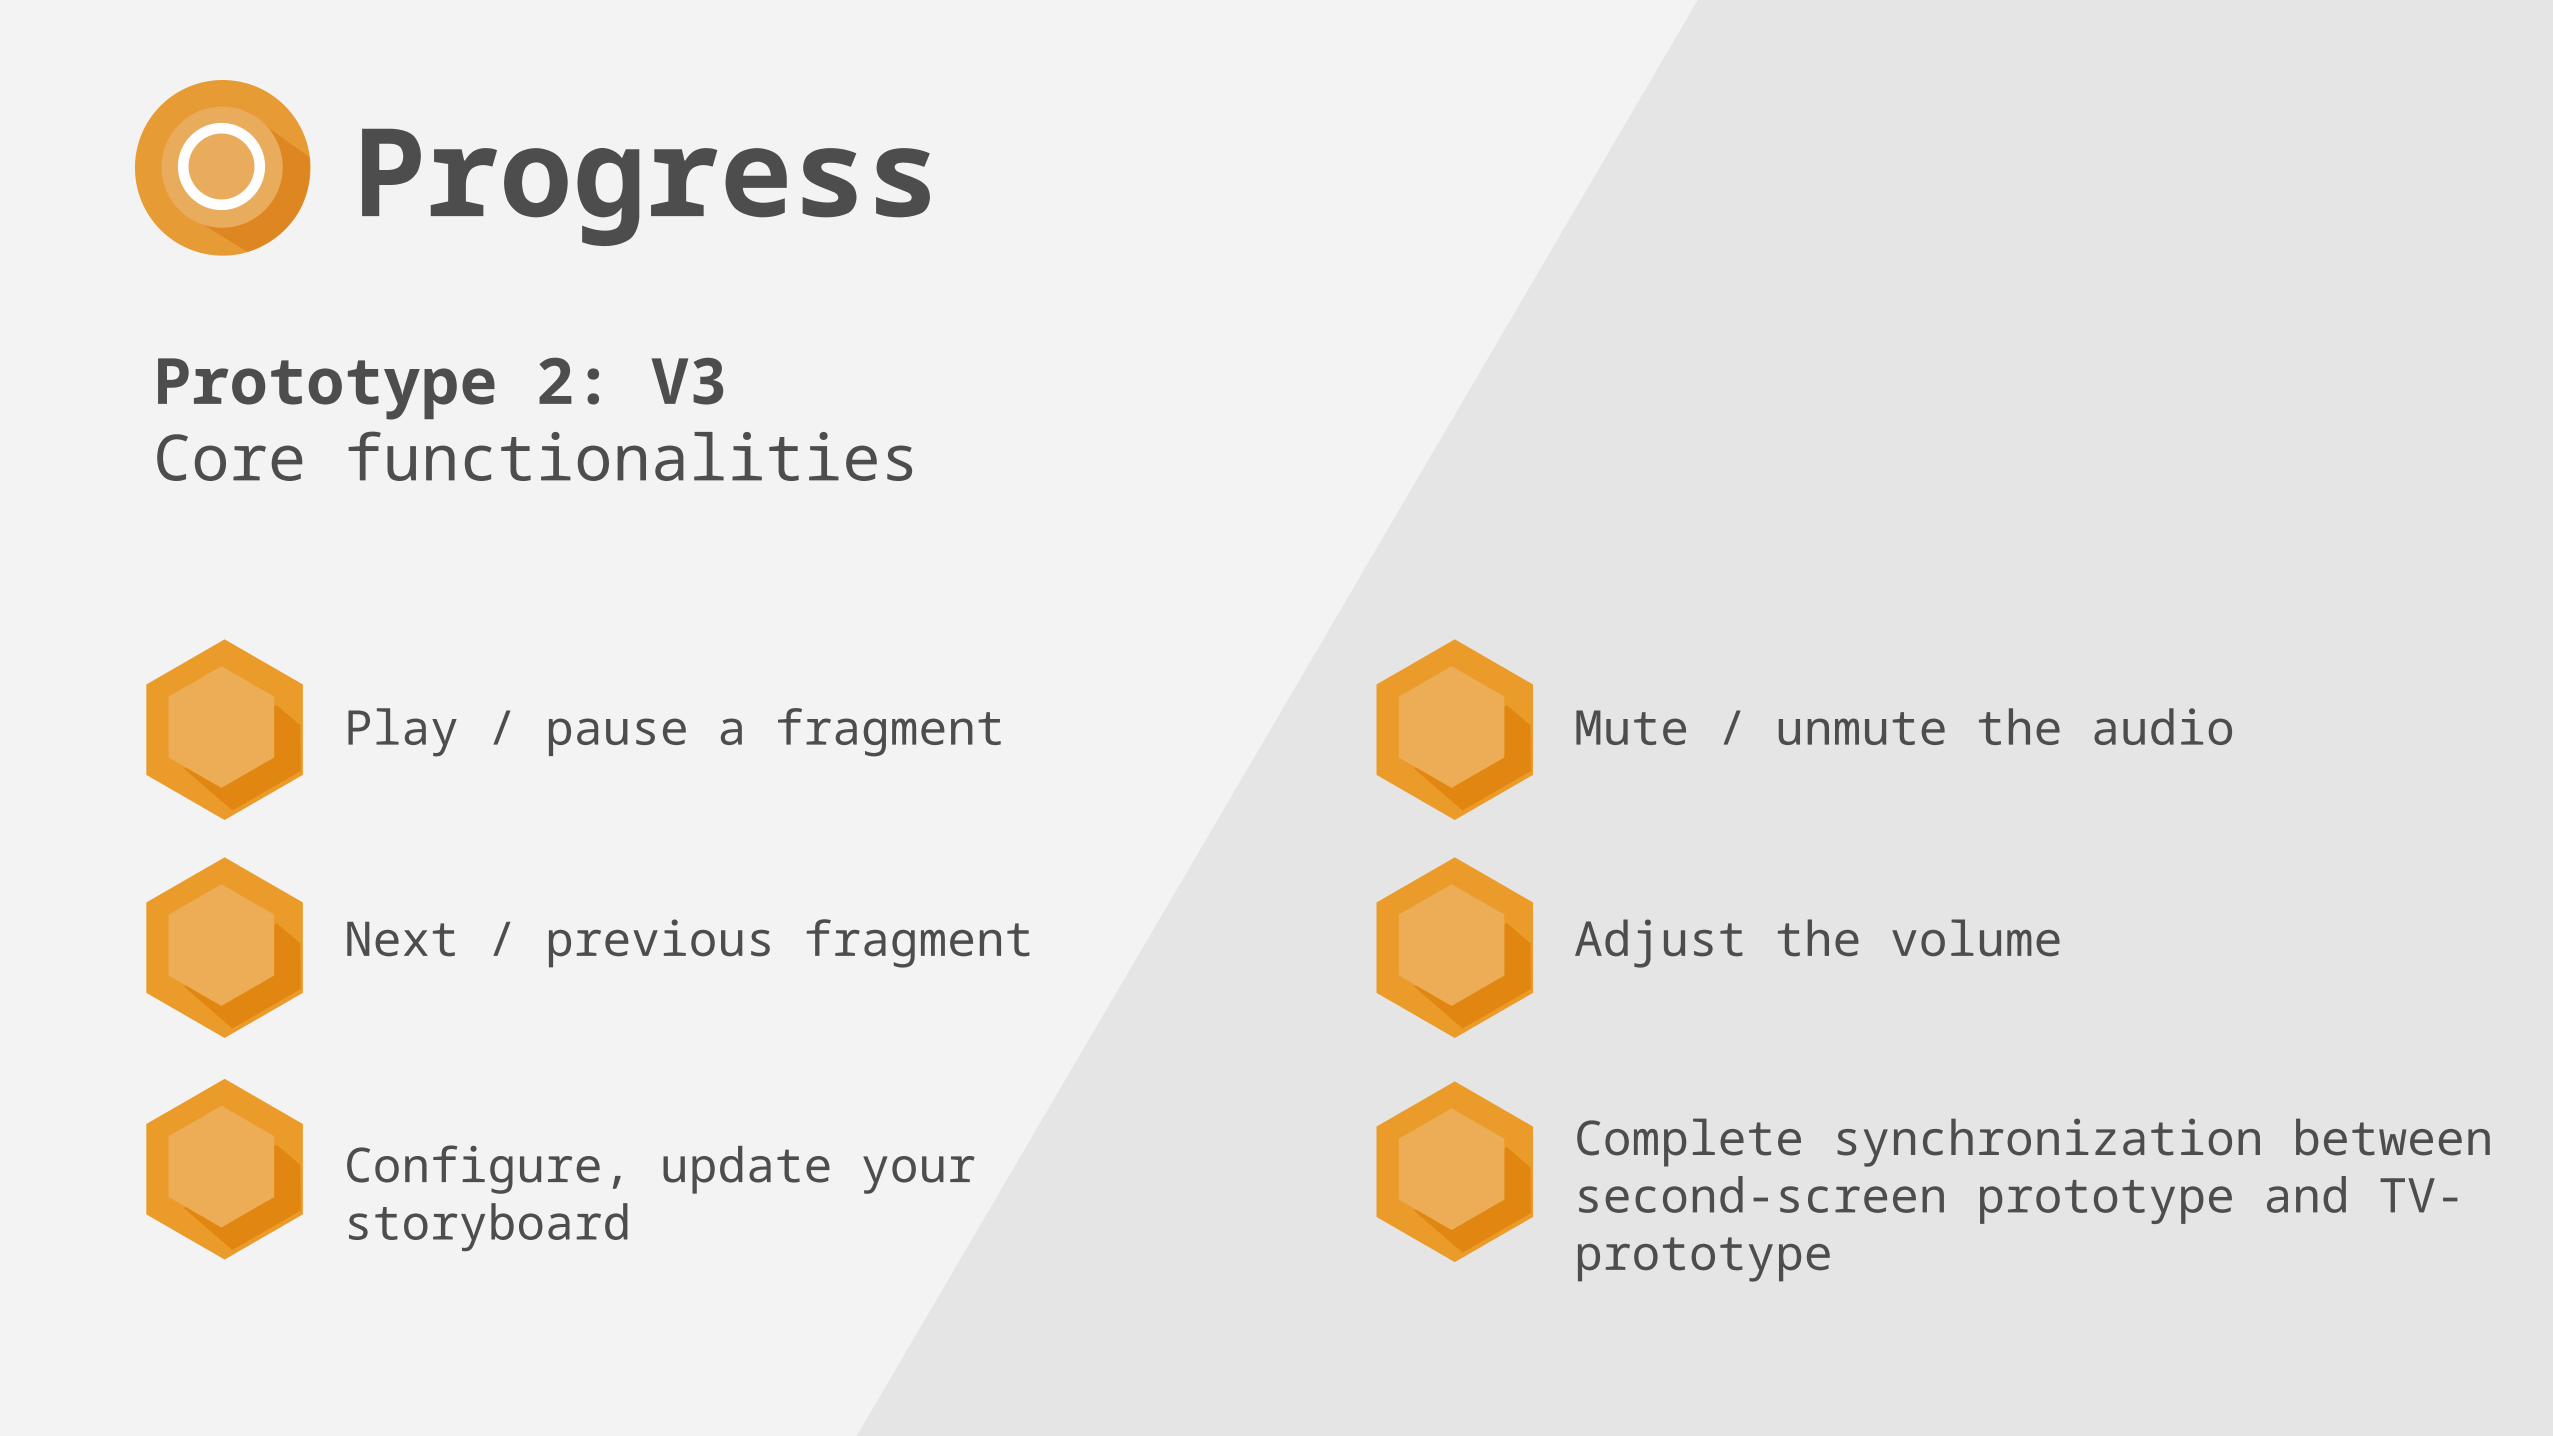
Prototype 2: V3Core functionalities
Play / pause a fragment
Progress
Next / previous fragment
Configure, update your storyboard
Mute / unmute the audio
Adjust the volume
Complete synchronization between second-screen prototype and TV-prototype
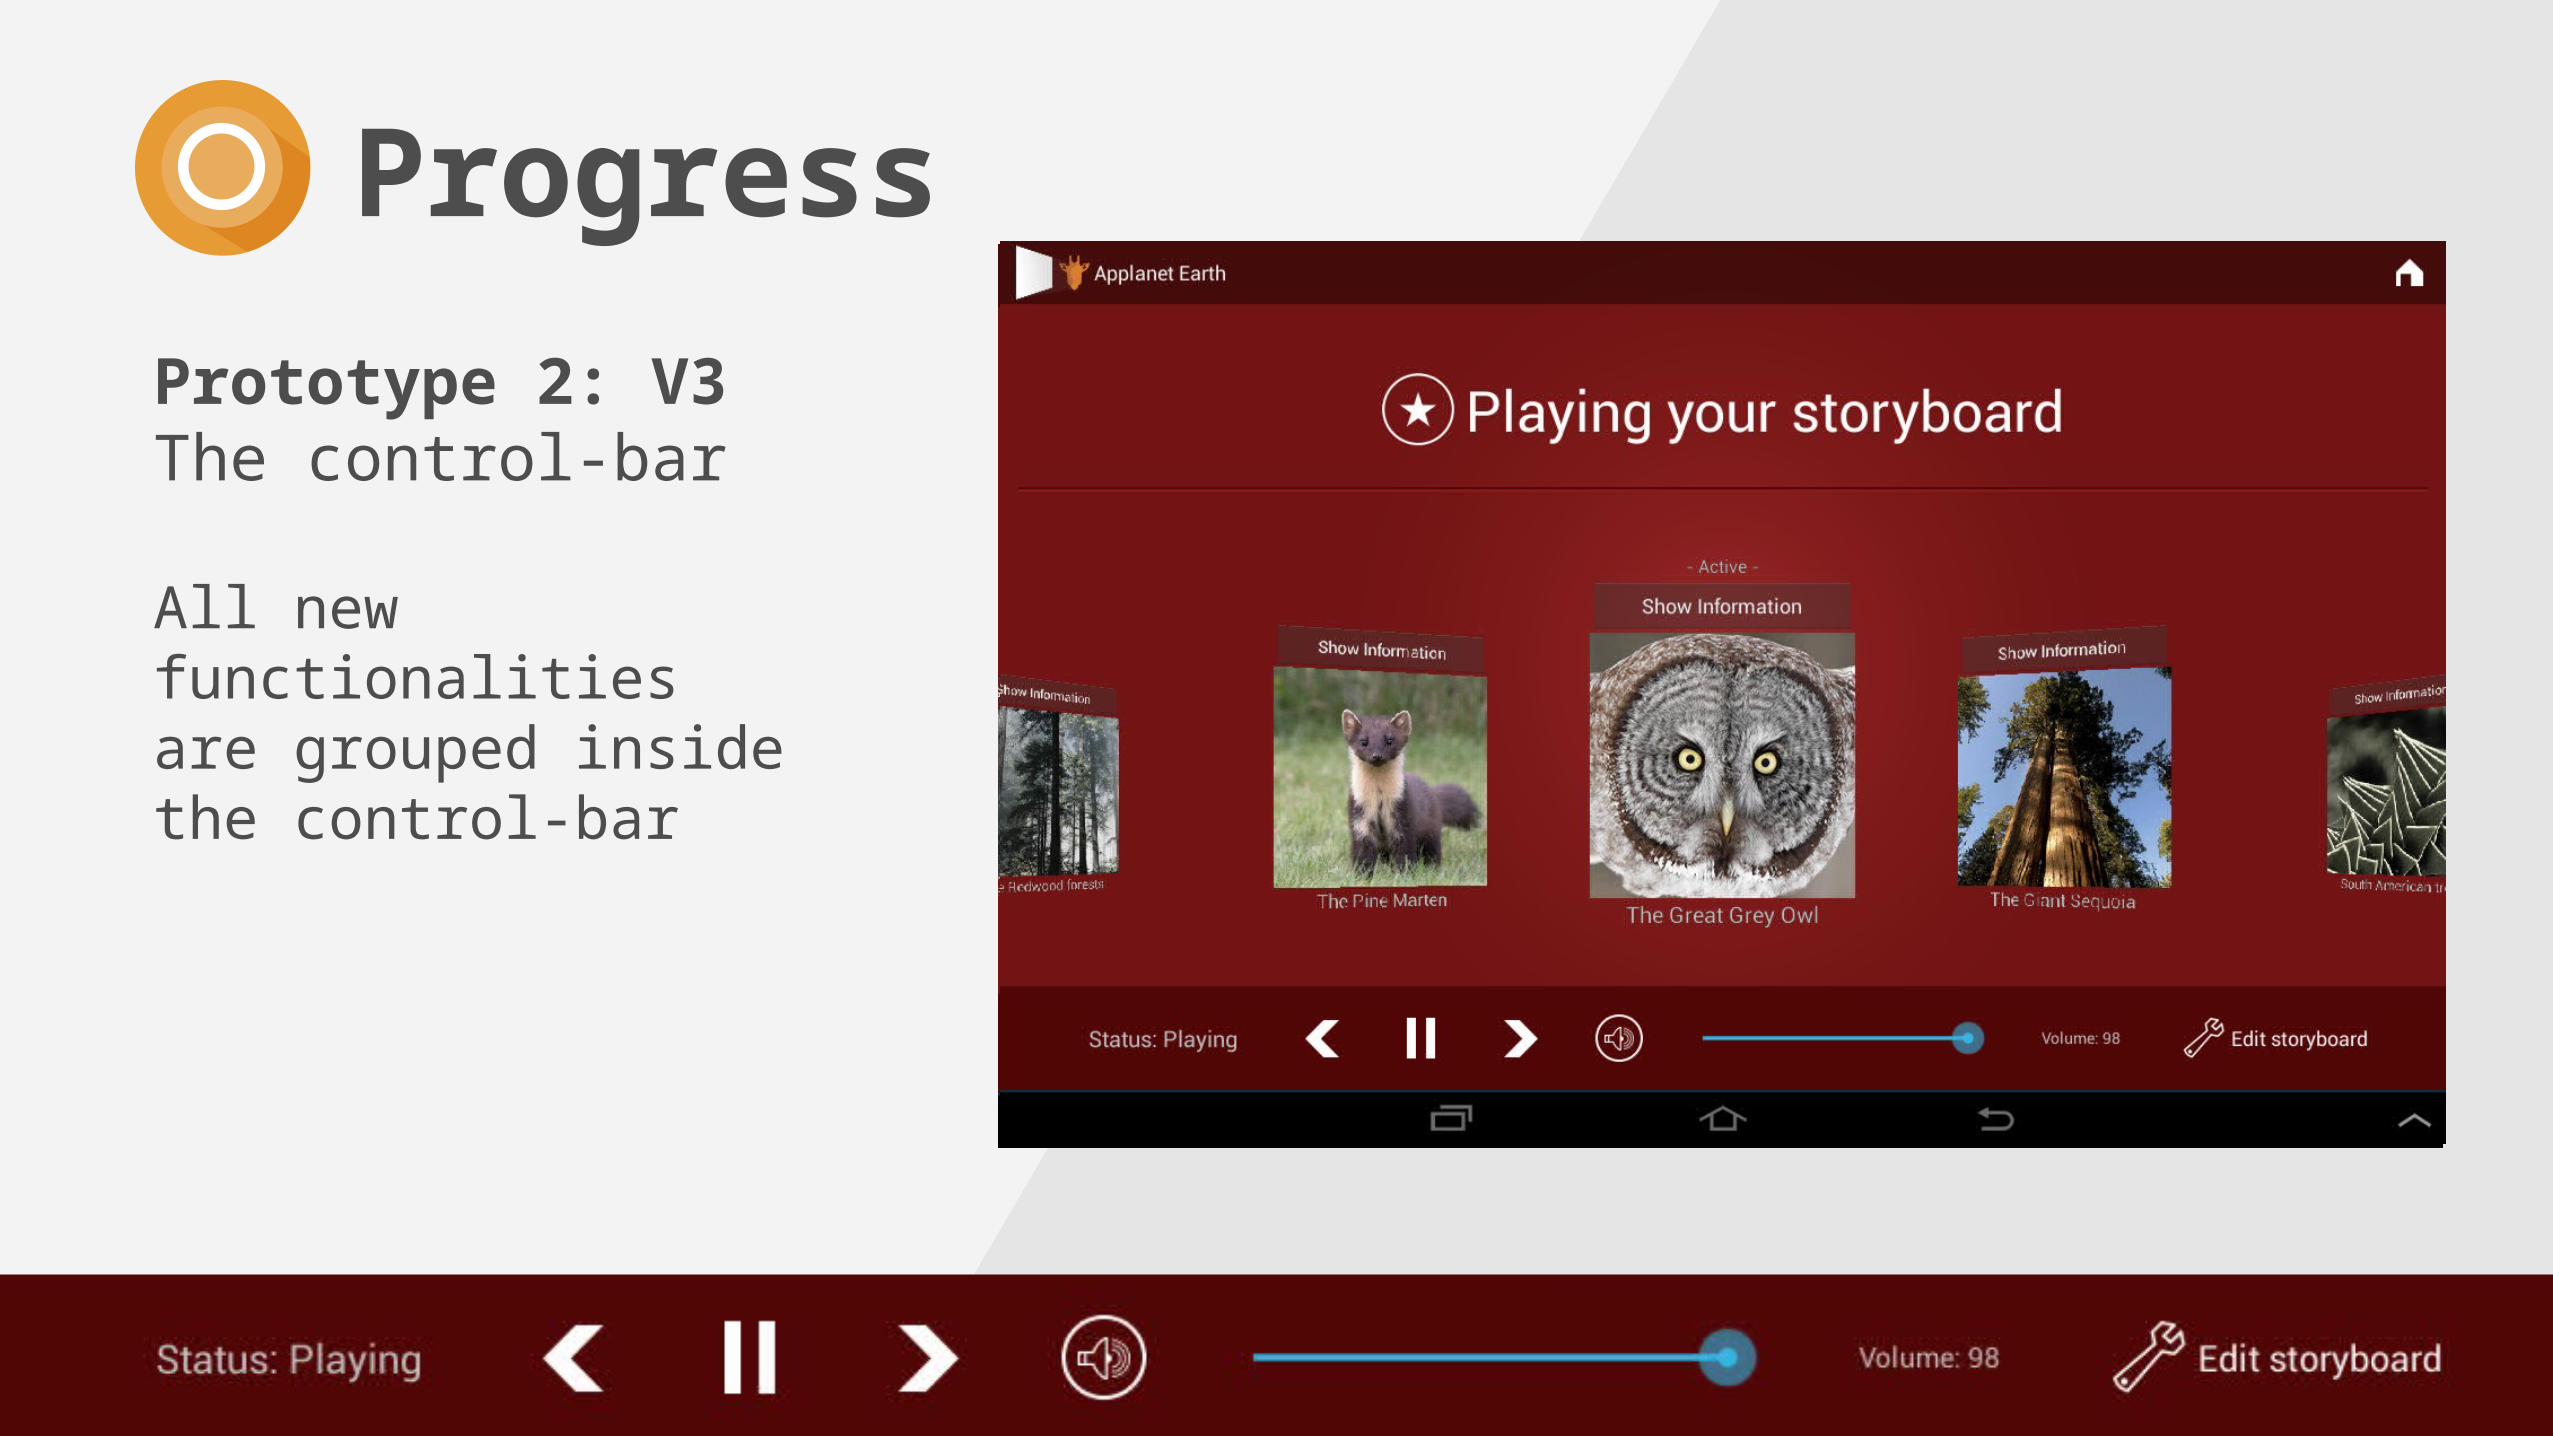
Prototype 2: V3The control-bar
All new functionalities are grouped inside the control-bar
Progress
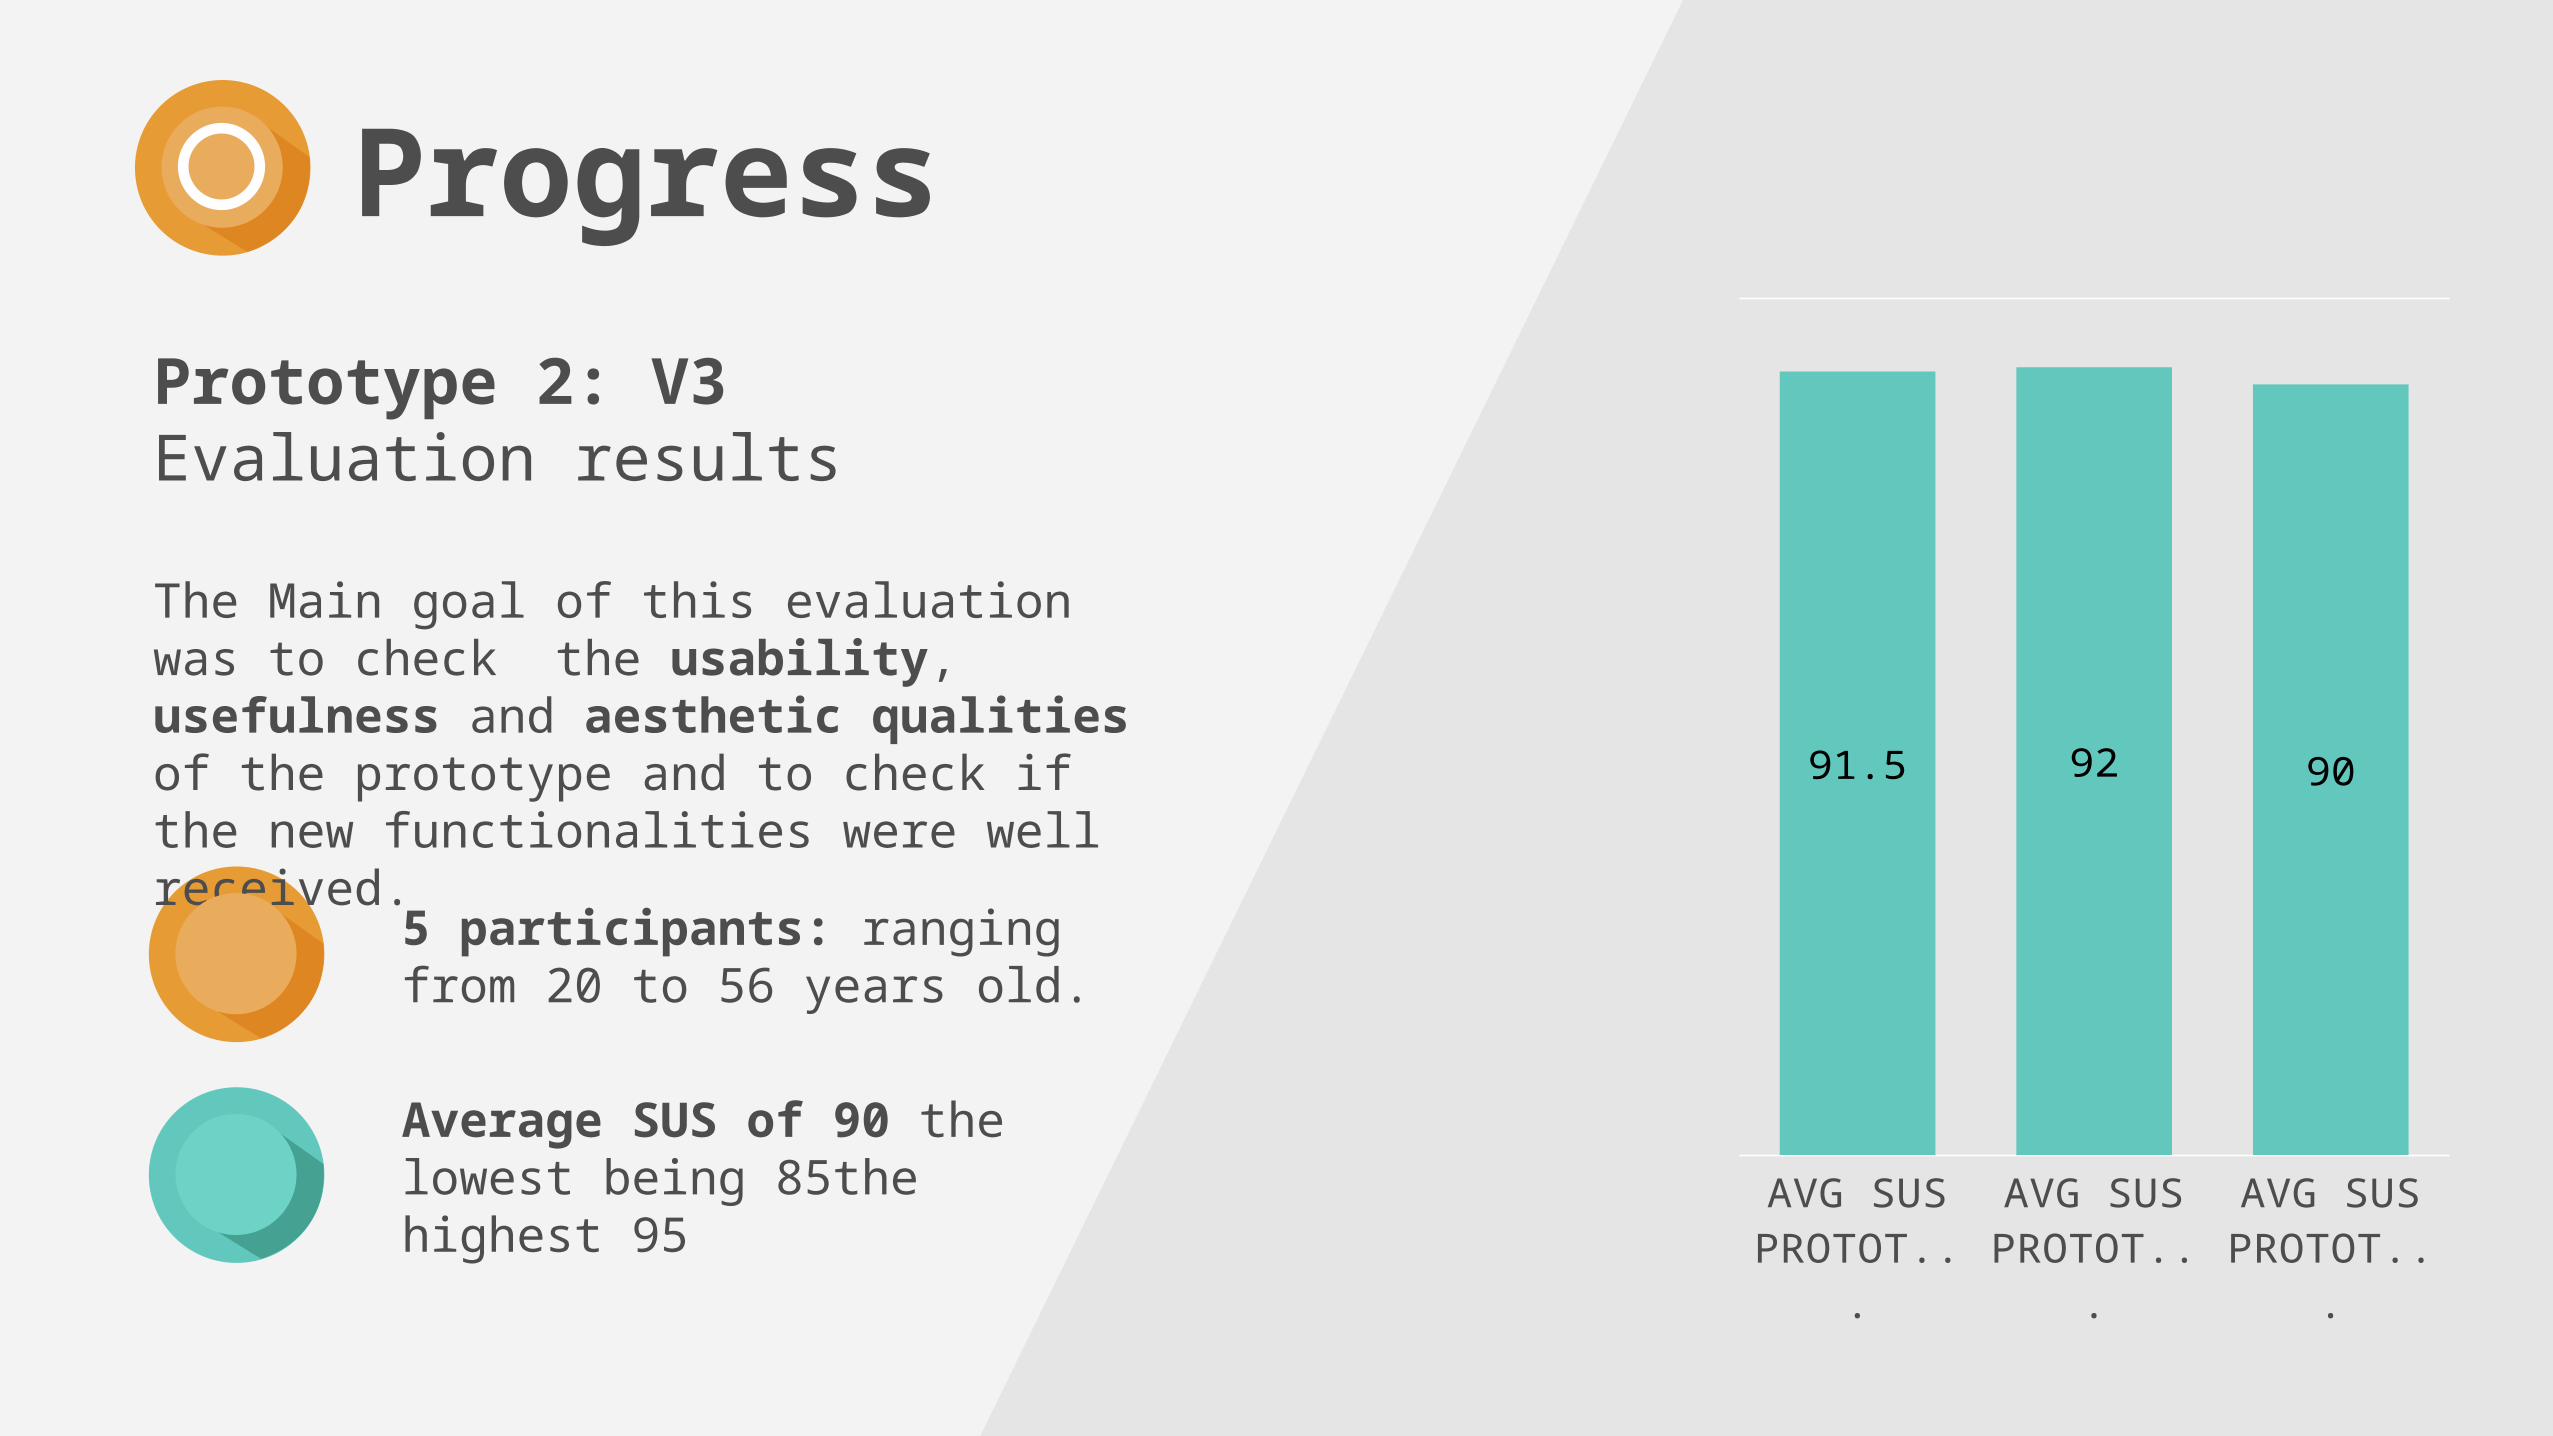
Prototype 2: V3Evaluation results
The Main goal of this evaluation was to check the usability, usefulness and aesthetic qualities of the prototype and to check if the new functionalities were well received.
5 participants: ranging from 20 to 56 years old.
Average SUS of 90 the lowest being 85the highest 95
Progress
AVG SUS PROTO-TYPE 2 -
V1
AVG SUS PROTO-TYPE 2 -
V2
AVG SUS PROTO-TYPE 2 -
V3
91.5 92 90
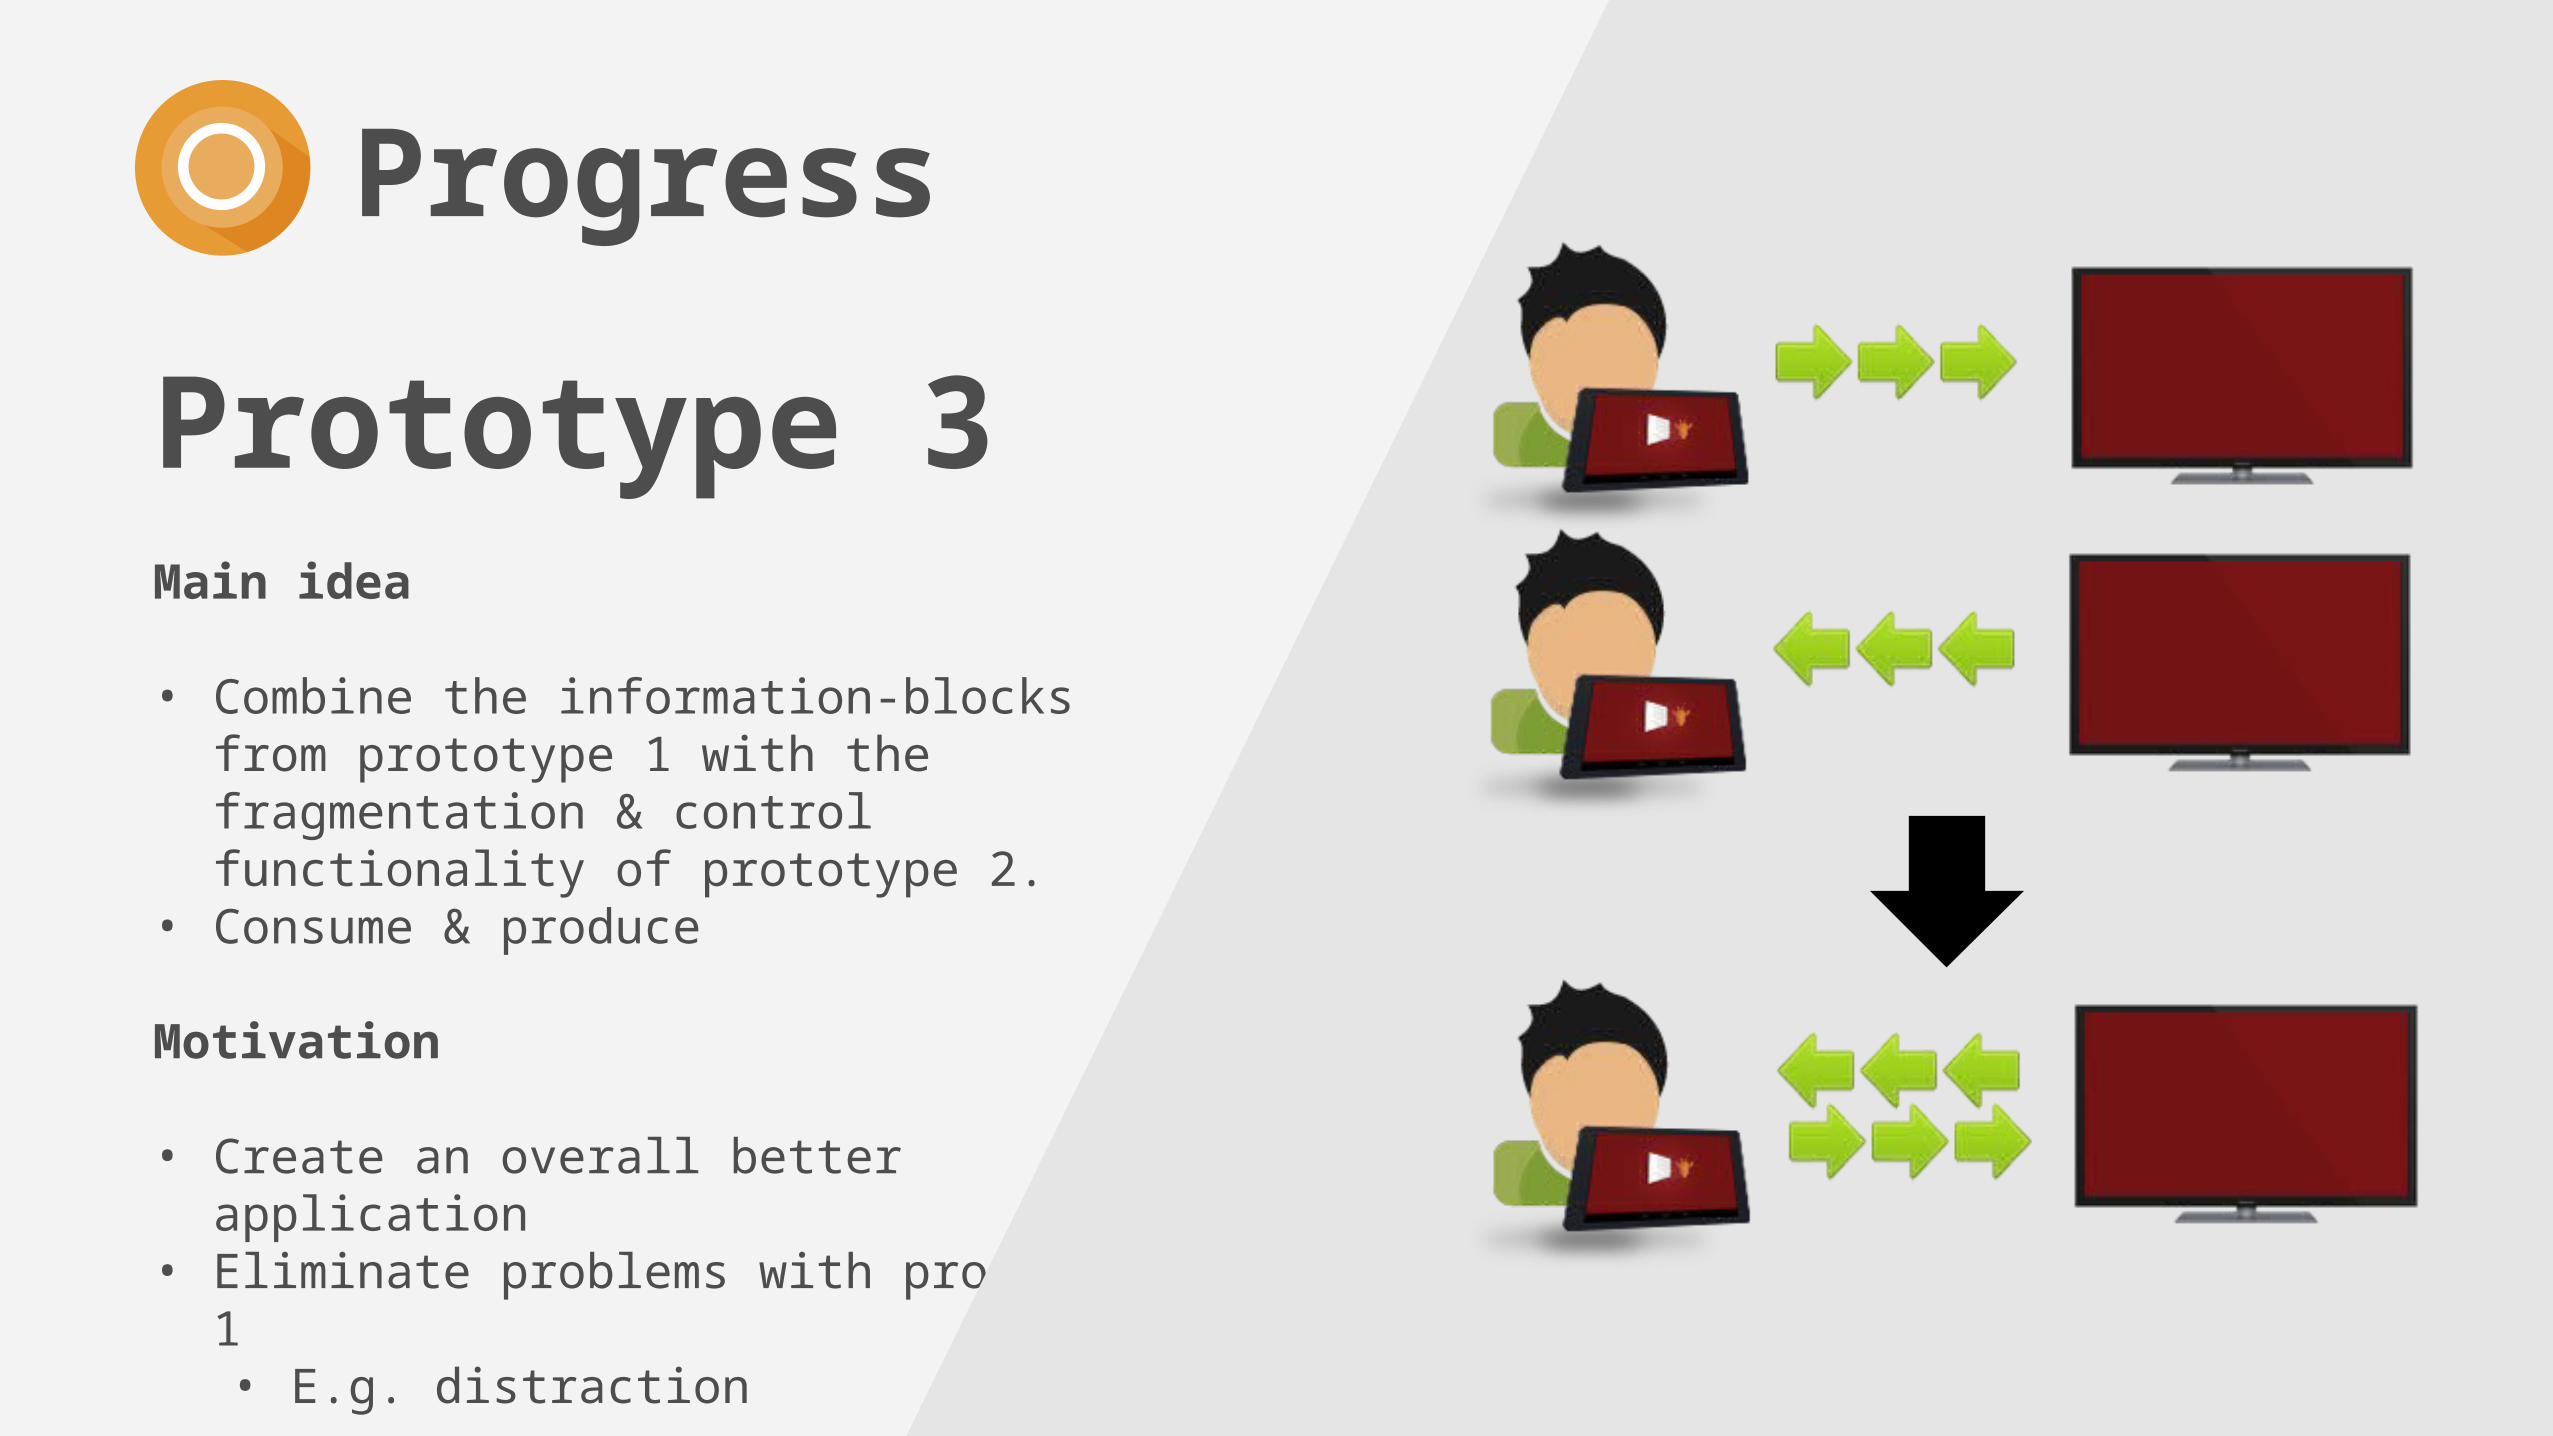
Prototype 3Main idea
• Combine the information-blocks from prototype 1 with the fragmentation & control functionality of prototype 2.
• Consume & produce
Motivation
• Create an overall better application• Eliminate problems with prototype 1
• E.g. distraction
Progress
Progress
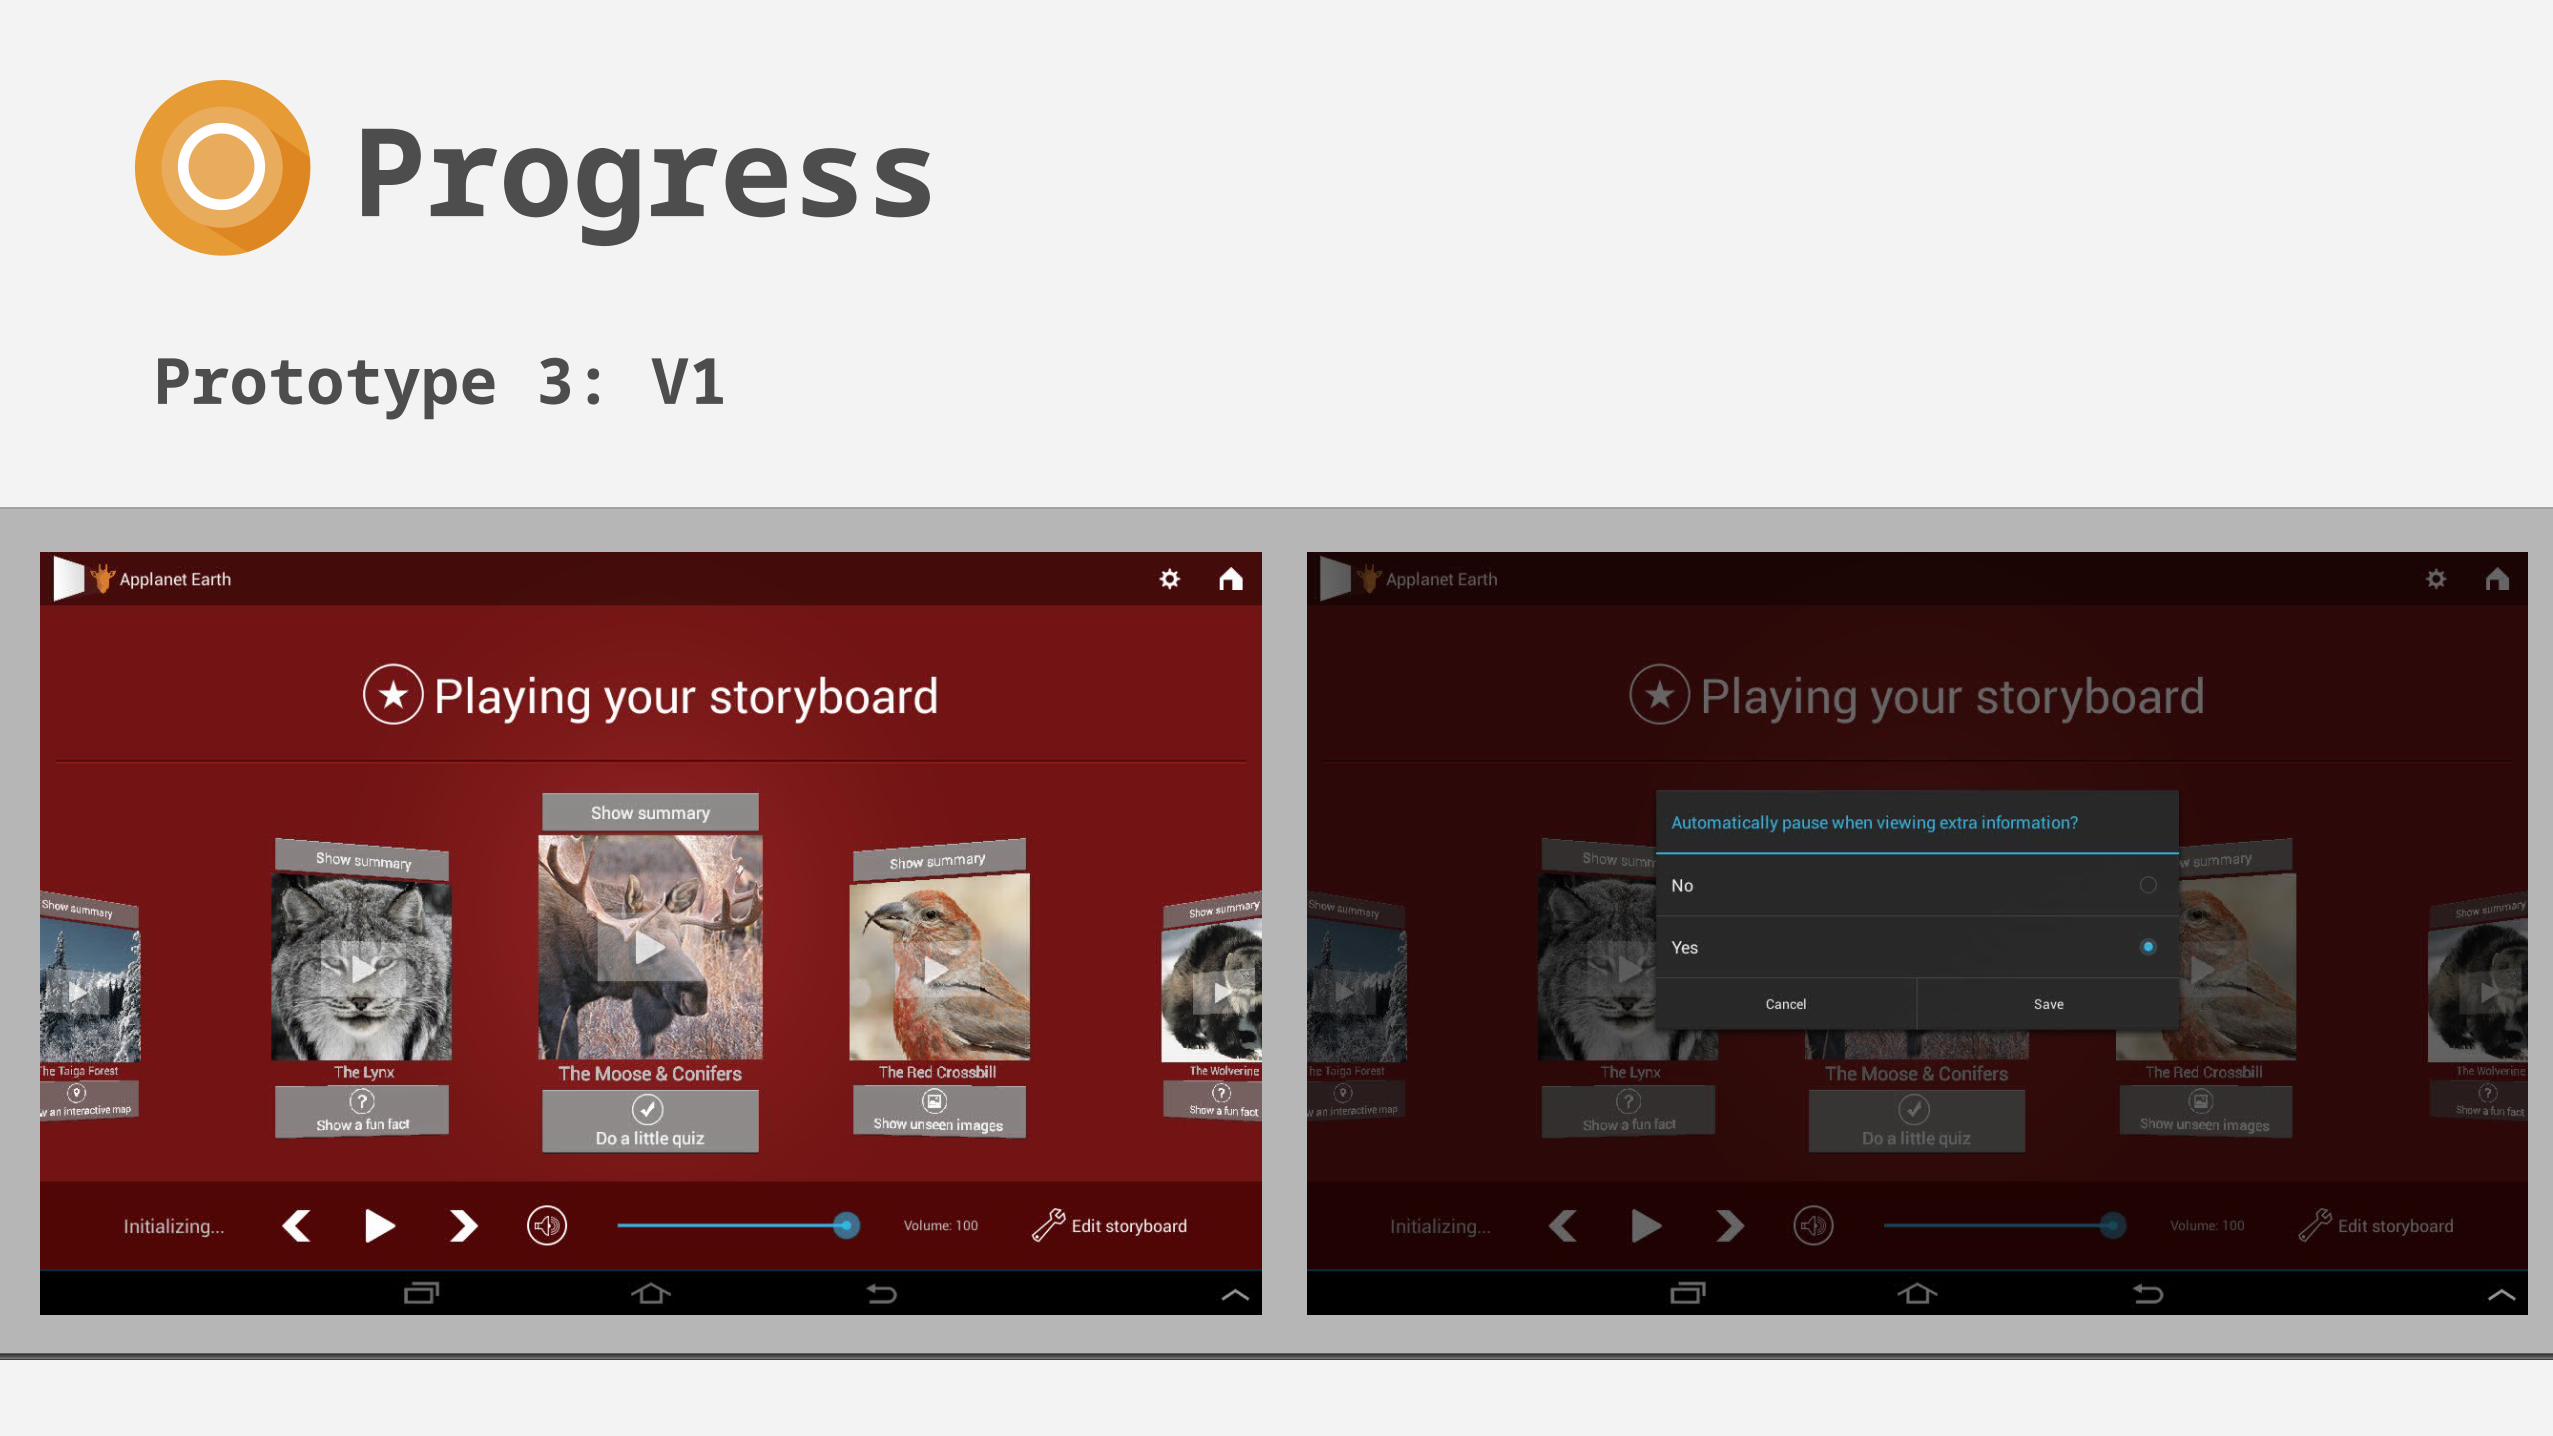
Prototype 3: V1
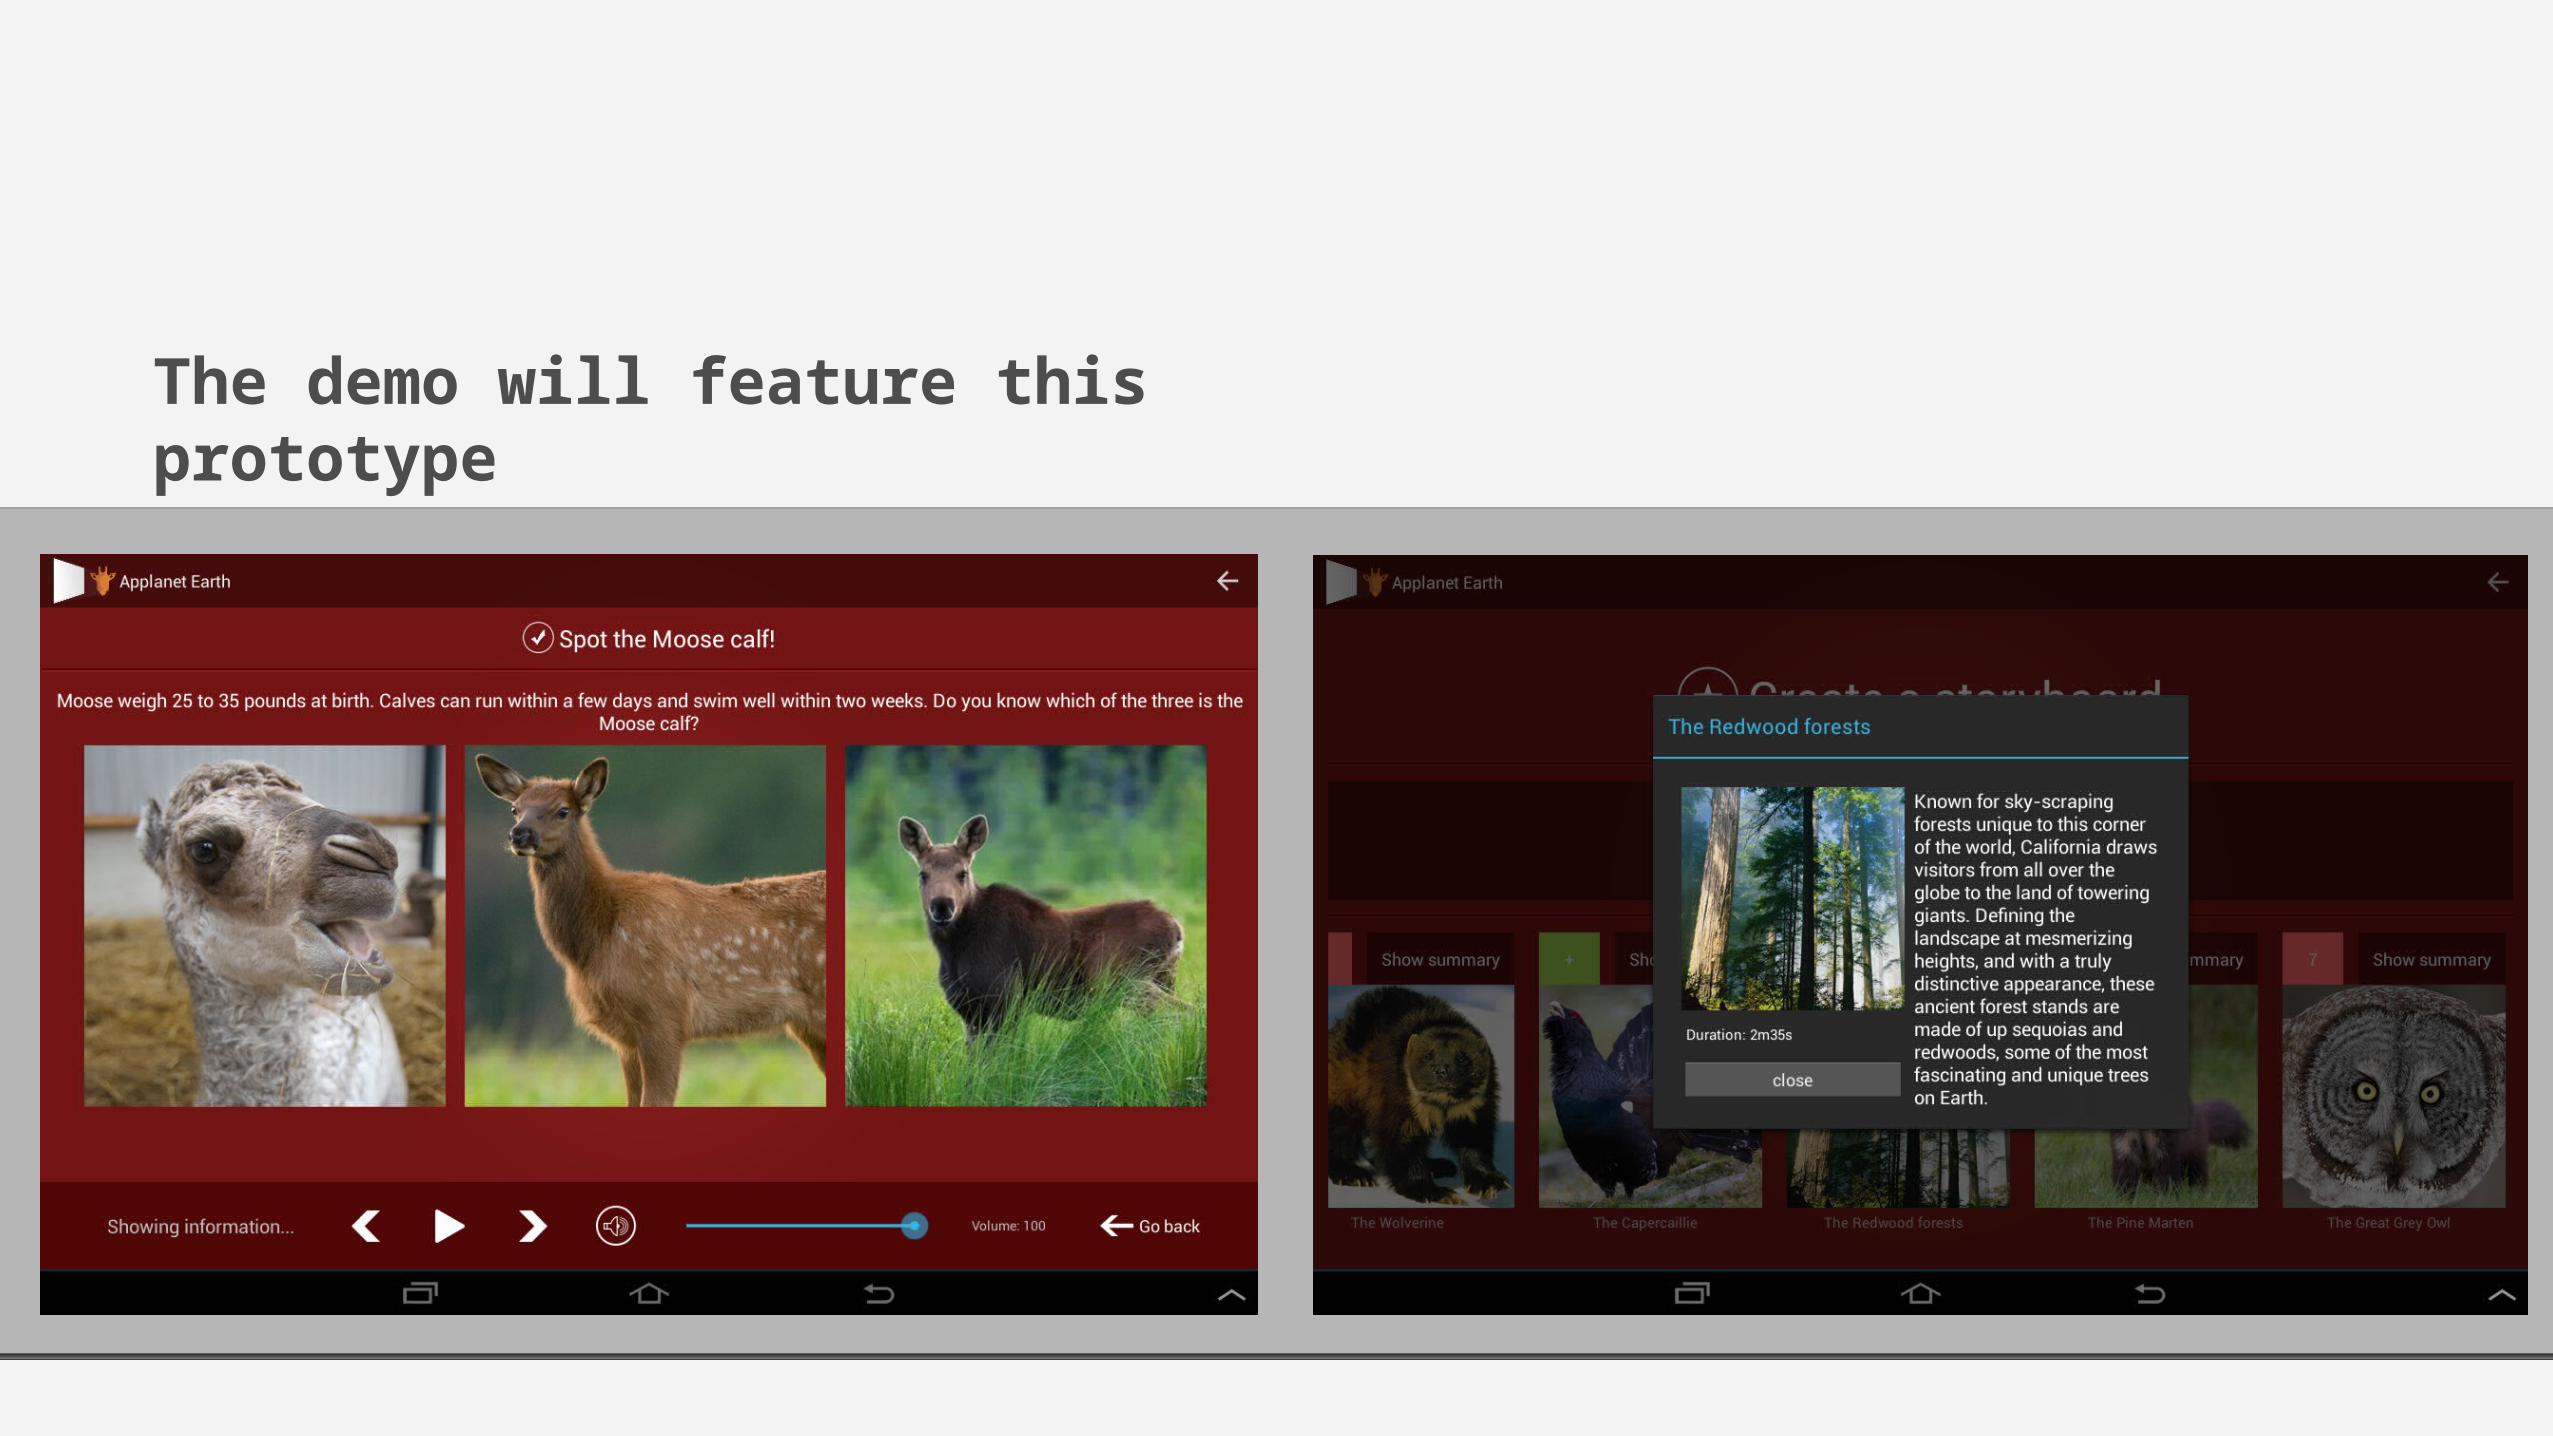
The demo will feature this prototype
Progress
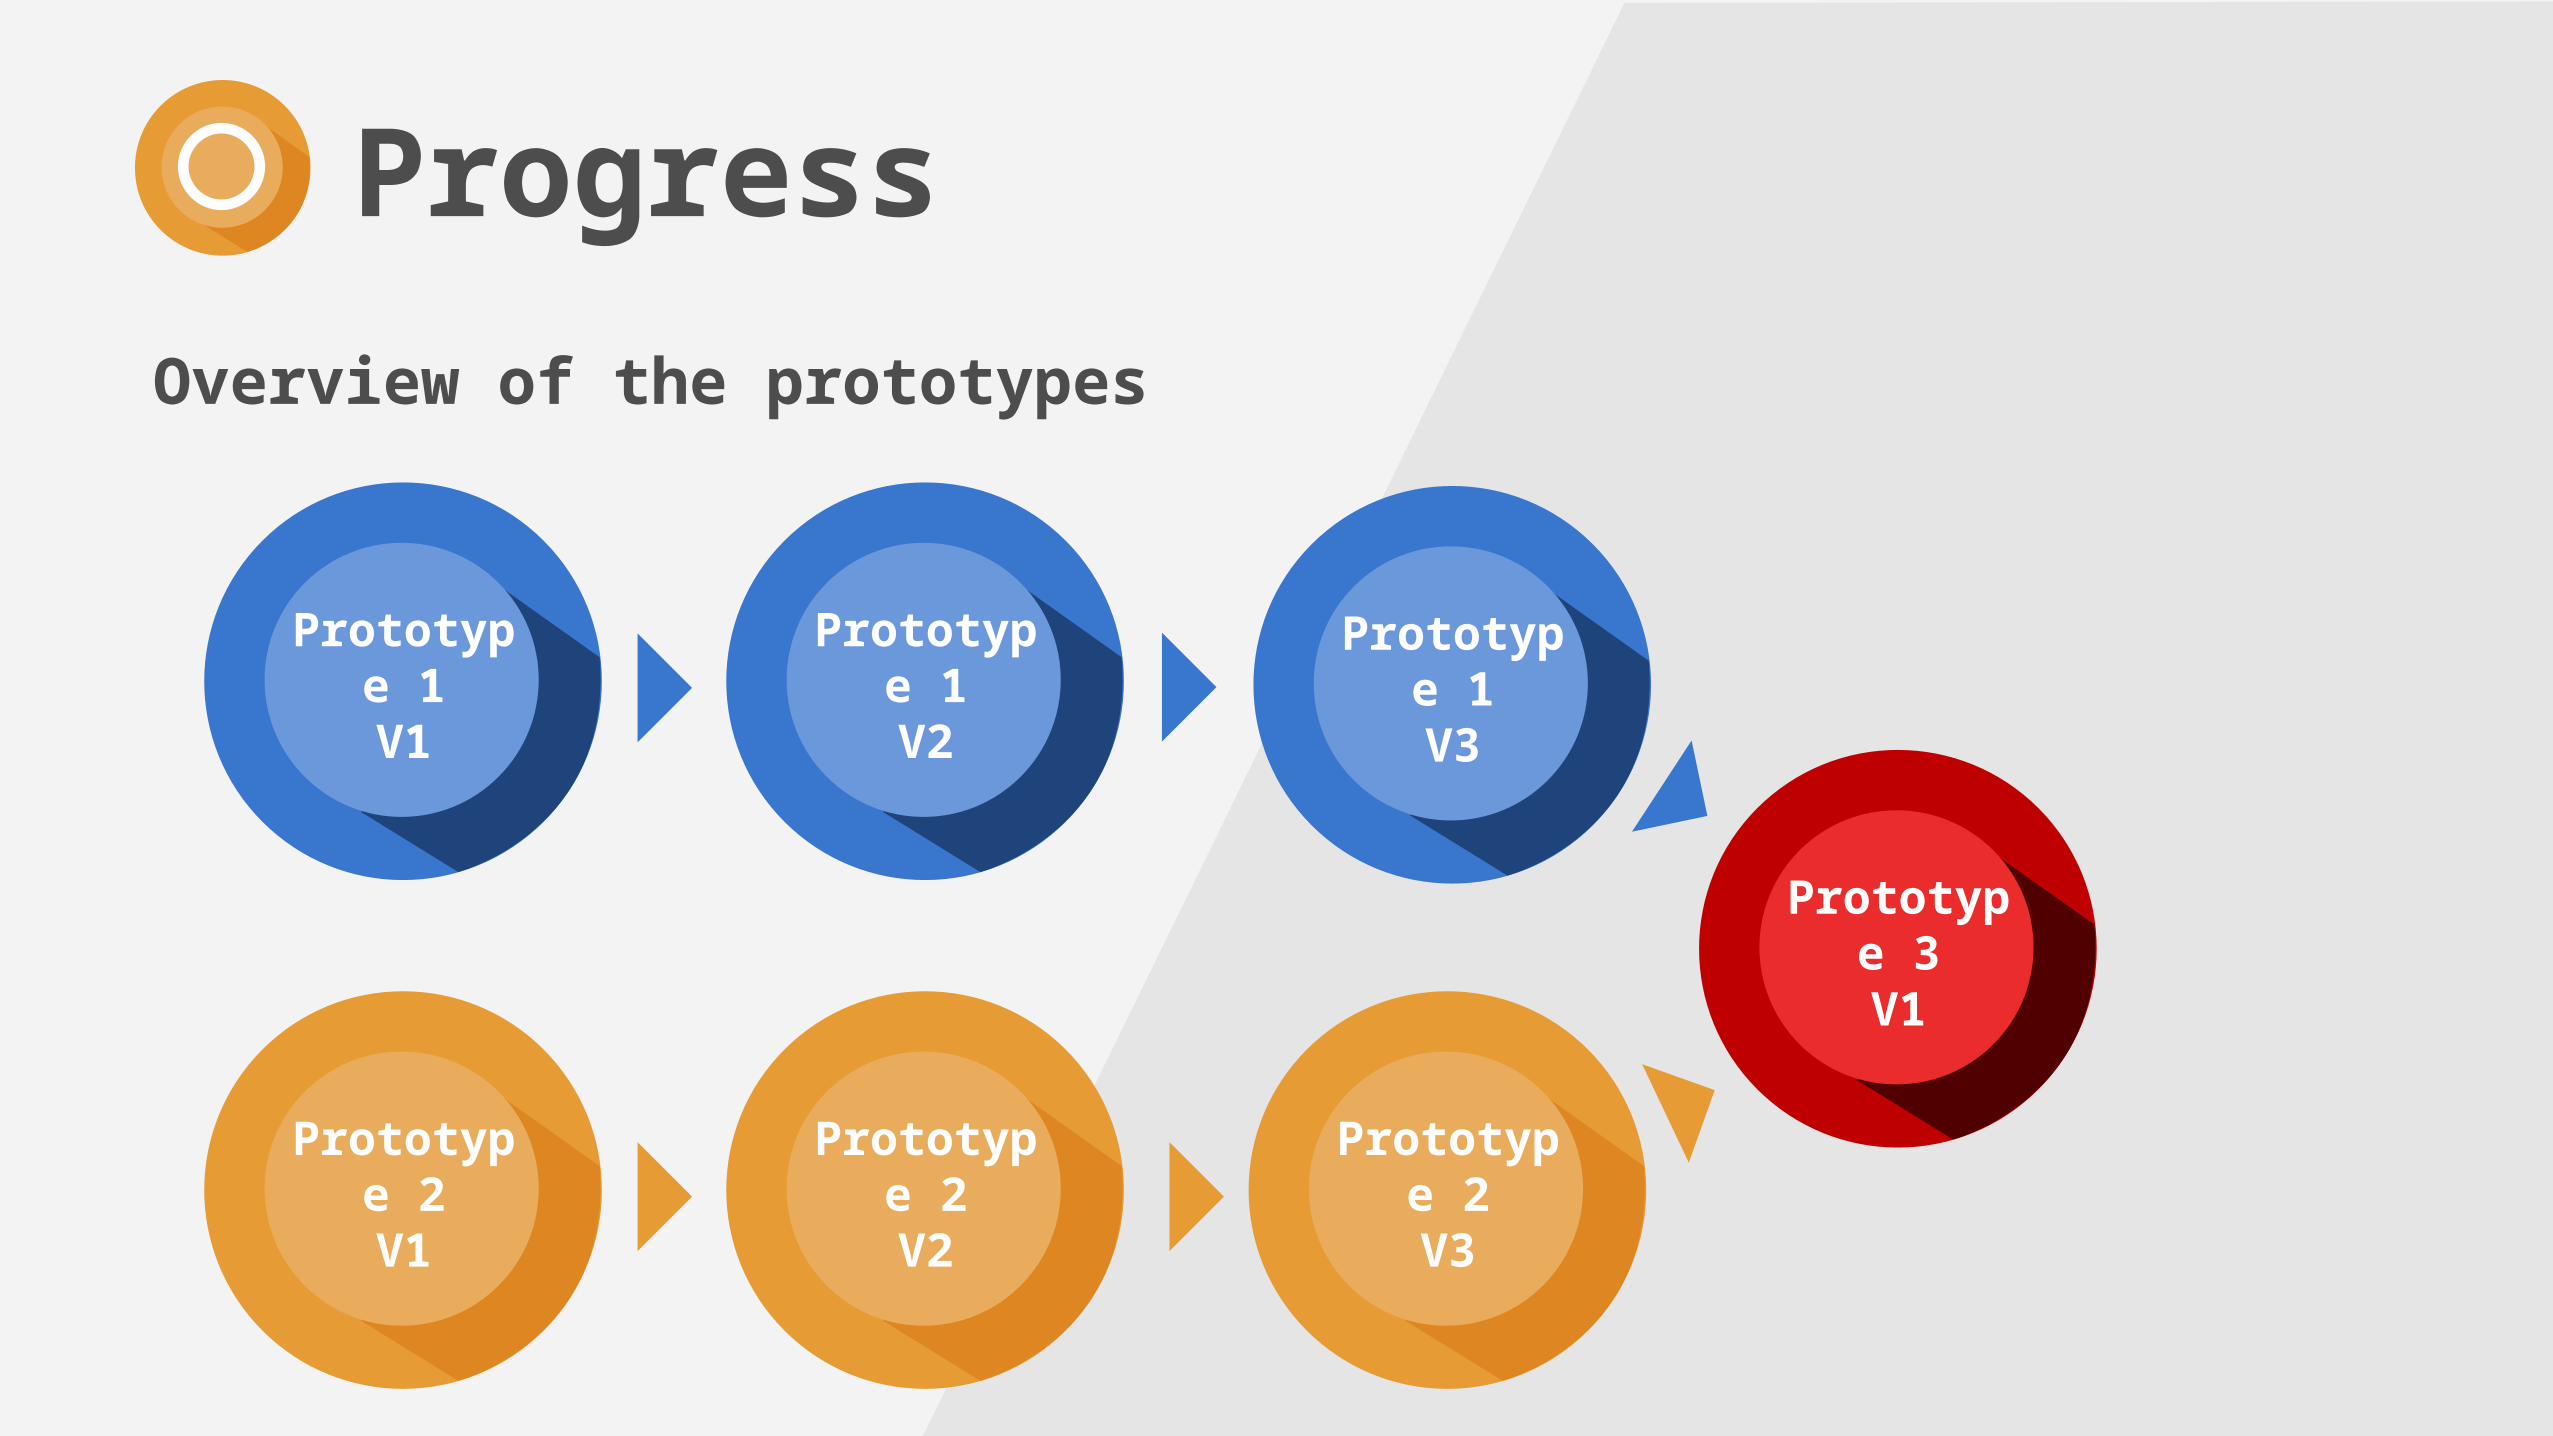
Overview of the prototypes
Prototype 1V1
Prototype 1V2
Prototype 2V1
Prototype 2V2
Prototype 2V3
Prototype 3V1
Prototype 1V3

1. Goal of this thesis
2. Recap
3. Progress (since last presentation)
4. Planning
5. Statistics
6. Demo
Table of contents
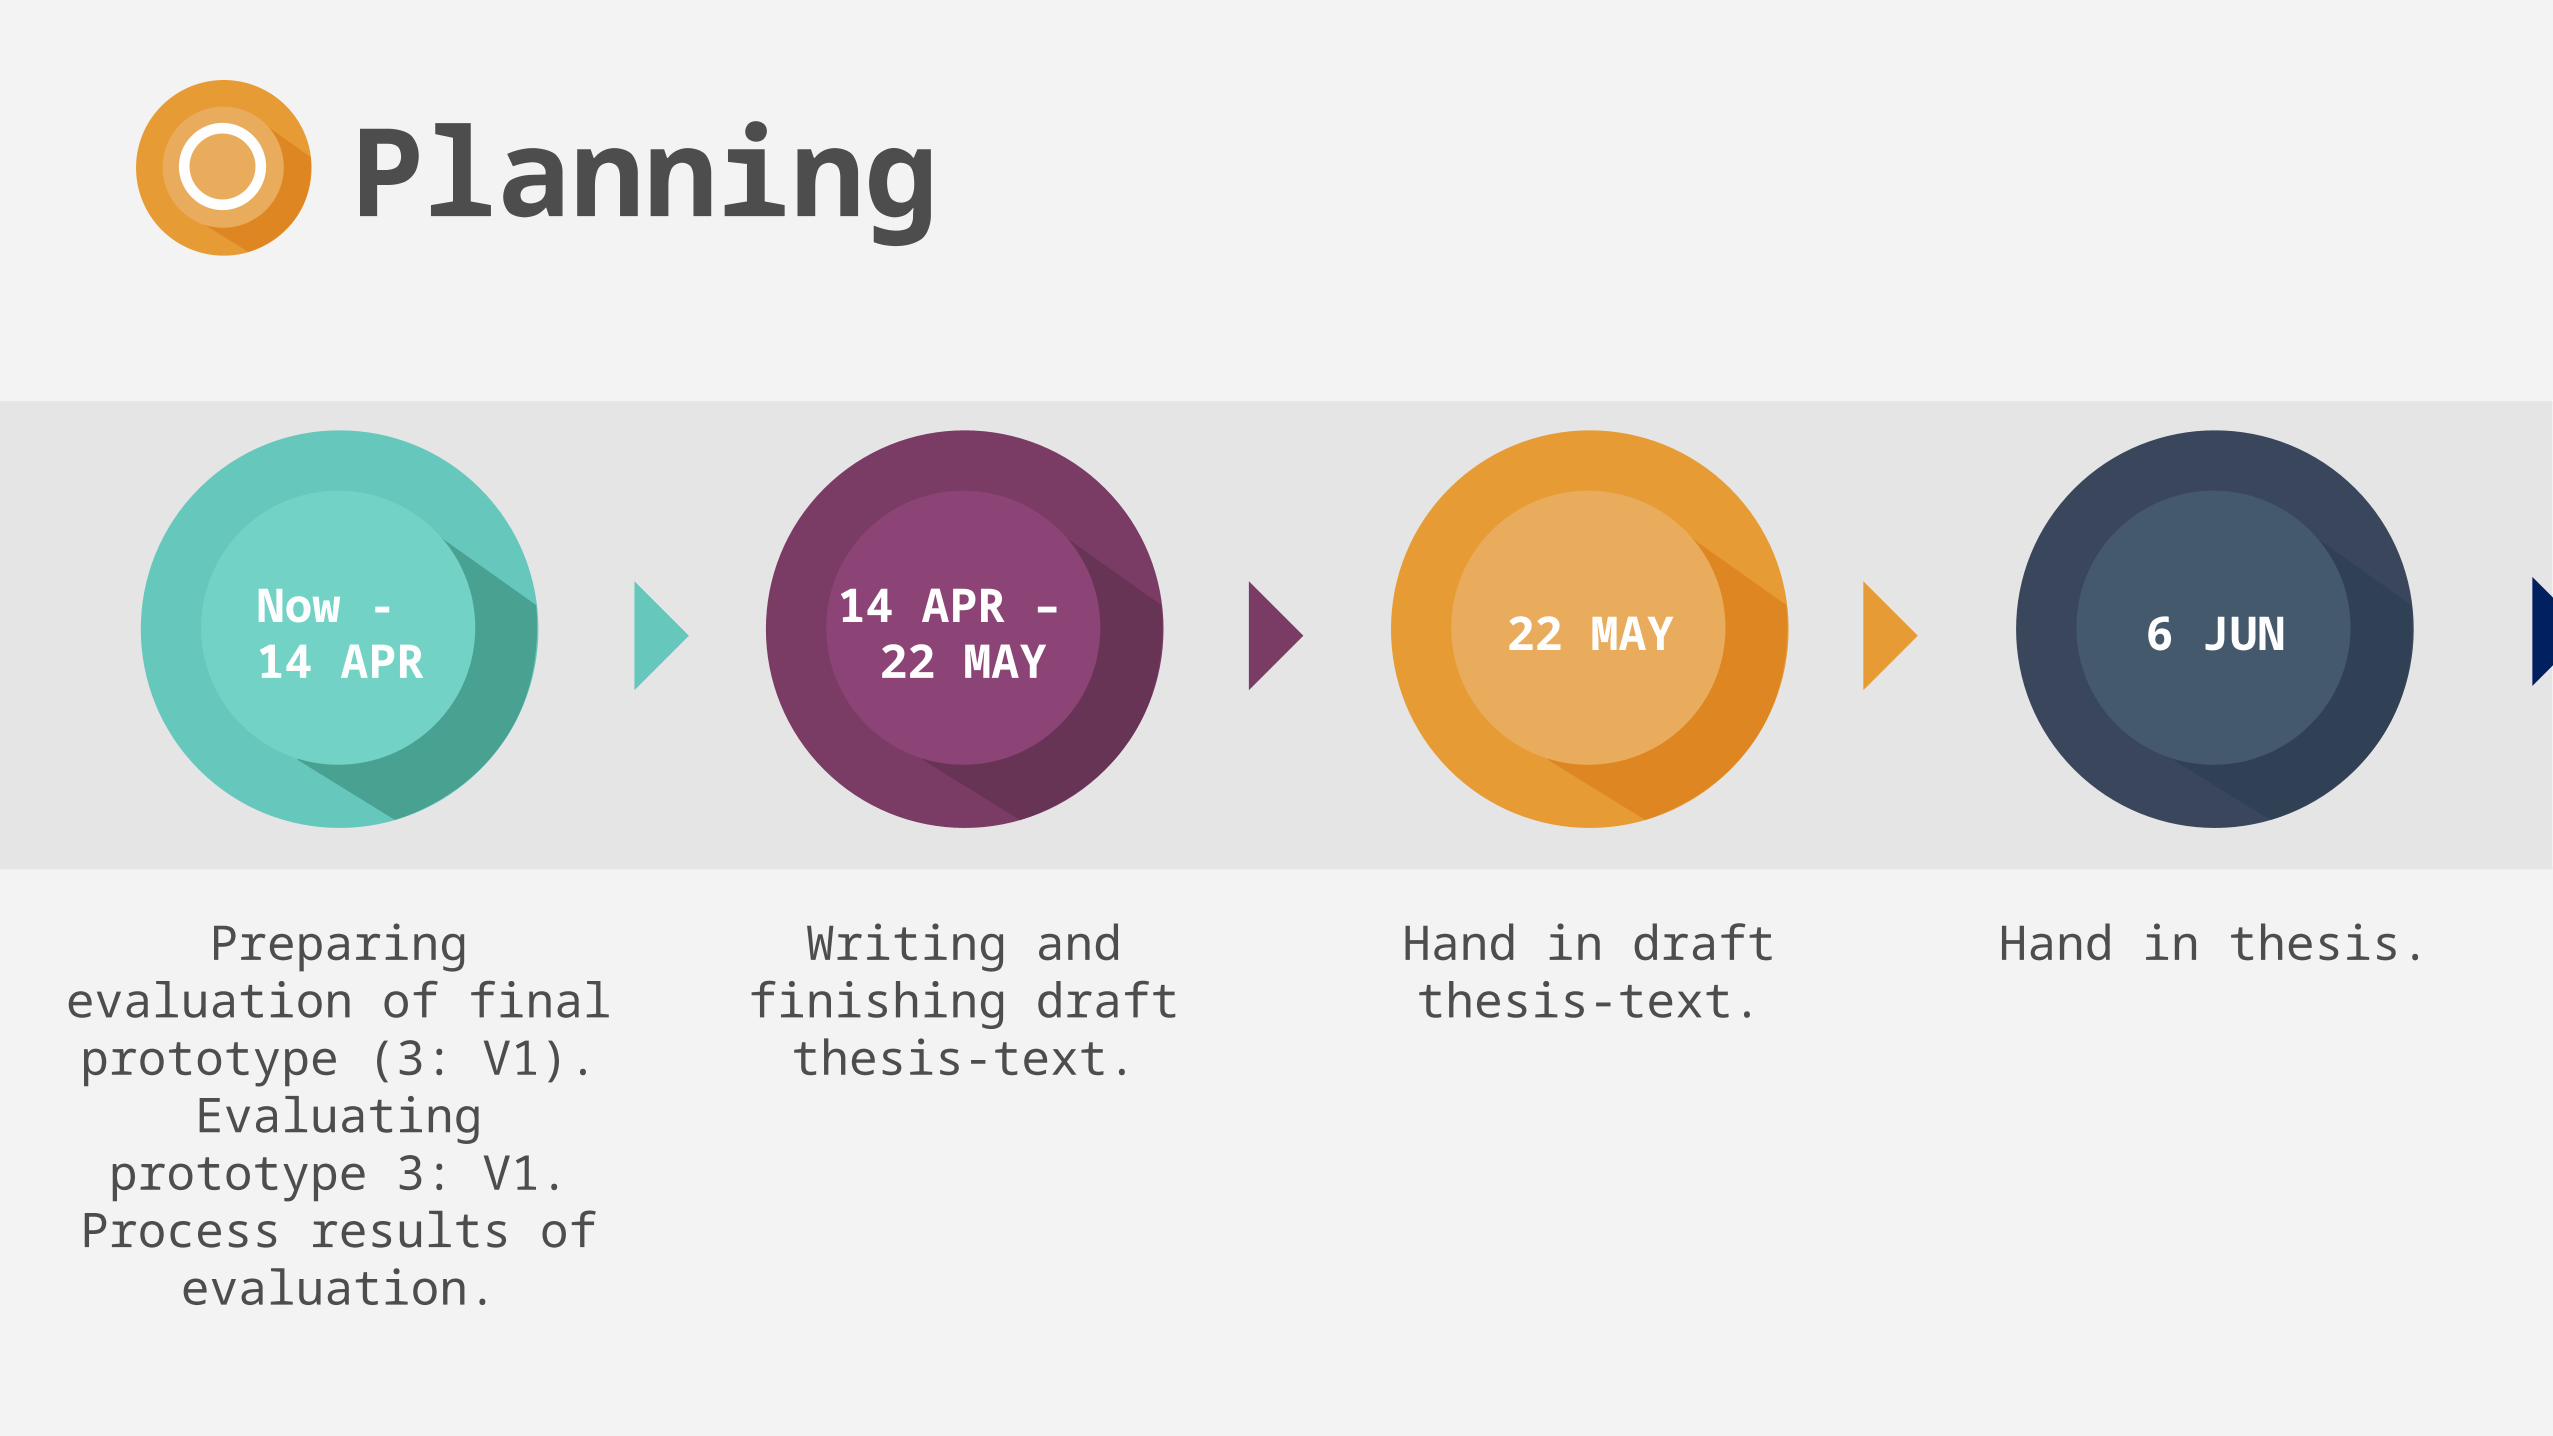
6 JUN22 MAY14 APR – 22 MAY
Now - 14 APR
Hand in thesis.Writing and finishing draft thesis-text.
Hand in draft thesis-text.
Preparing evaluation of final prototype (3:
V1). Evaluating prototype 3: V1.Process results of
evaluation.
Planning
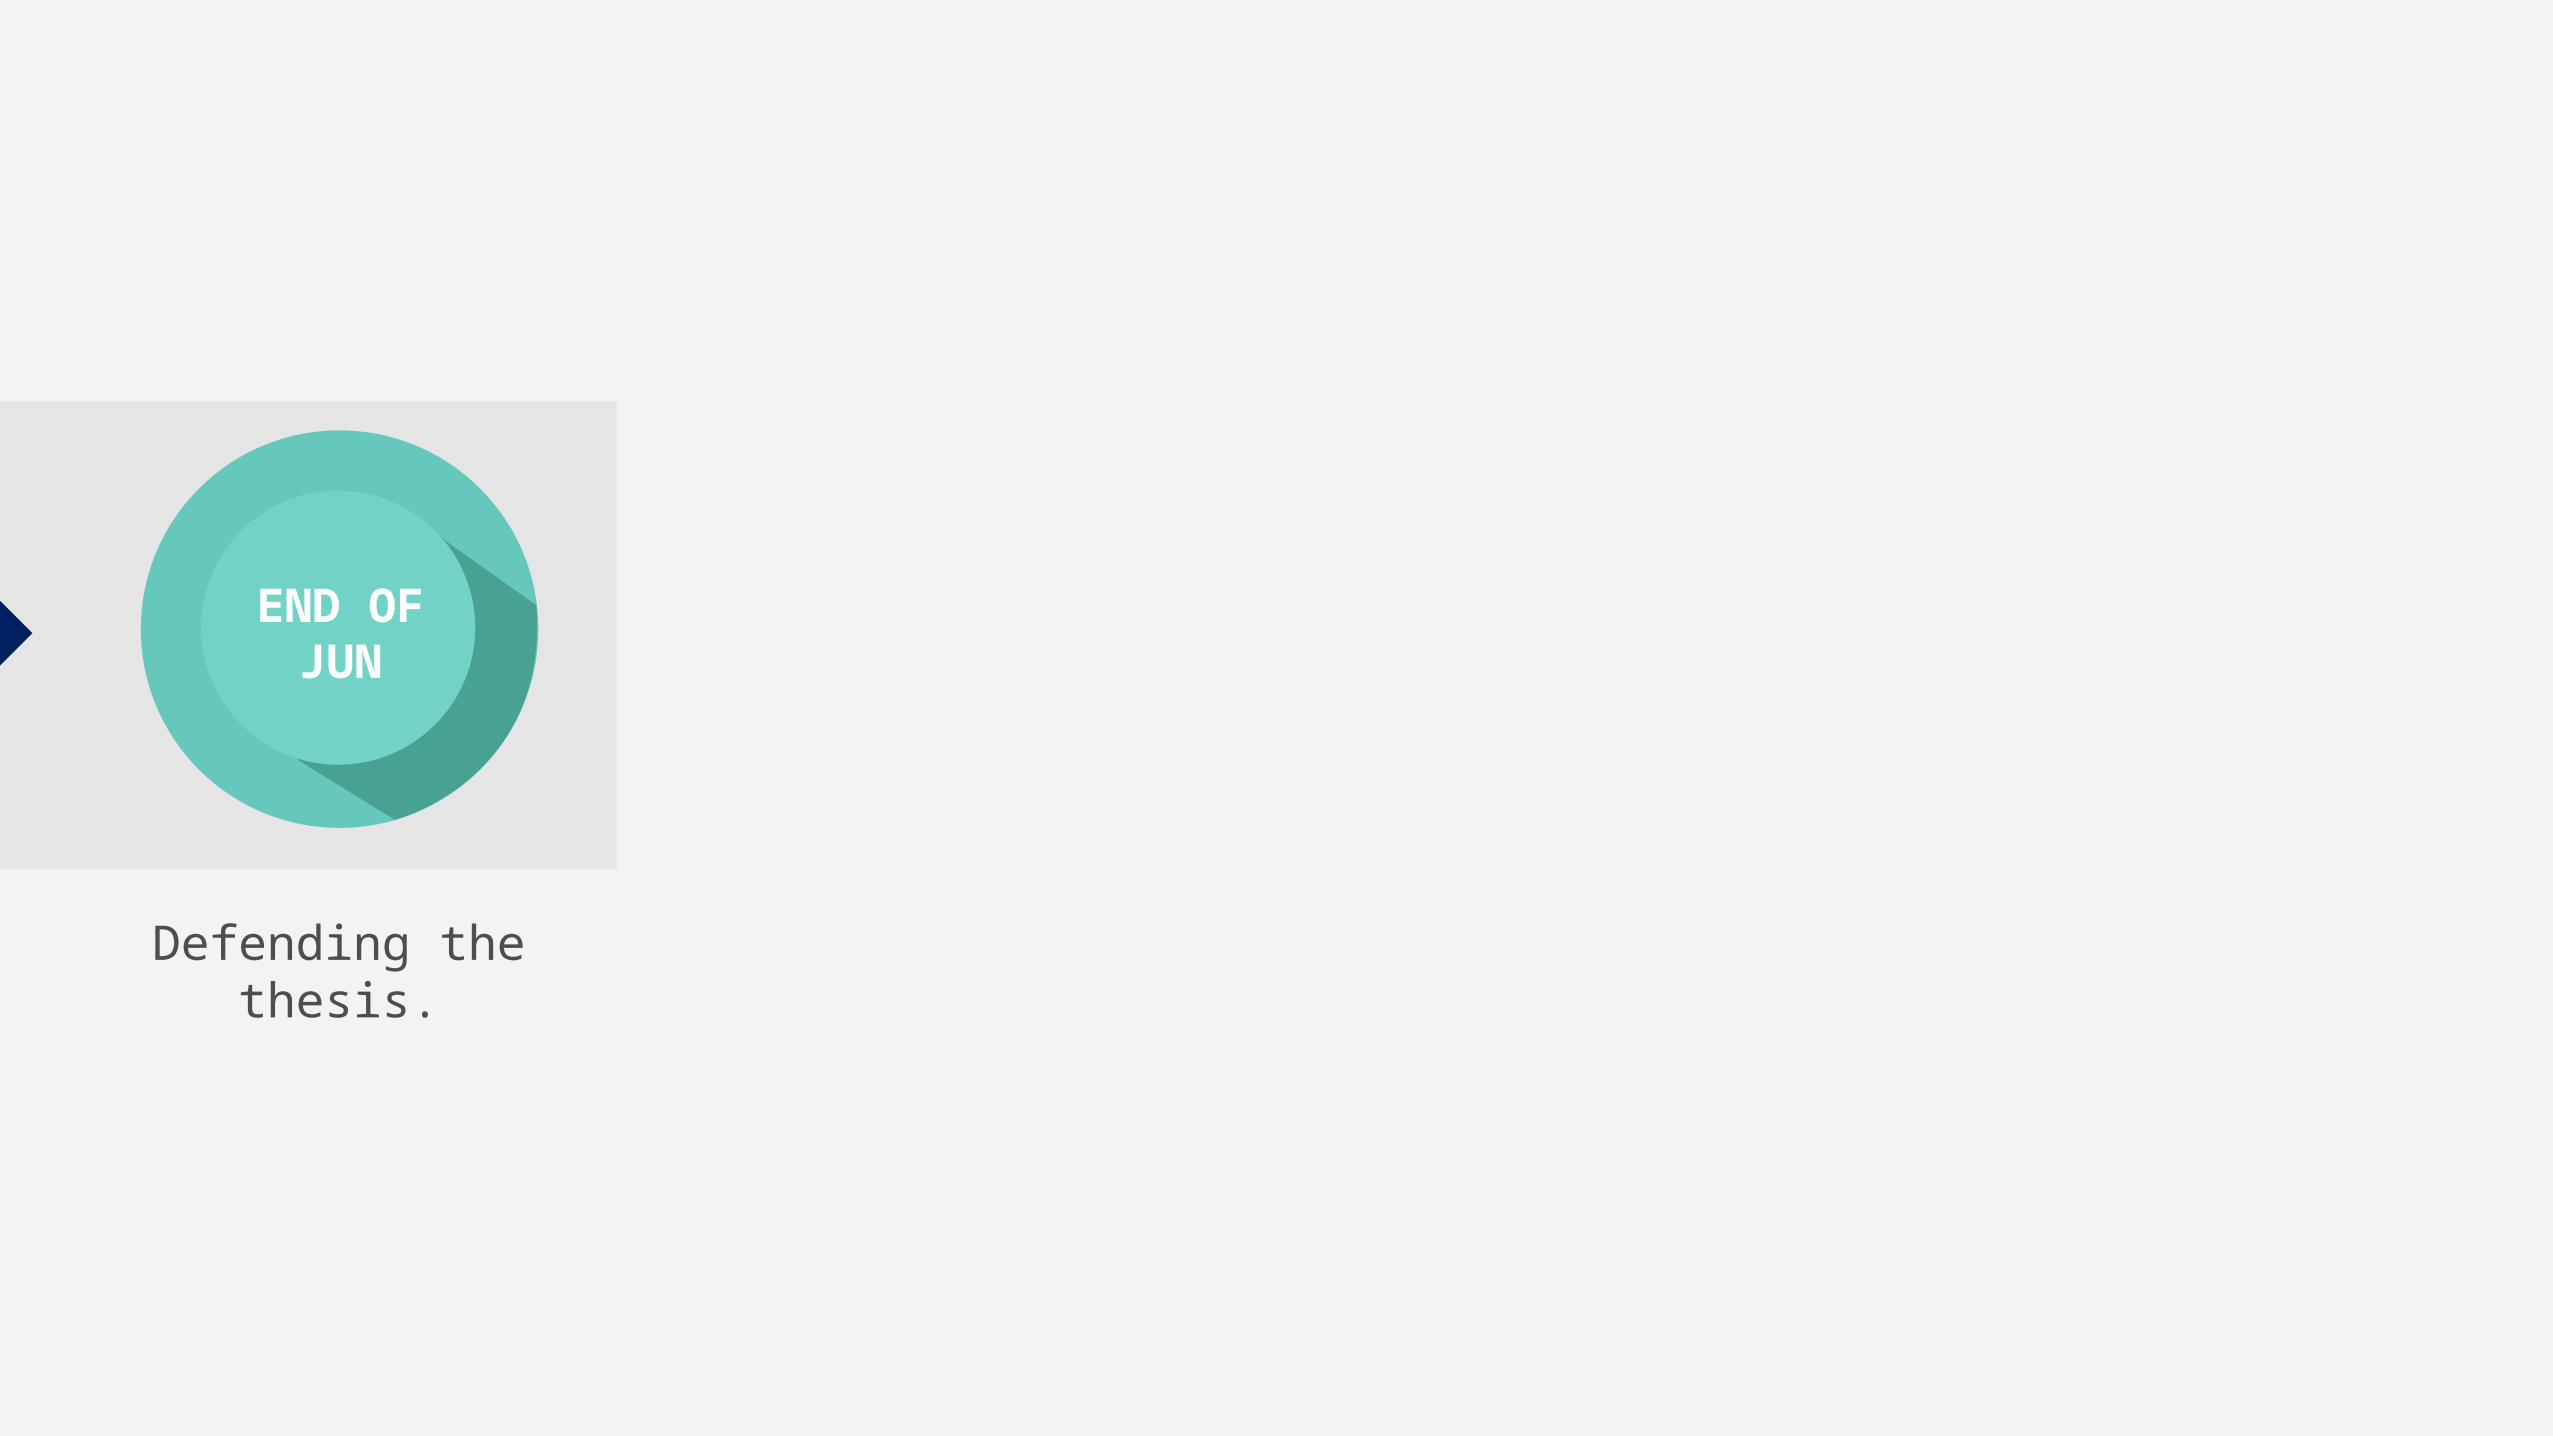
END OFJUN
Defending the thesis.

1. Goal of this thesis
2. Recap
3. Progress (since last presentation)
4. Planning
5. Statistics
6. Demo
Table of contents
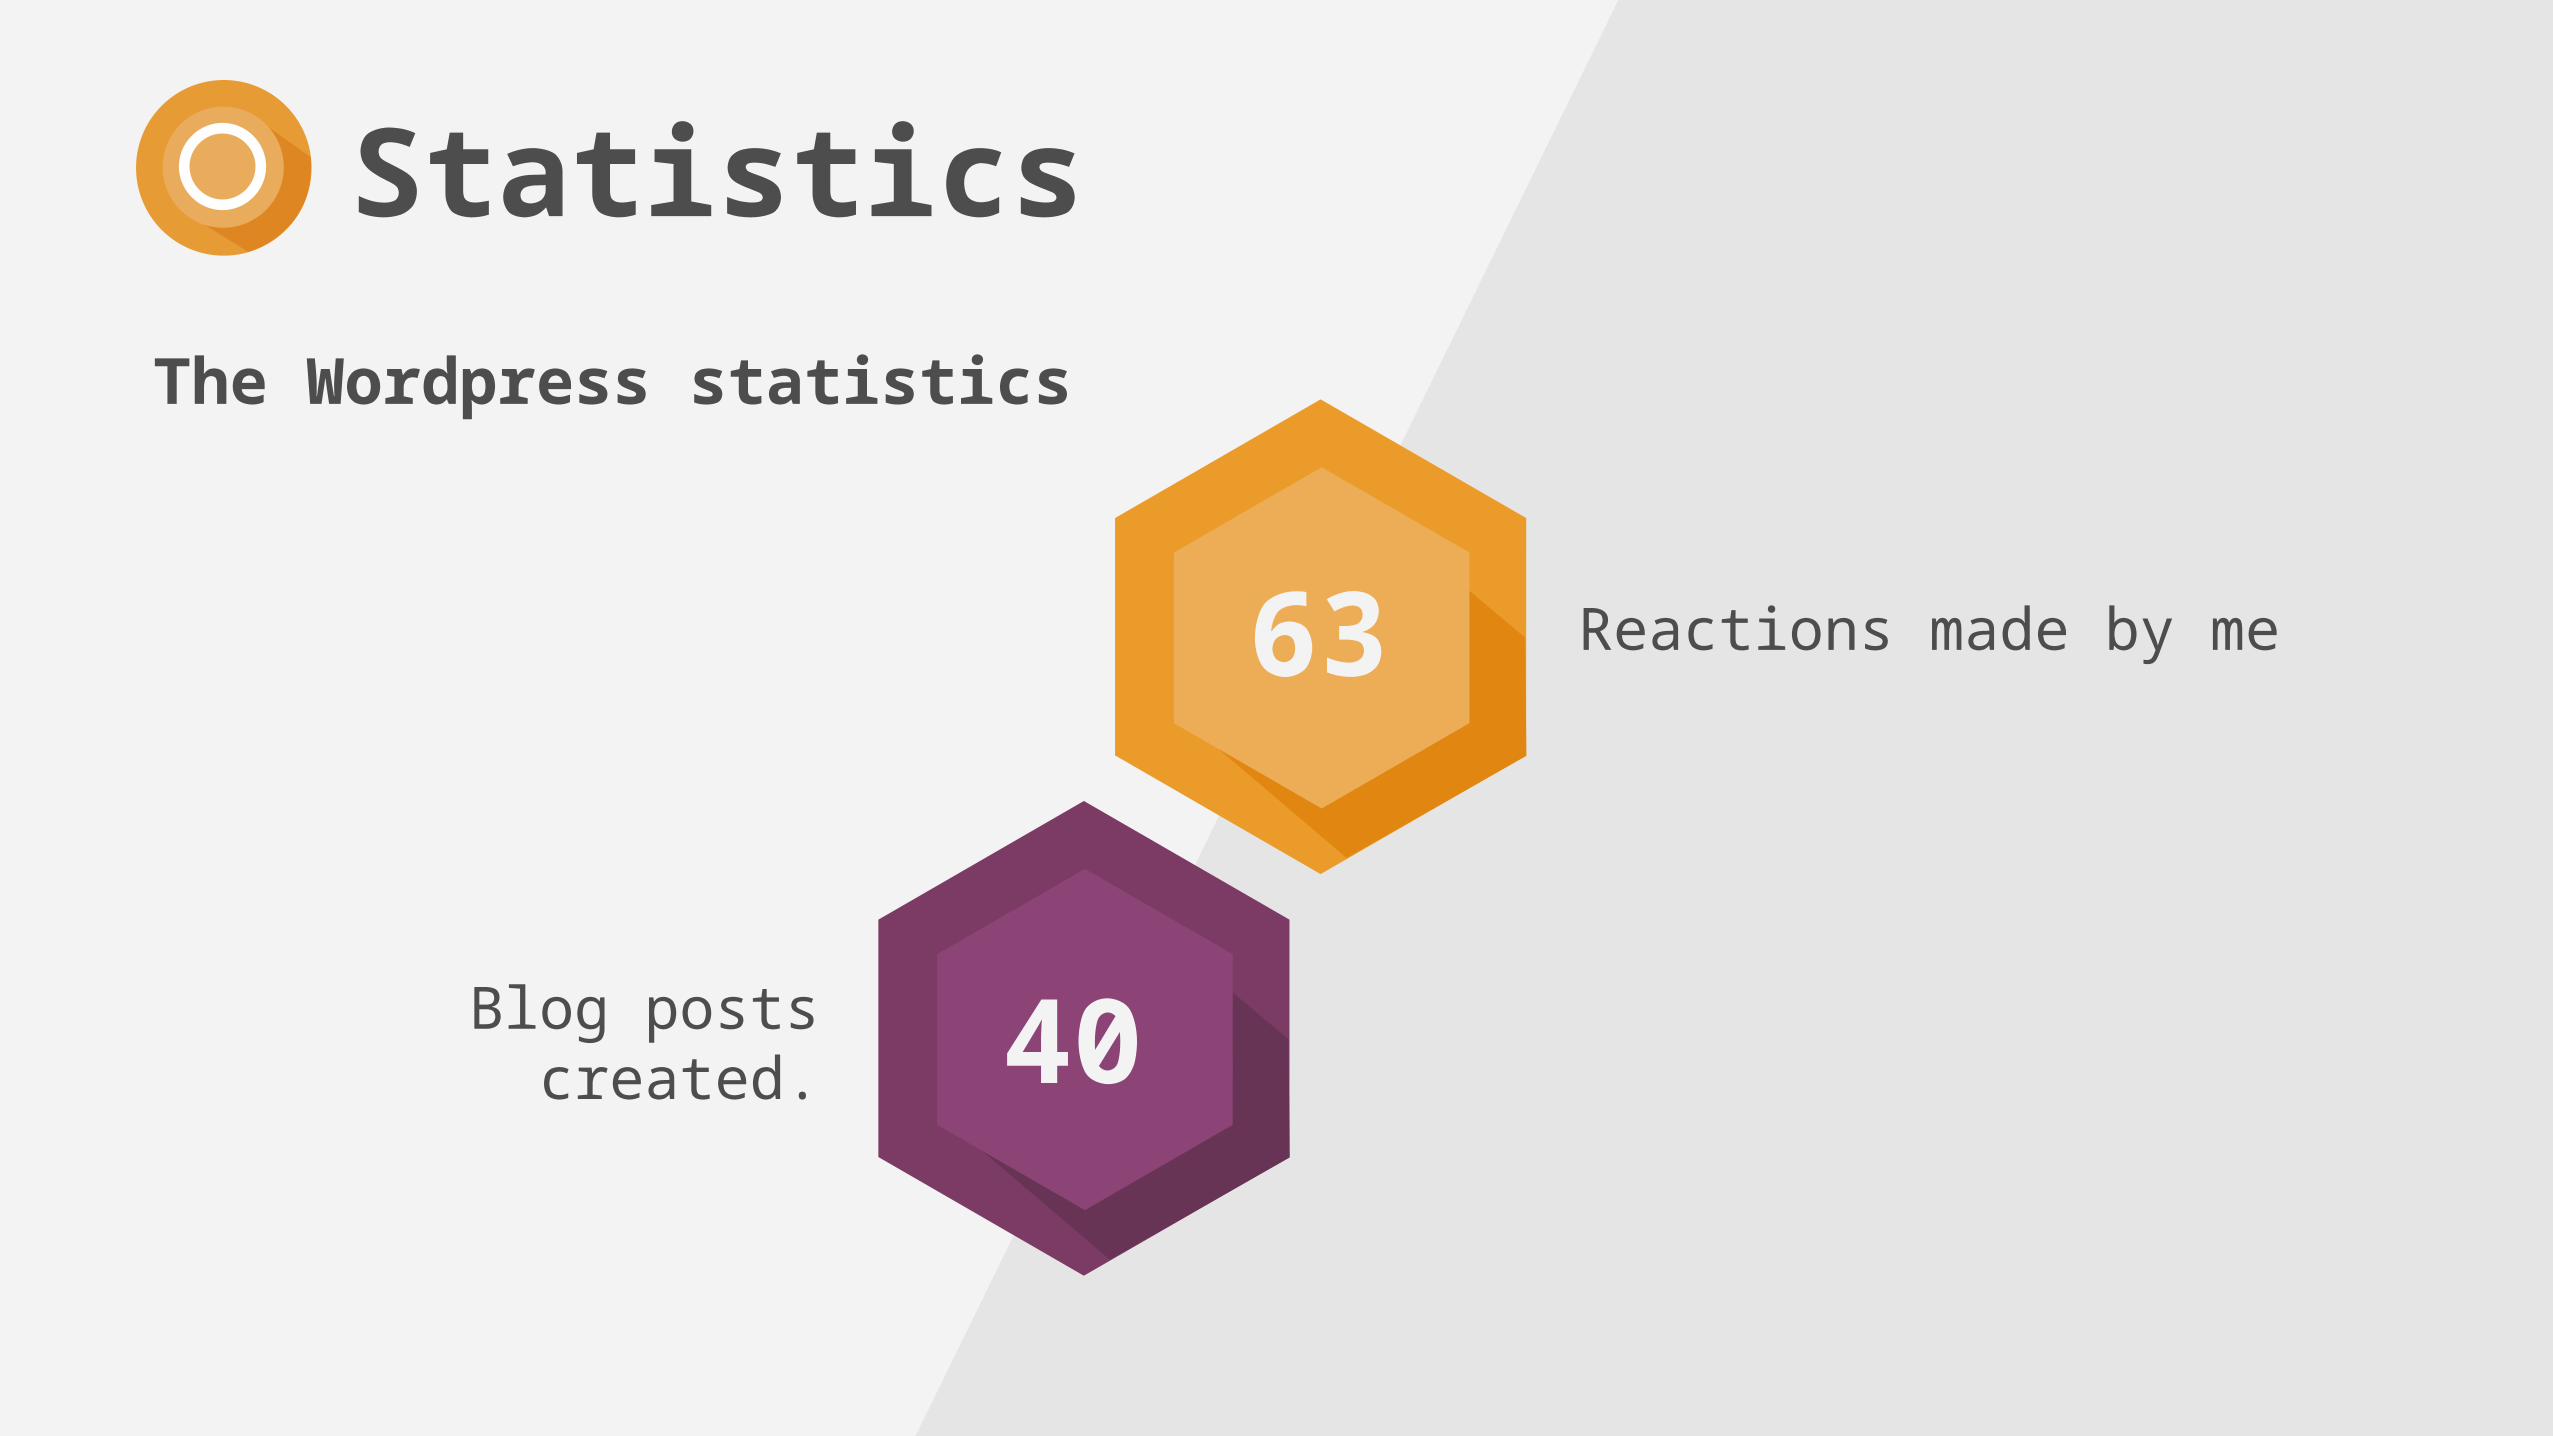
Blog posts created.
Reactions made by me
Statistics
The Wordpress statistics
40
63
Hours worked, and counting.
Statistics
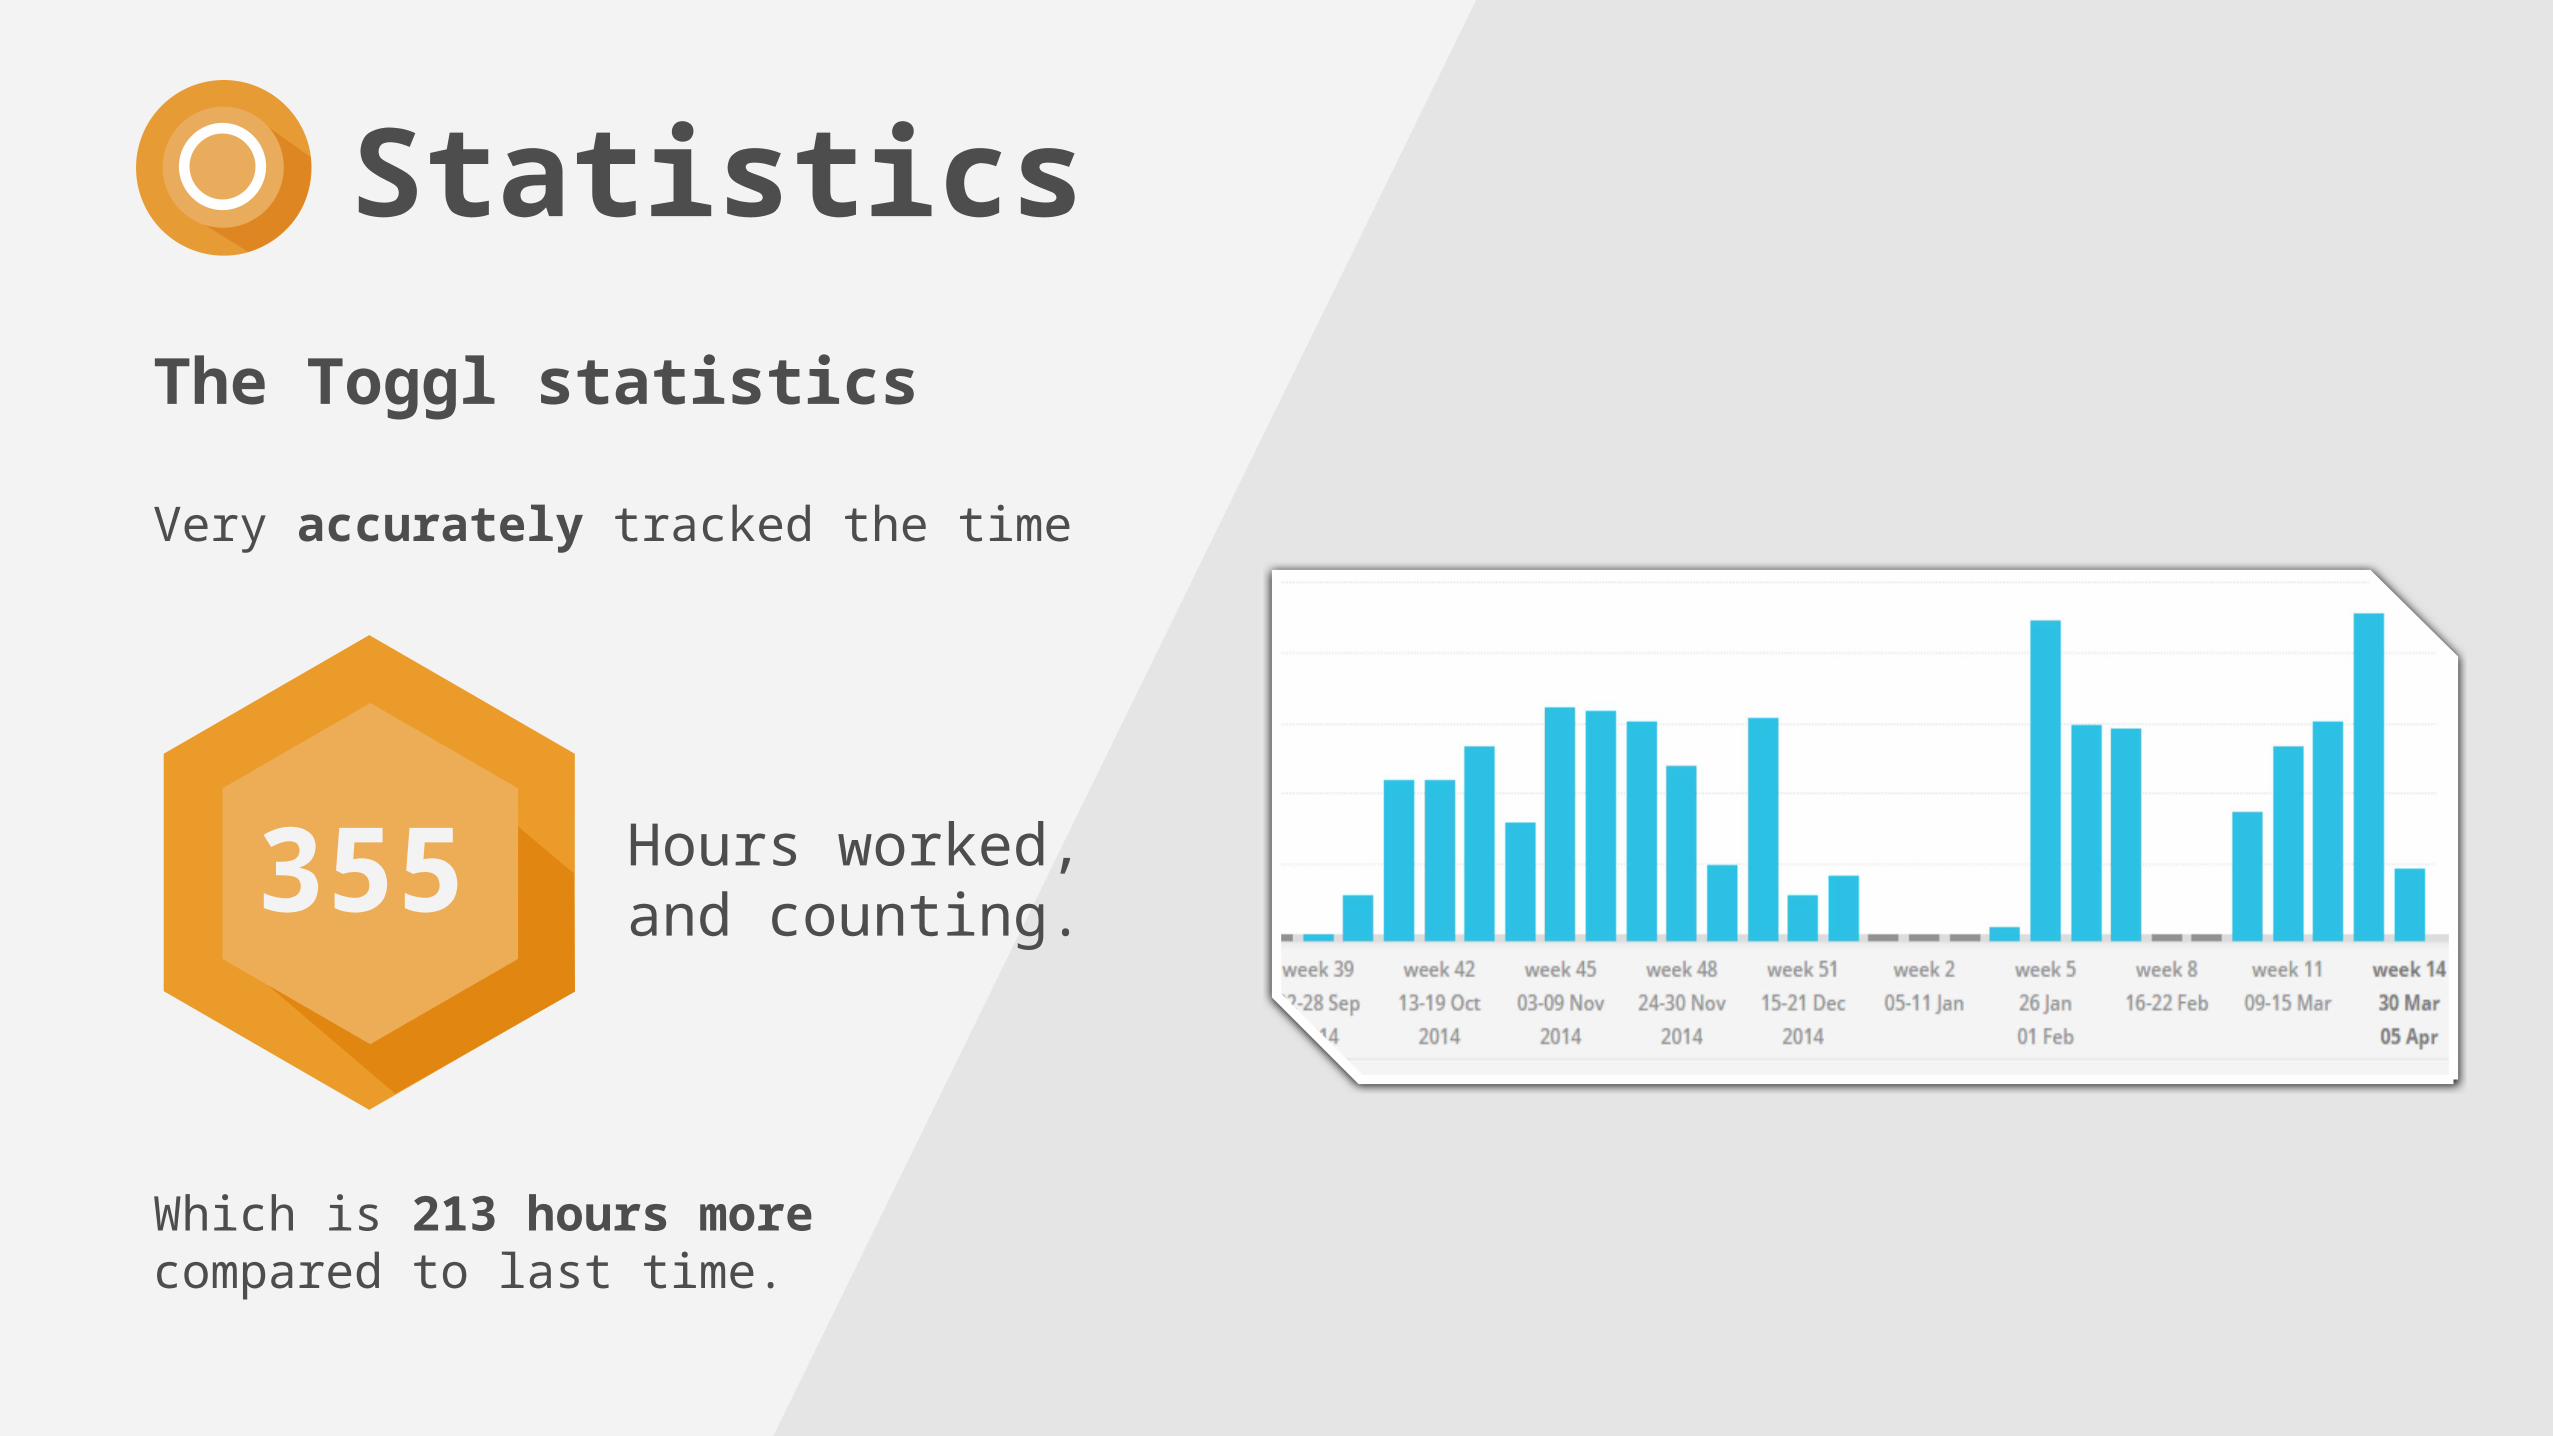
The Toggl statistics
Very accurately tracked the time
Which is 213 hours more compared to last time.
355
Expected score:
16/20
Demo

Questions?