Embed Size (px)
Citation preview

Nick Wagner, Steven S. Brown, William P. Dubé, Brian M. Lerner, Eric J. Williams -
NOAA Earth System Research Lab, USA
Theran Riedel, and Joel A. Thornton - University of Washington, USA
Derek Coffman - Pacific Marine Environmental Laboratory, NOAA, Seattle, Washington, USAA. Vlasenko - Air Quality Research Division, Science and Technology Branch, Environment Canada, Canada
Nocturnal Chemistry observed from the R/V AtlantisObservations of NO3 and N2O5
CalNEX Atlantis data meeting, January 11th, 2011
1) Introduction to nocturnal nitrogen oxide chemistry and an overview of the nocturnal nitrogen measurements from the cruise.
2) Using a steady state analysis to determine NO3 and N2O5 loss rates.
3) Main losses for NO3 and N2O5 during CalNEX.
4) A discussion of meteorology night time outflow derived from P-3 flights.
Outline

O3
NO2
N2O5
∆
H2O(l)
NO3
Cl- (aq)
NO2
HNO3
Deposition
ClNO2
Nocturnal Chemical Mechanism
• O3 and NO2 react to produce NO3. NO3 is photoliable and exists in significant concentrations only at night.
• NO3 and N2O5 are usually in chemical equilibrium and rapidly inter convert.
• NO3 is lost to reactions with VOCs.
• N2O5 is lost to hydrolysis.
• Conventional view: In the aerosol N2O5 is converted into NO3
- and HNO3, which is lost to deposition.
• New mechanism: N2O5 is convert to ClNO2 in aerosol with Cl-. ClNO2 builds throughout the night and is lost to photolysis in the morning.

Nighttime NO3 Production
• NO3 production rate: P(NO3) = k [O3] [NO2].
• Only nighttime data is shown.
• Polluted urban air masses.
• Shows where we expect to see nocturnal nitrogen oxide chemistry.

R/V Atlantis track - Colored by N2O5 mixing ratio
• N2O5 was mainly observed in Santa Monica and San Pedro Bay
• Many nights were spent stationary, and the measurements don’t show the spatial extent of the outflow.
•Only night time data is shown

Overview of Measured Mixing Ratios
• Observed mixing ratios of NO3, N2O5 and ClNO2.
• Scale on each graph increases by x10.
• The marine boundary layer is chlorine-rich environment.
• A large fraction of the nocturnal nitrogen ends up as ClNO2.

Lifetimes and Steady-State Analysis
Gray bar shows time period of linear fit.• Lifetimes are short < 15
min.
• In steady-state lifetimes can be related to pseudo first order loss coefficients.
• kN2O5 = 0.00072 +/- 0.00005 s-1
• kNO3 = 0.0071 +/- 0.0005 s-1
• Select periods time such that the loss rate coefficients are constant over the time period and produce a linear graph.
R2 = 0.90
][
1
)(
1
252352 NOK
kkON eq
NOONSS

Range of wind directionsover the night
• Wind speeds 3-5 m/s.• 1 hour is need to reach equilibrium.
Based on lifetimes of ~15 min.• 11 km to 18 km without fresh
emissions is needed.
Is the Steady-State Approximation Valid?
Atlantis Location – anchored off Port of LA
• Future work include box model simulations to determine the time taken to reach steady state.
• Comparing ClNO2 mixing ratio to the NO3 production rate indicates at least 1 hour of processing.
Argument 1 Argument 2

Summary of Steady-State Fits
• Some uptake coefficients are not reasonable using measured surface area.
• RH was 90%-100%. Could hydroscopic growth or droplet formation result in unmeasured surface area?
• Osthoff, et al. JGR 2006. High N2O5 losses due to fog.
kN2O5 (s-1)Measured Surface Area (m2/cm3)
Uptake Coefficient ()
Surface Area neededfor = 0.04 (%)
0.00072 222 0.05 135%
0.00012 182 0.01 22%
0.0012 144 0.13 350%
0.0025 130 0.32 800%
0.0021 143 0.24 600%
Unphysical

Large Surface Areas are Possible in Clouds
• Vertical profiles from the P-3 on June 2nd and 3rd, 2010. Through a marine stratus cloud.
• In the marine stratus cloud the surface area is >105 m2/cm3.
• Large surface areas are associated with fast N2O5 loss rates.
• From Sara Lance’s cloud probes.

NO3 Loss Rate
• NO3 losses to DMS are significant as expected in a marine environment.
• At times, DMS loss rate is comparable to the NO3 production rate.

Conclusions
• A large fraction of nocturnal nitrogen ends up as ClNO2.
• Both NO3 reactions with VOCs (DMS) and N2O5 hydrolysis are important losses.
• There is sometimes significant unmeasured surface area available for N2O5 hydrolysis.
Further Analysis:• Apply this analysis to other nights.
• Confirm steady-state, using a box model with determined loss rates.
• See if the NO3 loss rate can be attributed to VOCs measured by the GC and PTRTOF.
• Use box model calculations to determine N2O5 loss rate and ClNO2 yield and compare with the steady-state analysis.

Nighttime P-3 Flights over Water during CalNex 2010
Vertical Structure of Nighttime Outflow from L.A. Basin
Outline:
1) Motivating Experiment – Shair, et al. (1982)
2) Case 1
Overview, Transport, Chemistry, Vertical profile
3) Case 2
Overview, Transport, Chemistry, Vertical profile

1970’s transport study: SF6 injected into power plant at El Segundo in early evening
Motivation for CalNex Ship Based Nighttime Chemistry Study
• Measured plume overnight on a Navy vessel at various locations downwind
• Inferred transport in land breeze initiated aloft, eventually mixing to surface level
• Return transport during sea breeze the following day
• Can we confirm this transport pattern with Atlantis / P-3 measurements ? F. Shair, Atmos. Environ., 1982

5/29 7 PM - 5/30 1 AM PDT 5/30 10 PM - 5/31 4 AM PDT
6/02 1 - 7 AM PDT 6/03 1 - 8 AM PDT
Four Los Angeles Night Flights in Five Days
Local Sunset = 8:00 PM PDT
Local Sunrise = 5:45 AM
13 nighttime or early morning aircraft “transects” over water9 with clear tracers showing outflow, at least at some altitude range4 with mainly inflow

May 30, 2010 Night Flight• Day into night flight, several transects over water at varying altitude• Clear outflow in region South of L.A., but inflow immediately West of L.A.• Nearly as much NO3 in outflow as in East Basin for this flight (but not others)
AtlantisOverflight

Outflow associated with southeasterly wind, mainly in 200 – 400 m altitude range
Wind direction at Atlantis SE, but point toward marine, rather than continental influence
Atlantis
Atlantis
LongBeach
FlightDirection
LongBeach
May 30, Southerly Transect, Transport

• CO levels most enhanced on return leg at 300 – 400 m
• Very little ClNO2 anywhere on this flight, but some amount on lowest leg, possibly associated with a ship plume intercept
• Possibly some ClNO2 near Atlantis intercept ?
Atlantis
AtlantisLong
Beach
FlightDirection
May 30, Southerly Transect, Chemistry

• Potential T shows layers at 550, 350 and ~150 m, just at bottom of P-3 range• Nearly 180 degrees wind shear from from 200 - 700 m – implications for depth of outflow • Very dry above 400 m, likely very wet below 200:
Large change in N2O5 uptake / ClNO2 production ?
Vertical Profile, Long Beach, May 30 23:20 Local

June 3, 2010 Night Flight• Night into day flight, transects over both water and desert (not shown)• Outflow clearly persistent in regions to the West of L.A. on all over water transects• But … as with other flights, pollution more concentration in east basin rather than in the outflow
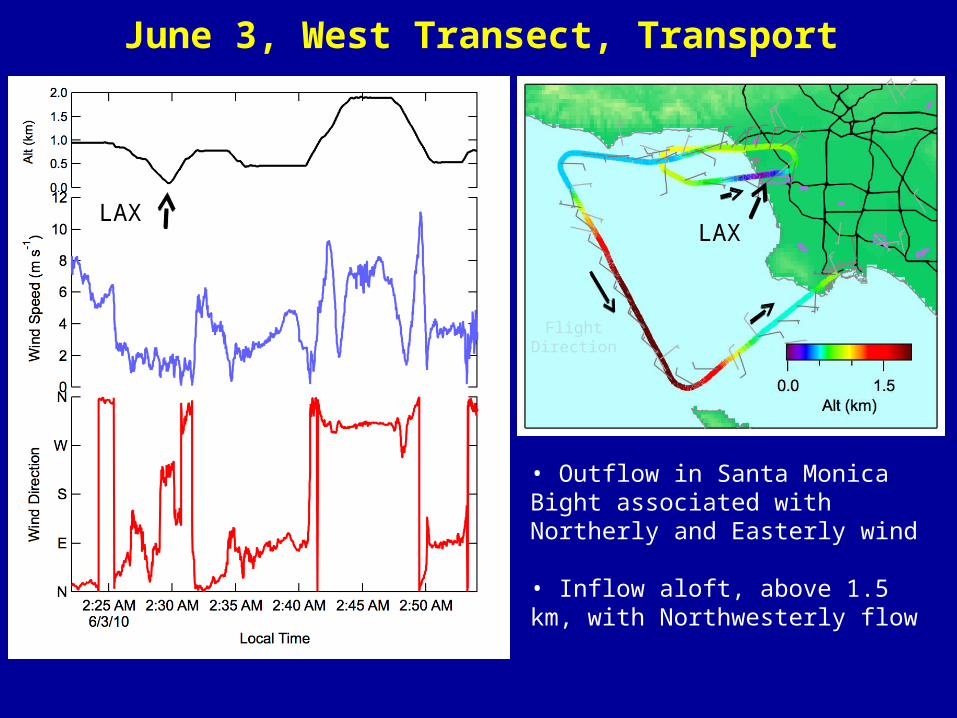
• Outflow in Santa Monica Bight associated with Northerly and Easterly wind
• Inflow aloft, above 1.5 km, with Northwesterly flow
LAX
FlightDirection
June 3, West Transect, Transport
LAX

• Large ClNO2 / N2O5 in air transported directly from the East at 500 m as aircraft transects in toward Long Beach
Horizontal extent ?Subsidence at sea ?
• Variability in vertical profile at LAX
LAX
FlightDirection
June 3, West Transect, Chemistry
LAX

Vertical Profile, LAX, June 3, 02:30 Local
• Layer structure at 250 m, stable above that level• Wind shear: SW inflow below 250 m over LAX, NE outflow in layers aloft• Stunning anticorrelation between ClNO2 and N2O5 in the vertical
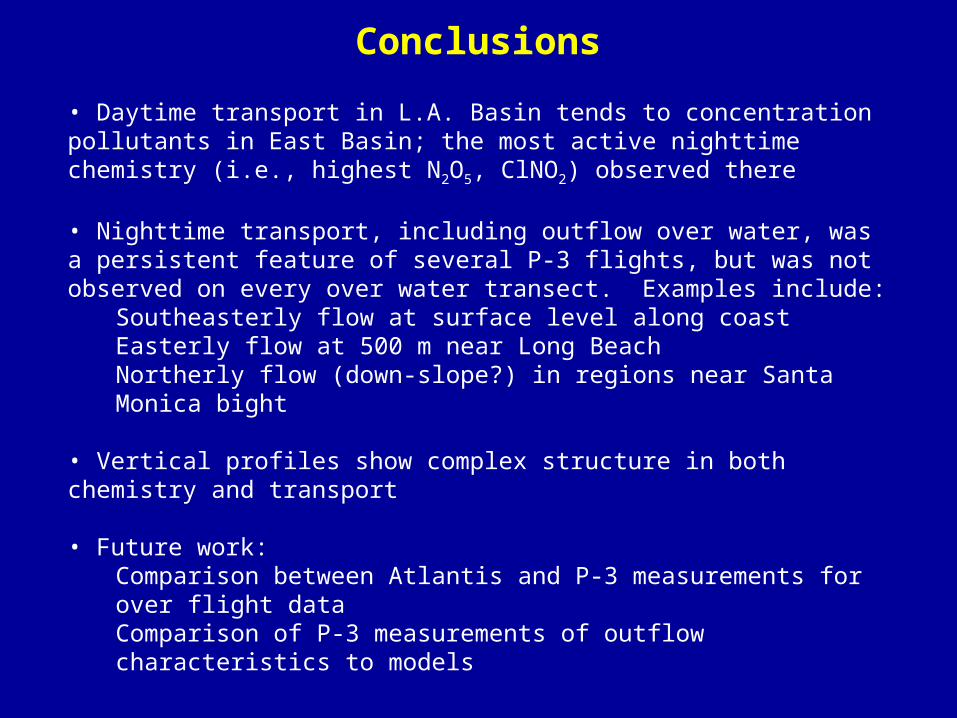
Conclusions
• Daytime transport in L.A. Basin tends to concentration pollutants in East Basin; the most active nighttime chemistry (i.e., highest N2O5, ClNO2) observed there
• Nighttime transport, including outflow over water, was a persistent feature of several P-3 flights, but was not observed on every over water transect. Examples include:
Southeasterly flow at surface level along coastEasterly flow at 500 m near Long BeachNortherly flow (down-slope?) in regions near Santa Monica bight
• Vertical profiles show complex structure in both chemistry and transport
• Future work:Comparison between Atlantis and P-3 measurements for over flight dataComparison of P-3 measurements of outflow characteristics to models

Limits on N2O5 loss rate for May 20th, 2010
• Disagreement between production and loss rate due to:
• Similar disagreement for all nights during the cruise.
1) NO3 and N2O5 are not at steady-state.
2) There is a large surface area from particles with diameters >10 m.
3) A NO3 loss.
• N2O5 loss rate for a range of uptake coefficients.
• Uses measured surface area for particles < 10 m diameter.