Embed Size (px)
Citation preview

Nicholas Charron
Bo Rothstein
The Quality of Government Institute
Dept. of Political Science
University of Gothenburg
Quality of Government
in EU regions
The QoG Institute
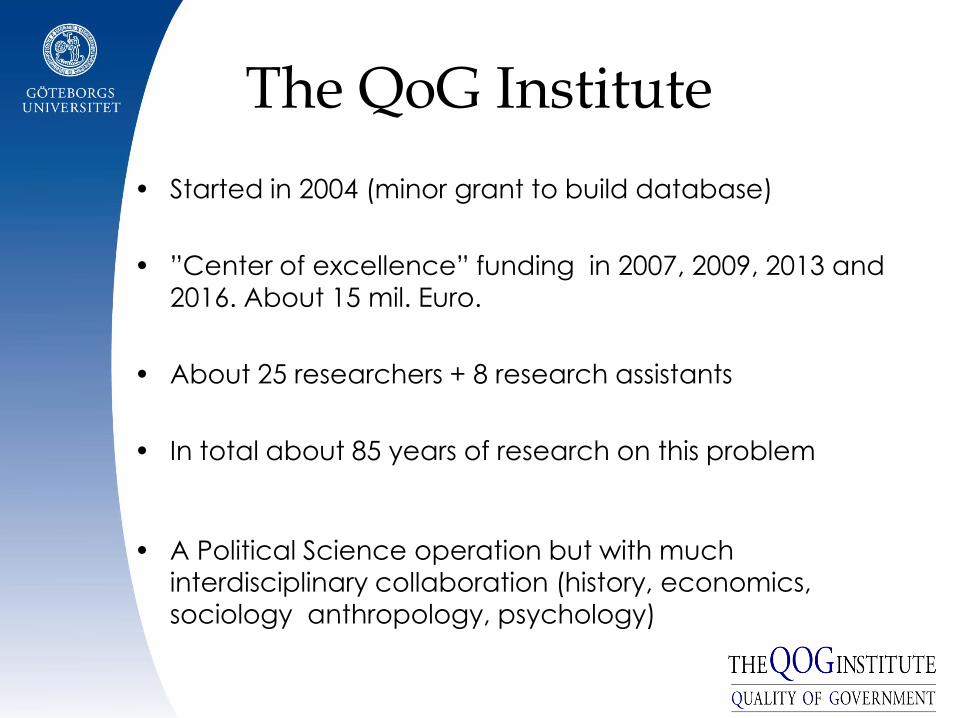
• Started in 2004 (minor grant to build database)
• ”Center of excellence” funding in 2007, 2009, 2013 and
2016. About 15 mil. Euro.
• About 25 researchers + 8 research assistants
• In total about 85 years of research on this problem
• A Political Science operation but with much
interdisciplinary collaboration (history, economics, sociology anthropology, psychology)
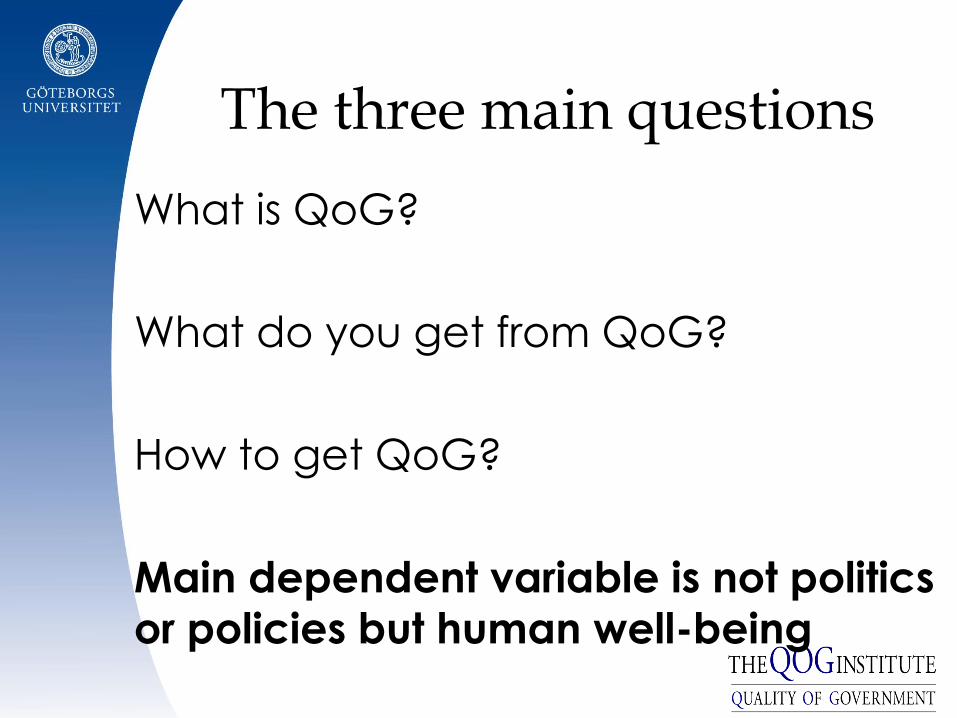
The three main questions
What is QoG?
What do you get from QoG?
How to get QoG?
Main dependent variable is not politics
or policies but human well-being
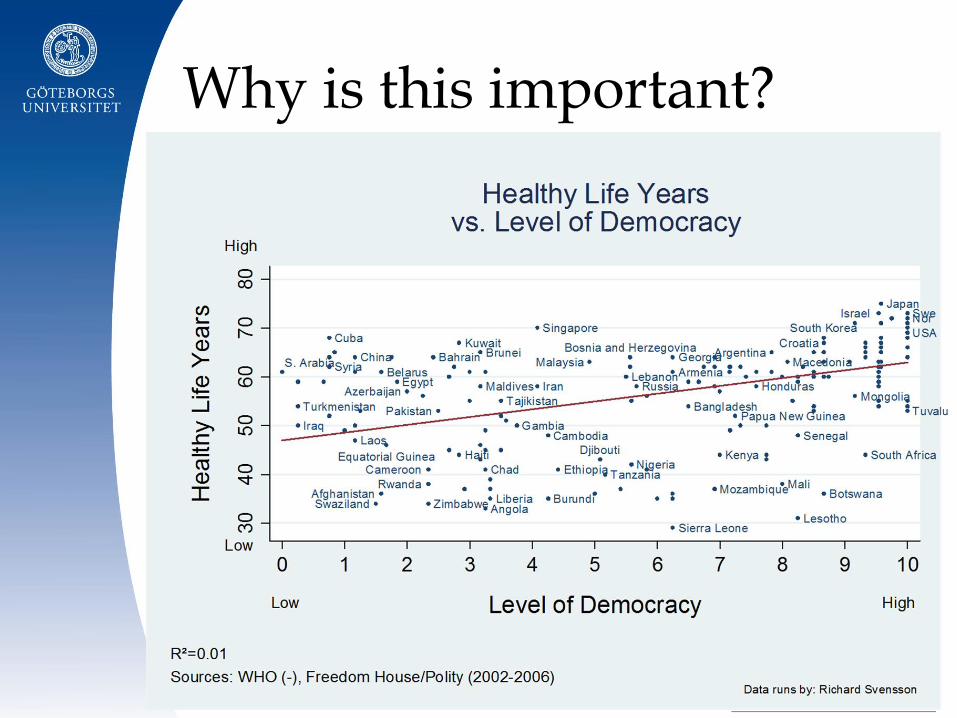
Why is this important?
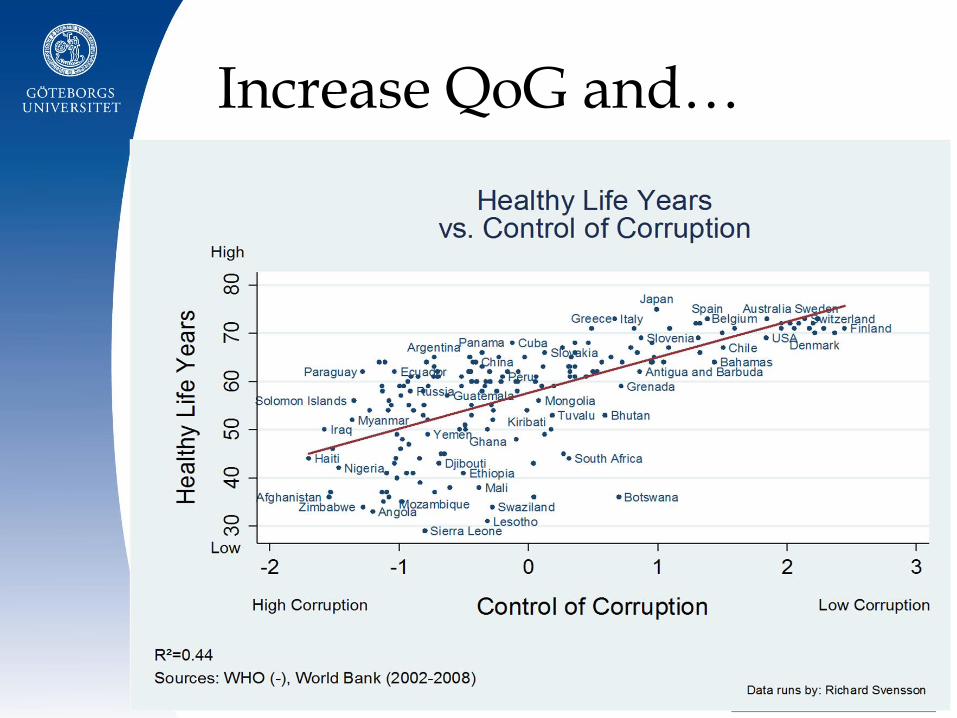
Increase QoG and…

What about the economy?
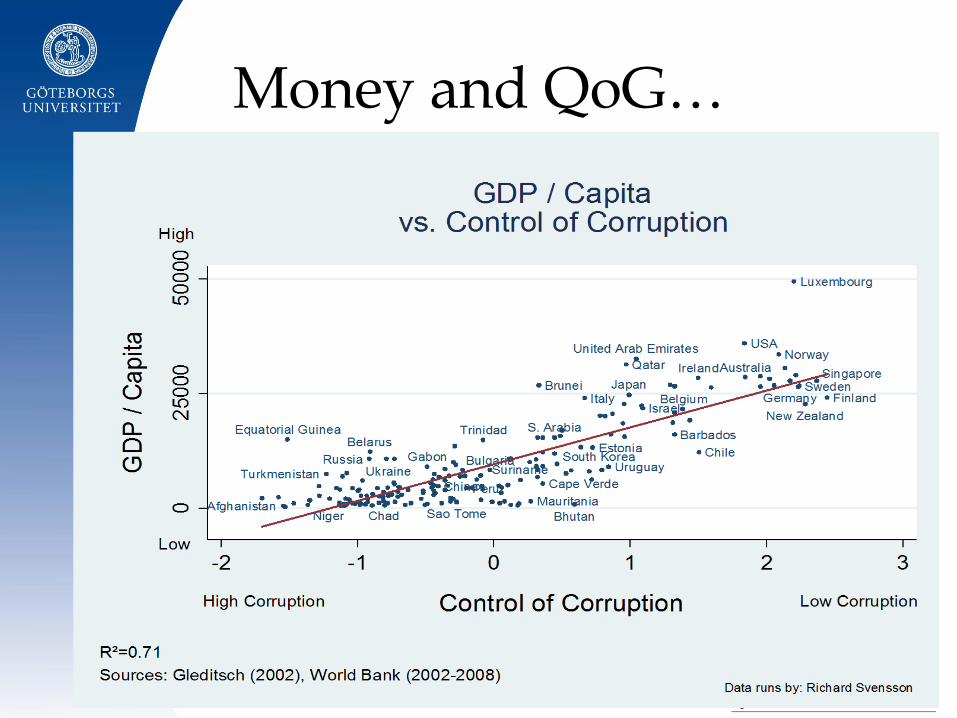
Money and QoG…
Where is the QoG problem located?
• Is the problem in the laws?
• If not laws, is the problem ”in the
culture?
• No – hardly any evidence
• No – hopeless from a policy
perspective
• If not laws (formal institutions) and
not culture, then what?
Two types of norms
1.Moral norms: What is right, what is
wrong?
2.Norms as social practice. ”This is
how we usually do things here”
3.These type of norms are very
different and can be opposed
What is it then?
Why is this important?
• Most countries (and regions) with
low QoG already have ”good” laws
• The ”culturalist” approach is
empirically not substantiated and
policywise impossible
• But, there is knowledge about how
to change ”standard operating
procedures”
The ’European Quality of Government Index’ (EQI) - background
• Almost all existing corruption/ QoG data (from the mid-1990s) at national-level. Limits research and policy debate
• Data demand: 2010, 1st (and only) mulit-country, sub national data on QoG to date. Funded by EU Commission (REGIO). Repeated in 2013 & 2017
• QoG Composite Index for 200+ E.U. regions
• The study is based on a citizen-survey of respondents in EU. They are the ’consumers’ of QoG (Contrast to many expert-based measures)
• Unit is NUTS 1 or 2 region – 400-450 respondents per region.
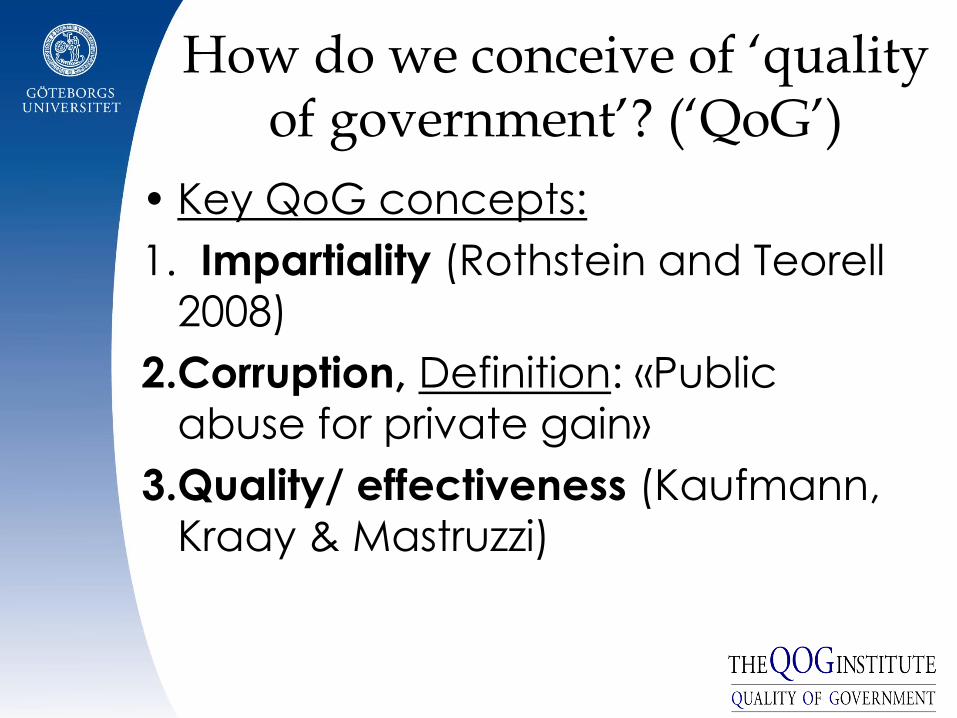
How do we conceive of ‘quality of government’? (‘QoG’)
• Key QoG concepts:
1. Impartiality (Rothstein and Teorell
2008)
2.Corruption, Definition: «Public
abuse for private gain»
3.Quality/ effectiveness (Kaufmann,
Kraay & Mastruzzi)
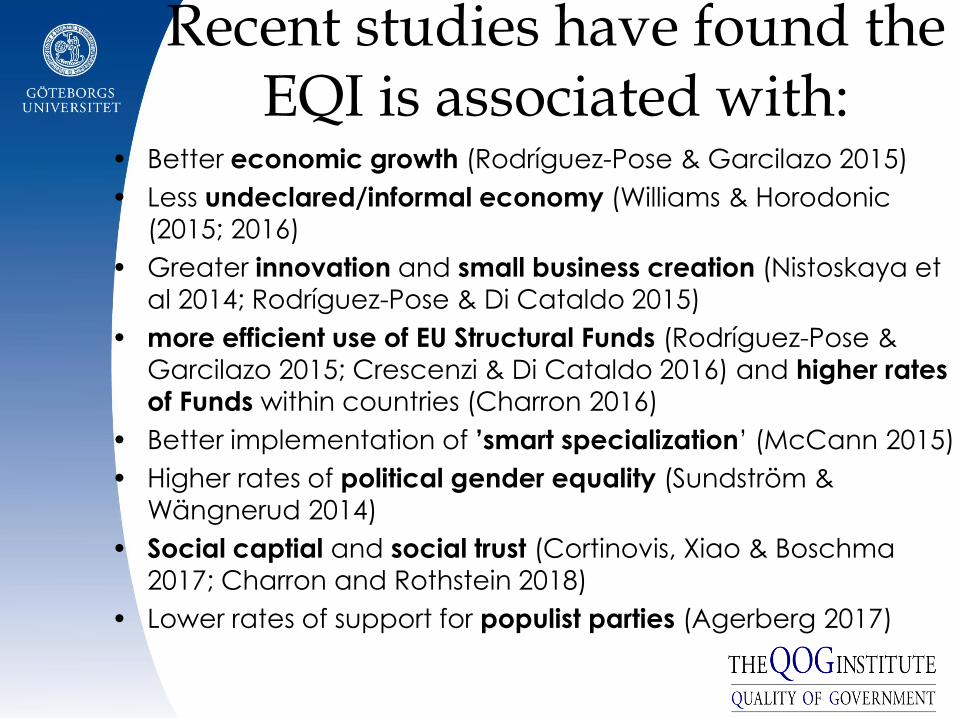
Recent studies have found the EQI is associated with:
• Better economic growth (Rodríguez-Pose & Garcilazo 2015)
• Less undeclared/informal economy (Williams & Horodonic
(2015; 2016)
• Greater innovation and small business creation (Nistoskaya et
al 2014; Rodríguez-Pose & Di Cataldo 2015)
• more efficient use of EU Structural Funds (Rodríguez-Pose &
Garcilazo 2015; Crescenzi & Di Cataldo 2016) and higher rates
of Funds within countries (Charron 2016)
• Better implementation of ’smart specialization’ (McCann 2015)
• Higher rates of political gender equality (Sundström &
Wängnerud 2014)
• Social captial and social trust (Cortinovis, Xiao & Boschma 2017; Charron and Rothstein 2018)
• Lower rates of support for populist parties (Agerberg 2017)
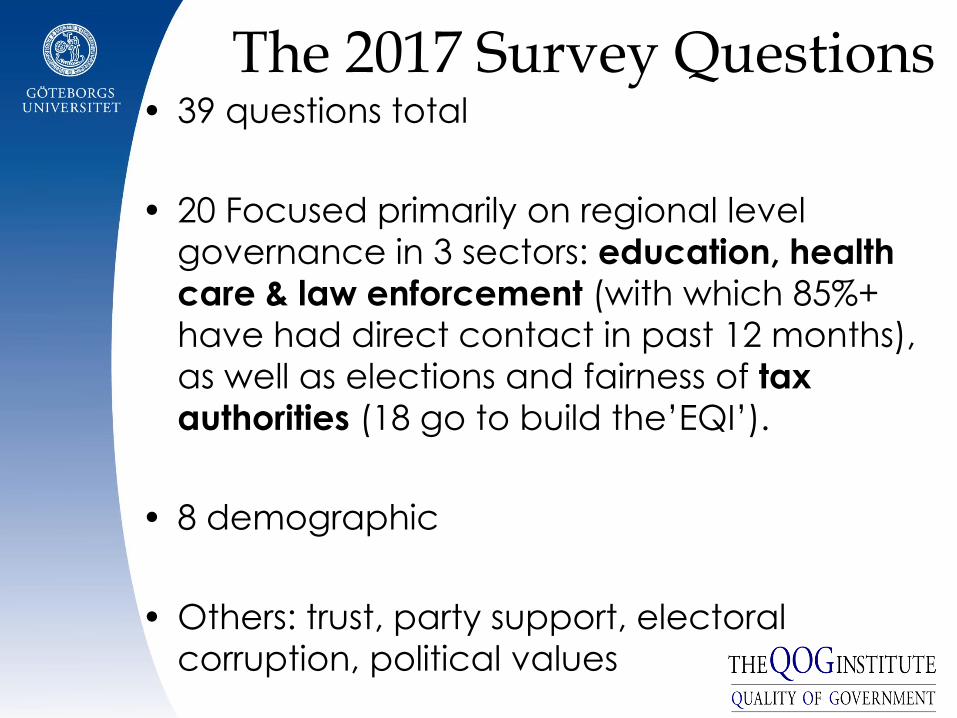
The 2017 Survey Questions • 39 questions total
• 20 Focused primarily on regional level
governance in 3 sectors: education, health care & law enforcement (with which 85%+
have had direct contact in past 12 months),
as well as elections and fairness of tax authorities (18 go to build the’EQI’).
• 8 demographic
• Others: trust, party support, electoral
corruption, political values
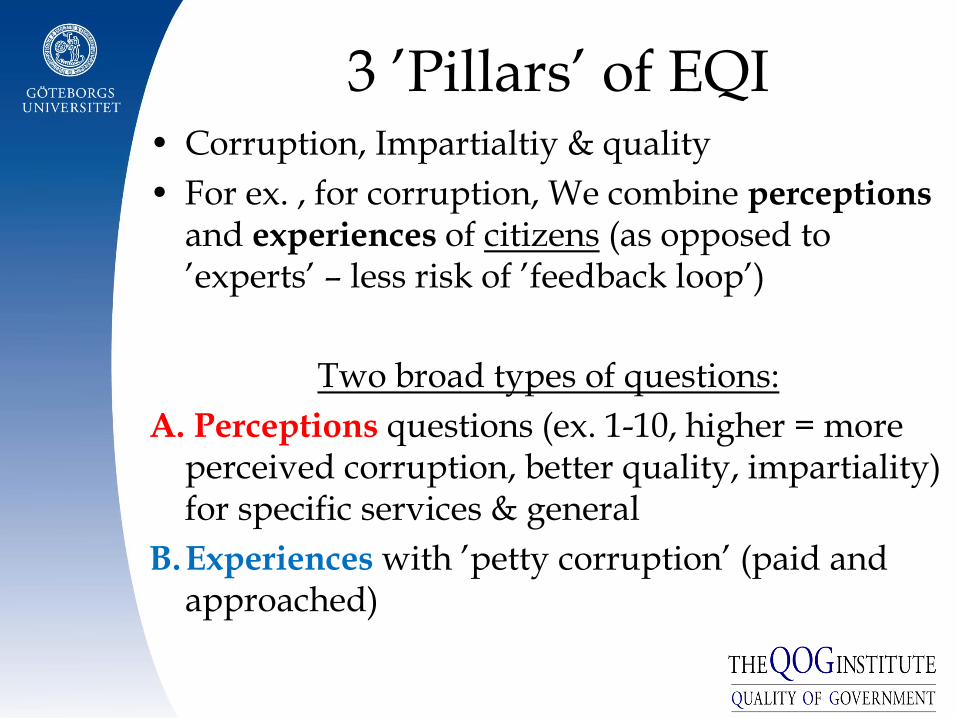
3 ’Pillars’ of EQI • Corruption, Impartialtiy & quality
• For ex. , for corruption, We combine perceptions and experiences of citizens (as opposed to ’experts’ – less risk of ’feedback loop’)
Two broad types of questions:
A. Perceptions questions (ex. 1-10, higher = more perceived corruption, better quality, impartiality) for specific services & general
B.Experiences with ’petty corruption’ (paid and approached)
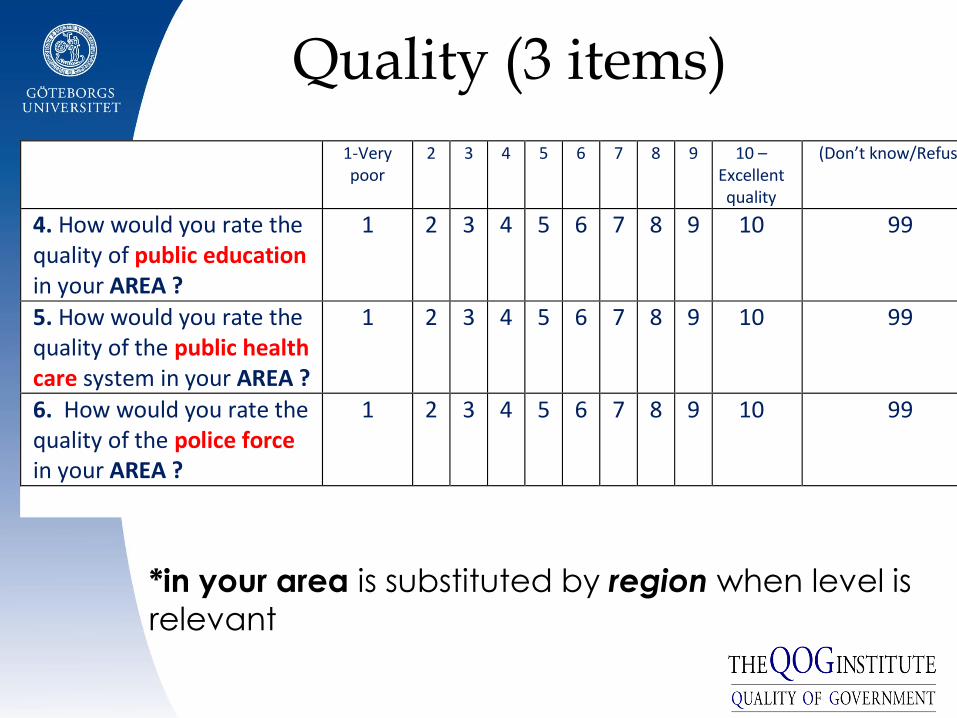
Quality (3 items)
*in your area is substituted by region when level is
relevant
1-Very poor
2 3 4 5 6 7 8 9 10 – Excellent quality
(Don’t know/Refused)
4. How would you rate the quality of public education in your AREA ?
1 2 3 4 5 6 7 8 9 10 99
5. How would you rate the quality of the public health care system in your AREA ?
1 2 3 4 5 6 7 8 9 10 99
6. How would you rate the quality of the police force in your AREA ?
1 2 3 4 5 6 7 8 9 10 99
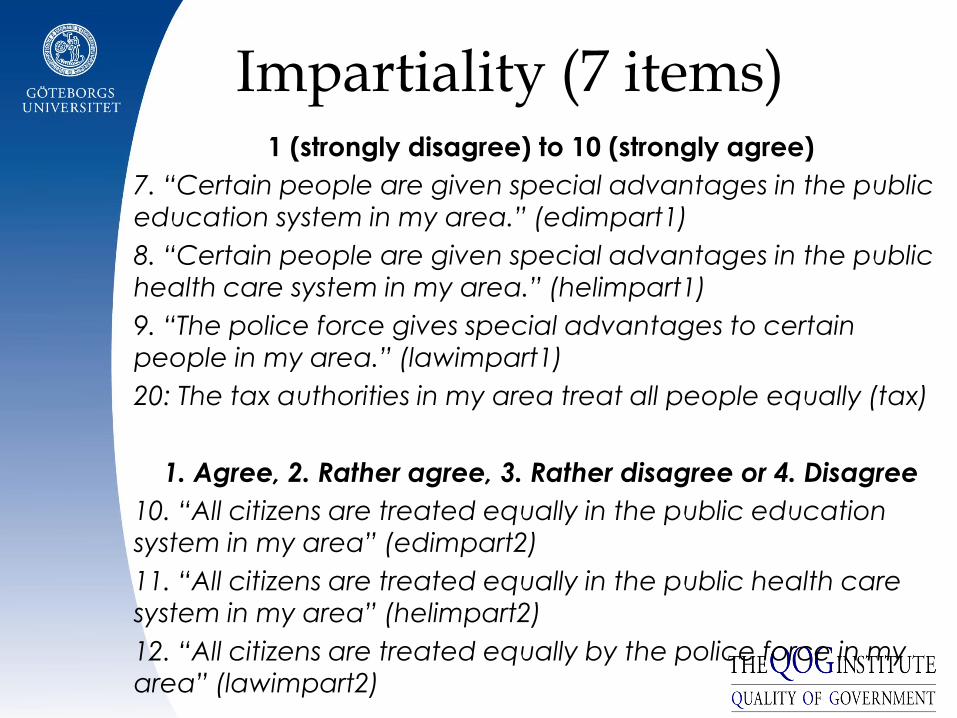
Impartiality (7 items) 1 (strongly disagree) to 10 (strongly agree)
7. “Certain people are given special advantages in the public education system in my area.” (edimpart1)
8. “Certain people are given special advantages in the public
health care system in my area.” (helimpart1)
9. “The police force gives special advantages to certain people in my area.” (lawimpart1)
20: The tax authorities in my area treat all people equally (tax)
1. Agree, 2. Rather agree, 3. Rather disagree or 4. Disagree
10. “All citizens are treated equally in the public education
system in my area” (edimpart2)
11. “All citizens are treated equally in the public health care system in my area” (helimpart2)
12. “All citizens are treated equally by the police force in my
area” (lawimpart2)
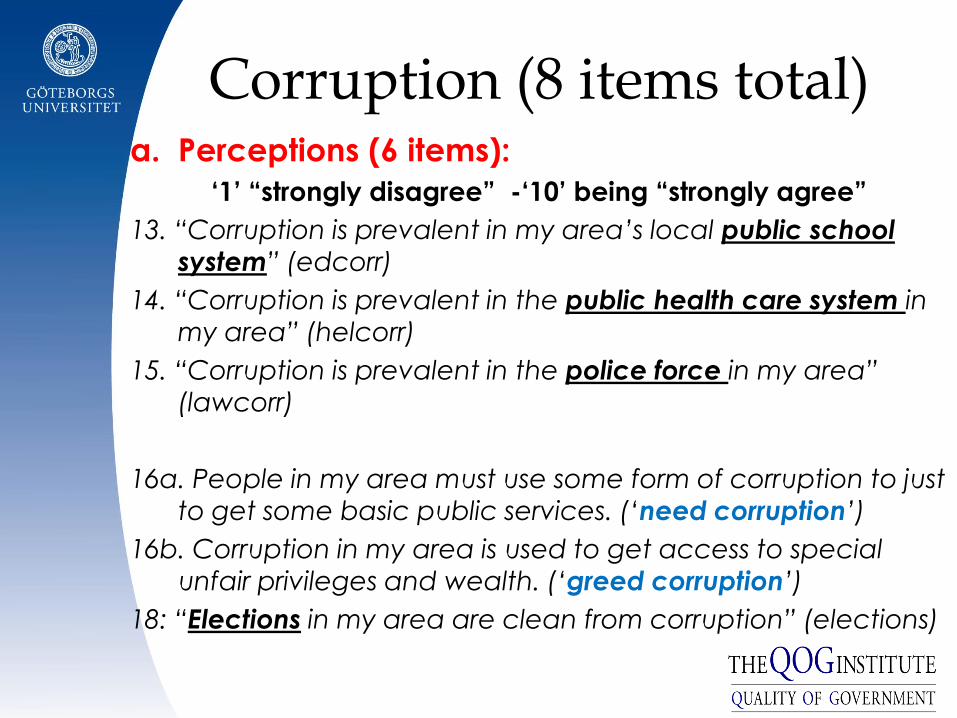
Corruption (8 items total) a. Perceptions (6 items):
‘1’ “strongly disagree” -‘10’ being “strongly agree”
13. “Corruption is prevalent in my area’s local public school
system” (edcorr)
14. “Corruption is prevalent in the public health care system in
my area” (helcorr)
15. “Corruption is prevalent in the police force in my area”
(lawcorr)
16a. People in my area must use some form of corruption to just
to get some basic public services. (‘need corruption’)
16b. Corruption in my area is used to get access to special
unfair privileges and wealth. (‘greed corruption’)
18: “Elections in my area are clean from corruption” (elections)
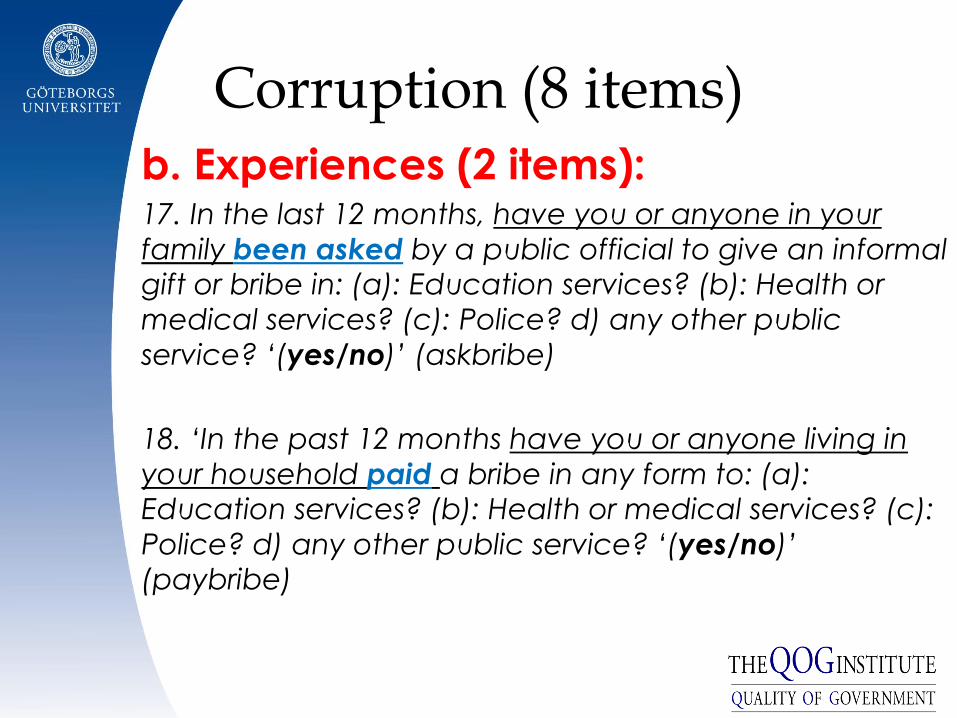
Corruption (8 items) b. Experiences (2 items): 17. In the last 12 months, have you or anyone in your
family been asked by a public official to give an informal
gift or bribe in: (a): Education services? (b): Health or
medical services? (c): Police? d) any other public
service? ‘(yes/no)’ (askbribe)
18. ‘In the past 12 months have you or anyone living in
your household paid a bribe in any form to: (a): Education services? (b): Health or medical services? (c):
Police? d) any other public service? ‘(yes/no)’ (paybribe)

Experiences over time: EU15 vs E13 (NMS), weighted estimates
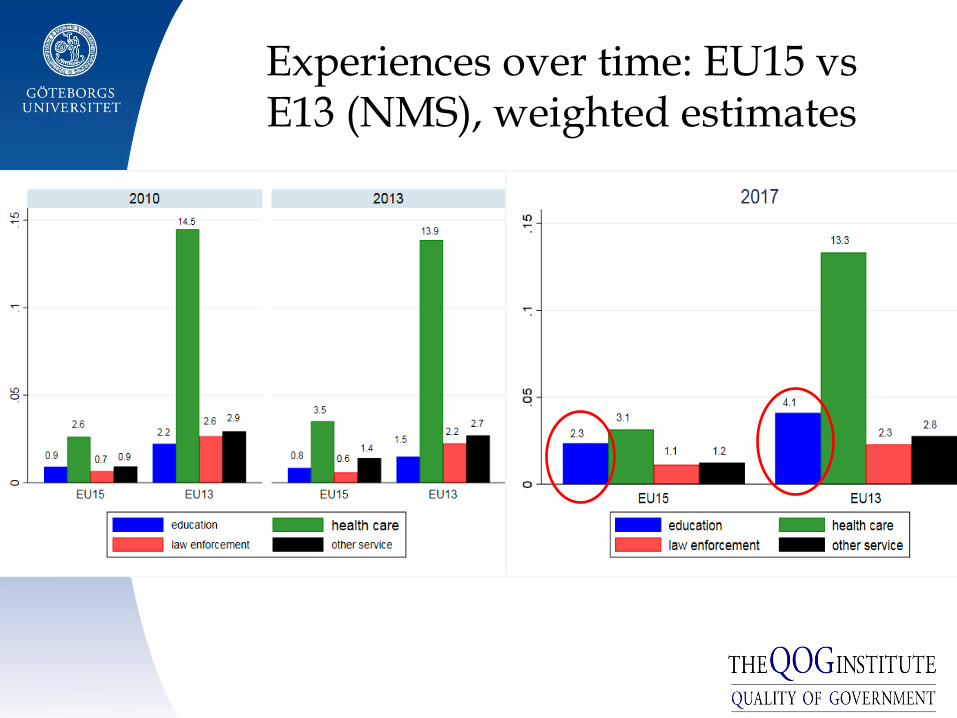
Experiences over time: EU15 vs E13 (NMS), weighted estimates
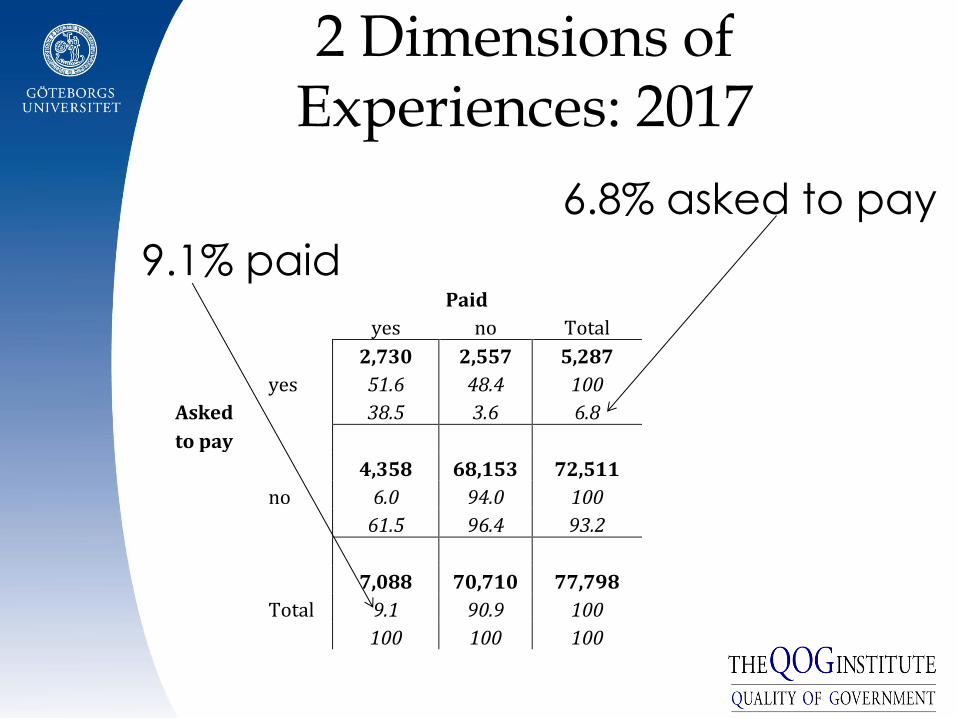
2 Dimensions of Experiences: 2017
6.8% asked to pay
9.1% paid
Paid
yes no Total
2,730 2,557 5,287
yes 51.6 48.4 100
Asked
38.5 3.6 6.8
to pay
4,358 68,153 72,511
no 6.0 94.0 100
61.5 96.4 93.2
7,088 70,710 77,798
Total 9.1 90.9 100
100 100 100
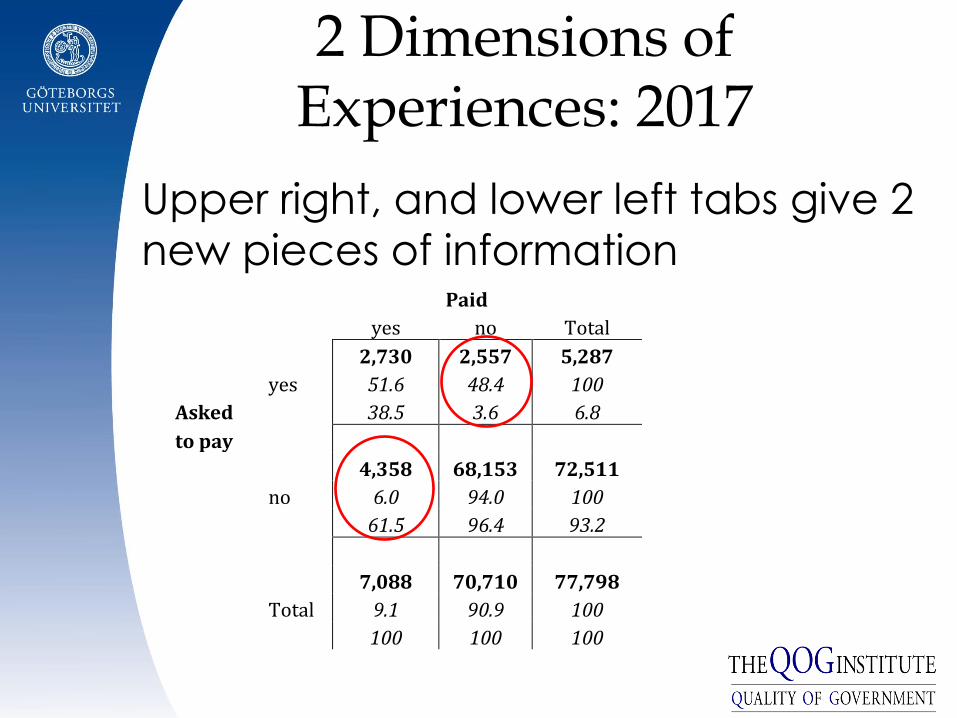
2 Dimensions of Experiences: 2017
Upper right, and lower left tabs give 2
new pieces of information
Paid
yes no Total
2,730 2,557 5,287
yes 51.6 48.4 100
Asked
38.5 3.6 6.8
to pay
4,358 68,153 72,511
no 6.0 94.0 100
61.5 96.4 93.2
7,088 70,710 77,798
Total 9.1 90.9 100
100 100 100
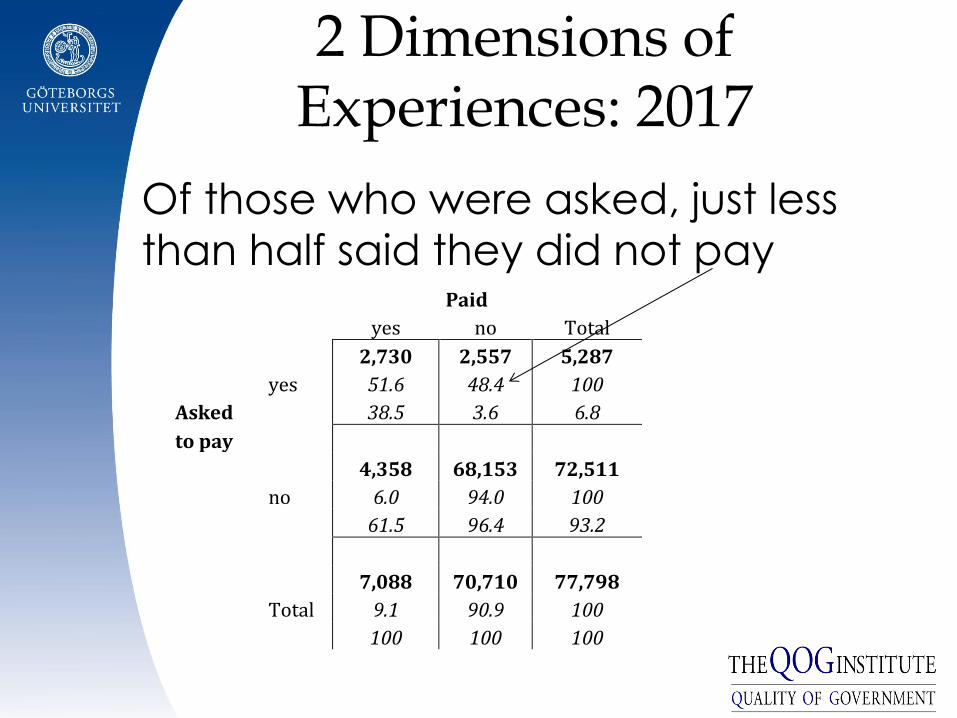
2 Dimensions of Experiences: 2017
Of those who were asked, just less
than half said they did not pay
Paid
yes no Total
2,730 2,557 5,287
yes 51.6 48.4 100
Asked
38.5 3.6 6.8
to pay
4,358 68,153 72,511
no 6.0 94.0 100
61.5 96.4 93.2
7,088 70,710 77,798
Total 9.1 90.9 100
100 100 100
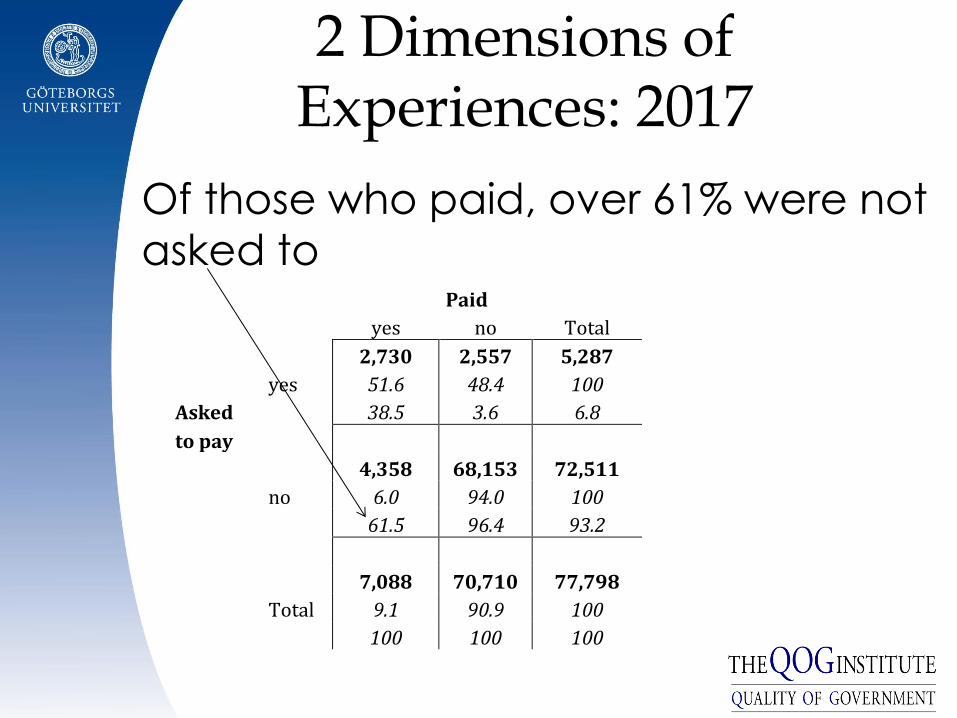
2 Dimensions of Experiences: 2017
Of those who paid, over 61% were not
asked to
Paid
yes no Total
2,730 2,557 5,287
yes 51.6 48.4 100
Asked
38.5 3.6 6.8
to pay
4,358 68,153 72,511
no 6.0 94.0 100
61.5 96.4 93.2
7,088 70,710 77,798
Total 9.1 90.9 100
100 100 100
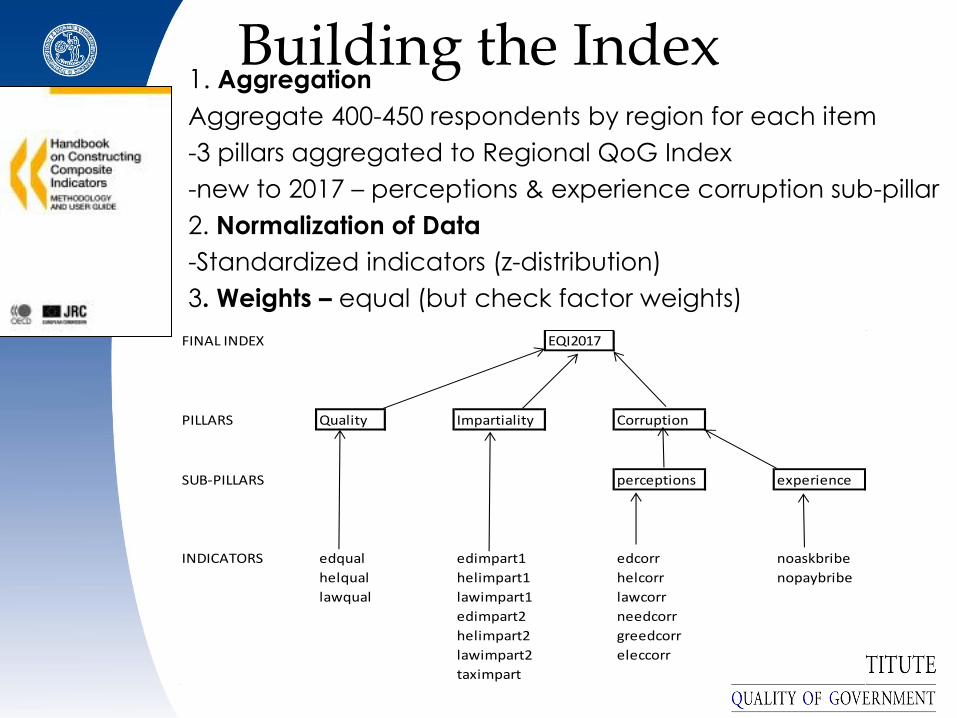
Building the Index 1. Aggregation
Aggregate 400-450 respondents by region for each item
-3 pillars aggregated to Regional QoG Index
-new to 2017 – perceptions & experience corruption sub-pillar
2. Normalization of Data
-Standardized indicators (z-distribution)
3. Weights – equal (but check factor weights)
FINAL INDEX EQI2017
PILLARS Quality Impartiality Corruption
SUB-PILLARS perceptions experience
INDICATORS edqual edimpart1 edcorr noaskbribe
helqual helimpart1 helcorr nopaybribe
lawqual lawimpart1 lawcorr
edimpart2 needcorr
helimpart2 greedcorr
lawimpart2 eleccorr
taximpart
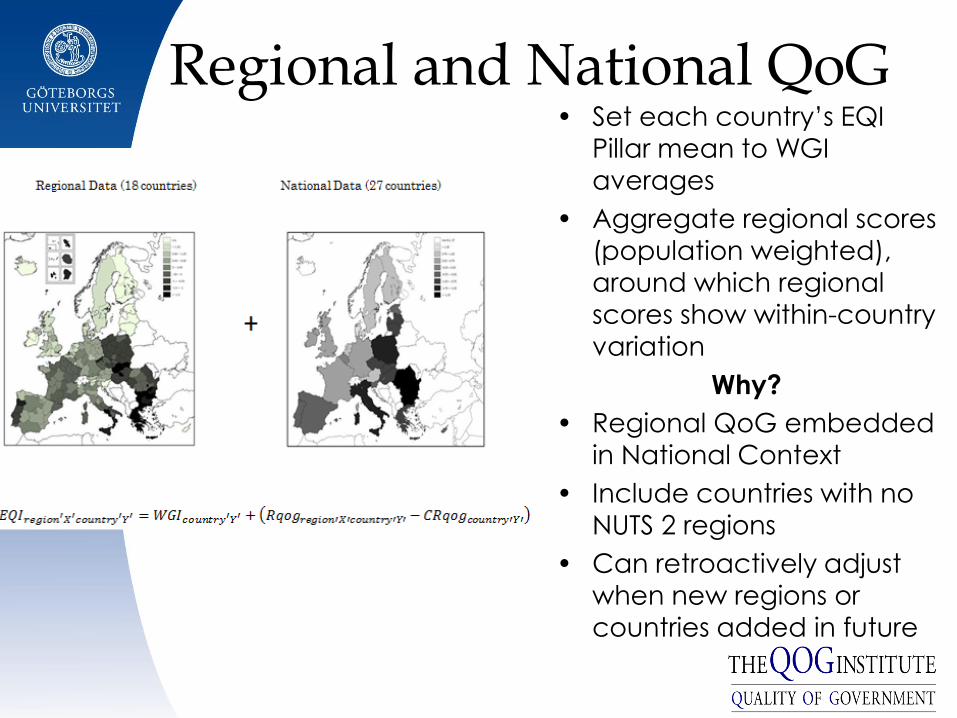
Regional and National QoG • Set each country’s EQI
Pillar mean to WGI
averages
• Aggregate regional scores
(population weighted),
around which regional
scores show within-country variation
Why?
• Regional QoG embedded
in National Context
• Include countries with no
NUTS 2 regions
• Can retroactively adjust when new regions or
countries added in future
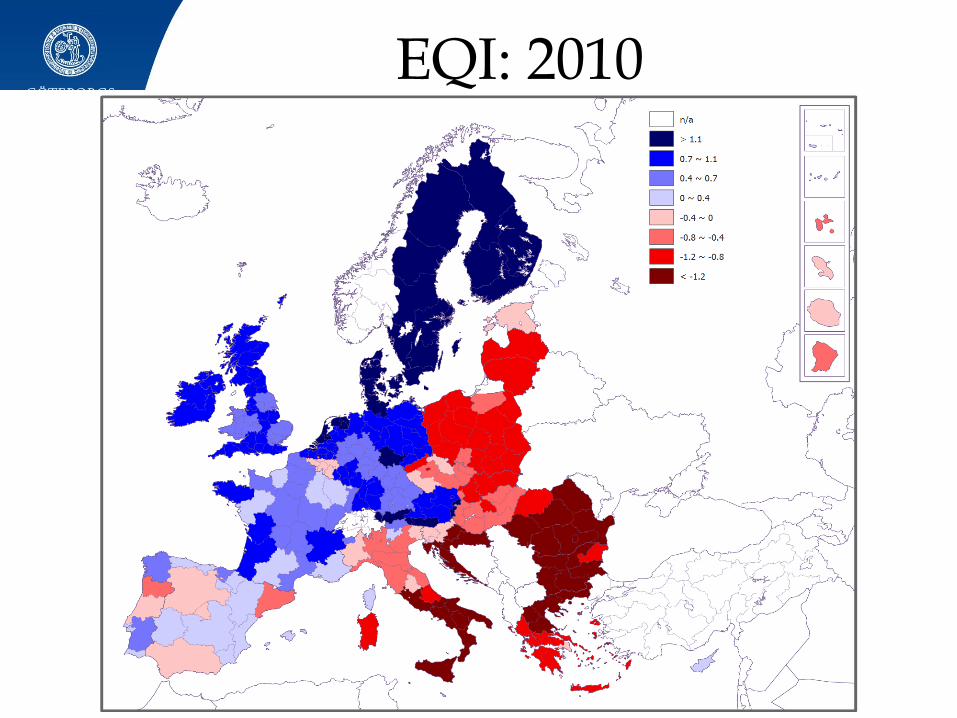
EQI: 2010
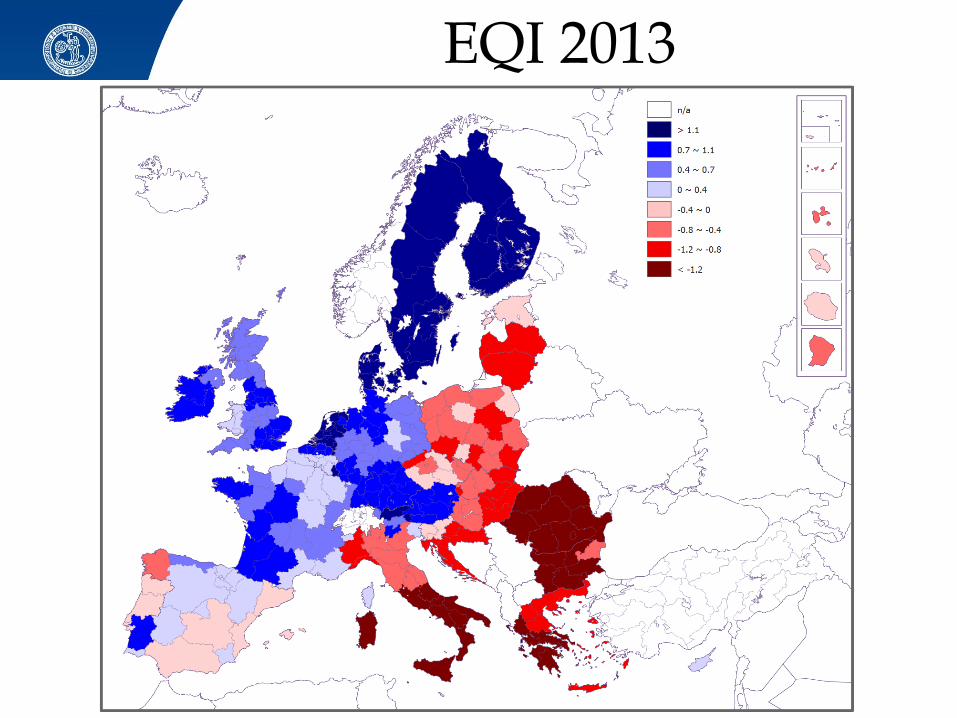
EQI 2013
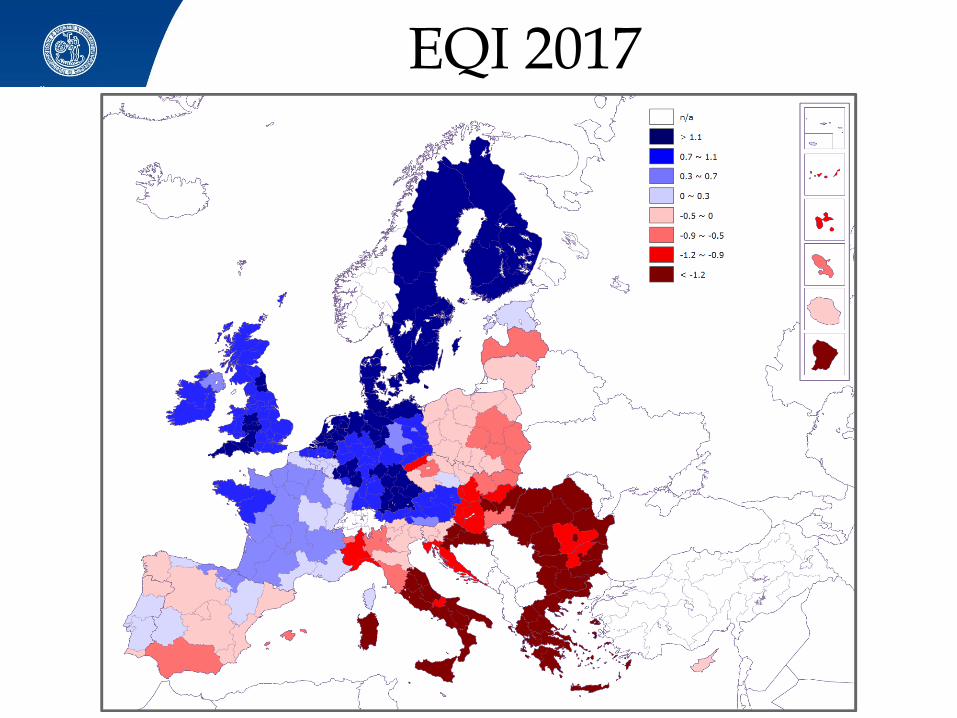
EQI 2017
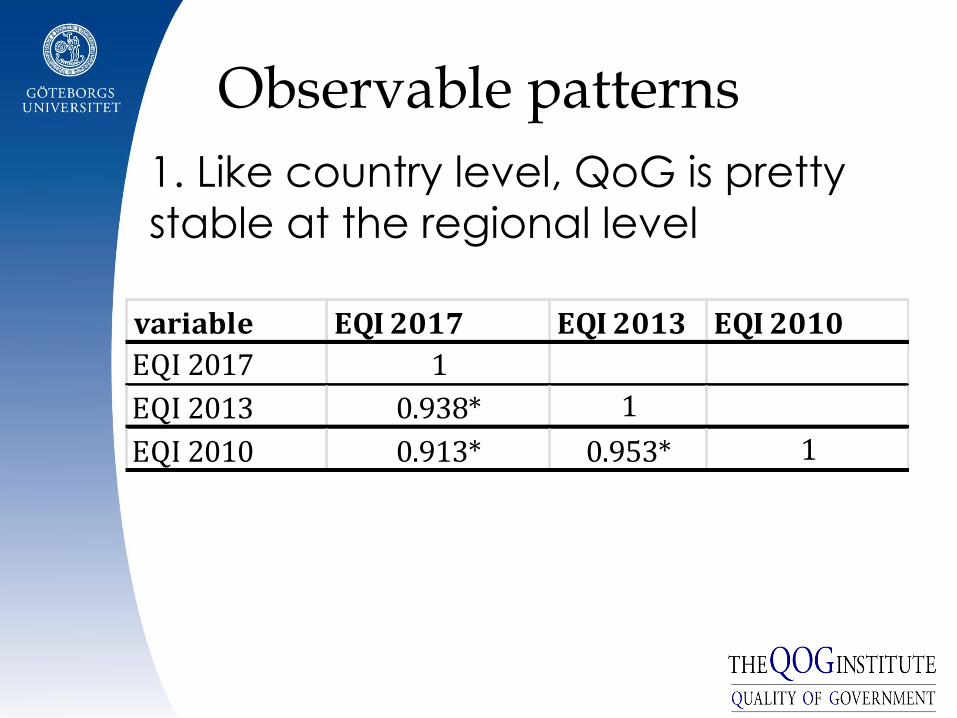
Observable patterns
1. Like country level, QoG is pretty
stable at the regional level
variable EQI 2017 EQI 2013 EQI 2010
EQI 2017 1
EQI 2013 0.938* 1
EQI 2010 0.913* 0.953* 1
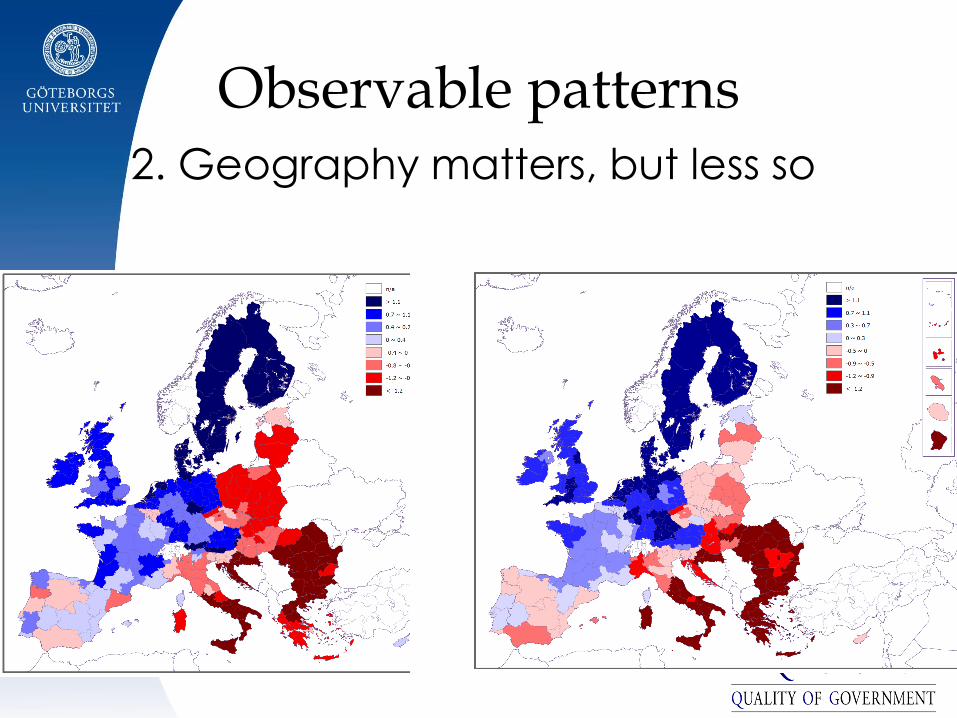
Observable patterns 2. Geography matters, but less so
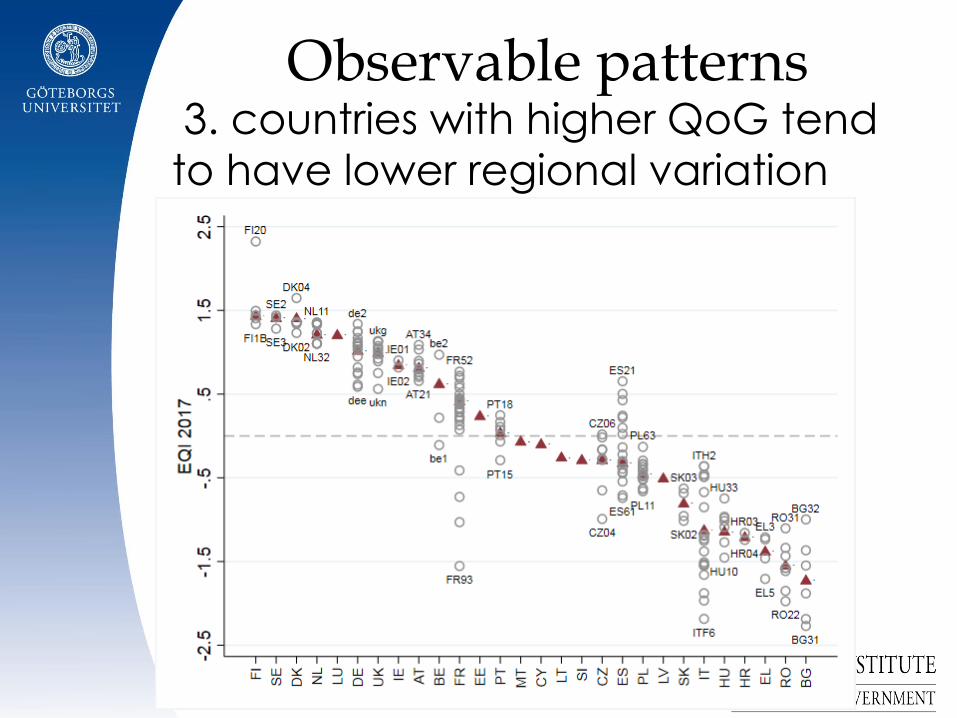
Observable patterns 3. countries with higher QoG tend
to have lower regional variation
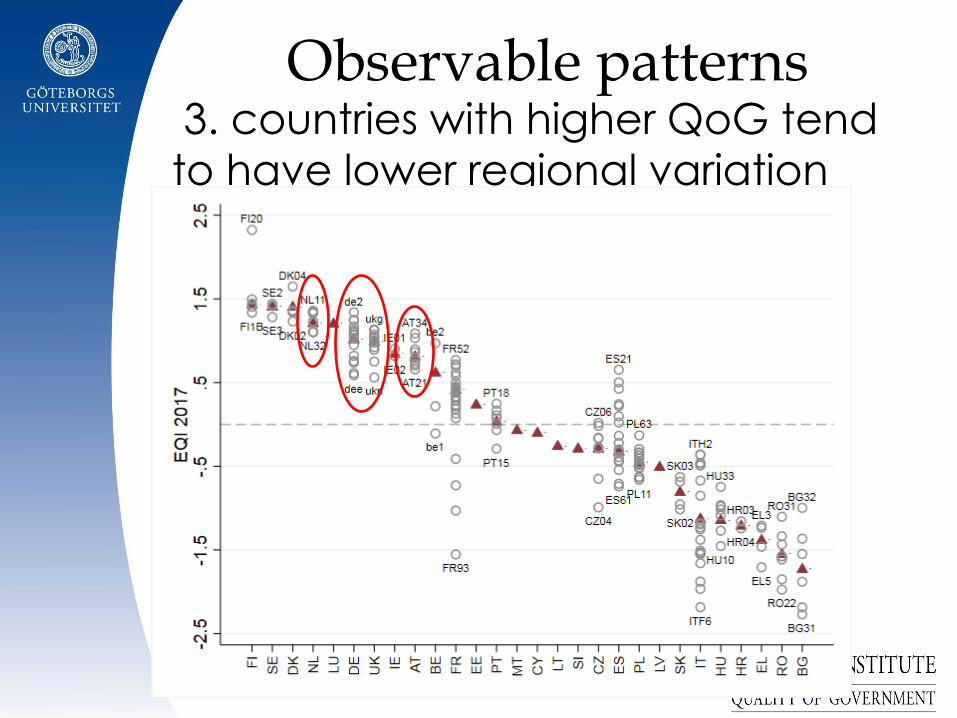
Observable patterns 3. countries with higher QoG tend
to have lower regional variation
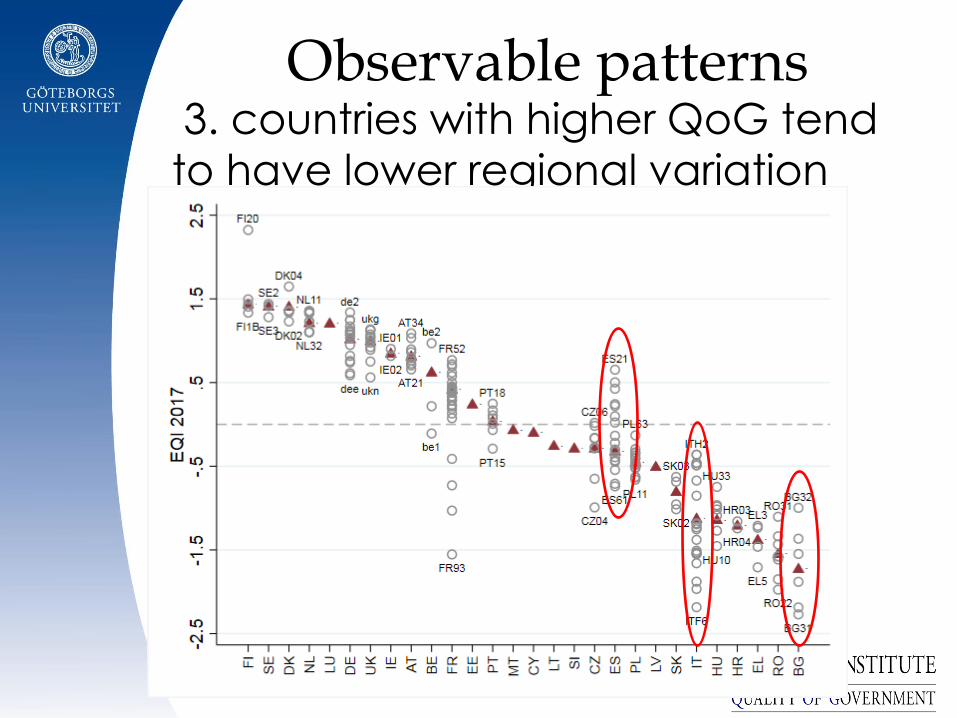
Observable patterns 3. countries with higher QoG tend
to have lower regional variation
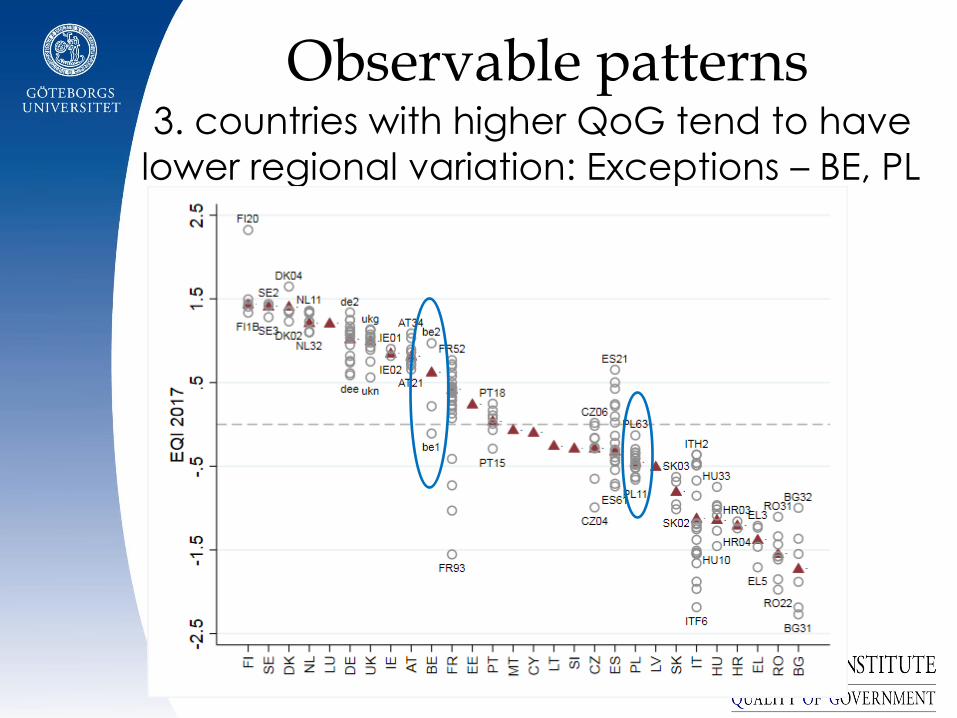
Observable patterns 3. countries with higher QoG tend to have
lower regional variation: Exceptions – BE, PL
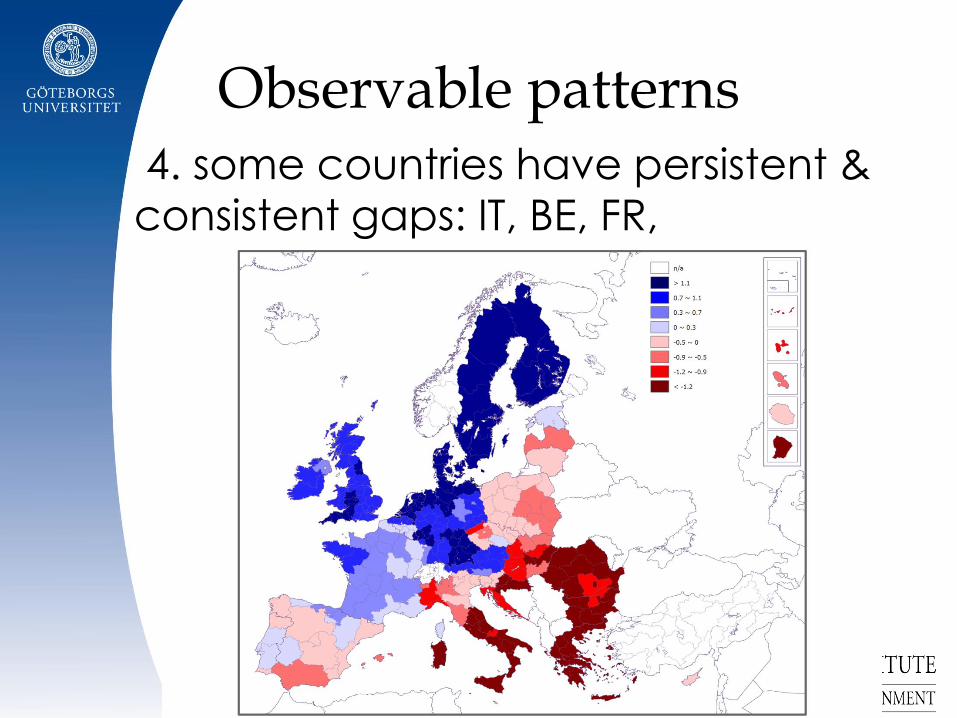
Observable patterns 4. some countries have persistent &
consistent gaps: IT, BE, FR,
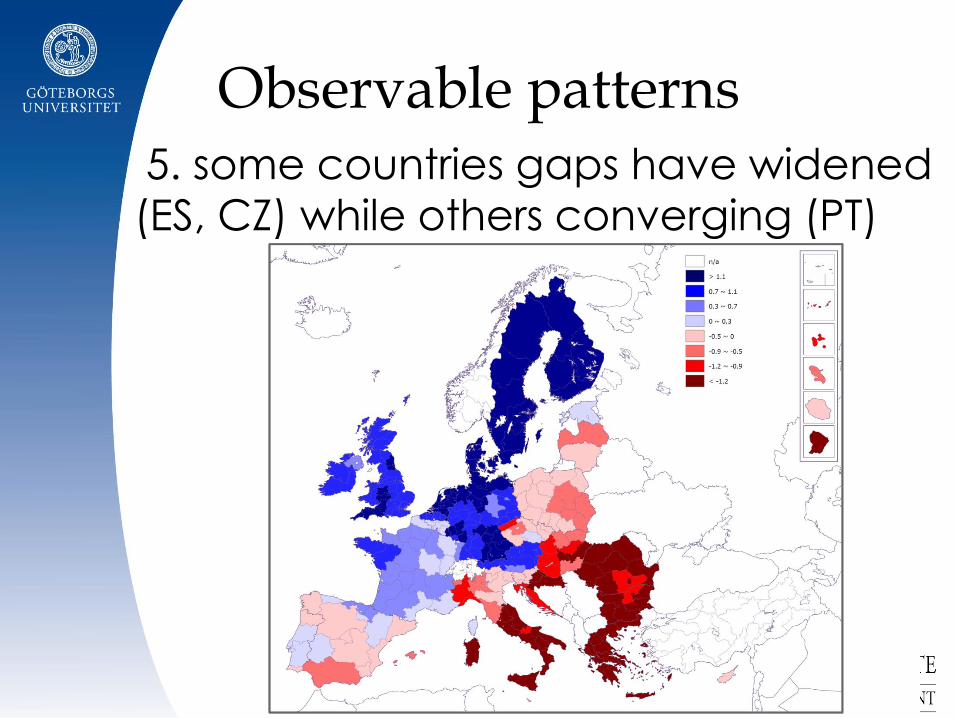
Observable patterns 5. some countries gaps have widened
(ES, CZ) while others converging (PT)
Observable patters
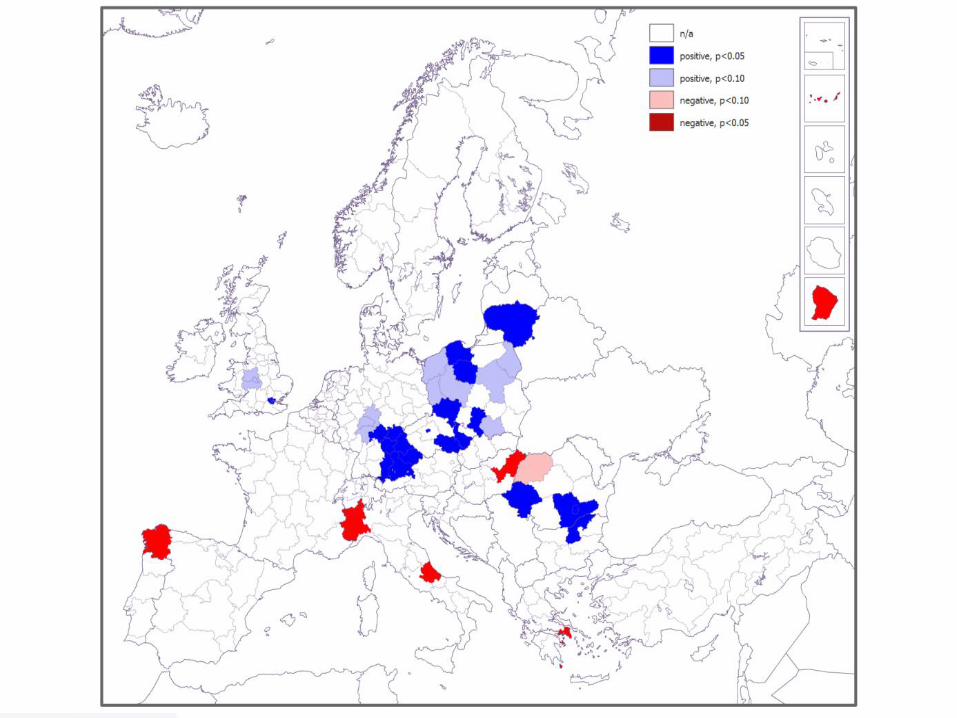
Testing trends over time
3 data points for each region gives
us (albeit limited) infomation about
trends in QoG, 2010-2017
Using statistical analysis, we test for
signficant (positive or negative)
changes
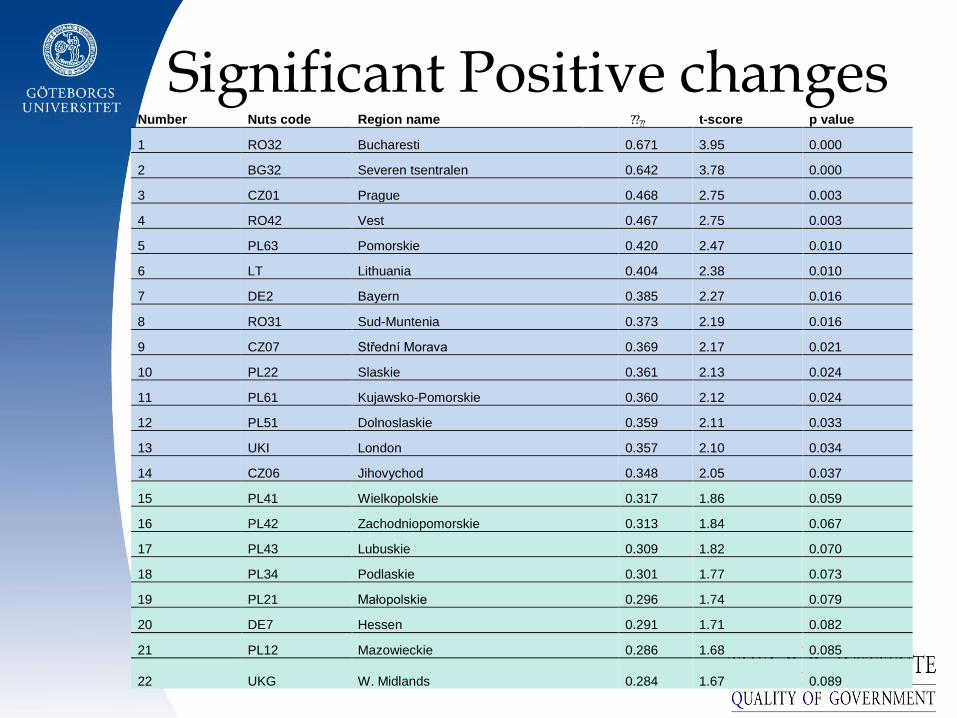
Significant Positive changes Number Nuts code Region name ???? t-score p value
1 RO32 Bucharesti 0.671 3.95 0.000
2 BG32 Severen tsentralen 0.642 3.78 0.000
3 CZ01 Prague 0.468 2.75 0.003
4 RO42 Vest 0.467 2.75 0.003
5 PL63 Pomorskie 0.420 2.47 0.010
6 LT Lithuania 0.404 2.38 0.010
7 DE2 Bayern 0.385 2.27 0.016
8 RO31 Sud-Muntenia 0.373 2.19 0.016
9 CZ07 Střední Morava 0.369 2.17 0.021
10 PL22 Slaskie 0.361 2.13 0.024
11 PL61 Kujawsko-Pomorskie 0.360 2.12 0.024
12 PL51 Dolnoslaskie 0.359 2.11 0.033
13 UKI London 0.357 2.10 0.034
14 CZ06 Jihovychod 0.348 2.05 0.037
15 PL41 Wielkopolskie 0.317 1.86 0.059
16 PL42 Zachodniopomorskie 0.313 1.84 0.067
17 PL43 Lubuskie 0.309 1.82 0.070
18 PL34 Podlaskie 0.301 1.77 0.073
19 PL21 Małopolskie 0.296 1.74 0.079
20 DE7 Hessen 0.291 1.71 0.082
21 PL12 Mazowieckie 0.286 1.68 0.085
22 UKG W. Midlands 0.284 1.67 0.089
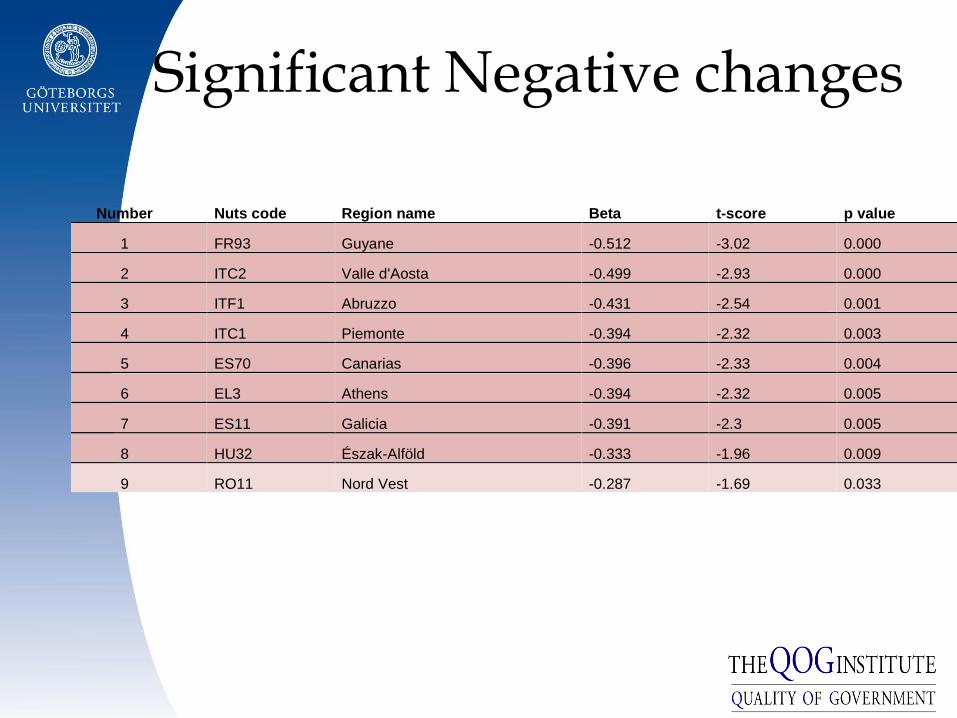
Significant Negative changes
Number Nuts code Region name Beta t-score p value
1 FR93 Guyane -0.512 -3.02 0.000
2 ITC2 Valle d'Aosta -0.499 -2.93 0.000
3 ITF1 Abruzzo -0.431 -2.54 0.001
4 ITC1 Piemonte -0.394 -2.32 0.003
5 ES70 Canarias -0.396 -2.33 0.004
6 EL3 Athens -0.394 -2.32 0.005
7 ES11 Galicia -0.391 -2.3 0.005
8 HU32 Észak-Alföld -0.333 -1.96 0.009
9 RO11 Nord Vest -0.287 -1.69 0.033
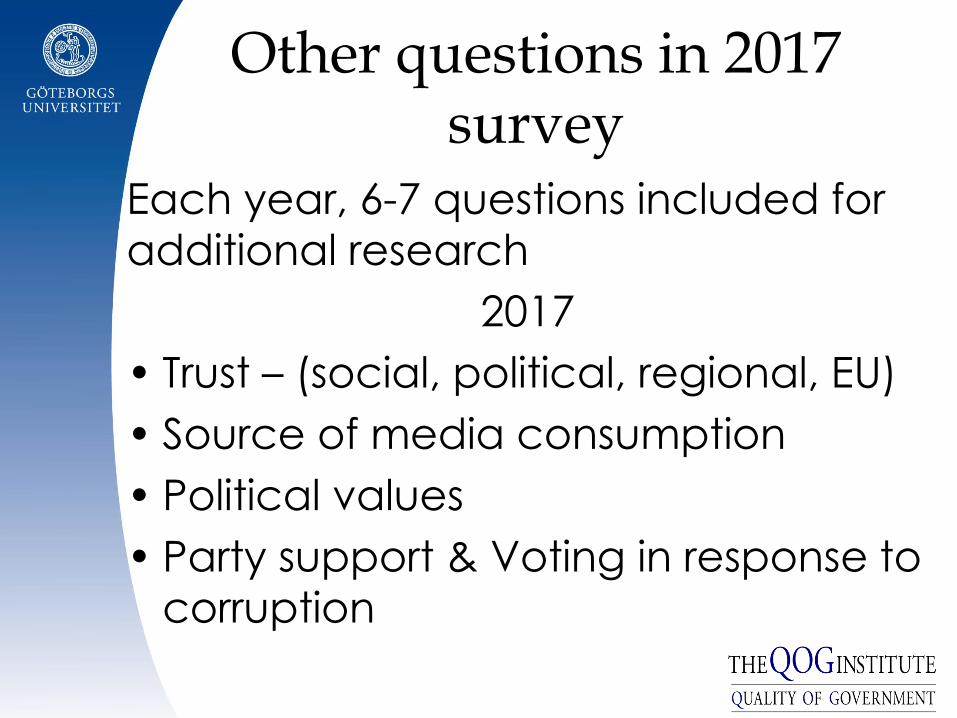
Other questions in 2017 survey
Each year, 6-7 questions included for
additional research
2017
• Trust – (social, political, regional, EU)
• Source of media consumption
• Political values
• Party support & Voting in response to
corruption
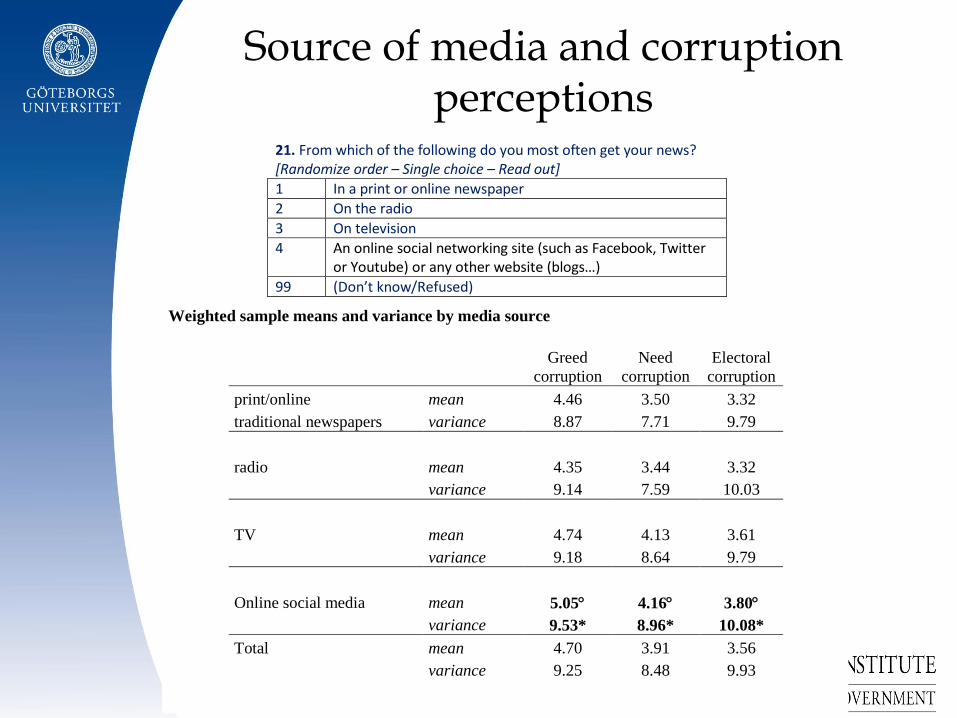
Source of media and corruption perceptions
Weighted sample means and variance by media source
Greed
corruption
Need
corruption
Electoral
corruption
print/online mean 4.46 3.50 3.32
traditional newspapers variance 8.87 7.71 9.79
radio mean 4.35 3.44 3.32
variance 9.14 7.59 10.03
TV mean 4.74 4.13 3.61
variance 9.18 8.64 9.79
Online social media mean 5.05 4.16 3.80
variance 9.53* 8.96* 10.08*
Total mean 4.70 3.91 3.56
variance 9.25 8.48 9.93
21. From which of the following do you most often get your news? [Randomize order – Single choice – Read out]
1 In a print or online newspaper
2 On the radio
3 On television
4 An online social networking site (such as Facebook, Twitter or Youtube) or any other website (blogs…)
99 (Don’t know/Refused)
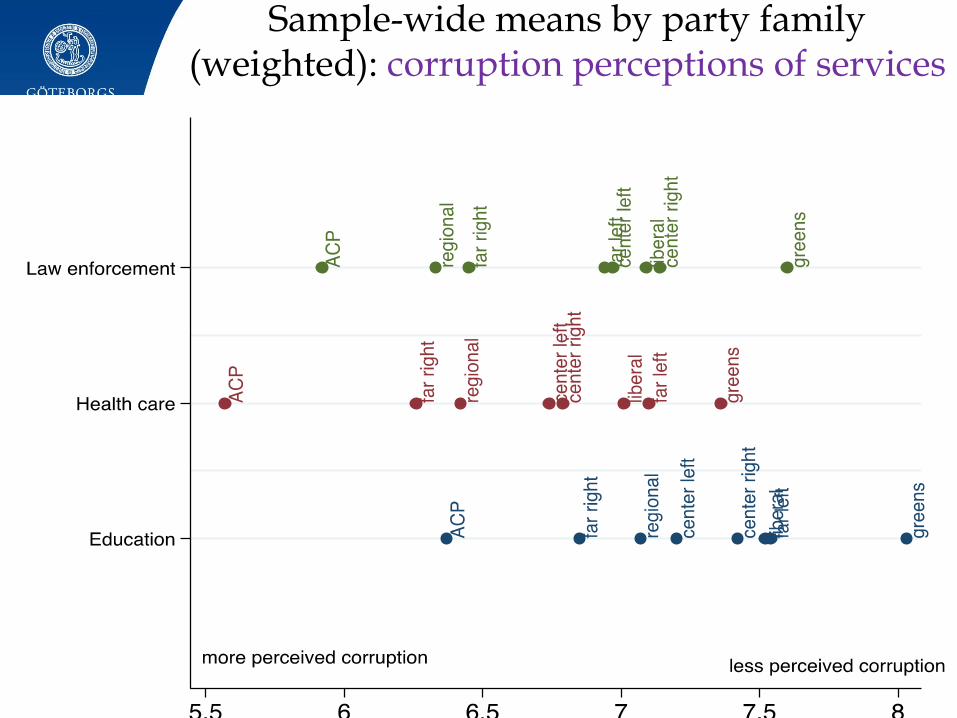
Sample-wide means by party family (weighted): corruption perceptions of services
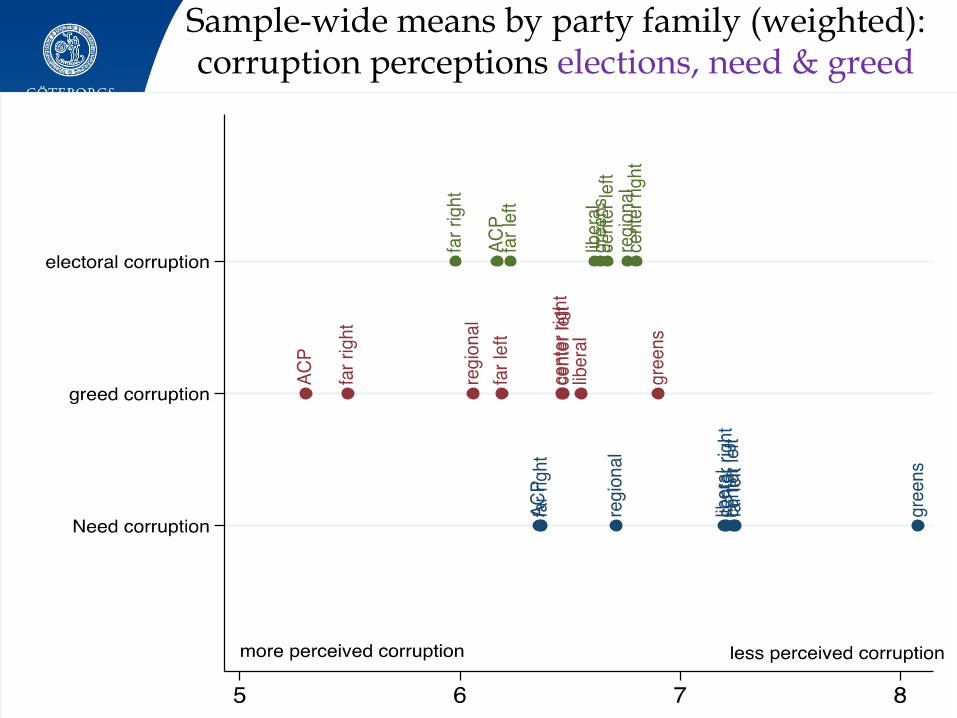
Sample-wide means by party family (weighted): corruption perceptions elections, need & greed
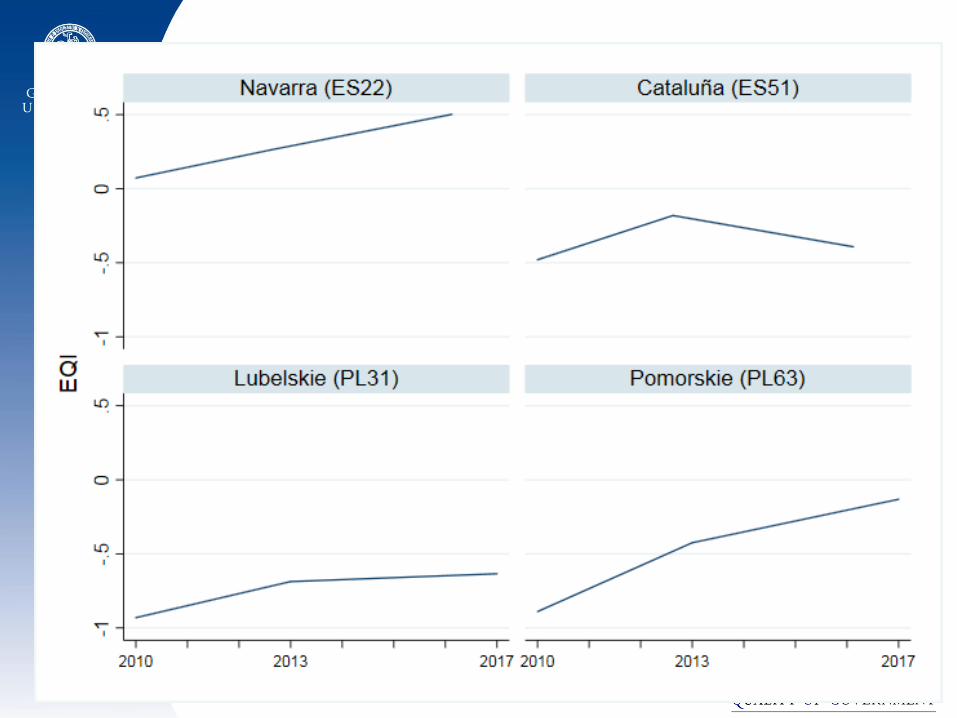
Further work in this project
• Investigate how political values and QoG
perceptions/experiences are related
(means, variances)
• Small-N study: Investigate two regions
with positive changes relative to ’control’
regions with (some) similar features
1. Pomorskie (PL63) & Lubelskie (PL31)
2. Navarra (ES22)& Catalonia (ES51)
Final remarks