Embed Size (px)
Citation preview

For professional investors only. This material is not suitable for retail clients
Schroders fixed incomeNiagara Institutional DialogueJune 2015
Alan Cauberghs, CFA Senior Investment Director, Fixed Income
� Quantitative easing (“QE”) – the right response?
� Structural market changes – liquidity gap
� Unintended consequences – a brave new world
� Outlook – what to expect going forward
2
Source: Schroders.
IntroductionA brave new world – did we think this through?

Quantitative easing

Quantitative easingStimulating real economy?
4
Source: BBC, The Telegraph, The Guardian
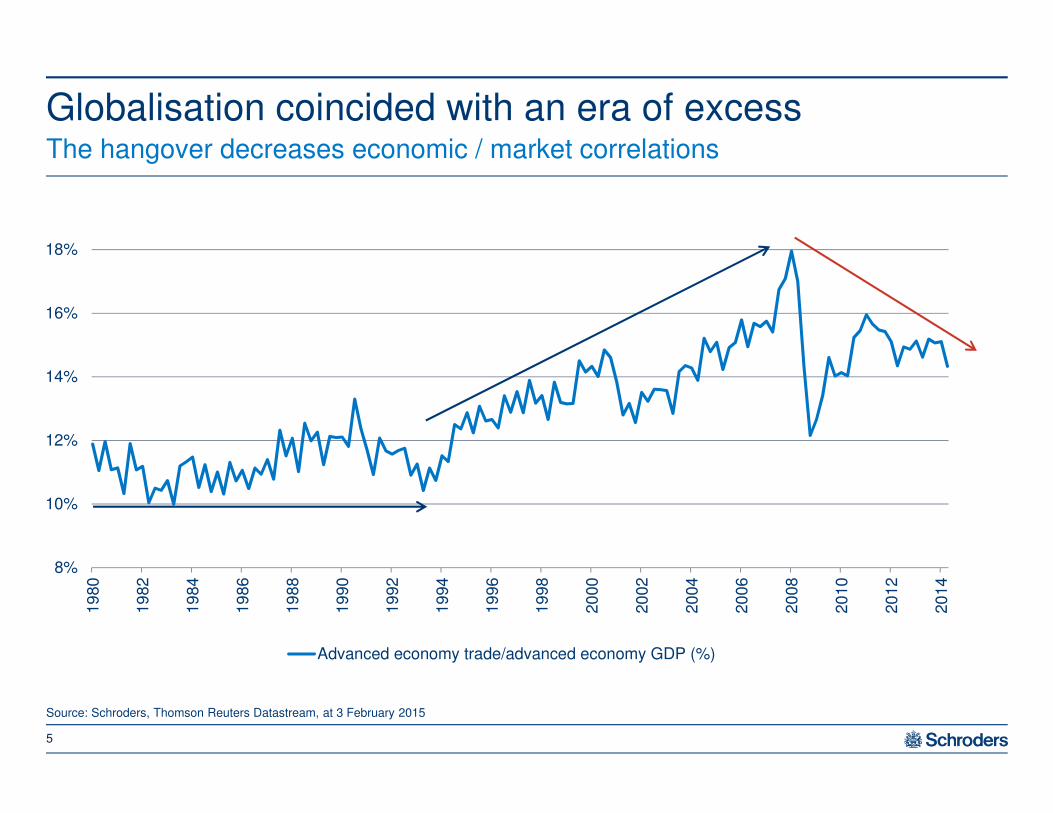
Globalisation coincided with an era of excessThe hangover decreases economic / market correlations
5
Source: Schroders, Thomson Reuters Datastream, at 3 February 2015
8%
10%
12%
14%
16%
18%
19
80
19
82
19
84
19
86
19
88
19
90
19
92
19
94
19
96
19
98
20
00
20
02
20
04
20
06
20
08
20
10
20
12
20
14
Advanced economy trade/advanced economy GDP (%)
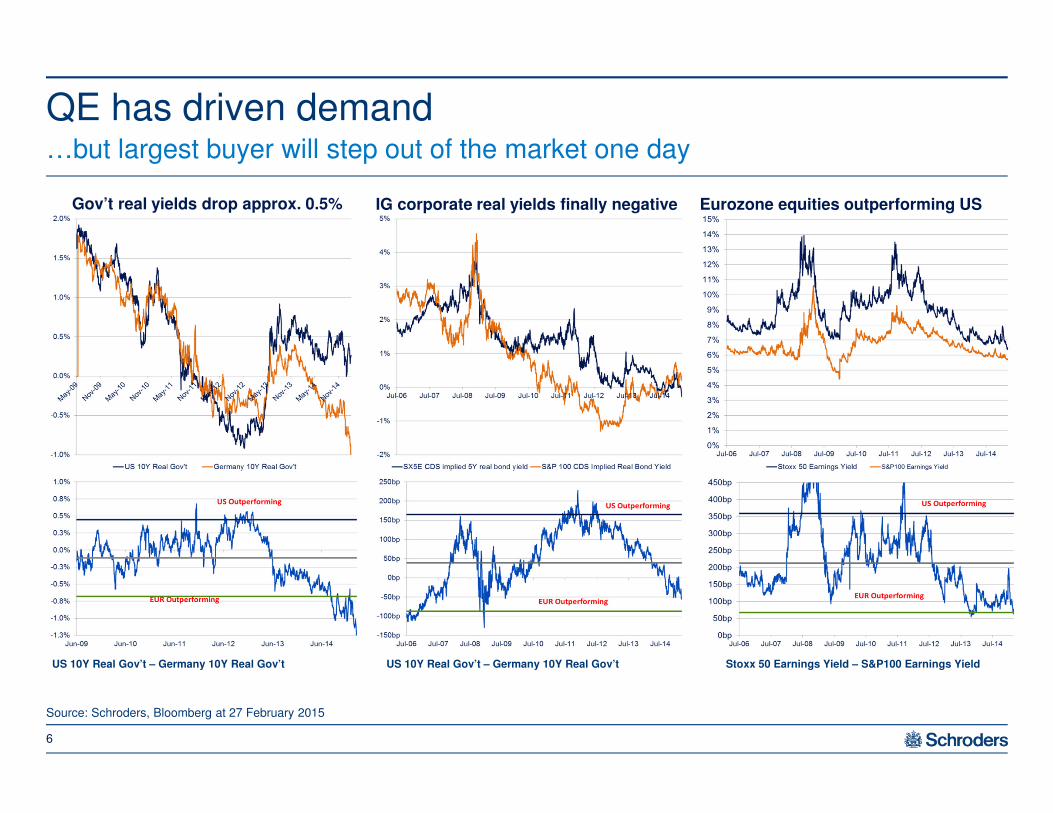
QE has driven demand…but largest buyer will step out of the market one day
Source: Schroders, Bloomberg at 27 February 2015
6
11/06/2015 12:30:48
Gov’t real yields drop approx. 0.5% IG corporate real yields finally negative Eurozone equities outperforming US
US 10Y Real Gov’t – Germany 10Y Real Gov’t US 10Y Real Gov’t – Germany 10Y Real Gov’t Stoxx 50 Earnings Yield – S&P100 Earnings Yield
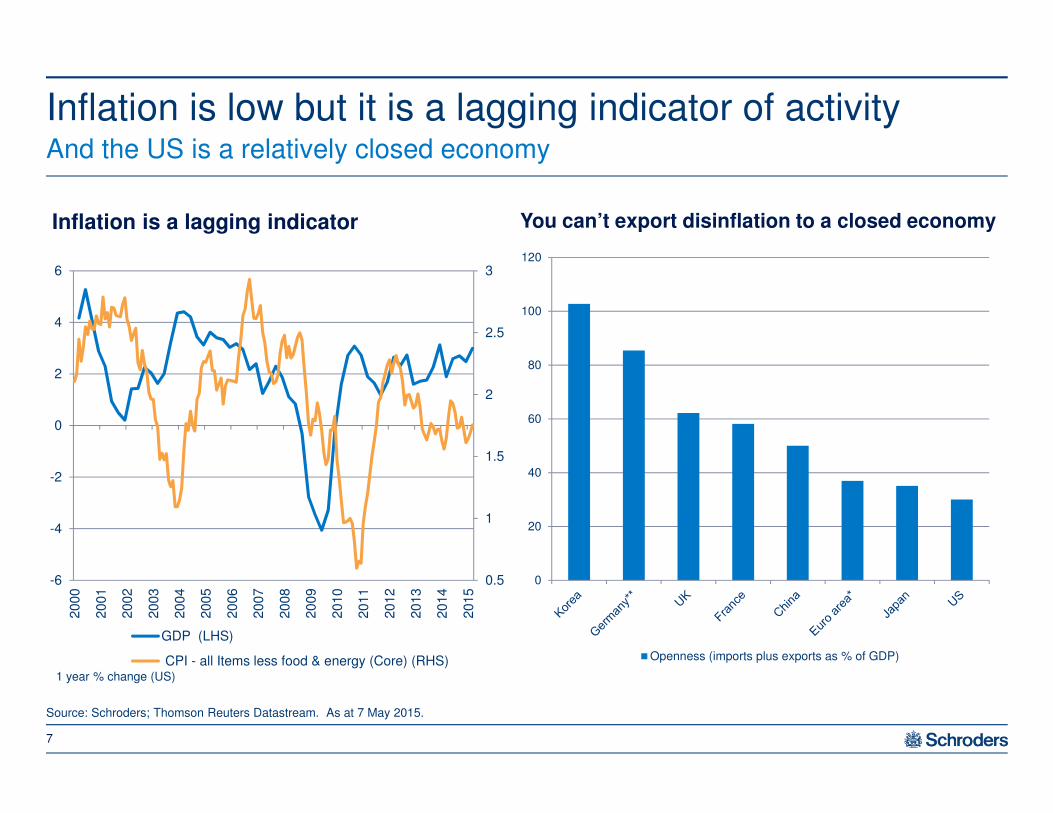
Inflation is low but it is a lagging indicator of activityAnd the US is a relatively closed economy
7
0.5
1
1.5
2
2.5
3
-6
-4
-2
0
2
4
6
2000
2001
2002
2003
2004
2005
2006
2007
2008
2009
2010
2011
2012
2013
2014
2015
1 year % change (US)
GDP (LHS)
CPI - all Items less food & energy (Core) (RHS)
Inflation is a lagging indicator You can’t export disinflation to a closed economy
0
20
40
60
80
100
120
Openness (imports plus exports as % of GDP)
Source: Schroders; Thomson Reuters Datastream. As at 7 May 2015.

8
Some 10 year government bond yields at all time lows
“Safe haven” assets are no longer safeFuture returns being brought forward – tomorrow’s lunch has been eaten
Source: Schroders; Thomson Reuters Datastream. As at 3 February 2015.
0%
10%
20%
30%
40%
50%
60%
70%
80%
90%
SZ GE SW NL FR AT BE JP FI
% of debt outstanding with negative yield
0.0
0.5
1.0
1.5
2.0
2.5
3.0
3.5
10 Year Govt YTM (%)
Unprecedented % of outstanding government bonds have negative yields

Structural market changes
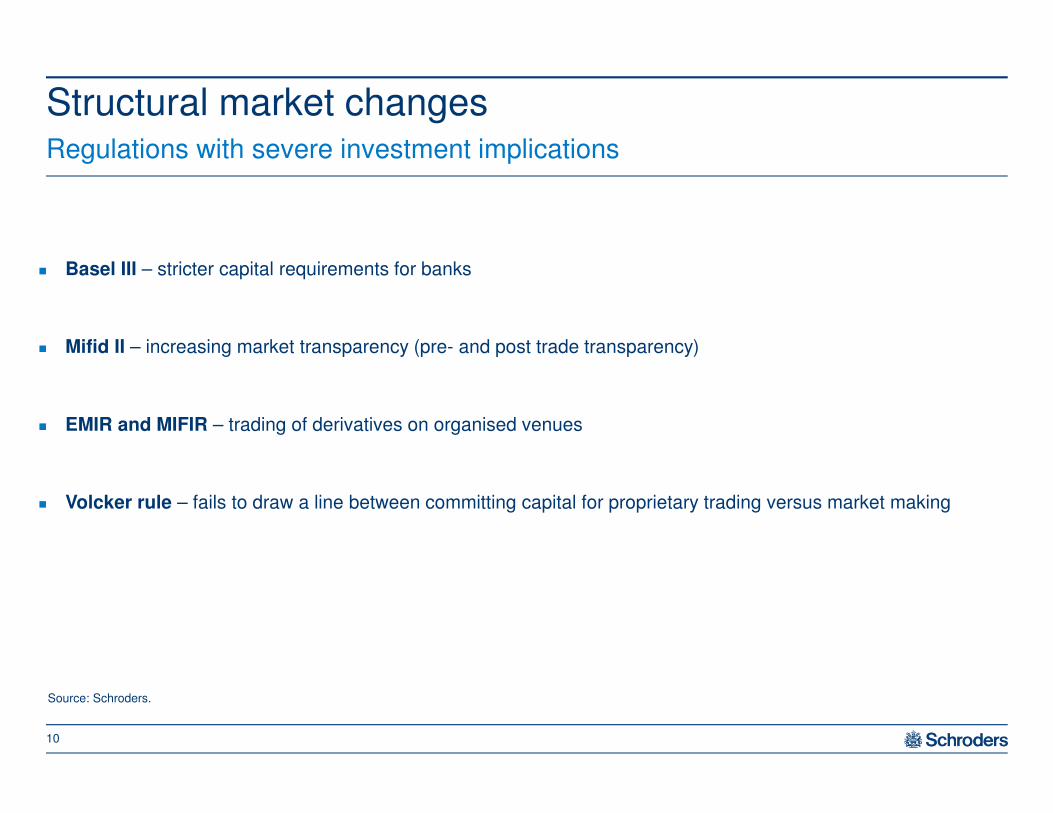
� Basel III – stricter capital requirements for banks
� Mifid II – increasing market transparency (pre- and post trade transparency)
� EMIR and MIFIR – trading of derivatives on organised venues
� Volcker rule – fails to draw a line between committing capital for proprietary trading versus market making
10
Source: Schroders.
Structural market changesRegulations with severe investment implications
0
1,000
2,000
3,000
4,000
5,000
6,000
7,000
IG
HY
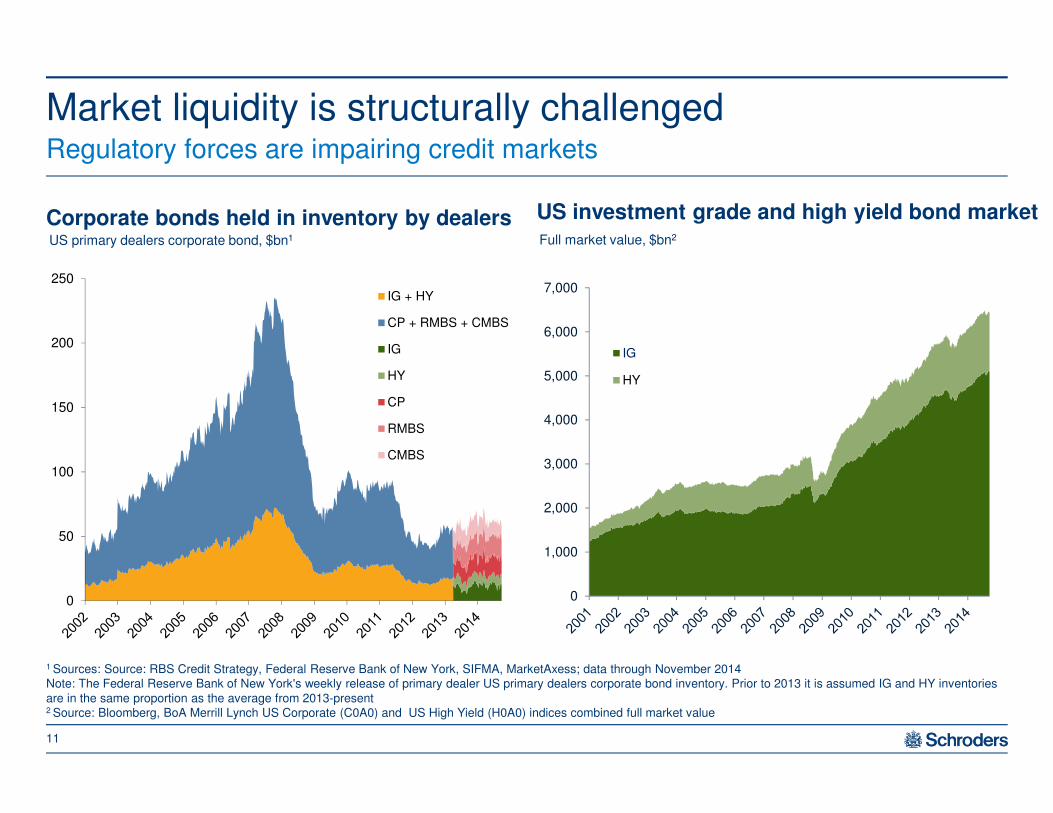
Corporate bonds held in inventory by dealers US investment grade and high yield bond market
Market liquidity is structurally challengedRegulatory forces are impairing credit markets
11
1 Sources: Source: RBS Credit Strategy, Federal Reserve Bank of New York, SIFMA, MarketAxess; data through November 2014Note: The Federal Reserve Bank of New York's weekly release of primary dealer US primary dealers corporate bond inventory. Prior to 2013 it is assumed IG and HY inventories are in the same proportion as the average from 2013-present2 Source: Bloomberg, BoA Merrill Lynch US Corporate (C0A0) and US High Yield (H0A0) indices combined full market value
Full market value, $bn2US primary dealers corporate bond, $bn1
0
50
100
150
200
250
IG + HY
CP + RMBS + CMBS
IG
HY
CP
RMBS
CMBS
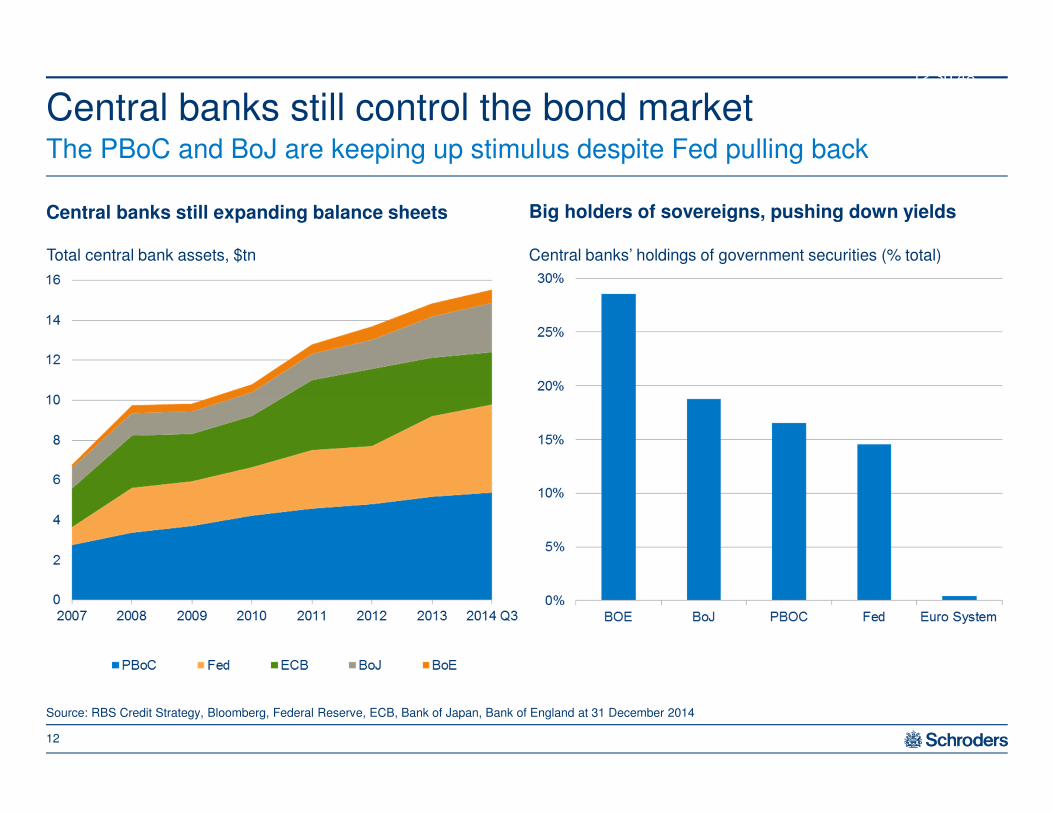
Central banks still control the bond marketThe PBoC and BoJ are keeping up stimulus despite Fed pulling back
12
Source: RBS Credit Strategy, Bloomberg, Federal Reserve, ECB, Bank of Japan, Bank of England at 31 December 2014
Central banks still expanding balance sheets Big holders of sovereigns, pushing down yields
11/06/2015 12:30:48
Total central bank assets, $tn Central banks’ holdings of government securities (% total)

Unintended consequences
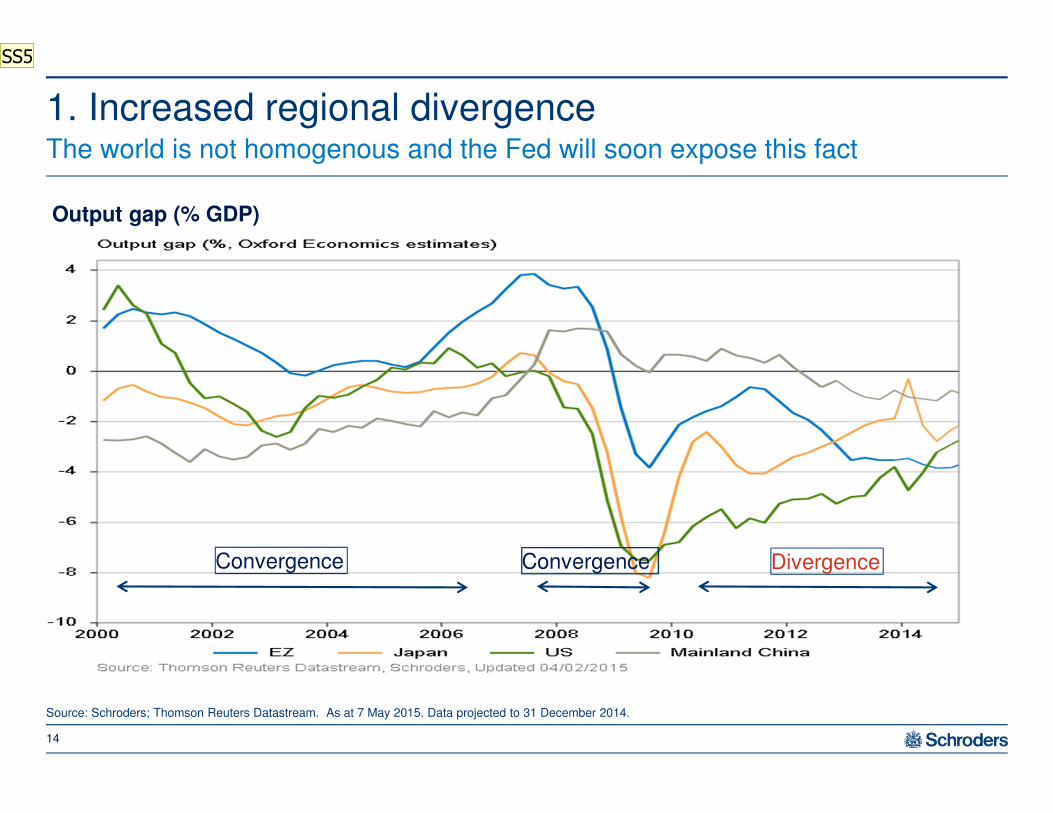
1. Increased regional divergenceThe world is not homogenous and the Fed will soon expose this fact
14
Source: Schroders; Thomson Reuters Datastream. As at 7 May 2015. Data projected to 31 December 2014.
Output gap (% GDP)
Convergence Convergence Divergence
SS5

Slide 14
SS5 suggested edit - in header consider changing 'will' to 'may' given recent events?
Defer to speaker/team on this. Scheffer, Scott, 6/04/15
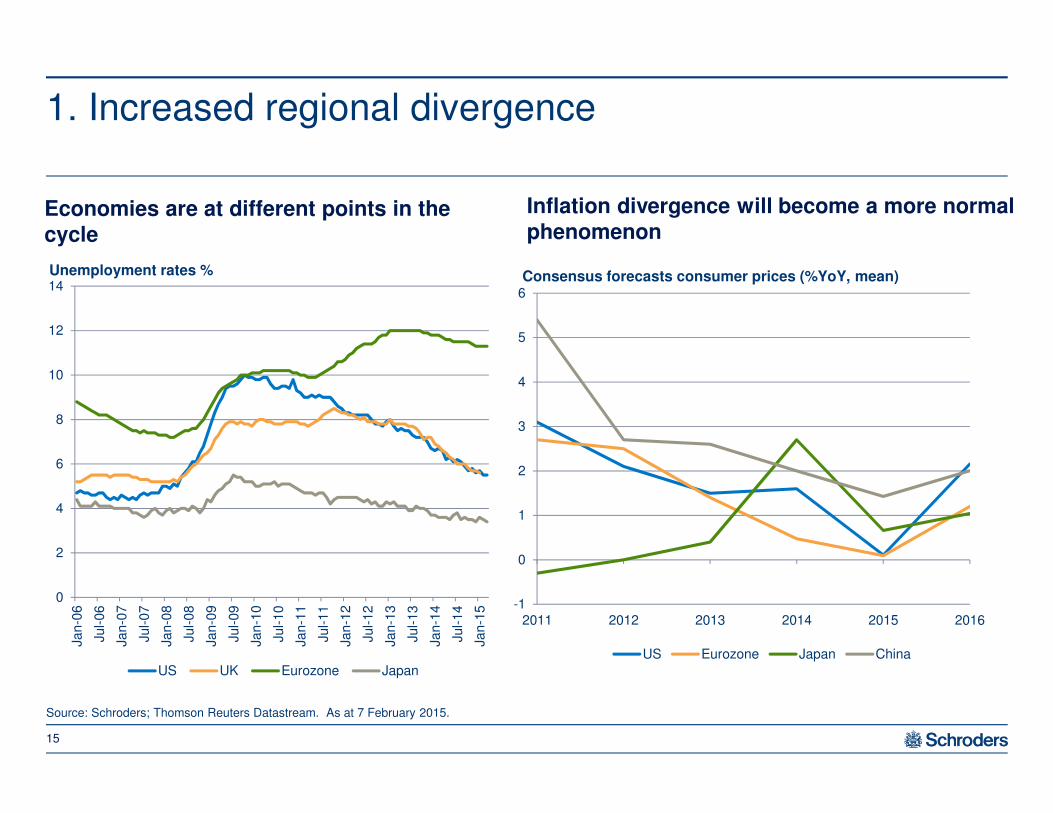
1. Increased regional divergence
15
0
2
4
6
8
10
12
14
Jan-0
6
Jul-06
Jan-0
7
Jul-07
Jan-0
8
Jul-08
Jan-0
9
Jul-09
Jan-1
0
Jul-10
Jan-1
1
Jul-11
Jan-1
2
Jul-12
Jan-1
3
Jul-13
Jan-1
4
Jul-14
Jan-1
5
Unemployment rates %
US UK Eurozone Japan
-1
0
1
2
3
4
5
6
2011 2012 2013 2014 2015 2016
Consensus forecasts consumer prices (%YoY, mean)
US Eurozone Japan China
Economies are at different points in the
cycle
Inflation divergence will become a more normal
phenomenon
Source: Schroders; Thomson Reuters Datastream. As at 7 February 2015.
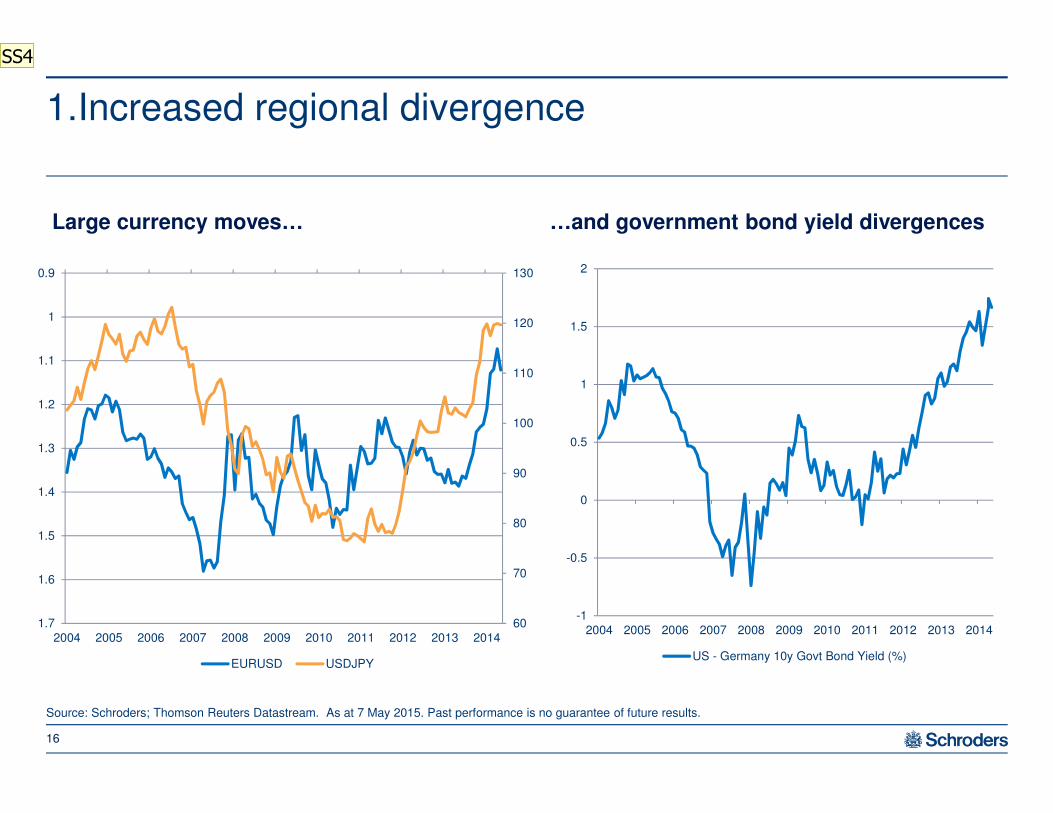
1.Increased regional divergence
16
Source: Schroders; Thomson Reuters Datastream. As at 7 May 2015. Past performance is no guarantee of future results.
60
70
80
90
100
110
120
1300.9
1
1.1
1.2
1.3
1.4
1.5
1.6
1.72004 2005 2006 2007 2008 2009 2010 2011 2012 2013 2014
EURUSD USDJPY
Large currency moves…
-1
-0.5
0
0.5
1
1.5
2
2004 2005 2006 2007 2008 2009 2010 2011 2012 2013 2014
US - Germany 10y Govt Bond Yield (%)
…and government bond yield divergences
SS4

Slide 16
SS4 add FN in redScheffer, Scott, 6/04/15
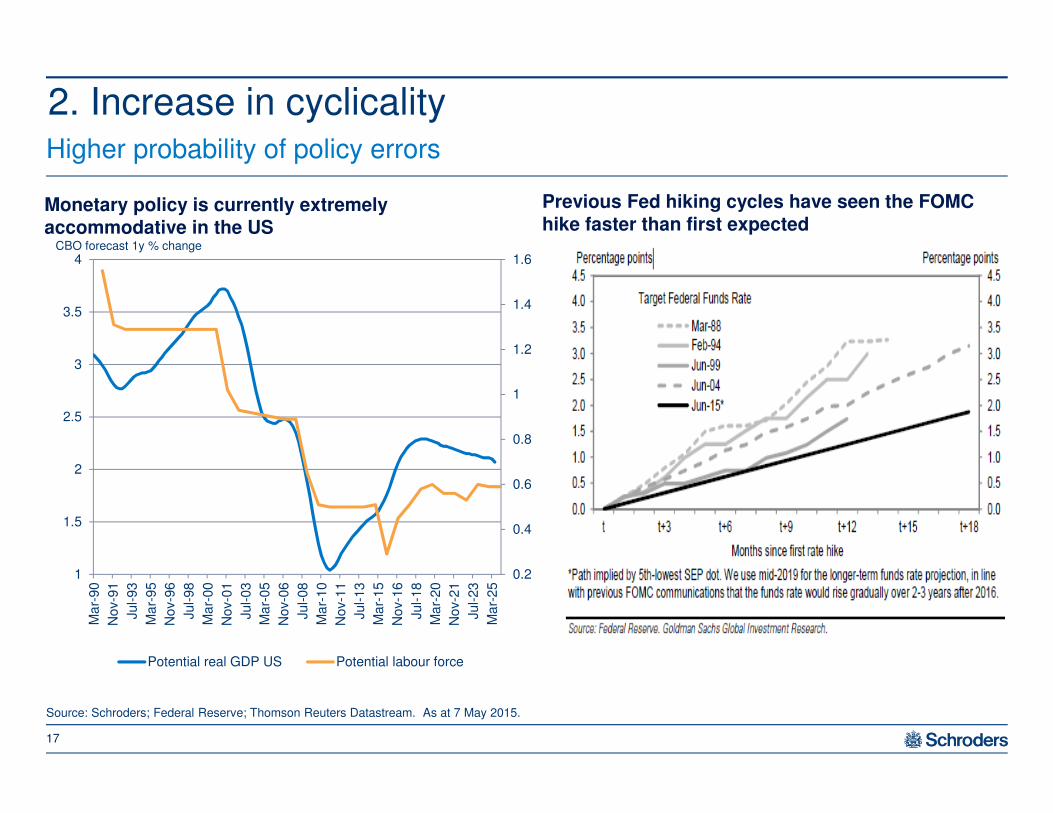
2. Increase in cyclicalityHigher probability of policy errors
17
Source: Schroders; Federal Reserve; Thomson Reuters Datastream. As at 7 May 2015.
Monetary policy is currently extremely
accommodative in the US
0.2
0.4
0.6
0.8
1
1.2
1.4
1.6
1
1.5
2
2.5
3
3.5
4
Ma
r-90
Nov-9
1
Jul-93
Ma
r-95
Nov-9
6
Jul-98
Ma
r-00
Nov-0
1
Jul-03
Ma
r-05
Nov-0
6
Jul-08
Ma
r-10
Nov-1
1
Jul-13
Ma
r-15
Nov-1
6
Jul-18
Ma
r-20
Nov-2
1
Jul-23
Ma
r-25
CBO forecast 1y % change
Potential real GDP US Potential labour force
Previous Fed hiking cycles have seen the FOMC
hike faster than first expected
UK nominal GDP vs. base rate US nominal GDP vs. Fed funds
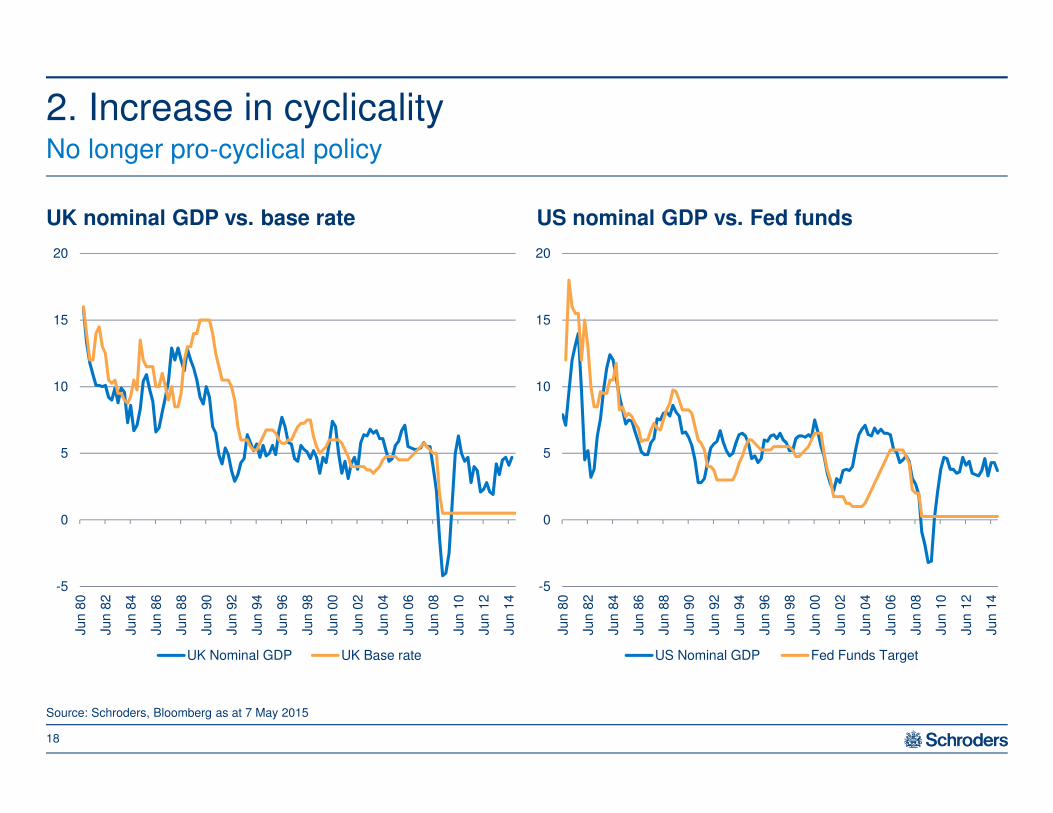
2. Increase in cyclicality
18
Source: Schroders, Bloomberg as at 7 May 2015
-5
0
5
10
15
20
Jun 8
0
Jun 8
2
Jun 8
4
Jun 8
6
Jun 8
8
Jun 9
0
Jun 9
2
Jun 9
4
Jun 9
6
Jun 9
8
Jun 0
0
Jun 0
2
Jun 0
4
Jun 0
6
Jun 0
8
Jun 1
0
Jun 1
2
Jun 1
4
UK Nominal GDP UK Base rate
-5
0
5
10
15
20
Jun 8
0
Jun 8
2
Jun 8
4
Jun 8
6
Jun 8
8
Jun 9
0
Jun 9
2
Jun 9
4
Jun 9
6
Jun 9
8
Jun 0
0
Jun 0
2
Jun 0
4
Jun 0
6
Jun 0
8
Jun 1
0
Jun 1
2
Jun 1
4
US Nominal GDP Fed Funds Target
No longer pro-cyclical policy
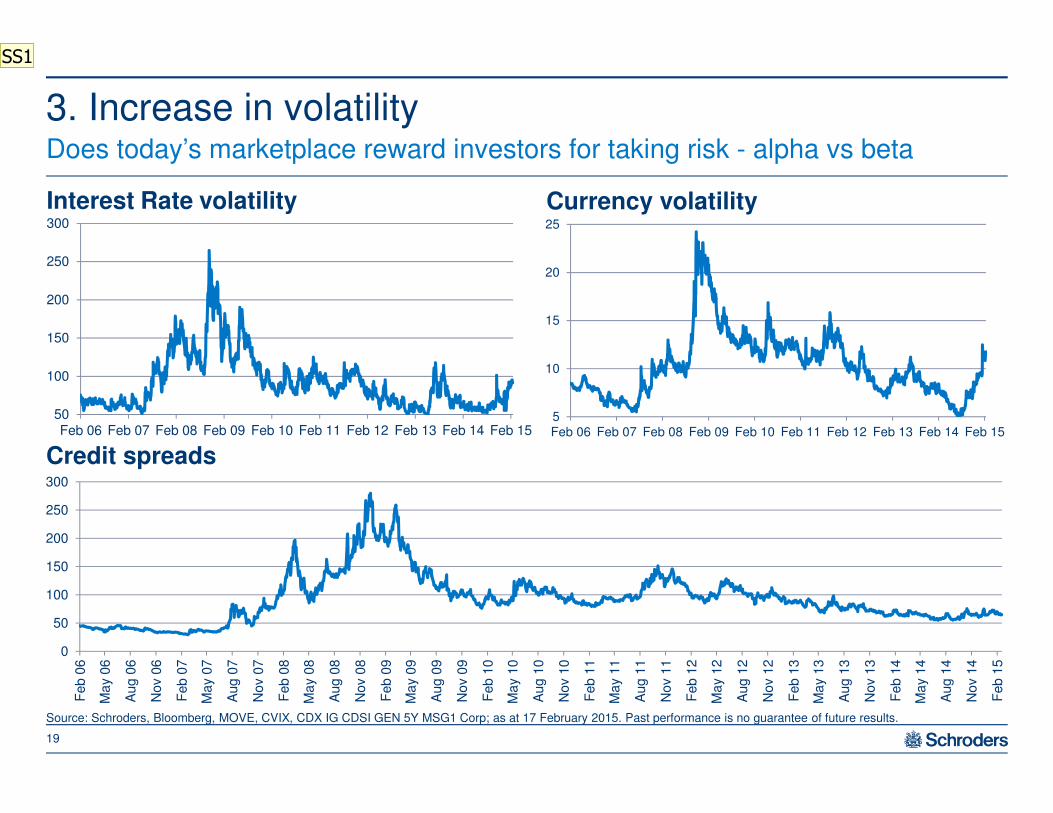
3. Increase in volatilityDoes today’s marketplace reward investors for taking risk - alpha vs beta
19
Source: Schroders, Bloomberg, MOVE, CVIX, CDX IG CDSI GEN 5Y MSG1 Corp; as at 17 February 2015. Past performance is no guarantee of future results.
Interest Rate volatility Currency volatility
Credit spreads
50
100
150
200
250
300
Feb 06 Feb 07 Feb 08 Feb 09 Feb 10 Feb 11 Feb 12 Feb 13 Feb 14 Feb 15
0
50
100
150
200
250
300
Feb 0
6
Ma
y 0
6
Aug
06
Nov 0
6
Feb 0
7
Ma
y 0
7
Aug
07
Nov 0
7
Feb 0
8
Ma
y 0
8
Aug
08
Nov 0
8
Feb 0
9
Ma
y 0
9
Aug
09
Nov 0
9
Feb 1
0
Ma
y 1
0
Aug
10
Nov 1
0
Feb 1
1
Ma
y 1
1
Aug
11
Nov 1
1
Feb 1
2
Ma
y 1
2
Aug
12
Nov 1
2
Feb 1
3
Ma
y 1
3
Aug
13
Nov 1
3
Feb 1
4
Ma
y 1
4
Aug
14
Nov 1
4
Feb 1
5
5
10
15
20
25
Feb 06 Feb 07 Feb 08 Feb 09 Feb 10 Feb 11 Feb 12 Feb 13 Feb 14 Feb 15
SS1

Slide 19
SS1 should sub-head end with a ? mark
also add FN noted in redScheffer, Scott, 6/04/15
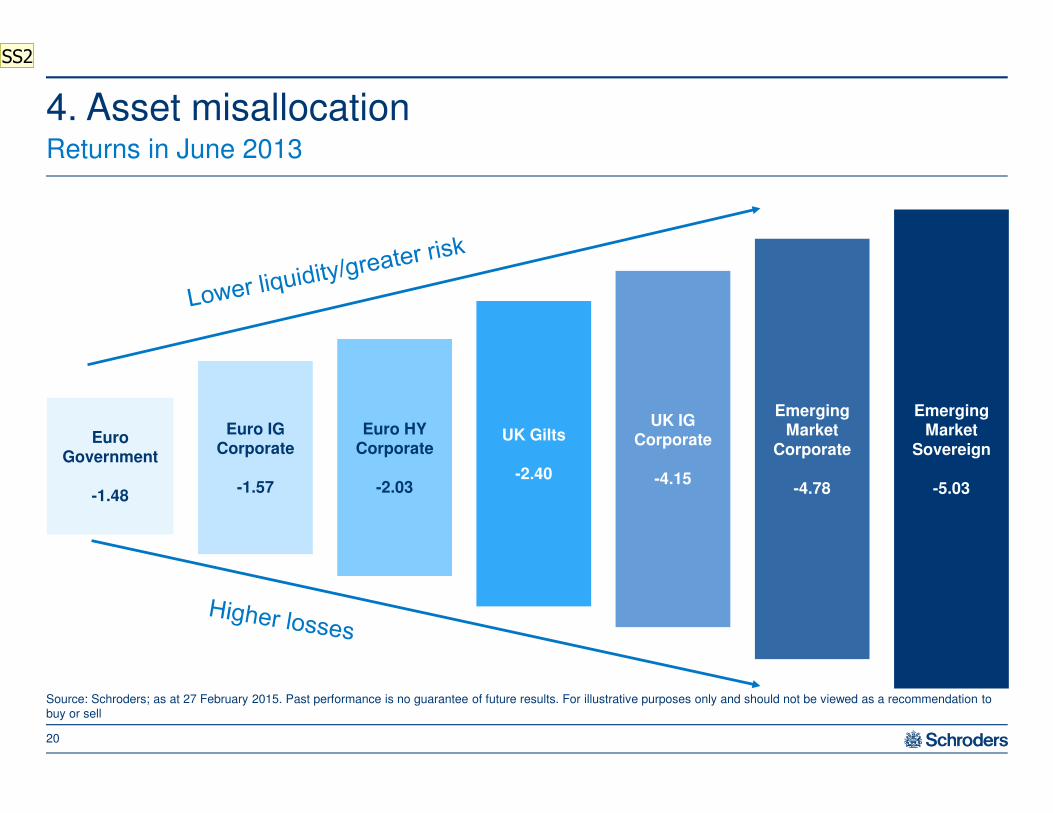
4. Asset misallocationReturns in June 2013
20
Source: Schroders; as at 27 February 2015. Past performance is no guarantee of future results. For illustrative purposes only and should not be viewed as a recommendation to buy or sell
11/06/2015 12:30:48
Euro IG Corporate
-1.57
Euro HY Corporate
-2.03
UK Gilts
-2.40
UK IG Corporate
-4.15
Emerging Market
Corporate
-4.78
Emerging Market
Sovereign
-5.03
Euro Government
-1.48
SS2

Slide 20
SS2 add FN noted in redScheffer, Scott, 6/04/15

Outlook

� Lower asset returns
� Higher cyclicality
� Regional divergence
� Lower terminal rate
22
Source: Schroders. Views current as at date of this material and is subject to change over time.
Wrong policy, unintended consequencesWhat next?
SS3

Slide 22
SS3 add views FN, in redScheffer, Scott, 6/04/15

Schroder Investment Management North America Inc. is an indirect wholly owned subsidiary of Schroders plc and an SEC registered investment adviser registered in Canada in the capacity of Portfolio Manager with the securities regulatory authorities in the Provinces of Alberta, British Columbia, Manitoba, Nova Scotia, Ontario, Quebec and Saskatchewan, and provides asset management products and services to clients in those jurisdictions. This document does not purport to provide investment advice and the information contained in this document is for general informational purposes only. It does not constitute or form part of any offer for sale or solicitation of any offer to buy or subscribe for any securities. It does not purport to describe the business or affairs of any issuer and is not being provided for delivery to or review by any prospective purchaser so as to assist the prospective purchaser to make an investment decision in respect of any securities, and is not otherwise provided in furtherance of a trade in securities. This document is delivered to certain qualified recipients only and may not be communicated, disclosed or quoted from except as specifically approved by Schroder Investment Management North America Inc.
Schroder Fund Advisors, LLC is a wholly-owned subsidiary of Schroder Investment Management North America Inc. and is a FINRA registered limited purpose Broker/Dealer and is registered in Canada in the capacity of Exempt Market Dealer with the Securities Commissions of Alberta, British Columbia, Manitoba, New Brunswick, Nova Scotia, Ontario, Quebec, and Saskatchewan.
Schroders investment products are only available to Permitted Clients as that term is defined by Canadian securities laws. This document does not constitute an offer to sell securities. Qualified investors will receive material documentation containing important information about their investments prior to investing.
Past performance is not guarantee of future results. The value of an investment can go down as well as up and is not guaranteed.
Schroder Investment Management North America Inc.875 Third Avenue, New York, NY 10022-6225(212) 641-3800www.schroders.com/canada
Important information
23