Embed Size (px)
Citation preview
MORRO BAY RESOURCES LTD. RIVERSIDE RESOURCES INC.
NI 43-101 Technical Report Mineral Resource Estimates for the El Capitan & Jesus Maria Deposits
Peñoles Gold-Silver Project, Durango State, Mexico
Report Prepared for:
Morro Bay Resources Ltd. Suite 1300, 734 – 7th Avenue SW Calgary, AB T2P 3P8
Riverside Resources Inc. Suite 1110, 1111 W Georgia Street Vancouver, BC V6E 4M3
Qualified Persons:
Ben Whiting, P.Geo., Whiting Geological Consulting Inc. Robert C. Sim, P.Geo., SIM Geological Inc. Mike Redfearn, P.Eng., Bureau Veritas Commodities Canada Ltd. Effective Date: March 2, 2015
Release Date: April 16, 2015
APRIL 2015
MORRO BAY RESOURCES LTD. | RIVERSIDE RESOURCES INC. TOC I NI 43-101 TECHNICAL REPORT PEÑOLES PROJECT
TABLE OF CONTENTS
1 SUMMARY .................................................................................................................................. 1-1
2 INTRODUCTION ......................................................................................................................... 2-1
3 RELIANCE ON OTHER EXPERTS ............................................................................................ 3-1
4 PROPERTY DESCRIPTION AND LOCATION .......................................................................... 4-1
4.1 Underlying Agreements .............................................................................................................. 4-3 4.1.1 Capitan 1 Concession and Purisima 1 Concession ........................................................... 4-4 4.1.2 Guerrero Option (Jesus Maria and San Rafael) ................................................................ 4-4 4.1.3 Altiplano Option (El Capitan and El Tubo) ......................................................................... 4-5
4.2 Risk Factors ............................................................................................................................... 4-6 4.3 Mexican Mining Law ................................................................................................................... 4-7
5 ACCESSIBILITY, CLIMATE, INFRASTRUCTURE AND PHYSIOGRAPHY ............................ 5-1
5.1 Accessibility ................................................................................................................................ 5-1 5.2 Climate ....................................................................................................................................... 5-1 5.3 Local Resources ........................................................................................................................ 5-1 5.4 Infrastructure .............................................................................................................................. 5-1 5.5 Physiography.............................................................................................................................. 5-2 5.6 Water Resources ....................................................................................................................... 5-2
6 HISTORY ..................................................................................................................................... 6-1
7 GEOLOGICAL SETTING AND MINERALIZATION .................................................................. 7-1
7.1 Mineralization ............................................................................................................................. 7-3 7.2 El Capitan ................................................................................................................................... 7-7 7.3 Jesus Maria Vein System ........................................................................................................... 7-9 7.4 San Rafael and El Tubo Vein System ...................................................................................... 7-10
8 DEPOSIT TYPES ........................................................................................................................ 8-1
9 EXPLORATION ........................................................................................................................... 9-1
9.1 Exploration Work: Aurcana and Riverside 2004 to 2011 (Daniels, 2011).................................. 9-1 9.2 Exploration Work: Sierra Madre 2011 to 2013 (Magrum, 2013) ................................................ 9-1 9.3 Exploration Work: Morro Bay 2014 (Myers et al., 2014) ............................................................ 9-2
10 DRILLING .................................................................................................................................. 10-1
10.1 Aurcana Drilling (2004) ............................................................................................................ 10-1 10.2 Riverside Drilling (2008) ........................................................................................................... 10-1 10.3 Sierra Madre Drilling (2011) ..................................................................................................... 10-1 10.4 Sierra Madre Drilling (2012) ..................................................................................................... 10-2 10.5 Sierra Madre Drilling (2013) ..................................................................................................... 10-2 10.6 Morro Bay Drilling (2014) ......................................................................................................... 10-2
11 SAMPLE PREPARATION, ANALYSES AND SECURITY ...................................................... 11-1
12 DATA VERIFICATION .............................................................................................................. 12-1
12.1 Assay Data Verification ............................................................................................................ 12-1
APRIL 2015
MORRO BAY RESOURCES LTD. | RIVERSIDE RESOURCES INC. TOC II NI 43-101 TECHNICAL REPORT PEÑOLES PROJECT
12.1.1 2015 Assay Verification Program ..................................................................................... 12-1 12.1.2 2014 Assay Verification Program ..................................................................................... 12-6 12.1.3 2012 Assay Verification Program ..................................................................................... 12-8 12.1.4 2009 Assay Verification Program ..................................................................................... 12-8
12.2 Survey Control Data Verification ............................................................................................ 12-11 12.3 Database Verification ............................................................................................................. 12-13 12.4 Conclusions ............................................................................................................................ 12-13
13 MINERAL PROCESSING AND METALLURGICAL TESTING ............................................... 13-1
13.1 Jesus Maria .............................................................................................................................. 13-1 13.1.1 Introduction ....................................................................................................................... 13-1 13.1.2 Samples and Head Assays .............................................................................................. 13-1 13.1.3 Gravity Separation Testing ............................................................................................... 13-2 13.1.4 Flotation Testing ............................................................................................................... 13-3 13.1.5 Cyanidation Leach Testing ............................................................................................... 13-4 13.1.6 Summary and Recommendations .................................................................................... 13-6
13.2 El Capitan ................................................................................................................................. 13-7 13.2.1 Summary of 2011 Test Work ........................................................................................... 13-7 13.2.2 Summary of 2012-2013 Test Work .................................................................................. 13-8 13.2.3 Samples and Head Assays .............................................................................................. 13-9 13.2.4 Bottle Roll Testing .......................................................................................................... 13-10 13.2.5 Column Leach Testing ................................................................................................... 13-12 13.2.6 Comminution Testing ..................................................................................................... 13-13 13.2.7 Summary and Recommendations .................................................................................. 13-14
14 MINERAL RESOURCE ESTIMATE ......................................................................................... 14-1
14.1 Introduction ............................................................................................................................... 14-1 14.2 Available Data .......................................................................................................................... 14-1 14.3 Geological Model ..................................................................................................................... 14-7 14.4 Bulk Density Data ..................................................................................................................... 14-8 14.5 Compositing ............................................................................................................................. 14-8 14.6 Exploratory Data Analysis ........................................................................................................ 14-8
14.6.1 Basic Statistics by Domain ............................................................................................... 14-9 14.6.2 Contact Profiles ................................................................................................................ 14-9 14.6.3 Conclusions and Modeling Implications ......................................................................... 14-12
14.7 Development of Probability Shells ......................................................................................... 14-12 14.8 Evaluation of Outlier Grades .................................................................................................. 14-16 14.9 Variography ............................................................................................................................ 14-17 14.10 Model Setup and Limits ...................................................................................................... 14-18 14.11 Interpolation Parameters .................................................................................................... 14-19 14.12 Validation ............................................................................................................................ 14-20 14.13 Resource Classification ...................................................................................................... 14-24 14.14 Mineral Resources ............................................................................................................. 14-24
15 ADJACENT PROPERTIES ....................................................................................................... 15-1
16 OTHER RELEVANT DATA AND INFORMATION ................................................................... 16-1
17 INTERPRETATION AND CONCLUSIONS .............................................................................. 17-1
18 RECOMMENDATIONS ............................................................................................................. 18-1
APRIL 2015
MORRO BAY RESOURCES LTD. | RIVERSIDE RESOURCES INC. TOC III NI 43-101 TECHNICAL REPORT PEÑOLES PROJECT
19 REFERENCES .......................................................................................................................... 19-1
20 DATE AND SIGNATURE PAGE .............................................................................................. 20-1
LIST OF TABLES
Table 1.1: Inferred Mineral Resource Estimate ......................................................................................... 1-6 Table 1.2: Sensitivity of El Capitan Mineral Resource to Gold Cut-Off Grade .......................................... 1-6 Table 1.3: Sensitivity of Jesus Maria Mineral Resource to Silver Cut-Off Grade ...................................... 1-7 Table 4.1: Mineral Concession Details ...................................................................................................... 4-2 Table 4.2: Mining Taxes in Mexico as of December 31, 2014. .................................................................. 4-5 Table 4.3: Work Commitments for Concessions in Mexico as of December 31, 2014.............................. 4-6 Table 4.4: Calculated Work and Tax Commitments for Peñoles Project Concessions as of December 31,
2014 ........................................................................................................................................................... 4-6 Table 9.1: Jesus Maria Trenching .............................................................................................................. 9-3 Table 9.2: Jesus Maria Underground Level Sampling ............................................................................... 9-4 Table 9.3: Jesus Maria Crosscut Sampling ............................................................................................... 9-4 Table 10.1: 2004-2009 Historic El Capitan Significant Drill Intersections ................................................ 10-6 Table 10.2: 2011 El Capitan Significant Drill Intersections ...................................................................... 10-7 Table 10.3: 2012 El Capitan Significant Drill Intersections ...................................................................... 10-9 Table 10.4: 2014 El Capitan Drilling Results ......................................................................................... 10-10 Table 10.5: 2013 Jesus Maria Significant Drill Intersections ................................................................. 10-11 Table 10.6: 2014 Jesus Maria Significant Drill Intersections ................................................................. 10-12 Table 10.7: 2014 San Rafael Significant Drill Intersections ................................................................... 10-14 Table 10.8: Complete Drill Hole Collar Listing ....................................................................................... 10-15 Table 12.1: Drill Core Quartering Check Assay Results (2015) .............................................................. 12-1 Table 12.2: Drill Core Quartering Check Assay Results for Base Metals (2015) .................................... 12-3 Table 12.3: Drill Core Quartering Check Assay Results (2014) .............................................................. 12-6 Table 12.4: Drill Core Quartering Check Assay Results (2009) .............................................................. 12-9 Table 12.5: Drill Hole Collars Spot Check using Hand-Held GPS (NAD-27 Zone 13) .......................... 12-12 Table 13.1: Composite Details and Head Assays.................................................................................... 13-2 Table 13.2: Gravity Separation Test Results ........................................................................................... 13-3 Table 13.3: Flotation Reagent Scheme ................................................................................................... 13-3 Table 13.4: Baseline Flotation Testing Results........................................................................................ 13-4 Table 13.5: Whole-Ore Cyanidation Test Results.................................................................................... 13-5 Table 13.6: Comparison of Test Results .................................................................................................. 13-7 Table 13.7: Types of Bottle Roll Tests ..................................................................................................... 13-8 Table 13.8: Column Leach Test Parameters ........................................................................................... 13-9 Table 13.9: Composite Head Assays ..................................................................................................... 13-10 Table 13.10: Bottle Roll Test Results at a Medium Grind ...................................................................... 13-11 Table 13.11: Comparison of Average Leach Results at Various Grind or Crush Sizes ........................ 13-12 Table 13.12: Cyanide Column Leach Results........................................................................................ 13-13 Table 13.13: Comminution Test Results ................................................................................................ 13-13 Table 14.1: Statistical Summary of Drilling Sample Database ................................................................ 14-7 Table 14.2: Statistical Summary of Composited Sample Database Inside/Outside of the Probability Shell
Domains ................................................................................................................................................. 14-16 Table 14.3: Summary of Outlier Grade Controls.................................................................................... 14-17 Table 14.4: Variogram Parameters ........................................................................................................ 14-18
APRIL 2015
MORRO BAY RESOURCES LTD. | RIVERSIDE RESOURCES INC. TOC IV NI 43-101 TECHNICAL REPORT PEÑOLES PROJECT
Table 14.5: Block Model Limits .............................................................................................................. 14-19 Table 14.6: Interpolation Parameters ..................................................................................................... 14-20 Table 14.7: Inferred Mineral Resource Estimate ................................................................................... 14-27 Table 14.8: Sensitivity of El Capitan Mineral Resource to Gold Cut-Off Grade .................................... 14-28 Table 14.9: Sensitivity of Jesus Maria Mineral Resource to Silver Cut-Off Grade ................................ 14-28 Table 18.1: Proposed Exploration Program ............................................................................................. 18-1
LIST OF FIGURES
Figure 1-1: Peñoles Project within Mexican Silver Belt ............................................................................. 1-1 Figure 4-1: Regional Locator Map Showing Concessions, Communities and Accessibility ...................... 4-1 Figure 4-2: Satellite Image Showing Concessions with Title Reference Number ..................................... 4-3 Figure 7-1: Mexican Government Property Geology Map ......................................................................... 7-2 Figure 7-2: Mexican Government Airborne Total Field Magnetics Map .................................................... 7-4 Figure 7-3: Mexican Government Airborne First Vertical Derivative Magnetics Map ................................ 7-5 Figure 7-4: Mexican Government Mineral Occurrence Map Showing Regional Stream Geochemistry.... 7-6 Figure 7-5: El Capitan Geology Section Showing Drill Holes and Structures (1) ...................................... 7-8 Figure 7-6: El Capitan Geology Section Showing Drill Holes and Structures (2) ...................................... 7-9 Figure 8-1: Peñoles District Geological Environments for Epithermal Deposits ........................................ 8-2 Figure 10-1: Jesus Maria Deposit Drill Hole Locations (plan view) ......................................................... 10-3 Figure 10-2: El Capitan Deposit Drill Hole Locations (plan view) ............................................................ 10-4 Figure 10-3: Jesus Maria Deposit Trenches and Underground Workings (plan view) ............................ 10-5 Figure 12-1: Gold Quarter-Core Duplicates (2015) ................................................................................. 12-2 Figure 12-2: Silver Quarter-Core Duplicates (2015) ................................................................................ 12-2 Figure 12-3: Gold Quarter-Core Duplicate Photos (2015) ....................................................................... 12-4 Figure 12-4: Silver Quarter-Core Duplicate Photos (2015) ...................................................................... 12-5 Figure 12-5: Gold Quarter-Core Duplicates (2014) ................................................................................. 12-7 Figure 12-6: Silver Quarter-Core Duplicates (2014) ................................................................................ 12-7 Figure 12-7: Gold Quarter-Core Duplicates (2009) ............................................................................... 12-10 Figure 12-8: Silver Quarter-Core Duplicates (2009) .............................................................................. 12-10 Figure 12-9: Drill Hole Collar Markers .................................................................................................... 12-12 Figure 13-1: Gold Extraction Kinetics ...................................................................................................... 13-5 Figure 13-2: Silver Extraction Kinetics ..................................................................................................... 13-6 Figure 13-3: Medium Grind Bottle Roll Test Results ............................................................................. 13-11 Figure 14-1: Distribution of Drill Holes by Vintage ................................................................................... 14-3 Figure 14-2: Distribution of Gold Sample Data (isometric view looking north) ........................................ 14-4 Figure 14-3: Distribution of Gold Sample Data (isometric view looking southwest) ................................ 14-4 Figure 14-4: Distribution of Silver Sample Data (isometric view looking north) ....................................... 14-5 Figure 14-5: Distribution of Silver Sample Data (isometric view looking southwest) ............................... 14-5 Figure 14-6: Boxplot of Gold by Lithologic Type at El Capitan ................................................................ 14-9 Figure 14-7: Contact Profile for Gold in Mineralized Volcanics vs. Silicified Breccia Zone at El Capitan . 14-
11 Figure 14-8: Contact Profile for Gold in Silicified Breccia Zone vs. Mineralized Sediments at El Capitan 14-
11 Figure 14-9: Interpreted Gold Trend Planes used to Control Dynamic Search Orientations during Model
Interpolations .......................................................................................................................................... 14-13
APRIL 2015
MORRO BAY RESOURCES LTD. | RIVERSIDE RESOURCES INC. TOC V NI 43-101 TECHNICAL REPORT PEÑOLES PROJECT
Figure 14-10: Interpreted Silver Trend Planes used to Control Dynamic Search Orientations during Model
Interpolations .......................................................................................................................................... 14-13 Figure 14-11: Isometric View Looking Northwest of the Gold and Silver Probability Shells .................. 14-15 Figure 14-12: Isometric View Looking Southwest of the Gold and Silver Probability Shells ................. 14-15 Figure 14-13: El Capitan Herco Grade/Tonnage Plot for Gold and Silver ............................................. 14-21 Figure 14-14: Jesus Maria Herco Grade/Tonnage Plot for Gold and Silver .......................................... 14-21 Figure 14-15: El Capitan Grade/Tonnage Comparison of Gold and Silver Models ............................... 14-22 Figure 14-16: Jesus Maria Grade/Tonnage Comparison of Gold and Silver Models ............................ 14-22 Figure 14-17: El Capitan Swath Plot of Gold and Silver Models by Easting ......................................... 14-23 Figure 14-18: Jesus Maria Swath Plot of Gold and Silver Models by Easting ....................................... 14-24 Figure 14-19: Isometric View of Grade Shells at Projected Cut-Off Grades Relative to Floating Cone Pit
Shells ...................................................................................................................................................... 14-26 Figure 14-20: Isometric View of Grades Shells at Projected Cut-Off Grades Relative to Floating Cone Pit
Shells ...................................................................................................................................................... 14-26
APRIL 2015
MORRO BAY RESOURCES LTD. | RIVERSIDE RESOURCES INC. 1-1 NI 43-101 TECHNICAL REPORT PEÑOLES PROJECT
1 SUMMARY
INTRODUCTION
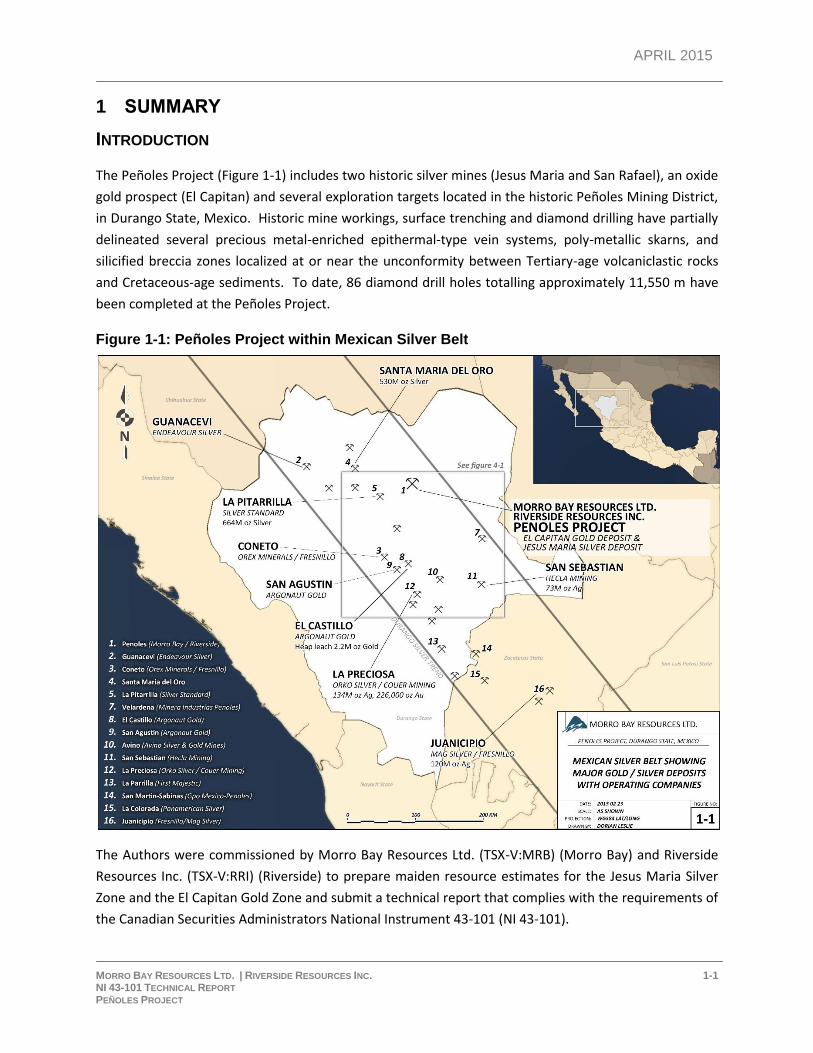
The Peñoles Project (Figure 1-1) includes two historic silver mines (Jesus Maria and San Rafael), an oxide
gold prospect (El Capitan) and several exploration targets located in the historic Peñoles Mining District,
in Durango State, Mexico. Historic mine workings, surface trenching and diamond drilling have partially
delineated several precious metal-enriched epithermal-type vein systems, poly-metallic skarns, and
silicified breccia zones localized at or near the unconformity between Tertiary-age volcaniclastic rocks
and Cretaceous-age sediments. To date, 86 diamond drill holes totalling approximately 11,550 m have
been completed at the Peñoles Project.
Figure 1-1: Peñoles Project within Mexican Silver Belt
The Authors were commissioned by Morro Bay Resources Ltd. (TSX-V:MRB) (Morro Bay) and Riverside
Resources Inc. (TSX-V:RRI) (Riverside) to prepare maiden resource estimates for the Jesus Maria Silver
Zone and the El Capitan Gold Zone and submit a technical report that complies with the requirements of
the Canadian Securities Administrators National Instrument 43-101 (NI 43-101).
APRIL 2015
MORRO BAY RESOURCES LTD. | RIVERSIDE RESOURCES INC. 1-2 NI 43-101 TECHNICAL REPORT PEÑOLES PROJECT
The resource estimates are based primarily on diamond drilling conducted by Morro Bay and previous
operator Sierra Madre Developments Inc. (TSX-V:SMG) (Sierra Madre) between 2011 and 2014. The
effective date of these mineral resource estimates is March 2, 2015. Note: No additional drilling has
been carried out since the effective date.
The resource estimates were completed by Robert Sim, P.Geo. of SIM Geological Inc. Mr. Sim is an
Independent Qualified Person as defined by National Instrument 43-101 Standards of Disclosure for
Mineral Projects. The geological and technical data for the project was reviewed by Ben Whiting, P.Geo.
of Whiting Geological Consulting Inc. The metallurgical test work that has been completed to date was
reviewed by Mike Redfearn, P.Eng. Whiting and Redfearn are also Independent Qualified Persons as
defined by National Instrument 43-101 Standards of Disclosure for Mineral Projects.
Based on the current drill hole database, the Jesus Maria and El Capitan deposits appear to form
relatively continuous, west- to west-northwest-trending zones of mineralization that may be amenable
to open-pit extraction methods. Jesus Maria is a silver deposit with minor amounts of contained gold
and base metals, and El Capitan is primarily a gold-bearing deposit with minor silver credits.
LOCATION, MINING CONCESSIONS, SURFACE RIGHTS AND PERMITS
The Peñoles Project is easily accessible and is located approximately 170 km, by road, west of the city of
Torreón, Coahuila State, Mexico. The centre of the Peñoles property is located approximately 180 km
north-northeast of the city of Durango and 50 km north of the town of Rodeo in the Municipality of San
Pedro del Gallo, Durango State, Mexico.
In 2008 and 2009, Riverside acquired the Peñoles property by purchasing two groups of concessions and
staking two concessions. The two groups of concessions (the Altiplano Option and Guerrero Option)
collectively cover the El Capitan prospect and the Jesus Maria and San Rafael mine workings. The two
staked concessions (initially comprising 35,694.1 ha) currently comprise 13,942.8 ha and cover several
early-stage exploration targets. The purchased concessions that cover the El Capitan prospect and the
historic silver mines comprise a total of 259.8 ha and are internal to a larger group of concessions
controlled by Minera La Parreña (2,652.8 ha), which, in turn, is surrounded by the concessions staked by
Riverside. Minera La Parreña is a subsidiary of one of the largest mining companies operating in Mexico,
Minera Industrias Peñoles (Minera Peñoles) and its precious metal division Minera Fresnillo (Fresnillo).
In March 2011, Sierra Madre acquired an option from Riverside to earn either a 51% or a 65% interest in
the Peñoles Project (Peñoles Option Agreement) by incurring exploration expenditures and making cash
and share payments to Riverside. Sierra Madre incurred exploration expenditures of approximately
$3,000,000 and made cash and share payments totalling approximately $2,140,000 to Riverside
between March 2011 and June 2013 (Magrum, 2013). On October 22, 2013, Morro Bay and Sierra
Madre announced that they had entered into an arm’s-length, non-binding letter of intent pursuant to
which Morro Bay would acquire all of the interests of Sierra Madre in the Peñoles Project. On
January 23, 2014, Morro Bay acquired all of Sierra Madre’s interests in exchange for 16 million Morro
APRIL 2015
MORRO BAY RESOURCES LTD. | RIVERSIDE RESOURCES INC. 1-3 NI 43-101 TECHNICAL REPORT PEÑOLES PROJECT
Bay common shares and 8 million share purchase warrants entitling the holders to purchase up to
8 million Morro Bay common shares. The deemed purchase price was $1,600,000, all of which was paid
by way of the aforesaid shares and warrants of Morro Bay. Sierra Madre distributed the Morro Bay
shares and share purchase warrants pro rata to shareholders of record as of the closing date.
In order to earn a 51% interest in the Peñoles Project, Morro Bay was initially required to expend
$750,000 of exploration expenditures by June 30, 2014 and pay Riverside $1,350,000 cash ($100,000
and USD$1,250,000) and issue $1,500,000 worth of Morro Bay shares (or cash at Morro Bay’s option,
provided that, if the market value of the Morro Bay shares is less than $0.05 based on a 30-day volume-
weighted average price [VWAP], such payments would be made in cash). During 2014, Morro Bay
incurred approximately $1,250,000 in exploration expenditures, made a $750,000 payment to Riverside
in shares of Morro Bay, and extended the option exercise date to January 20, 2015.
On January 20 and April 1, 2015, Morro Bay and Riverside announced amendments to the Peñoles
Option Agreement such that Morro Bay can earn an initial 51% interest by making a payment of
$750,000 by May 1, 2015 (payable in cash or Morro Bay shares at Morro Bay’s election, provided that, if
the market value of Morro Bay shares is less than $0.05 based on a 30-day VWAP, such payments would
be made in cash). Additional terms are included in the press releases dated January 20, 2015 and
April 1, 2015.
Surface rights in the primary target areas (El Capitan prospect and the historic Jesus Maria and San
Rafael mines) are owned by the Peñoles Ejido. To the best of the Authors' knowledge, Riverside holds
valid drilling permits and has negotiated a multi-year exploration access agreement with the Peñoles
Ejido which grants access to the primary target areas. To the best of the Authors' knowledge, the
agreement requires an annual minimum payment which is in good standing. No legal review was
conducted for the surface access agreement, and it is not known if the current agreement provides
access to the entire claim area. In the event that a decision is made to complete exploration work and
drilling outside of the primary target areas, Morro Bay and Riverside will need to negotiate with the
surface-rights holders regarding access agreements.
EXPLORATION HISTORY AND RECENT DRILLING
According to published historic records, Minera Industrias Peñoles was incorporated in 1887 to operate
the Jesus Maria and San Rafael silver mines, and took its name from the local community of Peñoles.
The full extent of the historic mine workings is unknown, but mining appears to have been selective and
limited to within approximately 100 m of surface.
The only modern exploration work that was completed on the subject property prior to 2011 consisted
of a four-hole drill program completed by Aurcana Corporation (Aurcana) in 2004, and surface mapping,
sampling, a limited IP survey, and a five-hole drill program completed by Riverside in 2008 and 2009.
APRIL 2015
MORRO BAY RESOURCES LTD. | RIVERSIDE RESOURCES INC. 1-4 NI 43-101 TECHNICAL REPORT PEÑOLES PROJECT
According to Daniels (2011), the drill holes completed by Aurcana and Riverside returned encouraging
results and showed that El Capitan has potential to host a bulk-tonnage, low-grade gold deposit.
Preliminary metallurgical tests completed by Sierra Madre in 2011 using Riverside drill core showed that
the gold mineralization at El Capitan can be recovered using cyanide leaching.
Since March 2011, exploration work and drilling has been focused on the Jesus Maria Silver Zone and
the El Capitan Gold Zone. The El Capitan and Jesus Maria deposits are south dipping, west- to west-
northwest-trending mineralized zones located on the concessions purchased by Riverside in 2008.
During 2011 and 2012, drilling at El Capitan encountered numerous intervals of gold mineralization
ranging from 50 m to 140 m wide. Mineralization is localized along the unconformity between Tertiary-
age volcaniclastic rocks and Cretaceous-age sediments. The upper part of the mineralized zone consists
of porous, volcanic agglomerate cut by narrow quartz veinlets and hydrothermal breccias (averaging 0.2
g/t to 0.5 g/t Au). At the base of the volcanic unit, there is a shallow-dipping, 10 m to 35 m wide
silicified zone (averaging 0.7 g/t to 1.5 g/t Au), and, below this zone, there is a sequence of oxidized
shales that is also cut by quartz veinlets and hydrothermal breccias (averaging 0.2 g/t to 0.6 g/t Au) with
low silver values.
The Jesus Maria prospect was initially considered to be a relatively narrow but high-grade vein-type
target; however, drilling carried out in 2013 and 2014 encountered 20 m to 80 m wide intervals of
predominantly silver-rich mineralization (with accessory gold and base-metal values) in the hanging wall
of the zone that was mined historically. Based on the widths of mineralization, the Jesus Maria might be
amenable to open-pit extraction methods. At their eastern limits, the deposits are separated by
approximately 300 m; however, the mineralized zones are interpreted as merging to the west.
Additional drilling between the western limit of the Jesus Maria deposit and the El Capitan deposit could
connect the two zones and delineate additional mineralization.
Between 2012 and 2014, preliminary metallurgical test work carried out by Inspectorate Exploration &
Mining Services Ltd. (Inspectorate) indicates that the gold and silver mineralization at Jesus Maria can be
recovered by using flotation or whole-ore cyanide leaching. Preliminary metallurgical test work also
indicates that gold mineralization at El Capitan can be recovered by using cyanide leaching.
DATA VERIFICATION AND SITE VISITS
On May 8, 2014, a site visit was carried out by Robert Sim, in the company of James Thom (contract
geologist employed by Morro Bay) and Howard Davies and Lex Lambeck (contract geologists employed
by Riverside). Sim inspected the core logging and core storage facilities at the project site office,
examined drill core from the El Capitan and Jesus Maria target areas, reviewed plans and sections of the
historic and recent drilling completed at El Capitan and Jesus Maria, and reviewed the QA/QC
procedures implemented by Sierra Madre and Morro Bay for the drill programs completed in 2011,
2012, 2013, and spring 2014. Sim also visited the site on June 12, 2012 during which he observed on-site
APRIL 2015
MORRO BAY RESOURCES LTD. | RIVERSIDE RESOURCES INC. 1-5 NI 43-101 TECHNICAL REPORT PEÑOLES PROJECT
drilling activities on the El Capitan deposit. Independent analyses of two drill core samples collected
during this site visit returned gold grades similar to values in the Morro Bay database.
On January 20-22, 2015, a site visit was carried out by Ben Whiting, in the company of James Thom.
Whiting examined several drill sites completed by Sierra Madre and Morro Bay, inspected the core
logging and core storage facilities at the project site office, examined drill core from the El Capitan and
Jesus Maria target areas, reviewed plans and sections of the historic and recent drilling completed at El
Capitan and Jesus Maria, and reviewed the QA/QC procedures implemented by Sierra Madre and Morro
Bay for the drill programs completed in 2011, 2012, 2013, and 2014. He also reviewed the QA/QC
procedures implemented by Riverside for the 2008 drill program. Additional data verification quarter-
core sampling was performed during this site visit.
The drilling completed at Peñoles by Sierra Madre and Morro Bay appears to have been completed to
industry standards and QA/QC procedures are adequate for purposes of resource estimation. No
significant operational or logistical problems were identified during the course of the site visits.
MINERAL RESOURCES
The mineral resource estimates have been generated from drill hole sample assay results, limited
surface trench and underground drift channel samples, and the interpretation of geological models,
which relate to the spatial distribution of gold and silver in the El Capitan and Jesus Maria deposits.
Interpolation characteristics have been defined based on the geology, drill hole spacing, and
geostatistical analysis of the data. The resources have been classified by their proximity to the sample
locations and are reported, as required by NI 43-101, according to the CIM Definition Standards for
Mineral Resources and Reserves (May, 2014).
Estimates are made from 3D block models based on geostatistical applications using commercial mine
planning software (MineSight® v9.50-01). The project limits are based in the UTM coordinate system
using a nominal block size of 10 m x 5 m x 10 m, with the shorter blocks roughly perpendicular to the
east-southeast-oriented strike direction of the deposits. The mineral resource estimate for the
El Capitan Gold Zone is based on results from 50 diamond drill-core holes totalling 7,004 m of drilling.
The mineral resource estimate for the Jesus Maria Silver Zone is based on results from 30 diamond drill-
core holes totalling 3,114 m of drilling. Diamond drilling was conducted from surface drill stations in the
hanging wall of the deposits. Holes are generally spaced at 40 m intervals and drilled to depths of
between 100 m and 200 m below surface.
Both deposits are at a relatively early stage of evaluation with respect to drilling and, as a result, some
assumptions have to be made using the available data. Classification at El Capitan is primarily influenced
by the nature of gold in the deposit. Similarly, classification at Jesus Maria is primarily driven by the
distribution of silver in the deposit. Visual observations and studies of indicator variogram ranges
suggest that zones of continuous mineralization, above the base-case cut-off limits, can be inferred
APRIL 2015
MORRO BAY RESOURCES LTD. | RIVERSIDE RESOURCES INC. 1-6 NI 43-101 TECHNICAL REPORT PEÑOLES PROJECT
when drill holes are spaced at a maximum distance of 150 m. Therefore, blocks in the model within a
maximum distance of 75 m from a drill hole have been included in the Inferred category.
Gold and silver mineralization occurs over relatively continuous zones for more than 500 m of strike
length at Jesus Maria, and for more than 1,000 m of strike length at El Capitan. Floating cone pit shells,
based on projected technical and economic parameters, suggest that mineralization to depths of 150 m
below surface exhibits reasonable prospects for eventual economic extraction using open-pit extraction
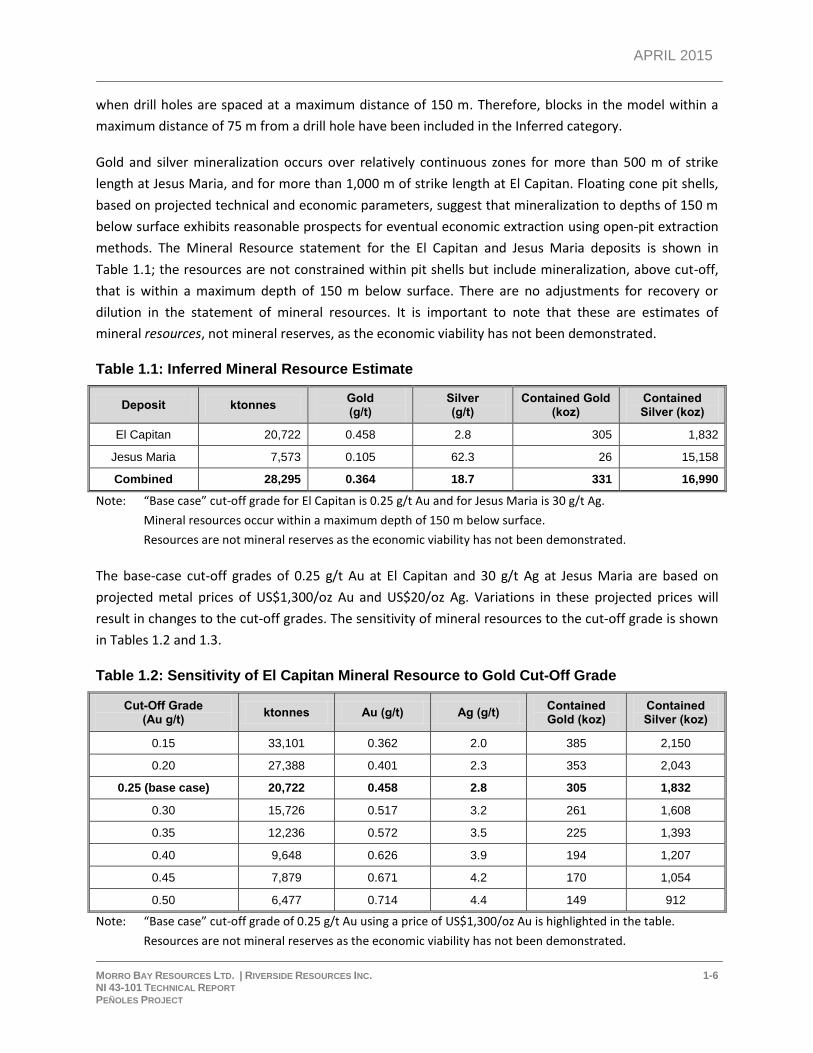
methods. The Mineral Resource statement for the El Capitan and Jesus Maria deposits is shown in
Table 1.1; the resources are not constrained within pit shells but include mineralization, above cut-off,
that is within a maximum depth of 150 m below surface. There are no adjustments for recovery or
dilution in the statement of mineral resources. It is important to note that these are estimates of
mineral resources, not mineral reserves, as the economic viability has not been demonstrated.
Table 1.1: Inferred Mineral Resource Estimate
Deposit ktonnes Gold (g/t)
Silver (g/t)
Contained Gold (koz)
Contained Silver (koz)
El Capitan 20,722 0.458 2.8 305 1,832
Jesus Maria 7,573 0.105 62.3 26 15,158
Combined 28,295 0.364 18.7 331 16,990
Note: “Base case” cut-off grade for El Capitan is 0.25 g/t Au and for Jesus Maria is 30 g/t Ag.
Mineral resources occur within a maximum depth of 150 m below surface.
Resources are not mineral reserves as the economic viability has not been demonstrated.
The base-case cut-off grades of 0.25 g/t Au at El Capitan and 30 g/t Ag at Jesus Maria are based on
projected metal prices of US$1,300/oz Au and US$20/oz Ag. Variations in these projected prices will
result in changes to the cut-off grades. The sensitivity of mineral resources to the cut-off grade is shown
in Tables 1.2 and 1.3.
Table 1.2: Sensitivity of El Capitan Mineral Resource to Gold Cut-Off Grade
Cut-Off Grade (Au g/t)
ktonnes Au (g/t) Ag (g/t) Contained Gold (koz)
Contained Silver (koz)
0.15 33,101 0.362 2.0 385 2,150
0.20 27,388 0.401 2.3 353 2,043
0.25 (base case) 20,722 0.458 2.8 305 1,832
0.30 15,726 0.517 3.2 261 1,608
0.35 12,236 0.572 3.5 225 1,393
0.40 9,648 0.626 3.9 194 1,207
0.45 7,879 0.671 4.2 170 1,054
0.50 6,477 0.714 4.4 149 912
Note: “Base case” cut-off grade of 0.25 g/t Au using a price of US$1,300/oz Au is highlighted in the table.
Resources are not mineral reserves as the economic viability has not been demonstrated.
APRIL 2015
MORRO BAY RESOURCES LTD. | RIVERSIDE RESOURCES INC. 1-7 NI 43-101 TECHNICAL REPORT PEÑOLES PROJECT
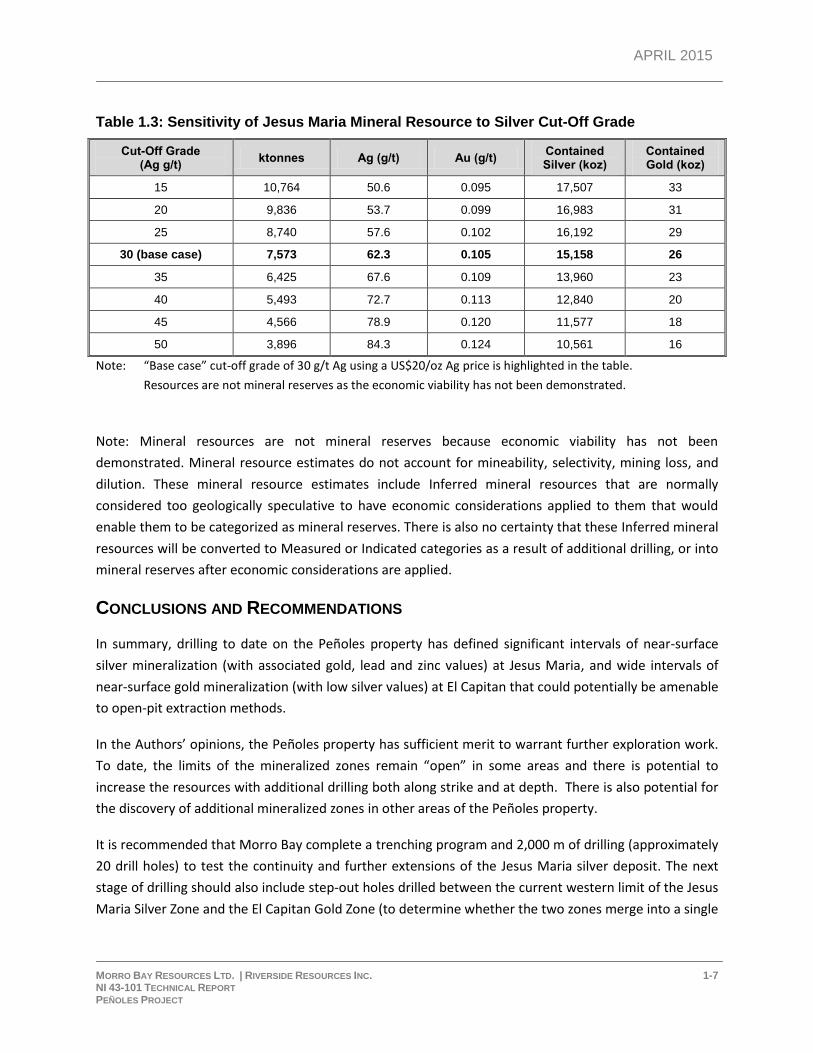
Table 1.3: Sensitivity of Jesus Maria Mineral Resource to Silver Cut-Off Grade
Cut-Off Grade (Ag g/t)
ktonnes Ag (g/t) Au (g/t) Contained Silver (koz)
Contained Gold (koz)
15 10,764 50.6 0.095 17,507 33
20 9,836 53.7 0.099 16,983 31
25 8,740 57.6 0.102 16,192 29
30 (base case) 7,573 62.3 0.105 15,158 26
35 6,425 67.6 0.109 13,960 23
40 5,493 72.7 0.113 12,840 20
45 4,566 78.9 0.120 11,577 18
50 3,896 84.3 0.124 10,561 16
Note: “Base case” cut-off grade of 30 g/t Ag using a US$20/oz Ag price is highlighted in the table.
Resources are not mineral reserves as the economic viability has not been demonstrated.
Note: Mineral resources are not mineral reserves because economic viability has not been
demonstrated. Mineral resource estimates do not account for mineability, selectivity, mining loss, and
dilution. These mineral resource estimates include Inferred mineral resources that are normally
considered too geologically speculative to have economic considerations applied to them that would
enable them to be categorized as mineral reserves. There is also no certainty that these Inferred mineral
resources will be converted to Measured or Indicated categories as a result of additional drilling, or into
mineral reserves after economic considerations are applied.
CONCLUSIONS AND RECOMMENDATIONS
In summary, drilling to date on the Peñoles property has defined significant intervals of near-surface
silver mineralization (with associated gold, lead and zinc values) at Jesus Maria, and wide intervals of
near-surface gold mineralization (with low silver values) at El Capitan that could potentially be amenable
to open-pit extraction methods.
In the Authors’ opinions, the Peñoles property has sufficient merit to warrant further exploration work.
To date, the limits of the mineralized zones remain “open” in some areas and there is potential to
increase the resources with additional drilling both along strike and at depth. There is also potential for
the discovery of additional mineralized zones in other areas of the Peñoles property.
It is recommended that Morro Bay complete a trenching program and 2,000 m of drilling (approximately
20 drill holes) to test the continuity and further extensions of the Jesus Maria silver deposit. The next
stage of drilling should also include step-out holes drilled between the current western limit of the Jesus
Maria Silver Zone and the El Capitan Gold Zone (to determine whether the two zones merge into a single
APRIL 2015
MORRO BAY RESOURCES LTD. | RIVERSIDE RESOURCES INC. 1-8 NI 43-101 TECHNICAL REPORT PEÑOLES PROJECT
mineralized zone). It is also recommended that Morro Bay conduct additional metallurgical test work on
both the Jesus Maria and El Capitan mineralized zones.
On completion of the planned drill program and metallurgical test work, results could be used to
calculate updated resource estimates and, if warranted, proceed to PEA-level assessments for both the
Jesus Maria and El Capitan deposits.
The total cost of the proposed exploration program, including applicable permitting costs and
concession taxes payable up to December 31, 2015, is estimated at CDN$750,000.
APRIL 2015
MORRO BAY RESOURCES LTD. | RIVERSIDE RESOURCES INC. 2-1 NI 43-101 TECHNICAL REPORT PEÑOLES PROJECT
2 INTRODUCTION
The Authors were commissioned by Morro Bay Resources Ltd. (Morro Bay) and Riverside Resources Inc.
(Riverside) to prepare maiden resource estimates for the Jesus Maria Silver Zone and the El Capitan Gold
Zone and submit a technical report that complies with the requirements of the Canadian Securities
Administrators National Instrument 43-101 (NI 43-101).
Morro Bay and Riverside are publically traded corporations listed on the TSX Venture Exchange (TSX-V)
under the symbols MRB and RRI, respectively. In Mexico, exploration work is conducted by Morro Bay’s
wholly owned subsidiary Minera MB Resources S.A. de C.V. (Minera MB).
This technical report will be used by Morro Bay and Riverside to fulfill their continuing disclosure
requirements under Canadian securities laws, including the requirements of National Instrument 43-101
Standards of Disclosure for Mineral Projects.
This technical report is based on published technical reports and technical data provided by Morro Bay
and Riverside as well as publically available government maps and publications. The property has been
the subject of recent technical reports by Daniels (2011), Magrum (2013), and Myers et al. (2014).
On May 8, 2014, a site visit was carried out by author Robert Sim, in the company of James Thom
(contract geologist employed by Morro Bay) and Howard Davies and Lex Lambeck (contract geologists
employed by Riverside). Sim inspected the core logging and core storage facilities at the project site
office, examined drill core from the El Capitan and Jesus Maria target areas, reviewed plans and sections
of the historic and recent drilling completed at El Capitan and Jesus Maria, and reviewed the QA/QC
procedures implemented by Sierra Madre and Morro Bay for the drill programs completed in 2011,
2012, 2013 and spring 2014. Sim is an Independent Qualified Person as defined by National Instrument
43-101 Standards of Disclosure for Mineral Projects. Sim also visited the site on June 12, 2012 during
which he observed on-site drilling activities on the El Capitan deposit.
On January 20-22, 2015, a site visit was carried out by author Ben Whiting, in the company of James
Thom (contract geologist employed by Morro Bay). Whiting examined several drill sites completed by
Sierra Madre and Morro Bay, inspected the core logging and core storage facilities at the project site
office, examined drill core from the El Capitan and Jesus Maria target areas, reviewed plans and sections
of the historic and recent drilling completed at El Capitan and Jesus Maria, and reviewed the QA/QC
procedures implemented by Sierra Madre and Morro Bay for the drill programs completed in 2011,
2012, 2013 and 2014. The author collected quarter-core samples from half core stored at the Morro
Bay facility located in the town of Peñoles. The author also reviewed the QA/QC procedures
implemented by Riverside for the 2008 drill program. Whiting is an Independent Qualified Person as
defined by National Instrument 43-101 Standards of Disclosure for Mineral Projects.
APRIL 2015
MORRO BAY RESOURCES LTD. | RIVERSIDE RESOURCES INC. 2-2 NI 43-101 TECHNICAL REPORT PEÑOLES PROJECT
The metallurgical test work that has been completed to date was reviewed by Mike Redfearn, P.Eng.
Redfearn is an Independent Qualified Person as defined by National Instrument 43-101 Standards of
Disclosure for Mineral Projects.
The Authors acknowledge the assistance and expedient provision of all requested information by Morro
Bay and Riverside in the compilation of this report. The documents that were reviewed, and any other
sources of information, are listed in Section 19 References.
All currency quoted in this report refers to Canadian dollars (CDN$), unless otherwise noted.
APRIL 2015
MORRO BAY RESOURCES LTD. | RIVERSIDE RESOURCES INC. 3-1 NI 43-101 TECHNICAL REPORT PEÑOLES PROJECT
3 RELIANCE ON OTHER EXPERTS
For the purpose of this report, the Authors have relied on claim ownership information provided by
Riverside. The Authors have not researched property titles or mineral rights for the Peñoles Gold-Silver
Project, and they have not reviewed the Peñoles Option Agreement between Riverside and Morro Bay.
As a result, the Authors express no opinion as to the ownership status of the property.
Section 4 Property Description and Location was provided by Morro Bay and Riverside, and has not been
independently verified. However, the Authors have no reason to question the title status stated in this
report.
APRIL 2015
MORRO BAY RESOURCES LTD. | RIVERSIDE RESOURCES INC. 4-1 NI 43-101 TECHNICAL REPORT PEÑOLES PROJECT
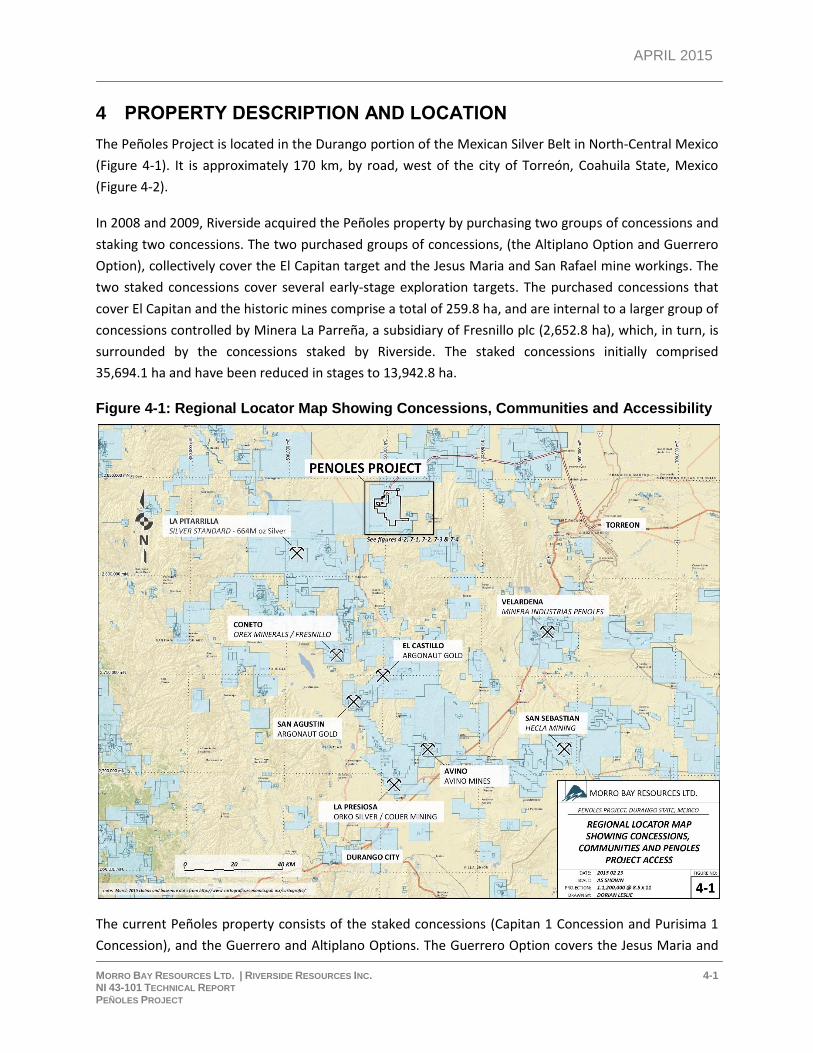
4 PROPERTY DESCRIPTION AND LOCATION
The Peñoles Project is located in the Durango portion of the Mexican Silver Belt in North-Central Mexico
(Figure 4-1). It is approximately 170 km, by road, west of the city of Torreón, Coahuila State, Mexico
(Figure 4-2).
In 2008 and 2009, Riverside acquired the Peñoles property by purchasing two groups of concessions and
staking two concessions. The two purchased groups of concessions, (the Altiplano Option and Guerrero
Option), collectively cover the El Capitan target and the Jesus Maria and San Rafael mine workings. The
two staked concessions cover several early-stage exploration targets. The purchased concessions that
cover El Capitan and the historic mines comprise a total of 259.8 ha, and are internal to a larger group of
concessions controlled by Minera La Parreña, a subsidiary of Fresnillo plc (2,652.8 ha), which, in turn, is
surrounded by the concessions staked by Riverside. The staked concessions initially comprised
35,694.1 ha and have been reduced in stages to 13,942.8 ha.
Figure 4-1: Regional Locator Map Showing Concessions, Communities and Accessibility
The current Peñoles property consists of the staked concessions (Capitan 1 Concession and Purisima 1
Concession), and the Guerrero and Altiplano Options. The Guerrero Option covers the Jesus Maria and
APRIL 2015
MORRO BAY RESOURCES LTD. | RIVERSIDE RESOURCES INC. 4-2 NI 43-101 TECHNICAL REPORT PEÑOLES PROJECT
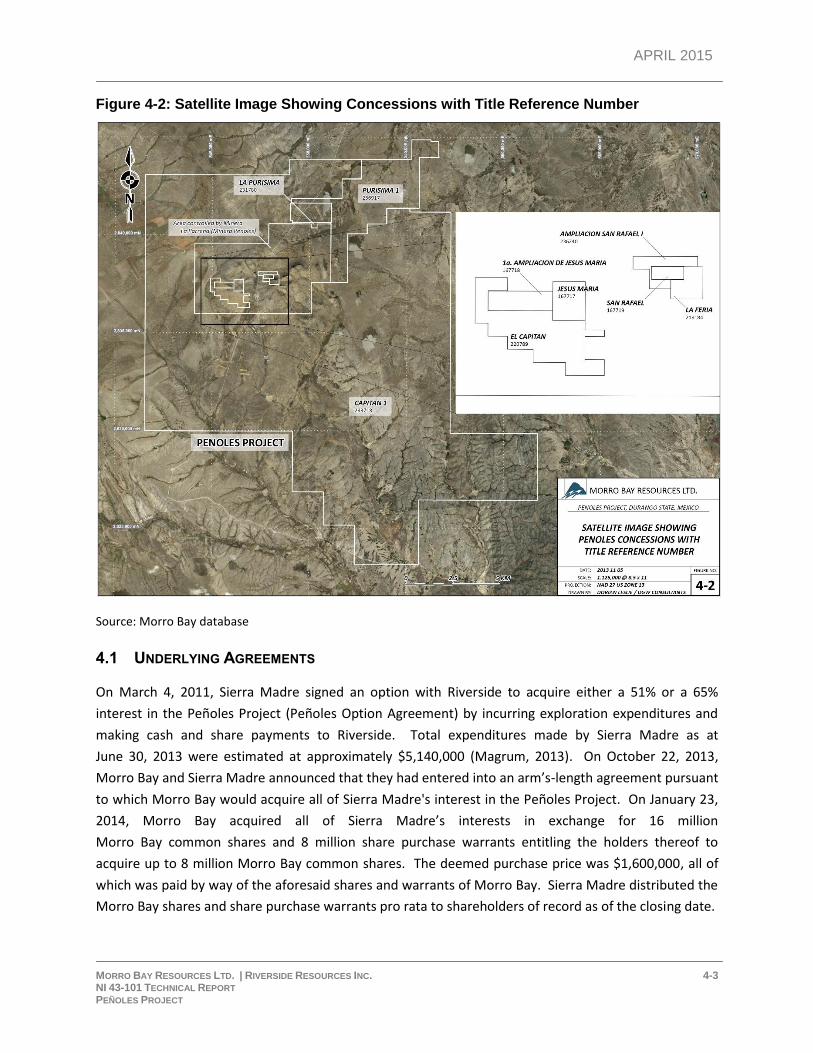
San Rafael prospects, and the Altiplano Option covers the El Capitan prospect. The centre of the project
area is located at approximately 546000mE and 2837000mN (UTM Zone 13N, NAD 27 – Mexico Datum).
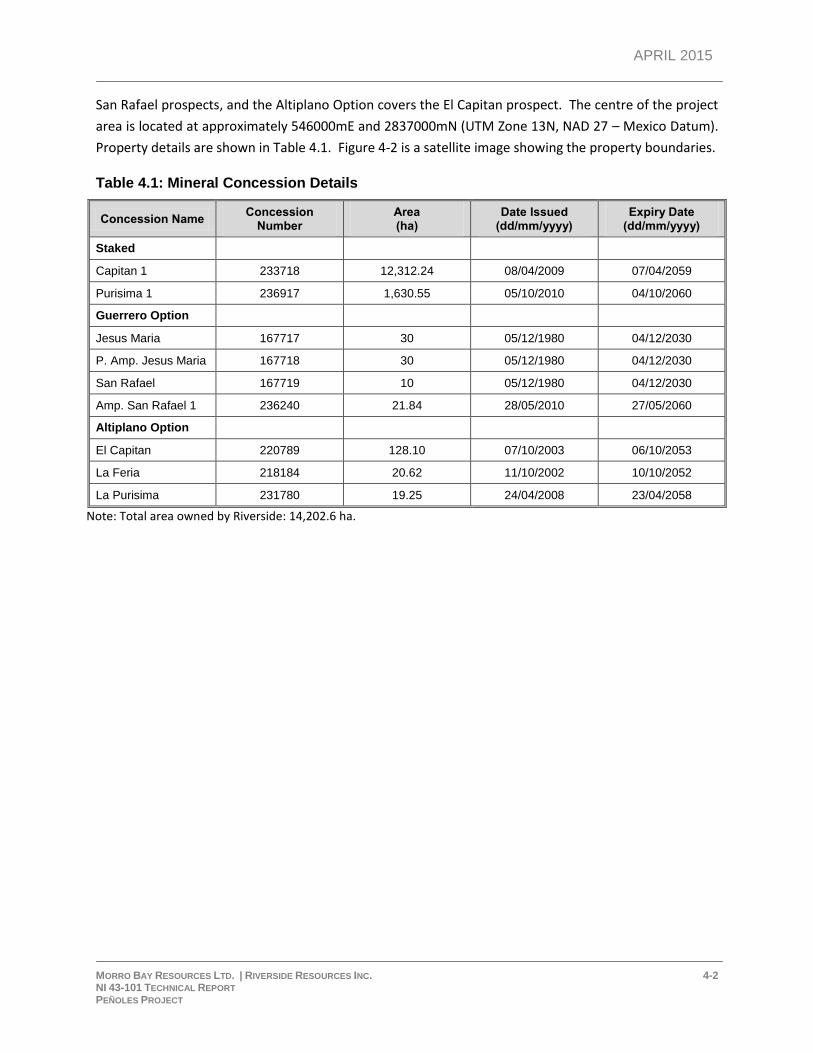
Property details are shown in Table 4.1. Figure 4-2 is a satellite image showing the property boundaries.
Table 4.1: Mineral Concession Details
Concession Name Concession
Number Area (ha)
Date Issued (dd/mm/yyyy)
Expiry Date (dd/mm/yyyy)
Staked
Capitan 1 233718 12,312.24 08/04/2009 07/04/2059
Purisima 1 236917 1,630.55 05/10/2010 04/10/2060
Guerrero Option
Jesus Maria 167717 30 05/12/1980 04/12/2030
P. Amp. Jesus Maria 167718 30 05/12/1980 04/12/2030
San Rafael 167719 10 05/12/1980 04/12/2030
Amp. San Rafael 1 236240 21.84 28/05/2010 27/05/2060
Altiplano Option
El Capitan 220789 128.10 07/10/2003 06/10/2053
La Feria 218184 20.62 11/10/2002 10/10/2052
La Purisima 231780 19.25 24/04/2008 23/04/2058
Note: Total area owned by Riverside: 14,202.6 ha.
APRIL 2015
MORRO BAY RESOURCES LTD. | RIVERSIDE RESOURCES INC. 4-3 NI 43-101 TECHNICAL REPORT PEÑOLES PROJECT
Figure 4-2: Satellite Image Showing Concessions with Title Reference Number
Source: Morro Bay database
4.1 UNDERLYING AGREEMENTS
On March 4, 2011, Sierra Madre signed an option with Riverside to acquire either a 51% or a 65%
interest in the Peñoles Project (Peñoles Option Agreement) by incurring exploration expenditures and
making cash and share payments to Riverside. Total expenditures made by Sierra Madre as at
June 30, 2013 were estimated at approximately $5,140,000 (Magrum, 2013). On October 22, 2013,
Morro Bay and Sierra Madre announced that they had entered into an arm’s-length agreement pursuant
to which Morro Bay would acquire all of Sierra Madre's interest in the Peñoles Project. On January 23,
2014, Morro Bay acquired all of Sierra Madre’s interests in exchange for 16 million
Morro Bay common shares and 8 million share purchase warrants entitling the holders thereof to
acquire up to 8 million Morro Bay common shares. The deemed purchase price was $1,600,000, all of
which was paid by way of the aforesaid shares and warrants of Morro Bay. Sierra Madre distributed the
Morro Bay shares and share purchase warrants pro rata to shareholders of record as of the closing date.
APRIL 2015
MORRO BAY RESOURCES LTD. | RIVERSIDE RESOURCES INC. 4-4 NI 43-101 TECHNICAL REPORT PEÑOLES PROJECT
In order to earn a 51% interest in the Peñoles Project, Morro Bay was initially required to expend
$750,000 of exploration expenditures by June 30, 2014, and pay Riverside $1,350,000 cash ($100,000
and USD$1,250,000) and issue $1,500,000 worth of Morro Bay shares (or cash at Morro Bay’s option,
provided that, if the market value of the Morro Bay shares is less than $0.05 based on a 30-day volume-
weighted average price [VWAP], such payments would be made in cash). In 2014, Morro Bay incurred
approximately $1,250,000 in exploration expenditures and made a $750,000 payment to Riverside in
shares of Morro Bay.
On January 20 and April 1, 2015, Morro Bay and Riverside announced amendments to the Peñoles
Option Agreement such that Morro Bay can earn an initial 51% interest by making a payment of
$750,000 by May 1, 2015 (payable in cash or Morro Bay shares at Morro Bay’s election, provided that, if
the market value of Morro Bay shares is less than $0.05 based on a 30-day VWAP, such payment would
be made in cash). Additional terms are included in the press releases dated January 20, 2015 and
April 1, 2015.
4.1.1 Capitan 1 Concession and Purisima 1 Concession
The Capitan 1 Concession (233718) was granted to Riverside on April 8, 2009 following an open
application process, and it is valid for a period of 50 years. The Purisima 1 Concession (236917) was
granted to Riverside on October 5, 2010 (see Mining Law Section). Concession holders must maintain
their properties in good standing by way of minimum annual work commitments and tax payments (see
Tables 4.2, 4.3 and 4.4; information is current as of December 31, 2014). According to the provisions of
the Altiplano Option agreement, the Capitan 1 and Purisima 1 concessions are subject to a 0.75% net
smelter royalty payable to Altiplano.
As part of the 2014 exploration program, Morro Bay and Riverside reviewed all available technical data
for the early-stage exploration target areas located within the Capitan 1 and Purisima 1 concessions
staked by Riverside, and elected to reduce the staked concession holdings to 13,942.8 ha.
The schedule of annual work commitments applicable to all concessions for 2015 is detailed in Table 4.4.
4.1.2 Guerrero Option (Jesus Maria and San Rafael)
Riverside optioned four concessions from the Jose Guerrero family that covered the Jesus Maria and
San Rafael vein-system targets. The overall terms of the agreement outline the option to purchase
100% of the property over a period of 40 months following the signing of the option agreement
(May 30, 2008) for a total purchase price of USD$800,000. According to Riverside, all required payments
have been made and the property is 100%-owned by Riverside. According to the provisions of the
Altiplano Option agreement, the Guerrero Property is subject to a 0.75% net smelter royalty payable to
Altiplano.
APRIL 2015
MORRO BAY RESOURCES LTD. | RIVERSIDE RESOURCES INC. 4-5 NI 43-101 TECHNICAL REPORT PEÑOLES PROJECT
4.1.3 Altiplano Option (El Capitan and El Tubo)
Riverside optioned three concessions from the Altiplano Exploration Company covering the El Capitan,
El Tubo, and La Purisima targets. The overall terms of the agreement outline the option to purchase
100% of the property over a period of 48 months from the signing of the option agreement
(January 31, 2008) following the completion of the schedule of payments, work commitments, and
Riverside share issuances, as outlined in the option agreement. According to Riverside, all required
payments have been made and the property is 100%-owned by Riverside.
The Authors reviewed the Altiplano Option agreement and noted that the concessions which comprise
the Altiplano Option are subject to a Royalty Interest equivalent to 2% of the net smelter returns.
According to the agreement, Riverside and/or Riverside Mexico can, on or before January 31, 2016, elect
to purchase, by notice in writing delivered to Altiplano, all of the rights, titles, and interests of Altiplano
in and to 0.5% of the Royalty Interest (which, for greater certainty, will reduce the Royalty Interest
payable to Altiplano to 1.5%), and, upon such election being made, Altiplano will sell all rights, titles, and
interests in and to 0.5% of the Royalty Interest to Riverside or Riverside Mexico, as the case might be,
for $500,000 payable by way of certified cheque or bank draft within 30 days. In connection with the
exercise of such right to elect, Altiplano will execute and deliver such documents, agreements, transfers,
and quit claims as the solicitors for Riverside or Riverside Mexico might reasonably require.
Altiplano will be entitled to receive a Net Smelter Returns Royalty of 0.75% from third-party claims
within the Area of Interest, except for claims held by Exploraciones Mineras Parreña, S.A. de C.V., in
which case Altiplano will be entitled to a 0.5% Net Smelter Returns Royalty.
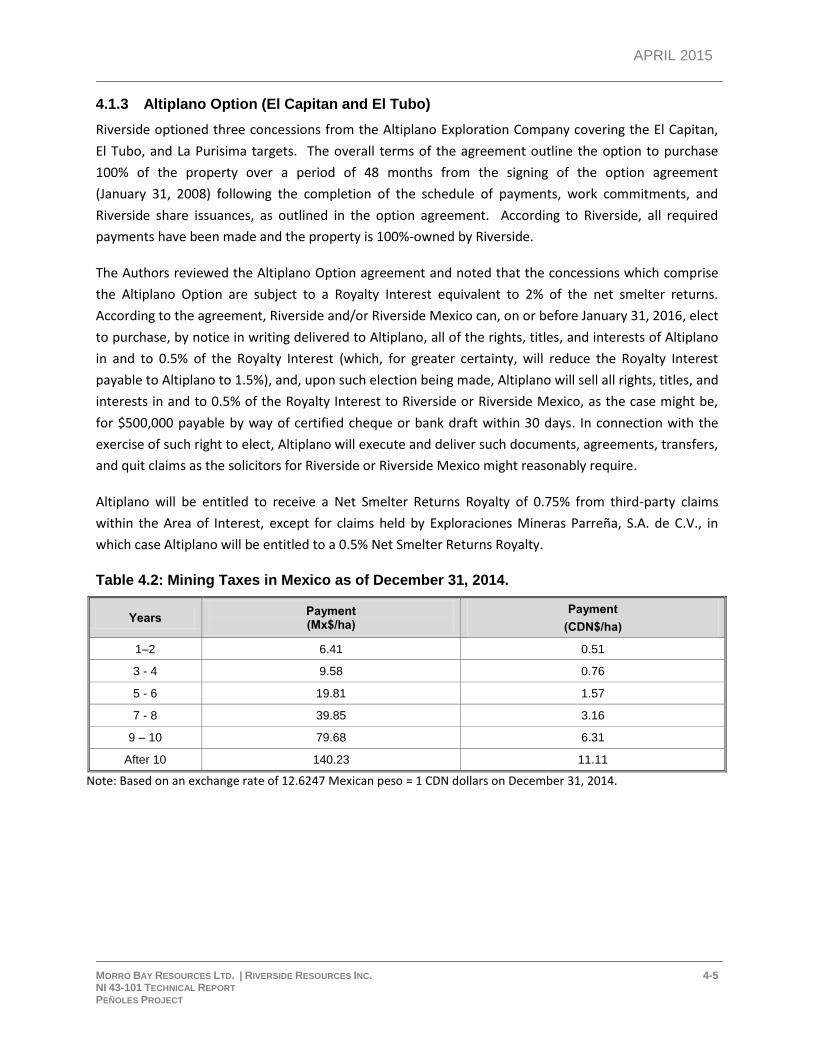
Table 4.2: Mining Taxes in Mexico as of December 31, 2014.
Years Payment (Mx$/ha)
Payment
(CDN$/ha)
1–2 6.41 0.51
3 - 4 9.58 0.76
5 - 6 19.81 1.57
7 - 8 39.85 3.16
9 – 10 79.68 6.31
After 10 140.23 11.11
Note: Based on an exchange rate of 12.6247 Mexican peso = 1 CDN dollars on December 31, 2014.
APRIL 2015
MORRO BAY RESOURCES LTD. | RIVERSIDE RESOURCES INC. 4-6 NI 43-101 TECHNICAL REPORT PEÑOLES PROJECT
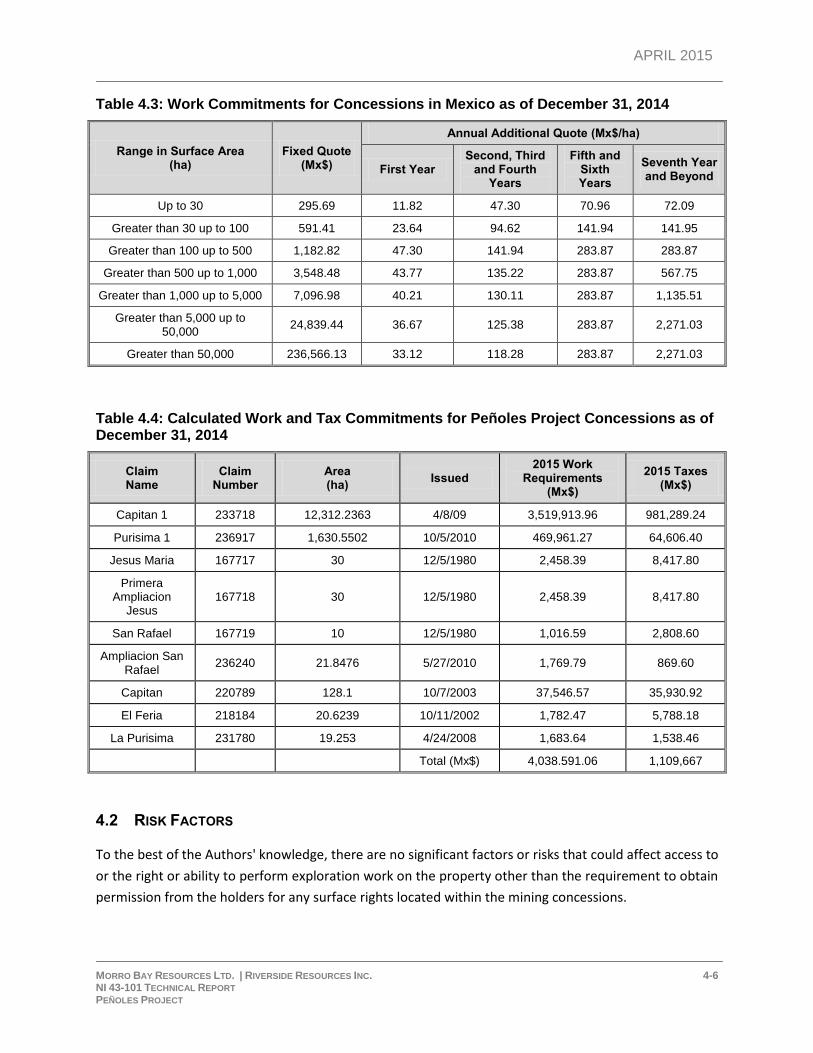
Table 4.3: Work Commitments for Concessions in Mexico as of December 31, 2014
Range in Surface Area (ha)
Fixed Quote (Mx$)
Annual Additional Quote (Mx$/ha)
First Year Second, Third
and Fourth Years
Fifth and Sixth Years
Seventh Year and Beyond
Up to 30 295.69 11.82 47.30 70.96 72.09
Greater than 30 up to 100 591.41 23.64 94.62 141.94 141.95
Greater than 100 up to 500 1,182.82 47.30 141.94 283.87 283.87
Greater than 500 up to 1,000 3,548.48 43.77 135.22 283.87 567.75
Greater than 1,000 up to 5,000 7,096.98 40.21 130.11 283.87 1,135.51
Greater than 5,000 up to 50,000
24,839.44 36.67 125.38 283.87 2,271.03
Greater than 50,000 236,566.13 33.12 118.28 283.87 2,271.03
Table 4.4: Calculated Work and Tax Commitments for Peñoles Project Concessions as of December 31, 2014
Claim Name
Claim Number
Area (ha)
Issued 2015 Work
Requirements (Mx$)
2015 Taxes (Mx$)
Capitan 1 233718 12,312.2363 4/8/09 3,519,913.96 981,289.24
Purisima 1 236917 1,630.5502 10/5/2010 469,961.27 64,606.40
Jesus Maria 167717 30 12/5/1980 2,458.39 8,417.80
Primera Ampliacion
Jesus 167718 30 12/5/1980 2,458.39 8,417.80
San Rafael 167719 10 12/5/1980 1,016.59 2,808.60
Ampliacion San Rafael
236240 21.8476 5/27/2010 1,769.79 869.60
Capitan 220789 128.1 10/7/2003 37,546.57 35,930.92
El Feria 218184 20.6239 10/11/2002 1,782.47 5,788.18
La Purisima 231780 19.253 4/24/2008 1,683.64 1,538.46
Total (Mx$) 4,038.591.06 1,109,667
4.2 RISK FACTORS
To the best of the Authors' knowledge, there are no significant factors or risks that could affect access to
or the right or ability to perform exploration work on the property other than the requirement to obtain
permission from the holders for any surface rights located within the mining concessions.
APRIL 2015
MORRO BAY RESOURCES LTD. | RIVERSIDE RESOURCES INC. 4-7 NI 43-101 TECHNICAL REPORT PEÑOLES PROJECT
The Peñoles property is a historic silver-gold-lead-zinc mine which was exploited at the turn of the 20th
Century. The ore contains arsenic, antimony, cadmium, and other trace metals. Several old mine
dumps, low-grade stockpiles, and smelter slags are present in the area related to the historic workings.
Several of the old tailings piles were sold by the local Ejido to unrelated parties and processed; these
areas were removed down to the underlying soil or bedrock surface from 2010 to 2012. The
underground mines are flooded to the upper working levels. The local Ejido used some of the mine
water for agricultural purposes, but the water was not used for human consumption. Dust
contamination has not been an issue in the past. To the Authors' knowledge, a review of mitigation
options for these issues has not been completed, but it is recommended.
To the best of the Authors' knowledge, the property is not subject to any environmental liabilities other
than the requirement to re-vegetate drill stations and drill access roads, and to back-fill trenches
excavated for exploration. Riverside and Morro Bay have been proactive and have constructed secure
enclosures surrounding existing underground mine shafts to ensure public safety.
Environmental permits have been granted and are in good standing. The permits were signed on
December 10, 2013 and are registered with the Secretario de Medio Ambiente y Recursos Naturales
(SEMARNAT), and programs are monitored by La Procuraduria Federal de Proteccion al Ambiente
(PROFEPA). The permits expire on August 18, 2015. All required reclamation for the trenching, drill
access roads, and drill pads has been completed.
Surface rights in the primary target areas (El Capitan, Jesus Maria, and San Rafael) are owned by the
Peñoles Ejido (i.e., the agrarian community). To the best of the Authors' knowledge, Riverside
negotiated a multi-year access agreement with the Peñoles Ejido which grants access to these primary
target areas. The agreement requires an annual payment and is in good standing to the best of the
Authors' knowledge. No legal review was conducted for the surface access agreement, and it is not
known if the current agreement provides access to the entire claim area.
It is common for mining companies in Mexico to negotiate surface access agreements with the owners
of surface rights within their concessions. In the event that a decision is made to complete exploration
work and drilling outside of the primary target areas, Morro Bay and Riverside will need to negotiate
with the surface-rights holders regarding access agreements.
4.3 MEXICAN MINING LAW
Mineral exploration and mining in Mexico is regulated by the Mining Law of 1992 (amended in
December 1996). The Mining Law establishes that all minerals found in Mexican territory are owned by
the Mexican nation, and that private third-parties can exploit such minerals (except oil and nuclear fuel
minerals) through mining licences, or concessions, granted by the Federal Government.
On April 29, 2005, the Mexican Congress published several amendments to the Mining Law of 1992.
According to these amendments, the exploration and exploitation concessions were replaced by a single
APRIL 2015
MORRO BAY RESOURCES LTD. | RIVERSIDE RESOURCES INC. 4-8 NI 43-101 TECHNICAL REPORT PEÑOLES PROJECT
concession type, the mining concession, which gives the holder both exploration and exploitation rights,
subject to the payment of relevant taxes. Older exploration and exploitation concessions were
automatically transformed into mining concessions with a single term of 50 years from the date the
concession was first registered at the Public Registry of Mines. Accordingly, exploration concessions
that were originally issued for a term of 6 years now have a term of 50 years from the date the
exploration concession was originally registered. Under the new amendments, the concession holder
maintains all the rights previously granted for an exploitation concession under the old law.
Concessions are freely transferable. They can be granted to or acquired by Mexican individuals, local
communities having collective ownership of the land (known as Ejidos), and companies incorporated
pursuant to Mexican law (Note: there are no foreign ownership restrictions for such companies).
Although the Constitution makes it possible for foreign individuals to hold mining concessions, the
Mining Law does not allow it. This means that foreigners wishing to engage in mining in Mexico must
establish a Mexican corporation for that purpose, or enter into joint ventures with Mexican individuals
or corporations.
Maintenance obligations which arise from a mining concession, and which must be kept current to avoid
its cancellation, require the owner to complete the following:
pay mining taxes (Table 4.2);
perform assessment work (Table 4.3); and
comply with environmental laws.
The regulations of the Mining Law establish the minimum annual amount of assessment work that must
be performed during each calendar year. Minimum annual concession taxes and minimum annual
expenditures required for assessment credit are summarized in Table 4.4 for fiscal 2015.
According to Morro Bay and Riverside, the concessions comprising the Peñoles Project are in good
standing as of the date of this report. However, it is important to note that concession taxes and
legislated minimum expenditure requirements escalate over time and are calculated on a per hectare
basis.
APRIL 2015
MORRO BAY RESOURCES LTD. | RIVERSIDE RESOURCES INC. 5-1 NI 43-101 TECHNICAL REPORT PEÑOLES PROJECT
5 ACCESSIBILITY, CLIMATE, INFRASTRUCTURE AND
PHYSIOGRAPHY
5.1 ACCESSIBILITY
The Peñoles property is easily accessible via paved and dirt roads year round. Initial access to the
property can be gained via the paved Hwy 49 north from Torreón to Bermejillo, turning west on the
paved road to Mapimi, continuing to an all-weather gravel road located just before the turn off to Santo
Domingo and then turning south. From this intersection, continue to the village of Peñoles which is
centrally located on the property. The total driving time from Torreón to the property is approximately
1.5 to 2.0 hours. The centre of the Peñoles property is located approximately 180 km north-northeast of
Durango and 50 km north of the town of Rodeo in the Municipality of San Pedro del Gallo, in Durango,
Mexico.
5.2 CLIMATE
A semi-dry climate dominates the Peñoles area and rainfall is limited to approximately 500 mm annually.
The climate is temperate with an average temperature of 18°C, with maximum temperatures reaching
35°C, and minimum temperatures falling to 2°C. The rainy season is from June through to August, with
minimal rainfall occurring from September to May. Exploration work and drilling can be conducted on a
year-round basis.
5.3 LOCAL RESOURCES
Unskilled workers are available from the village of Peñoles, but outfitters and a supply of heavy
construction equipment and skilled labour will need to be sourced from Torreón, Rodeo or Durango; all
are within a two-hour drive of the project area. Sierra Madre currently rents a house/office/core logging
complex in the village of Peñoles where core logging and processing takes place and field personnel are
housed during field operations. Geological field and technical staff must be brought in from farther
away as would be the case for any future mining personnel.
5.4 INFRASTRUCTURE
Electrical power is available throughout the property and is provided by existing power lines that cross
the property. At this time, it is not known whether sufficient power is available to support any mining
operation. Water is available from wells and old mine workings, so exploration can be carried out year
round. There are a few scattered small villages throughout the large concession area in addition to the
village of Peñoles near the El Capitan, Jesus Maria, San Rafael, and El Tubo prospects.
APRIL 2015
MORRO BAY RESOURCES LTD. | RIVERSIDE RESOURCES INC. 5-2 NI 43-101 TECHNICAL REPORT PEÑOLES PROJECT
5.5 PHYSIOGRAPHY
The Peñoles Project comprises two distinct topographic zones: a central zone that consists of low hills
with a maximum relief of 100 m, and a flat-lying zone that forms an apron around the central hills.
Absolute relief varies from 1,875 m above mean sea level (amsl) in stream gullies to 2,000 m amsl.
Numerous intermittent streams bisect the landscape and drainage is almost fan-like away from the
central hills. Vegetation in the area consists of various species of cactus, mesquite, and other thorny
bushes. Fertile areas of the flat-lying fans near prominent streams are under cultivation (corn, beans),
and the remainder is used for pasture land.
5.6 WATER RESOURCES
Groundwater is present in the Quaternary gravel basins created by basin-and-range faulting in the
region. To date, no water, well-specific drilling or flow-rate pump tests have been conducted by Morro
Bay or Riverside. Future work may include conducting ground water resource assessments.
APRIL 2015
MORRO BAY RESOURCES LTD. | RIVERSIDE RESOURCES INC. 6-1 NI 43-101 TECHNICAL REPORT PEÑOLES PROJECT
6 HISTORY
According to Daniels (2011), the current Peñoles property of Riverside was acquired through options in
2008 and through concession applications in 2008 and 2009, and is actually part of a much larger land
package held historically in the region by Minera Industrias Peñoles and/or its subsidiaries. The
historical work recounted here mainly pertains to the exploration and mining work carried out by a few
sporadic operators up until modern times, as the area has been mined since the 1880s, and this is the
property where Minera Industrias Peñoles began in 1887. Minera Industrias Peñoles still exists today
and holds mining claims in the area. Note: Parts of the property were explored throughout its history,
but it was not consolidated into a coherent exploration package prior to Riverside's involvement.
1887 to 1908
Minera Industrias Peñoles acquired the Jesus Maria, Nuestra Señora del Refugio and San Rafael mines
near the town of Peñoles and operated until 1908. At that time, two orebodies, one at Jesus Maria
(silver-lead-zinc-arsenic) and the other at San Rafael (silver), were reportedly mined out. The full extent
of the historic mine workings is unknown, but mining appears to have been selective and limited to
within approximately 100 m of surface.
1991 to 1993
Vicente Aguirre operated a small 100 t/d operation on the San Rafael mine dumps and reportedly
produced 350 g/t to 400 g/t Ag throughout his operations life. The land holdings lapsed and were
acquired by Jose Guerrero Legoretta with whom Riverside currently has option agreements.
2003
Consejo de Recursos Minerales published geological information map sheet G13-D22. On this sheet, a
reference is made to sampling at Jesus Maria in 1960, but there is no reference citation.
La Plata Gold signed an option agreement with Jose Guerrero to acquire 100% of the Jesus Maria and
San Rafael gold-silver exploration properties. Documented exploration activities were not available at
the time of report preparation.
2004
Aurcana optioned the Jesus Maria and San Rafael properties from La Plata and signed an option
agreement with Altiplano to acquire 100% of El Capitan. Aurcana completed a four-hole drilling
program. For details regarding the drilling completed by Aurcana in 2004, see Section 10 Drilling.
2008 and 2009
Riverside optioned the Peñoles property; it completed surface mapping, a limited IP survey, and a five-
hole drilling program. For details regarding the drilling completed by Riverside in 2008, see Section 10
Drilling.
APRIL 2015
MORRO BAY RESOURCES LTD. | RIVERSIDE RESOURCES INC. 6-2 NI 43-101 TECHNICAL REPORT PEÑOLES PROJECT
According to Daniels (2011), the drill holes completed by Aurcana and Riverside returned encouraging
results and showed that El Capitan has potential to host a bulk-tonnage, low-grade deposit.
APRIL 2015
MORRO BAY RESOURCES LTD. | RIVERSIDE RESOURCES INC. 7-1 NI 43-101 TECHNICAL REPORT PEÑOLES PROJECT
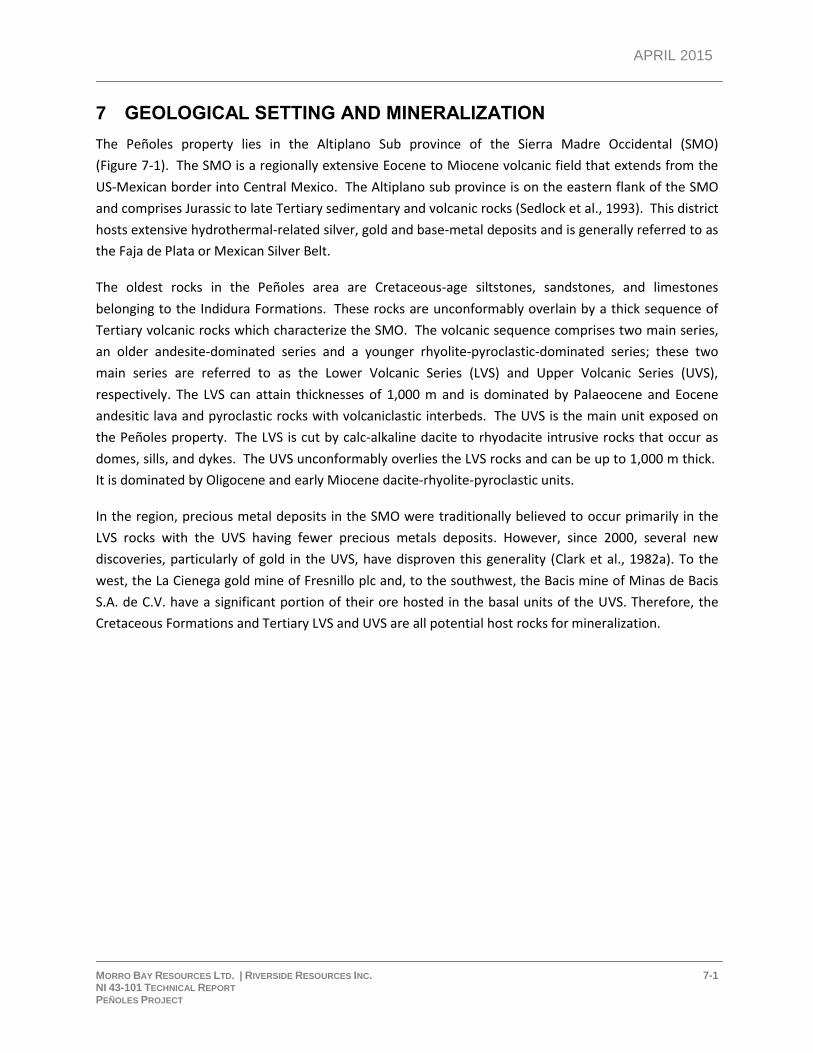
7 GEOLOGICAL SETTING AND MINERALIZATION
The Peñoles property lies in the Altiplano Sub province of the Sierra Madre Occidental (SMO)
(Figure 7-1). The SMO is a regionally extensive Eocene to Miocene volcanic field that extends from the
US-Mexican border into Central Mexico. The Altiplano sub province is on the eastern flank of the SMO
and comprises Jurassic to late Tertiary sedimentary and volcanic rocks (Sedlock et al., 1993). This district
hosts extensive hydrothermal-related silver, gold and base-metal deposits and is generally referred to as
the Faja de Plata or Mexican Silver Belt.
The oldest rocks in the Peñoles area are Cretaceous-age siltstones, sandstones, and limestones
belonging to the Indidura Formations. These rocks are unconformably overlain by a thick sequence of
Tertiary volcanic rocks which characterize the SMO. The volcanic sequence comprises two main series,
an older andesite-dominated series and a younger rhyolite-pyroclastic-dominated series; these two
main series are referred to as the Lower Volcanic Series (LVS) and Upper Volcanic Series (UVS),
respectively. The LVS can attain thicknesses of 1,000 m and is dominated by Palaeocene and Eocene
andesitic lava and pyroclastic rocks with volcaniclastic interbeds. The UVS is the main unit exposed on
the Peñoles property. The LVS is cut by calc-alkaline dacite to rhyodacite intrusive rocks that occur as
domes, sills, and dykes. The UVS unconformably overlies the LVS rocks and can be up to 1,000 m thick.
It is dominated by Oligocene and early Miocene dacite-rhyolite-pyroclastic units.
In the region, precious metal deposits in the SMO were traditionally believed to occur primarily in the
LVS rocks with the UVS having fewer precious metals deposits. However, since 2000, several new
discoveries, particularly of gold in the UVS, have disproven this generality (Clark et al., 1982a). To the
west, the La Cienega gold mine of Fresnillo plc and, to the southwest, the Bacis mine of Minas de Bacis
S.A. de C.V. have a significant portion of their ore hosted in the basal units of the UVS. Therefore, the
Cretaceous Formations and Tertiary LVS and UVS are all potential host rocks for mineralization.
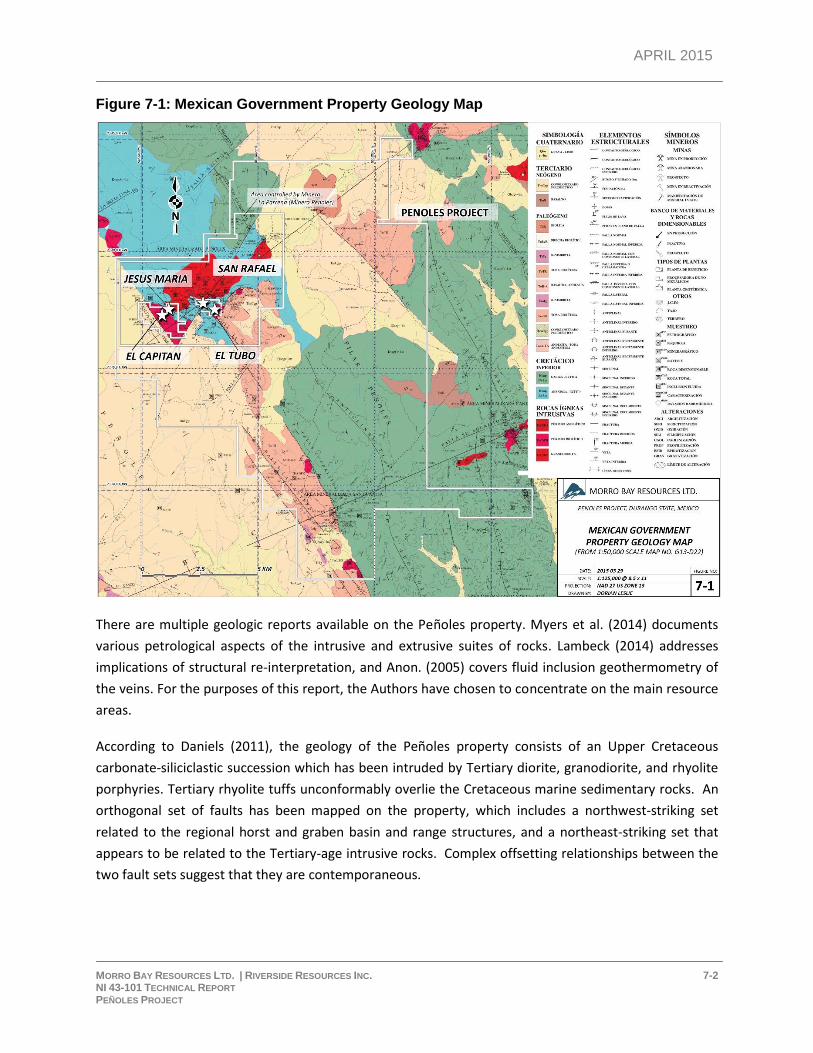
APRIL 2015
MORRO BAY RESOURCES LTD. | RIVERSIDE RESOURCES INC. 7-2 NI 43-101 TECHNICAL REPORT PEÑOLES PROJECT
Figure 7-1: Mexican Government Property Geology Map
There are multiple geologic reports available on the Peñoles property. Myers et al. (2014) documents
various petrological aspects of the intrusive and extrusive suites of rocks. Lambeck (2014) addresses
implications of structural re-interpretation, and Anon. (2005) covers fluid inclusion geothermometry of
the veins. For the purposes of this report, the Authors have chosen to concentrate on the main resource
areas.
According to Daniels (2011), the geology of the Peñoles property consists of an Upper Cretaceous
carbonate-siliciclastic succession which has been intruded by Tertiary diorite, granodiorite, and rhyolite
porphyries. Tertiary rhyolite tuffs unconformably overlie the Cretaceous marine sedimentary rocks. An
orthogonal set of faults has been mapped on the property, which includes a northwest-striking set
related to the regional horst and graben basin and range structures, and a northeast-striking set that
appears to be related to the Tertiary-age intrusive rocks. Complex offsetting relationships between the
two fault sets suggest that they are contemporaneous.
APRIL 2015
MORRO BAY RESOURCES LTD. | RIVERSIDE RESOURCES INC. 7-3 NI 43-101 TECHNICAL REPORT PEÑOLES PROJECT
7.1 MINERALIZATION
There are three features that control the epithermal mineralization on the Peñoles property. It is unclear
which feature is most influential, but it is clear that all three play a part.
First, structurally controlled conduit pathways for hydrothermal fluids mark the vein emplacement in
the Jesus Maria area (Daniels, 2011; Lambeck, 2014).
Second, the Jesus Maria area has carbonate-rich sedimentary rock horizons, which have provided a
buffering of the acidic hydrothermal fluids, and show hornfels skarn affinities; this might extend
mineralization laterally along bedding planes (Myers et al., 2014).
Lastly, the angular unconformity surface between the sedimentary rocks and the overlying UVS rhyolites
at El Capitan, which is a more passive fluid flow conduit, are similar to the mineralization controls
identified at La Preciosa silver-gold deposit (Whiting, 2008; Whiting, 2013) and La Pitarrilla silver-gold
deposit (McCrea, 2006; Boychuck et al., 2012).
The El Capitan deposit, the Jesus Maria deposit, and the San Rafael-El Tubo prospects of the Peñoles
Project are located on the concessions owned by Riverside (within the boundaries of the concessions
held by Minera La Parreña), and they appear to be related to intersections between the northwest-
striking and northeast-striking regional structures. These occurrences are also localized along the
southern margins of a northeast-oriented magnetic anomaly identified from government airborne
surveys (see Figure 7-2 and Figure 7-3). Figure 7-4 shows the location of the main prospects, published
stream sediment geochemistry for silver, and the generalized topography of the project area.
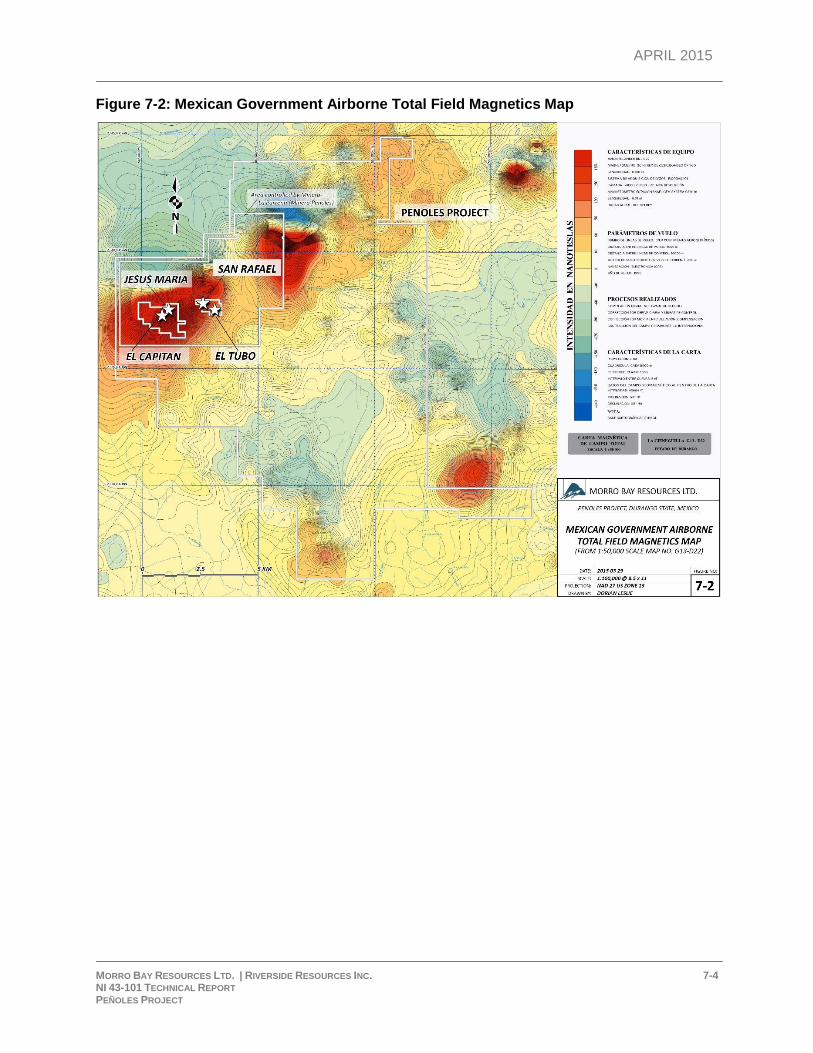
APRIL 2015
MORRO BAY RESOURCES LTD. | RIVERSIDE RESOURCES INC. 7-4 NI 43-101 TECHNICAL REPORT PEÑOLES PROJECT
Figure 7-2: Mexican Government Airborne Total Field Magnetics Map
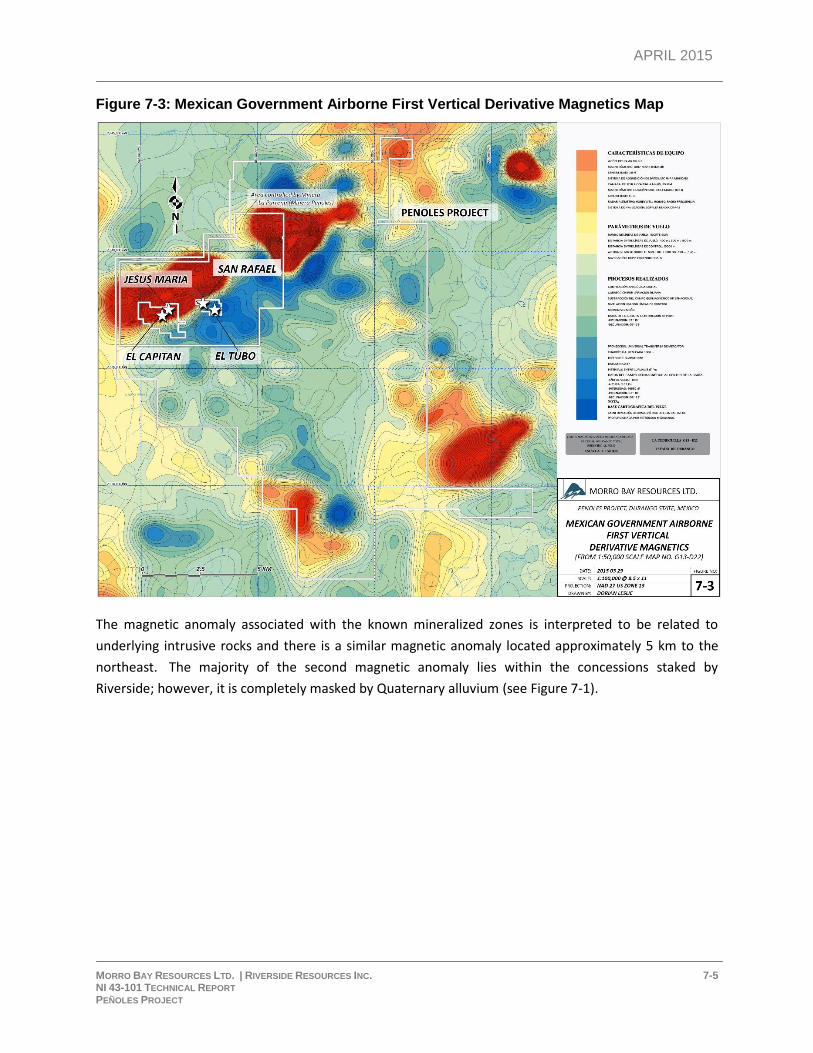
APRIL 2015
MORRO BAY RESOURCES LTD. | RIVERSIDE RESOURCES INC. 7-5 NI 43-101 TECHNICAL REPORT PEÑOLES PROJECT
Figure 7-3: Mexican Government Airborne First Vertical Derivative Magnetics Map
The magnetic anomaly associated with the known mineralized zones is interpreted to be related to
underlying intrusive rocks and there is a similar magnetic anomaly located approximately 5 km to the
northeast. The majority of the second magnetic anomaly lies within the concessions staked by
Riverside; however, it is completely masked by Quaternary alluvium (see Figure 7-1).
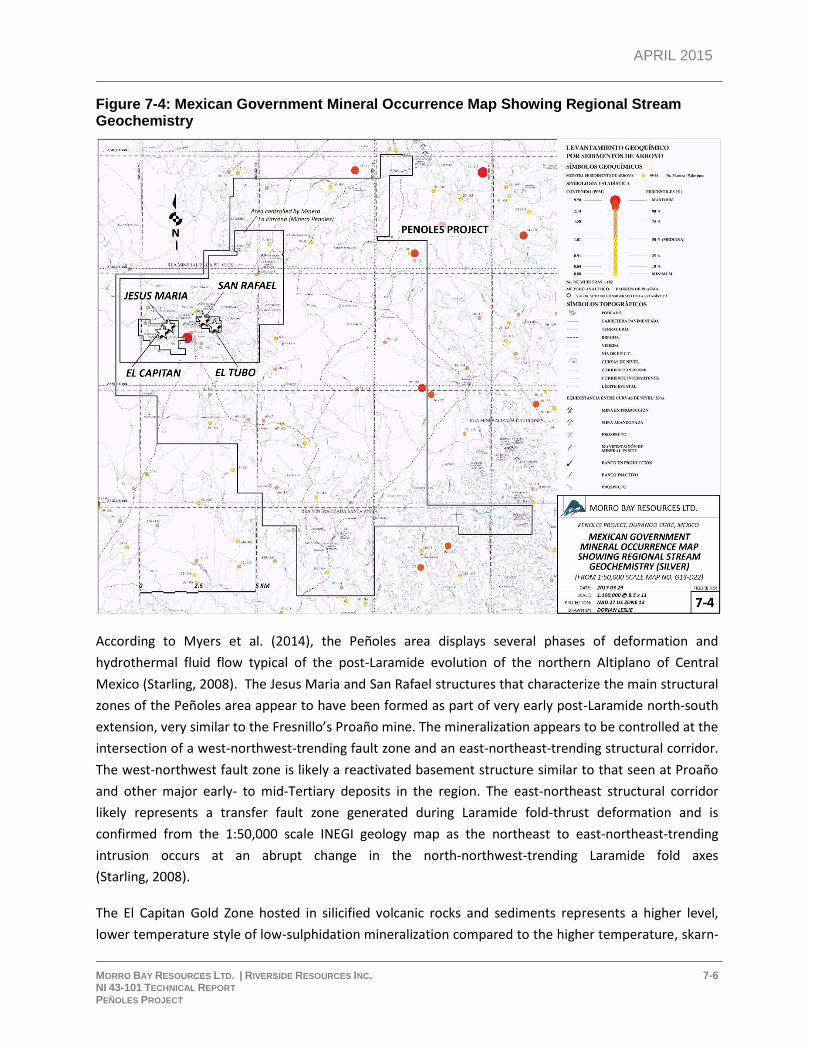
APRIL 2015
MORRO BAY RESOURCES LTD. | RIVERSIDE RESOURCES INC. 7-6 NI 43-101 TECHNICAL REPORT PEÑOLES PROJECT
Figure 7-4: Mexican Government Mineral Occurrence Map Showing Regional Stream Geochemistry
According to Myers et al. (2014), the Peñoles area displays several phases of deformation and
hydrothermal fluid flow typical of the post-Laramide evolution of the northern Altiplano of Central
Mexico (Starling, 2008). The Jesus Maria and San Rafael structures that characterize the main structural
zones of the Peñoles area appear to have been formed as part of very early post-Laramide north-south
extension, very similar to the Fresnillo’s Proaño mine. The mineralization appears to be controlled at the
intersection of a west-northwest-trending fault zone and an east-northeast-trending structural corridor.
The west-northwest fault zone is likely a reactivated basement structure similar to that seen at Proaño
and other major early- to mid-Tertiary deposits in the region. The east-northeast structural corridor
likely represents a transfer fault zone generated during Laramide fold-thrust deformation and is
confirmed from the 1:50,000 scale INEGI geology map as the northeast to east-northeast-trending
intrusion occurs at an abrupt change in the north-northwest-trending Laramide fold axes
(Starling, 2008).
The El Capitan Gold Zone hosted in silicified volcanic rocks and sediments represents a higher level,
lower temperature style of low-sulphidation mineralization compared to the higher temperature, skarn-
APRIL 2015
MORRO BAY RESOURCES LTD. | RIVERSIDE RESOURCES INC. 7-7 NI 43-101 TECHNICAL REPORT PEÑOLES PROJECT
hosted mineralization of the Jesus Maria-Refugio structure. Cross-cutting gold-silver structures in the
Jesus Maria Silver Zone appear to be later in age and lower temperature, which is similar to, or possibly
related to, the El Capitan mineralization. The bedded textures in the El Capitan silica cap zone might
reflect repeated hydrothermal depressurization and brecciation events in a volcanic/sub-volcanic
environment.
In the Jesus Maria area, the hydrothermal skarn is transitional to a series of sub-parallel, late- to post-
mineralization coarse calcite veins referred to as carbonate-gold zones that are common in many
deposits in the Altiplano (e.g., Velardeña, Fresnillo, and Guanajuato). The rare kinematic indicators show
that the quartz-calcite and late carbonate veins were emplaced under a phase of north-south to north-
northeast extensions similar to that at many deposits in the Altiplano generated around 32-28 Ma.
These late carbonate veins are cut by low-temperature quartz veinlets and breccias that appear to have
formed under more northeast extensions as they show dextral transtensional reactivation of the east-
northeast- to west-northwest-trending carbonate zones.
7.2 EL CAPITAN
The El Capitan target is situated at a major intersection of northeast-trending and northwest-trending
structural lineaments (Starling, 2008). The target area geology consists of an Upper Cretaceous,
carbonate-siliciclastic succession which has been intruded by Tertiary diorite, granodiorite, and rhyolite
porphyries. Tertiary rhyolite tuffs unconformably cap the Cretaceous marine sedimentary rocks.
According to Daniels (2011) and Magrum (2013), the El Capitan target is a > 700 m long by 70 m thick
mineralized zone, trending east-west/northwest-southeast, with a shallow dip to the south. It occurs
along a geologically unconformable contact formed between a tilted Tertiary volcaniclastic unit and a
folded Cretaceous marine sedimentary sequence. The El Capitan target displays hot-spring-style gold
mineralization consisting of quartz-calcite-fluorite veins, breccias, stringers, silicification and stockwork
veining, associated with a very active volcanic sequence, contemporaneous with several breccia stages
and accompanied by moderate to strong silicification, moderate oxidation, and local argillic alteration.
Several silica pulses and bladed carbonate minerals are present. These bladed carbonate minerals,
commonly pseudo-morphed by quartz, are interpreted to indicate gold deposition from boiling fluids,
which is the mechanism that cause the ore fluids to drop their mineralized fluid into available open
space.
According to Magrum (2013), drilling has defined three distinct, mineralized rock units at El Capitan. The
upper part of the mineralized zone consists of porous, volcanic agglomerates cut by narrow quartz
veinlets and hydrothermal breccias (averaging 0.2 g/t to 0.5 g/t Au). At the base of the volcanic unit
there is a shallow dipping, 10.0 m to 35.0 m wide silicified zone (averaging 0.7 g/t to 1.5 g/t Au), and
below this zone there is a sequence of oxidized shales that is also cut by quartz veinlets and
hydrothermal breccias (averaging 0.2 g/t to 0.6 g/t Au).
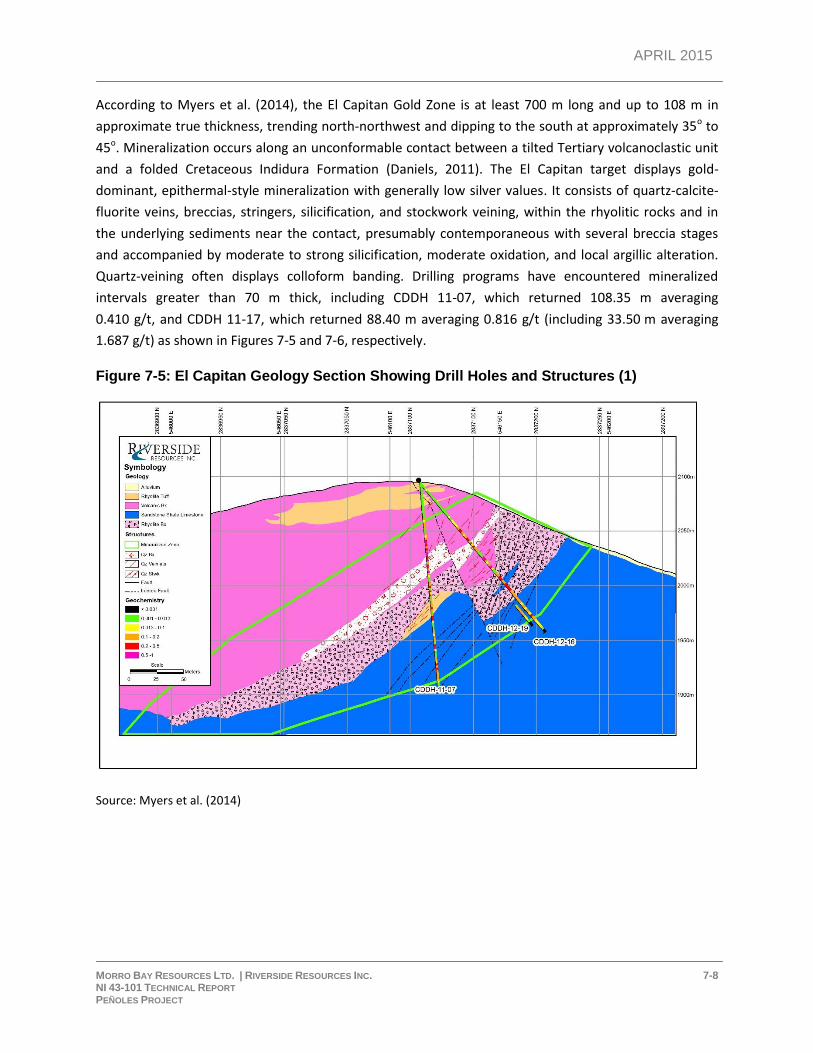
APRIL 2015
MORRO BAY RESOURCES LTD. | RIVERSIDE RESOURCES INC. 7-8 NI 43-101 TECHNICAL REPORT PEÑOLES PROJECT
According to Myers et al. (2014), the El Capitan Gold Zone is at least 700 m long and up to 108 m in
approximate true thickness, trending north-northwest and dipping to the south at approximately 35o to
45o. Mineralization occurs along an unconformable contact between a tilted Tertiary volcanoclastic unit
and a folded Cretaceous Indidura Formation (Daniels, 2011). The El Capitan target displays gold-
dominant, epithermal-style mineralization with generally low silver values. It consists of quartz-calcite-
fluorite veins, breccias, stringers, silicification, and stockwork veining, within the rhyolitic rocks and in
the underlying sediments near the contact, presumably contemporaneous with several breccia stages
and accompanied by moderate to strong silicification, moderate oxidation, and local argillic alteration.
Quartz-veining often displays colloform banding. Drilling programs have encountered mineralized
intervals greater than 70 m thick, including CDDH 11-07, which returned 108.35 m averaging
0.410 g/t, and CDDH 11-17, which returned 88.40 m averaging 0.816 g/t (including 33.50 m averaging
1.687 g/t) as shown in Figures 7-5 and 7-6, respectively.
Figure 7-5: El Capitan Geology Section Showing Drill Holes and Structures (1)
Source: Myers et al. (2014)
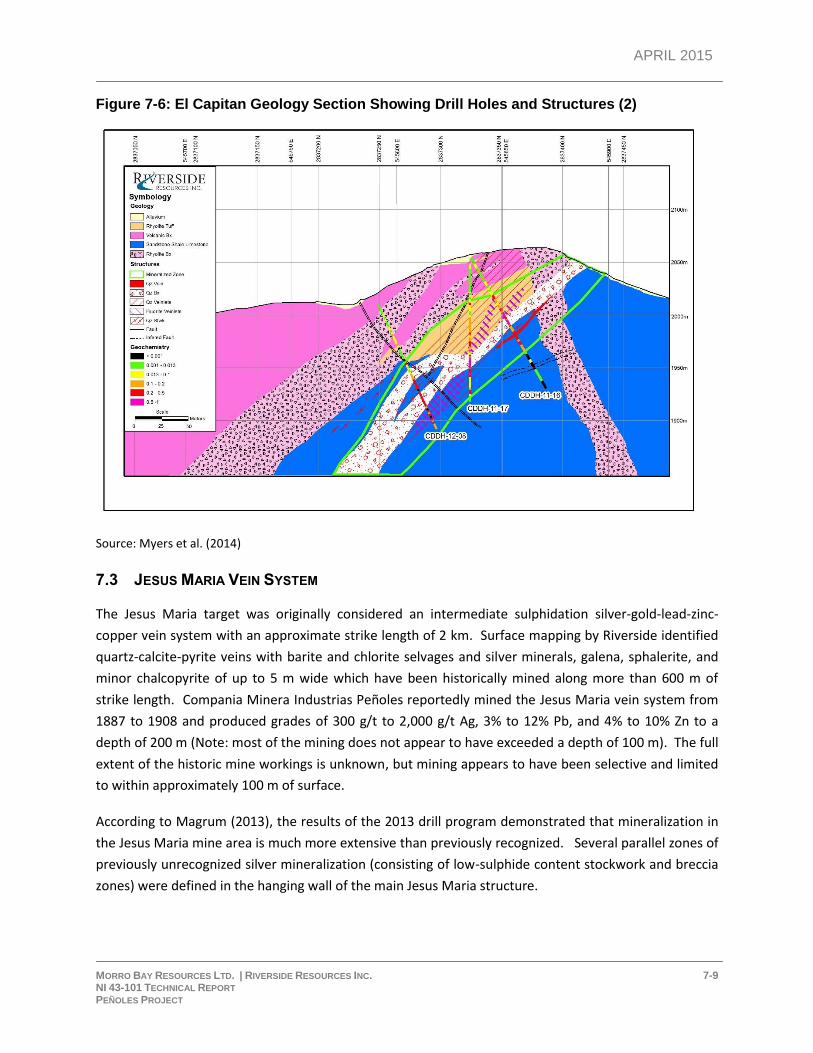
APRIL 2015
MORRO BAY RESOURCES LTD. | RIVERSIDE RESOURCES INC. 7-9 NI 43-101 TECHNICAL REPORT PEÑOLES PROJECT
Figure 7-6: El Capitan Geology Section Showing Drill Holes and Structures (2)
Source: Myers et al. (2014)
7.3 JESUS MARIA VEIN SYSTEM
The Jesus Maria target was originally considered an intermediate sulphidation silver-gold-lead-zinc-
copper vein system with an approximate strike length of 2 km. Surface mapping by Riverside identified
quartz-calcite-pyrite veins with barite and chlorite selvages and silver minerals, galena, sphalerite, and
minor chalcopyrite of up to 5 m wide which have been historically mined along more than 600 m of
strike length. Compania Minera Industrias Peñoles reportedly mined the Jesus Maria vein system from
1887 to 1908 and produced grades of 300 g/t to 2,000 g/t Ag, 3% to 12% Pb, and 4% to 10% Zn to a
depth of 200 m (Note: most of the mining does not appear to have exceeded a depth of 100 m). The full
extent of the historic mine workings is unknown, but mining appears to have been selective and limited
to within approximately 100 m of surface.
According to Magrum (2013), the results of the 2013 drill program demonstrated that mineralization in
the Jesus Maria mine area is much more extensive than previously recognized. Several parallel zones of
previously unrecognized silver mineralization (consisting of low-sulphide content stockwork and breccia
zones) were defined in the hanging wall of the main Jesus Maria structure.
APRIL 2015
MORRO BAY RESOURCES LTD. | RIVERSIDE RESOURCES INC. 7-10 NI 43-101 TECHNICAL REPORT PEÑOLES PROJECT
According to Myers et al. (2014), the Jesus Maria Silver Zone hosts vein, breccia, and poly-metallic skarn
or replacement bodies with elevated values of silver-gold-lead-zinc-copper with an approximate strike
length of 1.4 km.
The 2013 and 2014 drill program partially tested a 750 m long portion of the mineralization in the Jesus
Maria Silver Zone. Two types of mineralization were intersected in this drilling. One mineralization style
is a gold-silver zone, possibly controlled by a north-northeast-trending porphyritic monzonitic dike, or a
district-scale, east-northeast-trending fault zone. The other mineralization style hosts gold-silver-zinc-
lead and occurs as skarn or replacement-type zones in the carbonate-rich beds of the Indidura
Formation. The skarn/replacement zones are up to 30 m wide, true width in drill holes, and have been
tested as deep as 160 m from surface. The same zone outcrops at the surface giving a down-dip length
of 200 m. This zone is expected to continue at depth. The base and precious metal target types and the
gold-silver zone have been minimally tested along strike and remain open to depth and to the east and
west. Other carbonate-rich beds occur in this portion of the Indidura Formation and represent very
favourable and, currently, untested targets.
7.4 SAN RAFAEL AND EL TUBO VEIN SYSTEM
The San Rafael vein system strikes approximately east-west and contains several historical mining sites
and multiple semi-parallel and oblique vein sets. The main San Rafael structure was accessed via a
production shaft greater than 100 m deep. The San Rafael vein was also historically mined by Compania
Minera Industrias Peñoles, and reportedly produced grades ranging from 300 g/t to
1,000 g/t Ag, but no official records are available to substantiate these values. The fall 2014 drilling
program tested the main San Rafael structure, the Escondida vein, the Las Brujas zone, and the minor
vein zones between the primary structures. Results of the 2014 drill program are listed in Table 10.7.
The sedimentary rock package in the San Rafael zone appears to be dominated by siliceous siltstones,
and argillaceous limestones appear to be much less abundant than observed in the Jesus Maria Silver
Zone. Calcareous siltstones are noted at San Rafael as indicated by the presence of calc-silicate hornfels,
but skarn or carbonate-rich mineralized zones with base-metal sulphides were rare and minor. Pyrite
replacements are present in thin zones and veinlets with limited base or precious metal content.
The El Tubo target is one of the exploration targets on the Peñoles Project; it is a gold-bearing vein
system located one kilometre east of the village of Peñoles where values of 0.5 g/t Au and elevated
values of mercury, arsenic, barium, and antimony are common in surface samples. El Tubo has been
interpreted as a high-level expression of a gold-bearing vein system. A 30 m wide alteration body has
been mapped and could be drill tested. Assays from Riverside sampling in 2009 show relatively high
gold: silver ratios compared to the silver-base-metal-dominant veins at Jesus Maria and San Rafael; this
could possibly indicate a different stage of mineralization in the history of the Peñoles Mining District.
APRIL 2015
MORRO BAY RESOURCES LTD. | RIVERSIDE RESOURCES INC. 8-1 NI 43-101 TECHNICAL REPORT PEÑOLES PROJECT
8 DEPOSIT TYPES
According to Daniels (2011), the Peñoles Project is an example of an epithermal gold, silver, and base-
metals system similar to other major deposits within the Mexican Silver Belt. Epithermal deposits form
in the shallow parts of magma-related hydrothermal systems (Figure 8-1). They are generally associated
with volcanism and intrusions of calc-alkaline magmas, commonly in sub-aerial volcanic arcs. There are
two end-member styles of epithermal mineral deposits: low-sulphidation and high-sulphidation,
although intermediate-sulphidation has been used to describe many Mexican precious metal deposits.
Mineralization at Peñoles is somewhat difficult to define because it displays several of the following
mineralization styles all in very close proximity to each other:
Hot-spring gold mineralization (El Capitan structure);
Low sulphidation silver-gold-antimony mineralization (San Rafael-El Tubo and El Refugio
vein systems);
Intermediate sulphidation silver-gold-lead-zinc-copper mineralization (Jesus Maria vein
system); and
Sulphide-bearing (gold-copper-silver-zinc-lead) skarns or mantos associated with Tertiary
porphyries (La Purisima).
The Castillo deposit, previously named El Cairo (Argonaut Gold), is an example of a recent mine
development in a geological environment that is similar to the El Capitan Gold Zone. There is a structural
component to the low-grade, bulk-tonnage Castillo deposit, as seen on bench-level blast-hole assay data
plots. Castillo is a successful, heap leach operation in Durango State.
The Jesus Maria Silver Zone can be compared to the mineralization styles and geophysical responses of
the San Sebastian gold-silver (plus base metals) deposit (Hecla Mining) in Durango State (Redak, 2015b).
“… mineralization in the Saladillo district (San Sebastian) is hosted in Mesozoic sedimentary rocks and is
closely associated with Tertiary volcanic and intrusive rocks. Two NW-WNW oriented regional scale
structural features pass through the Saladillo district and are known to be important controls to
mineralization throughout the Mexican Silver Belt and in the district. A set of NE oriented regional scale
faults also traverse the center of the district and the confluence of these deep-seated WNW, NW and NE
structures appears to be an important factor for the localization of the mineralizing systems at the
Saladillo district.”
“A set of WNW oriented intermediate-sulfidation epithermal veins occur in the Saladillo Valley, including
the Francine, Middle, Professor, and North Vein. These veins are proximal to each other and are hosted
in shale of the Cretaceous Caracol Formation. This area is largely covered with soil and bedrock exposure
comes primarily from trenching. About six kilometers south of the Francine Vein is a set of NNW oriented
veins known as the Pedernalillo vein system, including the Don Sergio, Jessica, Andrea and Antonella
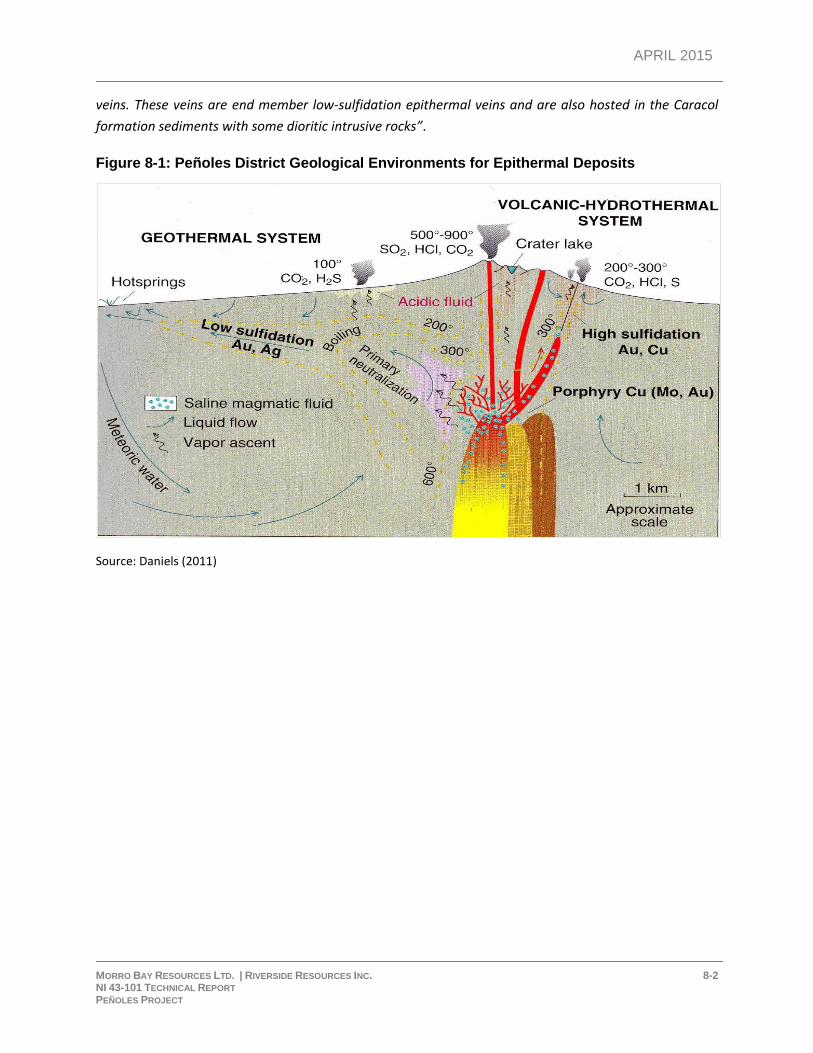
APRIL 2015
MORRO BAY RESOURCES LTD. | RIVERSIDE RESOURCES INC. 8-2 NI 43-101 TECHNICAL REPORT PEÑOLES PROJECT
veins. These veins are end member low-sulfidation epithermal veins and are also hosted in the Caracol
formation sediments with some dioritic intrusive rocks”.
Figure 8-1: Peñoles District Geological Environments for Epithermal Deposits
Source: Daniels (2011)
APRIL 2015
MORRO BAY RESOURCES LTD. | RIVERSIDE RESOURCES INC. 9-1 NI 43-101 TECHNICAL REPORT PEÑOLES PROJECT
9 EXPLORATION
Modern exploration work on the Peñoles property includes Aurcana Corporation (2004), Riverside
Resources Inc. (2008 to 2011), and Sierra Madre Developments Inc. (2011 to 2013), and work is
currently being carried out by Morro Bay Resources Ltd. (2014 to present). Exploration work has
included surface mapping, soil, rock and trench sampling, underground sampling, petrographic and fluid
inclusion studies, ground-based magnetic surveys, IP-resistivity surveys, diamond drilling, and
metallurgical testing. Reports from the various surveys and studies have been well maintained within
Morro Bay database archives and are available upon request. All drill core from the four drilling
programs mentioned here is stored on site and is readily accessible for re-logging and quartering for
verification sampling. Rejects and pulps from the drill programs completed by Sierra Madre and Morro
Bay are also stored on site and are available for verification sampling.
Exploration work carried out on the Peñoles property by Aurcana, Riverside, Sierra Madre, and Morro
Bay up until December 2014 has been summarized in two previously published, independent technical
reports (Daniels, 2011; Magrum, 2013) and in an unpublished technical report prepared by Myers et al.
(2014). This section briefly summarizes these results.
9.1 EXPLORATION WORK: AURCANA AND RIVERSIDE 2004 TO 2011 (DANIELS, 2011)
Preliminary geological work by Aurcana and Riverside showed that gold and silver mineralization
observed on the Peñoles property occurs in the same geological setting as, and exhibits many of the
same characteristics as, the epithermal-type vein systems developed throughout the Mexican Silver
Belt. Drilling carried out by Aurcana and Riverside showed that El Capitan has potential to host a bulk-
tonnage, low-grade deposit. A total of four diamond drill holes of historical drilling were carried out on
the property by Aurcana in 2004 for a total of 866.48 m. Three of the four drill holes targeted the El
Capitan Gold Zone. Aurcana drilling results are discussed in Section 10 Drilling. No other Aurcana
exploration records are known to the Authors.
From 2008 to 2011, Riverside focused its exploration work on the Jesus Maria, El Capitan, and San Rafael
mineralized zones. It carried out geophysical surveys, trenching (Trench Nos. RRI-01 to RRI-04), and
diamond drilling. During this time, Riverside also acquired the Capitan 1 and Purisima 1 concessions and
carried out reconnaissance prospecting on targets generated from an Aster alteration study. A total of
five diamond drill holes targeting El Capitan were completed in 2008 for a total of 967.6 m. Trenching
results are shown in Table 9.1. Riverside drilling results are discussed in Section 10 Drilling.
9.2 EXPLORATION WORK: SIERRA MADRE 2011 TO 2013 (MAGRUM, 2013)
From March 2011 to June 2013, Sierra Madre focused its exploration work on the Jesus Maria and
El Capitan mineralized zones. It incurred exploration expenditures of approximately $3,000,000 and
made cash and equity payments to Riverside totalling $2,140,000.
APRIL 2015
MORRO BAY RESOURCES LTD. | RIVERSIDE RESOURCES INC. 9-2 NI 43-101 TECHNICAL REPORT PEÑOLES PROJECT
The main objective of the 2011 drill program was to validate the conceptual deposit model developed
by Riverside and Aurcana, and increase the density of pierce points within El Capitan. The drilling
program was completed between June and September 2011, and included 18 drill holes totalling
2,210.1 m. In addition to the 2011 drill program at El Capitan, surface sampling and trenching was
completed in the Jesus Maria mine area. Seven new trenches (JMT 11-01 to JMT 11-07) and one drill
hole totalling 289.75 m were completed to test the Jesus Maria target. Trenching results are shown in
Table 9.1, and the drilling results are discussed in Section 10 Drilling.
In 2012, Sierra Madre completed a second drilling program on the El Capitan target. The 2012 drill
program consisted of 22 drill holes comprising 2,890.4 m. These drilling results are discussed in Section
10 Drilling.
In March 2013, Sierra Madre completed a second trenching program (consisting of nine trenches), a
limited underground sampling program and additional drilling on the Jesus Maria target. Underground
sampling was carried out along the upper levels of the former Jesus Maria mine (over a strike length of
approximately 50 m) and along a 35 m long crosscut that extends into the hanging wall of the
mineralization exposed in the mine workings. A total of eight drill holes were completed totalling
887.3 m. Trenching results are shown in Table 9.1, underground sampling results are summarized in
Tables 9.2 and 9.3, and drilling results are discussed in Section 10 Drilling.
During 2011 and 2012, drilling at El Capitan encountered numerous intervals of gold mineralization
ranging from 50 m to 140 m wide. Jesus Maria was initially considered an underground vein-type target;
however, drilling and sampling of a 35 m long crosscut in 2013 encountered wide intervals of silver
mineralization with accessory gold and base-metal values in the hanging wall of the mineralized zone
that was exploited by the historic mine workings.
9.3 EXPLORATION WORK: MORRO BAY 2014 (MYERS ET AL., 2014)
In January 2014, Morro Bay assumed control of Sierra Madre’s option agreement, with Riverside as
program operator. Morro Bay focused its exploration work on the Jesus Maria and San Rafael prospects
and carried out geological mapping, geophysical surveys (mag and IP), soil sampling, and diamond
drilling. In 2014, it incurred exploration expenditures of approximately $1,250,000 and made a payment
of $750,000 in shares to Riverside. Published results for Morro Bay’s 2014 drilling program at Jesus
Maria are shown in Table 10.6, and San Rafael's 2014 results are shown in Table 10.7.
The main objective of the 2014 Jesus Maria drill program was to delineate the extent of mineralization
in the hanging wall of the Jesus Maria structure. The 2014 drill program on the Jesus Maria Silver Zone
included 21 drill holes totalling 1,937 m. The drilling results are discussed in Section 10 Drilling.
During the 2014 exploration season, Morro Bay also drilled two holes at El Capitan totalling 205.6 m, five
holes at San Rafael totalling 1,062.3 m, and one exploratory hole on a regional target totalling 232.9 m.
The drilling results are discussed in Section 10 Drilling.
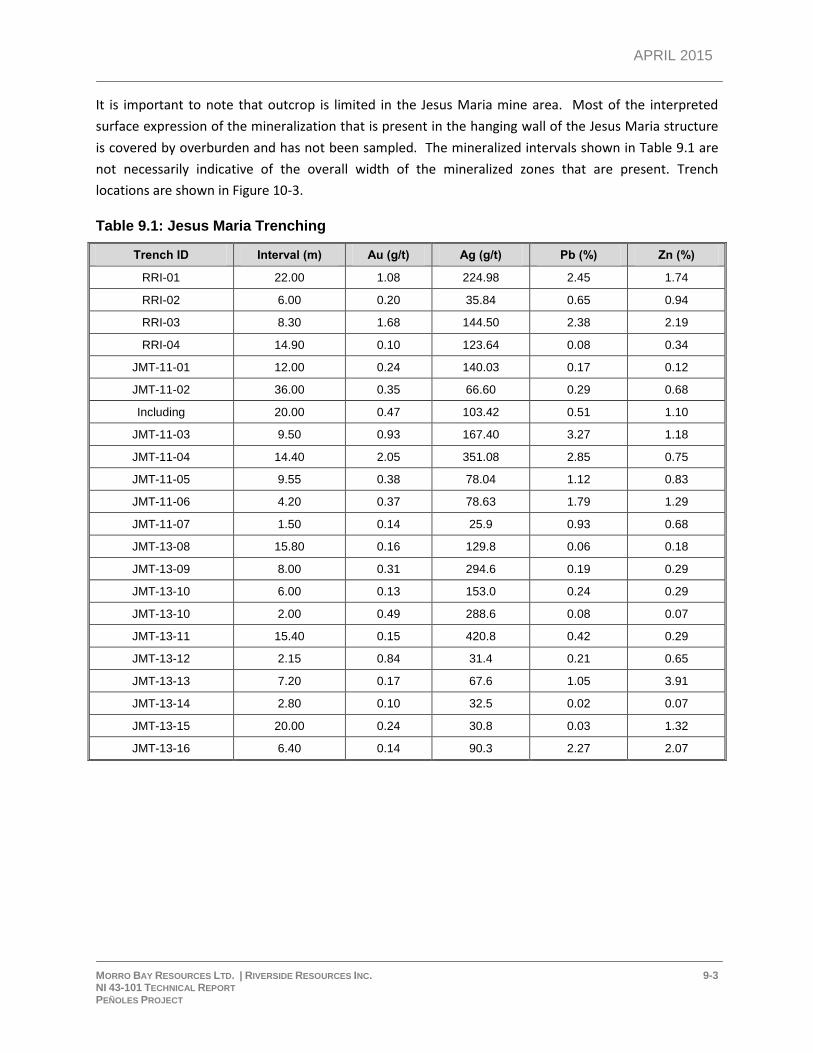
APRIL 2015
MORRO BAY RESOURCES LTD. | RIVERSIDE RESOURCES INC. 9-3 NI 43-101 TECHNICAL REPORT PEÑOLES PROJECT
It is important to note that outcrop is limited in the Jesus Maria mine area. Most of the interpreted
surface expression of the mineralization that is present in the hanging wall of the Jesus Maria structure
is covered by overburden and has not been sampled. The mineralized intervals shown in Table 9.1 are
not necessarily indicative of the overall width of the mineralized zones that are present. Trench
locations are shown in Figure 10-3.
Table 9.1: Jesus Maria Trenching
Trench ID Interval (m) Au (g/t) Ag (g/t) Pb (%) Zn (%)
RRI-01 22.00 1.08 224.98 2.45 1.74
RRI-02 6.00 0.20 35.84 0.65 0.94
RRI-03 8.30 1.68 144.50 2.38 2.19
RRI-04 14.90 0.10 123.64 0.08 0.34
JMT-11-01 12.00 0.24 140.03 0.17 0.12
JMT-11-02 36.00 0.35 66.60 0.29 0.68
Including 20.00 0.47 103.42 0.51 1.10
JMT-11-03 9.50 0.93 167.40 3.27 1.18
JMT-11-04 14.40 2.05 351.08 2.85 0.75
JMT-11-05 9.55 0.38 78.04 1.12 0.83
JMT-11-06 4.20 0.37 78.63 1.79 1.29
JMT-11-07 1.50 0.14 25.9 0.93 0.68
JMT-13-08 15.80 0.16 129.8 0.06 0.18
JMT-13-09 8.00 0.31 294.6 0.19 0.29
JMT-13-10 6.00 0.13 153.0 0.24 0.29
JMT-13-10 2.00 0.49 288.6 0.08 0.07
JMT-13-11 15.40 0.15 420.8 0.42 0.29
JMT-13-12 2.15 0.84 31.4 0.21 0.65
JMT-13-13 7.20 0.17 67.6 1.05 3.91
JMT-13-14 2.80 0.10 32.5 0.02 0.07
JMT-13-15 20.00 0.24 30.8 0.03 1.32
JMT-13-16 6.40 0.14 90.3 2.27 2.07
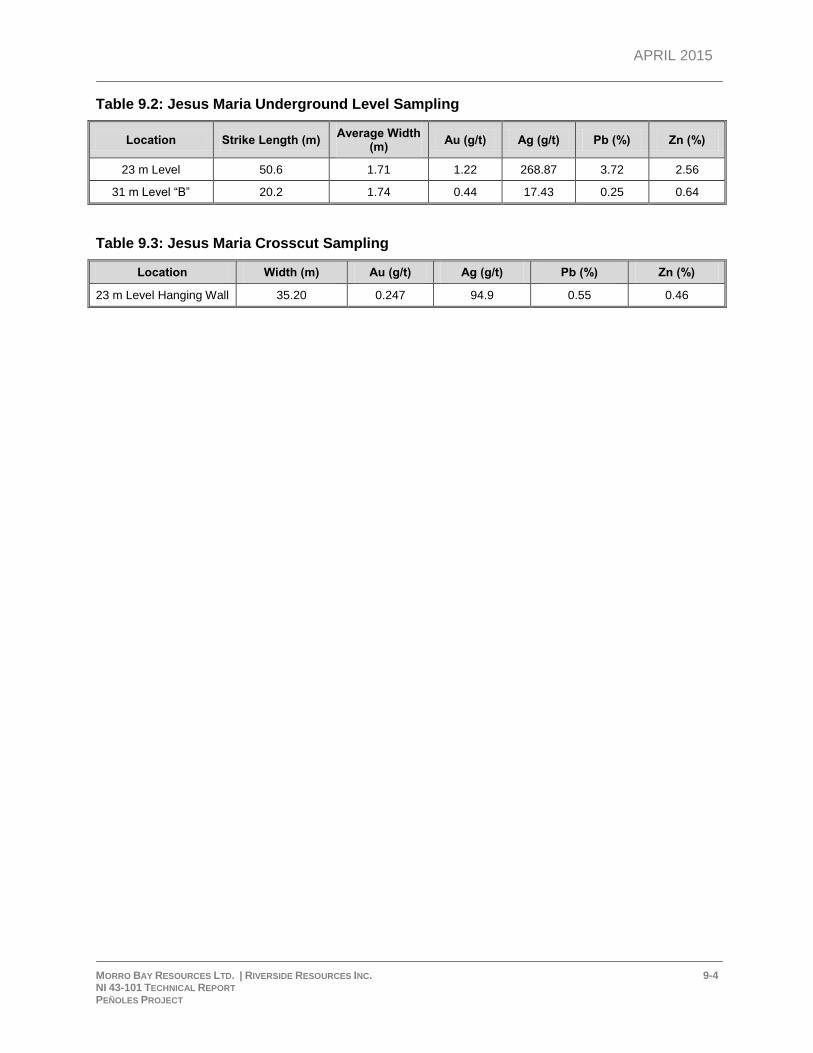
APRIL 2015
MORRO BAY RESOURCES LTD. | RIVERSIDE RESOURCES INC. 9-4 NI 43-101 TECHNICAL REPORT PEÑOLES PROJECT
Table 9.2: Jesus Maria Underground Level Sampling
Location Strike Length (m) Average Width
(m) Au (g/t) Ag (g/t) Pb (%) Zn (%)
23 m Level 50.6 1.71 1.22 268.87 3.72 2.56
31 m Level “B” 20.2 1.74 0.44 17.43 0.25 0.64
Table 9.3: Jesus Maria Crosscut Sampling
Location Width (m) Au (g/t) Ag (g/t) Pb (%) Zn (%)
23 m Level Hanging Wall 35.20 0.247 94.9 0.55 0.46
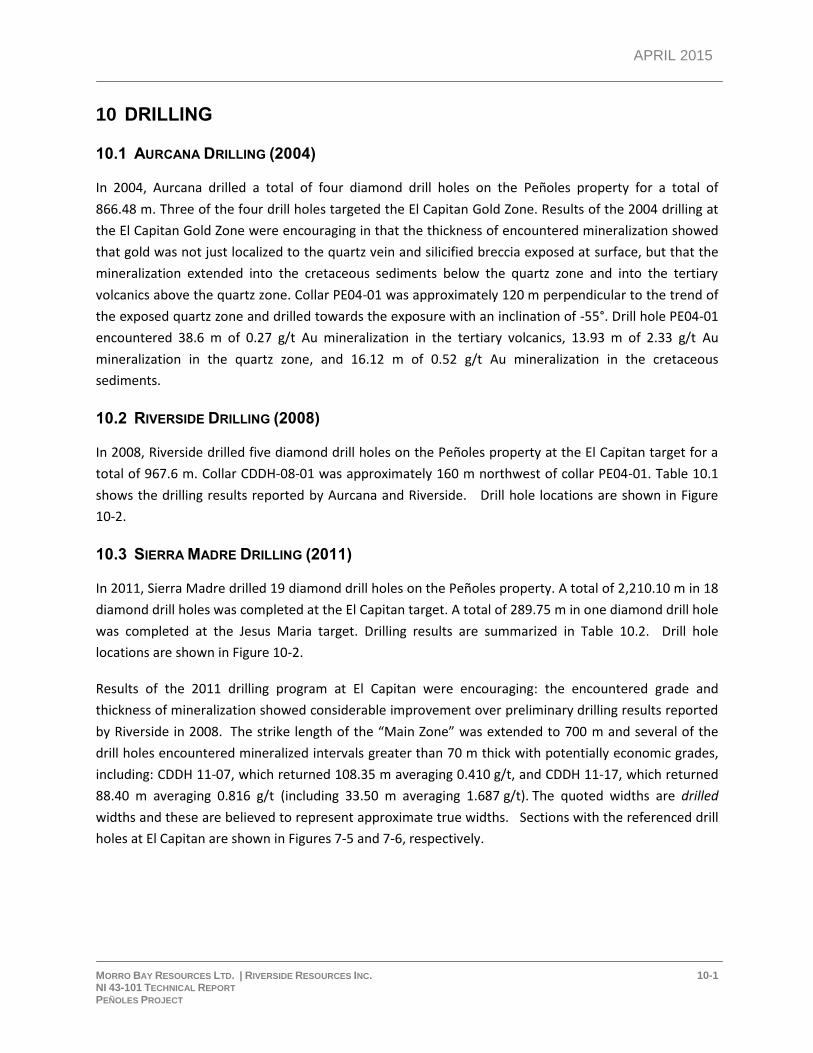
APRIL 2015
MORRO BAY RESOURCES LTD. | RIVERSIDE RESOURCES INC. 10-1 NI 43-101 TECHNICAL REPORT PEÑOLES PROJECT
10 DRILLING
10.1 AURCANA DRILLING (2004)
In 2004, Aurcana drilled a total of four diamond drill holes on the Peñoles property for a total of
866.48 m. Three of the four drill holes targeted the El Capitan Gold Zone. Results of the 2004 drilling at
the El Capitan Gold Zone were encouraging in that the thickness of encountered mineralization showed
that gold was not just localized to the quartz vein and silicified breccia exposed at surface, but that the
mineralization extended into the cretaceous sediments below the quartz zone and into the tertiary
volcanics above the quartz zone. Collar PE04-01 was approximately 120 m perpendicular to the trend of
the exposed quartz zone and drilled towards the exposure with an inclination of -55°. Drill hole PE04-01
encountered 38.6 m of 0.27 g/t Au mineralization in the tertiary volcanics, 13.93 m of 2.33 g/t Au
mineralization in the quartz zone, and 16.12 m of 0.52 g/t Au mineralization in the cretaceous
sediments.
10.2 RIVERSIDE DRILLING (2008)
In 2008, Riverside drilled five diamond drill holes on the Peñoles property at the El Capitan target for a
total of 967.6 m. Collar CDDH-08-01 was approximately 160 m northwest of collar PE04-01. Table 10.1
shows the drilling results reported by Aurcana and Riverside. Drill hole locations are shown in Figure
10-2.
10.3 SIERRA MADRE DRILLING (2011)
In 2011, Sierra Madre drilled 19 diamond drill holes on the Peñoles property. A total of 2,210.10 m in 18
diamond drill holes was completed at the El Capitan target. A total of 289.75 m in one diamond drill hole
was completed at the Jesus Maria target. Drilling results are summarized in Table 10.2. Drill hole
locations are shown in Figure 10-2.
Results of the 2011 drilling program at El Capitan were encouraging: the encountered grade and
thickness of mineralization showed considerable improvement over preliminary drilling results reported
by Riverside in 2008. The strike length of the “Main Zone” was extended to 700 m and several of the
drill holes encountered mineralized intervals greater than 70 m thick with potentially economic grades,
including: CDDH 11-07, which returned 108.35 m averaging 0.410 g/t, and CDDH 11-17, which returned
88.40 m averaging 0.816 g/t (including 33.50 m averaging 1.687 g/t). The quoted widths are drilled
widths and these are believed to represent approximate true widths. Sections with the referenced drill
holes at El Capitan are shown in Figures 7-5 and 7-6, respectively.
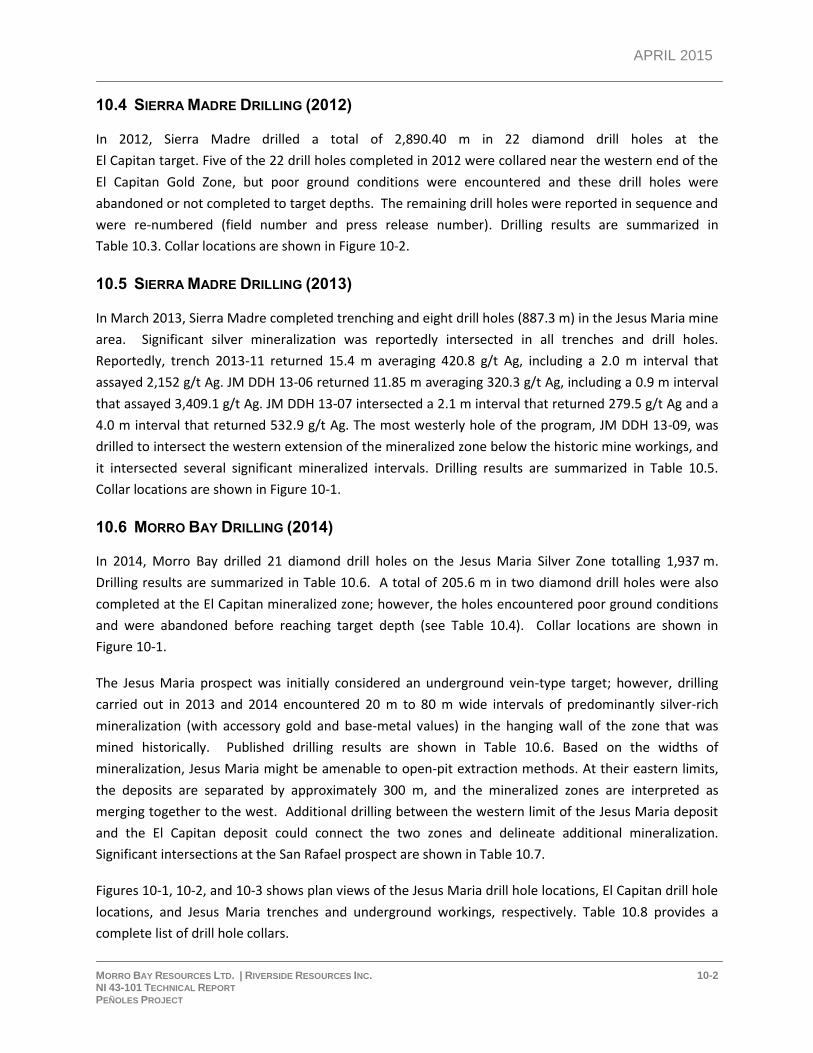
APRIL 2015
MORRO BAY RESOURCES LTD. | RIVERSIDE RESOURCES INC. 10-2 NI 43-101 TECHNICAL REPORT PEÑOLES PROJECT
10.4 SIERRA MADRE DRILLING (2012)
In 2012, Sierra Madre drilled a total of 2,890.40 m in 22 diamond drill holes at the
El Capitan target. Five of the 22 drill holes completed in 2012 were collared near the western end of the
El Capitan Gold Zone, but poor ground conditions were encountered and these drill holes were
abandoned or not completed to target depths. The remaining drill holes were reported in sequence and
were re-numbered (field number and press release number). Drilling results are summarized in
Table 10.3. Collar locations are shown in Figure 10-2.
10.5 SIERRA MADRE DRILLING (2013)
In March 2013, Sierra Madre completed trenching and eight drill holes (887.3 m) in the Jesus Maria mine
area. Significant silver mineralization was reportedly intersected in all trenches and drill holes.
Reportedly, trench 2013-11 returned 15.4 m averaging 420.8 g/t Ag, including a 2.0 m interval that
assayed 2,152 g/t Ag. JM DDH 13-06 returned 11.85 m averaging 320.3 g/t Ag, including a 0.9 m interval
that assayed 3,409.1 g/t Ag. JM DDH 13-07 intersected a 2.1 m interval that returned 279.5 g/t Ag and a
4.0 m interval that returned 532.9 g/t Ag. The most westerly hole of the program, JM DDH 13-09, was
drilled to intersect the western extension of the mineralized zone below the historic mine workings, and
it intersected several significant mineralized intervals. Drilling results are summarized in Table 10.5.
Collar locations are shown in Figure 10-1.
10.6 MORRO BAY DRILLING (2014)
In 2014, Morro Bay drilled 21 diamond drill holes on the Jesus Maria Silver Zone totalling 1,937 m.
Drilling results are summarized in Table 10.6. A total of 205.6 m in two diamond drill holes were also
completed at the El Capitan mineralized zone; however, the holes encountered poor ground conditions
and were abandoned before reaching target depth (see Table 10.4). Collar locations are shown in
Figure 10-1.
The Jesus Maria prospect was initially considered an underground vein-type target; however, drilling
carried out in 2013 and 2014 encountered 20 m to 80 m wide intervals of predominantly silver-rich
mineralization (with accessory gold and base-metal values) in the hanging wall of the zone that was
mined historically. Published drilling results are shown in Table 10.6. Based on the widths of
mineralization, Jesus Maria might be amenable to open-pit extraction methods. At their eastern limits,
the deposits are separated by approximately 300 m, and the mineralized zones are interpreted as
merging together to the west. Additional drilling between the western limit of the Jesus Maria deposit
and the El Capitan deposit could connect the two zones and delineate additional mineralization.
Significant intersections at the San Rafael prospect are shown in Table 10.7.
Figures 10-1, 10-2, and 10-3 shows plan views of the Jesus Maria drill hole locations, El Capitan drill hole
locations, and Jesus Maria trenches and underground workings, respectively. Table 10.8 provides a
complete list of drill hole collars.
APRIL 2015
MORRO BAY RESOURCES LTD. | RIVERSIDE RESOURCES INC. 10-3 NI 43-101 TECHNICAL REPORT PEÑOLES PROJECT
Figure 10-1: Jesus Maria Deposit Drill Hole Locations (plan view)
Source: Morro Bay database
APRIL 2015
MORRO BAY RESOURCES LTD. | RIVERSIDE RESOURCES INC. 10-4 NI 43-101 TECHNICAL REPORT PEÑOLES PROJECT
Figure 10-2: El Capitan Deposit Drill Hole Locations (plan view)
Source: Morro Bay database
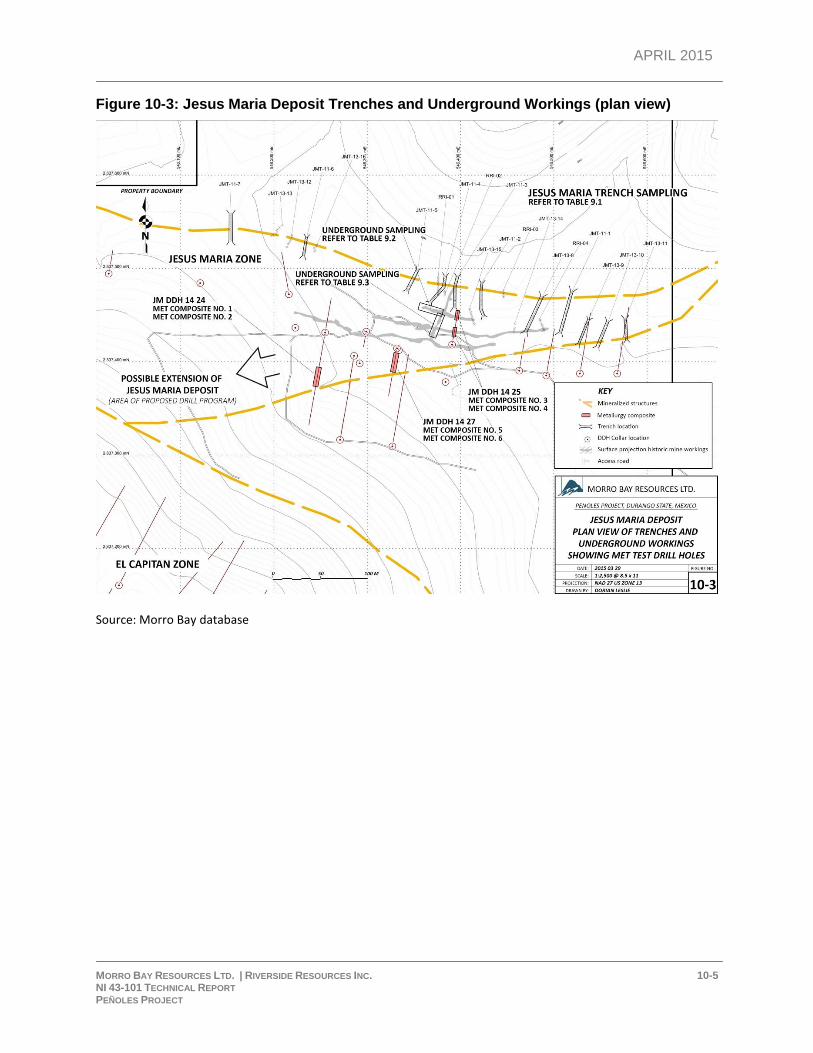
APRIL 2015
MORRO BAY RESOURCES LTD. | RIVERSIDE RESOURCES INC. 10-5 NI 43-101 TECHNICAL REPORT PEÑOLES PROJECT
Figure 10-3: Jesus Maria Deposit Trenches and Underground Workings (plan view)
Source: Morro Bay database
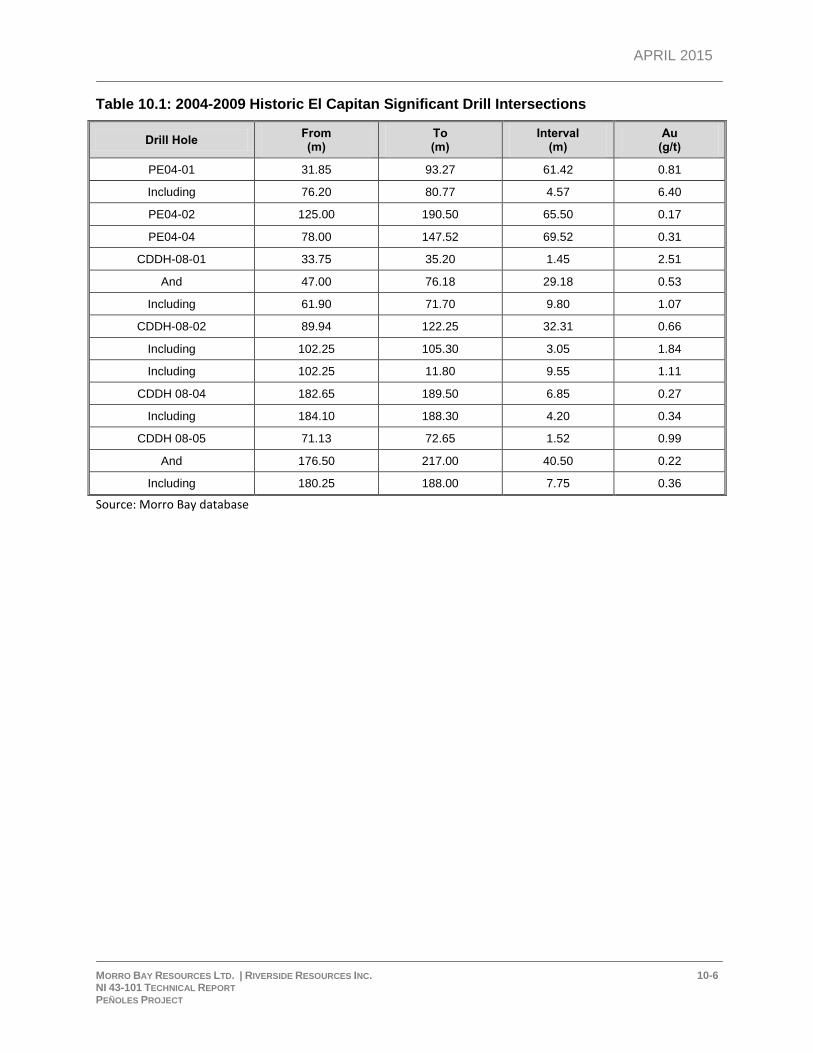
APRIL 2015
MORRO BAY RESOURCES LTD. | RIVERSIDE RESOURCES INC. 10-6 NI 43-101 TECHNICAL REPORT PEÑOLES PROJECT
Table 10.1: 2004-2009 Historic El Capitan Significant Drill Intersections
Drill Hole From (m)
To (m)
Interval (m)
Au (g/t)
PE04-01 31.85 93.27 61.42 0.81
Including 76.20 80.77 4.57 6.40
PE04-02 125.00 190.50 65.50 0.17
PE04-04 78.00 147.52 69.52 0.31
CDDH-08-01 33.75 35.20 1.45 2.51
And 47.00 76.18 29.18 0.53
Including 61.90 71.70 9.80 1.07
CDDH-08-02 89.94 122.25 32.31 0.66
Including 102.25 105.30 3.05 1.84
Including 102.25 11.80 9.55 1.11
CDDH 08-04 182.65 189.50 6.85 0.27
Including 184.10 188.30 4.20 0.34
CDDH 08-05 71.13 72.65 1.52 0.99
And 176.50 217.00 40.50 0.22
Including 180.25 188.00 7.75 0.36
Source: Morro Bay database
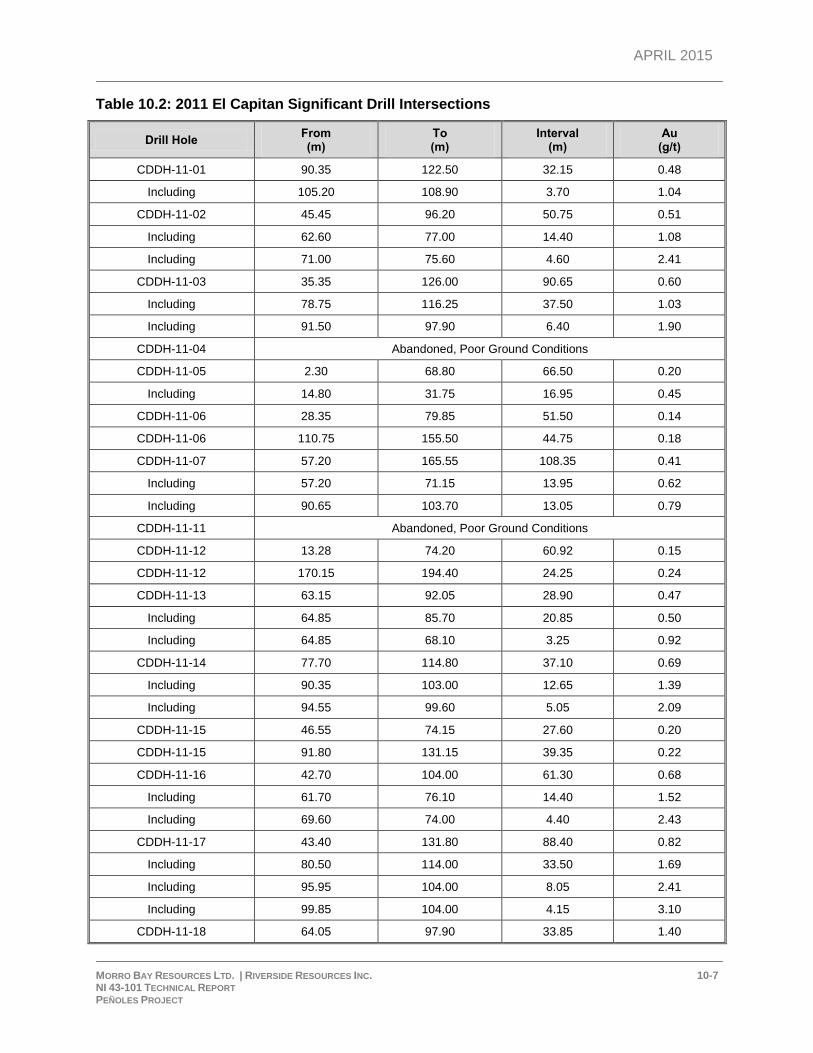
APRIL 2015
MORRO BAY RESOURCES LTD. | RIVERSIDE RESOURCES INC. 10-7 NI 43-101 TECHNICAL REPORT PEÑOLES PROJECT
Table 10.2: 2011 El Capitan Significant Drill Intersections
Drill Hole From (m)
To (m)
Interval (m)
Au (g/t)
CDDH-11-01 90.35 122.50 32.15 0.48
Including 105.20 108.90 3.70 1.04
CDDH-11-02 45.45 96.20 50.75 0.51
Including 62.60 77.00 14.40 1.08
Including 71.00 75.60 4.60 2.41
CDDH-11-03 35.35 126.00 90.65 0.60
Including 78.75 116.25 37.50 1.03
Including 91.50 97.90 6.40 1.90
CDDH-11-04 Abandoned, Poor Ground Conditions
CDDH-11-05 2.30 68.80 66.50 0.20
Including 14.80 31.75 16.95 0.45
CDDH-11-06 28.35 79.85 51.50 0.14
CDDH-11-06 110.75 155.50 44.75 0.18
CDDH-11-07 57.20 165.55 108.35 0.41
Including 57.20 71.15 13.95 0.62
Including 90.65 103.70 13.05 0.79
CDDH-11-11 Abandoned, Poor Ground Conditions
CDDH-11-12 13.28 74.20 60.92 0.15
CDDH-11-12 170.15 194.40 24.25 0.24
CDDH-11-13 63.15 92.05 28.90 0.47
Including 64.85 85.70 20.85 0.50
Including 64.85 68.10 3.25 0.92
CDDH-11-14 77.70 114.80 37.10 0.69
Including 90.35 103.00 12.65 1.39
Including 94.55 99.60 5.05 2.09
CDDH-11-15 46.55 74.15 27.60 0.20
CDDH-11-15 91.80 131.15 39.35 0.22
CDDH-11-16 42.70 104.00 61.30 0.68
Including 61.70 76.10 14.40 1.52
Including 69.60 74.00 4.40 2.43
CDDH-11-17 43.40 131.80 88.40 0.82
Including 80.50 114.00 33.50 1.69
Including 95.95 104.00 8.05 2.41
Including 99.85 104.00 4.15 3.10
CDDH-11-18 64.05 97.90 33.85 1.40
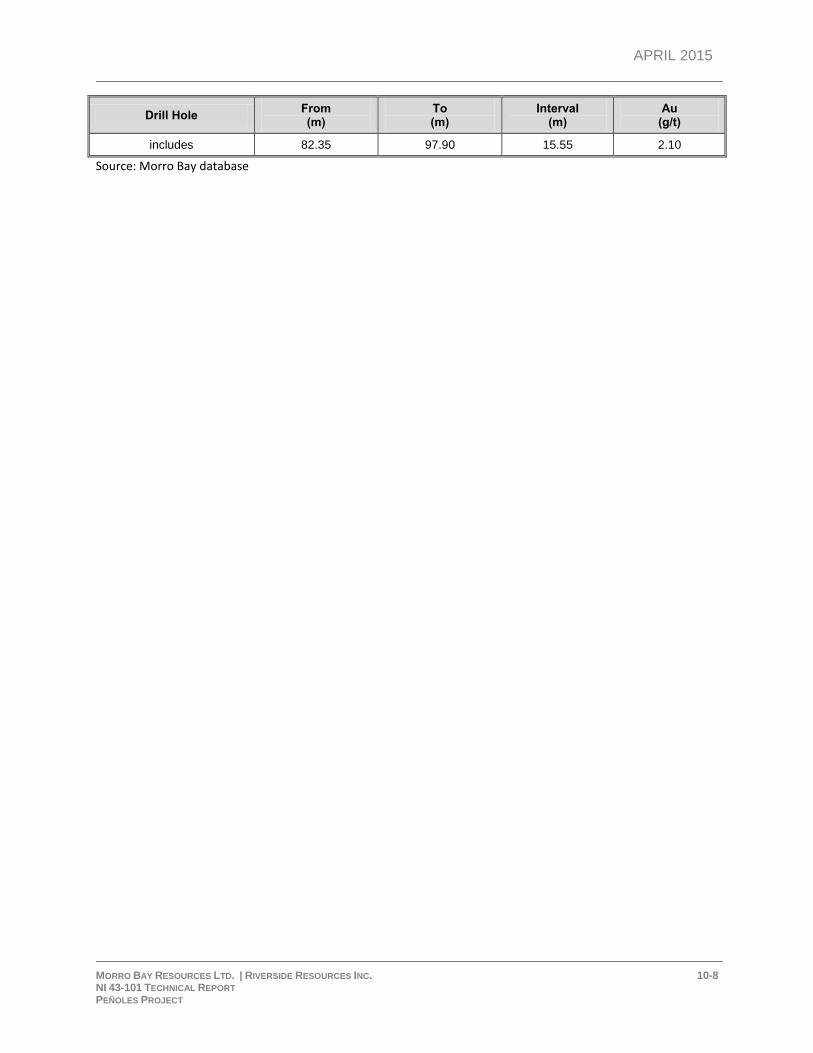
APRIL 2015
MORRO BAY RESOURCES LTD. | RIVERSIDE RESOURCES INC. 10-8 NI 43-101 TECHNICAL REPORT PEÑOLES PROJECT
Drill Hole From (m)
To (m)
Interval (m)
Au (g/t)
includes 82.35 97.90 15.55 2.10
Source: Morro Bay database
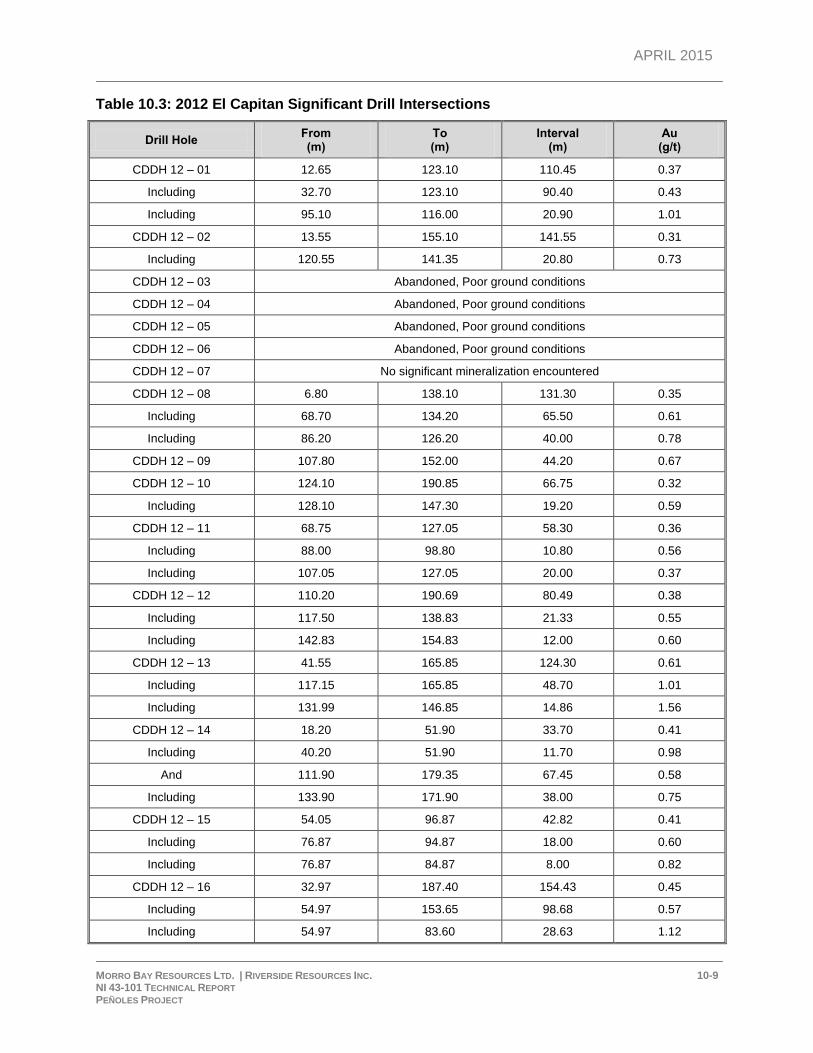
APRIL 2015
MORRO BAY RESOURCES LTD. | RIVERSIDE RESOURCES INC. 10-9 NI 43-101 TECHNICAL REPORT PEÑOLES PROJECT
Table 10.3: 2012 El Capitan Significant Drill Intersections
Drill Hole From (m)
To (m)
Interval (m)
Au (g/t)
CDDH 12 – 01 12.65 123.10 110.45 0.37
Including 32.70 123.10 90.40 0.43
Including 95.10 116.00 20.90 1.01
CDDH 12 – 02 13.55 155.10 141.55 0.31
Including 120.55 141.35 20.80 0.73
CDDH 12 – 03 Abandoned, Poor ground conditions
CDDH 12 – 04 Abandoned, Poor ground conditions
CDDH 12 – 05 Abandoned, Poor ground conditions
CDDH 12 – 06 Abandoned, Poor ground conditions
CDDH 12 – 07 No significant mineralization encountered
CDDH 12 – 08 6.80 138.10 131.30 0.35
Including 68.70 134.20 65.50 0.61
Including 86.20 126.20 40.00 0.78
CDDH 12 – 09 107.80 152.00 44.20 0.67
CDDH 12 – 10 124.10 190.85 66.75 0.32
Including 128.10 147.30 19.20 0.59
CDDH 12 – 11 68.75 127.05 58.30 0.36
Including 88.00 98.80 10.80 0.56
Including 107.05 127.05 20.00 0.37
CDDH 12 – 12 110.20 190.69 80.49 0.38
Including 117.50 138.83 21.33 0.55
Including 142.83 154.83 12.00 0.60
CDDH 12 – 13 41.55 165.85 124.30 0.61
Including 117.15 165.85 48.70 1.01
Including 131.99 146.85 14.86 1.56
CDDH 12 – 14 18.20 51.90 33.70 0.41
Including 40.20 51.90 11.70 0.98
And 111.90 179.35 67.45 0.58
Including 133.90 171.90 38.00 0.75
CDDH 12 – 15 54.05 96.87 42.82 0.41
Including 76.87 94.87 18.00 0.60
Including 76.87 84.87 8.00 0.82
CDDH 12 – 16 32.97 187.40 154.43 0.45
Including 54.97 153.65 98.68 0.57
Including 54.97 83.60 28.63 1.12
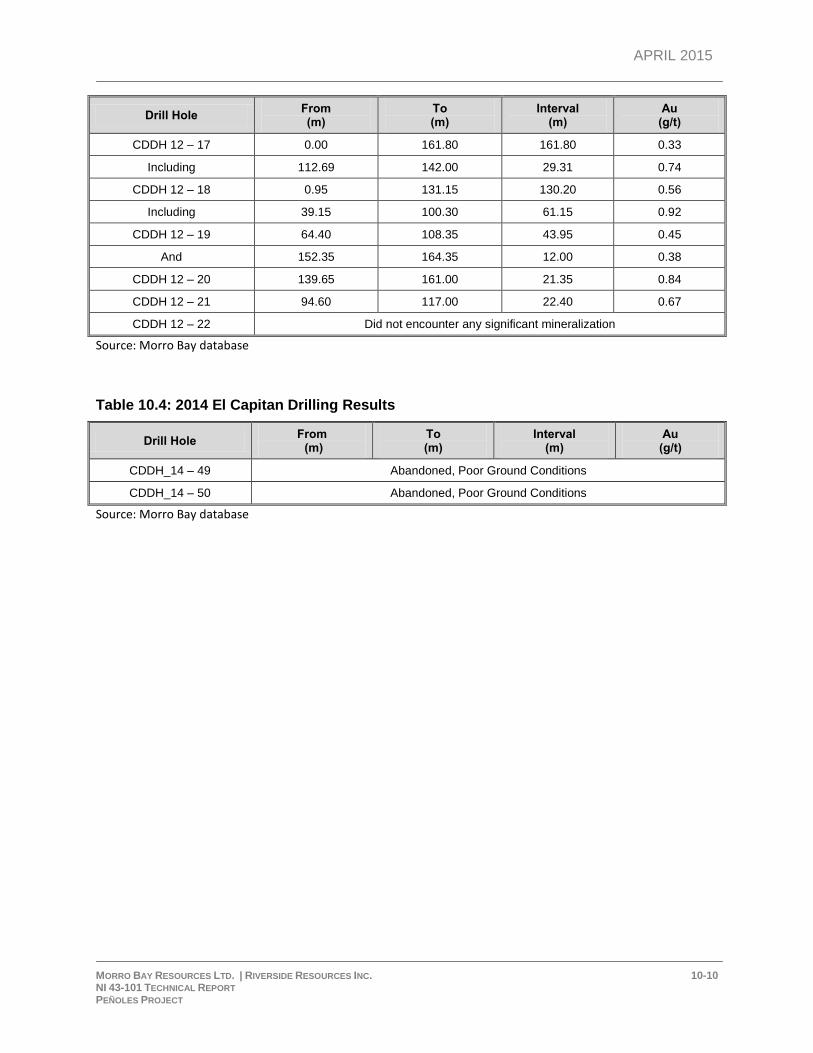
APRIL 2015
MORRO BAY RESOURCES LTD. | RIVERSIDE RESOURCES INC. 10-10 NI 43-101 TECHNICAL REPORT PEÑOLES PROJECT
Drill Hole From (m)
To (m)
Interval (m)
Au (g/t)
CDDH 12 – 17 0.00 161.80 161.80 0.33
Including 112.69 142.00 29.31 0.74
CDDH 12 – 18 0.95 131.15 130.20 0.56
Including 39.15 100.30 61.15 0.92
CDDH 12 – 19 64.40 108.35 43.95 0.45
And 152.35 164.35 12.00 0.38
CDDH 12 – 20 139.65 161.00 21.35 0.84
CDDH 12 – 21 94.60 117.00 22.40 0.67
CDDH 12 – 22 Did not encounter any significant mineralization
Source: Morro Bay database
Table 10.4: 2014 El Capitan Drilling Results
Drill Hole From (m)
To (m)
Interval (m)
Au (g/t)
CDDH_14 – 49 Abandoned, Poor Ground Conditions
CDDH_14 – 50 Abandoned, Poor Ground Conditions
Source: Morro Bay database
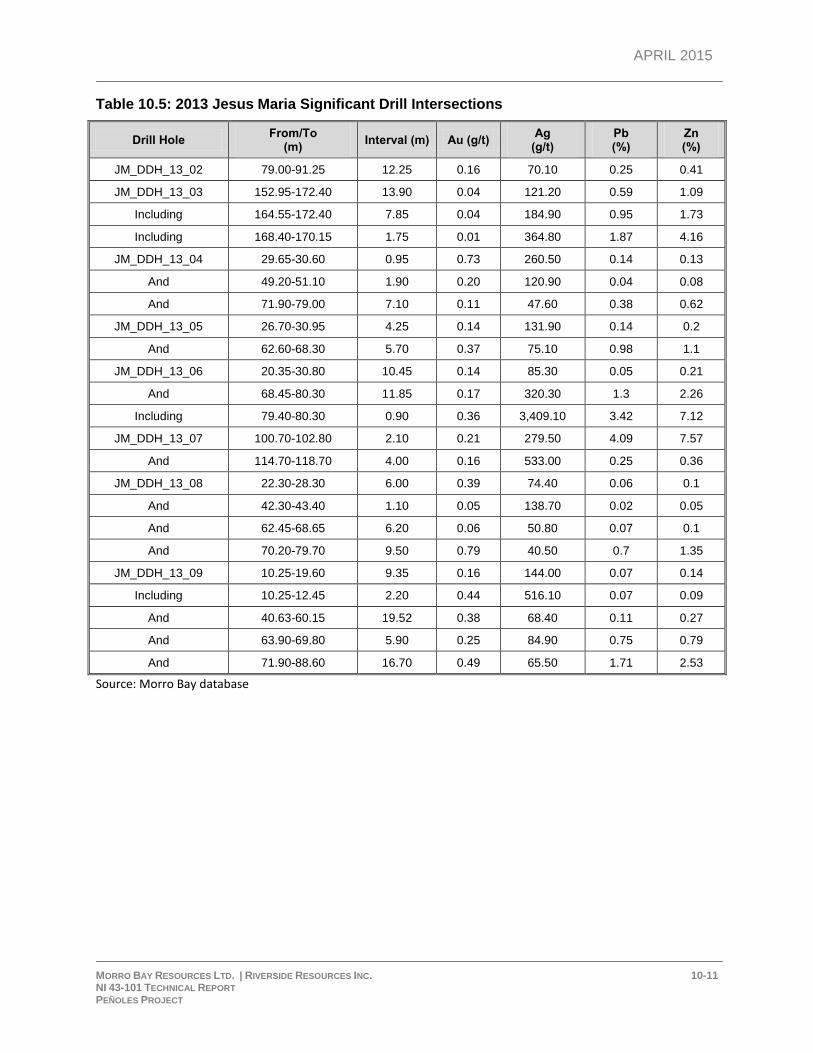
APRIL 2015
MORRO BAY RESOURCES LTD. | RIVERSIDE RESOURCES INC. 10-11 NI 43-101 TECHNICAL REPORT PEÑOLES PROJECT
Table 10.5: 2013 Jesus Maria Significant Drill Intersections
Drill Hole From/To
(m) Interval (m) Au (g/t)
Ag (g/t)
Pb (%)
Zn (%)
JM_DDH_13_02 79.00-91.25 12.25 0.16 70.10 0.25 0.41
JM_DDH_13_03 152.95-172.40 13.90 0.04 121.20 0.59 1.09
Including 164.55-172.40 7.85 0.04 184.90 0.95 1.73
Including 168.40-170.15 1.75 0.01 364.80 1.87 4.16
JM_DDH_13_04 29.65-30.60 0.95 0.73 260.50 0.14 0.13
And 49.20-51.10 1.90 0.20 120.90 0.04 0.08
And 71.90-79.00 7.10 0.11 47.60 0.38 0.62
JM_DDH_13_05 26.70-30.95 4.25 0.14 131.90 0.14 0.2
And 62.60-68.30 5.70 0.37 75.10 0.98 1.1
JM_DDH_13_06 20.35-30.80 10.45 0.14 85.30 0.05 0.21
And 68.45-80.30 11.85 0.17 320.30 1.3 2.26
Including 79.40-80.30 0.90 0.36 3,409.10 3.42 7.12
JM_DDH_13_07 100.70-102.80 2.10 0.21 279.50 4.09 7.57
And 114.70-118.70 4.00 0.16 533.00 0.25 0.36
JM_DDH_13_08 22.30-28.30 6.00 0.39 74.40 0.06 0.1
And 42.30-43.40 1.10 0.05 138.70 0.02 0.05
And 62.45-68.65 6.20 0.06 50.80 0.07 0.1
And 70.20-79.70 9.50 0.79 40.50 0.7 1.35
JM_DDH_13_09 10.25-19.60 9.35 0.16 144.00 0.07 0.14
Including 10.25-12.45 2.20 0.44 516.10 0.07 0.09
And 40.63-60.15 19.52 0.38 68.40 0.11 0.27
And 63.90-69.80 5.90 0.25 84.90 0.75 0.79
And 71.90-88.60 16.70 0.49 65.50 1.71 2.53
Source: Morro Bay database
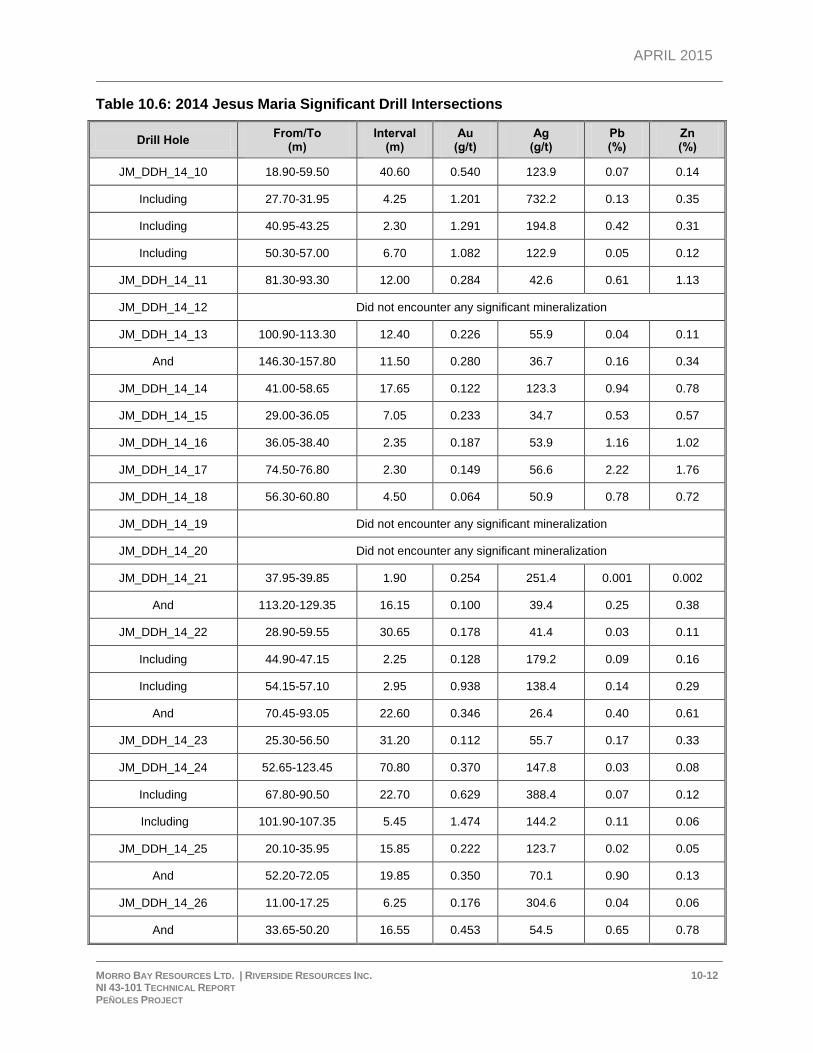
APRIL 2015
MORRO BAY RESOURCES LTD. | RIVERSIDE RESOURCES INC. 10-12 NI 43-101 TECHNICAL REPORT PEÑOLES PROJECT
Table 10.6: 2014 Jesus Maria Significant Drill Intersections
Drill Hole From/To
(m) Interval
(m) Au
(g/t) Ag
(g/t) Pb (%)
Zn (%)
JM_DDH_14_10 18.90-59.50 40.60 0.540 123.9 0.07 0.14
Including 27.70-31.95 4.25 1.201 732.2 0.13 0.35
Including 40.95-43.25 2.30 1.291 194.8 0.42 0.31
Including 50.30-57.00 6.70 1.082 122.9 0.05 0.12
JM_DDH_14_11 81.30-93.30 12.00 0.284 42.6 0.61 1.13
JM_DDH_14_12 Did not encounter any significant mineralization
JM_DDH_14_13 100.90-113.30 12.40 0.226 55.9 0.04 0.11
And 146.30-157.80 11.50 0.280 36.7 0.16 0.34
JM_DDH_14_14 41.00-58.65 17.65 0.122 123.3 0.94 0.78
JM_DDH_14_15 29.00-36.05 7.05 0.233 34.7 0.53 0.57
JM_DDH_14_16 36.05-38.40 2.35 0.187 53.9 1.16 1.02
JM_DDH_14_17 74.50-76.80 2.30 0.149 56.6 2.22 1.76
JM_DDH_14_18 56.30-60.80 4.50 0.064 50.9 0.78 0.72
JM_DDH_14_19 Did not encounter any significant mineralization
JM_DDH_14_20 Did not encounter any significant mineralization
JM_DDH_14_21 37.95-39.85 1.90 0.254 251.4 0.001 0.002
And 113.20-129.35 16.15 0.100 39.4 0.25 0.38
JM_DDH_14_22 28.90-59.55 30.65 0.178 41.4 0.03 0.11
Including 44.90-47.15 2.25 0.128 179.2 0.09 0.16
Including 54.15-57.10 2.95 0.938 138.4 0.14 0.29
And 70.45-93.05 22.60 0.346 26.4 0.40 0.61
JM_DDH_14_23 25.30-56.50 31.20 0.112 55.7 0.17 0.33
JM_DDH_14_24 52.65-123.45 70.80 0.370 147.8 0.03 0.08
Including 67.80-90.50 22.70 0.629 388.4 0.07 0.12
Including 101.90-107.35 5.45 1.474 144.2 0.11 0.06
JM_DDH_14_25 20.10-35.95 15.85 0.222 123.7 0.02 0.05
And 52.20-72.05 19.85 0.350 70.1 0.90 0.13
JM_DDH_14_26 11.00-17.25 6.25 0.176 304.6 0.04 0.06
And 33.65-50.20 16.55 0.453 54.5 0.65 0.78
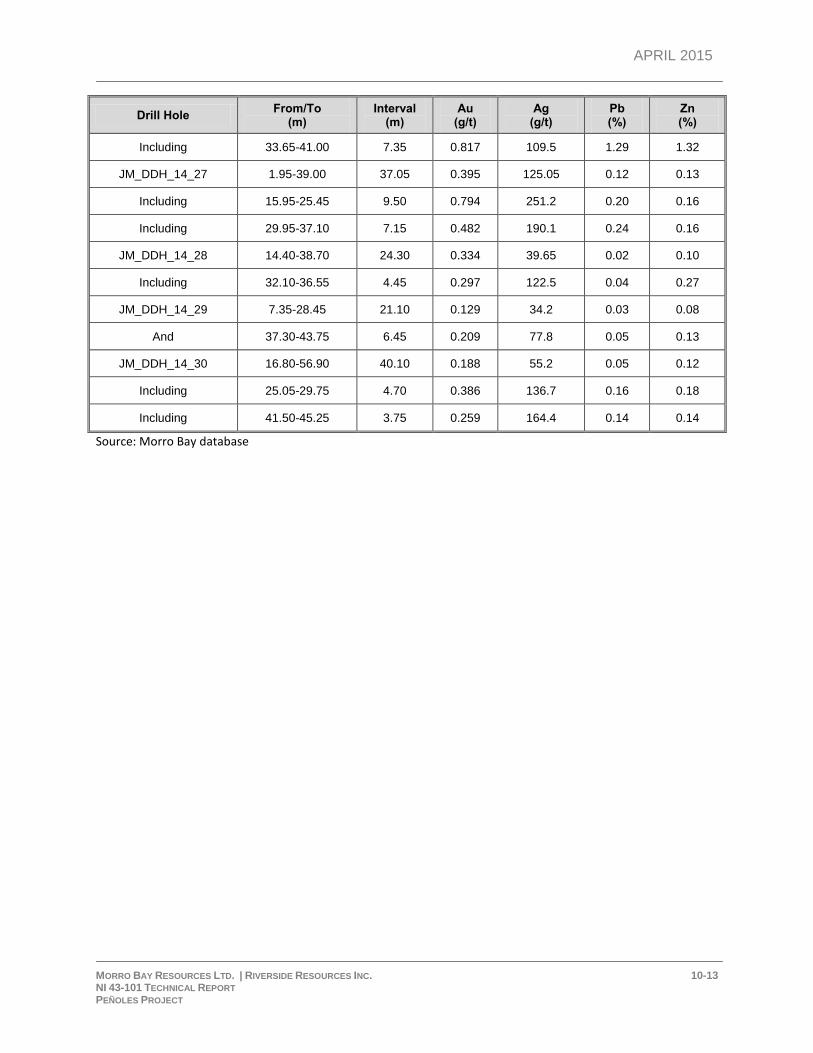
APRIL 2015
MORRO BAY RESOURCES LTD. | RIVERSIDE RESOURCES INC. 10-13 NI 43-101 TECHNICAL REPORT PEÑOLES PROJECT
Drill Hole From/To
(m) Interval
(m) Au
(g/t) Ag
(g/t) Pb (%)
Zn (%)
Including 33.65-41.00 7.35 0.817 109.5 1.29 1.32
JM_DDH_14_27 1.95-39.00 37.05 0.395 125.05 0.12 0.13
Including 15.95-25.45 9.50 0.794 251.2 0.20 0.16
Including 29.95-37.10 7.15 0.482 190.1 0.24 0.16
JM_DDH_14_28 14.40-38.70 24.30 0.334 39.65 0.02 0.10
Including 32.10-36.55 4.45 0.297 122.5 0.04 0.27
JM_DDH_14_29 7.35-28.45 21.10 0.129 34.2 0.03 0.08
And 37.30-43.75 6.45 0.209 77.8 0.05 0.13
JM_DDH_14_30 16.80-56.90 40.10 0.188 55.2 0.05 0.12
Including 25.05-29.75 4.70 0.386 136.7 0.16 0.18
Including 41.50-45.25 3.75 0.259 164.4 0.14 0.14
Source: Morro Bay database
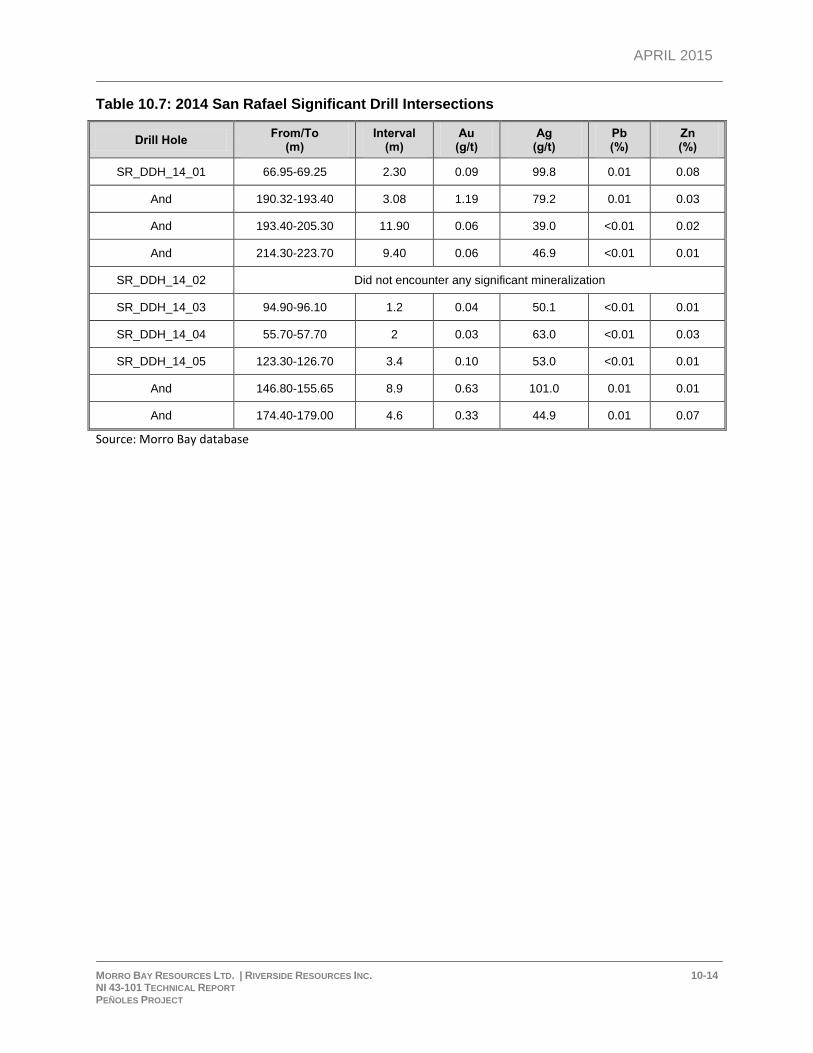
APRIL 2015
MORRO BAY RESOURCES LTD. | RIVERSIDE RESOURCES INC. 10-14 NI 43-101 TECHNICAL REPORT PEÑOLES PROJECT
Table 10.7: 2014 San Rafael Significant Drill Intersections
Drill Hole From/To
(m) Interval
(m) Au
(g/t) Ag
(g/t) Pb (%)
Zn (%)
SR_DDH_14_01 66.95-69.25 2.30 0.09 99.8 0.01 0.08
And 190.32-193.40 3.08 1.19 79.2 0.01 0.03
And 193.40-205.30 11.90 0.06 39.0 <0.01 0.02
And 214.30-223.70 9.40 0.06 46.9 <0.01 0.01
SR_DDH_14_02 Did not encounter any significant mineralization
SR_DDH_14_03 94.90-96.10 1.2 0.04 50.1 <0.01 0.01
SR_DDH_14_04 55.70-57.70 2 0.03 63.0 <0.01 0.03
SR_DDH_14_05 123.30-126.70 3.4 0.10 53.0 <0.01 0.01
And 146.80-155.65 8.9 0.63 101.0 0.01 0.01
And 174.40-179.00 4.6 0.33 44.9 0.01 0.07
Source: Morro Bay database
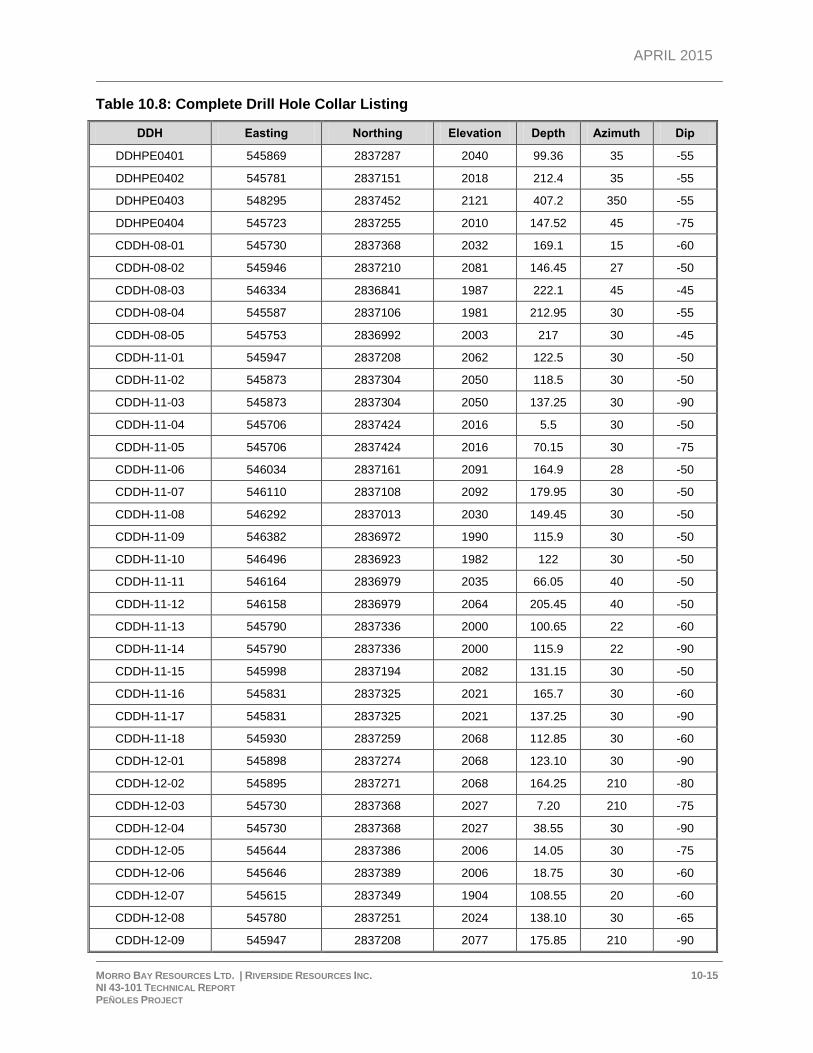
APRIL 2015
MORRO BAY RESOURCES LTD. | RIVERSIDE RESOURCES INC. 10-15 NI 43-101 TECHNICAL REPORT PEÑOLES PROJECT
Table 10.8: Complete Drill Hole Collar Listing
DDH Easting Northing Elevation Depth Azimuth Dip
DDHPE0401 545869 2837287 2040 99.36 35 -55
DDHPE0402 545781 2837151 2018 212.4 35 -55
DDHPE0403 548295 2837452 2121 407.2 350 -55
DDHPE0404 545723 2837255 2010 147.52 45 -75
CDDH-08-01 545730 2837368 2032 169.1 15 -60
CDDH-08-02 545946 2837210 2081 146.45 27 -50
CDDH-08-03 546334 2836841 1987 222.1 45 -45
CDDH-08-04 545587 2837106 1981 212.95 30 -55
CDDH-08-05 545753 2836992 2003 217 30 -45
CDDH-11-01 545947 2837208 2062 122.5 30 -50
CDDH-11-02 545873 2837304 2050 118.5 30 -50
CDDH-11-03 545873 2837304 2050 137.25 30 -90
CDDH-11-04 545706 2837424 2016 5.5 30 -50
CDDH-11-05 545706 2837424 2016 70.15 30 -75
CDDH-11-06 546034 2837161 2091 164.9 28 -50
CDDH-11-07 546110 2837108 2092 179.95 30 -50
CDDH-11-08 546292 2837013 2030 149.45 30 -50
CDDH-11-09 546382 2836972 1990 115.9 30 -50
CDDH-11-10 546496 2836923 1982 122 30 -50
CDDH-11-11 546164 2836979 2035 66.05 40 -50
CDDH-11-12 546158 2836979 2064 205.45 40 -50
CDDH-11-13 545790 2837336 2000 100.65 22 -60
CDDH-11-14 545790 2837336 2000 115.9 22 -90
CDDH-11-15 545998 2837194 2082 131.15 30 -50
CDDH-11-16 545831 2837325 2021 165.7 30 -60
CDDH-11-17 545831 2837325 2021 137.25 30 -90
CDDH-11-18 545930 2837259 2068 112.85 30 -60
CDDH-12-01 545898 2837274 2068 123.10 30 -90
CDDH-12-02 545895 2837271 2068 164.25 210 -80
CDDH-12-03 545730 2837368 2027 7.20 210 -75
CDDH-12-04 545730 2837368 2027 38.55 30 -90
CDDH-12-05 545644 2837386 2006 14.05 30 -75
CDDH-12-06 545646 2837389 2006 18.75 30 -60
CDDH-12-07 545615 2837349 1904 108.55 20 -60
CDDH-12-08 545780 2837251 2024 138.10 30 -65
CDDH-12-09 545947 2837208 2077 175.85 210 -90
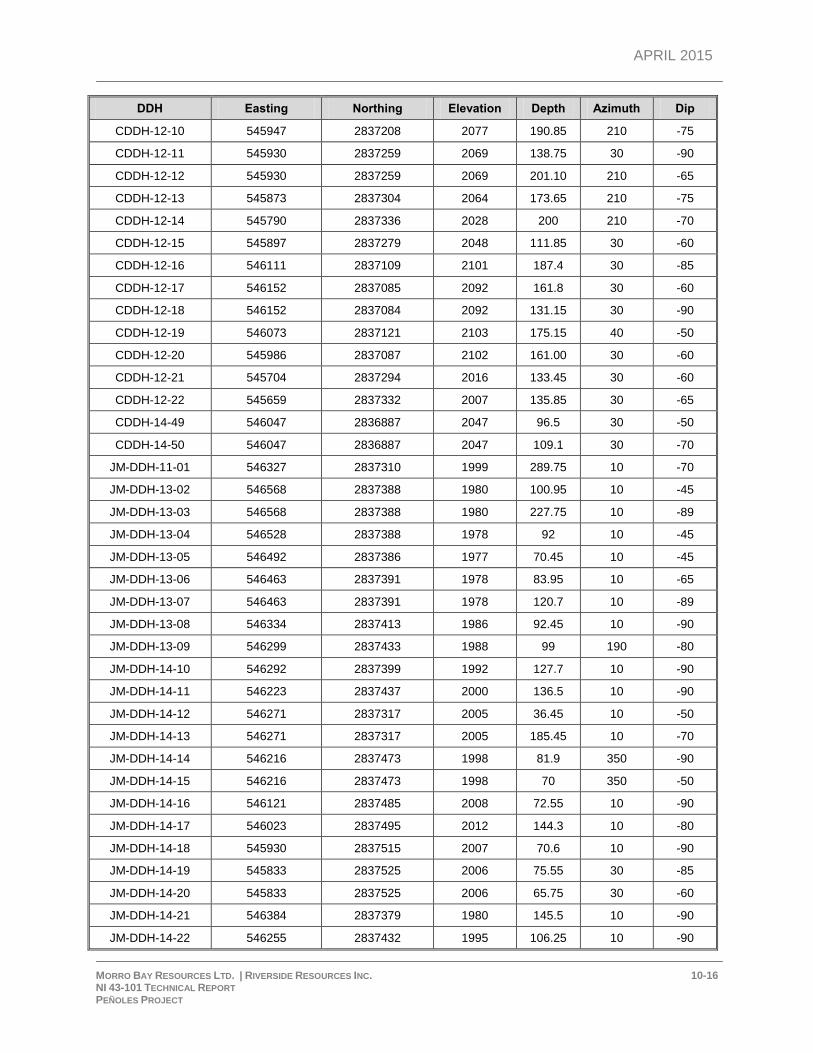
APRIL 2015
MORRO BAY RESOURCES LTD. | RIVERSIDE RESOURCES INC. 10-16 NI 43-101 TECHNICAL REPORT PEÑOLES PROJECT
DDH Easting Northing Elevation Depth Azimuth Dip
CDDH-12-10 545947 2837208 2077 190.85 210 -75
CDDH-12-11 545930 2837259 2069 138.75 30 -90
CDDH-12-12 545930 2837259 2069 201.10 210 -65
CDDH-12-13 545873 2837304 2064 173.65 210 -75
CDDH-12-14 545790 2837336 2028 200 210 -70
CDDH-12-15 545897 2837279 2048 111.85 30 -60
CDDH-12-16 546111 2837109 2101 187.4 30 -85
CDDH-12-17 546152 2837085 2092 161.8 30 -60
CDDH-12-18 546152 2837084 2092 131.15 30 -90
CDDH-12-19 546073 2837121 2103 175.15 40 -50
CDDH-12-20 545986 2837087 2102 161.00 30 -60
CDDH-12-21 545704 2837294 2016 133.45 30 -60
CDDH-12-22 545659 2837332 2007 135.85 30 -65
CDDH-14-49 546047 2836887 2047 96.5 30 -50
CDDH-14-50 546047 2836887 2047 109.1 30 -70
JM-DDH-11-01 546327 2837310 1999 289.75 10 -70
JM-DDH-13-02 546568 2837388 1980 100.95 10 -45
JM-DDH-13-03 546568 2837388 1980 227.75 10 -89
JM-DDH-13-04 546528 2837388 1978 92 10 -45
JM-DDH-13-05 546492 2837386 1977 70.45 10 -45
JM-DDH-13-06 546463 2837391 1978 83.95 10 -65
JM-DDH-13-07 546463 2837391 1978 120.7 10 -89
JM-DDH-13-08 546334 2837413 1986 92.45 10 -90
JM-DDH-13-09 546299 2837433 1988 99 190 -80
JM-DDH-14-10 546292 2837399 1992 127.7 10 -90
JM-DDH-14-11 546223 2837437 2000 136.5 10 -90
JM-DDH-14-12 546271 2837317 2005 36.45 10 -50
JM-DDH-14-13 546271 2837317 2005 185.45 10 -70
JM-DDH-14-14 546216 2837473 1998 81.9 350 -90
JM-DDH-14-15 546216 2837473 1998 70 350 -50
JM-DDH-14-16 546121 2837485 2008 72.55 10 -90
JM-DDH-14-17 546023 2837495 2012 144.3 10 -80
JM-DDH-14-18 545930 2837515 2007 70.6 10 -90
JM-DDH-14-19 545833 2837525 2006 75.55 30 -85
JM-DDH-14-20 545833 2837525 2006 65.75 30 -60
JM-DDH-14-21 546384 2837379 1980 145.5 10 -90
JM-DDH-14-22 546255 2837432 1995 106.25 10 -90
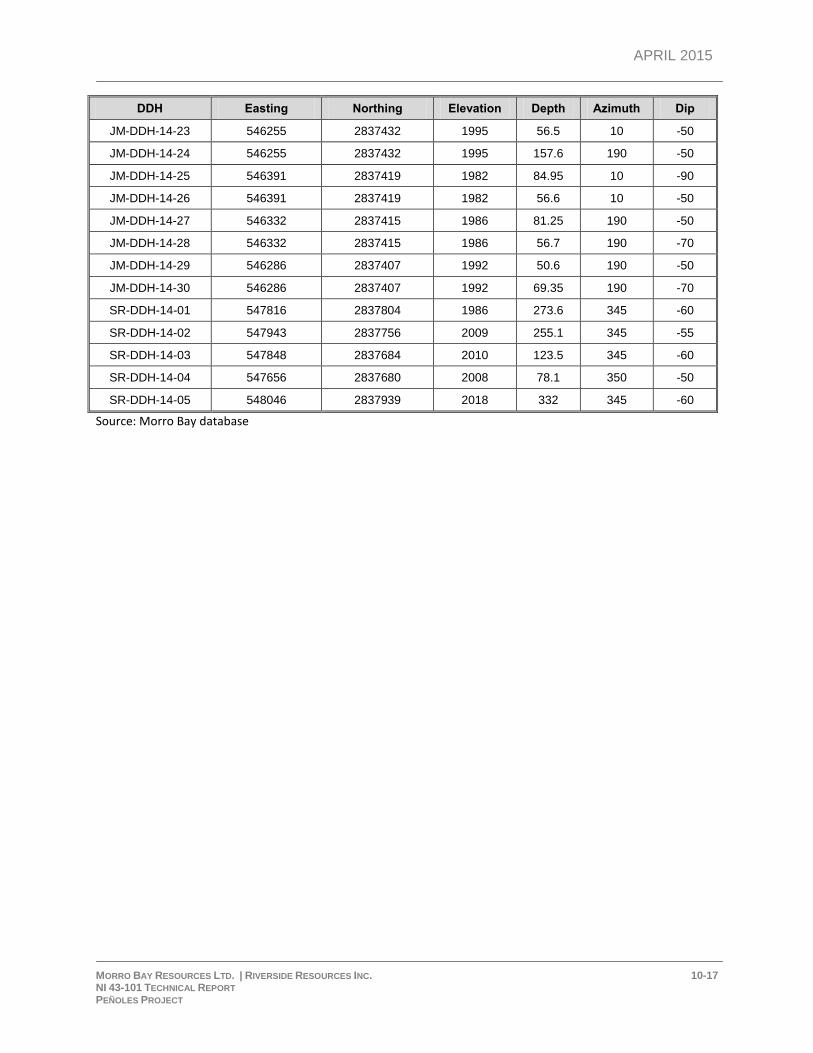
APRIL 2015
MORRO BAY RESOURCES LTD. | RIVERSIDE RESOURCES INC. 10-17 NI 43-101 TECHNICAL REPORT PEÑOLES PROJECT
DDH Easting Northing Elevation Depth Azimuth Dip
JM-DDH-14-23 546255 2837432 1995 56.5 10 -50
JM-DDH-14-24 546255 2837432 1995 157.6 190 -50
JM-DDH-14-25 546391 2837419 1982 84.95 10 -90
JM-DDH-14-26 546391 2837419 1982 56.6 10 -50
JM-DDH-14-27 546332 2837415 1986 81.25 190 -50
JM-DDH-14-28 546332 2837415 1986 56.7 190 -70
JM-DDH-14-29 546286 2837407 1992 50.6 190 -50
JM-DDH-14-30 546286 2837407 1992 69.35 190 -70
SR-DDH-14-01 547816 2837804 1986 273.6 345 -60
SR-DDH-14-02 547943 2837756 2009 255.1 345 -55
SR-DDH-14-03 547848 2837684 2010 123.5 345 -60
SR-DDH-14-04 547656 2837680 2008 78.1 350 -50
SR-DDH-14-05 548046 2837939 2018 332 345 -60
Source: Morro Bay database
APRIL 2015
MORRO BAY RESOURCES LTD. | RIVERSIDE RESOURCES INC. 11-1 NI 43-101 TECHNICAL REPORT PEÑOLES PROJECT
11 SAMPLE PREPARATION, ANALYSES AND SECURITY
A total of 2,929 drill core samples were submitted for analysis by Sierra Madre during the 2011, 2012,
and 2013 field programs, and a total of 1,503 drill core samples were submitted by Morro Bay in 2014.
All samples from the Peñoles Project were shipped to and processed at the Inspectorate Laboratories
(Inspectorate) in Durango.
The core from all drilling campaigns on the Peñoles property was transported by road from the drill site
to a core-logging facility at the Morro Bay Peñoles compound where it was logged and marked for
sampling. All holes received a preliminary log followed by a more detailed logging and labelling
procedure for sampling purposes. Samples were designated within lithologically uniform intervals as
determined by the geologists, with attention to varying mineralogy and textures. The geologist drew a
cutting line down the core with cross-lines marking out sample intervals; the intent was to minimize
sample bias and not cross any contacts. Sample lengths were generally one metre, but some were as
short as 30 cm and as long as 2.5 m. In most cases, barren samples were collected to shoulder both ends
of the mineralized intersection. Because of the fairly competent nature of the core recovered, the
sampled material sent away to be assayed is, for the most part, an accurate reflection of one half of the
core for the El Capitan mineralization. For sampling purposes, the core was sawn lengthwise using
diamond-blade saws. One half of the core was sent to a laboratory for analysis, and the other half was
retained. Core samples were tracked by three-part ticket books. One tag went with the sample for
assay, a second tag was stapled into the core box at the beginning of the sample interval, and the last
tag was kept with the geologist’s records. Core trays were marked with felt marker.
The plastic bags were tied closed, and instructions for the laboratory were enclosed. The plastic bags
were sealed in larger rice bags. These bags of samples were either delivered to or picked up by
Inspectorate and taken to the Inspectorate Lab in Durango, Mexico. All sample preparation and
analytical work was done by Inspectorate. Inspectorate Laboratories is accredited to the ISO 17025
Standard.
All samples were prepared (Sample Prep) by crushing to > 80% passing -10 mesh, split approximately
250 g and pulverised to > 90% passing -150 mesh. The content of gold and silver were determined by
procedure 2-FA-08/2-FA-10, involving FA/AAS and FA/GRAV on over-limit samples (> 2,000 ppb Au and
> 200 ppm Ag). Other elements were determined by ICP-AES.
Gold and silver values were determined by assay with an Atomic Absorption (AA) finish and, in the case
where gold assays were returned > 2,000 ppb or silver assays were returned > 200 ppm in the initial
FA/AA result, a gravimetric duplicate finish was applied. Other elements were determined by ICP-AES. A
30-element, inductively coupled plasma (ICP) package was run on all drill core and field samples.
Inspectorate has routine quality control procedures which ensure that every batch of 40 prepared
samples includes three sample repeats, one in-house standard, and/or one commercial standard.
Inspectorate is independent from both Sierra Madre and Morro Bay. Sierra Madre and Morro Bay used
APRIL 2015
MORRO BAY RESOURCES LTD. | RIVERSIDE RESOURCES INC. 11-2 NI 43-101 TECHNICAL REPORT PEÑOLES PROJECT
standard QA/QC procedures, when inserting standards and blanks, for all drilling programs completed
on the property.
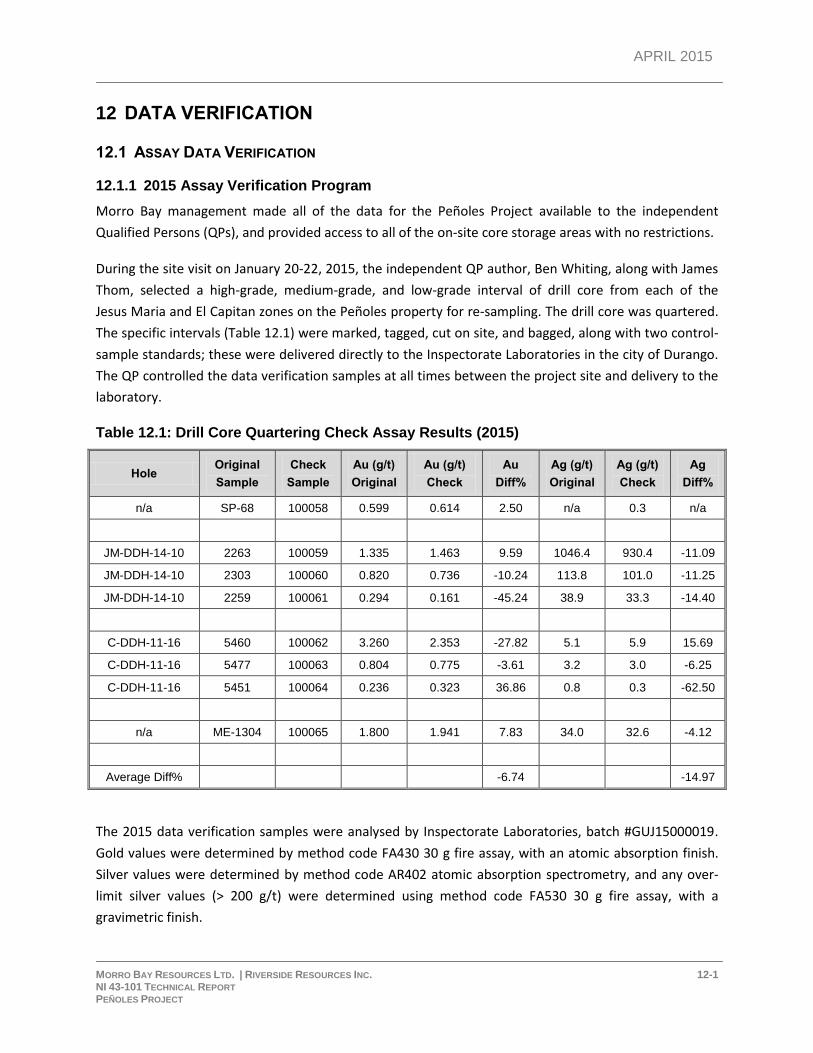
APRIL 2015
MORRO BAY RESOURCES LTD. | RIVERSIDE RESOURCES INC. 12-1 NI 43-101 TECHNICAL REPORT PEÑOLES PROJECT
12 DATA VERIFICATION
12.1 ASSAY DATA VERIFICATION
12.1.1 2015 Assay Verification Program
Morro Bay management made all of the data for the Peñoles Project available to the independent
Qualified Persons (QPs), and provided access to all of the on-site core storage areas with no restrictions.
During the site visit on January 20-22, 2015, the independent QP author, Ben Whiting, along with James
Thom, selected a high-grade, medium-grade, and low-grade interval of drill core from each of the
Jesus Maria and El Capitan zones on the Peñoles property for re-sampling. The drill core was quartered.
The specific intervals (Table 12.1) were marked, tagged, cut on site, and bagged, along with two control-
sample standards; these were delivered directly to the Inspectorate Laboratories in the city of Durango.
The QP controlled the data verification samples at all times between the project site and delivery to the
laboratory.
Table 12.1: Drill Core Quartering Check Assay Results (2015)
Hole Original
Sample
Check
Sample
Au (g/t)
Original
Au (g/t)
Check
Au
Diff%
Ag (g/t)
Original
Ag (g/t)
Check
Ag
Diff%
n/a SP-68 100058 0.599 0.614 2.50 n/a 0.3 n/a
JM-DDH-14-10 2263 100059 1.335 1.463 9.59 1046.4 930.4 -11.09
JM-DDH-14-10 2303 100060 0.820 0.736 -10.24 113.8 101.0 -11.25
JM-DDH-14-10 2259 100061 0.294 0.161 -45.24 38.9 33.3 -14.40
C-DDH-11-16 5460 100062 3.260 2.353 -27.82 5.1 5.9 15.69
C-DDH-11-16 5477 100063 0.804 0.775 -3.61 3.2 3.0 -6.25
C-DDH-11-16 5451 100064 0.236 0.323 36.86 0.8 0.3 -62.50
n/a ME-1304 100065 1.800 1.941 7.83 34.0 32.6 -4.12
Average Diff% -6.74 -14.97
The 2015 data verification samples were analysed by Inspectorate Laboratories, batch #GUJ15000019.
Gold values were determined by method code FA430 30 g fire assay, with an atomic absorption finish.
Silver values were determined by method code AR402 atomic absorption spectrometry, and any over-
limit silver values (> 200 g/t) were determined using method code FA530 30 g fire assay, with a
gravimetric finish.
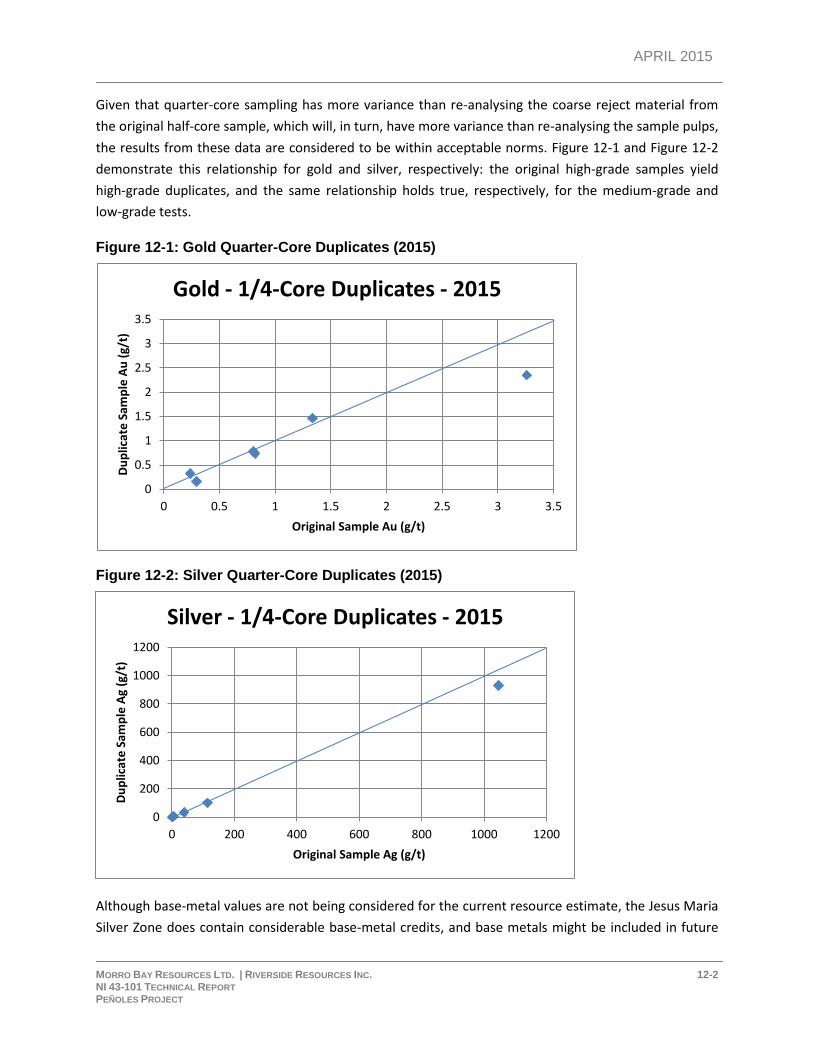
APRIL 2015
MORRO BAY RESOURCES LTD. | RIVERSIDE RESOURCES INC. 12-2 NI 43-101 TECHNICAL REPORT PEÑOLES PROJECT
Given that quarter-core sampling has more variance than re-analysing the coarse reject material from
the original half-core sample, which will, in turn, have more variance than re-analysing the sample pulps,
the results from these data are considered to be within acceptable norms. Figure 12-1 and Figure 12-2
demonstrate this relationship for gold and silver, respectively: the original high-grade samples yield
high-grade duplicates, and the same relationship holds true, respectively, for the medium-grade and
low-grade tests.
Figure 12-1: Gold Quarter-Core Duplicates (2015)
Figure 12-2: Silver Quarter-Core Duplicates (2015)
Although base-metal values are not being considered for the current resource estimate, the Jesus Maria
Silver Zone does contain considerable base-metal credits, and base metals might be included in future
0
0.5
1
1.5
2
2.5
3
3.5
0 0.5 1 1.5 2 2.5 3 3.5
Du
plic
ate
Sam
ple
Au
(g/
t)
Original Sample Au (g/t)
Gold - 1/4-Core Duplicates - 2015
0
200
400
600
800
1000
1200
0 200 400 600 800 1000 1200
Du
plic
ate
Sam
ple
Ag
(g/t
)
Original Sample Ag (g/t)
Silver - 1/4-Core Duplicates - 2015
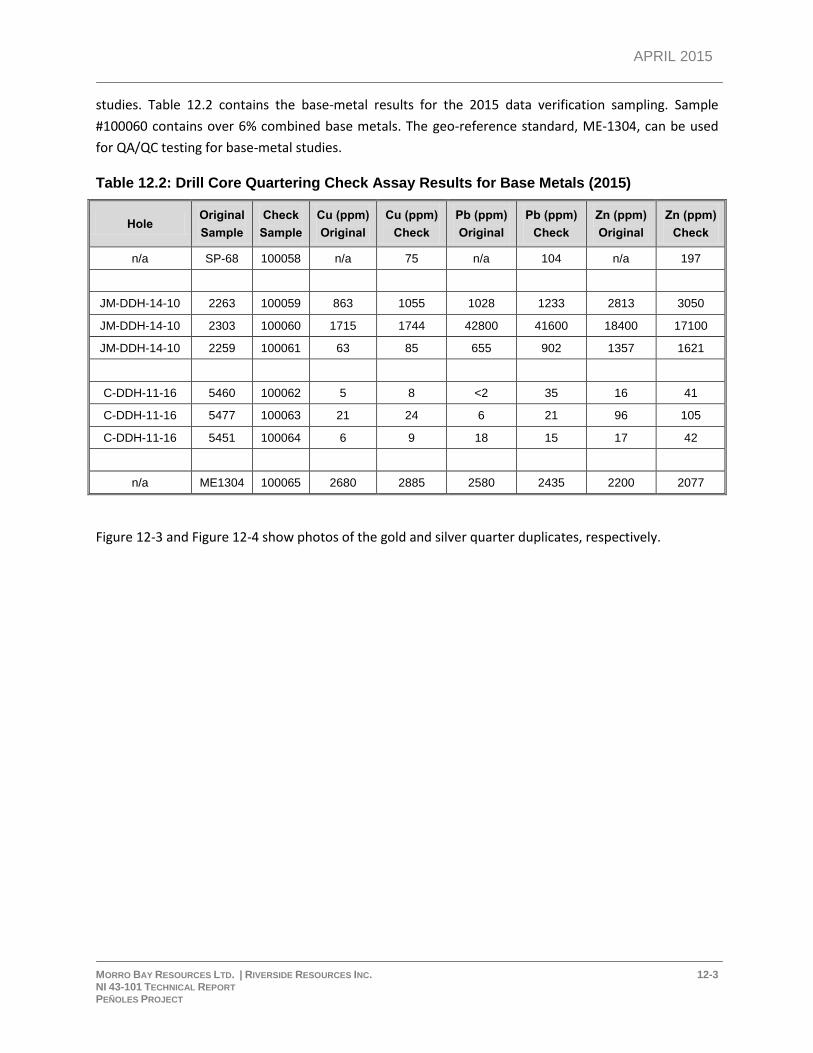
APRIL 2015
MORRO BAY RESOURCES LTD. | RIVERSIDE RESOURCES INC. 12-3 NI 43-101 TECHNICAL REPORT PEÑOLES PROJECT
studies. Table 12.2 contains the base-metal results for the 2015 data verification sampling. Sample
#100060 contains over 6% combined base metals. The geo-reference standard, ME-1304, can be used
for QA/QC testing for base-metal studies.
Table 12.2: Drill Core Quartering Check Assay Results for Base Metals (2015)
Hole Original
Sample
Check
Sample
Cu (ppm)
Original
Cu (ppm)
Check
Pb (ppm)
Original
Pb (ppm)
Check
Zn (ppm)
Original
Zn (ppm)
Check
n/a SP-68 100058 n/a 75 n/a 104 n/a 197
JM-DDH-14-10 2263 100059 863 1055 1028 1233 2813 3050
JM-DDH-14-10 2303 100060 1715 1744 42800 41600 18400 17100
JM-DDH-14-10 2259 100061 63 85 655 902 1357 1621
C-DDH-11-16 5460 100062 5 8 <2 35 16 41
C-DDH-11-16 5477 100063 21 24 6 21 96 105
C-DDH-11-16 5451 100064 6 9 18 15 17 42
n/a ME1304 100065 2680 2885 2580 2435 2200 2077
Figure 12-3 and Figure 12-4 show photos of the gold and silver quarter duplicates, respectively.
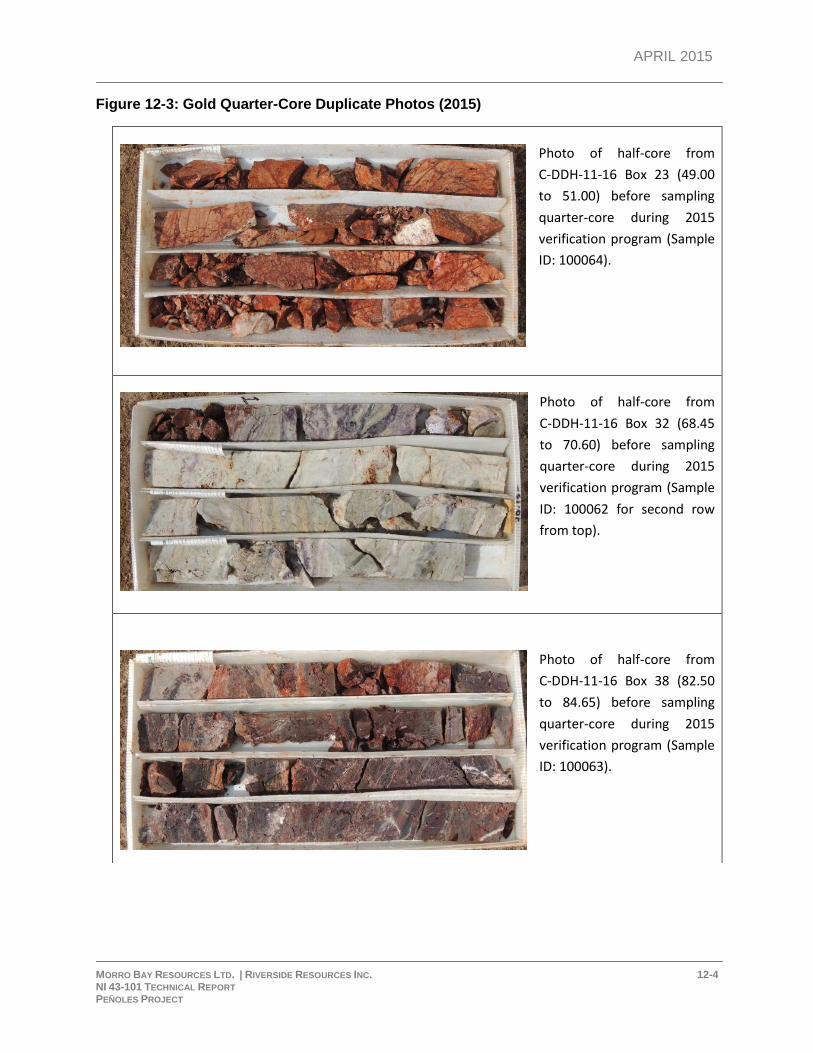
APRIL 2015
MORRO BAY RESOURCES LTD. | RIVERSIDE RESOURCES INC. 12-4 NI 43-101 TECHNICAL REPORT PEÑOLES PROJECT
Figure 12-3: Gold Quarter-Core Duplicate Photos (2015)
Photo of half-core from
C-DDH-11-16 Box 23 (49.00
to 51.00) before sampling
quarter-core during 2015
verification program (Sample
ID: 100064).
Photo of half-core from
C-DDH-11-16 Box 32 (68.45
to 70.60) before sampling
quarter-core during 2015
verification program (Sample
ID: 100062 for second row
from top).
Photo of half-core from
C-DDH-11-16 Box 38 (82.50
to 84.65) before sampling
quarter-core during 2015
verification program (Sample
ID: 100063).
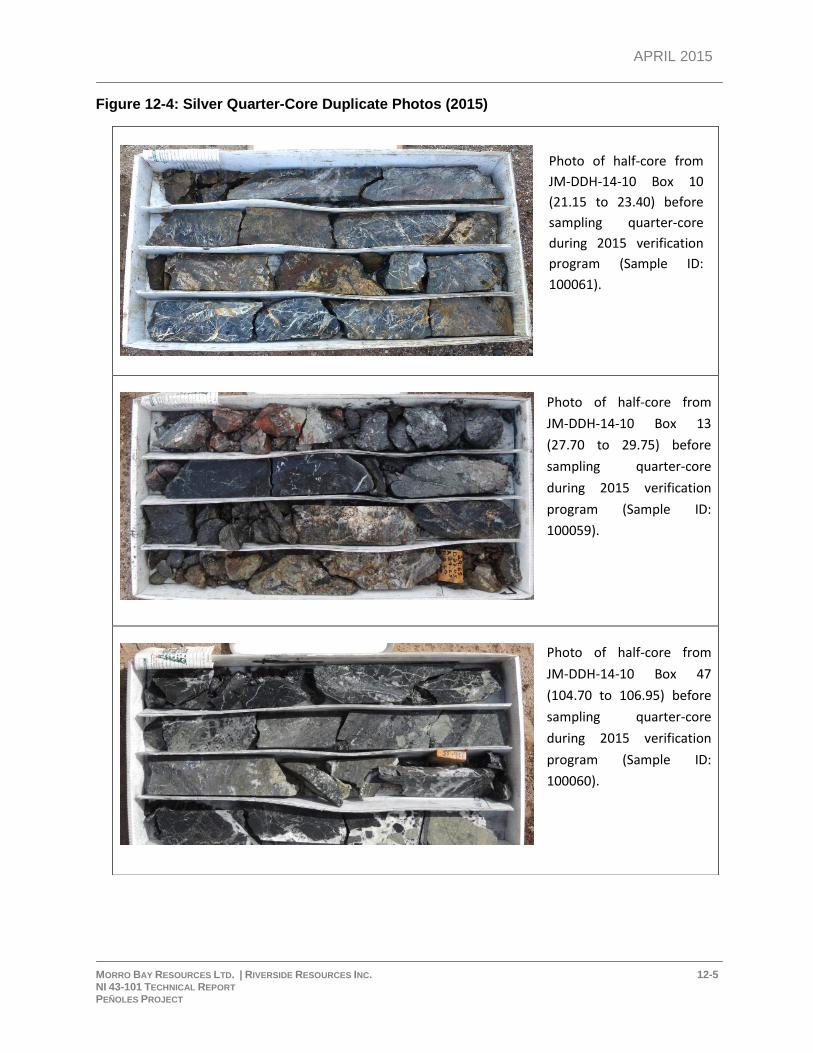
APRIL 2015
MORRO BAY RESOURCES LTD. | RIVERSIDE RESOURCES INC. 12-5 NI 43-101 TECHNICAL REPORT PEÑOLES PROJECT
Figure 12-4: Silver Quarter-Core Duplicate Photos (2015)
Photo of half-core from
JM-DDH-14-10 Box 13
(27.70 to 29.75) before
sampling quarter-core
during 2015 verification
program (Sample ID:
100059).
Photo of half-core from
JM-DDH-14-10 Box 47
(104.70 to 106.95) before
sampling quarter-core
during 2015 verification
program (Sample ID:
100060).
Photo of half-core from
JM-DDH-14-10 Box 10
(21.15 to 23.40) before
sampling quarter-core
during 2015 verification
program (Sample ID:
100061).
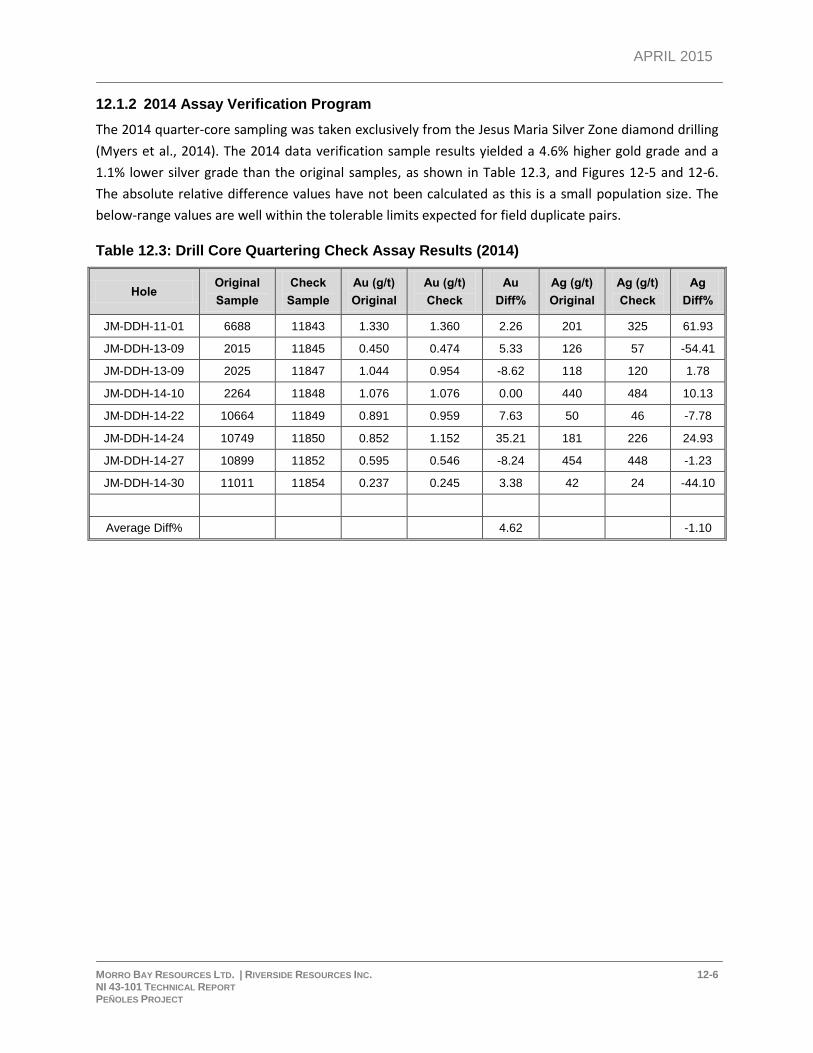
APRIL 2015
MORRO BAY RESOURCES LTD. | RIVERSIDE RESOURCES INC. 12-6 NI 43-101 TECHNICAL REPORT PEÑOLES PROJECT
12.1.2 2014 Assay Verification Program
The 2014 quarter-core sampling was taken exclusively from the Jesus Maria Silver Zone diamond drilling
(Myers et al., 2014). The 2014 data verification sample results yielded a 4.6% higher gold grade and a
1.1% lower silver grade than the original samples, as shown in Table 12.3, and Figures 12-5 and 12-6.
The absolute relative difference values have not been calculated as this is a small population size. The
below-range values are well within the tolerable limits expected for field duplicate pairs.
Table 12.3: Drill Core Quartering Check Assay Results (2014)
Hole Original
Sample
Check
Sample
Au (g/t)
Original
Au (g/t)
Check
Au
Diff%
Ag (g/t)
Original
Ag (g/t)
Check
Ag
Diff%
JM-DDH-11-01 6688 11843 1.330 1.360 2.26 201 325 61.93
JM-DDH-13-09 2015 11845 0.450 0.474 5.33 126 57 -54.41
JM-DDH-13-09 2025 11847 1.044 0.954 -8.62 118 120 1.78
JM-DDH-14-10 2264 11848 1.076 1.076 0.00 440 484 10.13
JM-DDH-14-22 10664 11849 0.891 0.959 7.63 50 46 -7.78
JM-DDH-14-24 10749 11850 0.852 1.152 35.21 181 226 24.93
JM-DDH-14-27 10899 11852 0.595 0.546 -8.24 454 448 -1.23
JM-DDH-14-30 11011 11854 0.237 0.245 3.38 42 24 -44.10
Average Diff% 4.62 -1.10
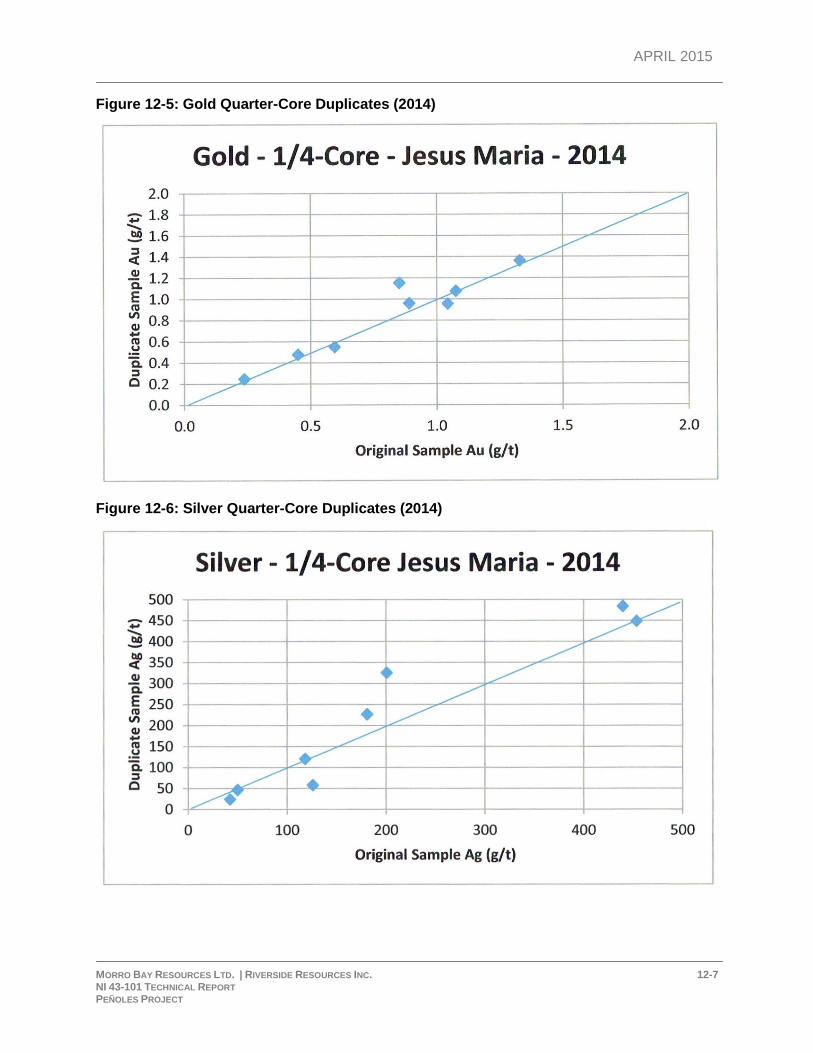
APRIL 2015
MORRO BAY RESOURCES LTD. | RIVERSIDE RESOURCES INC. 12-7 NI 43-101 TECHNICAL REPORT PEÑOLES PROJECT
Figure 12-5: Gold Quarter-Core Duplicates (2014)
Figure 12-6: Silver Quarter-Core Duplicates (2014)
APRIL 2015
MORRO BAY RESOURCES LTD. | RIVERSIDE RESOURCES INC. 12-8 NI 43-101 TECHNICAL REPORT PEÑOLES PROJECT
12.1.3 2012 Assay Verification Program
During his site visit in June 2012, Robert Sim collected two pieces of drill core for validation purposes.
These were ½ pieces measuring approximately 15 cm long from holes DDH-12-11 and
DDH-12-15. Sim brought the samples back to Canada and then sent them to ALS Minerals in North
Vancouver where they were analyzed using ALS Mineral's AuAA25 procedure (30 g fire assay with AA
finish). The gold grades returned from these samples are similar to values contained in these intervals in
the Peñoles project database.
12.1.4 2009 Assay Verification Program
A re-examination of the 2009 El Capitan Gold Zone quarter-core duplicates (Daniels, 2011) was also
conducted because there were questions regarding the 2009 check analyses that yielded gold values
that were, on average, 21% lower than the original samples in the database (Table 12.4). It was noted
that the “nugget effect,” high analyses from particles of gold, accounted for some of the difference. For
example, original sample #5194 yielded the highest value of 13.2 g/t, whereas its check sample, #7264,
yielded 4.2 g/t; both values are still considerably higher than the average gold grade for the El Capitan
Gold Zone. Daniels correctly attributed this to sample heterogeneity: transitioning from a half-core
original sample to a quarter-core duplicate sample. While the average silver grade is relatively low in the
El Capitan Gold Zone, the reverse pattern was identified for silver: 2009 check analyses yielded silver
values that were, on average, 26% higher than the original samples in the database.
To calculate the percent difference (Diff%) for values less than the detection limit, a value of ½ the
detection limit was used. In Figures 12-7 and 12-8, the highest grade gold sample is not included in the
graph range.
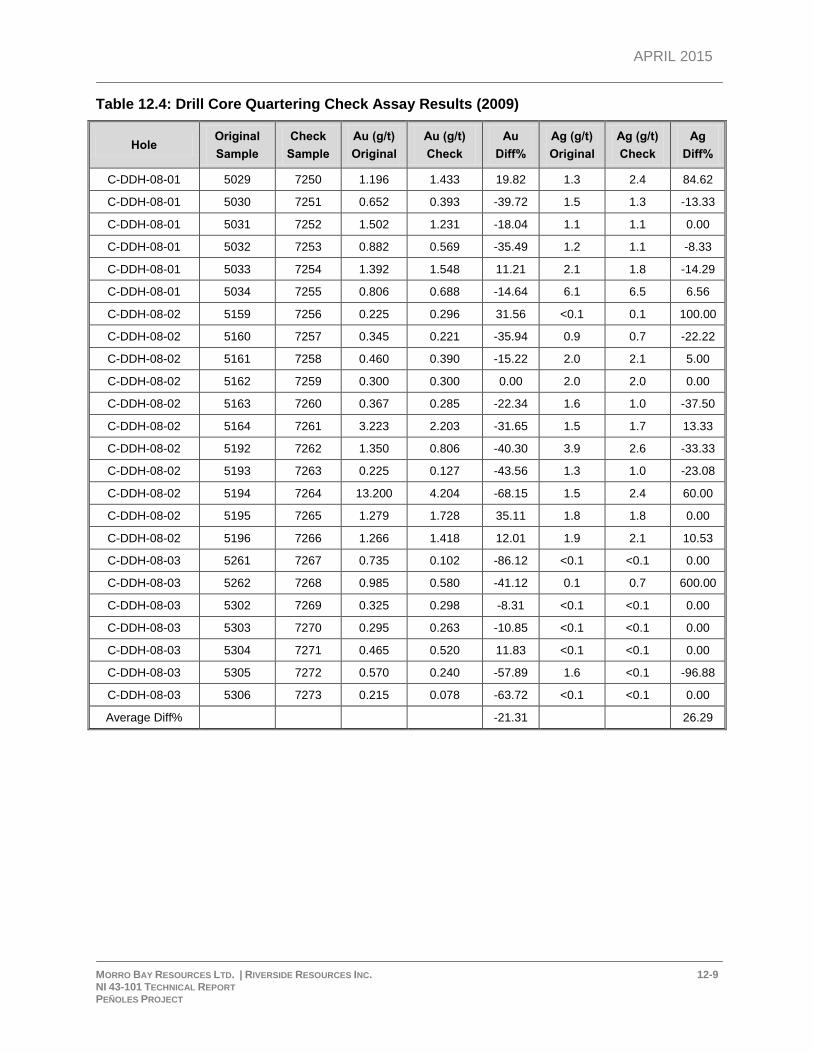
APRIL 2015
MORRO BAY RESOURCES LTD. | RIVERSIDE RESOURCES INC. 12-9 NI 43-101 TECHNICAL REPORT PEÑOLES PROJECT
Table 12.4: Drill Core Quartering Check Assay Results (2009)
Hole Original
Sample
Check
Sample
Au (g/t)
Original
Au (g/t)
Check
Au
Diff%
Ag (g/t)
Original
Ag (g/t)
Check
Ag
Diff%
C-DDH-08-01 5029 7250 1.196 1.433 19.82 1.3 2.4 84.62
C-DDH-08-01 5030 7251 0.652 0.393 -39.72 1.5 1.3 -13.33
C-DDH-08-01 5031 7252 1.502 1.231 -18.04 1.1 1.1 0.00
C-DDH-08-01 5032 7253 0.882 0.569 -35.49 1.2 1.1 -8.33
C-DDH-08-01 5033 7254 1.392 1.548 11.21 2.1 1.8 -14.29
C-DDH-08-01 5034 7255 0.806 0.688 -14.64 6.1 6.5 6.56
C-DDH-08-02 5159 7256 0.225 0.296 31.56 <0.1 0.1 100.00
C-DDH-08-02 5160 7257 0.345 0.221 -35.94 0.9 0.7 -22.22
C-DDH-08-02 5161 7258 0.460 0.390 -15.22 2.0 2.1 5.00
C-DDH-08-02 5162 7259 0.300 0.300 0.00 2.0 2.0 0.00
C-DDH-08-02 5163 7260 0.367 0.285 -22.34 1.6 1.0 -37.50
C-DDH-08-02 5164 7261 3.223 2.203 -31.65 1.5 1.7 13.33
C-DDH-08-02 5192 7262 1.350 0.806 -40.30 3.9 2.6 -33.33
C-DDH-08-02 5193 7263 0.225 0.127 -43.56 1.3 1.0 -23.08
C-DDH-08-02 5194 7264 13.200 4.204 -68.15 1.5 2.4 60.00
C-DDH-08-02 5195 7265 1.279 1.728 35.11 1.8 1.8 0.00
C-DDH-08-02 5196 7266 1.266 1.418 12.01 1.9 2.1 10.53
C-DDH-08-03 5261 7267 0.735 0.102 -86.12 <0.1 <0.1 0.00
C-DDH-08-03 5262 7268 0.985 0.580 -41.12 0.1 0.7 600.00
C-DDH-08-03 5302 7269 0.325 0.298 -8.31 <0.1 <0.1 0.00
C-DDH-08-03 5303 7270 0.295 0.263 -10.85 <0.1 <0.1 0.00
C-DDH-08-03 5304 7271 0.465 0.520 11.83 <0.1 <0.1 0.00
C-DDH-08-03 5305 7272 0.570 0.240 -57.89 1.6 <0.1 -96.88
C-DDH-08-03 5306 7273 0.215 0.078 -63.72 <0.1 <0.1 0.00
Average Diff% -21.31 26.29
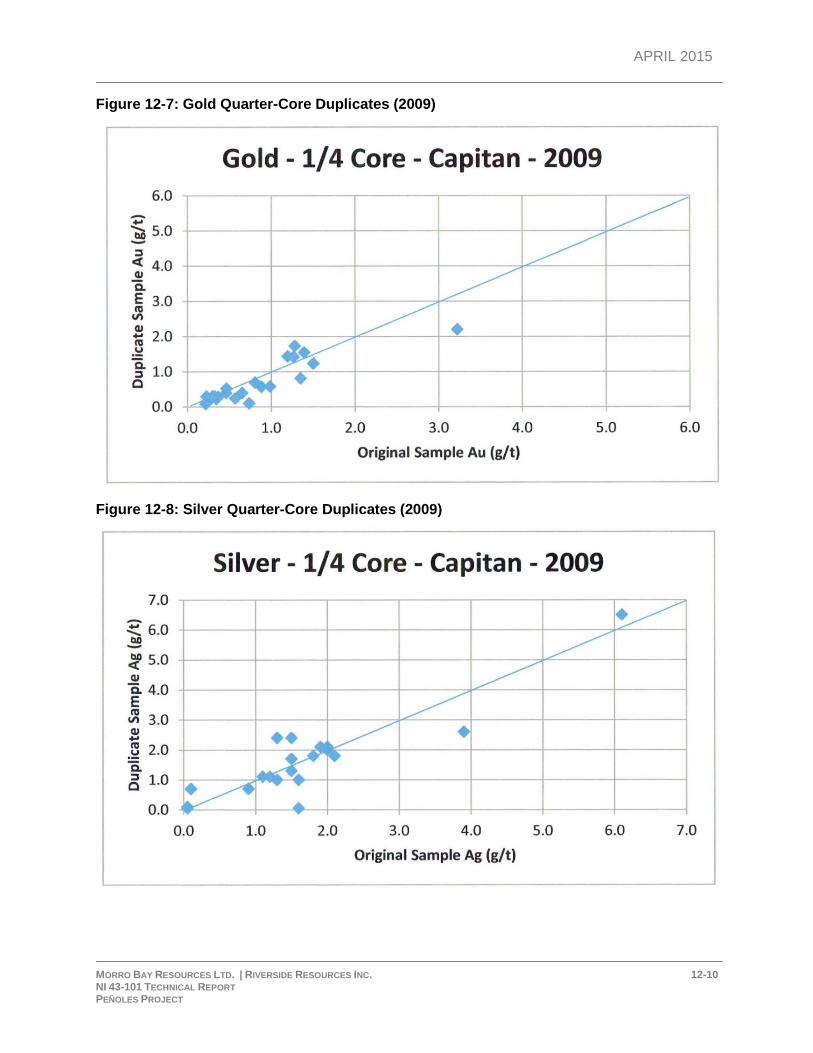
APRIL 2015
MORRO BAY RESOURCES LTD. | RIVERSIDE RESOURCES INC. 12-10 NI 43-101 TECHNICAL REPORT PEÑOLES PROJECT
Figure 12-7: Gold Quarter-Core Duplicates (2009)
Figure 12-8: Silver Quarter-Core Duplicates (2009)
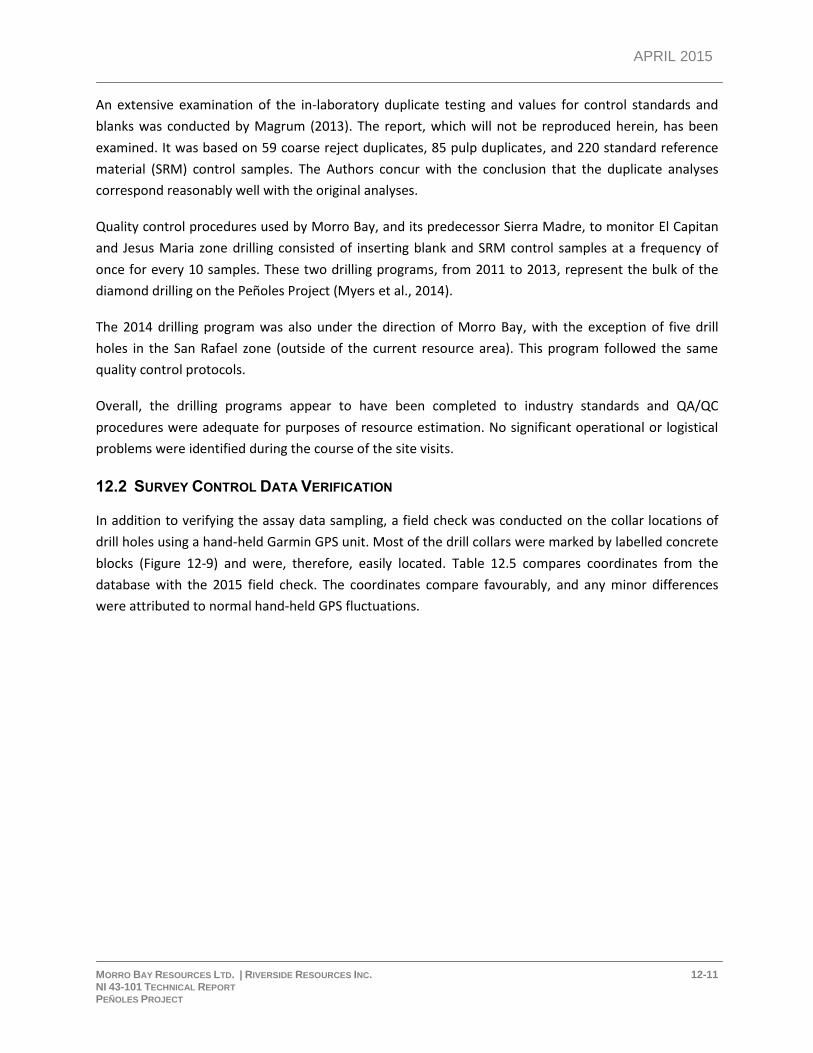
APRIL 2015
MORRO BAY RESOURCES LTD. | RIVERSIDE RESOURCES INC. 12-11 NI 43-101 TECHNICAL REPORT PEÑOLES PROJECT
An extensive examination of the in-laboratory duplicate testing and values for control standards and
blanks was conducted by Magrum (2013). The report, which will not be reproduced herein, has been
examined. It was based on 59 coarse reject duplicates, 85 pulp duplicates, and 220 standard reference
material (SRM) control samples. The Authors concur with the conclusion that the duplicate analyses
correspond reasonably well with the original analyses.
Quality control procedures used by Morro Bay, and its predecessor Sierra Madre, to monitor El Capitan
and Jesus Maria zone drilling consisted of inserting blank and SRM control samples at a frequency of
once for every 10 samples. These two drilling programs, from 2011 to 2013, represent the bulk of the
diamond drilling on the Peñoles Project (Myers et al., 2014).
The 2014 drilling program was also under the direction of Morro Bay, with the exception of five drill
holes in the San Rafael zone (outside of the current resource area). This program followed the same
quality control protocols.
Overall, the drilling programs appear to have been completed to industry standards and QA/QC
procedures were adequate for purposes of resource estimation. No significant operational or logistical
problems were identified during the course of the site visits.
12.2 SURVEY CONTROL DATA VERIFICATION
In addition to verifying the assay data sampling, a field check was conducted on the collar locations of
drill holes using a hand-held Garmin GPS unit. Most of the drill collars were marked by labelled concrete
blocks (Figure 12-9) and were, therefore, easily located. Table 12.5 compares coordinates from the
database with the 2015 field check. The coordinates compare favourably, and any minor differences
were attributed to normal hand-held GPS fluctuations.
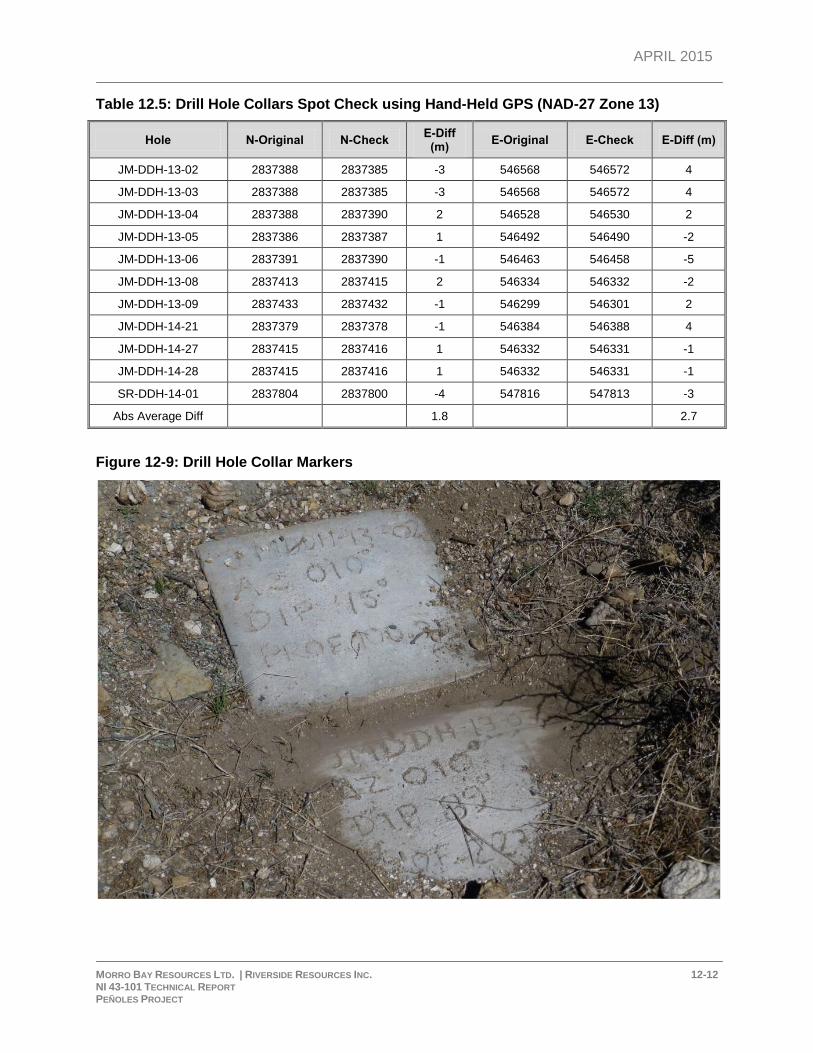
APRIL 2015
MORRO BAY RESOURCES LTD. | RIVERSIDE RESOURCES INC. 12-12 NI 43-101 TECHNICAL REPORT PEÑOLES PROJECT
Table 12.5: Drill Hole Collars Spot Check using Hand-Held GPS (NAD-27 Zone 13)
Hole N-Original N-Check E-Diff
(m) E-Original E-Check E-Diff (m)
JM-DDH-13-02 2837388 2837385 -3 546568 546572 4
JM-DDH-13-03 2837388 2837385 -3 546568 546572 4
JM-DDH-13-04 2837388 2837390 2 546528 546530 2
JM-DDH-13-05 2837386 2837387 1 546492 546490 -2
JM-DDH-13-06 2837391 2837390 -1 546463 546458 -5
JM-DDH-13-08 2837413 2837415 2 546334 546332 -2
JM-DDH-13-09 2837433 2837432 -1 546299 546301 2
JM-DDH-14-21 2837379 2837378 -1 546384 546388 4
JM-DDH-14-27 2837415 2837416 1 546332 546331 -1
JM-DDH-14-28 2837415 2837416 1 546332 546331 -1
SR-DDH-14-01 2837804 2837800 -4 547816 547813 -3
Abs Average Diff 1.8 2.7
Figure 12-9: Drill Hole Collar Markers
APRIL 2015
MORRO BAY RESOURCES LTD. | RIVERSIDE RESOURCES INC. 12-13 NI 43-101 TECHNICAL REPORT PEÑOLES PROJECT
12.3 DATABASE VERIFICATION
Following the completion of the mineral resource models, the sample data from eight randomly
selected drill holes, representing approximately 10% of the data, was exported from MineSight® for
validation purposes (four holes from El Capitan and four from Jesus Maria). The gold and silver grades
were manually compared to the values listed in certified assay certificates provided by the laboratories.
A total of 434 samples were checked and no errors were identified.
12.4 CONCLUSIONS
The procedures used during the exploration programs were reviewed during a series of site visits by
several qualified persons, and these practices were found to follow accepted industry standards. The
quantity and location of drilling were verified during these site visits. A suite of independent samples
were collected and analyzed and these grades are similar to the grades contained in the project
database. Manual verification of a random suite of holes showed that no errors exist in the underlying
database. The results of these data validation checks indicate that the database is sound and sufficiently
reliable to support the estimation of mineral resources.
APRIL 2015
MORRO BAY RESOURCES LTD. | RIVERSIDE RESOURCES INC. 13-1 NI 43-101 TECHNICAL REPORT PEÑOLES PROJECT
13 MINERAL PROCESSING AND METALLURGICAL TESTING
13.1 JESUS MARIA
A current, metallurgical test work program was carried out on samples from the Jesus Maria Silver Zone
of the Peñoles Project in Mexico, and the Bureau Veritas Commodities Canada Ltd. (Metallurgical
Division) produced the following report Preliminary Metallurgical Testing to Recover Gold and Silver on
Samples from the Jesus Maria Zone, Peñoles Project, Mexico – March 2015, which is summarized in this
section.
13.1.1 Introduction
A series of six composites were tested to explore the optimum method(s) to economically recover gold
and silver from the ore using three different process routes.
Testing included the following mineral processing circuits:
Gravity concentration;
Rougher-scavenger flotation; and
Whole-ore cyanidation.
All testing was performed at the nominal grind size of P80=75 µm for comparative purposes.
13.1.2 Samples and Head Assays
Samples were collected from mineralized intervals for three drill holes from the 2014 program and
composited to provide six bulk samples for metallurgical testing. The specific intervals and head grades
are shown in Table 13.1.
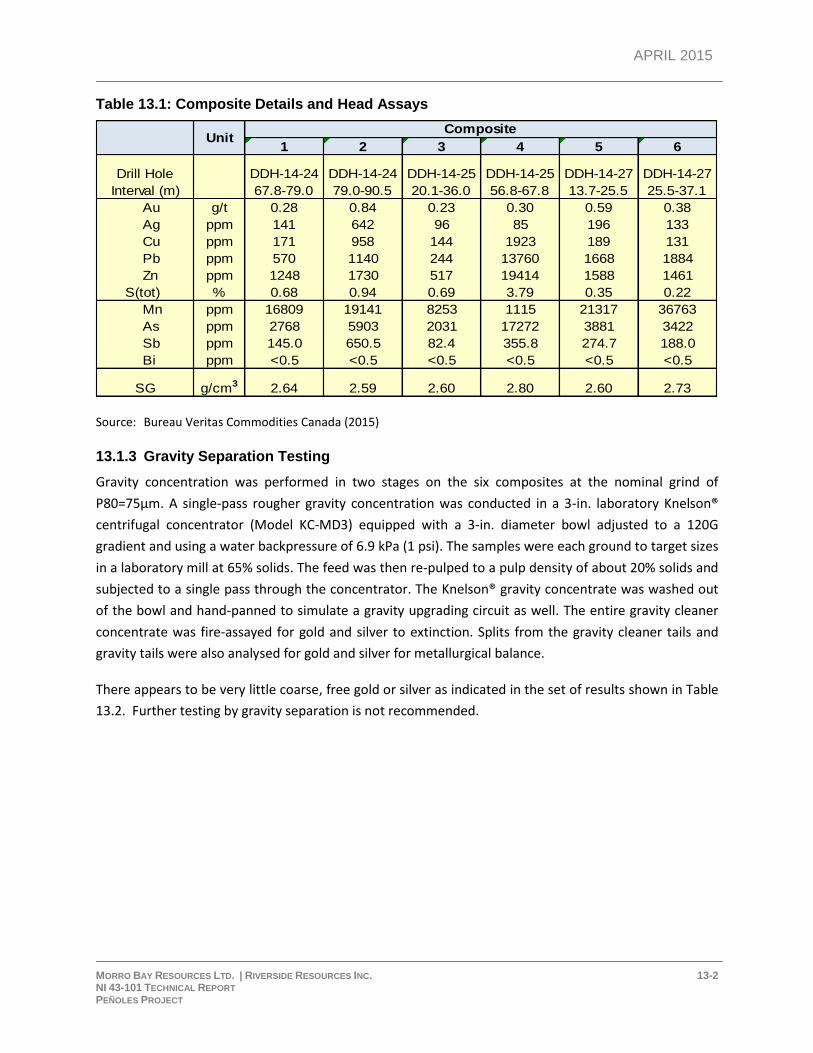
APRIL 2015
MORRO BAY RESOURCES LTD. | RIVERSIDE RESOURCES INC. 13-2 NI 43-101 TECHNICAL REPORT PEÑOLES PROJECT
Table 13.1: Composite Details and Head Assays
Source: Bureau Veritas Commodities Canada (2015)
13.1.3 Gravity Separation Testing
Gravity concentration was performed in two stages on the six composites at the nominal grind of
P80=75µm. A single-pass rougher gravity concentration was conducted in a 3-in. laboratory Knelson®
centrifugal concentrator (Model KC-MD3) equipped with a 3-in. diameter bowl adjusted to a 120G
gradient and using a water backpressure of 6.9 kPa (1 psi). The samples were each ground to target sizes
in a laboratory mill at 65% solids. The feed was then re-pulped to a pulp density of about 20% solids and
subjected to a single pass through the concentrator. The Knelson® gravity concentrate was washed out
of the bowl and hand-panned to simulate a gravity upgrading circuit as well. The entire gravity cleaner
concentrate was fire-assayed for gold and silver to extinction. Splits from the gravity cleaner tails and
gravity tails were also analysed for gold and silver for metallurgical balance.
There appears to be very little coarse, free gold or silver as indicated in the set of results shown in Table
13.2. Further testing by gravity separation is not recommended.
1 2 3 4 5 6
Drill Hole DDH-14-24 DDH-14-24 DDH-14-25 DDH-14-25 DDH-14-27 DDH-14-27
Interval (m) 67.8-79.0 79.0-90.5 20.1-36.0 56.8-67.8 13.7-25.5 25.5-37.1
Au g/t 0.28 0.84 0.23 0.30 0.59 0.38
Ag ppm 141 642 96 85 196 133
Cu ppm 171 958 144 1923 189 131
Pb ppm 570 1140 244 13760 1668 1884
Zn ppm 1248 1730 517 19414 1588 1461
S(tot) % 0.68 0.94 0.69 3.79 0.35 0.22
Mn ppm 16809 19141 8253 1115 21317 36763
As ppm 2768 5903 2031 17272 3881 3422
Sb ppm 145.0 650.5 82.4 355.8 274.7 188.0
Bi ppm <0.5 <0.5 <0.5 <0.5 <0.5 <0.5
SG g/cm3 2.64 2.59 2.60 2.80 2.60 2.73
UnitComposite
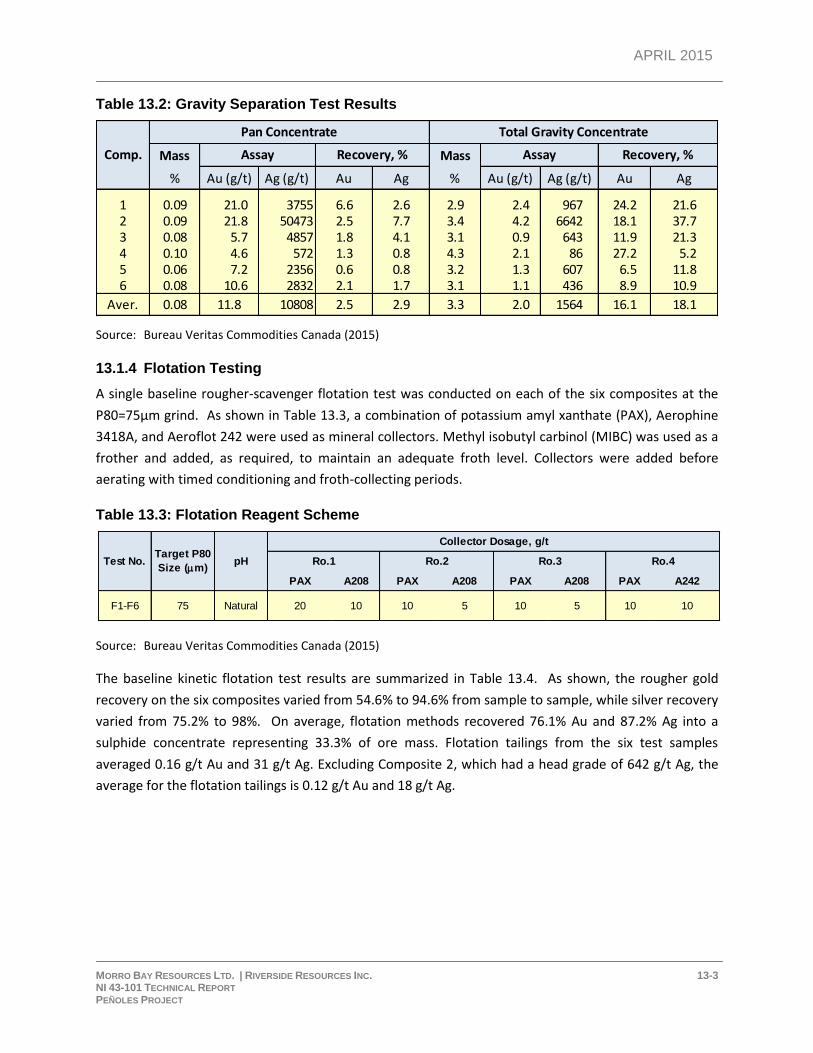
APRIL 2015
MORRO BAY RESOURCES LTD. | RIVERSIDE RESOURCES INC. 13-3 NI 43-101 TECHNICAL REPORT PEÑOLES PROJECT
Table 13.2: Gravity Separation Test Results
Source: Bureau Veritas Commodities Canada (2015)
13.1.4 Flotation Testing
A single baseline rougher-scavenger flotation test was conducted on each of the six composites at the
P80=75µm grind. As shown in Table 13.3, a combination of potassium amyl xanthate (PAX), Aerophine
3418A, and Aeroflot 242 were used as mineral collectors. Methyl isobutyl carbinol (MIBC) was used as a
frother and added, as required, to maintain an adequate froth level. Collectors were added before
aerating with timed conditioning and froth-collecting periods.
Table 13.3: Flotation Reagent Scheme
Source: Bureau Veritas Commodities Canada (2015)
The baseline kinetic flotation test results are summarized in Table 13.4. As shown, the rougher gold
recovery on the six composites varied from 54.6% to 94.6% from sample to sample, while silver recovery
varied from 75.2% to 98%. On average, flotation methods recovered 76.1% Au and 87.2% Ag into a
sulphide concentrate representing 33.3% of ore mass. Flotation tailings from the six test samples
averaged 0.16 g/t Au and 31 g/t Ag. Excluding Composite 2, which had a head grade of 642 g/t Ag, the
average for the flotation tailings is 0.12 g/t Au and 18 g/t Ag.
Mass Mass
% Au (g/t) Ag (g/t) Au Ag % Au (g/t) Ag (g/t) Au Ag
1 0.09 21.0 3755 6.6 2.6 2.9 2.4 967 24.2 21.62 0.09 21.8 50473 2.5 7.7 3.4 4.2 6642 18.1 37.73 0.08 5.7 4857 1.8 4.1 3.1 0.9 643 11.9 21.34 0.10 4.6 572 1.3 0.8 4.3 2.1 86 27.2 5.25 0.06 7.2 2356 0.6 0.8 3.2 1.3 607 6.5 11.86 0.08 10.6 2832 2.1 1.7 3.1 1.1 436 8.9 10.9
Aver. 0.08 11.8 10808 2.5 2.9 3.3 2.0 1564 16.1 18.1
Pan Concentrate Total Gravity Concentrate
Assay Recovery, % Assay Recovery, %Comp.
PAX A208 PAX A208 PAX A208 PAX A242
F1-F6 75 Natural 20 10 10 5 10 5 10 10
pH Ro.1 Ro.2Target P80
Size (mm)
Collector Dosage, g/t
Ro.3 Ro.4Test No.
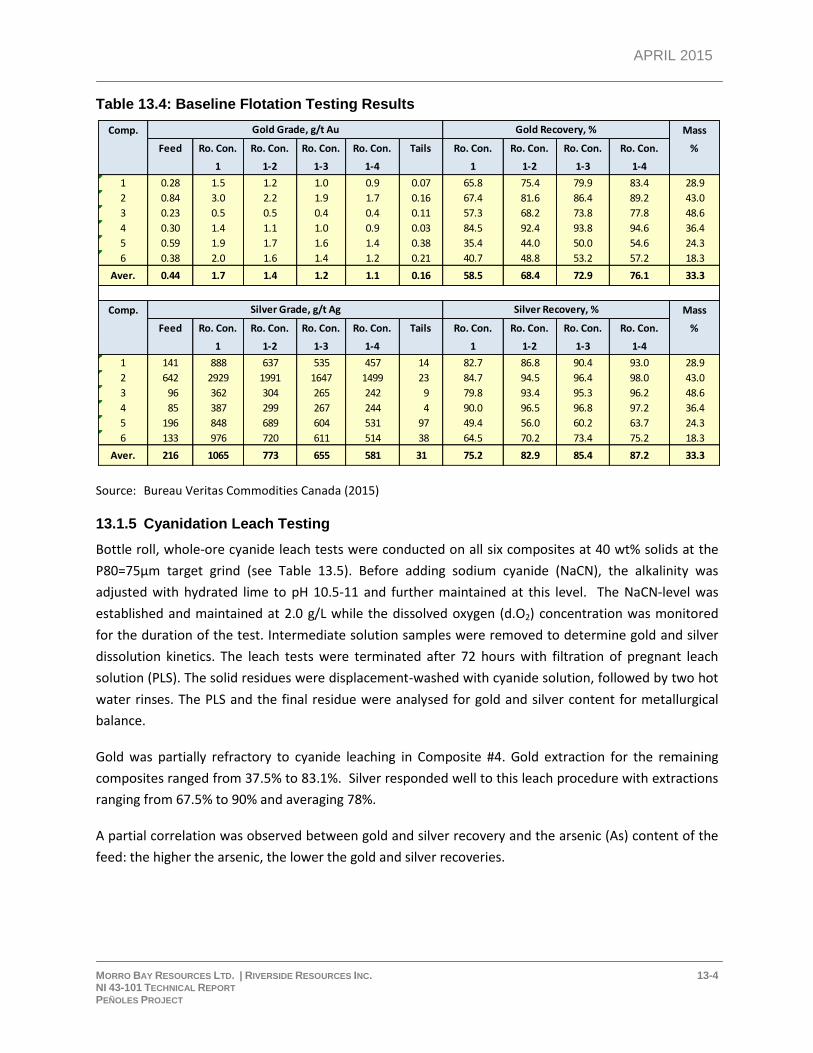
APRIL 2015
MORRO BAY RESOURCES LTD. | RIVERSIDE RESOURCES INC. 13-4 NI 43-101 TECHNICAL REPORT PEÑOLES PROJECT
Table 13.4: Baseline Flotation Testing Results
Source: Bureau Veritas Commodities Canada (2015)
13.1.5 Cyanidation Leach Testing
Bottle roll, whole-ore cyanide leach tests were conducted on all six composites at 40 wt% solids at the
P80=75µm target grind (see Table 13.5). Before adding sodium cyanide (NaCN), the alkalinity was
adjusted with hydrated lime to pH 10.5-11 and further maintained at this level. The NaCN-level was
established and maintained at 2.0 g/L while the dissolved oxygen (d.O2) concentration was monitored
for the duration of the test. Intermediate solution samples were removed to determine gold and silver
dissolution kinetics. The leach tests were terminated after 72 hours with filtration of pregnant leach
solution (PLS). The solid residues were displacement-washed with cyanide solution, followed by two hot
water rinses. The PLS and the final residue were analysed for gold and silver content for metallurgical
balance.
Gold was partially refractory to cyanide leaching in Composite #4. Gold extraction for the remaining
composites ranged from 37.5% to 83.1%. Silver responded well to this leach procedure with extractions
ranging from 67.5% to 90% and averaging 78%.
A partial correlation was observed between gold and silver recovery and the arsenic (As) content of the
feed: the higher the arsenic, the lower the gold and silver recoveries.
Comp. Mass
Feed Ro. Con. Ro. Con. Ro. Con. Ro. Con. Tails Ro. Con. Ro. Con. Ro. Con. Ro. Con. %
1 1-2 1-3 1-4 1 1-2 1-3 1-4
1 0.28 1.5 1.2 1.0 0.9 0.07 65.8 75.4 79.9 83.4 28.9
2 0.84 3.0 2.2 1.9 1.7 0.16 67.4 81.6 86.4 89.2 43.0
3 0.23 0.5 0.5 0.4 0.4 0.11 57.3 68.2 73.8 77.8 48.6
4 0.30 1.4 1.1 1.0 0.9 0.03 84.5 92.4 93.8 94.6 36.4
5 0.59 1.9 1.7 1.6 1.4 0.38 35.4 44.0 50.0 54.6 24.3
6 0.38 2.0 1.6 1.4 1.2 0.21 40.7 48.8 53.2 57.2 18.3
Aver. 0.44 1.7 1.4 1.2 1.1 0.16 58.5 68.4 72.9 76.1 33.3
Comp. Mass
Feed Ro. Con. Ro. Con. Ro. Con. Ro. Con. Tails Ro. Con. Ro. Con. Ro. Con. Ro. Con. %
1 1-2 1-3 1-4 1 1-2 1-3 1-4
1 141 888 637 535 457 14 82.7 86.8 90.4 93.0 28.9
2 642 2929 1991 1647 1499 23 84.7 94.5 96.4 98.0 43.0
3 96 362 304 265 242 9 79.8 93.4 95.3 96.2 48.6
4 85 387 299 267 244 4 90.0 96.5 96.8 97.2 36.4
5 196 848 689 604 531 97 49.4 56.0 60.2 63.7 24.3
6 133 976 720 611 514 38 64.5 70.2 73.4 75.2 18.3
Aver. 216 1065 773 655 581 31 75.2 82.9 85.4 87.2 33.3
Silver Grade, g/t Ag Silver Recovery, %
Gold Grade, g/t Au Gold Recovery, %
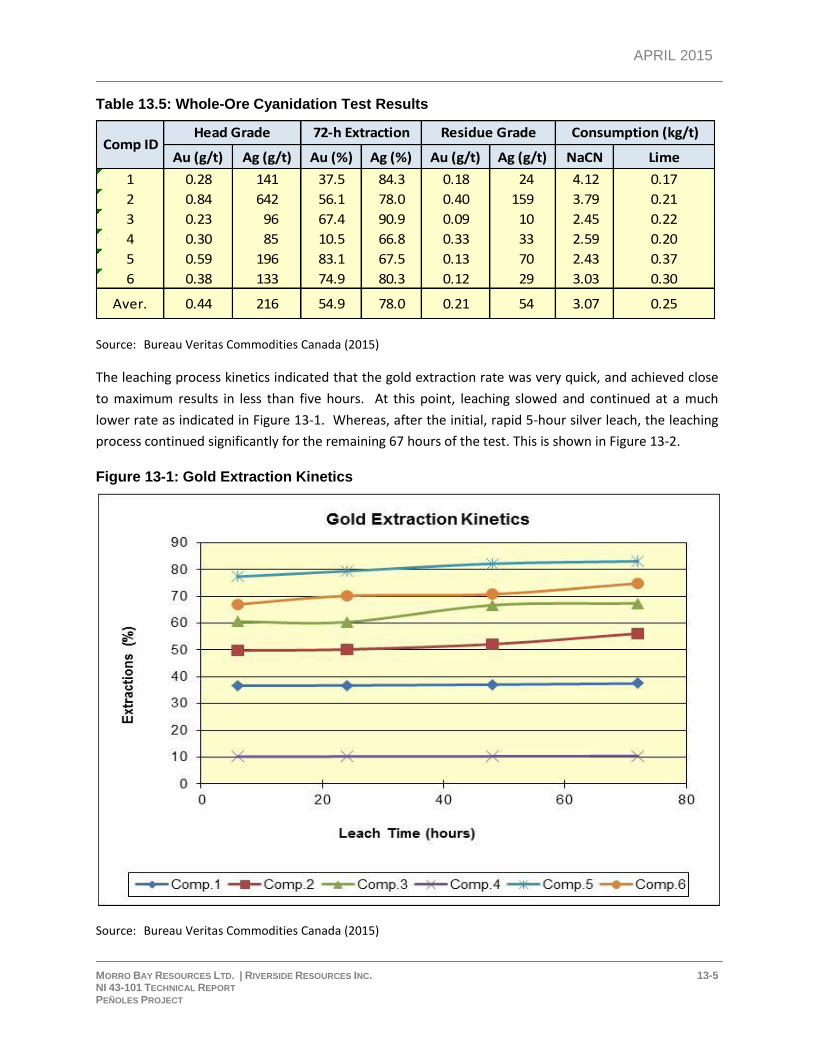
APRIL 2015
MORRO BAY RESOURCES LTD. | RIVERSIDE RESOURCES INC. 13-5 NI 43-101 TECHNICAL REPORT PEÑOLES PROJECT
Table 13.5: Whole-Ore Cyanidation Test Results
Source: Bureau Veritas Commodities Canada (2015)
The leaching process kinetics indicated that the gold extraction rate was very quick, and achieved close
to maximum results in less than five hours. At this point, leaching slowed and continued at a much
lower rate as indicated in Figure 13-1. Whereas, after the initial, rapid 5-hour silver leach, the leaching
process continued significantly for the remaining 67 hours of the test. This is shown in Figure 13-2.
Figure 13-1: Gold Extraction Kinetics
Source: Bureau Veritas Commodities Canada (2015)
Au (g/t) Ag (g/t) Au (%) Ag (%) Au (g/t) Ag (g/t) NaCN Lime
1 0.28 141 37.5 84.3 0.18 24 4.12 0.17
2 0.84 642 56.1 78.0 0.40 159 3.79 0.21
3 0.23 96 67.4 90.9 0.09 10 2.45 0.22
4 0.30 85 10.5 66.8 0.33 33 2.59 0.20
5 0.59 196 83.1 67.5 0.13 70 2.43 0.37
6 0.38 133 74.9 80.3 0.12 29 3.03 0.30
Aver. 0.44 216 54.9 78.0 0.21 54 3.07 0.25
Comp IDHead Grade 72-h Extraction Residue Grade Consumption (kg/t)
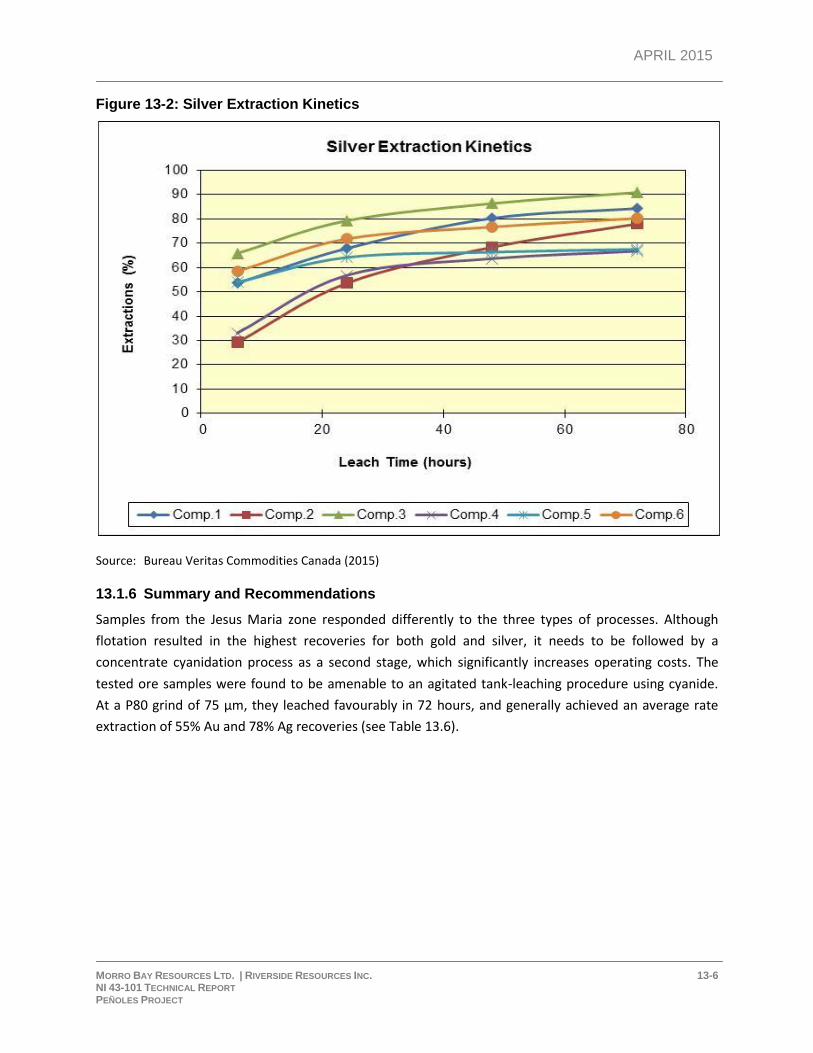
APRIL 2015
MORRO BAY RESOURCES LTD. | RIVERSIDE RESOURCES INC. 13-6 NI 43-101 TECHNICAL REPORT PEÑOLES PROJECT
Figure 13-2: Silver Extraction Kinetics
Source: Bureau Veritas Commodities Canada (2015)
13.1.6 Summary and Recommendations
Samples from the Jesus Maria zone responded differently to the three types of processes. Although
flotation resulted in the highest recoveries for both gold and silver, it needs to be followed by a
concentrate cyanidation process as a second stage, which significantly increases operating costs. The
tested ore samples were found to be amenable to an agitated tank-leaching procedure using cyanide.
At a P80 grind of 75 µm, they leached favourably in 72 hours, and generally achieved an average rate
extraction of 55% Au and 78% Ag recoveries (see Table 13.6).
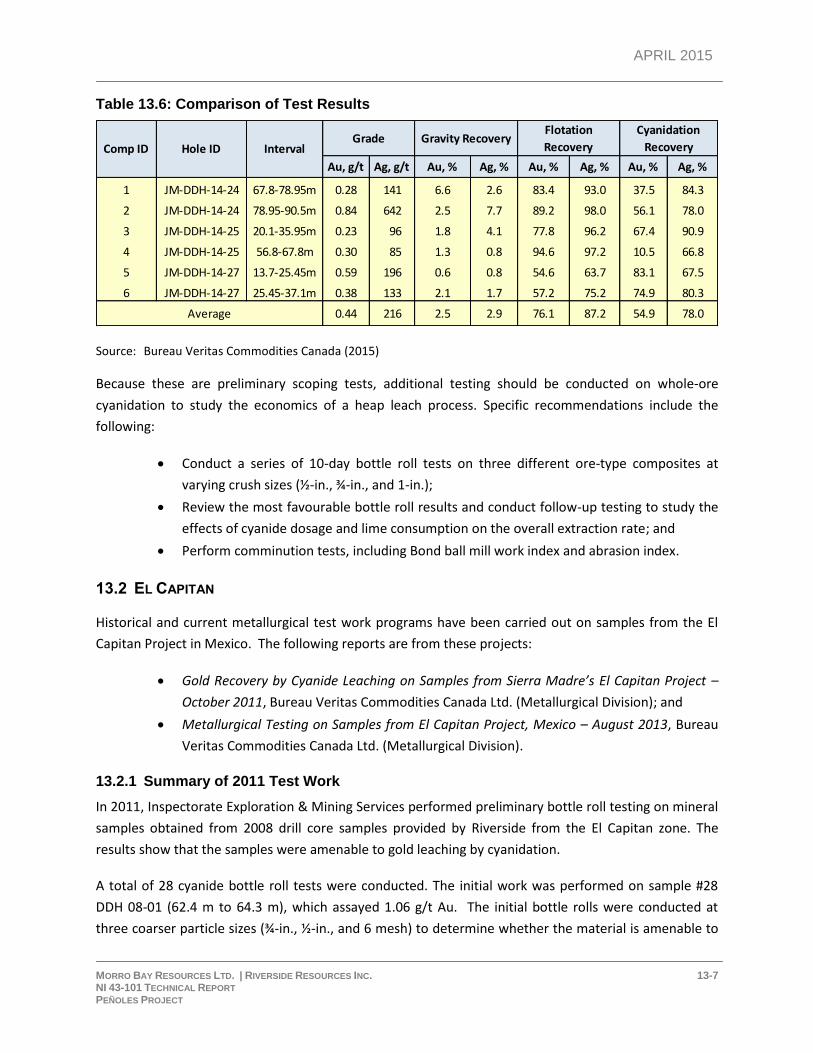
APRIL 2015
MORRO BAY RESOURCES LTD. | RIVERSIDE RESOURCES INC. 13-7 NI 43-101 TECHNICAL REPORT PEÑOLES PROJECT
Table 13.6: Comparison of Test Results
Source: Bureau Veritas Commodities Canada (2015)
Because these are preliminary scoping tests, additional testing should be conducted on whole-ore
cyanidation to study the economics of a heap leach process. Specific recommendations include the
following:
Conduct a series of 10-day bottle roll tests on three different ore-type composites at
varying crush sizes (½-in., ¾-in., and 1-in.);
Review the most favourable bottle roll results and conduct follow-up testing to study the
effects of cyanide dosage and lime consumption on the overall extraction rate; and
Perform comminution tests, including Bond ball mill work index and abrasion index.
13.2 EL CAPITAN
Historical and current metallurgical test work programs have been carried out on samples from the El
Capitan Project in Mexico. The following reports are from these projects:
Gold Recovery by Cyanide Leaching on Samples from Sierra Madre’s El Capitan Project –
October 2011, Bureau Veritas Commodities Canada Ltd. (Metallurgical Division); and
Metallurgical Testing on Samples from El Capitan Project, Mexico – August 2013, Bureau
Veritas Commodities Canada Ltd. (Metallurgical Division).
13.2.1 Summary of 2011 Test Work
In 2011, Inspectorate Exploration & Mining Services performed preliminary bottle roll testing on mineral
samples obtained from 2008 drill core samples provided by Riverside from the El Capitan zone. The
results show that the samples were amenable to gold leaching by cyanidation.
A total of 28 cyanide bottle roll tests were conducted. The initial work was performed on sample #28
DDH 08-01 (62.4 m to 64.3 m), which assayed 1.06 g/t Au. The initial bottle rolls were conducted at
three coarser particle sizes (¾-in., ½-in., and 6 mesh) to determine whether the material is amenable to
Au, g/t Ag, g/t Au, % Ag, % Au, % Ag, % Au, % Ag, %
1 JM-DDH-14-24 67.8-78.95m 0.28 141 6.6 2.6 83.4 93.0 37.5 84.3
2 JM-DDH-14-24 78.95-90.5m 0.84 642 2.5 7.7 89.2 98.0 56.1 78.0
3 JM-DDH-14-25 20.1-35.95m 0.23 96 1.8 4.1 77.8 96.2 67.4 90.9
4 JM-DDH-14-25 56.8-67.8m 0.30 85 1.3 0.8 94.6 97.2 10.5 66.8
5 JM-DDH-14-27 13.7-25.45m 0.59 196 0.6 0.8 54.6 63.7 83.1 67.5
6 JM-DDH-14-27 25.45-37.1m 0.38 133 2.1 1.7 57.2 75.2 74.9 80.3
0.44 216 2.5 2.9 76.1 87.2 54.9 78.0
Cyanidation
RecoveryHole ID Interval
Average
GradeComp ID
Gravity RecoveryFlotation
Recovery
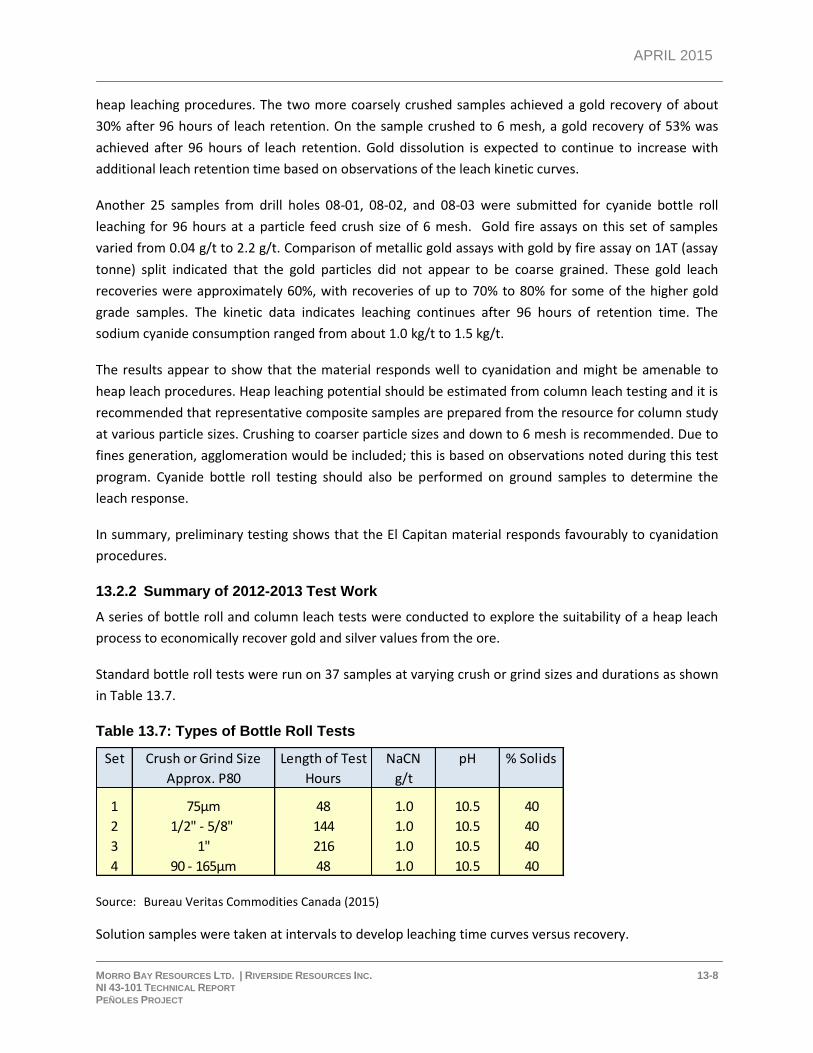
APRIL 2015
MORRO BAY RESOURCES LTD. | RIVERSIDE RESOURCES INC. 13-8 NI 43-101 TECHNICAL REPORT PEÑOLES PROJECT
heap leaching procedures. The two more coarsely crushed samples achieved a gold recovery of about
30% after 96 hours of leach retention. On the sample crushed to 6 mesh, a gold recovery of 53% was
achieved after 96 hours of leach retention. Gold dissolution is expected to continue to increase with
additional leach retention time based on observations of the leach kinetic curves.
Another 25 samples from drill holes 08-01, 08-02, and 08-03 were submitted for cyanide bottle roll
leaching for 96 hours at a particle feed crush size of 6 mesh. Gold fire assays on this set of samples
varied from 0.04 g/t to 2.2 g/t. Comparison of metallic gold assays with gold by fire assay on 1AT (assay
tonne) split indicated that the gold particles did not appear to be coarse grained. These gold leach
recoveries were approximately 60%, with recoveries of up to 70% to 80% for some of the higher gold
grade samples. The kinetic data indicates leaching continues after 96 hours of retention time. The
sodium cyanide consumption ranged from about 1.0 kg/t to 1.5 kg/t.
The results appear to show that the material responds well to cyanidation and might be amenable to
heap leach procedures. Heap leaching potential should be estimated from column leach testing and it is
recommended that representative composite samples are prepared from the resource for column study
at various particle sizes. Crushing to coarser particle sizes and down to 6 mesh is recommended. Due to
fines generation, agglomeration would be included; this is based on observations noted during this test
program. Cyanide bottle roll testing should also be performed on ground samples to determine the
leach response.
In summary, preliminary testing shows that the El Capitan material responds favourably to cyanidation
procedures.
13.2.2 Summary of 2012-2013 Test Work
A series of bottle roll and column leach tests were conducted to explore the suitability of a heap leach
process to economically recover gold and silver values from the ore.
Standard bottle roll tests were run on 37 samples at varying crush or grind sizes and durations as shown
in Table 13.7.
Table 13.7: Types of Bottle Roll Tests
Source: Bureau Veritas Commodities Canada (2015)
Solution samples were taken at intervals to develop leaching time curves versus recovery.
Set Crush or Grind Size Length of Test NaCN pH % Solids
Approx. P80 Hours g/t
1 75µm 48 1.0 10.5 40
2 1/2" - 5/8" 144 1.0 10.5 40
3 1" 216 1.0 10.5 40
4 90 - 165µm 48 1.0 10.5 40
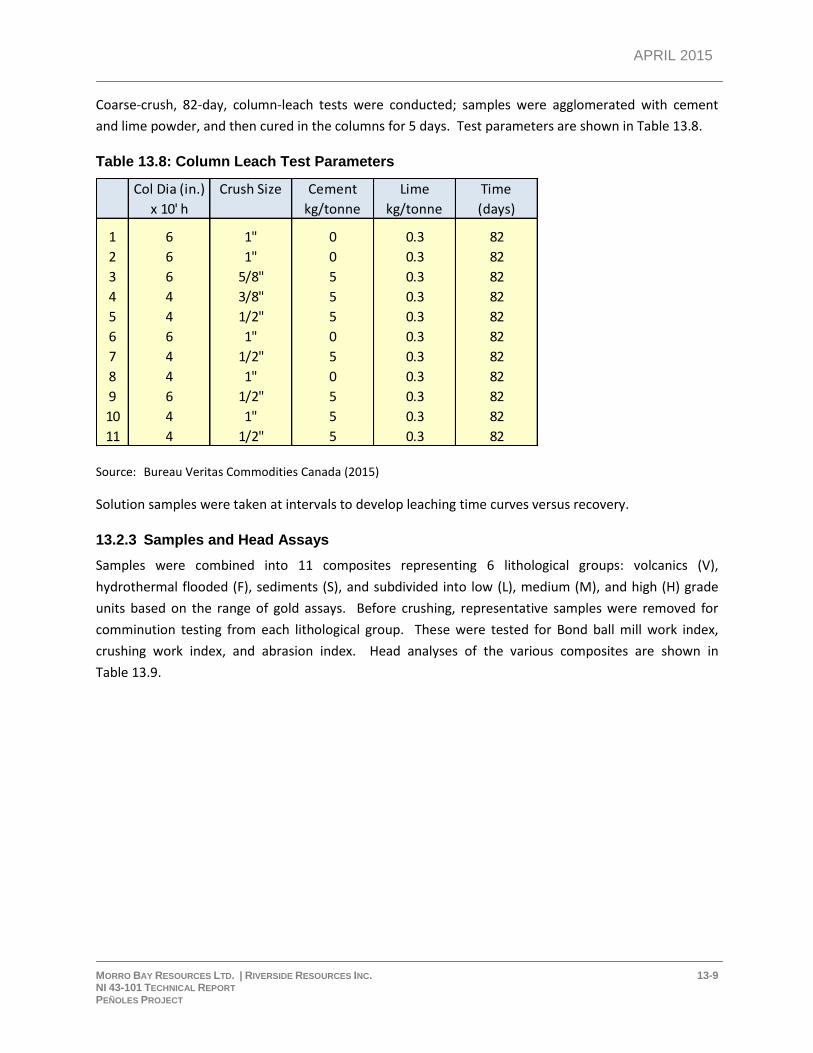
APRIL 2015
MORRO BAY RESOURCES LTD. | RIVERSIDE RESOURCES INC. 13-9 NI 43-101 TECHNICAL REPORT PEÑOLES PROJECT
Coarse-crush, 82-day, column-leach tests were conducted; samples were agglomerated with cement
and lime powder, and then cured in the columns for 5 days. Test parameters are shown in Table 13.8.
Table 13.8: Column Leach Test Parameters
Source: Bureau Veritas Commodities Canada (2015)
Solution samples were taken at intervals to develop leaching time curves versus recovery.
13.2.3 Samples and Head Assays
Samples were combined into 11 composites representing 6 lithological groups: volcanics (V),
hydrothermal flooded (F), sediments (S), and subdivided into low (L), medium (M), and high (H) grade
units based on the range of gold assays. Before crushing, representative samples were removed for
comminution testing from each lithological group. These were tested for Bond ball mill work index,
crushing work index, and abrasion index. Head analyses of the various composites are shown in
Table 13.9.
Col Dia (in.) Crush Size Cement Lime Time
x 10' h kg/tonne kg/tonne (days)
1 6 1" 0 0.3 82
2 6 1" 0 0.3 82
3 6 5/8" 5 0.3 82
4 4 3/8" 5 0.3 82
5 4 1/2" 5 0.3 82
6 6 1" 0 0.3 82
7 4 1/2" 5 0.3 82
8 4 1" 0 0.3 82
9 6 1/2" 5 0.3 82
10 4 1" 5 0.3 82
11 4 1/2" 5 0.3 82
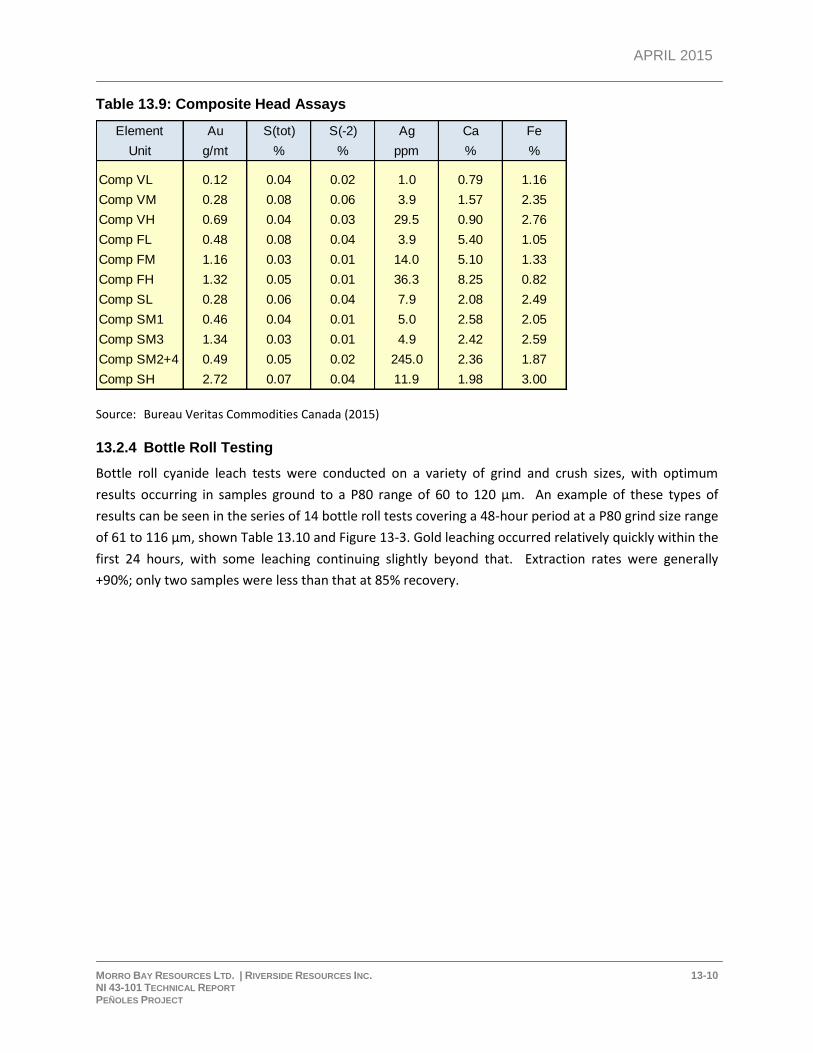
APRIL 2015
MORRO BAY RESOURCES LTD. | RIVERSIDE RESOURCES INC. 13-10 NI 43-101 TECHNICAL REPORT PEÑOLES PROJECT
Table 13.9: Composite Head Assays
Source: Bureau Veritas Commodities Canada (2015)
13.2.4 Bottle Roll Testing
Bottle roll cyanide leach tests were conducted on a variety of grind and crush sizes, with optimum
results occurring in samples ground to a P80 range of 60 to 120 μm. An example of these types of
results can be seen in the series of 14 bottle roll tests covering a 48-hour period at a P80 grind size range
of 61 to 116 μm, shown Table 13.10 and Figure 13-3. Gold leaching occurred relatively quickly within the
first 24 hours, with some leaching continuing slightly beyond that. Extraction rates were generally
+90%; only two samples were less than that at 85% recovery.
Element Au S(tot) S(-2) Ag Ca Fe
Unit g/mt % % ppm % %
Comp VL 0.12 0.04 0.02 1.0 0.79 1.16
Comp VM 0.28 0.08 0.06 3.9 1.57 2.35
Comp VH 0.69 0.04 0.03 29.5 0.90 2.76
Comp FL 0.48 0.08 0.04 3.9 5.40 1.05
Comp FM 1.16 0.03 0.01 14.0 5.10 1.33
Comp FH 1.32 0.05 0.01 36.3 8.25 0.82
Comp SL 0.28 0.06 0.04 7.9 2.08 2.49
Comp SM1 0.46 0.04 0.01 5.0 2.58 2.05
Comp SM3 1.34 0.03 0.01 4.9 2.42 2.59
Comp SM2+4 0.49 0.05 0.02 245.0 2.36 1.87
Comp SH 2.72 0.07 0.04 11.9 1.98 3.00
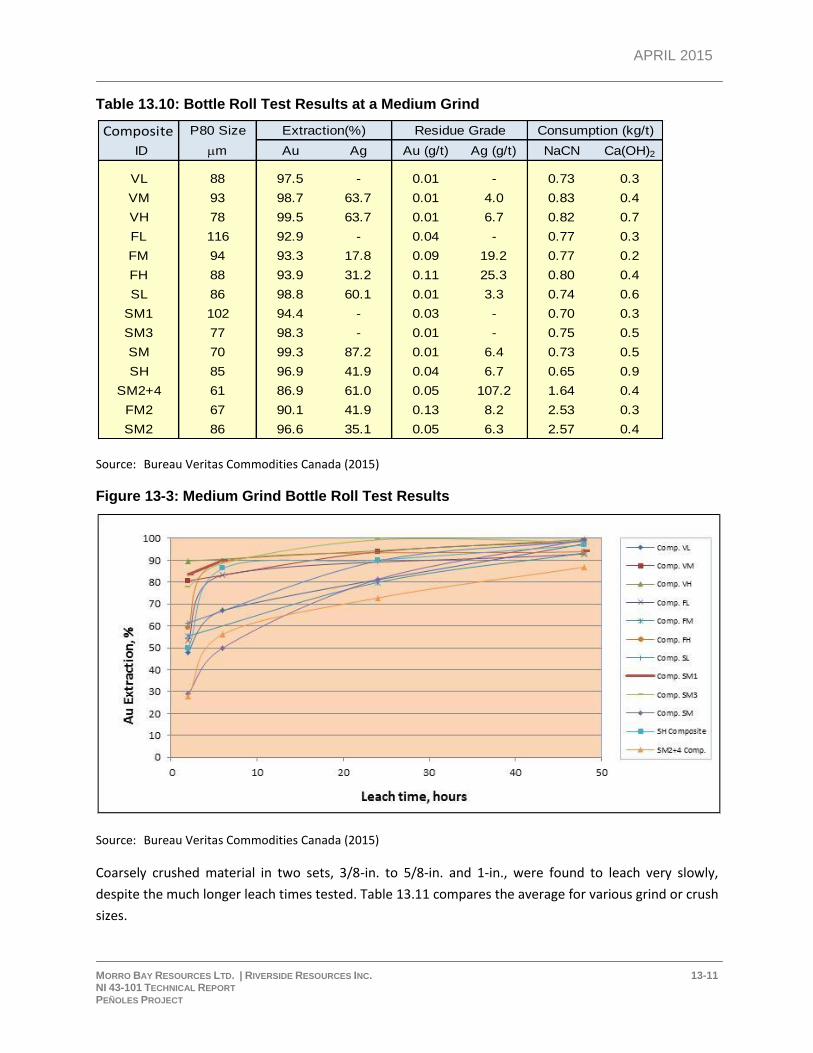
APRIL 2015
MORRO BAY RESOURCES LTD. | RIVERSIDE RESOURCES INC. 13-11 NI 43-101 TECHNICAL REPORT PEÑOLES PROJECT
Table 13.10: Bottle Roll Test Results at a Medium Grind
Source: Bureau Veritas Commodities Canada (2015)
Figure 13-3: Medium Grind Bottle Roll Test Results
Source: Bureau Veritas Commodities Canada (2015)
Coarsely crushed material in two sets, 3/8-in. to 5/8-in. and 1-in., were found to leach very slowly,
despite the much longer leach times tested. Table 13.11 compares the average for various grind or crush
sizes.
Composite P80 Size
ID mm Au Ag Au (g/t) Ag (g/t) NaCN Ca(OH)2
VL 88 97.5 - 0.01 - 0.73 0.3
VM 93 98.7 63.7 0.01 4.0 0.83 0.4
VH 78 99.5 63.7 0.01 6.7 0.82 0.7
FL 116 92.9 - 0.04 - 0.77 0.3
FM 94 93.3 17.8 0.09 19.2 0.77 0.2
FH 88 93.9 31.2 0.11 25.3 0.80 0.4
SL 86 98.8 60.1 0.01 3.3 0.74 0.6
SM1 102 94.4 - 0.03 - 0.70 0.3
SM3 77 98.3 - 0.01 - 0.75 0.5
SM 70 99.3 87.2 0.01 6.4 0.73 0.5
SH 85 96.9 41.9 0.04 6.7 0.65 0.9
SM2+4 61 86.9 61.0 0.05 107.2 1.64 0.4
FM2 67 90.1 41.9 0.13 8.2 2.53 0.3
SM2 86 96.6 35.1 0.05 6.3 2.57 0.4
Extraction(%) Residue Grade Consumption (kg/t)
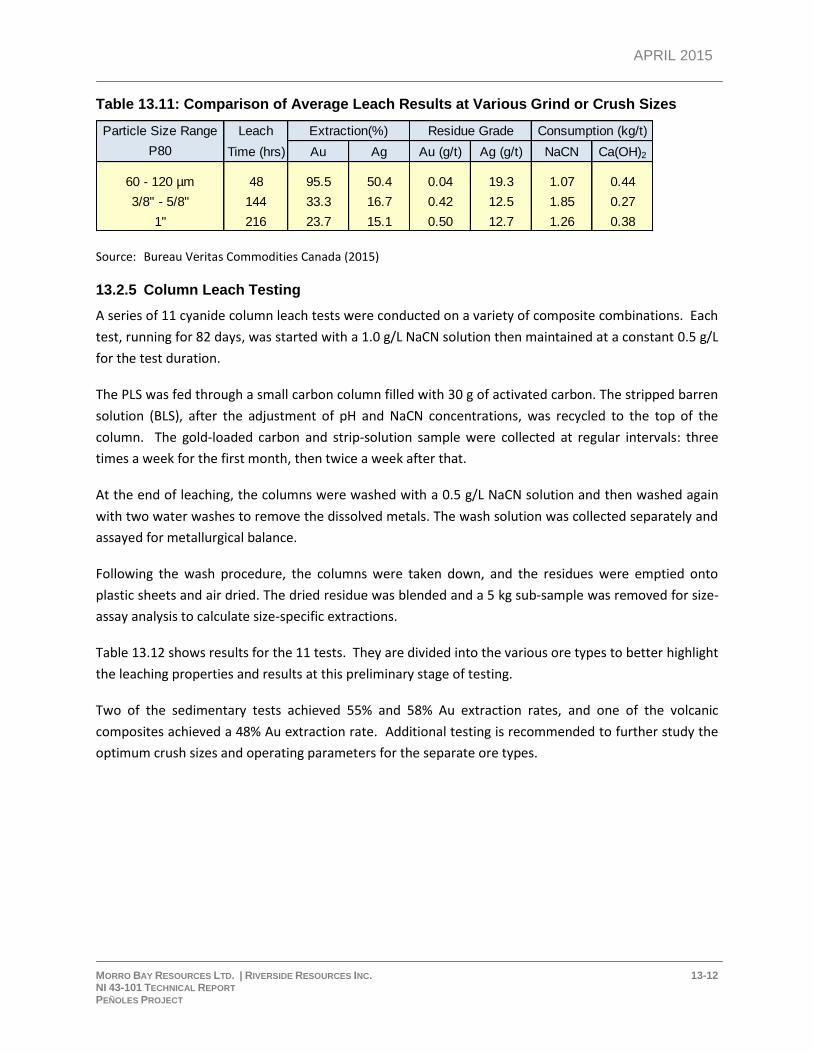
APRIL 2015
MORRO BAY RESOURCES LTD. | RIVERSIDE RESOURCES INC. 13-12 NI 43-101 TECHNICAL REPORT PEÑOLES PROJECT
Table 13.11: Comparison of Average Leach Results at Various Grind or Crush Sizes
Source: Bureau Veritas Commodities Canada (2015)
13.2.5 Column Leach Testing
A series of 11 cyanide column leach tests were conducted on a variety of composite combinations. Each
test, running for 82 days, was started with a 1.0 g/L NaCN solution then maintained at a constant 0.5 g/L
for the test duration.
The PLS was fed through a small carbon column filled with 30 g of activated carbon. The stripped barren
solution (BLS), after the adjustment of pH and NaCN concentrations, was recycled to the top of the
column. The gold-loaded carbon and strip-solution sample were collected at regular intervals: three
times a week for the first month, then twice a week after that.
At the end of leaching, the columns were washed with a 0.5 g/L NaCN solution and then washed again
with two water washes to remove the dissolved metals. The wash solution was collected separately and
assayed for metallurgical balance.
Following the wash procedure, the columns were taken down, and the residues were emptied onto
plastic sheets and air dried. The dried residue was blended and a 5 kg sub-sample was removed for size-
assay analysis to calculate size-specific extractions.
Table 13.12 shows results for the 11 tests. They are divided into the various ore types to better highlight
the leaching properties and results at this preliminary stage of testing.
Two of the sedimentary tests achieved 55% and 58% Au extraction rates, and one of the volcanic
composites achieved a 48% Au extraction rate. Additional testing is recommended to further study the
optimum crush sizes and operating parameters for the separate ore types.
Leach
Time (hrs) Au Ag Au (g/t) Ag (g/t) NaCN Ca(OH)2
48 95.5 50.4 0.04 19.3 1.07 0.44
144 33.3 16.7 0.42 12.5 1.85 0.27
216 23.7 15.1 0.50 12.7 1.26 0.38
Particle Size Range
P80
60 - 120 µm
3/8" - 5/8"
1"
Extraction(%) Residue Grade Consumption (kg/t)
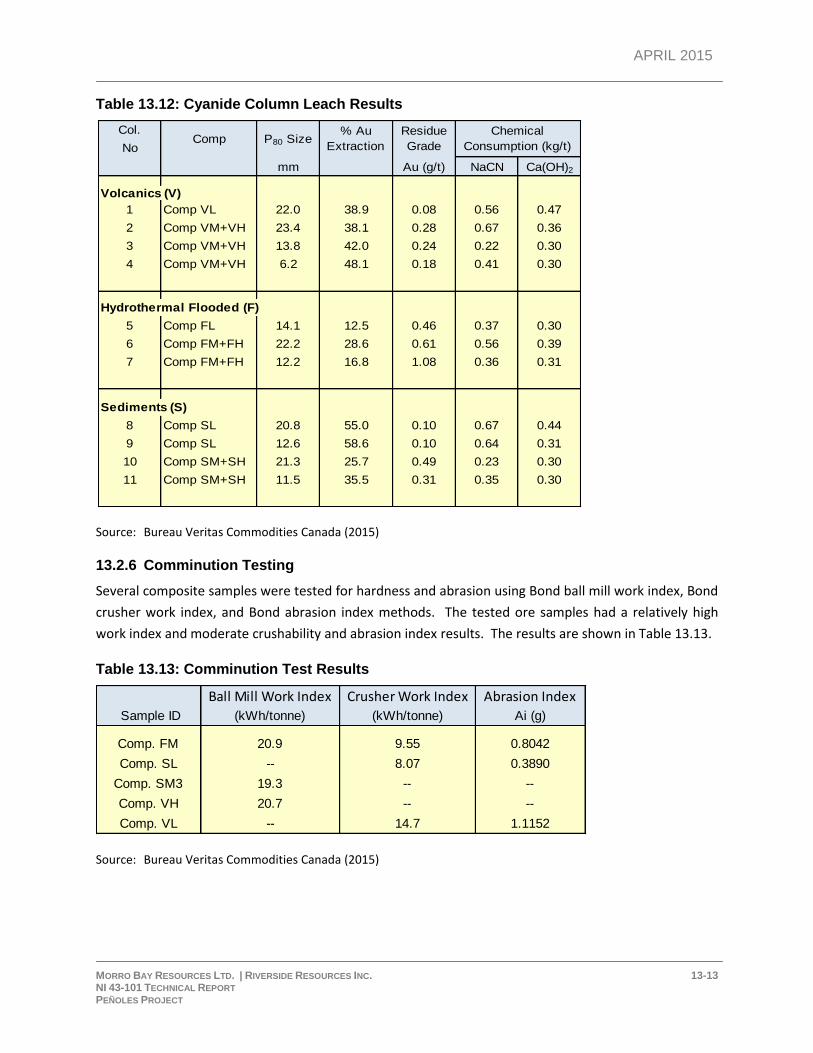
APRIL 2015
MORRO BAY RESOURCES LTD. | RIVERSIDE RESOURCES INC. 13-13 NI 43-101 TECHNICAL REPORT PEÑOLES PROJECT
Table 13.12: Cyanide Column Leach Results
Source: Bureau Veritas Commodities Canada (2015)
13.2.6 Comminution Testing
Several composite samples were tested for hardness and abrasion using Bond ball mill work index, Bond
crusher work index, and Bond abrasion index methods. The tested ore samples had a relatively high
work index and moderate crushability and abrasion index results. The results are shown in Table 13.13.
Table 13.13: Comminution Test Results
Source: Bureau Veritas Commodities Canada (2015)
Col.
No
mm Au (g/t) NaCN Ca(OH)2
Volcanics (V)
1 Comp VL 22.0 38.9 0.08 0.56 0.47
2 Comp VM+VH 23.4 38.1 0.28 0.67 0.36
3 Comp VM+VH 13.8 42.0 0.24 0.22 0.30
4 Comp VM+VH 6.2 48.1 0.18 0.41 0.30
Hydrothermal Flooded (F)
5 Comp FL 14.1 12.5 0.46 0.37 0.30
6 Comp FM+FH 22.2 28.6 0.61 0.56 0.39
7 Comp FM+FH 12.2 16.8 1.08 0.36 0.31
Sediments (S)
8 Comp SL 20.8 55.0 0.10 0.67 0.44
9 Comp SL 12.6 58.6 0.10 0.64 0.31
10 Comp SM+SH 21.3 25.7 0.49 0.23 0.30
11 Comp SM+SH 11.5 35.5 0.31 0.35 0.30
Comp P80 Size% Au
Extraction
Residue
Grade
Chemical
Consumption (kg/t)
Ball Mill Work Index Crusher Work Index Abrasion Index
Sample ID (kWh/tonne) (kWh/tonne) Ai (g)
Comp. FM 20.9 9.55 0.8042
Comp. SL -- 8.07 0.3890
Comp. SM3 19.3 -- --
Comp. VH 20.7 -- --
Comp. VL -- 14.7 1.1152
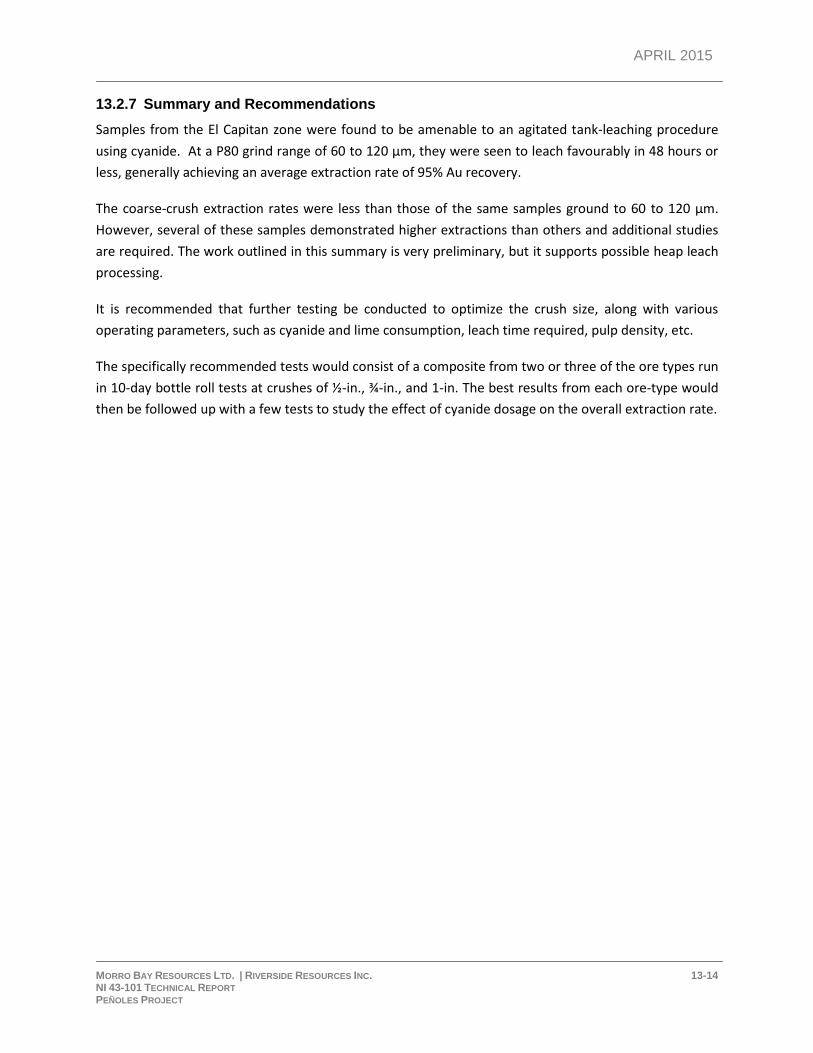
APRIL 2015
MORRO BAY RESOURCES LTD. | RIVERSIDE RESOURCES INC. 13-14 NI 43-101 TECHNICAL REPORT PEÑOLES PROJECT
13.2.7 Summary and Recommendations
Samples from the El Capitan zone were found to be amenable to an agitated tank-leaching procedure
using cyanide. At a P80 grind range of 60 to 120 μm, they were seen to leach favourably in 48 hours or
less, generally achieving an average extraction rate of 95% Au recovery.
The coarse-crush extraction rates were less than those of the same samples ground to 60 to 120 μm.
However, several of these samples demonstrated higher extractions than others and additional studies
are required. The work outlined in this summary is very preliminary, but it supports possible heap leach
processing.
It is recommended that further testing be conducted to optimize the crush size, along with various
operating parameters, such as cyanide and lime consumption, leach time required, pulp density, etc.
The specifically recommended tests would consist of a composite from two or three of the ore types run
in 10-day bottle roll tests at crushes of ½-in., ¾-in., and 1-in. The best results from each ore-type would
then be followed up with a few tests to study the effect of cyanide dosage on the overall extraction rate.
APRIL 2015
MORRO BAY RESOURCES LTD. | RIVERSIDE RESOURCES INC. 14-1 NI 43-101 TECHNICAL REPORT PEÑOLES PROJECT
14 MINERAL RESOURCE ESTIMATE
14.1 INTRODUCTION
This section describes the approach used to generate mineral resource estimates for the El Capitan and
Jesus Maria deposits. El Capitan is primarily a gold-bearing deposit with minor silver credits, and Jesus
Maria is a silver deposit with minor amounts of contained gold. The deposits are separated by
approximately 300 m and the mineralized zones are interpreted as merging together to the west. Due to
their close proximity, resources are generated using one block model, but, due to differences in the
nature of the mineralization, they remain essentially segregated during the development of the resource
model.
The mineral resource estimates were prepared under the direction of Robert Sim, P.Geo., with the
assistance of Bruce Davis, FAusIMM. Mr. Sim is the independent Qualified Person within the meaning of
NI 43-101 for the purposes of mineral resource estimates contained in this report. Estimates are made
from 3D block models based on geostatistical applications using commercial mine planning software
(MineSight® v9.50-01). The project limits are based in the UTM coordinate system using a nominal block
size of 10 m x 5 m x 10 m, with the shorter blocks roughly perpendicular to the east-southeast oriented
strike direction of the deposits. Diamond drilling was conducted from surface drill stations in the
hanging wall of the deposits. Holes are generally spaced at 40 m intervals to depths of between 150 m
and 200 m below surface.
The resource estimates have been generated from drill hole sample assay results, and limited surface
trend and drift channel samples, and the interpretation of a geologic model which relates to the spatial
distribution of gold and silver in the El Capitan and Jesus Maria deposits. Interpolation characteristics
have been defined based on the geology, drill hole spacing and geostatistical analysis of the data. The
resources were classified according to their proximity to the sample locations and are reported, as
required by NI 43-101, according to the CIM Definition Standards for Mineral Resources and Mineral
Reserves (May, 2014).
The mineral resource has been estimated in conformity with generally accepted CIM Estimation of
Mineral Resources and Mineral Reserves Best Practices Guidelines (November, 2003) and is reported in
accordance with the Canadian Securities Administrators’ (CSA) NI 43-101. Mineral resources are not
mineral reserves and they do not have demonstrated economic viability.
This report includes estimates for mineral resources only. Note: No mineral reserves were prepared or
reported.
14.2 AVAILABLE DATA
There are a total of 81 drill holes in the El Capitan/Jesus Maria database with a total core length of
10,265 m. Fifty holes were drilled to test the El Capitan target, and 30 holes were drilled on the Jesus
APRIL 2015
MORRO BAY RESOURCES LTD. | RIVERSIDE RESOURCES INC. 14-2 NI 43-101 TECHNICAL REPORT PEÑOLES PROJECT
Maria deposit. One drill hole was exploratory in nature, testing for satellite deposits, and did not
influence the resource model.
Drilling was conducted by the following operators as described in Section 10 Drilling:
2004 by Aurcana Corporation (4 holes)
2008 by Riverside Resources Inc. (5 holes)
2011, 2012, and 2013 by Sierra Madre Developments Inc. (49 holes)
2014 by Morro Bay Resource Ltd. (23 holes).
Also included in the database are chip-channel samples from Jesus Maria collected by Sierra Madre
Developments Inc. (Sierra Madre) from 20 cross-cutting surface trenches and 3 underground drift areas
(from historic production located 20–25 m below surface). The chip-channel data compares reasonably
well with proximal drill holes and it provides additional near-surface information on the nature of
mineralization at the Jesus Maria deposit. The location of the chip-channel data and the distribution of
drilling by vintage are shown in Figure 14-1. A comparison of the various drilling programs shows similar
results. Although the sample data collected during the 2004 and 2008 campaigns is not supported by
robust QA/QC programs, the older data is supported by proximal newer drilling and is considered
sufficient to validate this data for use in a resource estimate. Note: Only five holes drilled in 2004 and
2008 intersect the main mineralized zone at El Capitan and, therefore, contribute to the resource
estimation.
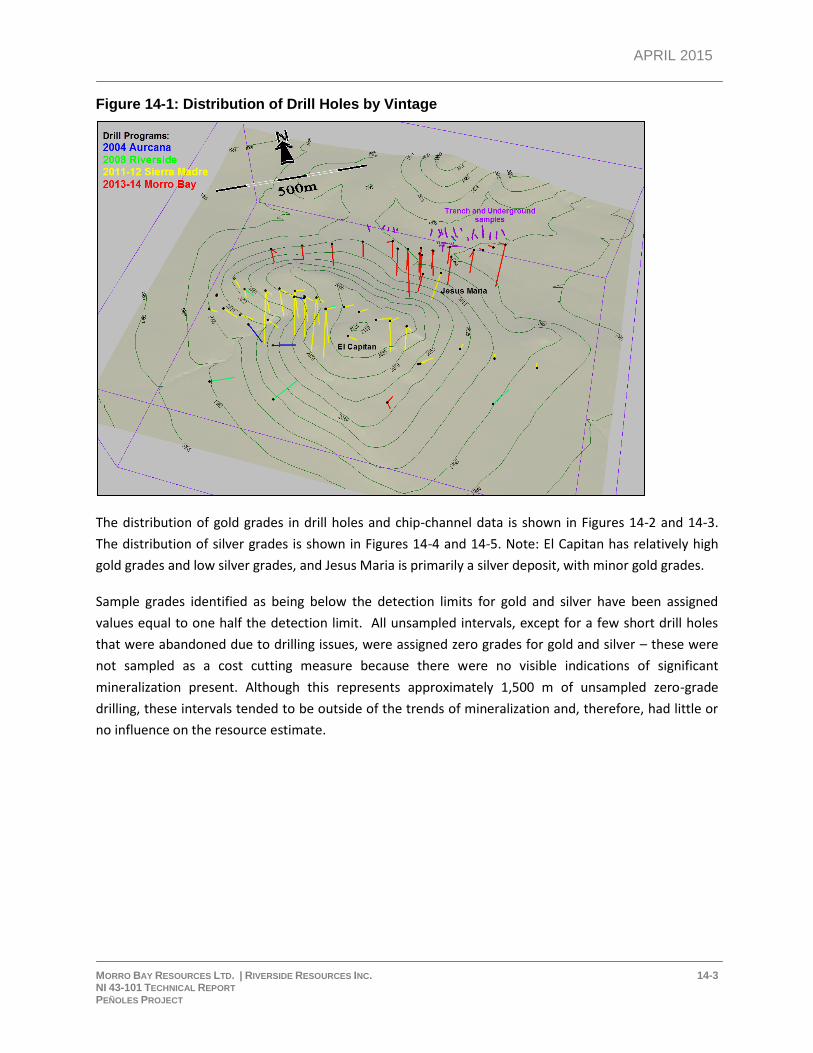
APRIL 2015
MORRO BAY RESOURCES LTD. | RIVERSIDE RESOURCES INC. 14-3 NI 43-101 TECHNICAL REPORT PEÑOLES PROJECT
Figure 14-1: Distribution of Drill Holes by Vintage
The distribution of gold grades in drill holes and chip-channel data is shown in Figures 14-2 and 14-3.
The distribution of silver grades is shown in Figures 14-4 and 14-5. Note: El Capitan has relatively high
gold grades and low silver grades, and Jesus Maria is primarily a silver deposit, with minor gold grades.
Sample grades identified as being below the detection limits for gold and silver have been assigned
values equal to one half the detection limit. All unsampled intervals, except for a few short drill holes
that were abandoned due to drilling issues, were assigned zero grades for gold and silver – these were
not sampled as a cost cutting measure because there were no visible indications of significant
mineralization present. Although this represents approximately 1,500 m of unsampled zero-grade
drilling, these intervals tended to be outside of the trends of mineralization and, therefore, had little or
no influence on the resource estimate.
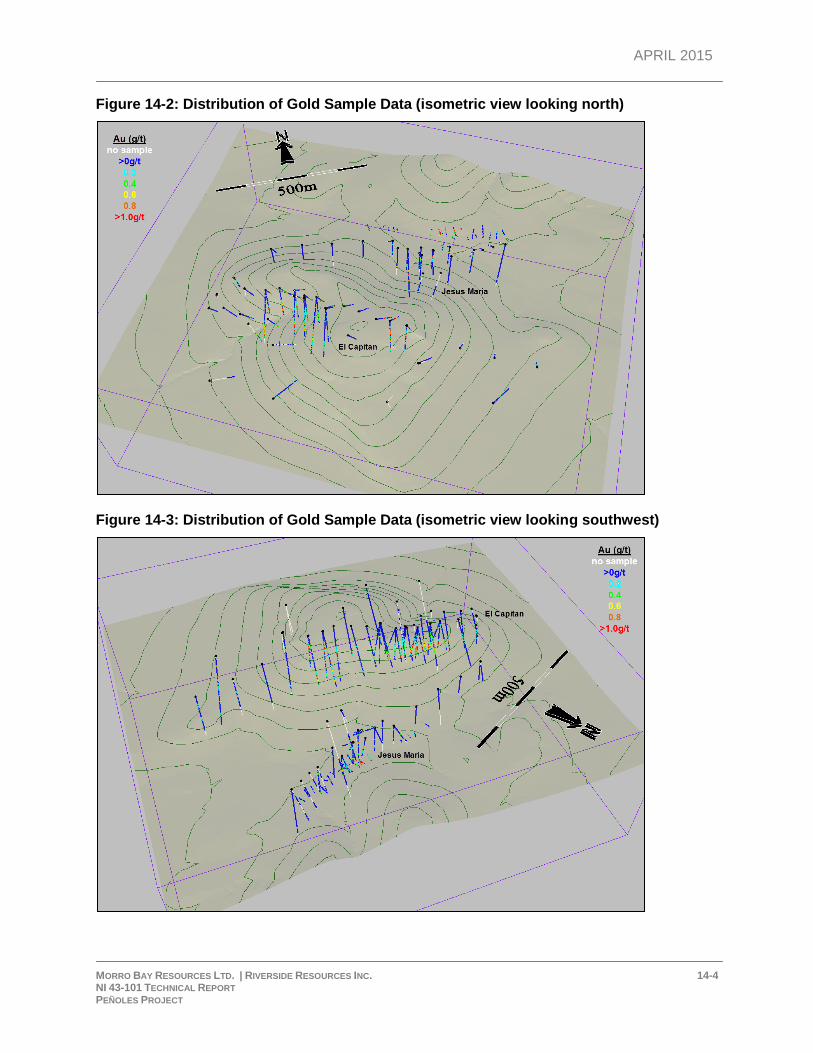
APRIL 2015
MORRO BAY RESOURCES LTD. | RIVERSIDE RESOURCES INC. 14-4 NI 43-101 TECHNICAL REPORT PEÑOLES PROJECT
Figure 14-2: Distribution of Gold Sample Data (isometric view looking north)
Figure 14-3: Distribution of Gold Sample Data (isometric view looking southwest)
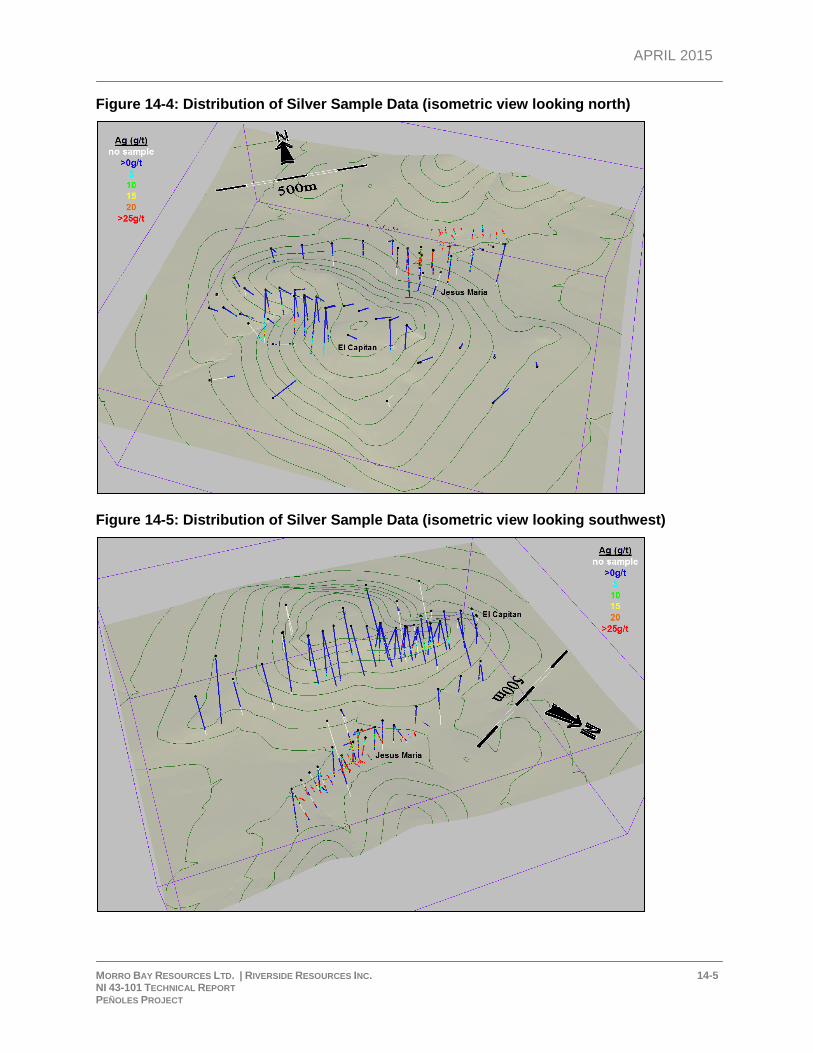
APRIL 2015
MORRO BAY RESOURCES LTD. | RIVERSIDE RESOURCES INC. 14-5 NI 43-101 TECHNICAL REPORT PEÑOLES PROJECT
Figure 14-4: Distribution of Silver Sample Data (isometric view looking north)
Figure 14-5: Distribution of Silver Sample Data (isometric view looking southwest)
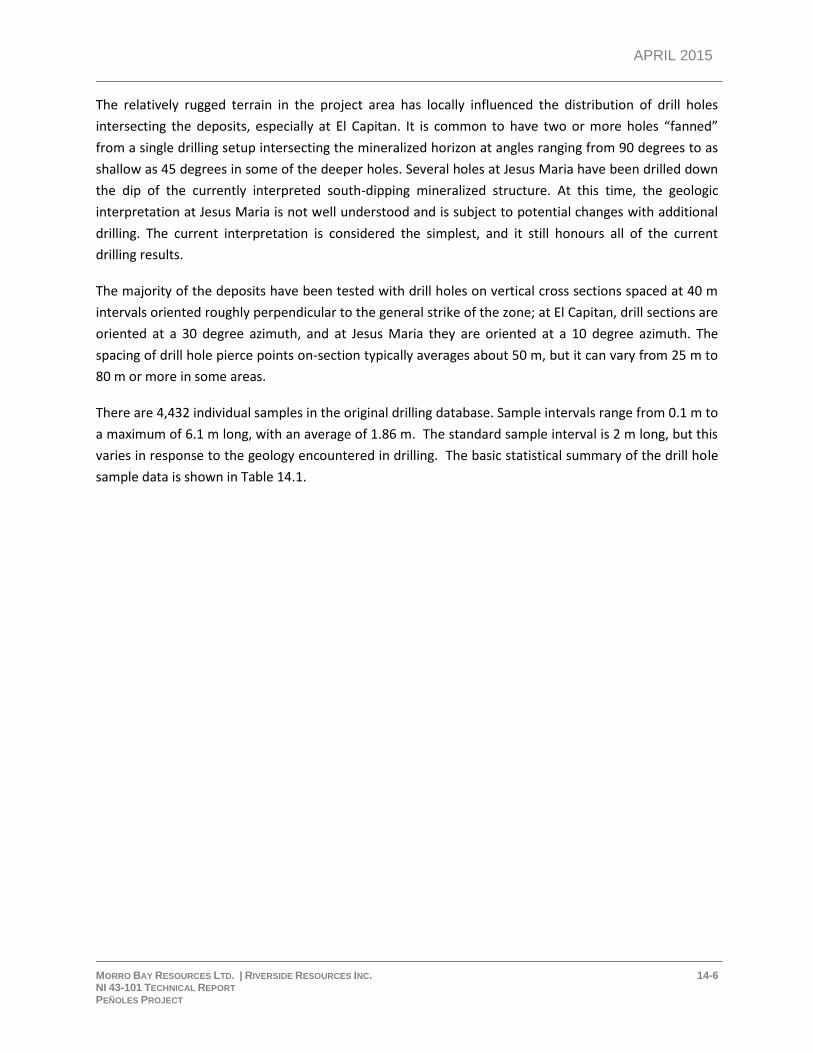
APRIL 2015
MORRO BAY RESOURCES LTD. | RIVERSIDE RESOURCES INC. 14-6 NI 43-101 TECHNICAL REPORT PEÑOLES PROJECT
The relatively rugged terrain in the project area has locally influenced the distribution of drill holes
intersecting the deposits, especially at El Capitan. It is common to have two or more holes “fanned”
from a single drilling setup intersecting the mineralized horizon at angles ranging from 90 degrees to as
shallow as 45 degrees in some of the deeper holes. Several holes at Jesus Maria have been drilled down
the dip of the currently interpreted south-dipping mineralized structure. At this time, the geologic
interpretation at Jesus Maria is not well understood and is subject to potential changes with additional
drilling. The current interpretation is considered the simplest, and it still honours all of the current
drilling results.
The majority of the deposits have been tested with drill holes on vertical cross sections spaced at 40 m
intervals oriented roughly perpendicular to the general strike of the zone; at El Capitan, drill sections are
oriented at a 30 degree azimuth, and at Jesus Maria they are oriented at a 10 degree azimuth. The
spacing of drill hole pierce points on-section typically averages about 50 m, but it can vary from 25 m to
80 m or more in some areas.
There are 4,432 individual samples in the original drilling database. Sample intervals range from 0.1 m to
a maximum of 6.1 m long, with an average of 1.86 m. The standard sample interval is 2 m long, but this
varies in response to the geology encountered in drilling. The basic statistical summary of the drill hole
sample data is shown in Table 14.1.
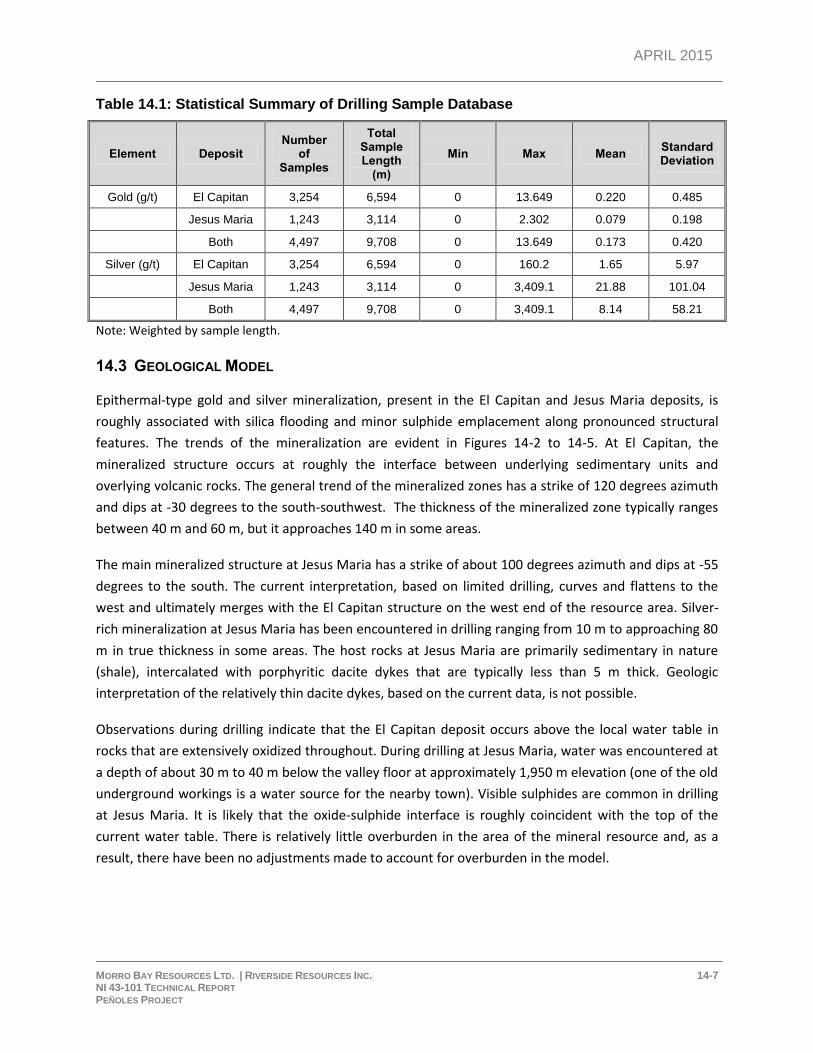
APRIL 2015
MORRO BAY RESOURCES LTD. | RIVERSIDE RESOURCES INC. 14-7 NI 43-101 TECHNICAL REPORT PEÑOLES PROJECT
Table 14.1: Statistical Summary of Drilling Sample Database
Element Deposit Number
of Samples
Total Sample Length
(m)
Min Max Mean Standard Deviation
Gold (g/t) El Capitan 3,254 6,594 0 13.649 0.220 0.485
Jesus Maria 1,243 3,114 0 2.302 0.079 0.198
Both 4,497 9,708 0 13.649 0.173 0.420
Silver (g/t) El Capitan 3,254 6,594 0 160.2 1.65 5.97
Jesus Maria 1,243 3,114 0 3,409.1 21.88 101.04
Both 4,497 9,708 0 3,409.1 8.14 58.21
Note: Weighted by sample length.
14.3 GEOLOGICAL MODEL
Epithermal-type gold and silver mineralization, present in the El Capitan and Jesus Maria deposits, is
roughly associated with silica flooding and minor sulphide emplacement along pronounced structural
features. The trends of the mineralization are evident in Figures 14-2 to 14-5. At El Capitan, the
mineralized structure occurs at roughly the interface between underlying sedimentary units and
overlying volcanic rocks. The general trend of the mineralized zones has a strike of 120 degrees azimuth
and dips at -30 degrees to the south-southwest. The thickness of the mineralized zone typically ranges
between 40 m and 60 m, but it approaches 140 m in some areas.
The main mineralized structure at Jesus Maria has a strike of about 100 degrees azimuth and dips at -55
degrees to the south. The current interpretation, based on limited drilling, curves and flattens to the
west and ultimately merges with the El Capitan structure on the west end of the resource area. Silver-
rich mineralization at Jesus Maria has been encountered in drilling ranging from 10 m to approaching 80
m in true thickness in some areas. The host rocks at Jesus Maria are primarily sedimentary in nature
(shale), intercalated with porphyritic dacite dykes that are typically less than 5 m thick. Geologic
interpretation of the relatively thin dacite dykes, based on the current data, is not possible.
Observations during drilling indicate that the El Capitan deposit occurs above the local water table in
rocks that are extensively oxidized throughout. During drilling at Jesus Maria, water was encountered at
a depth of about 30 m to 40 m below the valley floor at approximately 1,950 m elevation (one of the old
underground workings is a water source for the nearby town). Visible sulphides are common in drilling
at Jesus Maria. It is likely that the oxide-sulphide interface is roughly coincident with the top of the
current water table. There is relatively little overburden in the area of the mineral resource and, as a
result, there have been no adjustments made to account for overburden in the model.
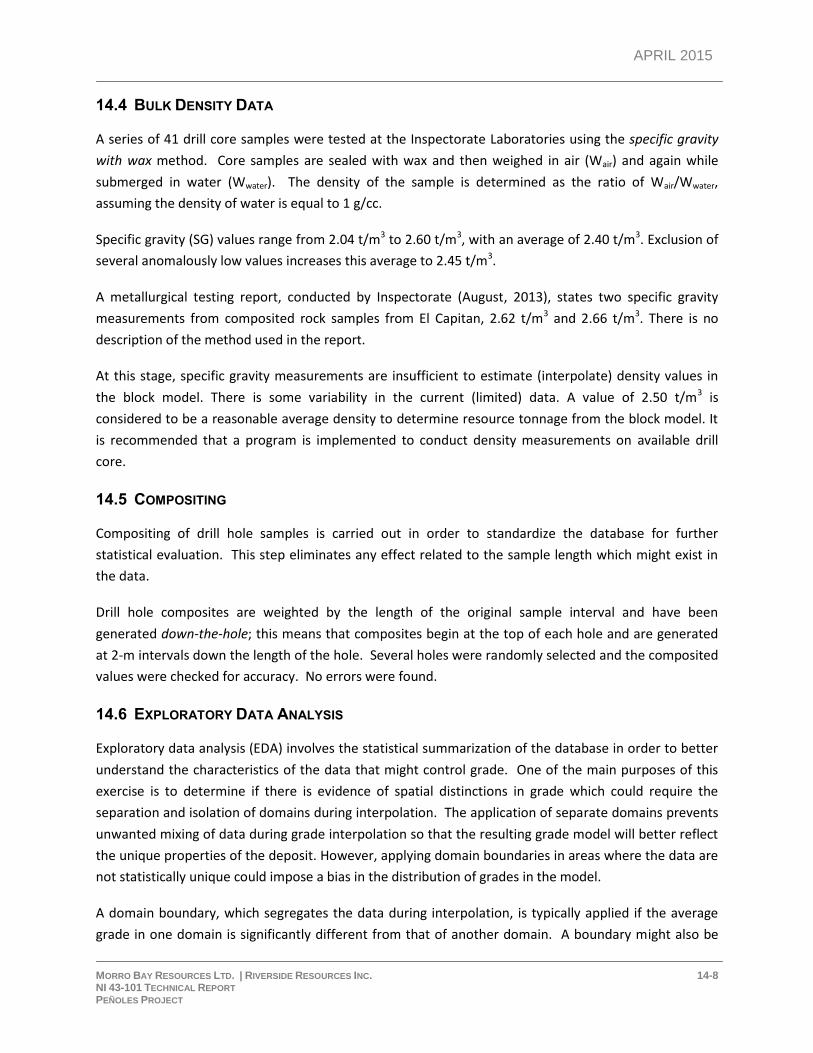
APRIL 2015
MORRO BAY RESOURCES LTD. | RIVERSIDE RESOURCES INC. 14-8 NI 43-101 TECHNICAL REPORT PEÑOLES PROJECT
14.4 BULK DENSITY DATA
A series of 41 drill core samples were tested at the Inspectorate Laboratories using the specific gravity
with wax method. Core samples are sealed with wax and then weighed in air (Wair) and again while
submerged in water (Wwater). The density of the sample is determined as the ratio of Wair/Wwater,
assuming the density of water is equal to 1 g/cc.
Specific gravity (SG) values range from 2.04 t/m3 to 2.60 t/m3, with an average of 2.40 t/m3. Exclusion of
several anomalously low values increases this average to 2.45 t/m3.
A metallurgical testing report, conducted by Inspectorate (August, 2013), states two specific gravity
measurements from composited rock samples from El Capitan, 2.62 t/m3 and 2.66 t/m3. There is no
description of the method used in the report.
At this stage, specific gravity measurements are insufficient to estimate (interpolate) density values in
the block model. There is some variability in the current (limited) data. A value of 2.50 t/m3 is
considered to be a reasonable average density to determine resource tonnage from the block model. It
is recommended that a program is implemented to conduct density measurements on available drill
core.
14.5 COMPOSITING
Compositing of drill hole samples is carried out in order to standardize the database for further
statistical evaluation. This step eliminates any effect related to the sample length which might exist in
the data.
Drill hole composites are weighted by the length of the original sample interval and have been
generated down-the-hole; this means that composites begin at the top of each hole and are generated
at 2-m intervals down the length of the hole. Several holes were randomly selected and the composited
values were checked for accuracy. No errors were found.
14.6 EXPLORATORY DATA ANALYSIS
Exploratory data analysis (EDA) involves the statistical summarization of the database in order to better
understand the characteristics of the data that might control grade. One of the main purposes of this
exercise is to determine if there is evidence of spatial distinctions in grade which could require the
separation and isolation of domains during interpolation. The application of separate domains prevents
unwanted mixing of data during grade interpolation so that the resulting grade model will better reflect
the unique properties of the deposit. However, applying domain boundaries in areas where the data are
not statistically unique could impose a bias in the distribution of grades in the model.
A domain boundary, which segregates the data during interpolation, is typically applied if the average
grade in one domain is significantly different from that of another domain. A boundary might also be
APRIL 2015
MORRO BAY RESOURCES LTD. | RIVERSIDE RESOURCES INC. 14-9 NI 43-101 TECHNICAL REPORT PEÑOLES PROJECT
applied where there is evidence that a significant change in the grade distribution exists across a
geologic contact.
14.6.1 Basic Statistics by Domain
As stated previously, mineralization at El Capitan generally occurs at the interface between an upper
volcanic sequence and a lower sedimentary package of rocks. The basic statistics for the distribution of
gold by lithologic type is shown in a boxplot in Figure 14-6. Note: the original lithologic types have been
broken into five types: mineralized volcanic, unmineralized volcanic, “main silicified breccia” zone,
mineralized sediments and unmineralized sediments. Gold grades tend to be highest in the silicified
breccia zone, but there is significant overlap between this and the mineralized volcanic and sediments.
Figure 14-6: Boxplot of Gold by Lithologic Type at El Capitan
At Jesus Maria, approximately 15% of the rocks intersected in drilling consist of dacite porphyry and the
remaining rocks are sedimentary in nature. The dacite dykes are mineralized, but they tend to contain,
on average, slightly lower grades compared to the sedimentary rocks.
14.6.2 Contact Profiles
Contact profiles evaluate the nature of grade trends between two domains: they graphically display the
average grades at increasing distances from the contact boundary. Those contact profiles that show a
marked difference in grade across a domain boundary indicate that the two datasets should be isolated
during interpolation. Conversely, if a more gradual change in grade occurs across a contact, the
APRIL 2015
MORRO BAY RESOURCES LTD. | RIVERSIDE RESOURCES INC. 14-10 NI 43-101 TECHNICAL REPORT PEÑOLES PROJECT
introduction of a hard boundary (e.g., segregation during interpolation) might result in a much different
trend in the grade model; in this case, the change in grade between domains in the model is often more
abrupt than the trends seen in the raw data. Finally, a flat contact profile indicates no grade changes
across the boundary; in this case, hard or soft domain boundaries will produce similar results in the
model.
A series of contact profiles were generated to evaluate the nature of gold across the lithologic types at
El Capitan. The two examples shown in Figures 14-7 and 14-8 show some moderate differences in grade
between the silicified breccia zone versus the surrounding mineralized volcanic and sediments. The gold
grades tend to build up close to the contact and are more transitional rather than abrupt.
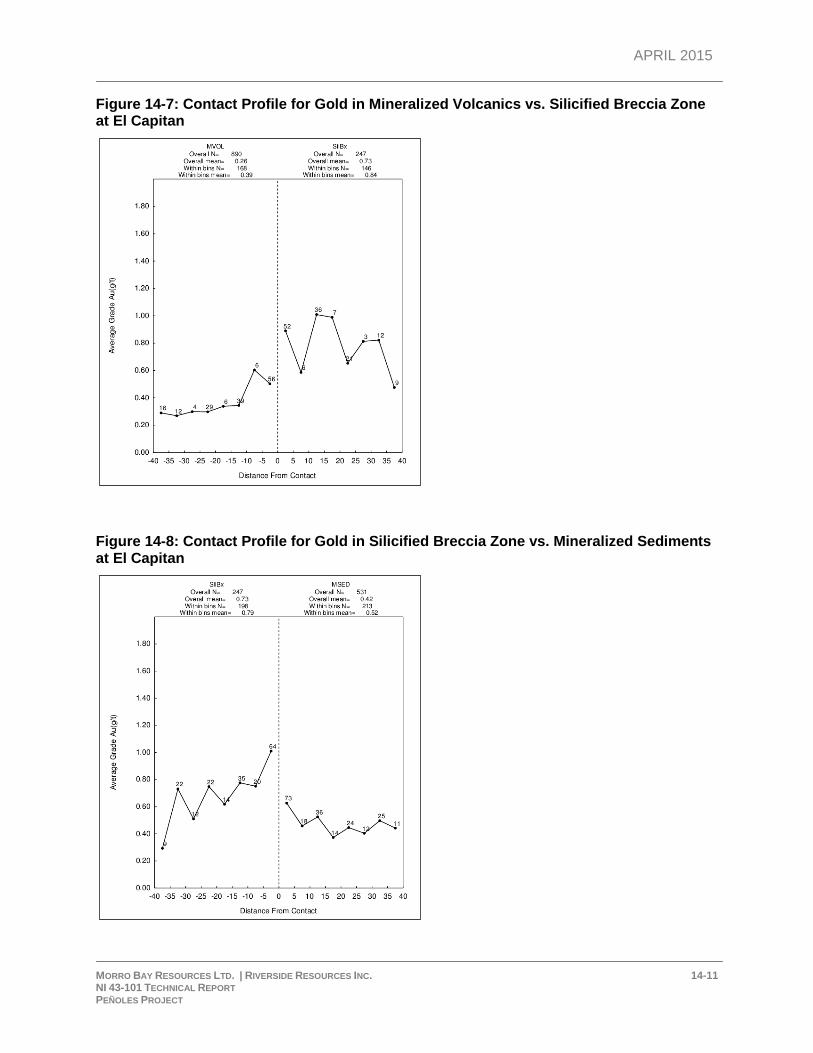
APRIL 2015
MORRO BAY RESOURCES LTD. | RIVERSIDE RESOURCES INC. 14-11 NI 43-101 TECHNICAL REPORT PEÑOLES PROJECT
Figure 14-7: Contact Profile for Gold in Mineralized Volcanics vs. Silicified Breccia Zone at El Capitan
Figure 14-8: Contact Profile for Gold in Silicified Breccia Zone vs. Mineralized Sediments at El Capitan
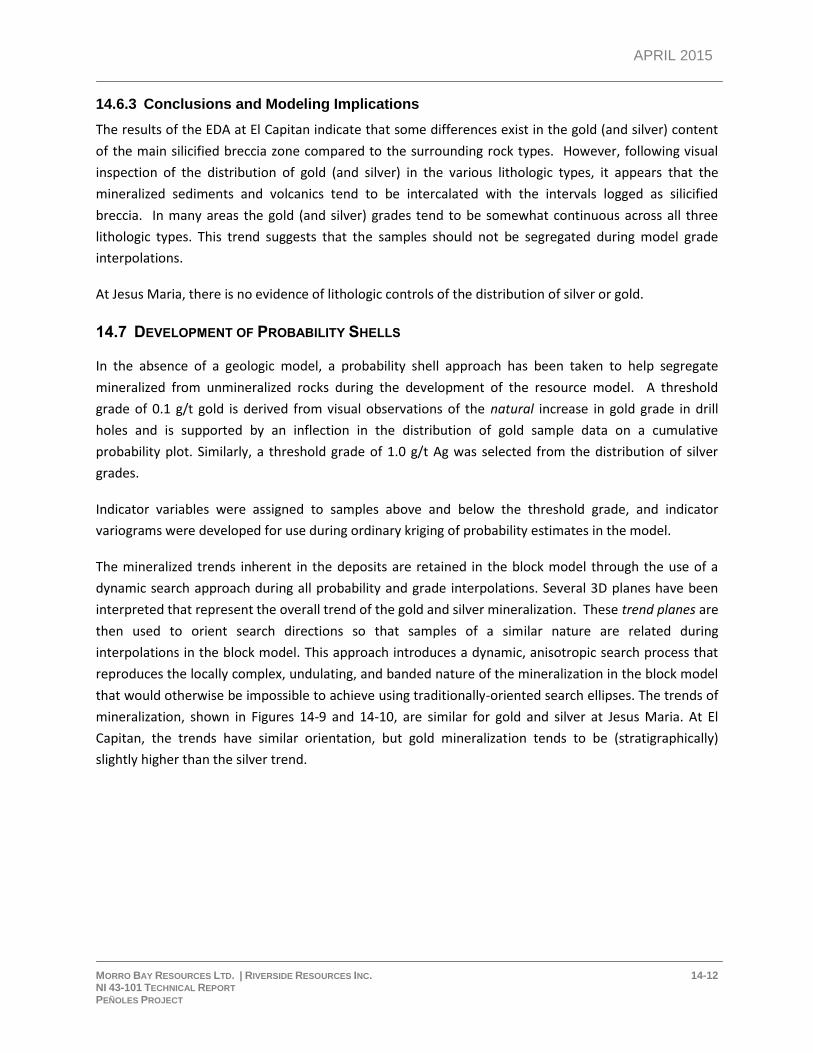
APRIL 2015
MORRO BAY RESOURCES LTD. | RIVERSIDE RESOURCES INC. 14-12 NI 43-101 TECHNICAL REPORT PEÑOLES PROJECT
14.6.3 Conclusions and Modeling Implications
The results of the EDA at El Capitan indicate that some differences exist in the gold (and silver) content
of the main silicified breccia zone compared to the surrounding rock types. However, following visual
inspection of the distribution of gold (and silver) in the various lithologic types, it appears that the
mineralized sediments and volcanics tend to be intercalated with the intervals logged as silicified
breccia. In many areas the gold (and silver) grades tend to be somewhat continuous across all three
lithologic types. This trend suggests that the samples should not be segregated during model grade
interpolations.
At Jesus Maria, there is no evidence of lithologic controls of the distribution of silver or gold.
14.7 DEVELOPMENT OF PROBABILITY SHELLS
In the absence of a geologic model, a probability shell approach has been taken to help segregate
mineralized from unmineralized rocks during the development of the resource model. A threshold
grade of 0.1 g/t gold is derived from visual observations of the natural increase in gold grade in drill
holes and is supported by an inflection in the distribution of gold sample data on a cumulative
probability plot. Similarly, a threshold grade of 1.0 g/t Ag was selected from the distribution of silver
grades.
Indicator variables were assigned to samples above and below the threshold grade, and indicator
variograms were developed for use during ordinary kriging of probability estimates in the model.
The mineralized trends inherent in the deposits are retained in the block model through the use of a
dynamic search approach during all probability and grade interpolations. Several 3D planes have been
interpreted that represent the overall trend of the gold and silver mineralization. These trend planes are
then used to orient search directions so that samples of a similar nature are related during
interpolations in the block model. This approach introduces a dynamic, anisotropic search process that
reproduces the locally complex, undulating, and banded nature of the mineralization in the block model
that would otherwise be impossible to achieve using traditionally-oriented search ellipses. The trends of
mineralization, shown in Figures 14-9 and 14-10, are similar for gold and silver at Jesus Maria. At El
Capitan, the trends have similar orientation, but gold mineralization tends to be (stratigraphically)
slightly higher than the silver trend.
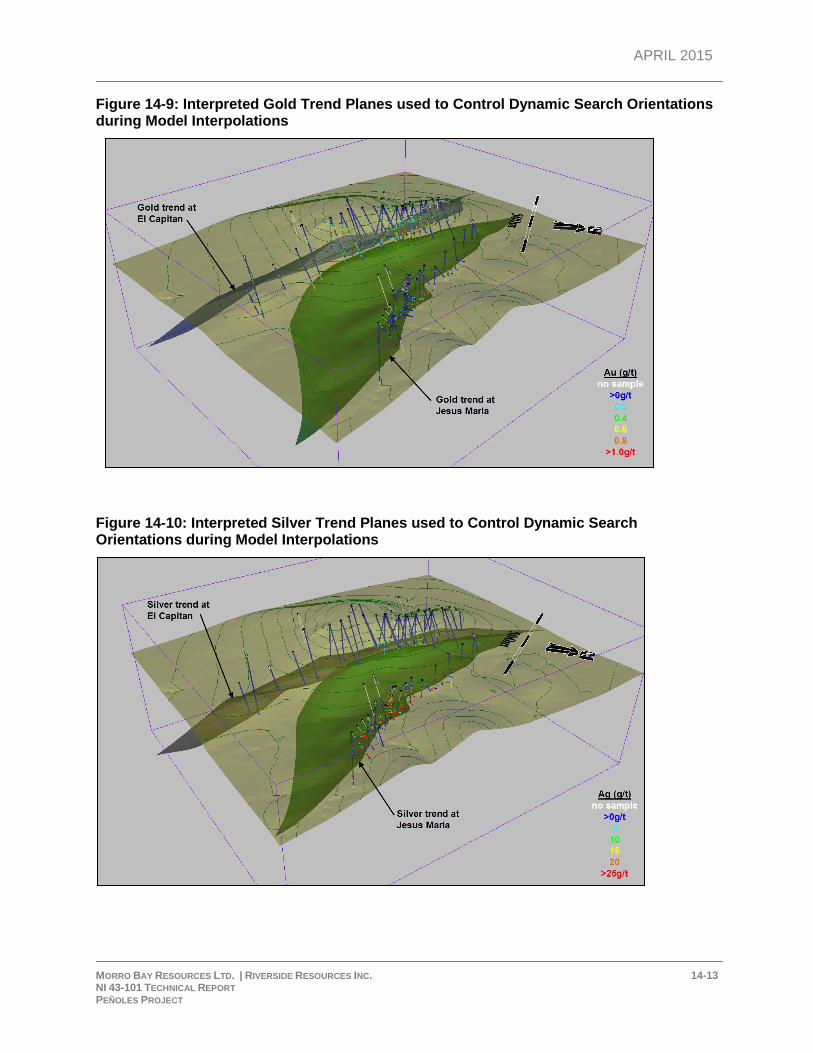
APRIL 2015
MORRO BAY RESOURCES LTD. | RIVERSIDE RESOURCES INC. 14-13 NI 43-101 TECHNICAL REPORT PEÑOLES PROJECT
Figure 14-9: Interpreted Gold Trend Planes used to Control Dynamic Search Orientations during Model Interpolations
Figure 14-10: Interpreted Silver Trend Planes used to Control Dynamic Search Orientations during Model Interpolations
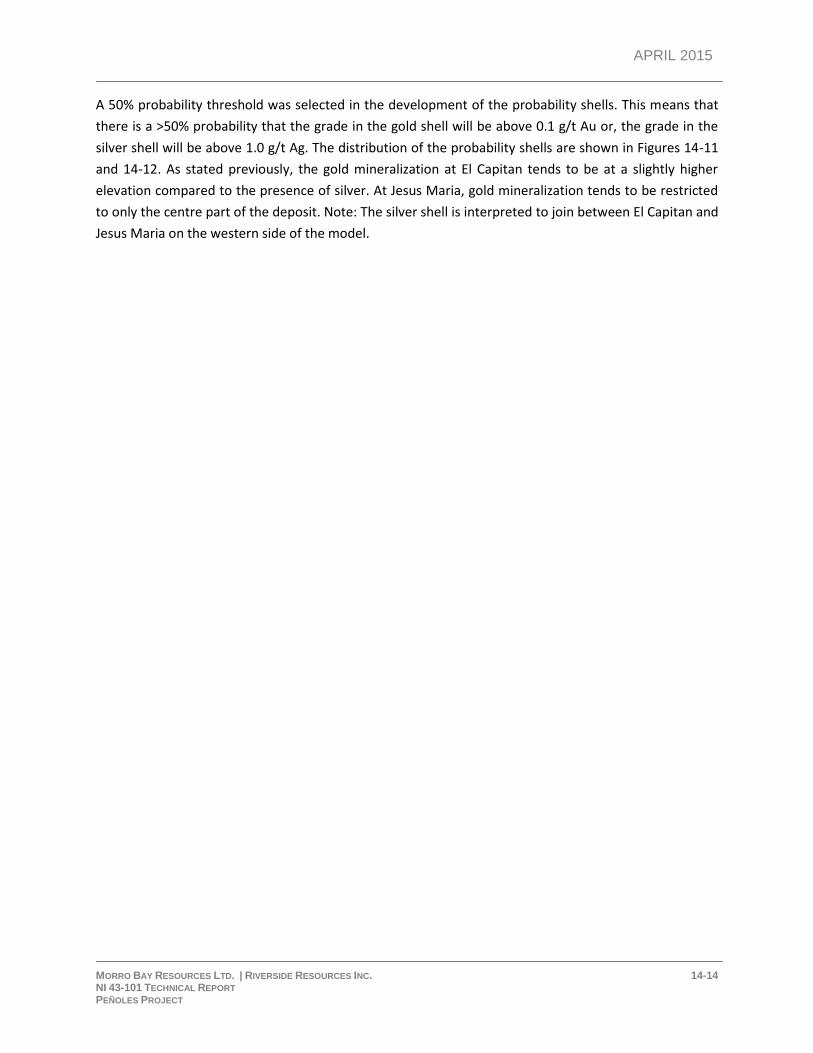
APRIL 2015
MORRO BAY RESOURCES LTD. | RIVERSIDE RESOURCES INC. 14-14 NI 43-101 TECHNICAL REPORT PEÑOLES PROJECT
A 50% probability threshold was selected in the development of the probability shells. This means that
there is a >50% probability that the grade in the gold shell will be above 0.1 g/t Au or, the grade in the
silver shell will be above 1.0 g/t Ag. The distribution of the probability shells are shown in Figures 14-11
and 14-12. As stated previously, the gold mineralization at El Capitan tends to be at a slightly higher
elevation compared to the presence of silver. At Jesus Maria, gold mineralization tends to be restricted
to only the centre part of the deposit. Note: The silver shell is interpreted to join between El Capitan and
Jesus Maria on the western side of the model.
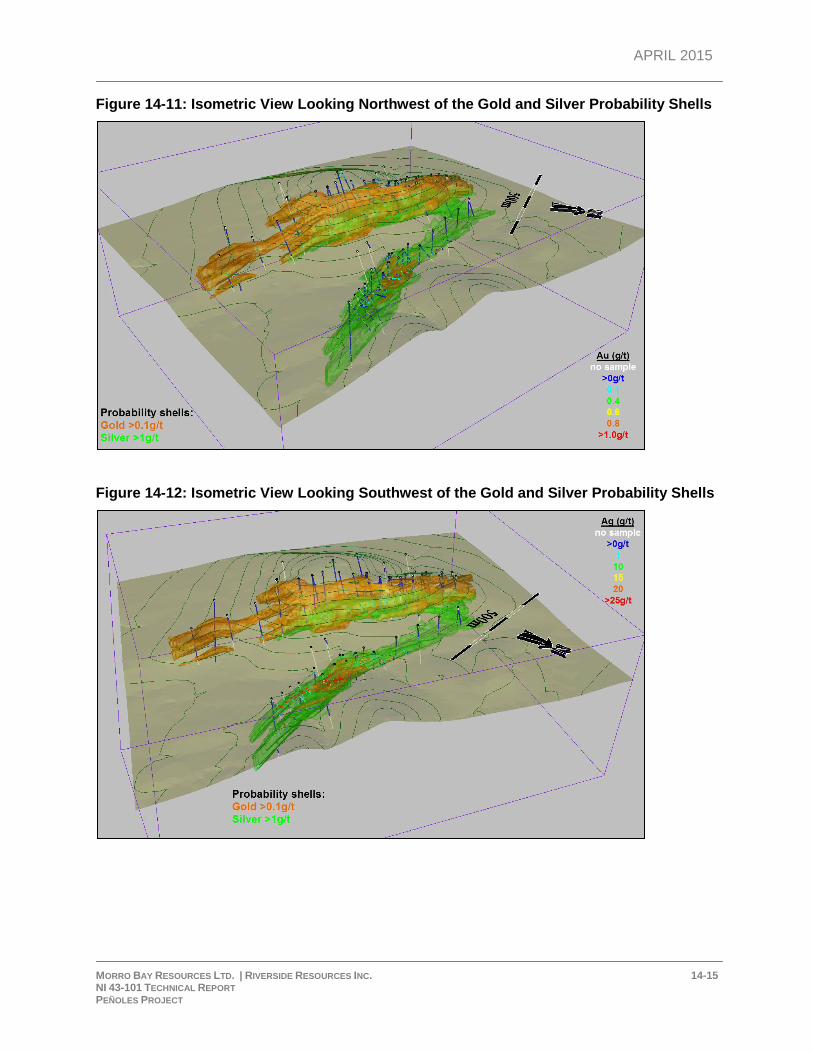
APRIL 2015
MORRO BAY RESOURCES LTD. | RIVERSIDE RESOURCES INC. 14-15 NI 43-101 TECHNICAL REPORT PEÑOLES PROJECT
Figure 14-11: Isometric View Looking Northwest of the Gold and Silver Probability Shells
Figure 14-12: Isometric View Looking Southwest of the Gold and Silver Probability Shells
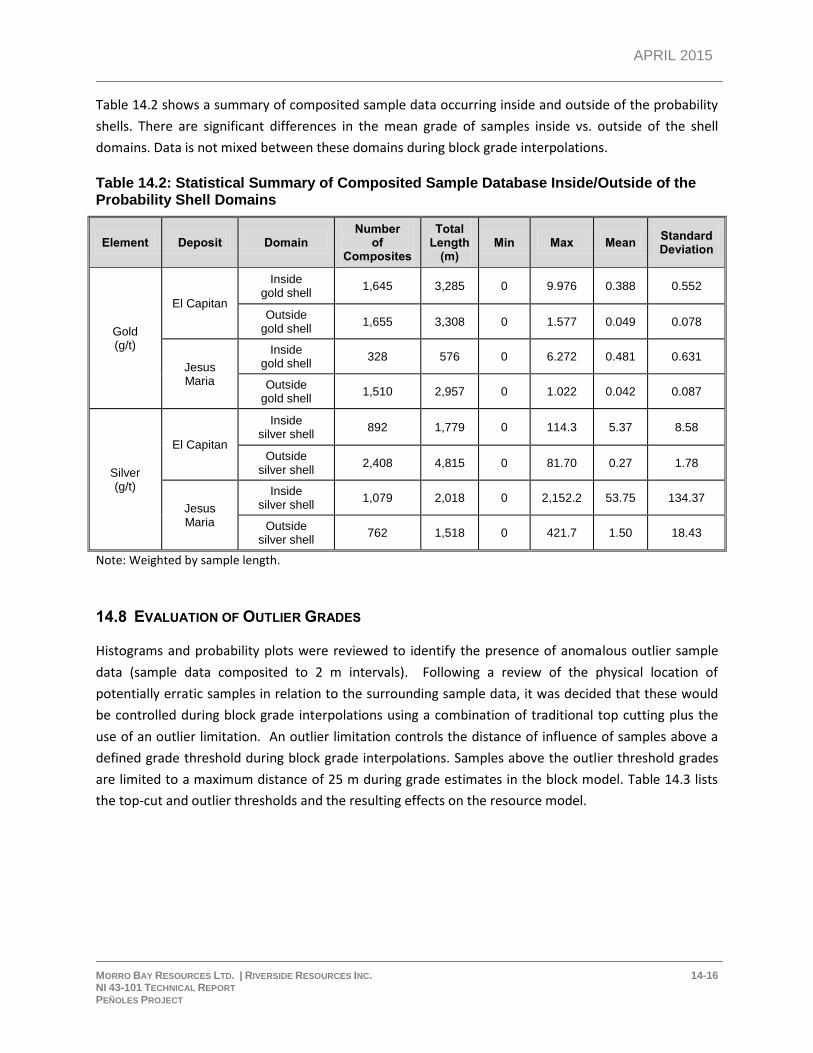
APRIL 2015
MORRO BAY RESOURCES LTD. | RIVERSIDE RESOURCES INC. 14-16 NI 43-101 TECHNICAL REPORT PEÑOLES PROJECT
Table 14.2 shows a summary of composited sample data occurring inside and outside of the probability
shells. There are significant differences in the mean grade of samples inside vs. outside of the shell
domains. Data is not mixed between these domains during block grade interpolations.
Table 14.2: Statistical Summary of Composited Sample Database Inside/Outside of the Probability Shell Domains
Element Deposit Domain Number
of Composites
Total Length
(m) Min Max Mean
Standard Deviation
Gold (g/t)
El Capitan
Inside gold shell
1,645 3,285 0 9.976 0.388 0.552
Outside gold shell
1,655 3,308 0 1.577 0.049 0.078
Jesus Maria
Inside gold shell
328 576 0 6.272 0.481 0.631
Outside gold shell
1,510 2,957 0 1.022 0.042 0.087
Silver (g/t)
El Capitan
Inside silver shell
892 1,779 0 114.3 5.37 8.58
Outside silver shell
2,408 4,815 0 81.70 0.27 1.78
Jesus Maria
Inside silver shell
1,079 2,018 0 2,152.2 53.75 134.37
Outside silver shell
762 1,518 0 421.7 1.50 18.43
Note: Weighted by sample length.
14.8 EVALUATION OF OUTLIER GRADES
Histograms and probability plots were reviewed to identify the presence of anomalous outlier sample
data (sample data composited to 2 m intervals). Following a review of the physical location of
potentially erratic samples in relation to the surrounding sample data, it was decided that these would
be controlled during block grade interpolations using a combination of traditional top cutting plus the
use of an outlier limitation. An outlier limitation controls the distance of influence of samples above a
defined grade threshold during block grade interpolations. Samples above the outlier threshold grades
are limited to a maximum distance of 25 m during grade estimates in the block model. Table 14.3 lists
the top-cut and outlier thresholds and the resulting effects on the resource model.
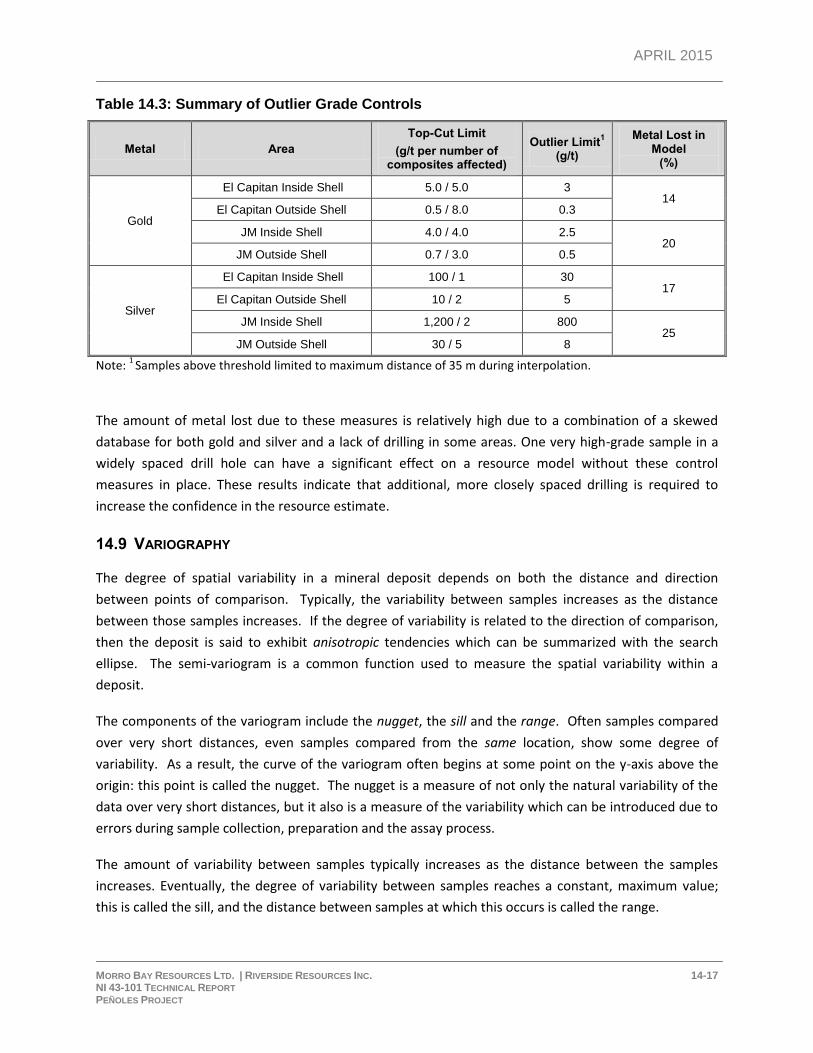
APRIL 2015
MORRO BAY RESOURCES LTD. | RIVERSIDE RESOURCES INC. 14-17 NI 43-101 TECHNICAL REPORT PEÑOLES PROJECT
Table 14.3: Summary of Outlier Grade Controls
Metal Area
Top-Cut Limit
(g/t per number of composites affected)
Outlier Limit1
(g/t)
Metal Lost in Model
(%)
Gold
El Capitan Inside Shell 5.0 / 5.0 3 14
El Capitan Outside Shell 0.5 / 8.0 0.3
JM Inside Shell 4.0 / 4.0 2.5 20
JM Outside Shell 0.7 / 3.0 0.5
Silver
El Capitan Inside Shell 100 / 1 30 17
El Capitan Outside Shell 10 / 2 5
JM Inside Shell 1,200 / 2 800 25
JM Outside Shell 30 / 5 8
Note: 1
Samples above threshold limited to maximum distance of 35 m during interpolation.
The amount of metal lost due to these measures is relatively high due to a combination of a skewed
database for both gold and silver and a lack of drilling in some areas. One very high-grade sample in a
widely spaced drill hole can have a significant effect on a resource model without these control
measures in place. These results indicate that additional, more closely spaced drilling is required to
increase the confidence in the resource estimate.
14.9 VARIOGRAPHY
The degree of spatial variability in a mineral deposit depends on both the distance and direction
between points of comparison. Typically, the variability between samples increases as the distance
between those samples increases. If the degree of variability is related to the direction of comparison,
then the deposit is said to exhibit anisotropic tendencies which can be summarized with the search
ellipse. The semi-variogram is a common function used to measure the spatial variability within a
deposit.
The components of the variogram include the nugget, the sill and the range. Often samples compared
over very short distances, even samples compared from the same location, show some degree of
variability. As a result, the curve of the variogram often begins at some point on the y-axis above the
origin: this point is called the nugget. The nugget is a measure of not only the natural variability of the
data over very short distances, but it also is a measure of the variability which can be introduced due to
errors during sample collection, preparation and the assay process.
The amount of variability between samples typically increases as the distance between the samples
increases. Eventually, the degree of variability between samples reaches a constant, maximum value;
this is called the sill, and the distance between samples at which this occurs is called the range.
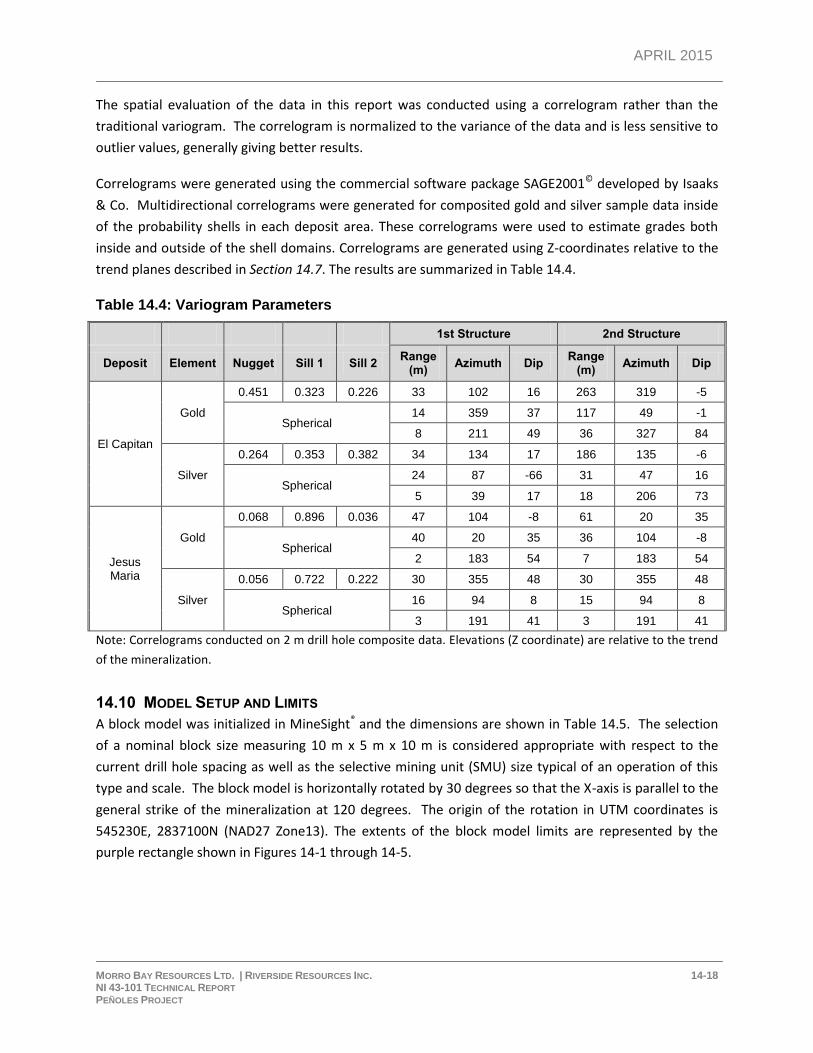
APRIL 2015
MORRO BAY RESOURCES LTD. | RIVERSIDE RESOURCES INC. 14-18 NI 43-101 TECHNICAL REPORT PEÑOLES PROJECT
The spatial evaluation of the data in this report was conducted using a correlogram rather than the
traditional variogram. The correlogram is normalized to the variance of the data and is less sensitive to
outlier values, generally giving better results.
Correlograms were generated using the commercial software package SAGE2001© developed by Isaaks
& Co. Multidirectional correlograms were generated for composited gold and silver sample data inside
of the probability shells in each deposit area. These correlograms were used to estimate grades both
inside and outside of the shell domains. Correlograms are generated using Z-coordinates relative to the
trend planes described in Section 14.7. The results are summarized in Table 14.4.
Table 14.4: Variogram Parameters
1st Structure 2nd Structure
Deposit Element Nugget Sill 1 Sill 2 Range
(m) Azimuth Dip
Range (m)
Azimuth Dip
El Capitan
Gold
0.451 0.323 0.226 33 102 16 263 319 -5
Spherical 14 359 37 117 49 -1
8 211 49 36 327 84
Silver
0.264 0.353 0.382 34 134 17 186 135 -6
Spherical 24 87 -66 31 47 16
5 39 17 18 206 73
Jesus Maria
Gold
0.068 0.896 0.036 47 104 -8 61 20 35
Spherical 40 20 35 36 104 -8
2 183 54 7 183 54
Silver
0.056 0.722 0.222 30 355 48 30 355 48
Spherical 16 94 8 15 94 8
3 191 41 3 191 41
Note: Correlograms conducted on 2 m drill hole composite data. Elevations (Z coordinate) are relative to the trend
of the mineralization.
14.10 MODEL SETUP AND LIMITS
A block model was initialized in MineSight® and the dimensions are shown in Table 14.5. The selection
of a nominal block size measuring 10 m x 5 m x 10 m is considered appropriate with respect to the
current drill hole spacing as well as the selective mining unit (SMU) size typical of an operation of this
type and scale. The block model is horizontally rotated by 30 degrees so that the X-axis is parallel to the
general strike of the mineralization at 120 degrees. The origin of the rotation in UTM coordinates is
545230E, 2837100N (NAD27 Zone13). The extents of the block model limits are represented by the
purple rectangle shown in Figures 14-1 through 14-5.
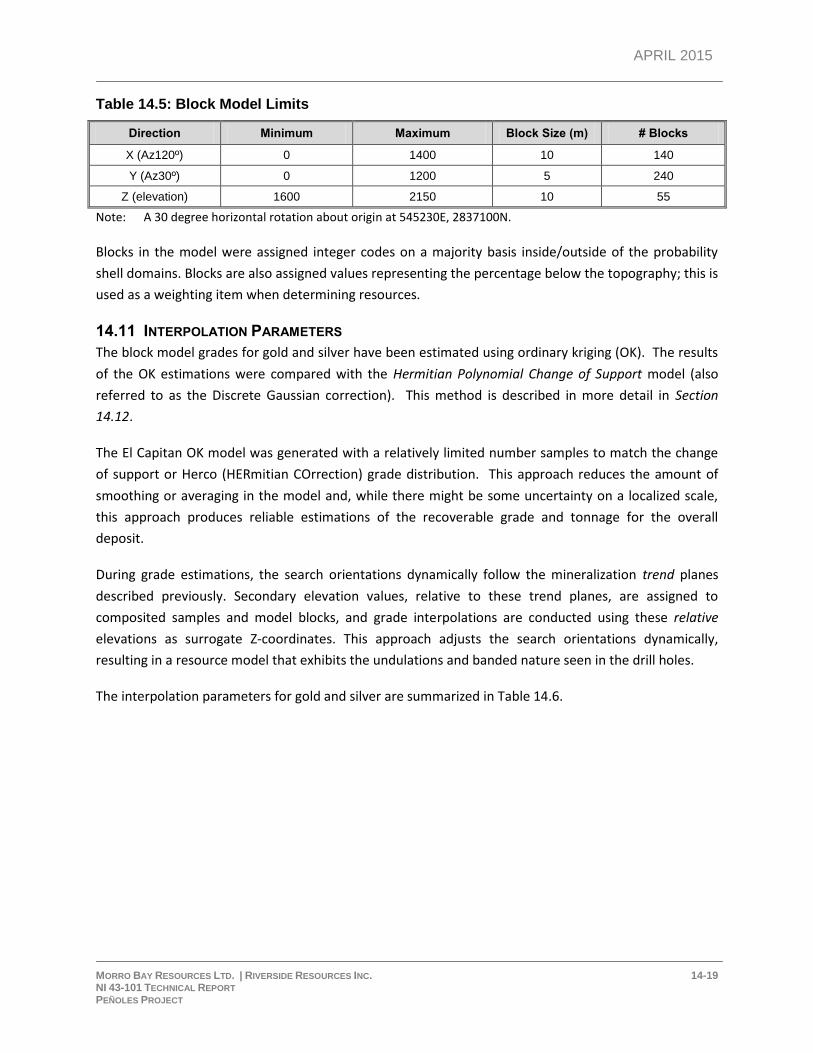
APRIL 2015
MORRO BAY RESOURCES LTD. | RIVERSIDE RESOURCES INC. 14-19 NI 43-101 TECHNICAL REPORT PEÑOLES PROJECT
Table 14.5: Block Model Limits
Direction Minimum Maximum Block Size (m) # Blocks
X (Az120º) 0 1400 10 140
Y (Az30º) 0 1200 5 240
Z (elevation) 1600 2150 10 55
Note: A 30 degree horizontal rotation about origin at 545230E, 2837100N.
Blocks in the model were assigned integer codes on a majority basis inside/outside of the probability
shell domains. Blocks are also assigned values representing the percentage below the topography; this is
used as a weighting item when determining resources.
14.11 INTERPOLATION PARAMETERS
The block model grades for gold and silver have been estimated using ordinary kriging (OK). The results
of the OK estimations were compared with the Hermitian Polynomial Change of Support model (also
referred to as the Discrete Gaussian correction). This method is described in more detail in Section
14.12.
The El Capitan OK model was generated with a relatively limited number samples to match the change
of support or Herco (HERmitian COrrection) grade distribution. This approach reduces the amount of
smoothing or averaging in the model and, while there might be some uncertainty on a localized scale,
this approach produces reliable estimations of the recoverable grade and tonnage for the overall
deposit.
During grade estimations, the search orientations dynamically follow the mineralization trend planes
described previously. Secondary elevation values, relative to these trend planes, are assigned to
composited samples and model blocks, and grade interpolations are conducted using these relative
elevations as surrogate Z-coordinates. This approach adjusts the search orientations dynamically,
resulting in a resource model that exhibits the undulations and banded nature seen in the drill holes.
The interpolation parameters for gold and silver are summarized in Table 14.6.
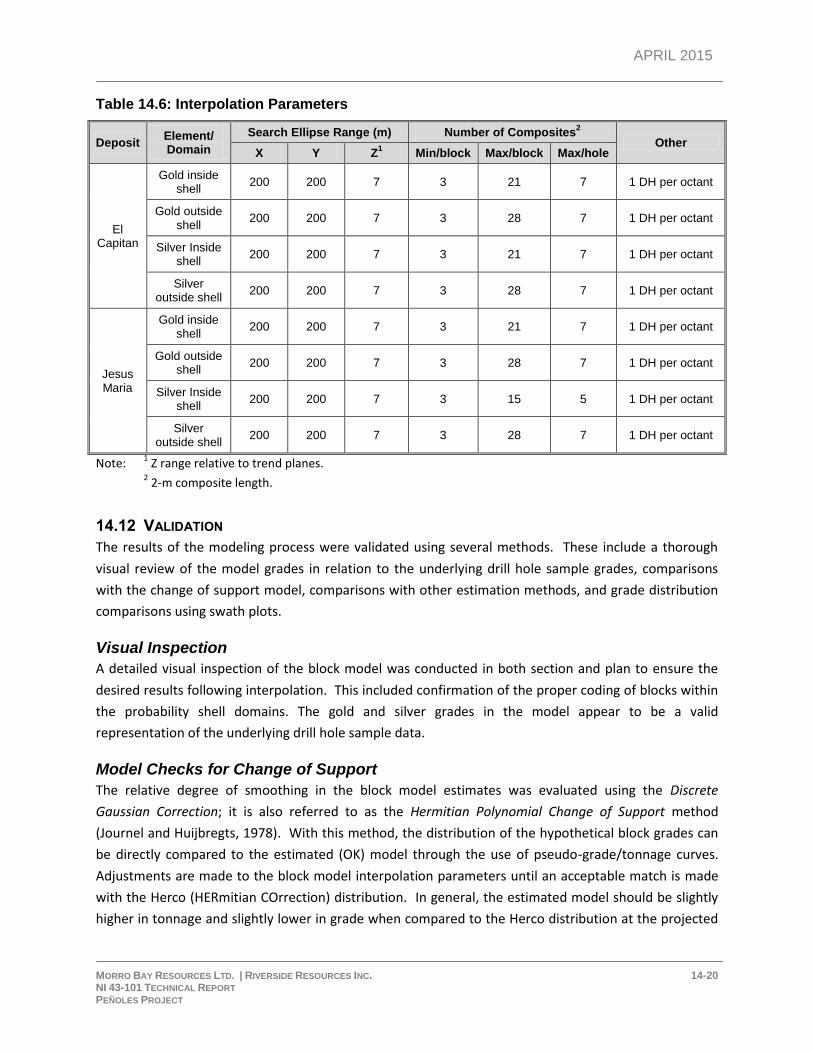
APRIL 2015
MORRO BAY RESOURCES LTD. | RIVERSIDE RESOURCES INC. 14-20 NI 43-101 TECHNICAL REPORT PEÑOLES PROJECT
Table 14.6: Interpolation Parameters
Deposit Element/ Domain
Search Ellipse Range (m) Number of Composites2
Other X Y Z
1 Min/block Max/block Max/hole
El Capitan
Gold inside shell
200 200 7 3 21 7 1 DH per octant
Gold outside shell
200 200 7 3 28 7 1 DH per octant
Silver Inside shell
200 200 7 3 21 7 1 DH per octant
Silver outside shell
200 200 7 3 28 7 1 DH per octant
Jesus Maria
Gold inside shell
200 200 7 3 21 7 1 DH per octant
Gold outside shell
200 200 7 3 28 7 1 DH per octant
Silver Inside shell
200 200 7 3 15 5 1 DH per octant
Silver outside shell
200 200 7 3 28 7 1 DH per octant
Note: 1 Z range relative to trend planes.
2 2-m composite length.
14.12 VALIDATION
The results of the modeling process were validated using several methods. These include a thorough
visual review of the model grades in relation to the underlying drill hole sample grades, comparisons
with the change of support model, comparisons with other estimation methods, and grade distribution
comparisons using swath plots.
Visual Inspection
A detailed visual inspection of the block model was conducted in both section and plan to ensure the
desired results following interpolation. This included confirmation of the proper coding of blocks within
the probability shell domains. The gold and silver grades in the model appear to be a valid
representation of the underlying drill hole sample data.
Model Checks for Change of Support
The relative degree of smoothing in the block model estimates was evaluated using the Discrete
Gaussian Correction; it is also referred to as the Hermitian Polynomial Change of Support method
(Journel and Huijbregts, 1978). With this method, the distribution of the hypothetical block grades can
be directly compared to the estimated (OK) model through the use of pseudo-grade/tonnage curves.
Adjustments are made to the block model interpolation parameters until an acceptable match is made
with the Herco (HERmitian COrrection) distribution. In general, the estimated model should be slightly
higher in tonnage and slightly lower in grade when compared to the Herco distribution at the projected
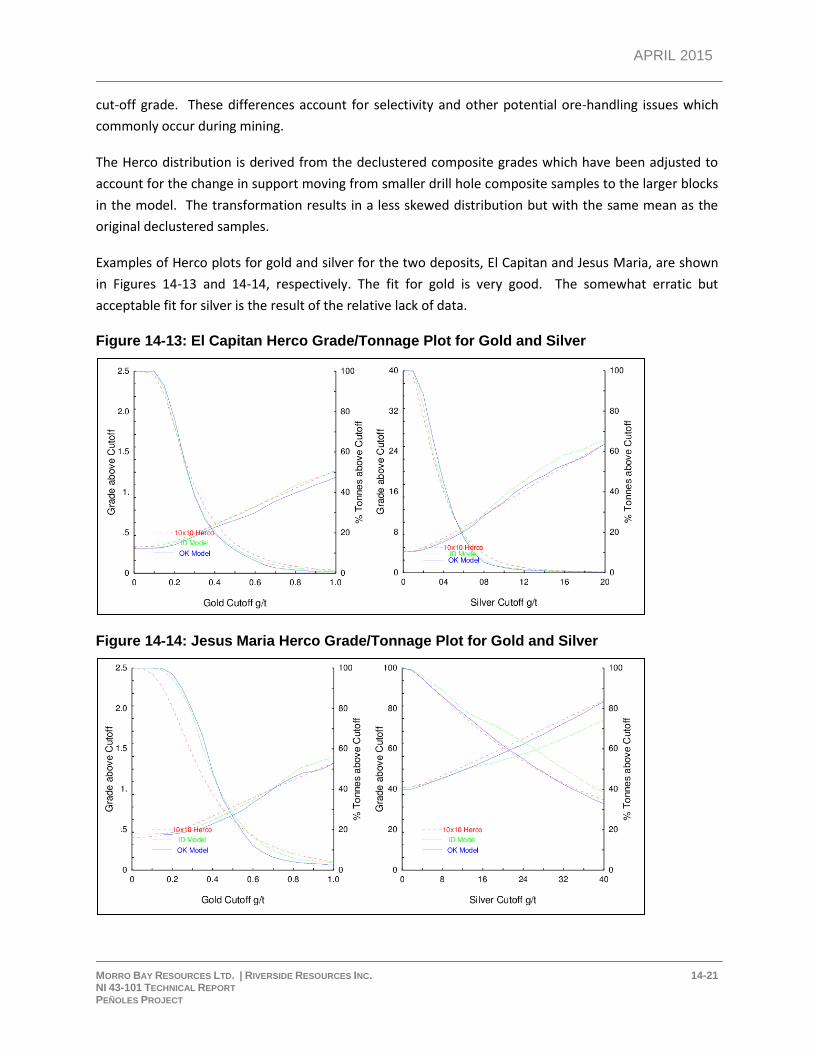
APRIL 2015
MORRO BAY RESOURCES LTD. | RIVERSIDE RESOURCES INC. 14-21 NI 43-101 TECHNICAL REPORT PEÑOLES PROJECT
cut-off grade. These differences account for selectivity and other potential ore-handling issues which
commonly occur during mining.
The Herco distribution is derived from the declustered composite grades which have been adjusted to
account for the change in support moving from smaller drill hole composite samples to the larger blocks
in the model. The transformation results in a less skewed distribution but with the same mean as the
original declustered samples.
Examples of Herco plots for gold and silver for the two deposits, El Capitan and Jesus Maria, are shown
in Figures 14-13 and 14-14, respectively. The fit for gold is very good. The somewhat erratic but
acceptable fit for silver is the result of the relative lack of data.
Figure 14-13: El Capitan Herco Grade/Tonnage Plot for Gold and Silver
Figure 14-14: Jesus Maria Herco Grade/Tonnage Plot for Gold and Silver
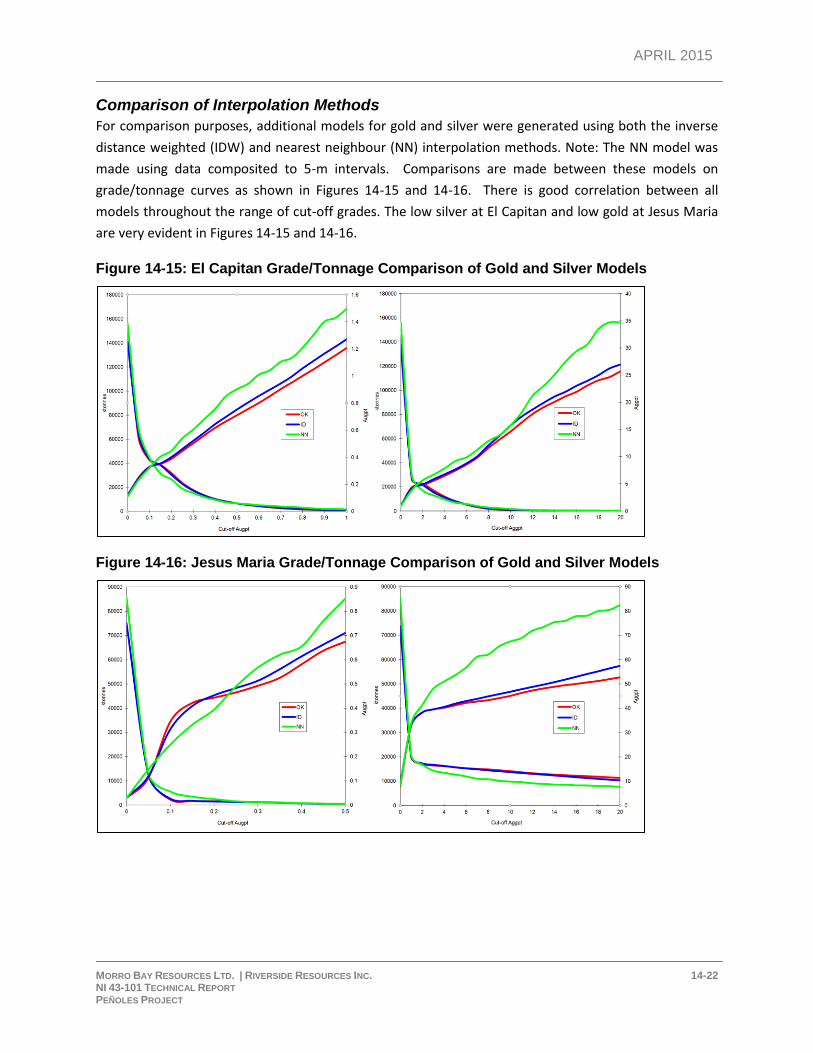
APRIL 2015
MORRO BAY RESOURCES LTD. | RIVERSIDE RESOURCES INC. 14-22 NI 43-101 TECHNICAL REPORT PEÑOLES PROJECT
Comparison of Interpolation Methods
For comparison purposes, additional models for gold and silver were generated using both the inverse
distance weighted (IDW) and nearest neighbour (NN) interpolation methods. Note: The NN model was
made using data composited to 5-m intervals. Comparisons are made between these models on
grade/tonnage curves as shown in Figures 14-15 and 14-16. There is good correlation between all
models throughout the range of cut-off grades. The low silver at El Capitan and low gold at Jesus Maria
are very evident in Figures 14-15 and 14-16.
Figure 14-15: El Capitan Grade/Tonnage Comparison of Gold and Silver Models
Figure 14-16: Jesus Maria Grade/Tonnage Comparison of Gold and Silver Models
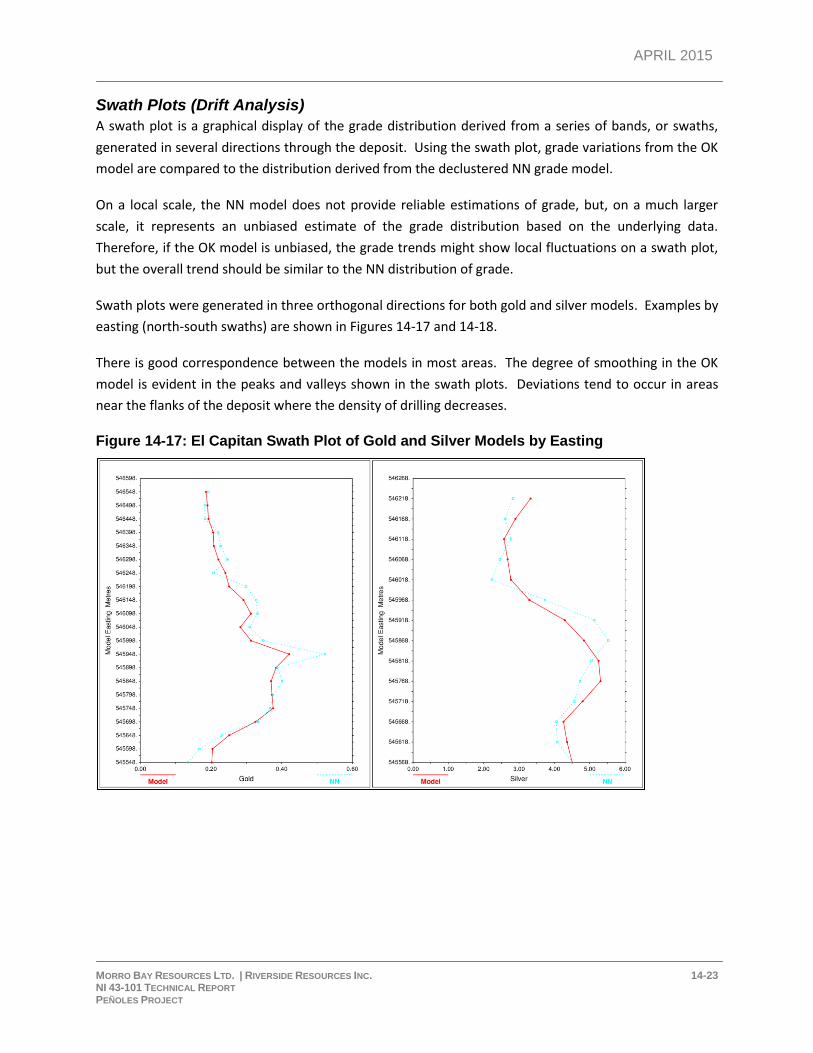
APRIL 2015
MORRO BAY RESOURCES LTD. | RIVERSIDE RESOURCES INC. 14-23 NI 43-101 TECHNICAL REPORT PEÑOLES PROJECT
Swath Plots (Drift Analysis)
A swath plot is a graphical display of the grade distribution derived from a series of bands, or swaths,
generated in several directions through the deposit. Using the swath plot, grade variations from the OK
model are compared to the distribution derived from the declustered NN grade model.
On a local scale, the NN model does not provide reliable estimations of grade, but, on a much larger
scale, it represents an unbiased estimate of the grade distribution based on the underlying data.
Therefore, if the OK model is unbiased, the grade trends might show local fluctuations on a swath plot,
but the overall trend should be similar to the NN distribution of grade.
Swath plots were generated in three orthogonal directions for both gold and silver models. Examples by
easting (north-south swaths) are shown in Figures 14-17 and 14-18.
There is good correspondence between the models in most areas. The degree of smoothing in the OK
model is evident in the peaks and valleys shown in the swath plots. Deviations tend to occur in areas
near the flanks of the deposit where the density of drilling decreases.
Figure 14-17: El Capitan Swath Plot of Gold and Silver Models by Easting
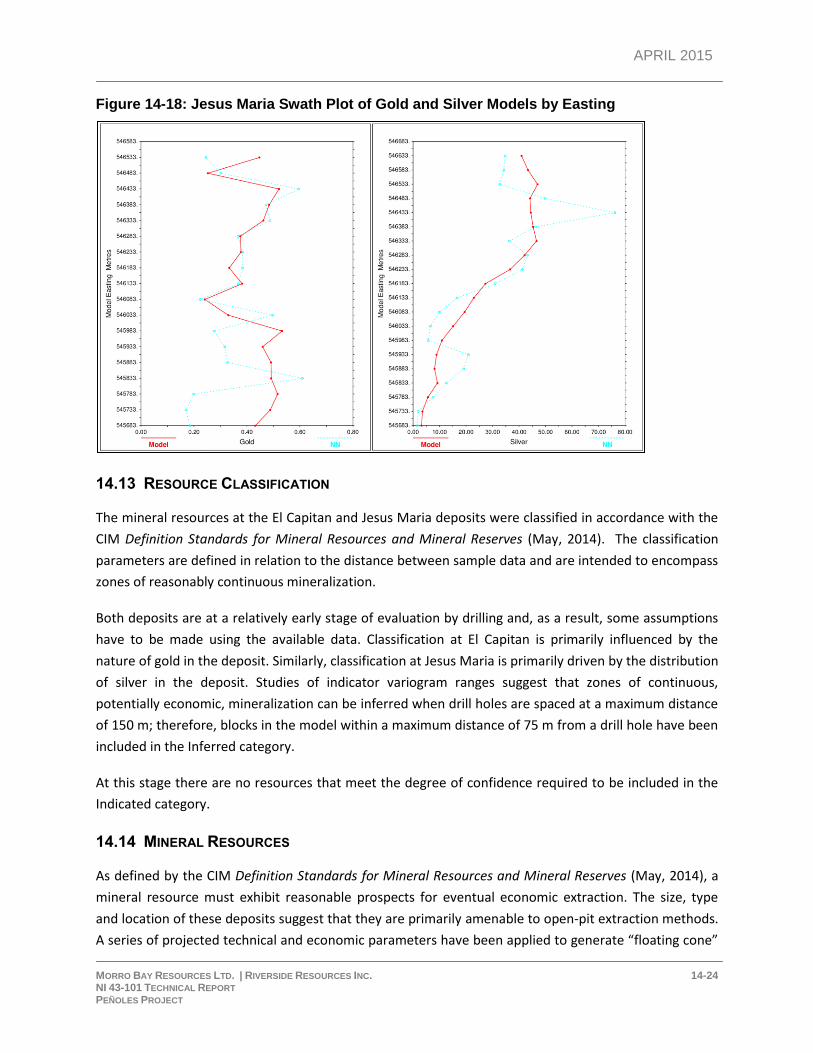
APRIL 2015
MORRO BAY RESOURCES LTD. | RIVERSIDE RESOURCES INC. 14-24 NI 43-101 TECHNICAL REPORT PEÑOLES PROJECT
Figure 14-18: Jesus Maria Swath Plot of Gold and Silver Models by Easting
14.13 RESOURCE CLASSIFICATION
The mineral resources at the El Capitan and Jesus Maria deposits were classified in accordance with the
CIM Definition Standards for Mineral Resources and Mineral Reserves (May, 2014). The classification
parameters are defined in relation to the distance between sample data and are intended to encompass
zones of reasonably continuous mineralization.
Both deposits are at a relatively early stage of evaluation by drilling and, as a result, some assumptions
have to be made using the available data. Classification at El Capitan is primarily influenced by the
nature of gold in the deposit. Similarly, classification at Jesus Maria is primarily driven by the distribution
of silver in the deposit. Studies of indicator variogram ranges suggest that zones of continuous,
potentially economic, mineralization can be inferred when drill holes are spaced at a maximum distance
of 150 m; therefore, blocks in the model within a maximum distance of 75 m from a drill hole have been
included in the Inferred category.
At this stage there are no resources that meet the degree of confidence required to be included in the
Indicated category.
14.14 MINERAL RESOURCES
As defined by the CIM Definition Standards for Mineral Resources and Mineral Reserves (May, 2014), a
mineral resource must exhibit reasonable prospects for eventual economic extraction. The size, type
and location of these deposits suggest that they are primarily amenable to open-pit extraction methods.
A series of projected technical and economic parameters have been applied to generate “floating cone”
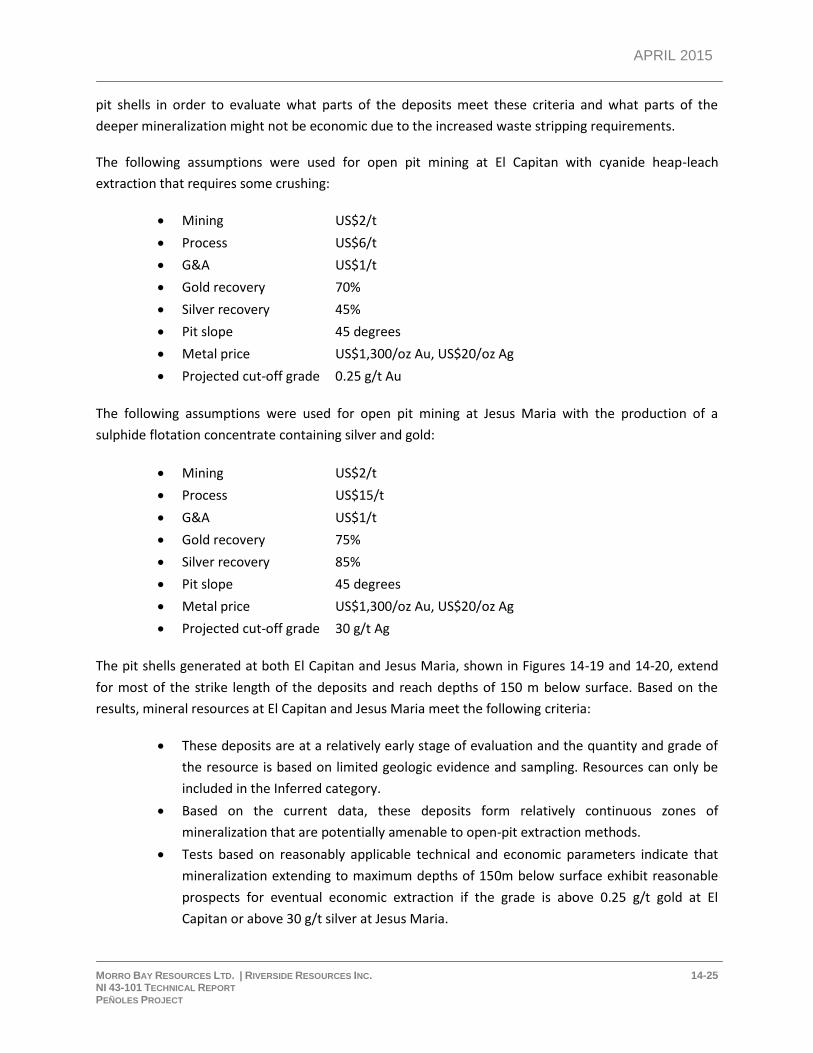
APRIL 2015
MORRO BAY RESOURCES LTD. | RIVERSIDE RESOURCES INC. 14-25 NI 43-101 TECHNICAL REPORT PEÑOLES PROJECT
pit shells in order to evaluate what parts of the deposits meet these criteria and what parts of the
deeper mineralization might not be economic due to the increased waste stripping requirements.
The following assumptions were used for open pit mining at El Capitan with cyanide heap-leach
extraction that requires some crushing:
Mining US$2/t
Process US$6/t
G&A US$1/t
Gold recovery 70%
Silver recovery 45%
Pit slope 45 degrees
Metal price US$1,300/oz Au, US$20/oz Ag
Projected cut-off grade 0.25 g/t Au
The following assumptions were used for open pit mining at Jesus Maria with the production of a
sulphide flotation concentrate containing silver and gold:
Mining US$2/t
Process US$15/t
G&A US$1/t
Gold recovery 75%
Silver recovery 85%
Pit slope 45 degrees
Metal price US$1,300/oz Au, US$20/oz Ag
Projected cut-off grade 30 g/t Ag
The pit shells generated at both El Capitan and Jesus Maria, shown in Figures 14-19 and 14-20, extend
for most of the strike length of the deposits and reach depths of 150 m below surface. Based on the
results, mineral resources at El Capitan and Jesus Maria meet the following criteria:
These deposits are at a relatively early stage of evaluation and the quantity and grade of
the resource is based on limited geologic evidence and sampling. Resources can only be
included in the Inferred category.
Based on the current data, these deposits form relatively continuous zones of
mineralization that are potentially amenable to open-pit extraction methods.
Tests based on reasonably applicable technical and economic parameters indicate that
mineralization extending to maximum depths of 150m below surface exhibit reasonable
prospects for eventual economic extraction if the grade is above 0.25 g/t gold at El
Capitan or above 30 g/t silver at Jesus Maria.
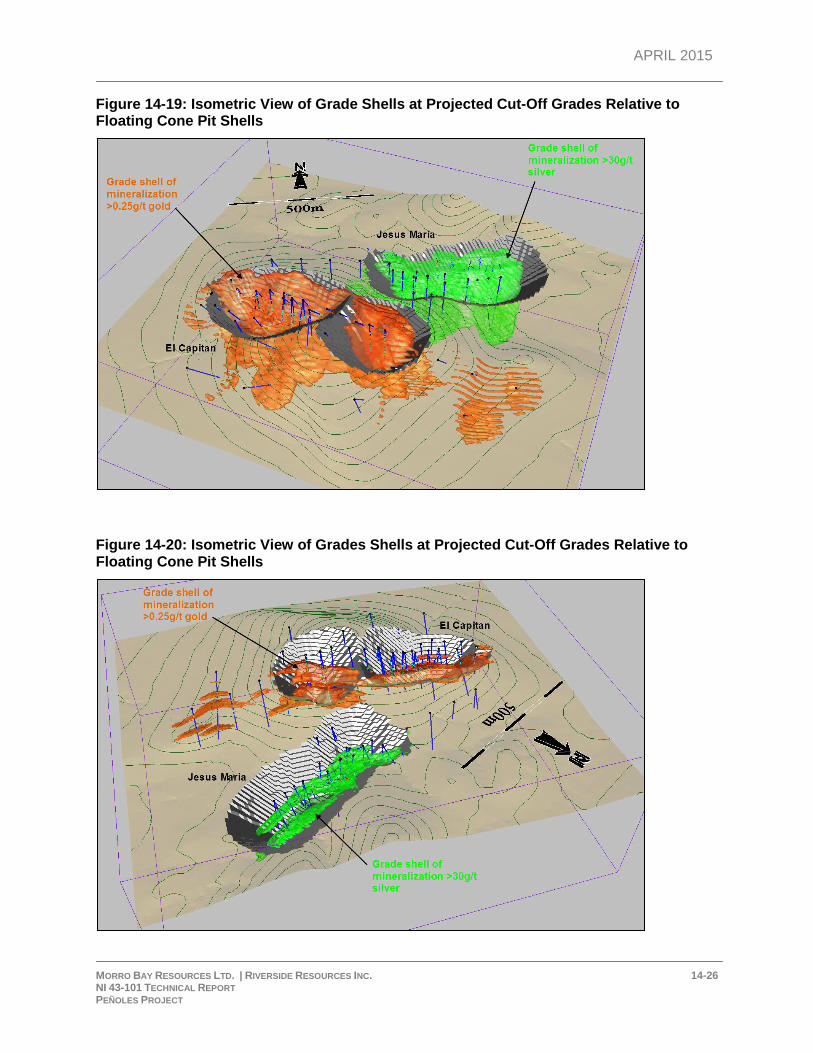
APRIL 2015
MORRO BAY RESOURCES LTD. | RIVERSIDE RESOURCES INC. 14-26 NI 43-101 TECHNICAL REPORT PEÑOLES PROJECT
Figure 14-19: Isometric View of Grade Shells at Projected Cut-Off Grades Relative to Floating Cone Pit Shells
Figure 14-20: Isometric View of Grades Shells at Projected Cut-Off Grades Relative to Floating Cone Pit Shells
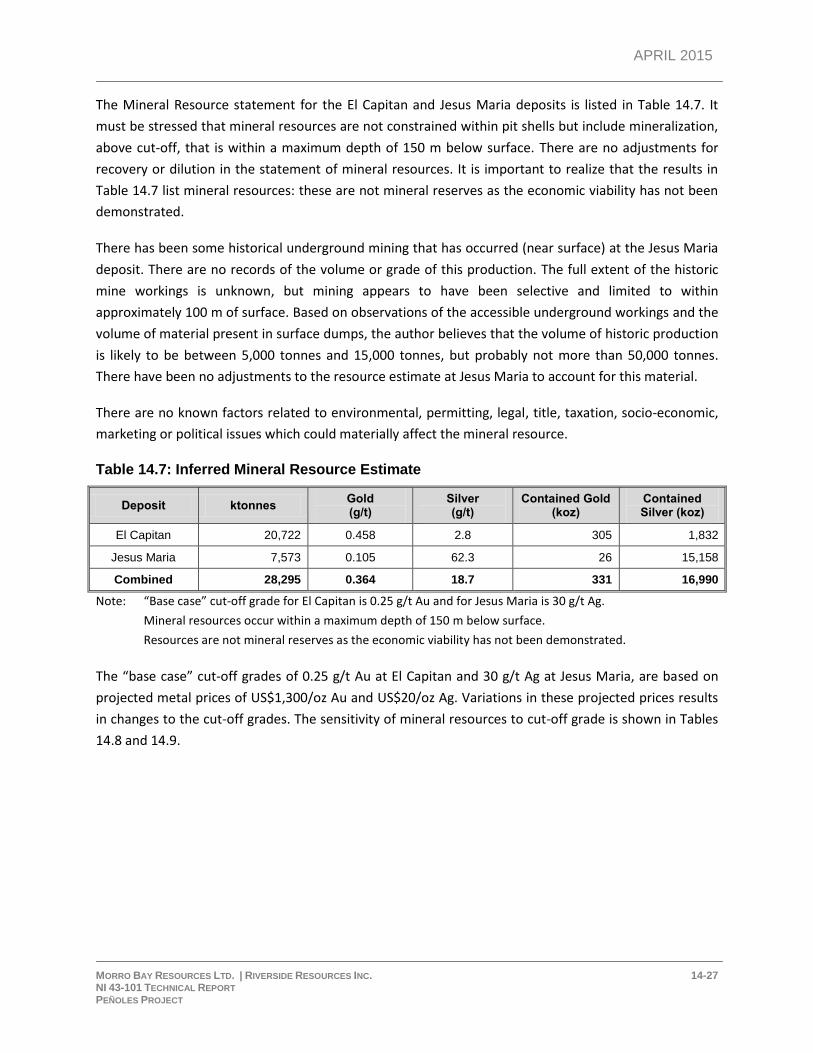
APRIL 2015
MORRO BAY RESOURCES LTD. | RIVERSIDE RESOURCES INC. 14-27 NI 43-101 TECHNICAL REPORT PEÑOLES PROJECT
The Mineral Resource statement for the El Capitan and Jesus Maria deposits is listed in Table 14.7. It
must be stressed that mineral resources are not constrained within pit shells but include mineralization,
above cut-off, that is within a maximum depth of 150 m below surface. There are no adjustments for
recovery or dilution in the statement of mineral resources. It is important to realize that the results in
Table 14.7 list mineral resources: these are not mineral reserves as the economic viability has not been
demonstrated.
There has been some historical underground mining that has occurred (near surface) at the Jesus Maria
deposit. There are no records of the volume or grade of this production. The full extent of the historic
mine workings is unknown, but mining appears to have been selective and limited to within
approximately 100 m of surface. Based on observations of the accessible underground workings and the
volume of material present in surface dumps, the author believes that the volume of historic production
is likely to be between 5,000 tonnes and 15,000 tonnes, but probably not more than 50,000 tonnes.
There have been no adjustments to the resource estimate at Jesus Maria to account for this material.
There are no known factors related to environmental, permitting, legal, title, taxation, socio-economic,
marketing or political issues which could materially affect the mineral resource.
Table 14.7: Inferred Mineral Resource Estimate
Deposit ktonnes Gold (g/t)
Silver (g/t)
Contained Gold (koz)
Contained Silver (koz)
El Capitan 20,722 0.458 2.8 305 1,832
Jesus Maria 7,573 0.105 62.3 26 15,158
Combined 28,295 0.364 18.7 331 16,990
Note: “Base case” cut-off grade for El Capitan is 0.25 g/t Au and for Jesus Maria is 30 g/t Ag.
Mineral resources occur within a maximum depth of 150 m below surface.
Resources are not mineral reserves as the economic viability has not been demonstrated.
The “base case” cut-off grades of 0.25 g/t Au at El Capitan and 30 g/t Ag at Jesus Maria, are based on
projected metal prices of US$1,300/oz Au and US$20/oz Ag. Variations in these projected prices results
in changes to the cut-off grades. The sensitivity of mineral resources to cut-off grade is shown in Tables
14.8 and 14.9.
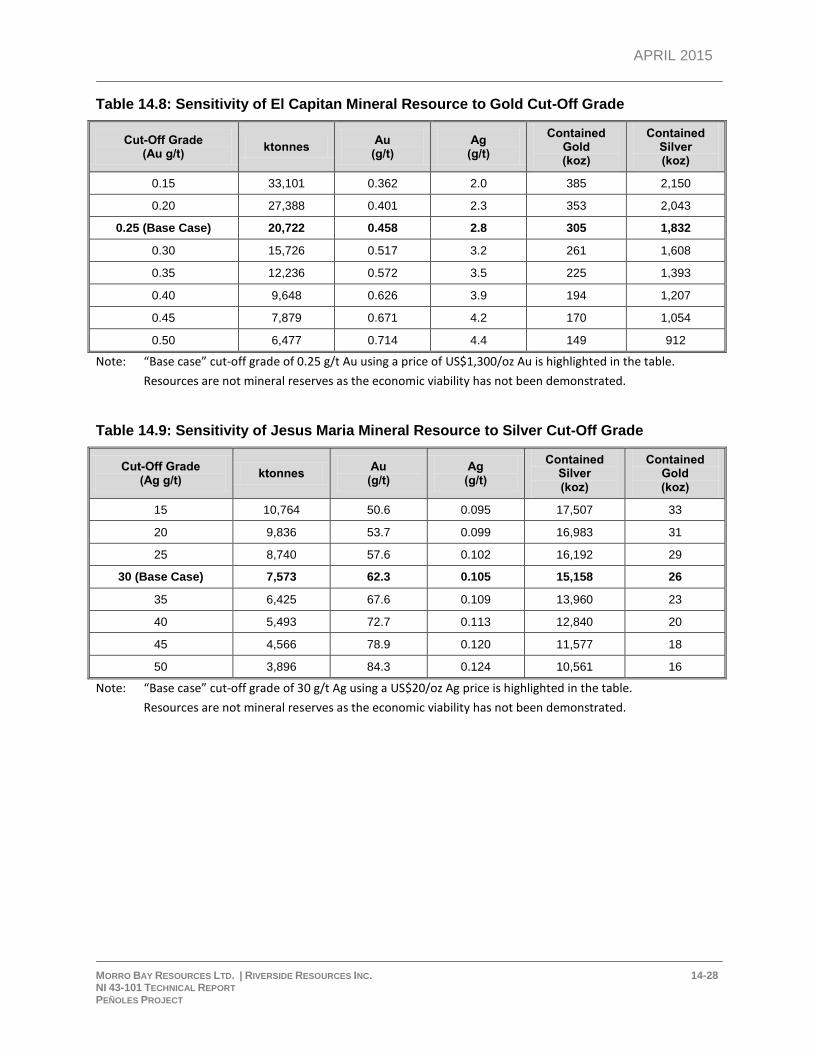
APRIL 2015
MORRO BAY RESOURCES LTD. | RIVERSIDE RESOURCES INC. 14-28 NI 43-101 TECHNICAL REPORT PEÑOLES PROJECT
Table 14.8: Sensitivity of El Capitan Mineral Resource to Gold Cut-Off Grade
Cut-Off Grade (Au g/t)
ktonnes Au
(g/t) Ag
(g/t)
Contained Gold (koz)
Contained Silver (koz)
0.15 33,101 0.362 2.0 385 2,150
0.20 27,388 0.401 2.3 353 2,043
0.25 (Base Case) 20,722 0.458 2.8 305 1,832
0.30 15,726 0.517 3.2 261 1,608
0.35 12,236 0.572 3.5 225 1,393
0.40 9,648 0.626 3.9 194 1,207
0.45 7,879 0.671 4.2 170 1,054
0.50 6,477 0.714 4.4 149 912
Note: “Base case” cut-off grade of 0.25 g/t Au using a price of US$1,300/oz Au is highlighted in the table.
Resources are not mineral reserves as the economic viability has not been demonstrated.
Table 14.9: Sensitivity of Jesus Maria Mineral Resource to Silver Cut-Off Grade
Cut-Off Grade (Ag g/t)
ktonnes Au
(g/t) Ag
(g/t)
Contained Silver (koz)
Contained Gold (koz)
15 10,764 50.6 0.095 17,507 33
20 9,836 53.7 0.099 16,983 31
25 8,740 57.6 0.102 16,192 29
30 (Base Case) 7,573 62.3 0.105 15,158 26
35 6,425 67.6 0.109 13,960 23
40 5,493 72.7 0.113 12,840 20
45 4,566 78.9 0.120 11,577 18
50 3,896 84.3 0.124 10,561 16
Note: “Base case” cut-off grade of 30 g/t Ag using a US$20/oz Ag price is highlighted in the table.
Resources are not mineral reserves as the economic viability has not been demonstrated.
APRIL 2015
MORRO BAY RESOURCES LTD. | RIVERSIDE RESOURCES INC. 15-1 NI 43-101 TECHNICAL REPORT PEÑOLES PROJECT
15 ADJACENT PROPERTIES
There are no adjacent mineral properties that are relevant to the Peñoles property.
APRIL 2015
MORRO BAY RESOURCES LTD. | RIVERSIDE RESOURCES INC. 16-1 NI 43-101 TECHNICAL REPORT PEÑOLES PROJECT
16 OTHER RELEVANT DATA AND INFORMATION
The Authors are not aware of any additional relevant data, or information not addressed in this report,
which could have an impact on the results of the resource estimate, or the conclusions expressed
herein.
APRIL 2015
MORRO BAY RESOURCES LTD. | RIVERSIDE RESOURCES INC. 17-1 NI 43-101 TECHNICAL REPORT PEÑOLES PROJECT
17 INTERPRETATION AND CONCLUSIONS
In summary, drilling to date on the Peñoles Property has defined significant intervals of near-surface,
silver-gold mineralization at Jesus Maria, and defined wide intervals of near-surface gold-silver
mineralization at El Capitan that could potentially be amenable to open-pit extraction methods.
In the Authors’ opinions, the Peñoles property has sufficient merit to warrant further exploration work.
To date, the limits of the mineralized zones remain “open” in some areas and there is potential to
increase the resources with additional drilling both along strike and at depth at El Capitan and Jesus
Maria. There is also potential for the discovery of additional mineralized zones in other areas of the
Peñoles property.
There are three features that control the epithermal mineralization on the Peñoles property. It is unclear
which feature is most influential, but it is clear that all three play a part. First, structurally controlled
conduit pathways for hydrothermal fluids mark the vein emplacement in the Jesus Maria area (Daniels,
2011; Lambeck, 2014). Second, the Jesus Maria area has carbonate-rich sedimentary rock horizons,
which have provided a buffering of the acidic hydrothermal fluids, and show hornfels skarn affinities;
this might extend mineralization laterally along bedding planes (Myers et al., 2014). Lastly, the angular
unconformity surface between the sedimentary rocks and the overlying UVS rhyolites at El Capitan,
which is a more passive fluid flow conduit, are similar to the mineralization controls identified at La
Preciosa silver-gold deposit (Whiting, 2008; Whiting, 2013) and La Pitarrilla silver-gold deposit (McCrea,
2006; Boychuck et al., 2012).
According to Myers et al. (2014), the 2013 and 2014 drill programs partially tested a 750 m long portion
of the mineralization in the Jesus Maria Silver Zone. Two types of mineralization were intersected in this
drilling. One mineralization style is a gold-silver zone, possibly controlled by a north-northeast-trending
porphyritic monzonitic dike, or a district-scale, east-northeast-trending fault zone. The other
mineralization style hosts gold-silver-zinc-lead and occurs as skarn or replacement-type zones in the
carbonate-rich beds of the Indidura Formation. The skarn/replacement zones are up to 30 m wide, true
width in drill holes, and have been tested as deep as 160 m from the surface. The same zone outcrops at
the surface giving a down-dip length of 200 m. This zone is expected to continue at depth. The base and
precious metal target type and the gold-silver zone have been minimally tested along strike and remain
open to depth and to the east and west. Other carbonate-rich beds occur in this portion of the Indidura
Formation and represent very favourable and, currently, untested targets.
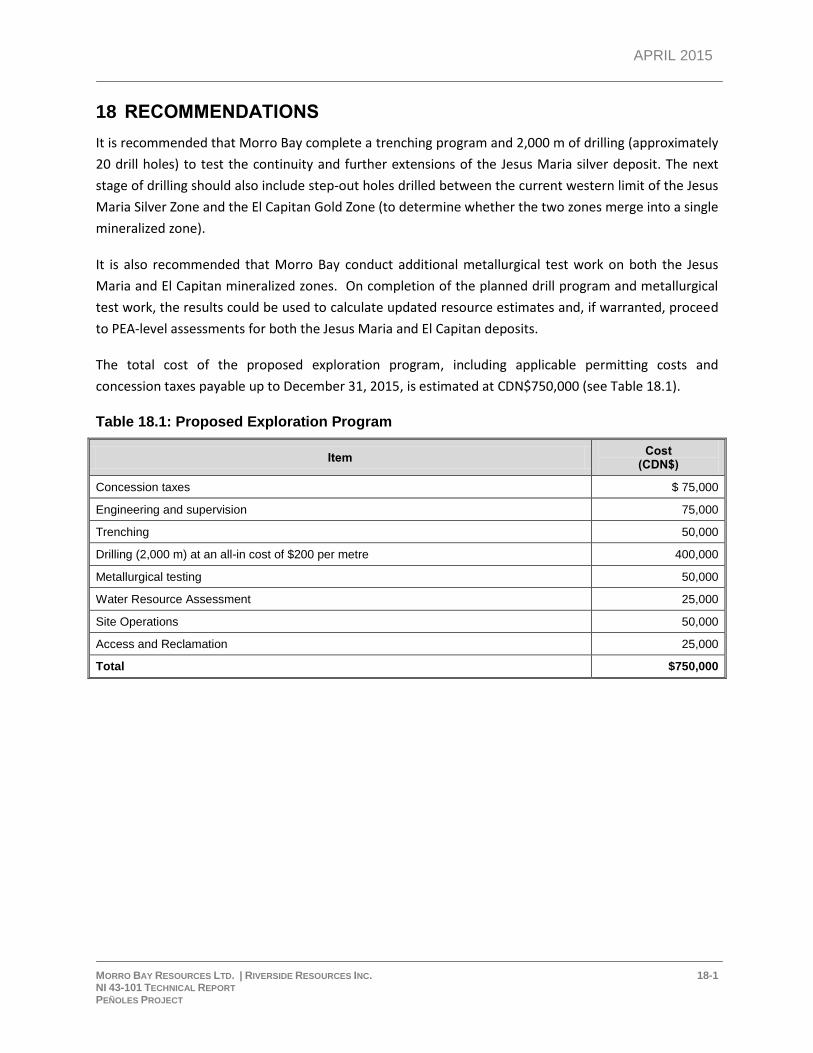
APRIL 2015
MORRO BAY RESOURCES LTD. | RIVERSIDE RESOURCES INC. 18-1 NI 43-101 TECHNICAL REPORT PEÑOLES PROJECT
18 RECOMMENDATIONS
It is recommended that Morro Bay complete a trenching program and 2,000 m of drilling (approximately
20 drill holes) to test the continuity and further extensions of the Jesus Maria silver deposit. The next
stage of drilling should also include step-out holes drilled between the current western limit of the Jesus
Maria Silver Zone and the El Capitan Gold Zone (to determine whether the two zones merge into a single
mineralized zone).
It is also recommended that Morro Bay conduct additional metallurgical test work on both the Jesus
Maria and El Capitan mineralized zones. On completion of the planned drill program and metallurgical
test work, the results could be used to calculate updated resource estimates and, if warranted, proceed
to PEA-level assessments for both the Jesus Maria and El Capitan deposits.
The total cost of the proposed exploration program, including applicable permitting costs and
concession taxes payable up to December 31, 2015, is estimated at CDN$750,000 (see Table 18.1).
Table 18.1: Proposed Exploration Program
Item Cost
(CDN$)
Concession taxes $ 75,000
Engineering and supervision 75,000
Trenching 50,000
Drilling (2,000 m) at an all-in cost of $200 per metre 400,000
Metallurgical testing 50,000
Water Resource Assessment 25,000
Site Operations 50,000
Access and Reclamation 25,000
Total $750,000
APRIL 2015
MORRO BAY RESOURCES LTD. | RIVERSIDE RESOURCES INC. 19-1 NI 43-101 TECHNICAL REPORT PEÑOLES PROJECT
19 REFERENCES
Anon., 2005 (?), Petrographic and Fluid Inclusion Study of Samples from the Peñoles District, Durango,
Mexico. MAGSA – Microtermometria y Asesoria Geologia Minera S.A. de C.V., 12p.
Bureau Veritas Commodities Canada Ltd. (Metallurgical Division), 2011, Gold Recovery by Cyanide
Leaching on Samples from Sierra Madre’s El Capitan Project – October 2011.Bureau Veritas Commodities
Canada Ltd. (Metallurgical Division), 2013, Metallurgical Testing on Samples from El Capitan Project,
Mexico – August 2013.
Bureau Veritas Commodities Canada Ltd. (Metallurgical Division), 2015, Preliminary Metallurgical
Testing to Recover Gold and Silver on Samples from the Jesus Maria Zone, Penoles Project, Mexico –
March 2015.
Boychuck, K.G., Garcia, D.H., Sharp, A.W., Vincent, J.D. and Yeomans, T.J., 2012, NI 43-101 Technical
Report on the Pitarrilla Project, Durango State, Mexico. Prepared for Silver Standard Resources Ltd.,
435p.
Cardenas Vargas, J., Carrasco Centeno, M., Sanenz Reyes, R., and Macedo Palencia, R., 1993,
Monografia Geologico-Minero del Estado de Durango. For Consejo de Recursos Minerales, Publication
M-10e, 165p.
Chen, S., 2013, Metallurgical Testing on Samples from El Capitan Project, Mexico. Inspectorate
Exploration & Mining Services Ltd. (Metallurgical Division). August 18, 2013. Project No. 1203105.
Clark, K.F., Foster, C.T. and Damon, P.E., 1982a, Cenozoic mineral deposits and subduction-related
magmatic arcs in Mexico GSA Bulletin; June 1982; v. 93; no. 6; p. 533-544.
Clark, K.F., Foster, C.T., and Damon, P.E., 1982b, Carta Geologico Minera La Cieneguilla G13-D22, Escala
1:50,000, 2003. Informe De La Cartografia Geologico Minera, Consejo de Recursos Minerales (Regional
Geological data published in Spanish).
Daniels, A.H., 2009, Technical Report on the Peñoles Gold-Silver Project, Durango, Mexico. Prepared for
Riverside Resources Inc., May 31, 2009. NI 43-101 report.
Daniels, A.H., 2011, Updated Technical Report on the Peñoles Gold-Silver Project, Durango, Mexico.
Prepared for Sierra Madre Development Inc., 71p.
Grcic, B., 2011. Gold Recovery by Cyanide Leaching on Samples from Sierra Madre’s El Capitan Project.
Inspectorate Exploration & Mining Services Ltd., October 7, 2011. Project No. 1103006.
Journel, A.G., and Huijbregts, Ch. J., 1978, Mining Geostatistics. London, Academic Press, 600p.
APRIL 2015
MORRO BAY RESOURCES LTD. | RIVERSIDE RESOURCES INC. 19-2 NI 43-101 TECHNICAL REPORT PEÑOLES PROJECT
Lambeck, L., 2014, Jesus Maria Mine: A New Structural Interpretation to Suggest a North Dipping Fault,
termed the Gully Fault, which is directly associated with the high-grade ore. Memorandum prepared for
Morro Bay Resources Ltd., 6p.
Magrum, M., 2013, Review of Technical Information and Proposed Exploration Program for the Peñoles
Project, Durango State, Mexico. Prepared for Sierra Madre Development Corp. and Morro Bay Capital
Corp. 49p. (plus appendices).
McCrea, J.A., 2006. NI 43-101 Technical Report on the La Pitarrilla Property, Durango Mexico. Prepared
for Silver Standard Resources Ltd. by James A. McCrea, dated September 28, 2006. Vancouver, Canada,
100p.
McDowell, F.W. and Keizer, R.P., 1977, Timing of mid Tertiary Volcanism in the Sierra Madre Occidental
between Durango City and Mazatlan, Mexico; Geological Society of America Bulletin V88, p 1479 – 1487.
Myers, G., Smith, D., and Lopez-Luque, J., 2014, NI 43-101 Technical Report of the Peñoles Gold-Silver
Project, Durango, Mexico. Prepared for Morro Bay Resources Ltd. and Riverside Resources Inc., 88p.
Redak, S., 2015a, San Sebastien: High-grade epithermal gold and silver, Durango, Mexico. AME-BC
Mineral Exploration Roundup, Vancouver, BC, Canada, Core Shack Abstracts vol. p. 93-94.
Redak, S., 2015b, Hecla Mining Company. Retrieved from http://www.hecla-
mining.com/exploration/exploration_sansebastian.php
Sedlock, R.L., Ortega-Gutierrez, F., and Speed, R.C., 1993, Tectonostratigraphic Terranes and Tectonic
Evolution of Mexico: Geological Society of America, Special Paper 278, 153p.
Starling, M., 2008. Riverside Resources Internal Report.
Staude, J-M, G., 1995, Epithermal Mineralization in the Sierra Madre Occidental, and the Metallogeny of
Northwestern Mexico: Ph.D, dissertation, Tucson, University of Arizona, 248p.
Whiting, B., 2013, Geology and Discovery History of the Large “La Preciosa” Epithermal Silver-gold
Deposit in Durango, Mexico. Whistler-2013: Geosciences for Discovery, Society of Economic Geologists,
Whistler, BC, Canada, September 24-27, Abstract vol. p. 97, e-Poster vol. p. 603-609.
Whiting, B.H., 2008, Technical Report – Mineral Resource Estimate V – La Preciosa Silver-gold Deposit,
Durango State, Mexico. Prepared for Orko Silver Corporation, 75p. (plus maps).
Wright, F., 2012. Re: Interim Data – El Capitan Cyanide Leach Evaluation. F. Wright Consulting Inc.
August 25, 2012. Memorandum.
APRIL 2015
MORRO BAY RESOURCES LTD. | RIVERSIDE RESOURCES INC. 20-1 NI 43-101 TECHNICAL REPORT PEÑOLES PROJECT
20 DATE AND SIGNATURE PAGE
Bernard Henry (Ben) Whiting
I, Bernard Henry Whiting, of 427 Garrett Street, New Westminster, BC, Canada, V3L 3S1, Professional
Geoscientist and President of Whiting Geological Consulting Inc., do hereby certify that:
1. I am a co-author of the report titled; “NI 43-101 Technical Report, Mineral Resource Estimates for the El Capitan & Jesus Maria deposits, Peñoles Gold-Silver Project, Durango State, Mexico” for Morro Bay Resources Ltd. and Riverside Resources Inc., dated April 16, 2015, with effective date of March 2, 2015.
2. I am a graduate of the University of British Columbia and hold a Bachelor of Science (B.Sc.) degree 1979 and a Master of Science (M.Sc.) degree 1989 in geological sciences.
3. I am an economic geologist and have practiced my profession on a full time basis since 1979 in North America, South America, Europe, Asia and Oceania, including over 12 years exploration experience with projects in Mexico. I have also taught as an Adjunct Professor of geological sciences 1995-2006 and mining engineering 2000-2005 at Queen’s University and mining engineering 1989 at the University of British Columbia.
4. I have been a registered Professional Geoscientist (P.Geo.) member in good standing of the Association of Professional Engineers and Geoscientists of British Columbia (APEGBC) since 1991 (registration # 19851) and of the Association of Professional Geoscientists of Ontario (APGO) since 2002 (registration # 0347). I am also a Fellow of the Society of Economic Geologists (SEG) and a member of the Canadian Institute of Mining, Metallurgy and Petroleum (CIM) and La Asociación de Ingenieros de Minas Metalurgistas y Geólogos de México (AIMMGM).
5. I have read the definitions of “Qualified Person” set out in National Instrument 43-101 and certify that by reason of my education, affiliation with a professional association (as defined in NI 43-101) and past relevant work experience, I fulfill the requirements to be a “Qualified Person” for the purposes of NI 43-101.
6. I have conducted several site visits to the Peñoles Project, the most recent of which was on January 20-22, 2015.
7. I take responsibility for the preparation of this report, with the exclusion of Section 13 – Mineral Processing and Metallurgical Testing (see: M. Redfearn) and Section 14 – Mineral Resource Estimate (see: R.C. Sim), utilizing data gathered in the field in my role as a consulting geologist and information summarized in the references of this report.
8. I am independent of both Morro Bay Resources Ltd. and Riverside Resources Inc. and all their subsidiaries as defined in NI 43-101 and in the Companion Policy to NI 43-101.
9. I have read National Instrument 43-101, Companion Policy 43-101CP and Form 43-101F1 and this technical report has been prepared in compliance with that instrument.
10. To the best of my knowledge, information and belief, this technical report contains all the scientific and technical information that is required to be disclosed to make this technical report not misleading.
/sig/ B.H. Whiting
“original signed and sealed”
______________________________
B. H. (Ben) Whiting, M.Sc., P.Geo.
Dated at Vancouver, British Columbia, Canada this 16th Day of April, 2015.
APRIL 2015
MORRO BAY RESOURCES LTD. | RIVERSIDE RESOURCES INC. 20-2 NI 43-101 TECHNICAL REPORT PEÑOLES PROJECT
Robert Sim, P.Geo, SIM Geological Inc.
I, Robert Sim, P.Geo, do hereby certify that:
1. I am an independent consultant of:
SIM Geological Inc.
6810 Cedarbrook Place
Delta, British Columbia, Canada V4E 3C5
2. I graduated from Lakehead University with an Honours Bachelor of Science (Geology) in 1984.
3. I am a member, in good standing, of the Association of Professional Engineers and Geoscientists of British Columbia, License Number 24076.
4. I have practiced my profession continuously for 31 years and have been involved in mineral exploration, mine site geology and operations, mineral resource and reserve estimations and feasibility studies on numerous underground and open pit base metal and gold deposits in Canada, the United States, Central and South America, Europe, Asia, Africa and Australia.
5. I have read the definition of “qualified person” set out in National Instrument 43-101 (NI 43-101) and certify that by reason of my education, affiliation with a professional association (as defined in NI 43-101) and past relevant work experience, I fulfill the requirements to be a “qualified person” for the purposes of NI 43-101.
6. I am a co-author of the technical report titled NI 43-101 Technical Report, Mineral Resource Estimates for the El Capitan & Jesus Maria deposits, Peñoles Gold-Silver Project, Durango State, Mexico, dated April 16, 2015, with an effective date of March 2, 2015 (the Technical Report), and accept professional responsibility for Section 14 and portions of Sections 1, 2, 17, and 18.
7. I visited the property on June 12, 2012 and again on May 8, 2014.
8. I have no prior involvement with the Property other than to review the drilling operations during a site visit in June 2012.
9. As of the effective date of the Technical Report, to the best of my knowledge, information and belief, the Technical Report contains all scientific and technical information that is required to be disclosed to make the Technical Report not misleading.
10. I am independent of Morro Bay Resources Ltd. and Riverside Resources Inc. applying all of the tests in Section 1.5 of NI 43-101.
11. I have read NI 43-101 and Form 43-101F1, and the Technical Report has been prepared in compliance with that instrument and form.
Dated this 16th
day of April 2015.
“original signed and sealed”
_________________________
Robert Sim, P.Geo
APRIL 2015
MORRO BAY RESOURCES LTD. | RIVERSIDE RESOURCES INC. 20-3 NI 43-101 TECHNICAL REPORT PEÑOLES PROJECT
Michael Redfearn, P.Eng., Bureau Veritas Commodities Canada Ltd.
I, Michael Redfearn, P.Eng., do hereby certify that:
1. I am an independent contractor with:
Bureau Veritas Commodities Canada Ltd.
11620 Horseshoe Way
Richmond, BC, Canada V7A 4V5
2. I graduated from Michigan Technological University with a Bachelor of Science (Metallurgical Engineering) in 1968.
3. I am a member, in good standing, of the Association of Professional Engineers and Geoscientists of British Columbia, License Number 8154.
4. I have practiced my profession continuously for 46 years and have been involved in mineral processing and metallurgical testing, including scoping, prefeasibility and feasibility studies on numerous base metal and gold deposits in Canada, the United States and South America.
5. I have read the definition of “qualified person” set out in National Instrument 43-101 (NI 43-101) and certify that by reason of my education, affiliation with a professional association (as defined in NI 43-101) and past relevant work experience, I fulfill the requirements to be a “qualified person” for the purposes of NI 43-101.
6. I am a co-author of the technical report titled NI 43-101 Technical Report, Mineral Resource Estimates for the El Capitan & Jesus Maria deposits, Peñoles Gold-Silver Project, Durango State, Mexico, dated April 16, 2015, with an effective date of March 2, 2015 (the Technical Report), and accept professional responsibility for Section 13.
7. I have not visited the property.
8. I have no prior involvement with the Property other than to conduct metallurgical testing programs on samples in 2011, 2012, 2013 and 2015.
9. As of the effective date of the Technical Report, to the best of my knowledge, information and belief, the Technical Report contains all scientific and technical information that is required to be disclosed to make the Technical Report not misleading.
10. I am independent of Morro Bay Resources Ltd. and Riverside Resources Inc. applying all of the tests in Section 1.5 of NI 43-101.
11. I have read NI 43-101 and Form 43-101F1, and the Technical Report has been prepared in compliance with that instrument and form.
Dated this 16th
day of April 2015.
“original signed and sealed”
_________________________
Michael Redfearn, P.Eng.