Embed Size (px)
Citation preview

2015 Annual Report for Biological Resources Monitoring
Desert Sunlight Solar Project, Riverside County BLM CASE FILE NUMBER CACA-48649
Biological Opinion# FWS-ERIV-08B0789-11F0041
Prepared for: BUREAU OF LAND MANAGEMENT
Palm Springs – South Coast Field Office 1201 Bird Center Drive
Palm Springs, California 92262
Prepared by: IRONWOOD CONSULTING, INC. 1030 Nevada Street, Suite 201
Redlands, CA 92374
Desert Sunlight Solar Farm 2015 Annual O&M Biological Report ii
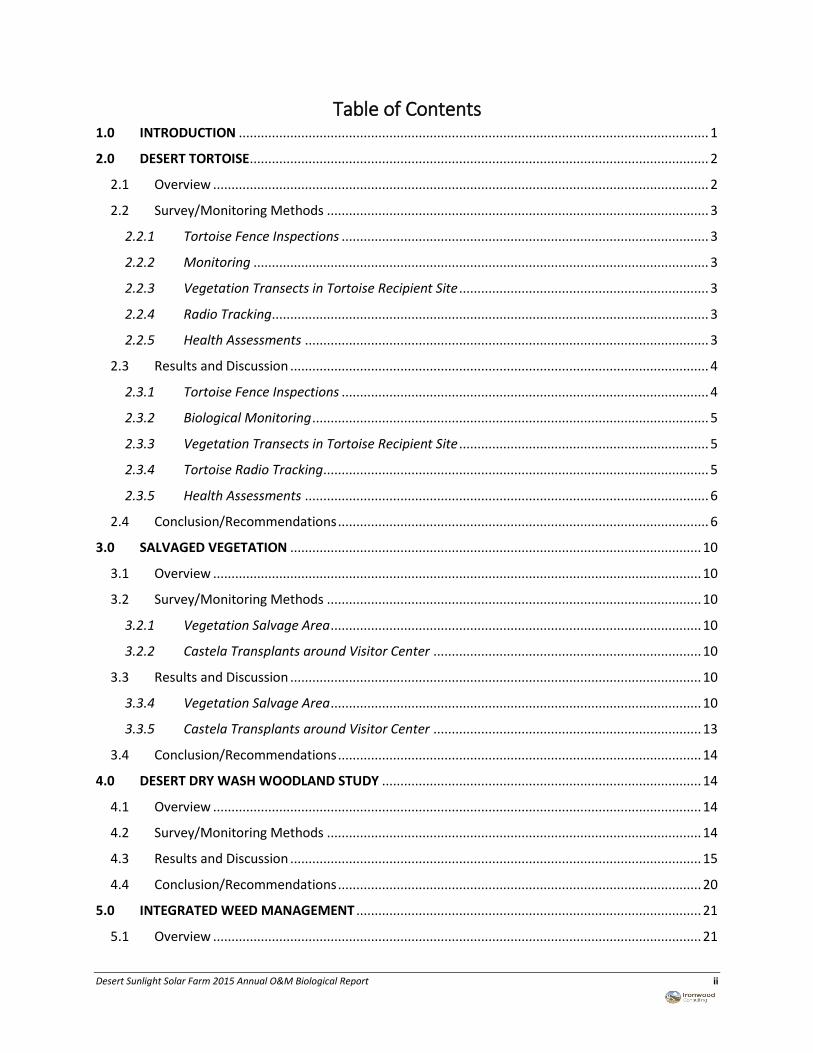
Table of Contents 1.0 INTRODUCTION ................................................................................................................................ 1
2.0 DESERT TORTOISE ............................................................................................................................. 2
2.1 Overview ....................................................................................................................................... 2
2.2 Survey/Monitoring Methods ........................................................................................................ 3
2.2.1 Tortoise Fence Inspections .................................................................................................... 3
2.2.2 Monitoring ............................................................................................................................ 3
2.2.3 Vegetation Transects in Tortoise Recipient Site .................................................................... 3
2.2.4 Radio Tracking ....................................................................................................................... 3
2.2.5 Health Assessments .............................................................................................................. 3
2.3 Results and Discussion .................................................................................................................. 4
2.3.1 Tortoise Fence Inspections .................................................................................................... 4
2.3.2 Biological Monitoring ............................................................................................................ 5
2.3.3 Vegetation Transects in Tortoise Recipient Site .................................................................... 5
2.3.4 Tortoise Radio Tracking ......................................................................................................... 5
2.3.5 Health Assessments .............................................................................................................. 6
2.4 Conclusion/Recommendations ..................................................................................................... 6
3.0 SALVAGED VEGETATION ................................................................................................................ 10
3.1 Overview ..................................................................................................................................... 10
3.2 Survey/Monitoring Methods ...................................................................................................... 10
3.2.1 Vegetation Salvage Area ..................................................................................................... 10
3.2.2 Castela Transplants around Visitor Center ......................................................................... 10
3.3 Results and Discussion ................................................................................................................ 10
3.3.4 Vegetation Salvage Area ..................................................................................................... 10
3.3.5 Castela Transplants around Visitor Center ......................................................................... 13
3.4 Conclusion/Recommendations ................................................................................................... 14
4.0 DESERT DRY WASH WOODLAND STUDY ....................................................................................... 14
4.1 Overview ..................................................................................................................................... 14
4.2 Survey/Monitoring Methods ...................................................................................................... 14
4.3 Results and Discussion ................................................................................................................ 15
4.4 Conclusion/Recommendations ................................................................................................... 20
5.0 INTEGRATED WEED MANAGEMENT .............................................................................................. 21
5.1 Overview ..................................................................................................................................... 21

Desert Sunlight Solar Farm 2015 Annual O&M Biological Report iii
5.2 Survey/Monitoring Methods ...................................................................................................... 21
5.3 Results and Discussion ................................................................................................................ 22
5.3.1 Solar Farm ........................................................................................................................... 22
5.3.2 Gen-Tie Line ......................................................................................................................... 23
5.3.3 Herbicide Use ...................................................................................................................... 23
5.4 Conclusions and Recommendations ........................................................................................... 28
6.0 RAVEN MANAGEMENT................................................................................................................... 28
6.1 Overview ..................................................................................................................................... 28
6.2 Survey/Monitoring Methods ...................................................................................................... 28
6.2.1 Incidental Sightings ............................................................................................................. 28
6.2.2 Avian Point Count Surveys................................................................................................... 29
6.2.3 Nest Surveys ........................................................................................................................ 29
6.3 Results and Discussion ................................................................................................................ 31
6.3.1 Incidental Sightings ............................................................................................................. 31
6.3.2 Avian Point Count Survey Results ........................................................................................ 32
6.3.3 Nest Survey Results ............................................................................................................ 36
6.4 Conclusion and Recommendations............................................................................................. 38
REFERENCES ................................................................................................................................................ 39
LIST OF TABLES
Table 1. 2015 Desert Tortoise Task………………………………………………………………………………………………………..2 Table 2. Results from ELISA tests for M. testudenium and M. testudenium (2011-2015)………………….…….9 Table 3. Status of Surviving Salvaged Plants, 2015…………………………………….…………………………………….……11 Table 4. Survivorship Thresholds for Salvaged Plants………………………………………………………………………..….11 Table 5. Status of Crucifixion Thorn (Castela Emoryi), 2015………………………………………………………………....13 Table 6. Desert Dry Wash Study Health and Vigor Results………………………………………….……………………17-18 Table 7. Summary of Weed Survey Dates and Locations, 2015………………………………….…………………….……22 Table 8. Raven Detections during Avian Point Counts 2011-2015…………………………………………………………33 Table 9. Total Number of Ravens Detections at Point Counts Over Time………………………………………………33 Table 10. Raven Density Estimates by Season and Year…………………………………………………………………………34 Table 11. Estimated Density of Common ravens at Desert Center over Time………………………………………..35 Table 12. Comparison of success, failure and total number of raven nests from 2013 through 2015…….37

Desert Sunlight Solar Farm 2015 Annual O&M Biological Report iv
LIST OF FIGURES
Figure 1. Translocatee and Resident Tortoises Last Radio-tracking Locations………………………………………..7 Figure 2. Control Tortoises Last Radio-tracking Locations………………………………………………………………………8 Figure 3. Remaining Surviving Salvaged Plants………………………………………………………………………………………12 Figure 4. DDWW Study Sites ………………………………………………………………………………………………………………..19 Figure 5. Solar Farm Survey Results for Incidental Weeds January-March 2015……………………………………25 Figure 6. Gen-tie Line A-1 Survey Results for Incidental Weeds January-March 2015…………………………….26 Figure 7. Herbicide Use Areas ………………………………………………………………………………………………………….……27 Figure 8. Avian Point Count Locations associated with Desert Sunlight Solar Farm …………………………….…30 Figure 9. Raptor and Raven Nests Detected During 2015……………………………………………………………………..37
LIST OF PHOTOS Photo 1. Erosion post-rain events………………………………………………………………………………………………………….4 Photo 2. Permanent repairs of erosion ………………………………………………………………………………………………...4 Photo 3. Permanent repairs to erosion along tortoise fence inside and outside Project boundary………..5 Photo 4. Front view of 6004 carcass……………………………………………………………………………………………………...6 Photo 5. Lateral view of 6213 carcass…………………………………………………………………………………………………….7 Photo 6. Remaining Castela around the Visitor Center, December 2015………………………………………………13 Photo 7. Repeat Photograph Site #1 Palo Verde #9 - 28 December 2012…………………………………………….15 Photo 8. Repeat Photograph Site #1, Palo Verde #9 - 11 December 2015……………………………………………15 Photo 9. Repeat Photograph Site #3, Smoke Tree #3 - 28 Dec 2012…………………………………………………….16 Photo 10. Repeat Photograph Site #3, Smoke Tree #3 - 11 December 2015………………………………………….16 Photo 11. Dead plants beneath solar arrays………………………………………………………………………………………….23 Photo 12. Dead plants in retention basins…………………………………………………………………………………………….23 Photo 13. Native rubber rabbit bush (Ericameria nauseosa) affected by herbicide use…………………………24 Photo 14. Native creosote (Larea tridentata) affected by herbicide use……………………………………………….24 Photo 15. Common raven pulling apart project trash, while perched on solar panels……………………….….31

Desert Sunlight Solar Farm 2015 Annual O&M Biological Report 1
1.0 INTRODUCTION Desert Sunlight Solar Farm (Project) transitioned from the construction phase of the Project to the
Operations and Management (O&M) phase of the Project beginning on January 1, 2015 under Next Era
Energy. Biological requirements have also been phased into the requirements for O&M per the following
guiding documents of the Project:
Biological Opinion (BO)
Final Environmental Impact Statement (FEIS)
Desert Tortoise Translocation Plan (DTTP)
Vegetation Salvage Plan (VSP)
Desert Dry Wash Woodland Plan (DDWWP)
Integrated Weed Management Plan (IWMP)
Pesticide Use Proposal (PUP) and associated Environmental Assessment (EA)
Raven Management Plan (RMP)
Bird and Bat Conservation Strategy (BBCS)/Avian and Bat Protection Plan (ABPP)
Ironwood Consulting, Inc. (Ironwood) has performed all biological requirements associated with the
above plans throughout 2015 for O&M, with the exception to some tasks of the BBCS (approved in
December 2014) which replaces the older ABPP. A different consulting firm was tasked for the
requirements of the BBCS.
As the Project phased into O&M, regular biological presence also decreased at the site and occurred only
when required biological tasks were necessary. Monthly summary reports of all biological activities
completed by Ironwood were submitted to Next Era at the end of each month of activity, including all the
collected raw, unprocessed data.
Biological requirements for O&M will be discussed in this report per each biological resource.

Desert Sunlight Solar Farm 2015 Annual O&M Biological Report 2
2.0 DESERT TORTOISE
2.1 Overview
Per the BO and the DTTP, requirements for desert tortoise include tortoise fence inspections, biological
monitoring if necessary, radio tracking, and health assessments. The intention of these tasks are to
monitor the health and activity of translocated tortoises from the project site and prevent any harm to
desert tortoises during the O&M phase of activities. All desert tortoise related tasks conducted in 2015
are summarized in Table 1.
Table 1. 2015 Desert Tortoise Tasks
Time Period
2015 Tortoise Radio Tracking
Tortoise Health
Assessments Tortoise Fence Inspections
January 1/20/15 C. Hackbarth, A. Robinson - 1/20/15 C. Hackbarth, A. Robinson
February 2/17-18/15 B. Sandstrom - 2/17/15 B. Sandstrom
March
3/21-22/2015 P. Flores; 3/25-26/2015 E.
Lockward -
3/3/15 P. Pacheco, B. Sandstrom,
P. Flores
April
4/8-9/15 P. Flores, 4/14-15/15 L.Chow, 4/21-22
L. Chow & K.Hughes; 4/28-29/15 E. Lockward -
4/7/15 P. Flores, 4/22/15 K.
Hughes
May
5/6-5/11B. Sandstrom, K. Kermoian; 5/14-5/15 K.
Hughes; 5/19-5/20 L. Chow; 5/26-/27 E. Lockward
5/6-5/11 K. Kermoian, B.
Sandstrom 5/8 B. Sandstrom
June 6/3-6/4 L. Chow, 6/23-6/24 K. Hughes -
6/21-6/23 B. Sandstrom, P.
Pacheco, P. Flores
July 7/8-7/9 K. Hughes, 7/28 K. Hughes, L. Chow - 7/9, 7/20, 7/31 K. Hughes
August 8/11-8/12, K. Hughes, 8/27-8/28, K. Hughes - 8/10 K. Huges, fence repair
September 9/9-9/10 K. Hughes, 9/28-9/29 L. Chow - 9/10 K. Hughes
October
10/9-10/10 K. Hughes, 10/26 E. Locward, 10/27
K. Hughes
10/30-10/31 B.
Sandstrom, R. Woodard 10/9 K. Hughes
November 11/18-11/19 K. Hughes
11/2-11/3 C. Bedwell, L.
Chow 11/18 K. Hughes
December 12/10 L. Chow - 12/8 P. Pacheco

Desert Sunlight Solar Farm 2015 Annual O&M Biological Report 3
2.2 Survey/Monitoring Methods
2.2.1 Tortoise Fence Inspections The perimeter tortoise fence was inspected at least once a month by Ironwood biologists throughout the
year. Inspections occurred during visits to the site in conjunction with monthly inner perimeter weed
inspections and tortoise radio-tracking events. After rainstorms, if Ironwood biologists were not nearby,
onsite personnel also inspected the tortoise fence within 24 hours, as required by the BO, and contacted
Ironwood if there were any issues with the tortoise fence.
2.2.2 Monitoring The Biological Opinion states that “Authorized Biologists or Biological Monitors would be present during
all ground-disturbing construction activities that have the potential to disturb soil, vegetation, and
wildlife…to minimize incidental death and injury of desert tortoises residing in or entering the construction
or O&M disturbance areas (e.g., project sites, linear facilities, access roads). Because of this, any work or
repairs that occur outside the biologically cleared solar farm site is required to have a biological monitor.
Prior to beginning any ground disturbing activities outside the Project, biological monitors familiarized
crews with species of wildlife and plants that are of concern for the Project. Biological monitors walked
or drove ahead of crews surveying for wildlife and plants. When areas were cleared biologically, crews
were allowed to access areas and the biological monitor remained present during all ground-disturbing
activities that occurred outside the fenced project boundary to ensure that ground disturbance is minimal
and no species of concern were harmed.
2.2.3 Vegetation Transects in Tortoise Recipient Site Five baseline points were previously established at the Sunlight Recipient Site and the Chuckwalla
Control Site (10 baseline points total) and surveyed annually to measure potential changes in habitat
characteristics. Each baseline point used line-intercept transects heading east and north to record cover
estimates of each plant species detected as well as the plants found within each 5m x 50m plot. Data
was recorded on datasheets.
2.2.4 Radio Tracking There are six translocated, six resident and seven control tortoises associated with the Desert Sunlight
Solar Farm Project. These tortoises were radio tracked per the BO weekly in the spring, twice monthly in
the summer and fall, and once a month in the winter.
2.2.5 Health Assessments Comprehensive health assessments are required per the BO in the spring and fall and were conducted per
US Fish and Wildlife Service guidelines. Health exams were performed by permitted personnel only.

Desert Sunlight Solar Farm 2015 Annual O&M Biological Report 4
2.3 Results and Discussion
2.3.1 Tortoise Fence Inspections The tortoise fence remained intact throughout most of 2015 during every monthly inspection with the
exception of the summer monsoonal months of July and August. Due to heavy rain events those months,
erosion occurred on the eastern part of the permanent tortoise fence that left a small breach on the
tortoise fence. Onsite personnel inspected the fence after all rain events and temporarily blocked any
gaps in the fence with plywood until those areas could be permanently repaired (see photos 1 and 2). A
biologist also inspected areas where temporary repairs were made for any signs of tortoise entering the
site – no sign was detected.
Photo 1. Erosion post-rain events Photo 2. Permanent repairs of erosion

Desert Sunlight Solar Farm 2015 Annual O&M Biological Report 5
2.3.2 Biological Monitoring Only one biological monitoring event occurred during 2015 for O&M related to repairs to the permanent
tortoise fence on the eastern side of the Project. The monitoring event occurred on August 10, 2015
following substantial rain events earlier in the week due to some minor breeches in the tortoise fence. A
biological monitor was present to ensure that no sensitive wildlife or plants were harmed outside project
boundaries when the repair crew took equipment off site to the outer eastern boundary of the Project
site. The biological monitor ensured that no wildlife was harmed and the crew remained within the
Project right-of-way as erosion repairs occurred (see photo 3).
Photo 3. Permanent repairs to erosion along tortoise fence inside and outside project boundary
2.3.3 Vegetation Transects in Tortoise Recipient Site Vegetation transects were completed on March 13-14, 2015 by Lead Botanist Michael Honer and two
assistants. There were no significant changes noted, and data will be tabulated when tortoises are
decommissioned and processed with data collected in previous years to note potential changes since
translocation efforts began.
2.3.4 Tortoise Radio Tracking All tortoises appeared to display seasonally appropriate behavior throughout the year and were located
during each radio tracking event, with the exception of 6117, 6004, and 6213 discussed below. The last
tortoise radio tracking locations in 2015 are depicted in Figures 1 and 2.
The only tortoise that was not located during each event was resident tortoise 6117, whose transmitter
may have failed. It was last located in a burrow on April 14, 2015. Since then, the transmitter has not been
heard after much searching within and outside its range, nor has the tortoise been found occupying any
of its historical burrows. Its historical range is not large and there has been some effort during each radio
tracking event to locate the tortoise in its high fidelity burrows, but to date the effort has been
unsuccessful. Total search time for the lost tortoise has exceeded over 50 hours.

Desert Sunlight Solar Farm 2015 Annual O&M Biological Report 6
Two tortoise mortalities were detected during radio tracking events this year – one was translocatee male
tortoise 6004 and another was control male tortoise 6213. Cause of death was unclear for both tortoises,
but was suspected to be predator related. Both carcasses were left in place per agency instruction and
mortality reports were sent to agencies on August 28, 2015 for tortoise 6004 and on September 30, 2015
for 6213 following the discovery of the mortalities.
Photo 4. Front view of 6004 carcass Photo 5. Lateral view of 6213 carcass
2.3.5 Health Assessments Comprehensive health assessments performed on all transmittered tortoises in the spring and fall of
2015 did not indicate any unusual or troublesome conditions - tortoises were non-symptomatic for
upper respiratory disease, and no recent traumatic injuries were recorded. Results of all ELISA tests
performed by University of Florida for Mycoplasma agassizii and Mycoplasma testudinium are
presented in table 2.
2.4 Conclusion/Recommendations
All tortoise requirements for O&M were met during 2015. Tortoises displayed seasonally appropriate
behavior during radio tracking events, tortoise fence issues were dealt with in a timely manner, and
tortoise health results in 2015 were consistent with previous results. Radio tracking, fence inspections,
and health assessments will continue throughout the next year until decommissioning of the tortoises,
which is expected to occur in fall 2016 with agency approval.

Desert Sunlight Solar Farm 2015 Annual O&M Biological Report 7

Desert Sunlight Solar Farm 2015 Annual O&M Biological Report 8

Table 2. Results from ELISA tests for Mycoplasma testudenium and Mycoplasma testudenium (2011-2015)
KEY:
Myco
pla
sm
a
testu
den
ium
Myco
pla
sm
a
ag
gassiz
ii
Myco
pla
sm
a
testu
den
ium
Myco
pla
sm
a
ag
gassiz
ii
Myco
pla
sm
a
testu
den
ium
Myco
pla
sm
a
ag
gassiz
ii
Myco
pla
sm
a
testu
den
ium
Myco
pla
sm
a
ag
gassiz
ii
Myco
pla
sm
a
testu
den
ium
Myco
pla
sm
a
ag
gassiz
ii
Myco
pla
sm
a
testu
den
ium
Myco
pla
sm
a
ag
gassiz
ii
Myco
pla
sm
a
testu
den
ium
Myco
pla
sm
a
ag
gassiz
ii
Myco
pla
sm
a
testu
den
ium
Myco
pla
sm
a
ag
gassiz
ii
Myco
pla
sm
a
testu
den
ium
Myco
pla
sm
a
ag
gassiz
ii
6001 <32 <32 32 <32 <32 32 <32 <32 <32 <32 <32 <32 32 <32 - - - - dead 2014
6002 <32 <32 64 <32 32 32 <32 <32 <32 <32 128 <32 <32 <32 <32 32 <32 <32
6003 <32 <32 <32 <32 <32 <32 <32 <32 <32 <32 <32 <32 <32 <32 <32 - <32 <32
6004 <32 <32 128 <32 64 <32 <32 <32 <32 <32 <32 <32 <32 <32 - <32 - - dead 2015
6005 - - 64 <32 <32 <32 <32 <32 <32 <32 <32 <32 - - <32 <32 <32 <32
6006 - - 64 <32 32 <32 <32 <32 <32 <32 <32 <32 <32 <32 <32 - <32 <32
6007 - - <32 <32 <32 <32 <32 <32 <32 <32 <32 <32 <32 <32 <32 - <32 <32
6111 <32 <32 32 <32 <32 <32 <32 <32 <32 <32 32 <32 <32 <32 <32 <32 <32 <32
6114 <32 <32 <32 <32 <32 <32 <32 <32 <32 32 <32 <32 - - - - - - dead 2014
6115 <32 <32 64 <32 32 <32 <32 <32 <32 <32 <32 <32 <32 <32 <32 - <32 <32
6116 <32 <32 - - <32 <32 <32 <32 <32 <32 <32 <32 <32 <32 <32 <32 <32 <32
6117 <32 <32 64 <32 64 32 <32 <32 <32 <32 <32 <32 <32 <32 - - - - dead/lost 2015
6119 <32 <32 - - 64 <32 <32 <32 <32 <32 32 <32 32 <32 <32 <32 <32 <32
6123 <32 <32 64 <32 32 <32 <32 <32 <32 <32 32 <32 <32 <32 <32 <32 <32 <32
6210 - - - - <32 <32 <32 <32 <32 <32 <32 <32 <32 <32 <32 <32 <32 <32
6211 - - - - <32 <32 <32 <32 <32 <32 32 <32 <32 <32 <32 <32 <32 <32
6212 - - - - <32 <32 <32 <32 <32 <32 <32 <32 <32 <32 <32 <32 <32 <32
6213 - - - - 32 <32 <32 <32 <32 32 <32 <32 32 <32 - <32 - - dead 2015
6214 - - - - 32 <32 <32 <32 <32 <32 <32 <32 <32 <32 <32 <32 <32 <32
6215 - - - - 32 <32 <32 <32 <32 <32 <32 <32 <32 <32 <32 32 <32 <32
6216 - - - - <32 <32 <32 <32 <32 <32 <32 <32 <32 <32 <32 <32 <32 <32
T
RA
NSL
OC
ATE
DR
ESID
ENT
CO
NTR
OL
2011
2012
Tortoise IDTortoise
Status
FALL
2015
2014
SPRING FALL SPRING FALL SPRING FALLSPRING FALL
2013
ELIZA TiterMycoplasma
aggassizii RESULT
Mycoplasma
testudenium RESULT
<32 Negative Negative
32 Suspect Suspect
64 Positive Suspect
128 Positive Positive

Desert Sunlight Solar Farm 2015 Annual O&M Biological Report 10
3.0 SALVAGED VEGETATION
3.1 Overview
This report summarizes the status of all salvaged plants housed in the Vegetation Salvage Area and the
Visitor Center of the Desert Sunlight Solar Farm throughout 2015. These plants were all salvaged per
provisions of the Vegetation Salvage Plan (VSP) and have been in the care of the Ironwood Lead Botanist,
Michael Honer, since construction began. Detailed methods, timing, success thresholds, and adaptive
management have been reported in quarterly and annual reports throughout construction and methods
will remain the same throughout the O&M period.
3.2 Survey/Monitoring Methods
3.2.1 Vegetation Salvage Area At the beginning of 2015, a total of 85 plants remained on the Vegetation Salvage Area. All of these
plants were extracted per the VSP from the solar site during construction and transplanted to the area.
Many additional plants (mostly cacti) were also extracted during construction, but were subsequently
donated to various entities (detailed in previous year-end reports).
The health and vigor monitoring for the remaining plants onsite was conducted by Ironwood Lead Botanist
Michael Honer at the Vegetation Salvage Area near the Visitor Center.
Salvaged plants were placed in four categories: robust, fair, poor, or dead depending on the percentage
of the plant that appears alive as described in the Vegetation Salvage Plan.
3.2.2 Castela Transplants around Visitor Center Before construction in 2011, vegetative cuttings from several crucifixion thorn plants (Castela emoryi)
were taken from the Desert Sunlight Solar Farm site as well as surrounding areas. These cuttings were
propagated at the Rancho Santa Ana Botanic Garden (RSABG) to appropriate size for transplant. In
November 2014, these crucifixion thorn propagules were brought to the Project’s Visitor Center and
experimentally transplanted following recommendations of RSABG nursery staff.
These plants have been caged against herbivory and RSABG advised against watering these plants until
late spring 2015, so all the dripline emitters near these plants have only been unplugged for a brief period
in May 2015 during the second quarter’s health assessments. Dripline emitters were capped again in
anticipation of summer monsoonal rains and continue to remain capped.
3.3 Results and Discussion
3.3.4 Vegetation Salvage Area All plants appear to have established nicely and should require little maintenance going forward. The
cacti seem to be surviving the severe continuing drought across the region, and should not need
supplemental watering. There were a few scattered summer monsoon events this summer, which
provided adequate natural watering for all the plants, so no additional watering occurred for the
remainder of 2015. The status of surviving plants during the last visit of 2015 is summarized in Table 3.

Desert Sunlight Solar Farm 2015 Annual O&M Biological Report 11
Table 3: Status of Surviving Salvaged Plants, 2015
Three salvaged plant mortalities were recorded in 2015:
1 Mamillaria tetrancistra was succumbed to rodent herbivory (March 2015)
1 Cylindropuntia echinocarpa succumbed to long-term termite damage (October 2015)
1 Fouquieria splendens succumbed to a boring insect infestation (October 2015)
To date, survivorship thresholds for all salvaged plants remains within the threshold required in the VSP
and is summarized in Table 4.
Table 4. Survivorship Thresholds for Salvaged Plants
Scientific name Common nameTotal
survivingRobust Fair Poor Dead
Cylindropuntia echinocarpa Golden cholla 37 29 7 2 1
Cylindropuntia ramocissima Pencil cholla 14 14
Opuntia basilaris Beavertail cactus 4 3 1
Mammillaria tetrancistra Nipple cactus 4 4 1
Coryphantha alversonii Foxtail cactus 1 1
Fouquieria splendens Ocotillo 22 22 1
TOTAL ALL PLANTS 82 73 8 2 3
DSSF Vegetation Salvage Area - Surviving Transplant Status - December 11, 2015
Salvaged Plants
Original
Number of
Salvaged
Plants
Plant
Mortalities
(2011-2015)
Surviving
Number of
Plants
(December
2015)
Survivorship
Threshold
Required
Survivorship
Achieved to
Date
Cactus 72 12 60 50% 75%
Ocotillo 29 7 22 75% 83%

Desert Sunlight Solar Farm 2015 Annual O&M Biological Report 12
Figure 3. Remaining Surviving Salvaged Plants

Desert Sunlight Solar Farm 2015 Annual O&M Biological Report 13
3.3.5 Castela Transplants around Visitor Center To date, 14 of these plants appear to be surviving. General Health and Vigor monitoring as of October 8,
2015 are summarized in Table 3.
Table 5. Status of Crucifixion Thorn (Castela emoryi), 2015
There were significant mortalities of many of these plants over the summer of this year - all of the
smaller plants and some larger plants died. Although watering of these plants occurred in May 2015,
and several monsoonal storms watered the plants over the summer, most plants have perished. There
is no supportable explanation for this beyond the assumption that these plants do not survive
transplantation well. During transplantation, very delicate minor root growth on the smaller plants
were observed, which sometimes detached during planting. It is suspected that these plants were not
developed enough to transplant effectively. The larger plants had a much more developed root mass,
which appeared to have remained intact during the transplantation. Some of these larger plants are still
doing quite well, leafing out and growing new stems.
There were no success thresholds assigned to these plants in the Vegetation Salvage Plan, but the
intention is to keep good data of all of these Castela maintaining some genetic participation in the ecology
of the Chuckwalla Valley.
Photo 6. Remaining Castela around the Visitor Center, December 2015
Robust Fair Poor Dead Total
8 3 1 56 68
Castela Status - DSSF Visitor Center - December 2015

Desert Sunlight Solar Farm 2015 Annual O&M Biological Report 14
3.4 Conclusion/Recommendations
The on-going responsibilities for the salvaged vegetation will be quarterly maintenance and monitoring of
plants in the Plant Salvage Area and the Castela transplants by the Visitor Center, which includes judicious
watering as needed and checking for any pest infestations or any additional unanticipated damage. No
additional watering is proposed in anticipation of the coming rainy season in 2016. Sufficient rainfall is
anticipated that will bolster the remaining survivors into a more robust state. Success thresholds have
been met but close attention should be given to all the species in an effort to continue to give them the
best chance of survival.
4.0 DESERT DRY WASH WOODLAND STUDY
4.1 Overview Desert Dry Wash Woodland (DDWW) is designated as an important vegetation type that qualifies for
monitoring and protection per The Northern and Eastern Colorado Desert Coordinated Management Plan
("NECO" Bureau of Land Management, 2002). In 2012, First Solar began preparations for drilling a second
well near the eastern boundary of the solar site, situated near the Pinto Wash DDWW. This action
triggered the need and timeline for monitoring potential effects of groundwater drawdown on the trees
in Pinto Wash.
This study is intended to monitor DDWW trees near the construction well to see if groundwater drawdown
by the well is affecting them. Well production began in Winter 2012 and ended in Summer 2014. To date,
all the trees are surviving, and many are thriving. There is no evidence that well activity has adversely
affected these trees.
4.2 Survey/Monitoring Methods
This ongoing study complies with the provisions outlined in the Desert Dry Wash Woodland Monitoring
and Reporting Plan (Ironwood Consulting, Inc., 2011b). Several aspects of the original design and timing
of this study have been altered to conform to conditions observed in the study area, and to improve
efficiency of sampling. Details of the new study design and its departure from the original plan were
coordinated with the BLM and outlined in the 2012 Annual Report for Biological Resources Monitoring for
Desert Sunlight Solar Farm (Ironwood Consulting, 2012), which includes qualitative health and vigor
characteristics and photographs of each species in full, north facing.

Desert Sunlight Solar Farm 2015 Annual O&M Biological Report 15
4.3 Results and Discussion
After nearly 3 years of monitoring the 80 study trees across all four sites, all trees remain alive although
2 smoke trees appear to be in poor health 24 trees exhibited some loss of live branches, as compared
with baseline measurements taken in late 2012. Significant loss is defined as a loss of 10% or more loss
of "live" branches, although percent loss varied from 5% to 75%.
The greatest loss of tissue across all sites was on smoke trees (21 of 40), with significant decline
observed on 2 smoke trees in the control site, 3 smoke trees at site #2, and 3 smoke trees at site #1.
The only losses of palo verdes were 2 trees at the control site and 1 tree on site #1. However, no palo
verde loss was greater than 20%.
Normal (but modest) patterns of flowering and fruiting for each species took place each year, with the
majority of action happening in late spring into early summer. By December 2015, most trees had
already flowered, set, and dropped seed. Occasional summer monsoonal storms grazed the area this
summer, which accounts for modest leafing-out of many of the palo verdes. There were no noticeable
diseases or insect infestations on any of the trees.
Photos 7 and 8. Example of repeat photographs of two study trees: 28 Dec 2012 and 11 December 2015.
Site #1, Palo Verde #9: 75% live tissue (no change)

Desert Sunlight Solar Farm 2015 Annual O&M Biological Report 16
Photos 9 and 10. Example of repeat photographs of two study trees: 28 Dec 2012 and 11 December
2015. Site #3, Smoke Tree #3 showing loss of about 10% live branches since baseline study
This study is intended to monitor trees that might be "phreatophytic" near the well to see if groundwater
drawdown is harming them. This study to date has shown no significant changes that could be attributable
to water table drop associated with the well installed near DDWW on the Project.
A number of factors may also affect the efficacy of this study, including:
If these trees are actually obligate phreatophytes, what would be the expected lag time be before
observing any noticeable change in their health? If they are facultative phreatophytes, how could
a decline in health be definitively attributed to groundwater drawdown versus a prolonged
drought?
Strong late summer-early fall monsoonal storms covered the Pinto Wash area in 2011, 2012 013,
and 2015 producing strong surface flows and potential infiltration. Could these storms "mask" any
effects of drought or groundwater drawdown?
Total winter precipitation in the years since the Project started has been poor, and especially
below average in the last four years. Could this lack of seasonal rainfall be the cause of the die-
backs that have been recorded?
What is the effect of existing agricultural wells near Pinto Wash?

Desert Sunlight Solar Farm 2015 Annual O&M Biological Report 17
Table 6. Desert Dry Wash Study Health and Vigor Results (All measurements are in percentages with yellow highlights indicating loss of >10% branch tissue)
DATE
% % % % % % % % % % % %
alive leaf flw / frt alive leaf flw / frt alive leaf flw / frt alive leaf flw / frt
W1PV01 90 1 90 80 90 5
W1PV02 40 1 40 40 40
W1PV03 65 2 65 65 2 65
W1PV04 90 30 90 90 7 85 25
W1PV05 65 70 75 65
W1PV06 70 70 50 70
W1PV07 75 1 75 75 75
W1PV08 90 40 80 90 2 80 15
W1PV09 75 75 70 75
W1PV10 90 1 90 90 2 90
W1STO1 90 85 90 60
W1ST02 75 75 75 70
W1ST03 90 85 75 40
W1ST04 90 90 80 75
W1ST05 95 85 90 75
W1ST06 60 75 60 20
W1ST07 95 90 95 70
W1ST08 75 75 75 75
W1ST09 95 95 95 75
W1ST10 75 75 75 75
W2PV01 75 1 75 75 1 75
W2PV02 90 90 90 10 90 10
W2PV03 45 45 45 45
W2PV04 95 95 95 95
W2PV05 65 1 65 65 65 5
W2PV06 65 65 65 65
W2PV07 75 4 75 1 75 30 75 10
W2PV08 65 65 65 65
W2PV09 70 70 70 10 70 10
W2PV10 65 65 65 65
W2ST01 60 65 60 50
W2ST02 100 98 95 70
W2ST03 70 5 70 70 65
W2ST04 75 8 75 75 70
W2ST05 60 1 60 60 1, 0 60
W2ST06 85 80 50 30
W2ST07 60 60 60 45
W2ST08 55 55 55 55
W2ST09 70 5 70 50 10
W2ST10 55 65 55 55
Plant ID
Site #1: Closest to well (480m)
Site #2: 783m from well
Winter 2012 Winter 2013 Winter 2014 Winter 2015
BASELINE H&V H&V H&V H&V

Desert Sunlight Solar Farm 2015 Annual O&M Biological Report 18
Table 6. Desert Dry Wash Woodland Study Health and Vigor Results (continued)
DATE
% % % % % % % % % % % %
alive leaf flw / frt alive leaf flw / frt alive leaf flw / frt alive leaf flw / frt
W3PV01 85 25 80 1 85 30 85 20
W3PV02 45 45 45 5 45 10
W3PV03 80 80 70 80 10
W3PV04 90 90 80 90
W3PV05 60 65 60 60 10
W3PV06 90 1 85 90 90 10
W3PV07 90 85 90 90 20
W3PV08 45 15 50 45 10 45
W3PV09 85 30 85 75 2 85 10
W3PV10 75 75 1 75 5 75 10
W3ST01 40 40 40 1, 0 40
W3ST02 95 90 80 75
W3ST03 75 1 75 70 65
W3ST04 75 1 75 75 75
W3ST05 80 1 75 80 1, 0 70
W3ST06 65 1 65 65 65
W3ST07 80 80 80 65
W3ST08 90 75 70 65
W3ST09 75 80 70 75
W3ST10 100 95 75 90
WCPVO1 90 90 75 10 85 10
WCPV02 75 75 75 10 75 10
WCPV03 93 90 65 90 30
WCPV04 60 1 60 60 50
WCPV05 95 95 90 10 95 10
WCPV06 90 90 80 90
WCPV07 90 35 90 90 40 85
WCPV08 90 10 80 75 20 70 15
WCPV09 85 70 65 85
WCPV10 85 85 80 15 85
WCST01 65 70 65 65
WCST02 75 70 75 60
WCST03 65 65 65 1, 0 65
WCST04 75 75 65 55
WCST05 90 60 65 30
WCST06 85 50 40 10
WCST07 75 75 75 75
WCST08 75 75 70 75
WCST09 65 65 65 65
WCST10 97 95 90 90
Plant ID
Site #3: 1640 m from well
Control Site: 5.3 miles N of well
Winter 2012 Winter 2013 Winter 2014 Winter 2015
BASELINE H&V H&V H&V H&V

Desert Sunlight Solar Farm 2015 Annual O&M Biological Report 19
Desert Sunlight Solar Farm 2015 Annual O&M Biological Report 20
4.4 Conclusion/Recommendations
The Desert Dry Wash Woodland Monitoring and Reporting Plan (Ironwood Consulting, Inc., 2011b)
includes this language about the efficacy and timing of ongoing implementation of this Study:
On an annual basis, the efficacy of this program will be evaluated. If monitoring is determined by
BLM, CDFG, and CPUC (for SCE components) to be ineffective (either because these trees are using
only surface water sources or other variables interfere with the surveys that make it impossible to
determine any cause-effect relationship), it may be stopped at that time. If these agencies determine
the need for additional monitoring, the study may be extended to an agreed upon time during post-
construction... After a period of three years post-construction, a final dry wash woodland monitoring
program report will be submitted to BLM, CDFG, and CPUC (for SCE components).
The results and discussion imply that this study so far has produced little data that clearly implicates
groundwater drawdown with tree stress or mortality. The study also does not support the concept of palo
verdes and smoke trees being obligate phreatophytes. It is suspected that these trees are most likely
facultative phreatophytes, which employ multiple strategies for acquiring and storing water in this harsh
desert environment (including a combination of surface and groundwater acquisition; shallow and deep
root systems; drought deciduousness; and location along deeper washes channels which consolidate
whatever flows come from infrequent storms).
Close to 3 years of data have been collected for these sites documenting generalized health and vigor, as
well as seasonal patterns of leafing and flowering. This represents close to 3 years of "Baseline Conditions"
for these study trees. All the trees are marked by accurate GPS coordinates and repeatable photographs,
and can be relocated and reevaluated at any time in the future.
As specified in the DDWP, this study is scheduled to continue for a period of three years post-construction
(i.e. post well production). As construction drew to a close on the solar farm in late 2014, production at
the well ceased, and all the trees are surviving.
Although there appear to be some losses of live tissue in some of the trees, it is impossible to correlate
these losses with well production, because the entire region has been under a prolonged drought
throughout the period.
Thus, it is recommended that this study be discontinued at this time.

Desert Sunlight Solar Farm 2015 Annual O&M Biological Report 21
5.0 INTEGRATED WEED MANAGEMENT
5.1 Overview The following represents a summary of activities associated with weed management that was completed
during 2015. Surveys for weeds were conducted in the following areas associated with the solar farm:
The inner perimeter of the Project where soil had been disturbed including the detention ponds
for monthly surveys
All areas of the solar farm that have been disturbed that are currently occupied by solar panels
and associated infrastructure as annual survey
The undisturbed 250-foot/76.5-meter buffer area around the site as a quarterly survey
The gen-tie right-of-way as a quarterly survey
5.2 Survey/Monitoring Methods
A series of surveys for the presence of weeds in the solar farm and gen-tie line were completed to estimate
invasiveness of weeds. Table 5 details survey dates and locations in 2015.
A quarterly pedestrian survey of the 250 foot/76.25 meter buffer zone outside the tortoise fence of the
Solar Array portion of Project area was completed. In addition to the outer buffer area, monthly surveys
of disturbed and undeveloped areas along the inside perimeter of the site were completed. These
pedestrian surveys were conducted in the inner perimeter where soils had been disturbed and cleared. In
the first quarter of 2015, an annual survey of the solar farm array area was also completed. This survey
was completed using a pick-up truck. One biologist drove the truck and the other two biologists made
observations of weeds present in the array areas using binoculars.
Any weeds encountered would be recorded with a hand-held GPS unit and were hand-pulled, bagged and
disposed of in a trash dumpster.

Desert Sunlight Solar Farm 2015 Annual O&M Biological Report 22
Table 7. Summary of Weed Survey Dates and Locations, 2015
5.3 Results and Discussion
5.3.1 Solar Farm During the first quarter of 2015 surveys, Sahara mustard (Brassica tournefortii) was found as individual plants primarily in the southwestern portion of the solar farm (Figure 5). Salt cedar (Tamarix ramosissima) was found in two of the retention basins located on the southern border of the solar farm. During construction, the retention basins were noted as sources of these invasive weeds likely due to stormwater flooding events in the region. In addition, London rocket (Sisymbrium irio) and nettle-leaved goosefoot (Chenopodium murale) were found in scattered locations within the solar farm.
No invasive weeds were detected in the retention basins or around the solar farm site throughout the second and third quarter surveys.
During fourth quarter surveys, approximately 500 salt cedars were detected in retention basin 2-2 on the site. This is the same retention basin where salt cedars were found during the First Quarter, 2015 survey (Figure 1). All salt cedar were dug out, bagged and disposed of in the trash dumpster. One incidental salt cedar was observed in array block 3. This weed was also dug out, bagged and disposed of in a trash dumpster.
Dates
Inner
Perimeter
(Monthly)
250-ft/76.25-m
Buffer Area
(Quarterly)
Gen-Tie Line
(Quarterly)
Annual Survey of
Disturbed Area
(Solar Farm)
1/20/2015 X
2/17/2015 X
3/3/2015 x
3/3-3/8/2015 x x x
4/7/2015 x
5/8/2015 x
6/21-23/2015 x x x
7/9/2015 x
8/10/2015 x
9/10/2015 x
8/28/2015-
8/30/2015x x
10/9/2015 x
11/18/2015 x
12/8/2015 x
12/7-9/2015 x x
First Quarter
Second Quarter
Third Quarter
Fourth Quarter

Desert Sunlight Solar Farm 2015 Annual O&M Biological Report 23
5.3.2 Gen-Tie Line During the first quarter of 2015 surveys, Sahara mustard and London rocket were found in the gen-tie line from pole pads 1 to 31 along Kaiser Road (Figure 6). The number of weeds within any pole pad area was less than 100 indicating a limited degree of invasiveness. A few nettle-leaved goosefoot weeds was observed between pole pads 8 and 9, and again between pole pads 10 and 11. Sahara mustard and London rocket was again found in the gen-tie line from pole pads 56 through 69 also in a limited degree of invasiveness.
No invasive weeds were detected in the gen-tie corridor in the subsequent surveys for the remainder of the year.
5.3.3 Herbicide Use During December weed surveys, Ironwood biologists observed non-native and native vegetation onsite
that were dying and exhibiting signs of possible herbicide use.
Ironwood was not present during the herbicide application but communication from Next Era Energy
confirmed that pre- and post-emergent herbicides (SFM 75 and Garlon 4) were applied to solar arrays and
retention basins only within the solar farm where weed growth was present as noted by Next Era Energy
in Figure 7. The herbicide applicators were given WEAP training that included weed identification prior
to beginning work and used portable tanks with hand guns for pin point accuracy. Herbicide application
began on November 9th in the arrays and finished at the retention ponds on November 19th and 20th. No
herbicides were applied outside the solar farm (e-mail communication, Adam Dobrzanski).
Photo 11. Dead plants beneath solar arrays Photo 12. Dead plants in retention basins
Desert Sunlight Solar Farm 2015 Annual O&M Biological Report 24
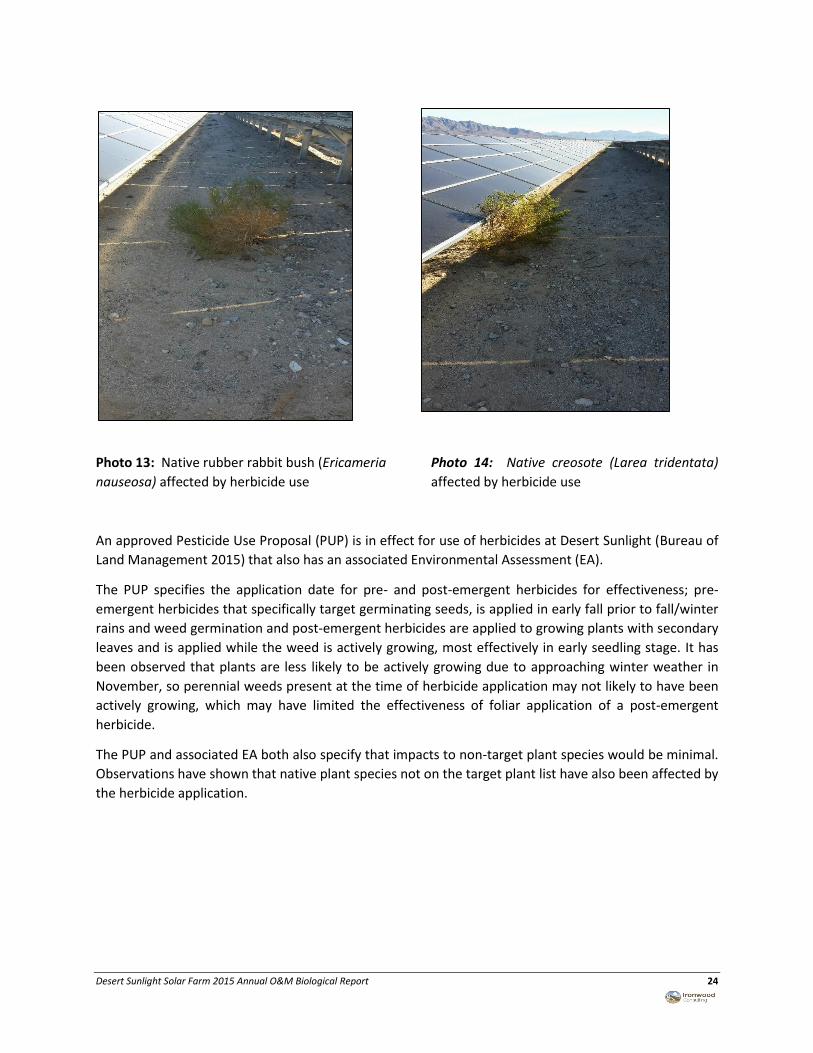
Photo 13: Native rubber rabbit bush (Ericameria Photo 14: Native creosote (Larea tridentata)
nauseosa) affected by herbicide use affected by herbicide use
An approved Pesticide Use Proposal (PUP) is in effect for use of herbicides at Desert Sunlight (Bureau of
Land Management 2015) that also has an associated Environmental Assessment (EA).
The PUP specifies the application date for pre- and post-emergent herbicides for effectiveness; pre-
emergent herbicides that specifically target germinating seeds, is applied in early fall prior to fall/winter
rains and weed germination and post-emergent herbicides are applied to growing plants with secondary
leaves and is applied while the weed is actively growing, most effectively in early seedling stage. It has
been observed that plants are less likely to be actively growing due to approaching winter weather in
November, so perennial weeds present at the time of herbicide application may not likely to have been
actively growing, which may have limited the effectiveness of foliar application of a post-emergent
herbicide.
The PUP and associated EA both also specify that impacts to non-target plant species would be minimal.
Observations have shown that native plant species not on the target plant list have also been affected by
the herbicide application.

Desert Sunlight Solar Farm 2015 Annual O&M Biological Report 25

Desert Sunlight Solar Farm 2015 Annual O&M Biological Report 26

Desert Sunlight Solar Farm 2015 Annual O&M Biological Report 27
Figure 7. Herbicide Use Areas (in orange)
Desert Sunlight Solar Farm 2015 Annual O&M Biological Report 28
5.4 Conclusions and Recommendations
On the solar farm, salt cedar continues to be found in the southern retention basins, while London rocket and nettle-leaved goosefoot was found in scattered locations within the solar farm. On the gen-tie corridor, Sahara mustard, London rocket, and nettle-leaved goosefoot were detected, but the numbers indicated a limited degree of invasiveness. All invasive weeds detected were removed, bagged and disposed in a trash dumpster. Continued monitoring and eradication of weeds within the project area is recommended to prevent any increase in invasive weeds.
It is recommended that herbicide application, should it become necessary again, be applied as a pre-
emergent herbicide in early fall as it would be more effective in curtailing germinating weed seeds than
application of a post-emergent at the time of the year when most annual weeds have set seeds and died.
Impacts to native plants from herbicide application should also be minimal, as stated by the PUP and
associated EA. It is also recommended that impacts to native plants from the recent herbicide application
be quantified and documented in the Pesticide Application Records maintained by the applicator and
included in the next annual biological monitoring report to BLM.
6.0 RAVEN MANAGEMENT
6.1 Overview
This report summarizes the implementation of the Raven Management Plan (RMP) during the course of
project activities on the Desert Sunlight Solar Farm Project in 2015. Much of the RMP was implemented
during the construction phase of the project and is discussed in detail in previous annual reports. This
report will focus on implementation of the RMP during 2015 and comparing results collected in previous
years.
The purpose of the RMP is to address potential impacts to desert tortoise (Gopherus agassizii) by
eliminating and minimizing subsides made available to Common ravens (raven; Corvus corax) to the
maximum extent practicable. The purpose of this project-specific plan is to protect juvenile and hatchling
desert tortoises in the project vicinity (within the immediate area of the Chuckwalla Valley) from increased
predation by ravens by eliminating or minimizing raven attractants and resources (e.g., surface water,
trash and animal and plant waste materials; perching, nesting, and roosting sites) during construction,
operation and maintenance, and decommissioning of the project.
6.2 Survey/Monitoring Methods
6.2.1 Incidental Sightings During the construction phase of the Project, raven(s) sighted by biological monitors were recorded on
standardized data forms during regular daily monitoring activities. Project construction concluded in
Desert Sunlight Solar Farm 2015 Annual O&M Biological Report 29
December of 2014, which included a drastic reduction in the amount of time biologists spent in and
around the project. There were, however, ravens caught on game cameras during the avian carcass
removal trials which took place 16 December 2014 through 21 January 2015 and 27 March 2015 through
18 May 2015.
6.2.2 Avian Point Count Surveys During construction and Operations and Maintenance, biologists repeated surveys at points within the
Solar Farm site and controls using the same methods employed during baseline surveys (Figure 2). The
purpose of conducting Avian Point Count (APC) surveys is to measure any potential increase or decrease
in the number of Ravens sighted on the Solar Farm project or adjacent to project components.
Avian Point Count Surveys were conducted by avian biologists who had extensive prior experience
surveying for birds in the eastern deserts of California. Biologists performing point counts had competent
bird identification skills and were able to detect species by sight and sound (calling and singing).
Survey periods were chosen to optimize the detection potential for seasonal migrants as well as resident
birds. Surveys were conducted during the time of the day when birds were most active, generally the first
four hours after sunrise.
Avian Point Count Surveys began during fall 2011 and were performed seasonally through mid-November
2015, excluding the summer months (June, July and August). Avian Point Count locations are depicted in
Figure 8.
6.2.3 Nest Surveys Driving surveys followed previously-utilized survey protocols in order to detect raven nests within one
mile of all project components. The ground beneath confirmed raven nests was inspected for desert
tortoise remains. The Project’s Designated Biologist (DB) had the authority to recommend nest or problem
raven removal through consultation with Land Managers and regulatory agencies including: Bureau of
Land Management (BLM), United States Fish and Wildlife Service (USFWS), and California Department of
Fish and Wildlife (CDFW).
Nest surveys may also be used to evaluate and assess population trends in ravens; and an increase in
nesting ravens over the course of Project development and operations could indicate an increase in
subsidy availability.

Desert Sunlight Solar Farm 2015 Annual O&M Biological Report 30
Figure 8. Avian Point Count locations associated with the Desert Sunlight Solar Farm

Desert Sunlight Solar Farm 2015 Annual O&M Biological Report 31
6.3 Results and Discussion
6.3.1 Incidental Sightings Incidental detections of ravens utilizing subsidies within the Solar Farm were recorded during all biological
activities during the Project’s construction phase. Biological monitors and surveyors recorded incidental
sightings of ravens utilizing project subsidies on standardized data sheets in order to assess the pressures
these birds are placing on project subsidies. The presence of ravens was documented on the Project site
prior to the initiation of construction activities. Construction monitors consistently reported ravens flying
during early morning hours from the west, heading east. The continuity of these reports suggested that
ravens regularly roost in Pinto Wash (east of the project site) and fly westward (toward the Colorado River
Aqueduct pump station and Eagle Mountain Mine), over the project site, in search of resources.
The number of incidental sightings recorded within the solar-farm footprint corresponded with
construction activities in the years 2011 through 2015. Instances where ravens were documented utilizing
project subsidies were responded to in the following ways:
Project personnel were reminded of the project’s refuse management requirements and all
project-related trash was confined to enclosures that provided proper containment.
Biological monitors attempted to remove (and make unavailable to ravens) all project-related
carrion, including road-killed animals and construction kills.
Efforts were made to contain water and make it unavailable to ravens.
Construction workers and subcontractors are required to address waste management on a daily
basis (i.e. trash sweeps, manage own waste).
Entrance gate guards check the back of open vehicles for trash as they enter the Project.
In the event that additional waste management is needed (i.e., high wind events, storm events),
crews are assembled as necessary to ensure trash is contained in accordance with the RMP.
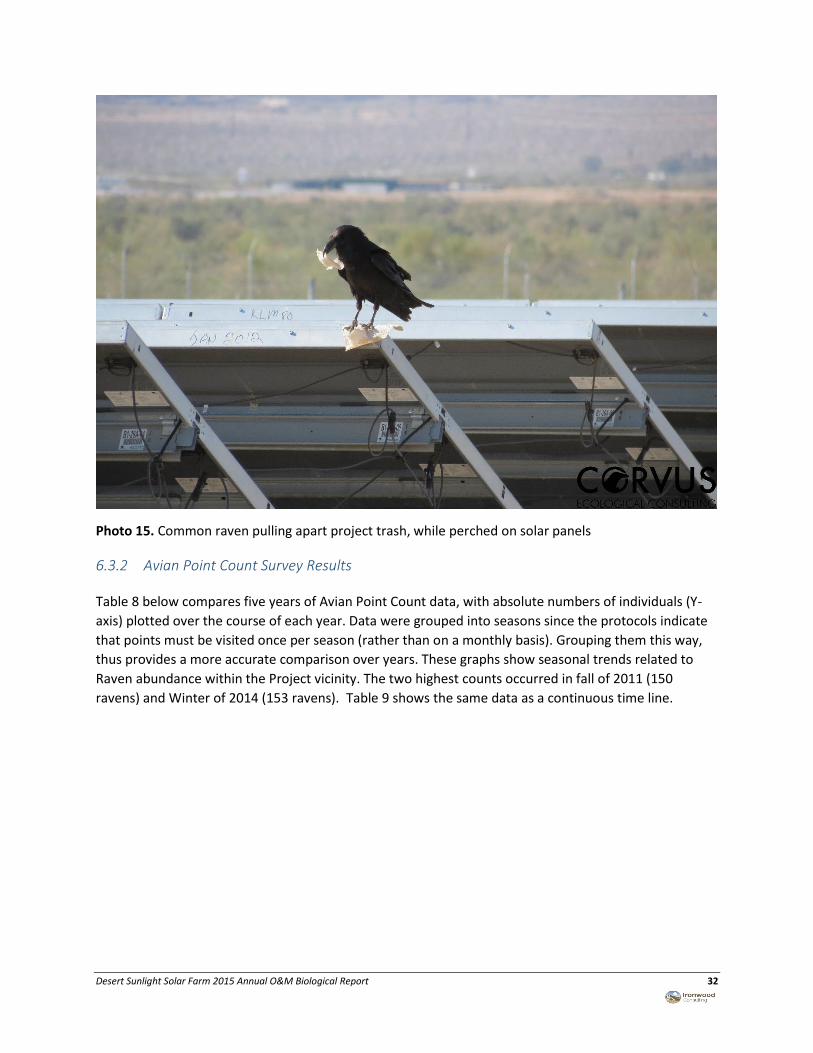
Ravens were photographed on game cameras 52 times on 35 different carcasses in 2015. Similar to 2014
results, the greatest number of ravens in any single camera frame was two, suggesting that at least one
pair of ravens continues to frequent the Project site.
Desert Sunlight Solar Farm 2015 Annual O&M Biological Report 32
Photo 15. Common raven pulling apart project trash, while perched on solar panels
6.3.2 Avian Point Count Survey Results
Table 8 below compares five years of Avian Point Count data, with absolute numbers of individuals (Y-
axis) plotted over the course of each year. Data were grouped into seasons since the protocols indicate
that points must be visited once per season (rather than on a monthly basis). Grouping them this way,
thus provides a more accurate comparison over years. These graphs show seasonal trends related to
Raven abundance within the Project vicinity. The two highest counts occurred in fall of 2011 (150
ravens) and Winter of 2014 (153 ravens). Table 9 shows the same data as a continuous time line.

Desert Sunlight Solar Farm 2015 Annual O&M Biological Report 33
Table 8. Raven Detections during Avian Point Counts 2011-2015
Table 9. Total Number of Raven Detections at Point Counts over Time
0
20
40
60
80
100
120
140
160
180
Winter Spring Fall
Tota
l # R
aven
s D
etec
ted
Total # of Ravens Detected During Avian Point Counts by Year and Season
2012 2013 2014 2015 2011
0
20
40
60
80
100
120
140
160
180
Fall 2011 Winter11-12
Spring12
Fall 12 Winter12-13
Spring13
Fall 13 Winter13-14
Spring14
Fall 14 Winter14-15
Spring15
Fall 15
Total # of Ravens detected During Avian Point Counts Over Time

Desert Sunlight Solar Farm 2015 Annual O&M Biological Report 34
Program Distance was used to analyze the data from the point counts to determine an overall density
(Tables 10 and 11). Program Distance uses the distance measurements taken by the observer to estimate
a detection function for the species of interest. The detection of objects is a function of distance from the
observer. The Distance software uses the collected data to estimate that function and calculate a more
accurate estimate of density than raw counts alone.
Table 10. Raven Density Estimates by Season and Year
SEASON DENSITY ESTIMATE
LOWER CONFIDENCE
LIMIT
UPPER CONFIDENCE
LIMIT
DETECTION FUNCTION
GOODNESS OF FIT
FALL 2011 0.029 0.009 0.097 Hazard Rate key 0.9432
WINTER 11-12 Unable to estimate detection function
SPRING 2012 0.128 0.031 0.533 Hazard Rate key with 2 cosine adjustments
0.3761
FALL 2012 0.001 0.001 0.003 Uniform key with 2 cosine adjustments
0.3977
WINTER 12-13 0.003 0.002 0.005 Uniform key with 4 simple polynomial
adjustments
0.2953
SPRING 2013 0.024 0.008 0.067 Hazard Rate key with 2 cosine adjustments
0.4743
FALL 2013 0.005 0.002 0.012 Hazard Rate key 0.8095
WINTER 13-14 0.013 0.008 0.021 Negative Exponential with 2 hermite polynomial
adjustments
0.7745
SPRING 2014 0.004 0.002 0.011 Hazard Rate key 0.3660
FALL 2014 0.002 0.001 0.004 Uniform key with 2 cosine adjustments
0.7847
WINTER 14-15 0.003 0.001 0.008 Uniform key with 2 cosine adjustments
0.9838
SPRING 2015 0.001 0.001 0.003 Hazard Rate key with 1 cosine adjustment
0.9748
FALL 2015 0.015 0.008 0.027 Hazard Rate key with 1 cosine adjustment
0.6801

Desert Sunlight Solar Farm 2015 Annual O&M Biological Report 35
Table 11. Estimated Density of Common ravens at Desert Center over Time
0.029
0.128
0.001 0.003
0.024
0.005
0.013
0.004 0.002 0.003 0.001
0.015
0
0.01
0.02
0.03
0.04
0.05
0.06
0.07
0.08
0.09
0.1
0.11
0.12
0.13
0.14
Fall 11 Winter11-12
Spring12
Fall 12 Winter12-13
Spring13
Fall 13 Winter13-14
Spring14
Fall 14 Winter14-15
Spring15
Fall 15
Estimated Density of Common ravens Over Time

6.3.3 Nest Survey Results
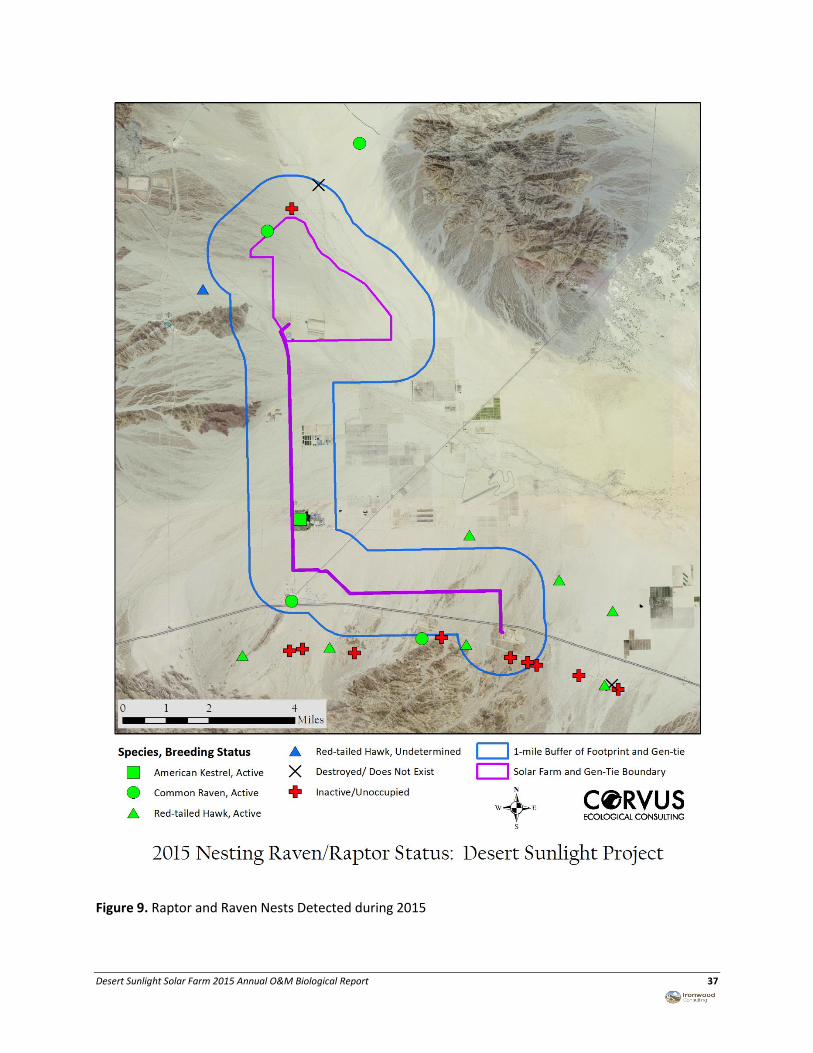
Only 4 raven nests were observed during the 2015 breeding season (Table 12). All four nesting attempts
were successful with 8 fledglings produced for a success rate of 2 nestlings/nest.
Two of the active raven nests were within 2 miles of the project perimeter and the other two were > 6
miles from the project footprint (Figure 9).
During each year (2012-2015), biologists surveyed the ground surface below raven nests in search of
juvenile desert tortoise carcasses, which would indicate predation or scavenging by nest occupants.
Ground surface surveys below common raven nests for juvenile tortoises has resulted in no (0) desert
tortoise carcasses detected during any of these search efforts.
Table 12. Comparison of success, failure and total number of raven nests from 2013 through 2015
Note: 2012 data is not included because a specific nesting survey was not completed
6 7 4
4
1
0
0
2
4
6
8
10
12
2013 2014 2015
# o
f N
ests
Common raven Nest Success 2013-2015
Successful Failed
Desert Sunlight Solar Farm 2015 Annual O&M Biological Report 37
Figure 9. Raptor and Raven Nests Detected during 2015

Desert Sunlight Solar Farm 2015 Annual O&M Biological Report 38
6.4 Conclusion and Recommendations
The presence of ravens within the Project boundary fluctuated temporally due to natural causes, placing
dynamic pressures on Project subsidies over the course of the Project. Common ravens, including at least
one breeding pair, were documented in the Project area (within at least one mile of the solar farm
perimeter) prior to the onset of construction activities at the Desert Sunlight Solar Farm. Seasonal changes
to the abundance and distribution of common ravens within the Chuckwalla Valley was not well
understood until species-specific surveys were implemented as a requirement of this Project’s RMP.
Through project-specific survey efforts, biologists have learned that seasonal fluctuations in raven
numbers and distribution is a natural phenomenon. The pressure placed on Project subsidies fluctuates
as the abundance of ravens shifts temporally within the Project’s vicinity. Grubbing and vegetation
clearing activities during the construction phase unintentionally provided a temporary food subsidy to
ravens. Raven subsidy use was the highest when vegetation clearing activities in the construction phase
took place during the fall and winter months, corresponding with natural increases in raven numbers
throughout the Chuckwalla Valley. Since the completion of clearing and grubbing activities, there has been
a decrease in the benefit gained by ravens from Project subsidies.
Following completion of the construction phase, there were no more common raven nesting attempts
within close proximity (one-mile) of the project, than there were prior to the onset of Project-related
construction activities. No change to the number of ravens attempting to nest within proximity of the
Project indicates that whatever benefits were gained during the construction phase were temporary.
Additionally, the number of Ravens detected incidentally post-construction are equivalent to the number
detected pre-construction.
The primary goal of this project-specific RMP was to protect juvenile and hatchling desert tortoises in the
Project vicinity (within the immediate area of the Chuckwalla Valley) from increased predation by ravens
by eliminating or minimizing raven attractants and resources (e.g., surface water, trash and animal and
plant waste materials; perching, nesting, and roosting sites) during construction, operation and
maintenance, and decommissioning of the project. During the construction phase and during operations
and maintenance, Common raven nests have been routinely monitored for the presence of desert tortoise
remains, which would indicate predation or scavenging by ravens. To date, no desert tortoise remains
have been found associated with ravens or raven nests within proximity to the Desert Sunlight Solar Farm.
During the construction and subsequent operations and maintenance of this Project, the goals of the
Raven Management Plan have been met through successful implementation of the prescribed measures
that it required. Adaptive management and the continued assessment of applied mitigation measures
resulted in effective action. Monitoring strategies were able to successfully assess the long-term trends
in raven populations and evaluate the pressures that ravens placed on Project subsidies while
determining impacts to desert tortoise populations in the vicinity.
Ironwood Consulting, Inc. Office: 1030 Nevada Street, Suite 201, Redlands, CA 92374 Mail: PO Box 10068, San Bernardino, CA 92423
Phone: (909) 798-0330 Fax: (909)798-0330 www.ironwoodbio.com
REFERENCES
Bureau of Land Management 2011 Desert Sunlight Solar Farm Final Environmental Impact Statement and Record of Decision.
2015 Pesticide Use Proposal Number 0015-CA-060-002, Desert Sunlight Solar Project.
Environmental Assessment Number DOI-BLM-060-0015-0017-EA
Dobrzanski, Adam
2015 Email Communication between Mr. Adam Dobrzanski and Ms. Lehong Chow/Ms. Kathy
Simon. December 21, 2015.
Ironwood Consulting, Inc.
2011a Avian and Bat Protection Plan for the Desert Sunlight Solar Farm Project. Report prepared for Desert Sunlight Holdings, LLC, Oakland, California.
2011b Desert Dry Wash Woodland Monitoring and Reporting Plan, First Solar Desert Sunlight Solar Project, Riverside County. BLM Case File Number CACA-48649. July 2011
2011c Vegetation Salvage Plan, Desert Sunlight Solar Farm. BLM Case File Number CACA-48648. Riverside County, CA. Revised 5 October 2011.
2011d Integrated Weed Management Plan, Desert Sunlight Solar Farm. BLM Case File Number CACA-48648. Riverside County, CA. Revised 17 June 2011.
2012 Annual Report for Biological Resources Monitoring, First Solar Desert Sunlight Solar Project, Riverside County. BLM Case File Number CACA-48649. Biological Opinion # FWS-ERIV-0880789-11F0041, 1 January - 31 December 2012.
2013 2012 Annual Report for Desert Sunlight Solar Farm. Report prepared for Desert Sunlight Holdings. LLC, Oakland, California.
2014 2013 Annual Report for Biological Resource Monitoring. First Solar Desert Sunlight Solar Project, Riverside County. BLM Case File Number CACA-48649. Report prepared for Desert Sunlight Holdings. LLC, Oakland, California.
2015 2014 Annual Report for Desert Sunlight Solar Farm. First Solar Desert Sunlight Solar Project, Riverside County. BLM Case File Number CACA-48649. Report prepared for Desert Sunlight Holdings. LLC, Oakland, California.
Ralph, C. John; Sauer, John R.; Droege, Sam, technical editors
1995. Monitoring Bird Populations by Point Counts. Gen. Tech. Rep. PSW-GTR-149. Albany, CA: Pacific Southwest Research Station, Forest Service, US. Department of Agriculture; 187 p.