Embed Size (px)
Citation preview

James Bedford | Nuffield Health Research Placement | Biomedical Sciences September 2015
Cord Blood Stem Cell Storage THE EFFECT OF UMBILICAL CORD BLOOD SAMPLE SIZE AND COLLECTION PROCESS ON CD34 AND CD45
CELL CONCENTRATION

JAMES BEDFORD 2015 PAGE 1
Introduction
Umbilical cord blood (CB) is blood taken directly from the umbilical cord at birth. Rich in
hematopoietic stem cells (HSCs), this blood has significant potential to provide support
for gene therapy, tissue regrowth and oncological treatments. The stem cells taken from
the umbilical cord exhibit a high degree of pluripotency and can, therefore, be used as an
alternative to the intrusive extraction of bone marrow stem cells which is currently the
primary other source of such high potency stem cells. When bone marrow stem cells are
employed to combat diseases or restore bodily damage, patients face the potential of
rejection issues (GvHD). Stem cells taken from adult tissue also suffer from environmental
damage as a result of the donor’s age. Umbilical stem cells are taken from an otherwise
discarded tissue, suffer no environmental damage and can be used to guarantee a 100%
match for the baby from which it was taken, should they require stem cell treatments in
the future.
With over 10 years of experience, Biovault Technical Ltd. is a world leading human tissue
bank and the UK’s largest private tissue bank. Partnered with both the NHS and Plymouth
University, an accredited leader in best practice, Biovault stores embryonic umbilical cord
blood, cord tissue, peripheral blood stem cells, bone and bone marrow stem cells, femoral
heads and tendons in -190° cryogenic storage vats ready for a time such that they may be
required by any of their 11,000-strong client base. Biovault primarily receives samples of
umbilical cord blood and tissue from clients and partners throughout the world, processes
them in-house and performs blood stem cell testing and sample analysis before storing
them in cryogenic Eternes for up to 30 years.
Research Project
When Biovault processes incoming umbilical cord blood, they recover samples to be
analysed through flow cytometry. Flow cytometry uses fluorochromes bound to antigens
specific to the particular stem cells in the cord blood in order to record the number of
viable stem cells in any one sample and thus the feasibility of those stem cells in any
treatment using an array of lasers and high-sensitivity sensors. The number of leukocytes,
stem cells and their according viabilities are measured to determine the likely success of
samples after the freezing process. The viability of stem cell samples are not all equal and
if many cells are in a state of apoptosis before freezing, these cells may be recorded as
viable during flow cytometry, thus hyper-inflating the result. Viability often decreases over
the storage period of the samples and hence the incoming viability of the samples is
critical.
Biovault receives samples from over 10 different countries, from women aged 20 to 70
employing various methods of birthing and different birth weights subsequent to differing
gestation periods – all of these factors may influence the feasibility of any sample that
Biovault receives; and that is what this investigation seeks to establish.

JAMES BEDFORD 2015 PAGE 2
My report’s title is ‘The effect of umbilical cord blood sample size and collection process
on CD34+ and CD45+ cell concentration’. I initially set out to investigate two broad
hypotheses that Biovault were particularly interested in. The first was that babies
delivered after 40 weeks gestation gave lower sample volumes with lower stem cell counts
and lower viability. The second was that older mothers gave samples of a decreased
viability, volume and stem cell count.
Scientific theory states that younger mothers should give healthier babies with a lower
risk of birth complications and that older women present a higher risk for birth defects
and poorer-quality births. Previous studies (Ghadeer Ibrahim Alrefaei, 2015) have
supported the idea that maternal age shares a negative correlation with MSC
(Mesenchymal Stem Cells) count in the placenta although the effect on HSCs is relatively
undocumented. Older studies (K K Ballen, 2000) with lower precision instruments have
found that for hematopoietic stem cells (the variety present in the umbilical cord blood),
maternal age had no effect on the count or viability of the sample. However, with a
noticeable lack of data in this area, this investigation (with a greater sample size and
equipment sophistication than that available to most prior reports) seeks to shed light on
these effects.
Recovery and Method
The processing at Biovault is based around the findings of Pablo Rubenstein (Rubenstein,
1995). Incoming samples arrive in blood bags merely a day or two after collection at birth.
Arriving by courier, the incoming samples are logged into the system, uniquely identified
by label and QR code and assigned to an individual paper and electronic file which will
stay with the sample for the duration of its lifetime. Once checked in, samples are
prepared for processing by scrubbing with Biocide E (a sodium hypochlorite-based
sporicide) to kill any spores present on the samples before cleaning with IPA (99.8%
Isopropyl Alcohol) which ruptures the cell walls on any remaining bacteria.
Samples are then passed into a grade B cleanroom through an air-sterilising hatch. After
replacing their clothes with two sets of sterile gowns, masks, hoods and gloves, staff enter
the cleanroom and receive the cleaned blood bag. The blood bag is hermetically sealed to
a three-part blood bag before the blood undergoes centrifugation at 1500rpm for 15
minutes.
Centrifugation separates the blood into its three constituent components by relative mass
(heavy erythrocytes, the buffy coat of concentrated leukocyte suspension and the light
plasma layer) before a laser-guided Optipress is used to compress the anticoagulated
blood into the three blood bags based on the type of blood component. In grade A safety
cabinets samples of blood plasma are taken for blood tests. Dimethyl sulfoxide (DMSO), a
powerful cryoprotectant is then added to the bag of stem cell-containing leukocytes to aid
in the process of vitrification during freezing. DMSO is toxic to cells at room temperature
and after the addition of DMSO, samples must be drastically cooled by to avoid rapid cell
JAMES BEDFORD 2015 PAGE 3
death within ten minutes. DMSO addition takes two minutes and in the remaining eight
minutes, the leukocyte suspension is sampled, transferred to a final twenty-five millilitre
storage bag, hermetically sealed four times to AABB (American Association of Blood
Banks) regulation before the storage bag is packaged into a protective cardboard cassette,
security sealed, labelled and verified for storage.
Within the final 2 minutes, the processed cassettes and samples are moved to be rapidly
rate cooled to -140°C. Without the DMSO, cells in the sample would form ice crystals
during the cooling process which would lead to the rupture of plasma membranes and
subsequent cell death (Health, 2011). After being cooled for 75 minutes, the samples are
removed to a Cryocart (a liquid nitrogen-filled mobile transporter) before being placed
into a dedicated and logged position within an Eterne for long-term storage.
After placement in the Eterne, records of all equipment and lot numbers are recorded in a
secure database and samples of maternal blood and processed blood sent off for analysis
by nearby dedicated labs. Samples of the leukocytes are then taken to the flow cytometry
lab where a flow cytometer determines the number of leukocytes, hematopoietic stem
cells and their respective viabilities per milliliter.
A dedicated microbiology lab takes fungal and TSA (bacterial) plates from the cleanrooms
and incubates them to check for no bacterial or fungal contamination in the cleanroom
during processing and particle counters under the safety cabinets monitor the number of
particles present to guarantee no contamination of the medical samples. Biohazardous
samples (those from patients with AIDs, blood diseases or from high-risk countries) are
isolated into a separate Eterne and constantly logged, cross-checked and monitored
ensuring samples are up-to-date and all equipment in contact with them is recorded.
Results
Data was copied from hard copies dating from 03/01/2012 through to 15/10/2013 into a
database for analysis; a total of 798 records were entered. The fields of information
recorded included date received, unique references, incoming,
processing and final weight, viability, leukocyte count, CD34+ count,
birthing method, birth weight, collection date (DOB), maternal DOB
and gestation period. The volume of each sample was calculated by
deducting the weight of the emptied collection bag from the incoming
weight and assuming a density equal to that of water (1gcm-3). 218
records were partially incomplete in some way and these records have
been removed from relevant analysis and statistics.
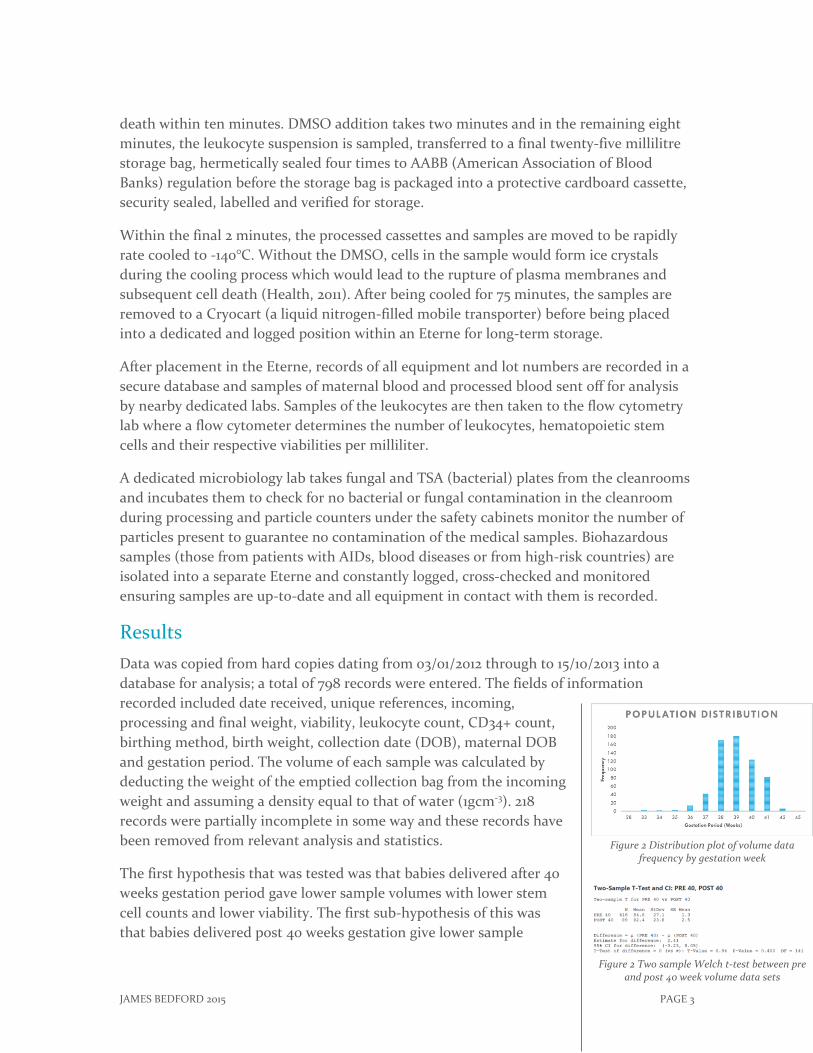
The first hypothesis that was tested was that babies delivered after 40
weeks gestation period gave lower sample volumes with lower stem
cell counts and lower viability. The first sub-hypothesis of this was
that babies delivered post 40 weeks gestation give lower sample
Figure 2 Two sample Welch t-test between pre and post 40 week volume data sets
Figure 2 Distribution plot of volume data frequency by gestation week

JAMES BEDFORD 2015 PAGE 4
volumes. 629 records gave full information for both the calculation of
volume and the gestation period combined. With the number of
samples in excess of 600, there is no requirement for the data to be
transformed (despite a slight left tail skew) due to the Central Limit
Theorum which stipulates 30/31 datum to be sufficiently large not to
require transformation.
Using statistical software Minitab, the results were analysed and a
two-sample T-test was performed on the datum below 39 weeks and
the datum above 39 weeks (Figure 2). The resulting T-value of 0.84
indicates a statistically significant difference between the two samples
to a 0.400 or 60% confidence (P-Value = 0.400). The scientifically
accepted level of significance required to allow the rejection of a null
hypothesis is 95%; hence this result is negative. There is no
discernable effect of post 40-week gestation on collected volume
against a pre 40-week gestational period. However, subsequently an
ANOVA (Analysis Of Variance) test was performed on the data below
40 weeks, equal to 40 weeks and above 40 weeks.
The ANOVA testing did not assume equal variances and all values are
reported to the accepted 95% certainty level (Figure 3). The test
reported an interval plot of the data. As visible (Figure 5), the test
presents a significant difference between the means of those
gestational periods outside of 40 weeks and those of 40 weeks. A
Games-Horwell Pairwise comparison test was carried out on the data
and reported that the mean for 40 weeks gestation was 95%
significantly different from that of both pre and post 40 weeks. The
interval plot presented shows this trend with an unexpected dip in the
mean for 40 weeks meaning that babies delivered after 40 weeks
gestation deliver lower umbilical cord volumes than those born earlier
or later. The data was split down into its components to acknowledge
any offset and an interval plot was created again (Figure 6). As seen by
the second interval plot, there is no real difference between the means
and the overlapping error bars make it such that the null hypothesis
may not be accepted.
To conclude: there is no statistical difference between the volumes
delivered by babies born before or after 40 weeks. Nor is there a
difference between the volumes delivered after 40 weeks or after
gestation periods outside of that. This concords with the findings of K
K Ballen (K K Ballen, 2000) whose results report no significant change
in volume as gestational period changes.
Figure 3 One-way ANOVA test on volume data sets pre, post and equal to 40 weeks gestation
period
Figure 4 Test for equal variance between volume data sets of pre, post and 40 week gestation
periods
Figure 5 Interval plot for volume grouped as pre, post and 40 weeks gestation period
Figure 6 Interval plot for volume grouped by gestation week
Figure 7 Test for equal variance between CD34+ count data sets of pre, post and 40 week
gestation periods

JAMES BEDFORD 2015 PAGE 5
The second part of this hypothesis was that babies delivered after 40
weeks deliver lower stem cells counts. Stem cells are counted by the
presense of CD34+ fluorchromes detected in flow cytometry.
A critical part of these statistics are that the variance between
population groups is equal. To determine whether pre 40, 40 and post
40 week groups were of equal variance, an equal variance test was
performed on the groups. As shown by the test for equal variance
(Figure 7), because the error bars overlap, there can be no significant
difference in variance assumed. Therefore, equal variance may be
assumed and in any event, this small disparity in variance will have a
small affect on ANOVA or T-Testing.
ANOVA testing was performed on all pre 40 week, 40 week and post
40 week samples with Tukey pairwise, Fisher Pairwise and Dunnett
Multiple Comparison tests all reporting no significant difference
between the samples all to over 95% certainty. The null hypothesis
must be accepted in this case: there is no decline in CD34+ stem cells
in a sample when gestation period exceeds 40 weeks.
The final part of the first hypothesis was that gestation periods over 40
weeks give lower viabilities. Viability is measured by counting
flurochromes attached to exposed DNA which is released from dead or
comprimised cells. In this way, the viability of the sample can be
assesssed.
A test for equal variance was performed on the viabilites which yielded
a graph (Figure 8) stating that there is no significant difference in
variance and so ANOVA testing is viable assuming equal variance.
Tukey parirwise, Fisher pairwise and Dunnett multiple comparison
tests all yieleded results indicating that there is no significant
difference between viabilites of babies born pre 40 weeks or post 40
weeks (Figure 9).
To ensure no error in the findings, the groups were split into
component weeks. The graph (Figure 8) shows the overlapping
variance error bars indicating that equal variance may be assumed for
further tests. ANOVA testing was then carried out (Figure 10), the
results of which gave Tukey pairwise, Fisher pairwise and Dunnett
mulitple comparison test results supporting no difference between the
individual samples.
Figure 8 Test for equal variance between viability data grouped by gestation week
Figure 9 Tukey, Fisher and Dunnett tests on
viability data sets grouped into pre, post and
equal to 40 weeks gestation
Figure 10 Tukey, Fisher and Dunnett tests on viability data sets grouped by gestation week
JAMES BEDFORD 2015 PAGE 6
In conclusion, the first hypothesis cannot be accepted and the data
does not support the idea that gestation periods in excess of 40 weeks
lead to lower viability, volume or stem cell counts.
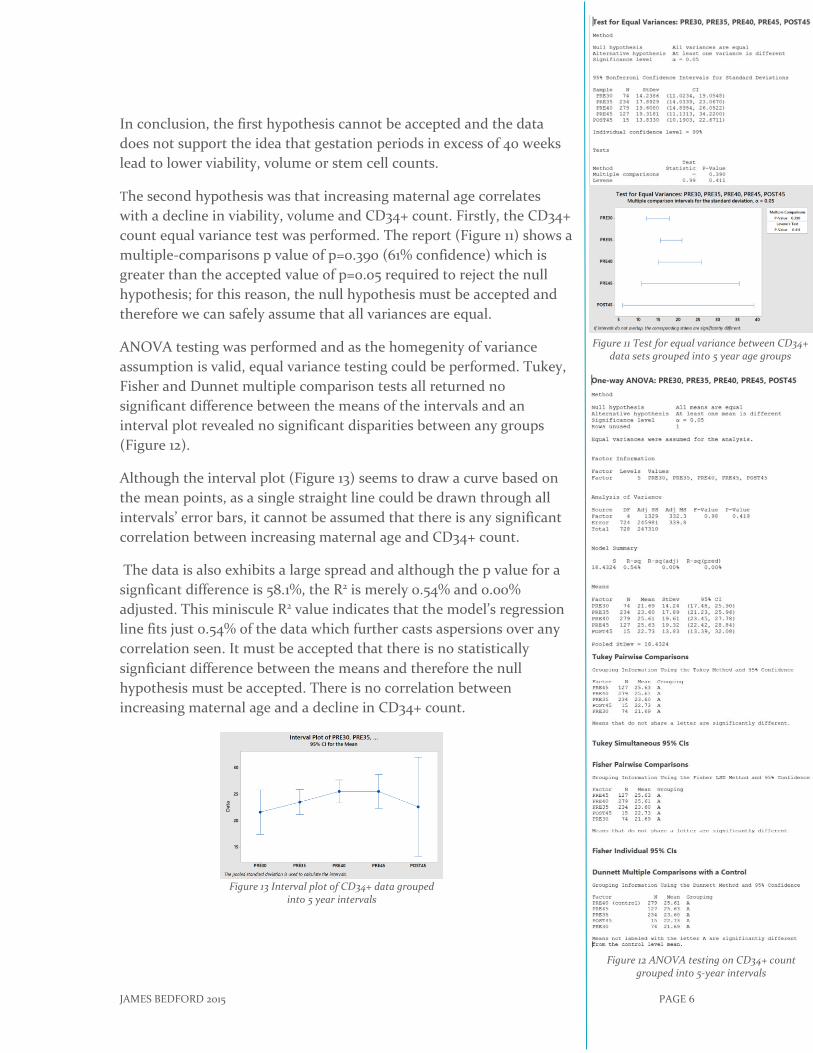
The second hypothesis was that increasing maternal age correlates
with a decline in viability, volume and CD34+ count. Firstly, the CD34+
count equal variance test was performed. The report (Figure 11) shows a
multiple-comparisons p value of p=0.390 (61% confidence) which is
greater than the accepted value of p=0.05 required to reject the null
hypothesis; for this reason, the null hypothesis must be accepted and
therefore we can safely assume that all variances are equal.
ANOVA testing was performed and as the homegenity of variance
assumption is valid, equal variance testing could be performed. Tukey,
Fisher and Dunnet multiple comparison tests all returned no
significant difference between the means of the intervals and an
interval plot revealed no significant disparities between any groups
(Figure 12).
Although the interval plot (Figure 13) seems to draw a curve based on
the mean points, as a single straight line could be drawn through all
intervals’ error bars, it cannot be assumed that there is any significant
correlation between increasing maternal age and CD34+ count.
The data is also exhibits a large spread and although the p value for a
signficant difference is 58.1%, the R2 is merely 0.54% and 0.00%
adjusted. This miniscule R2 value indicates that the model’s regression
line fits just 0.54% of the data which further casts aspersions over any
correlation seen. It must be accepted that there is no statistically
signficiant difference between the means and therefore the null
hypothesis must be accepted. There is no correlation between
increasing maternal age and a decline in CD34+ count.
Figure 13 Interval plot of CD34+ data grouped into 5 year intervals
Figure 11 Test for equal variance between CD34+ data sets grouped into 5 year age groups
Figure 12 ANOVA testing on CD34+ count grouped into 5-year intervals
JAMES BEDFORD 2015 PAGE 7
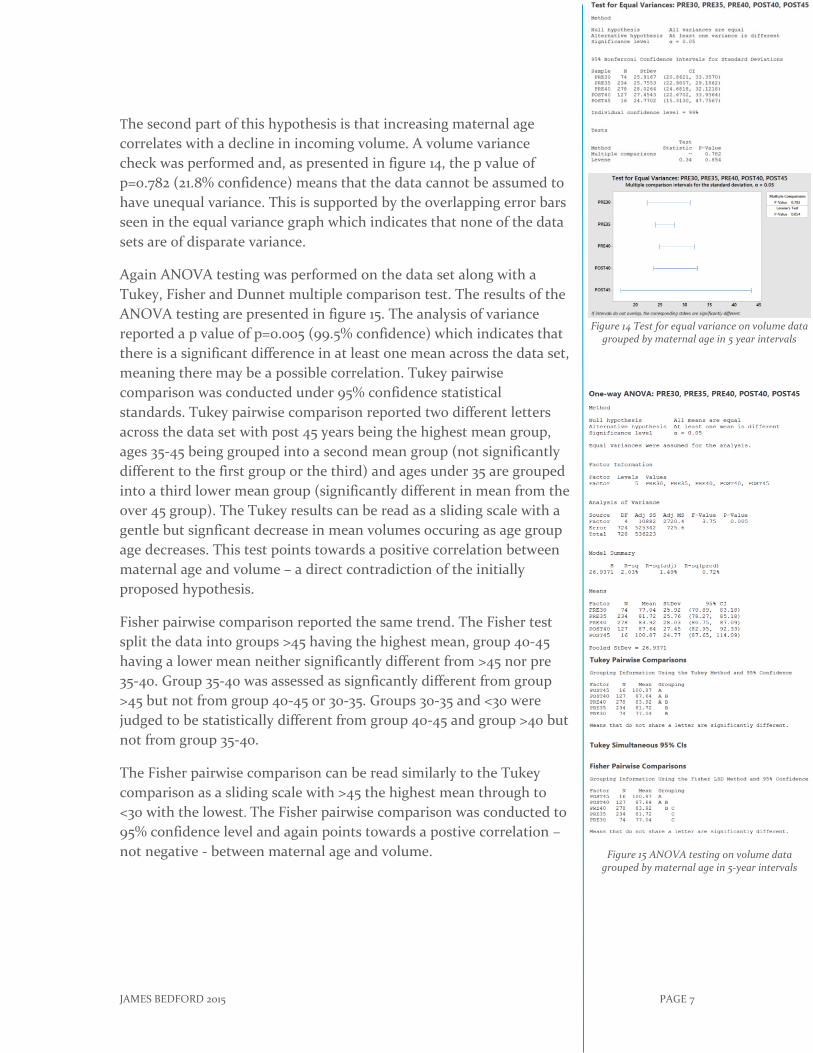
The second part of this hypothesis is that increasing maternal age
correlates with a decline in incoming volume. A volume variance
check was performed and, as presented in figure 14, the p value of
p=0.782 (21.8% confidence) means that the data cannot be assumed to
have unequal variance. This is supported by the overlapping error bars
seen in the equal variance graph which indicates that none of the data
sets are of disparate variance.
Again ANOVA testing was performed on the data set along with a
Tukey, Fisher and Dunnet multiple comparison test. The results of the
ANOVA testing are presented in figure 15. The analysis of variance
reported a p value of p=0.005 (99.5% confidence) which indicates that
there is a significant difference in at least one mean across the data set,
meaning there may be a possible correlation. Tukey pairwise
comparison was conducted under 95% confidence statistical
standards. Tukey pairwise comparison reported two different letters
across the data set with post 45 years being the highest mean group,
ages 35-45 being grouped into a second mean group (not significantly
different to the first group or the third) and ages under 35 are grouped
into a third lower mean group (significantly different in mean from the
over 45 group). The Tukey results can be read as a sliding scale with a
gentle but signficant decrease in mean volumes occuring as age group
age decreases. This test points towards a positive correlation between
maternal age and volume – a direct contradiction of the initially
proposed hypothesis.
Fisher pairwise comparison reported the same trend. The Fisher test
split the data into groups >45 having the highest mean, group 40-45
having a lower mean neither significantly different from >45 nor pre
35-40. Group 35-40 was assessed as signficantly different from group
>45 but not from group 40-45 or 30-35. Groups 30-35 and <30 were
judged to be statistically different from group 40-45 and group >40 but
not from group 35-40.
The Fisher pairwise comparison can be read similarly to the Tukey
comparison as a sliding scale with >45 the highest mean through to
<30 with the lowest. The Fisher pairwise comparison was conducted to
95% confidence level and again points towards a postive correlation –
not negative - between maternal age and volume.
Figure 14 Test for equal variance on volume data grouped by maternal age in 5 year intervals
Figure 15 ANOVA testing on volume data grouped by maternal age in 5-year intervals
JAMES BEDFORD 2015 PAGE 8
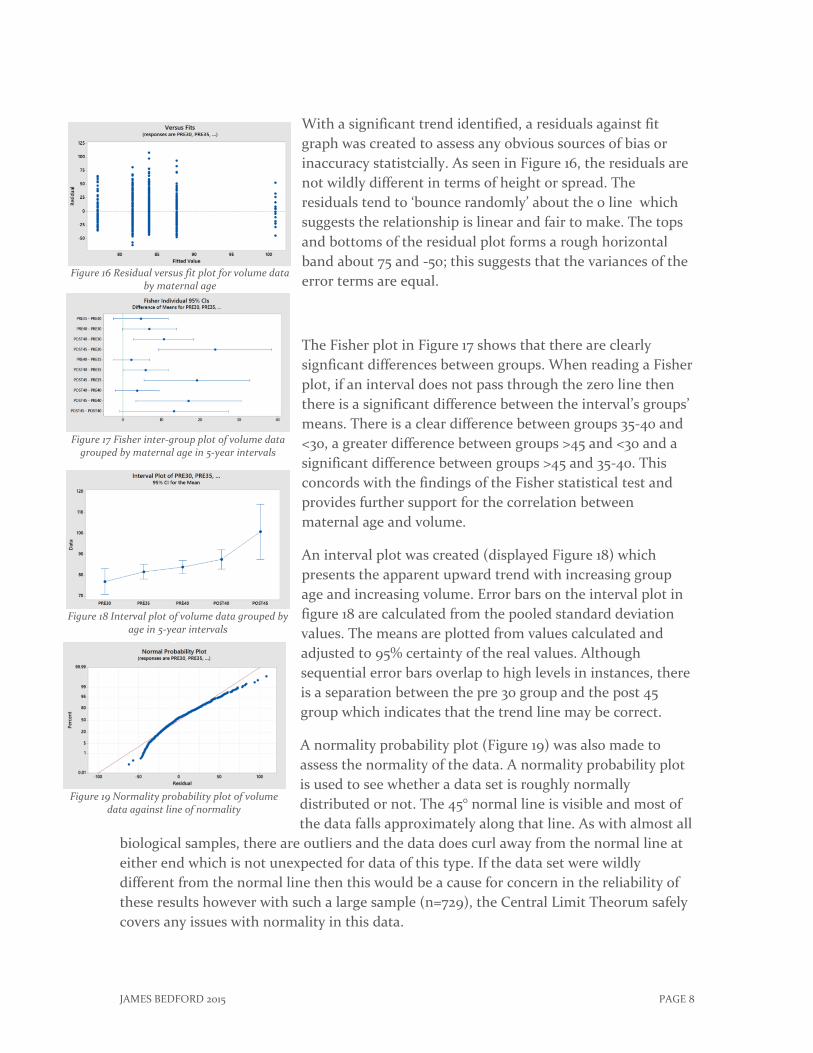
With a significant trend identified, a residuals against fit
graph was created to assess any obvious sources of bias or
inaccuracy statistcially. As seen in Figure 16, the residuals are
not wildly different in terms of height or spread. The
residuals tend to ‘bounce randomly’ about the 0 line which
suggests the relationship is linear and fair to make. The tops
and bottoms of the residual plot forms a rough horizontal
band about 75 and -50; this suggests that the variances of the
error terms are equal.
The Fisher plot in Figure 17 shows that there are clearly
signficant differences between groups. When reading a Fisher
plot, if an interval does not pass through the zero line then
there is a significant difference between the interval’s groups’
means. There is a clear difference between groups 35-40 and
<30, a greater difference between groups >45 and <30 and a
significant difference between groups >45 and 35-40. This
concords with the findings of the Fisher statistical test and
provides further support for the correlation between
maternal age and volume.
An interval plot was created (displayed Figure 18) which
presents the apparent upward trend with increasing group
age and increasing volume. Error bars on the interval plot in
figure 18 are calculated from the pooled standard deviation
values. The means are plotted from values calculated and
adjusted to 95% certainty of the real values. Although
sequential error bars overlap to high levels in instances, there
is a separation between the pre 30 group and the post 45
group which indicates that the trend line may be correct.
A normality probability plot (Figure 19) was also made to
assess the normality of the data. A normality probability plot
is used to see whether a data set is roughly normally
distributed or not. The 45° normal line is visible and most of
the data falls approximately along that line. As with almost all
biological samples, there are outliers and the data does curl away from the normal line at
either end which is not unexpected for data of this type. If the data set were wildly
different from the normal line then this would be a cause for concern in the reliability of
these results however with such a large sample (n=729), the Central Limit Theorum safely
covers any issues with normality in this data.
Figure 16 Residual versus fit plot for volume data by maternal age
Figure 17 Fisher inter-group plot of volume data grouped by maternal age in 5-year intervals
Figure 18 Interval plot of volume data grouped by age in 5-year intervals
Figure 19 Normality probability plot of volume data against line of normality
JAMES BEDFORD 2015 PAGE 9
To summarise, there is a statistically significant possitive correlation
between maternal age and the volume of cord blood collected to a
degree of confidence in excess of 95%.
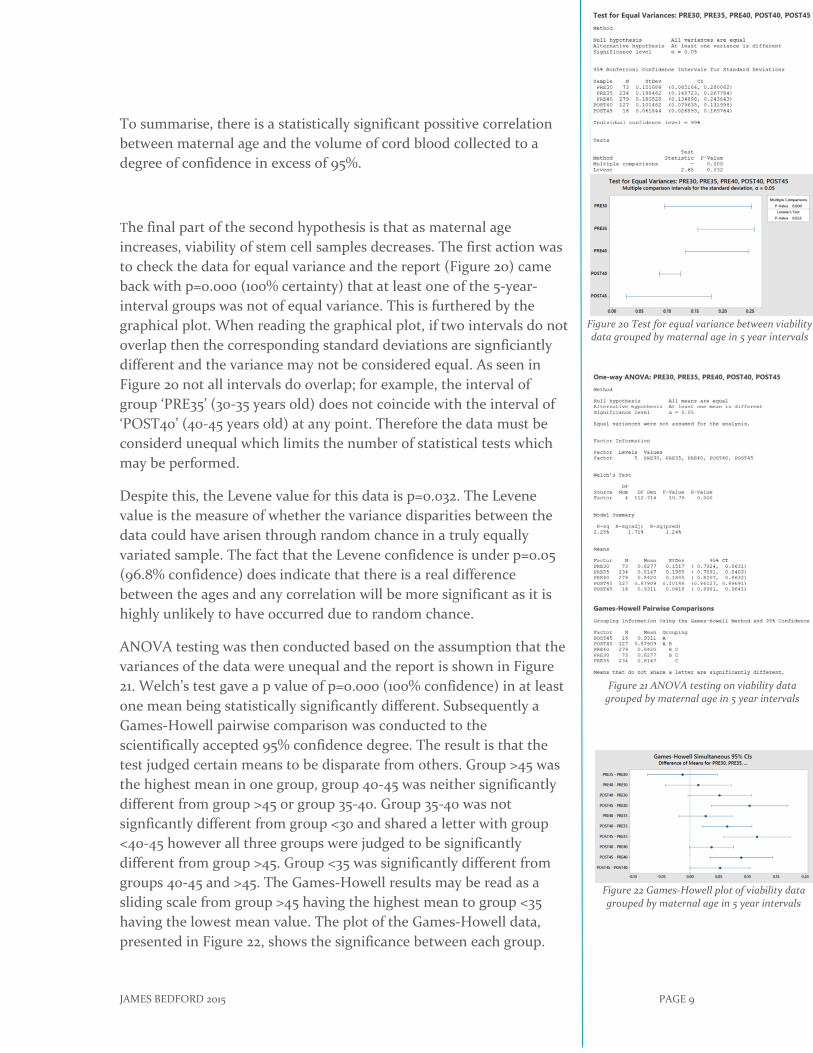
The final part of the second hypothesis is that as maternal age
increases, viability of stem cell samples decreases. The first action was
to check the data for equal variance and the report (Figure 20) came
back with p=0.000 (100% certainty) that at least one of the 5-year-
interval groups was not of equal variance. This is furthered by the
graphical plot. When reading the graphical plot, if two intervals do not
overlap then the corresponding standard deviations are signficiantly
different and the variance may not be considered equal. As seen in
Figure 20 not all intervals do overlap; for example, the interval of
group ‘PRE35’ (30-35 years old) does not coincide with the interval of
‘POST40’ (40-45 years old) at any point. Therefore the data must be
considerd unequal which limits the number of statistical tests which
may be performed.
Despite this, the Levene value for this data is p=0.032. The Levene
value is the measure of whether the variance disparities between the
data could have arisen through random chance in a truly equally
variated sample. The fact that the Levene confidence is under p=0.05
(96.8% confidence) does indicate that there is a real difference
between the ages and any correlation will be more significant as it is
highly unlikely to have occurred due to random chance.
ANOVA testing was then conducted based on the assumption that the
variances of the data were unequal and the report is shown in Figure
21. Welch’s test gave a p value of p=0.000 (100% confidence) in at least
one mean being statistically significantly different. Subsequently a
Games-Howell pairwise comparison was conducted to the
scientifically accepted 95% confidence degree. The result is that the
test judged certain means to be disparate from others. Group >45 was
the highest mean in one group, group 40-45 was neither significantly
different from group >45 or group 35-40. Group 35-40 was not
signficantly different from group <30 and shared a letter with group
<40-45 however all three groups were judged to be significantly
different from group >45. Group <35 was significantly different from
groups 40-45 and >45. The Games-Howell results may be read as a
sliding scale from group >45 having the highest mean to group <35
having the lowest mean value. The plot of the Games-Howell data,
presented in Figure 22, shows the significance between each group.
Figure 20 Test for equal variance between viability data grouped by maternal age in 5 year intervals
Figure 21 ANOVA testing on viability data grouped by maternal age in 5 year intervals
Figure 22 Games-Howell plot of viability data grouped by maternal age in 5 year intervals
JAMES BEDFORD 2015 PAGE 10
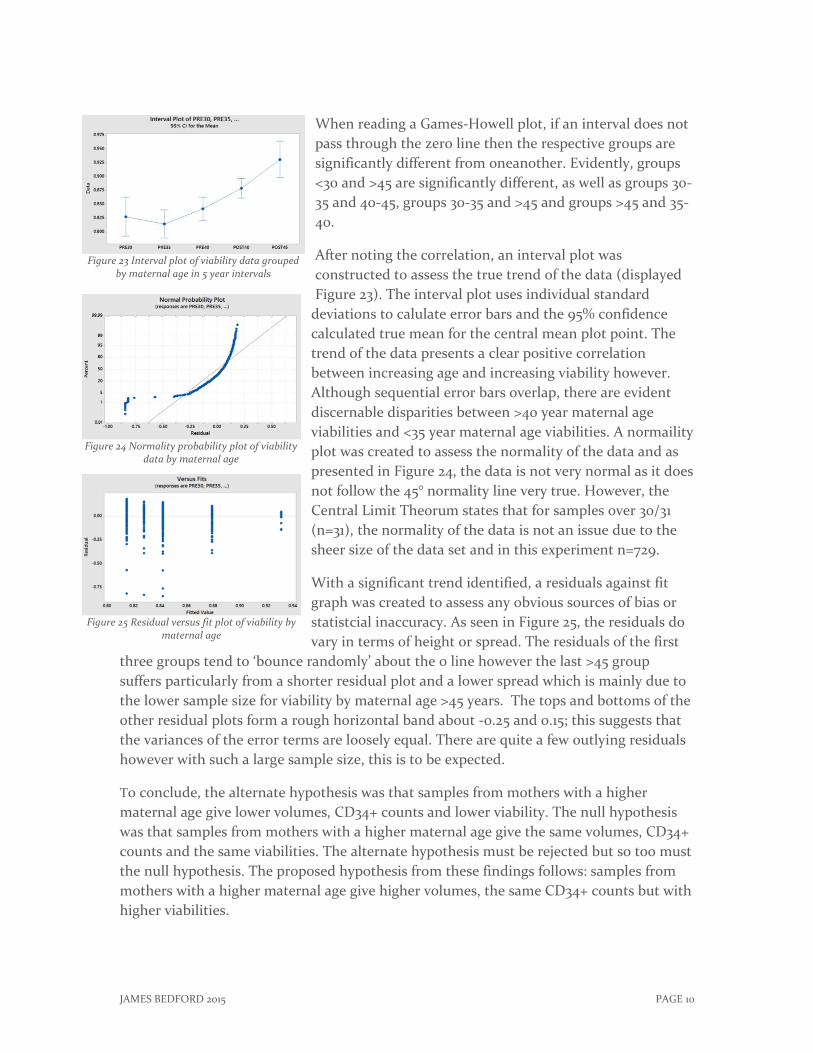
When reading a Games-Howell plot, if an interval does not
pass through the zero line then the respective groups are
significantly different from oneanother. Evidently, groups
<30 and >45 are significantly different, as well as groups 30-
35 and 40-45, groups 30-35 and >45 and groups >45 and 35-
40.
After noting the correlation, an interval plot was
constructed to assess the true trend of the data (displayed
Figure 23). The interval plot uses individual standard
deviations to calulate error bars and the 95% confidence
calculated true mean for the central mean plot point. The
trend of the data presents a clear positive correlation
between increasing age and increasing viability however.
Although sequential error bars overlap, there are evident
discernable disparities between >40 year maternal age
viabilities and <35 year maternal age viabilities. A normaility
plot was created to assess the normality of the data and as
presented in Figure 24, the data is not very normal as it does
not follow the 45° normality line very true. However, the
Central Limit Theorum states that for samples over 30/31
(n=31), the normality of the data is not an issue due to the
sheer size of the data set and in this experiment n=729.
With a significant trend identified, a residuals against fit
graph was created to assess any obvious sources of bias or
statistcial inaccuracy. As seen in Figure 25, the residuals do
vary in terms of height or spread. The residuals of the first
three groups tend to ‘bounce randomly’ about the 0 line however the last >45 group
suffers particularly from a shorter residual plot and a lower spread which is mainly due to
the lower sample size for viability by maternal age >45 years. The tops and bottoms of the
other residual plots form a rough horizontal band about -0.25 and 0.15; this suggests that
the variances of the error terms are loosely equal. There are quite a few outlying residuals
however with such a large sample size, this is to be expected.
To conclude, the alternate hypothesis was that samples from mothers with a higher
maternal age give lower volumes, CD34+ counts and lower viability. The null hypothesis
was that samples from mothers with a higher maternal age give the same volumes, CD34+
counts and the same viabilities. The alternate hypothesis must be rejected but so too must
the null hypothesis. The proposed hypothesis from these findings follows: samples from
mothers with a higher maternal age give higher volumes, the same CD34+ counts but with
higher viabilities.
Figure 23 Interval plot of viability data grouped by maternal age in 5 year intervals
Figure 24 Normality probability plot of viability data by maternal age
Figure 25 Residual versus fit plot of viability by maternal age
JAMES BEDFORD 2015 PAGE 11
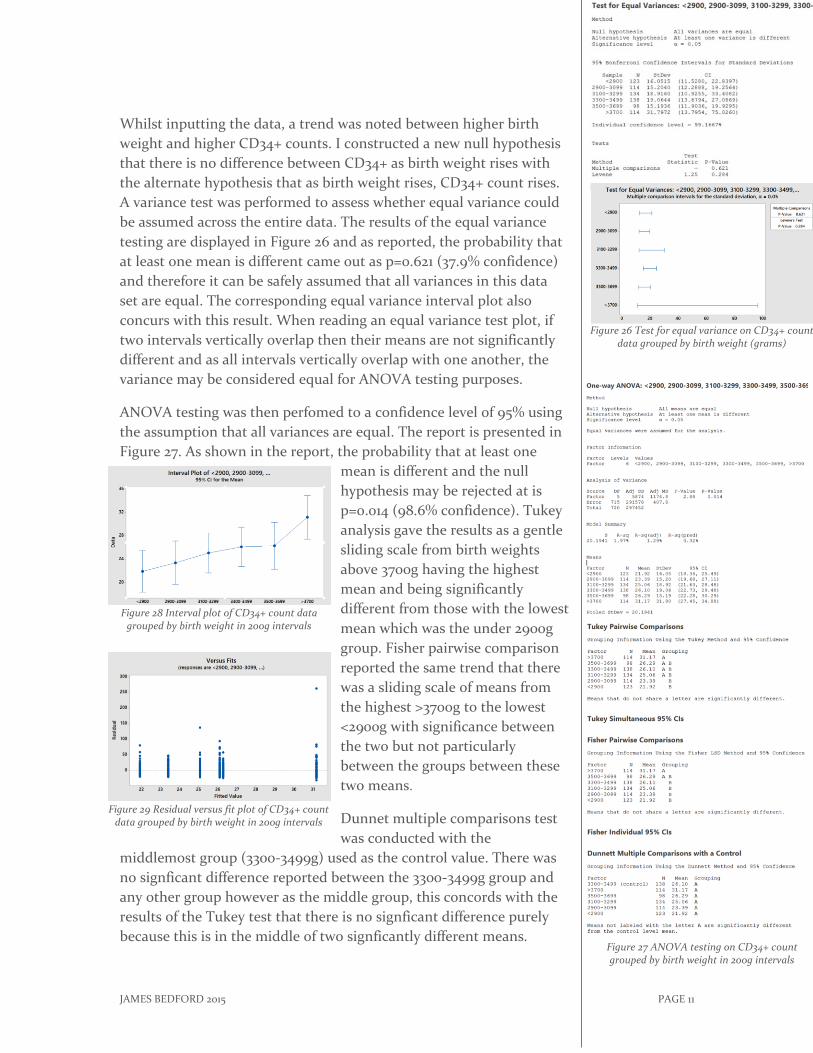
Whilst inputting the data, a trend was noted between higher birth
weight and higher CD34+ counts. I constructed a new null hypothesis
that there is no difference between CD34+ as birth weight rises with
the alternate hypothesis that as birth weight rises, CD34+ count rises.
A variance test was performed to assess whether equal variance could
be assumed across the entire data. The results of the equal variance
testing are displayed in Figure 26 and as reported, the probability that
at least one mean is different came out as p=0.621 (37.9% confidence)
and therefore it can be safely assumed that all variances in this data
set are equal. The corresponding equal variance interval plot also
concurs with this result. When reading an equal variance test plot, if
two intervals vertically overlap then their means are not significantly
different and as all intervals vertically overlap with one another, the
variance may be considered equal for ANOVA testing purposes.
ANOVA testing was then perfomed to a confidence level of 95% using
the assumption that all variances are equal. The report is presented in
Figure 27. As shown in the report, the probability that at least one
mean is different and the null
hypothesis may be rejected at is
p=0.014 (98.6% confidence). Tukey
analysis gave the results as a gentle
sliding scale from birth weights
above 3700g having the highest
mean and being significantly
different from those with the lowest
mean which was the under 2900g
group. Fisher pairwise comparison
reported the same trend that there
was a sliding scale of means from
the highest >3700g to the lowest
<2900g with significance between
the two but not particularly
between the groups between these
two means.
Dunnet multiple comparisons test
was conducted with the
middlemost group (3300-3499g) used as the control value. There was
no signficant difference reported between the 3300-3499g group and
any other group however as the middle group, this concords with the
results of the Tukey test that there is no signficant difference purely
because this is in the middle of two signficantly different means.
Figure 26 Test for equal variance on CD34+ count data grouped by birth weight (grams)
Figure 27 ANOVA testing on CD34+ count grouped by birth weight in 200g intervals
Figure 28 Interval plot of CD34+ count data grouped by birth weight in 200g intervals
Figure 29 Residual versus fit plot of CD34+ count data grouped by birth weight in 200g intervals
JAMES BEDFORD 2015 PAGE 12
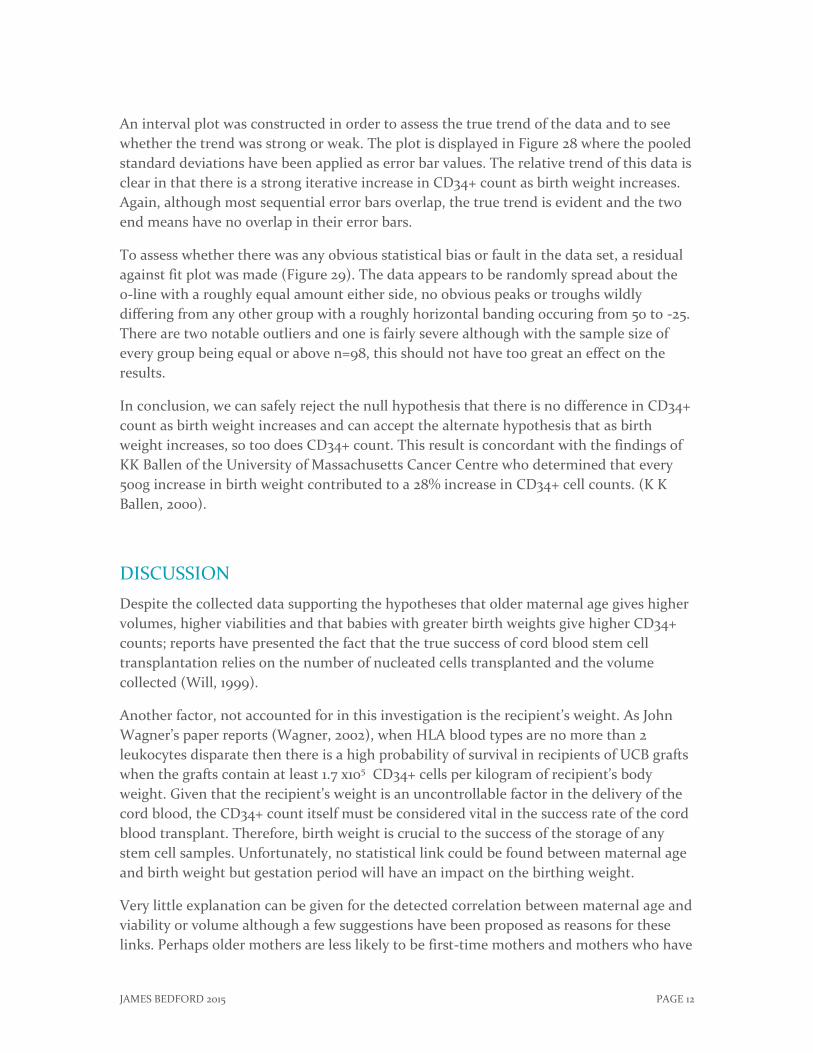
An interval plot was constructed in order to assess the true trend of the data and to see
whether the trend was strong or weak. The plot is displayed in Figure 28 where the pooled
standard deviations have been applied as error bar values. The relative trend of this data is
clear in that there is a strong iterative increase in CD34+ count as birth weight increases.
Again, although most sequential error bars overlap, the true trend is evident and the two
end means have no overlap in their error bars.
To assess whether there was any obvious statistical bias or fault in the data set, a residual
against fit plot was made (Figure 29). The data appears to be randomly spread about the
0-line with a roughly equal amount either side, no obvious peaks or troughs wildly
differing from any other group with a roughly horizontal banding occuring from 50 to -25.
There are two notable outliers and one is fairly severe although with the sample size of
every group being equal or above n=98, this should not have too great an effect on the
results.
In conclusion, we can safely reject the null hypothesis that there is no difference in CD34+
count as birth weight increases and can accept the alternate hypothesis that as birth
weight increases, so too does CD34+ count. This result is concordant with the findings of
KK Ballen of the University of Massachusetts Cancer Centre who determined that every
500g increase in birth weight contributed to a 28% increase in CD34+ cell counts. (K K
Ballen, 2000).
DISCUSSION
Despite the collected data supporting the hypotheses that older maternal age gives higher
volumes, higher viabilities and that babies with greater birth weights give higher CD34+
counts; reports have presented the fact that the true success of cord blood stem cell
transplantation relies on the number of nucleated cells transplanted and the volume
collected (Will, 1999).
Another factor, not accounted for in this investigation is the recipient’s weight. As John
Wagner’s paper reports (Wagner, 2002), when HLA blood types are no more than 2
leukocytes disparate then there is a high probability of survival in recipients of UCB grafts
when the grafts contain at least 1.7 x10⁵ CD34+ cells per kilogram of recipient’s body
weight. Given that the recipient’s weight is an uncontrollable factor in the delivery of the
cord blood, the CD34+ count itself must be considered vital in the success rate of the cord
blood transplant. Therefore, birth weight is crucial to the success of the storage of any
stem cell samples. Unfortunately, no statistical link could be found between maternal age
and birth weight but gestation period will have an impact on the birthing weight.
Very little explanation can be given for the detected correlation between maternal age and
viability or volume although a few suggestions have been proposed as reasons for these
links. Perhaps older mothers are less likely to be first-time mothers and mothers who have

JAMES BEDFORD 2015 PAGE 13
previously given birth experience less trauma and stress to the umbilical cord cells during
labour and delivery. Alternatively, it has been suggested that lifestyle of older women is
likely to be less erratic and healthier with fewer chemical and physiological instabilities as
are present in younger mothers. This could lead to a less traumatic and a more stable
pregnancy which may have an effect on the quality of cells at birth.
In regards to the finding of no correlation between gestation period and viability, cell
count or volume, the findings seem to, again, contradict common literature supporting
the idea that gestation periods over 40 weeks are unhealthier pregnancies due to the
breakdown of elements of the womb after this period which can risk stillbirth or birthing
complications (the reason for induced labour options being recommended after 42 weeks
gestation) (NHS, 2015).
This report concludes that mothers giving birth to babies at a maternal age over 35 will
deliver samples of greater volume and stem cell viability. The number of CD34+ cells per
microlitre increases with birth weight which is a key factor for the success of future
transplantations. This said, the purity of the umbilical cord blood (most births result in
leakage of blood from mother to baby) and the presence of cord blood stem cells in favour
of maternal red blood cells is also of significant importance in many factors of storage
from freezing and preservation to transplantation and viability (M-Reboredo, 2000). A
proposed extension of this report is in collecting and collating data on whether mothers of
the newborn are first-time mothers or not, how many hours of labour the mother went
through and the weight of the mother at time of birth to assess the effect of these factors
on the data.

JAMES BEDFORD 2015 PAGE 14
References Ghadeer Ibrahim Alrefaei, S. A.-K. (2015, August). Does the maternal age affect the mesenchymal
stem cell markers and gene expression in the human placenta? What is the evidence?
Tissue&Cell. doi:10.1016/j.tice.2015.05.005
Health, N. I. (2011, June 17). Hematopoietic Stem Cells. Retrieved from U.S. Department of Health
and Human Services: http://stemcells.nih.gov/info/scireport/pages/chapter5.aspx
K K Ballen, M. W. (2000). Bigger is better: maternal and neonatal predictors of hematopoietic
potential of umbilical cord blood units. Nature, 27(1), 7-14. Retrieved from
http://www.nature.com/bmt/journal/v27/n1/full/1702729a.html
M-Reboredo, N. (2000). Collection, processing and cryopreservation of umbilical cord blood for
unrelated transplantation. Bone Marrow Transplantation, 1263-1270.
NHS, N. H. (2015, 02 12). Induced Labour. Retrieved from NHS Choices:
http://www.nhs.uk/conditions/pregnancy-and-baby/pages/induction-labour.aspx#close
Rubenstein, P. (1995, October 24). Processing and cryopreservation of placental/umbilical cord
blood for unrelated bone marrow reconstruction. Proceedings of the National Academy of
Sciences, 92(22), 10119-10122.
UAH. (n.d.). The Central Limit Theorum. Retrieved from University of Alabama in Huntsville:
http://www.math.uah.edu/stat/sample/CLT.html
Wagner, J. E. (2002). Transplantation of Unrelated Donor Umbilical Cord Blood in 102 patients with
malignant and nonmalignant diseases: influence of CD34 cell dose and HLA disparity on
treatment-related mortality and survival. Blood, 100(5), 1611-1618.
Will, A. M. (1999). Umbilical Cord Blood Transplantation. Archives of Disease and Childhood, 80(1),
3-6.
ACKNOWLEDGEMENTS
Portions of information contained in this publication/book are printed with permission of Minitab
Inc. All such material remains the exclusive property and copyright of Minitab Inc. All rights
reserved.
MINITAB® and all other trademarks and logos for the Company's products and services are the
exclusive property of Minitab Inc. All other marks referenced remain the property of their
respective owners. See minitab.com for more information