Embed Size (px)
Citation preview

NH Business Growth SectorsHouse and Senate Finance and Ways & Means Committees
Dennis DelayDeputy Director,New Hampshire Center for Public Policy Studies1/9/2007
2
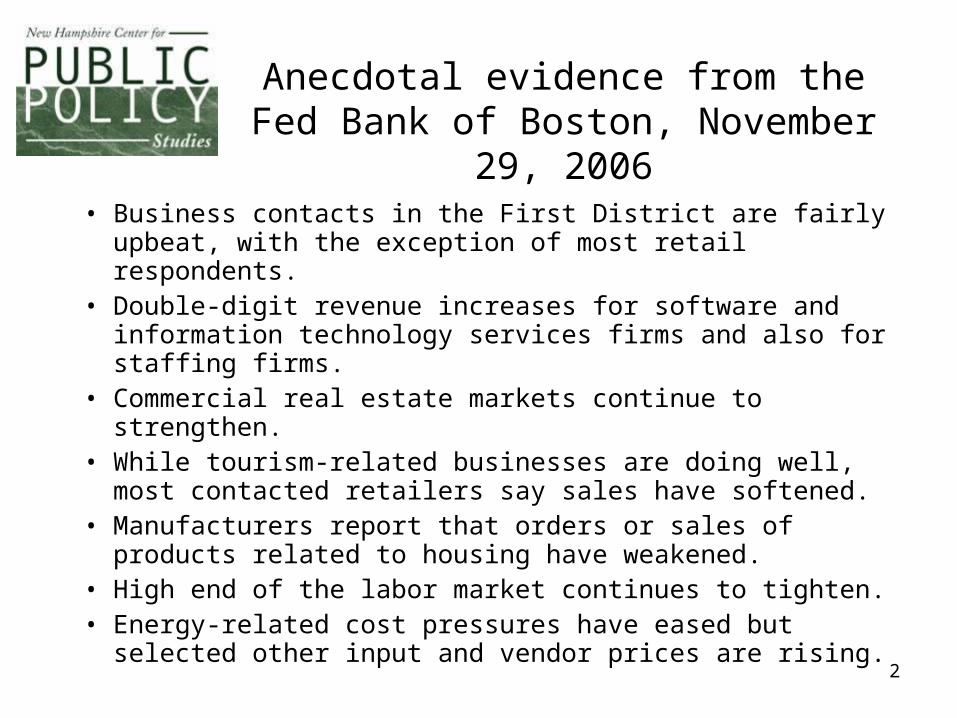
Anecdotal evidence from the Fed Bank of Boston, November 29, 2006
• Business contacts in the First District are fairly upbeat, with the exception of most retail respondents.
• Double-digit revenue increases for software and information technology services firms and also for staffing firms.
• Commercial real estate markets continue to strengthen.• While tourism-related businesses are doing well, most
contacted retailers say sales have softened.• Manufacturers report that orders or sales of products
related to housing have weakened.• High end of the labor market continues to tighten. • Energy-related cost pressures have eased but selected
other input and vendor prices are rising.
3
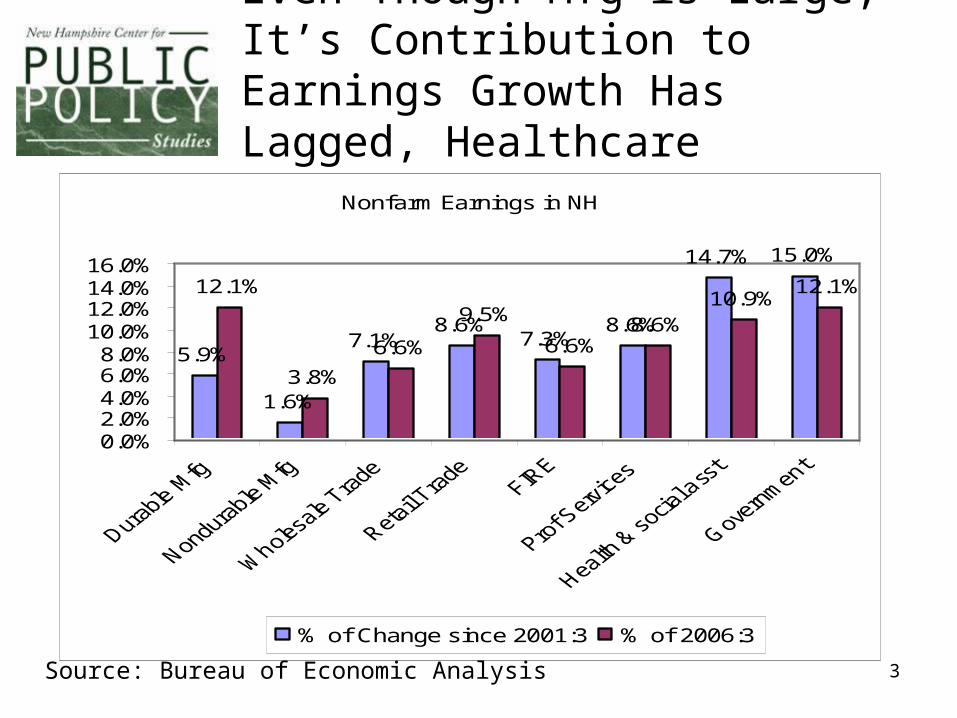
Even Though Mfg is Large, It’s Contribution to Earnings Growth Has Lagged, Healthcare Increases
Nonfarm Earnings in NH
5.9%
1.6%
7.1%8.6%
7.3%8.6%
14.7% 15.0%
12.1%
3.8%
6.6%
9.5%
6.6%8.6%
10.9%12.1%
0.0%2.0%4.0%6.0%8.0%
10.0%12.0%14.0%16.0%
% of Change since 2001:3 % of 2006:3
Source: Bureau of Economic Analysis

4
New Hampshire Growing Faster than US or Region Since 2001
Real Gross State ProductIndex to 2001=100
80.00
85.00
90.00
95.00
100.00
105.00
110.00
115.00
1997 1998 1999 2000 2001 2002 2003 2004 2005
US NEW ENGLAND New Hampshire
New HampshireUS
New England
Source: Bureau of Economic Analysis

5
Fastest Growing GDP Contributors are Not (Necessarily) the Largest
Growth 2001 to 2005
Private Industry NH GDP, Ranked by 2001 to 2005 Growth 2001 2005 Change Percent
Educational services 669 960 291 43.5%
Utilities 1,297 1,791 494 38.1%
Information 1,420 1,942 522 36.8%
Health care and social assistance 3,366 4,547 1,181 35.1%
Real estate, rental, and leasing 6,236 8,322 2,086 33.5%
Administrative and waste services 1,095 1,430 335 30.6%
Construction 2,122 2,754 632 29.8%
Management of companies and enterprises 604 781 177 29.3%
Retail trade 3,723 4,658 935 25.1%
Accommodation and food services 1,317 1,640 323 24.5%
Transportation and warehousing 735 885 150 20.4%
Wholesale trade 2,935 3,523 588 20.0%
Other services, except government 1,099 1,308 209 19.0%
Finance and insurance 4,040 4,785 745 18.4%
Professional and technical services 2,873 3,349 476 16.6%
Arts, entertainment, and recreation 398 461 63 15.8%
Mfg Durable goods 4,443 5,043 600 13.5%
Mfg Nondurable goods 1,745 1,557 -188 -10.8%
6
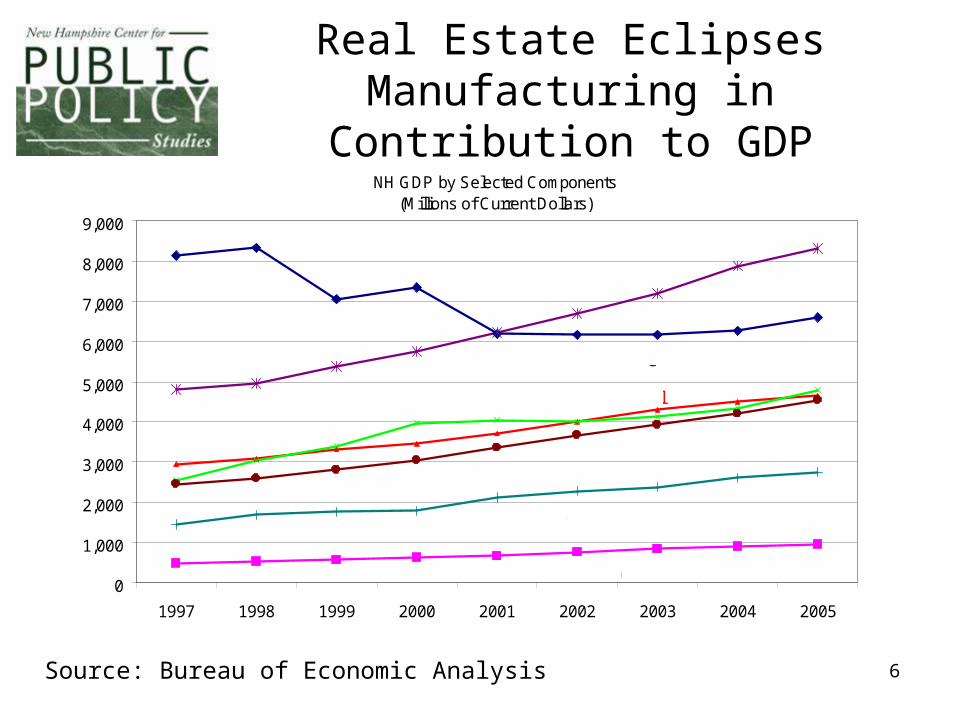
Real Estate Eclipses Manufacturing in Contribution to
GDPNH GDP by Selected Components
(Millions of Current Dollars)
0
1,000
2,000
3,000
4,000
5,000
6,000
7,000
8,000
9,000
1997 1998 1999 2000 2001 2002 2003 2004 2005
Manufacturing
Real Estate, Rental and Leasing
FIRE
Retail
Health Care
Construction
Education
Source: Bureau of Economic Analysis
7
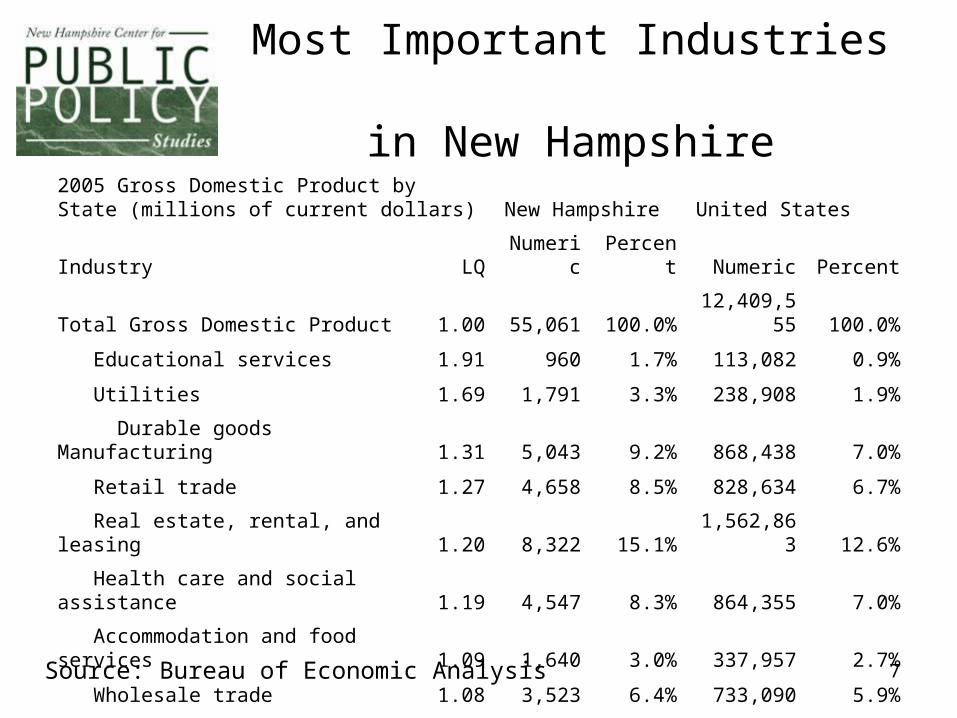
Most Important Industries in New Hampshire
2005 Gross Domestic Product by State (millions of current dollars) New Hampshire United States
Industry LQ Numeric Percent Numeric Percent
Total Gross Domestic Product 1.00 55,061 100.0% 12,409,555 100.0%
Educational services 1.91 960 1.7% 113,082 0.9%
Utilities 1.69 1,791 3.3% 238,908 1.9%
Durable goods Manufacturing 1.31 5,043 9.2% 868,438 7.0%
Retail trade 1.27 4,658 8.5% 828,634 6.7%
Real estate, rental, and leasing 1.20 8,322 15.1% 1,562,863 12.6%
Health care and social assistance 1.19 4,547 8.3% 864,355 7.0%
Accommodation and food services 1.09 1,640 3.0% 337,957 2.7%
Wholesale trade 1.08 3,523 6.4% 733,090 5.9%
Finance and insurance 1.07 4,785 8.7% 1,011,548 8.2%
Construction 1.05 2,754 5.0% 593,535 4.8%
Source: Bureau of Economic Analysis
8
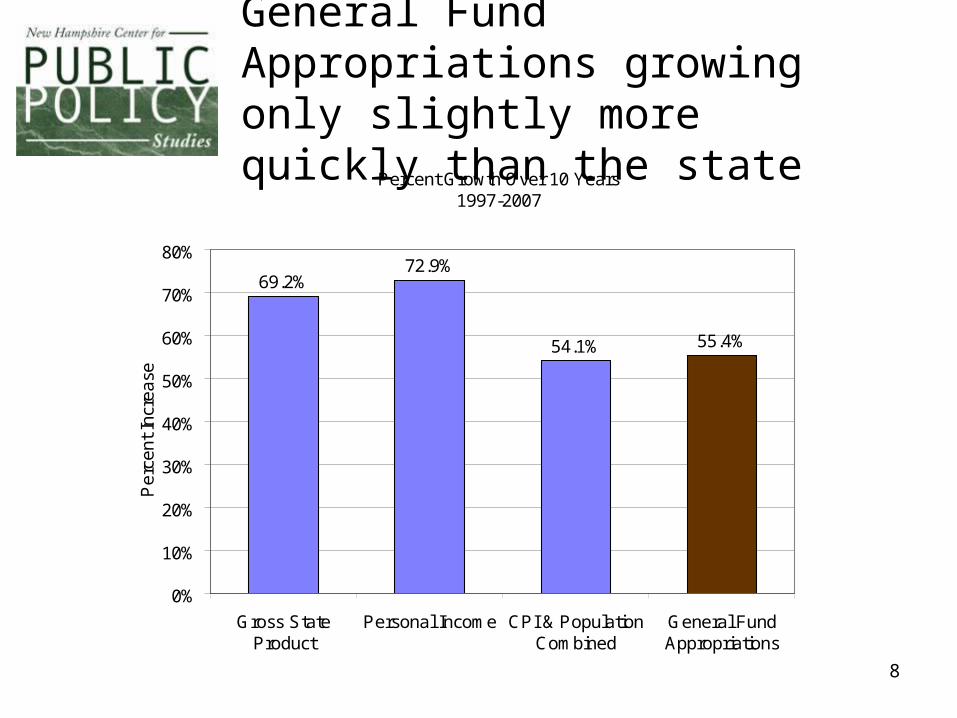
Percent Growth Over 10 Years1997-2007
69.2%72.9%
54.1% 55.4%
0%
10%
20%
30%
40%
50%
60%
70%
80%
Gross StateProduct
Personal Income CPI & PopulationCombined
General FundAppropriations
Per
cent
Inc
rea
se
General Fund Appropriations growing only slightly more quickly than the state
9
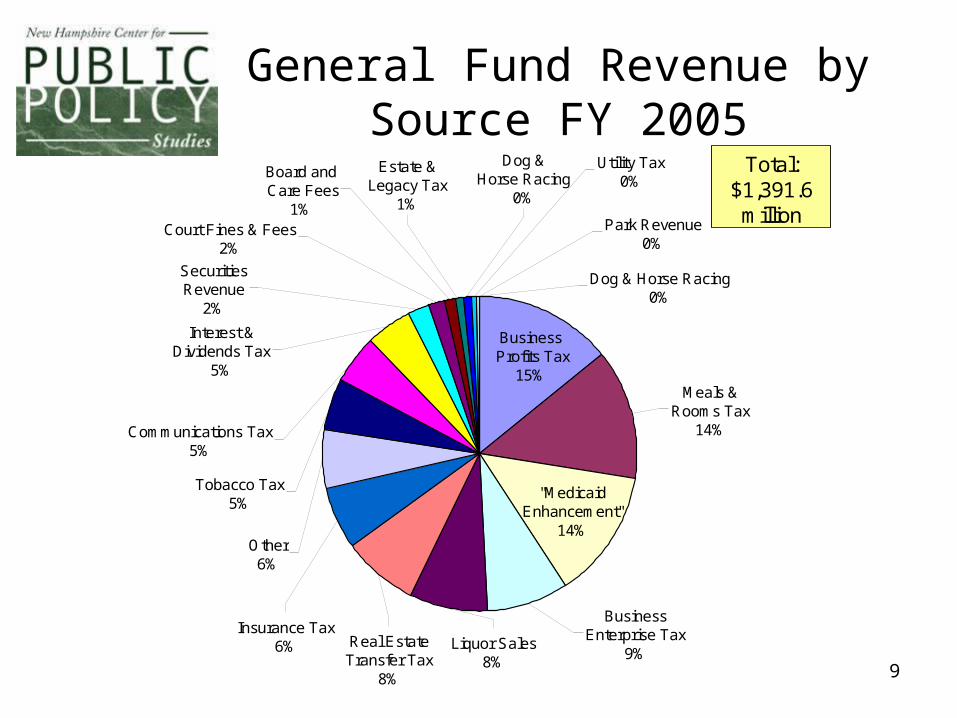
Business Enterprise Tax
9%
Meals & Rooms Tax
14%
"Medicaid Enhancement"
14%
Utility Tax0%
Dog & Horse Racing
0%
Estate & Legacy Tax
1%
Dog & Horse Racing0%
Park Revenue0%
Board and Care Fees
1%
Interest & Dividends Tax
5%
SecuritiesRevenue
2%
Court Fines & Fees2%
Business Profits Tax
15%
Communications Tax5%
Tobacco Tax5%
Other6%
Insurance Tax6% Real Estate
Transfer Tax8%
Liquor Sales8%
Total:$1,391.6 million
General Fund Revenue by Source FY 2005
10
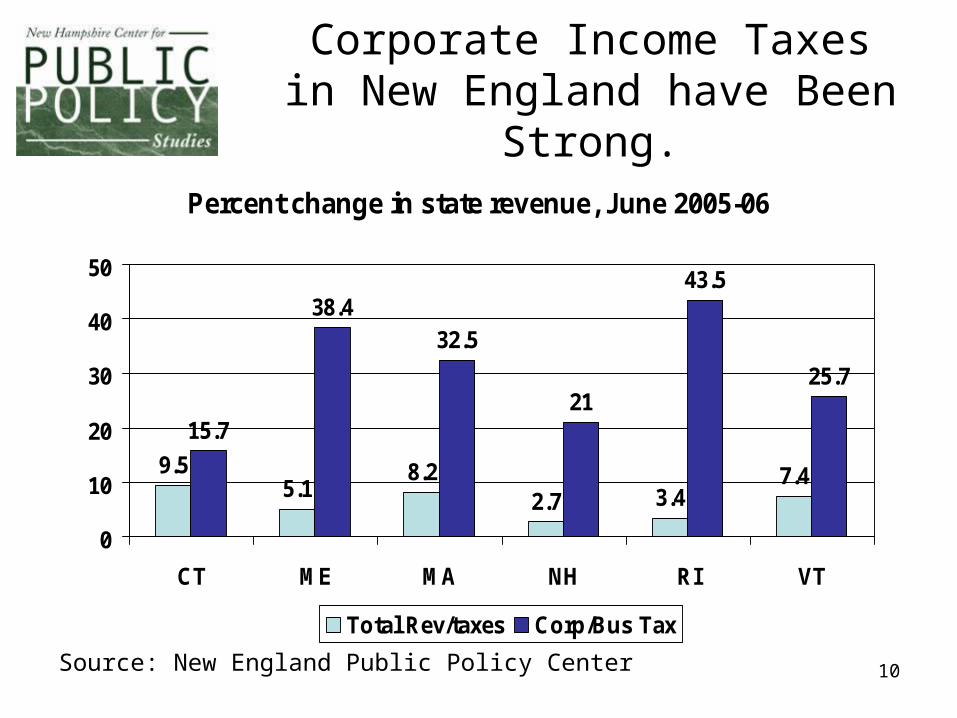
Corporate Income Taxes in New England have Been Strong.
Percent change in state revenue, June 2005-06
9.55.1
8.22.7 3.4
7.4
15.7
38.432.5
21
43.5
25.7
0
10
20
30
40
50
CT ME MA NH RI VT
Total Rev/taxes Corp/Bus Tax
Source: New England Public Policy Center

11
..in part because US Corporate Profits are at Record Levels
US Corporate Profits w/IVA & CCA
0.0
200.0
400.0
600.0
800.0
1000.0
1200.0
1400.0
1600.0
1800.0
Jan-
91
Jan-
92
Jan-
93
Jan-
94
Jan-
95
Jan-
96
Jan-
97
Jan-
98
Jan-
99
Jan-
00
Jan-
01
Jan-
02
Jan-
03
Jan-
04
Jan-
05
Jan-
06
Source: Bureau of Economic Analysis
12
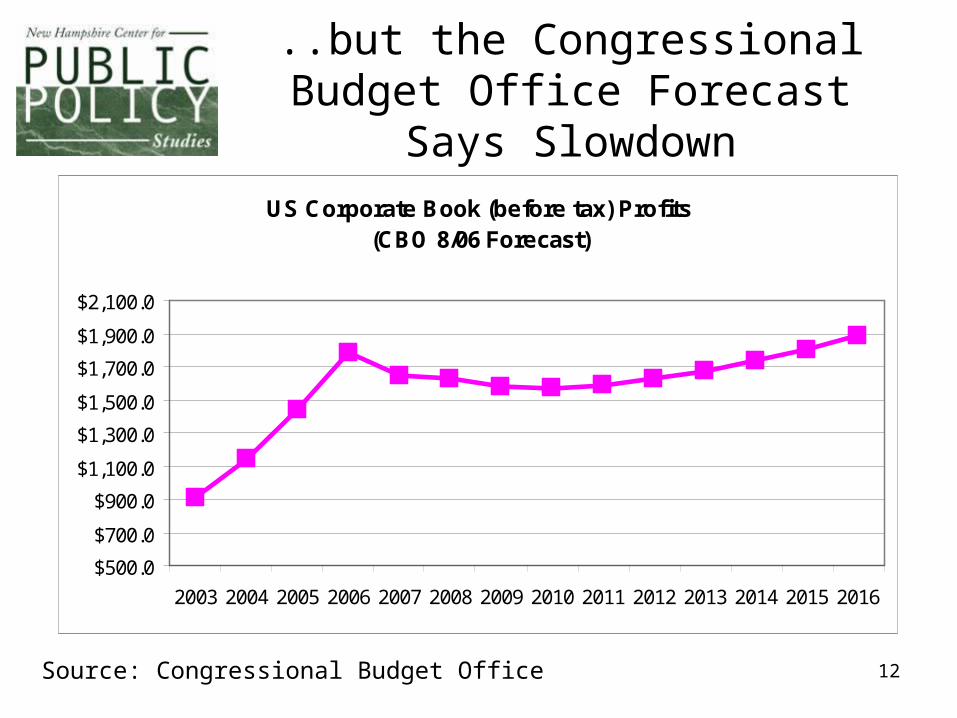
..but the Congressional Budget Office Forecast Says Slowdown
US Corporate Book (before tax) Profits (CBO 8/06 Forecast)
$500.0
$700.0
$900.0
$1,100.0
$1,300.0
$1,500.0
$1,700.0
$1,900.0
$2,100.0
2003 2004 2005 2006 2007 2008 2009 2010 2011 2012 2013 2014 2015 2016
Source: Congressional Budget Office

13
The “Other Income” Portion of NH Personal Income Increasing Since 2003 (Matching Corporate Profits)NH Dividends, Interest, and Rent (PY)
5800
6000
6200
6400
6600
6800
7000
7200
7400
7600
2000 2000 2001 2002 2003 2003 2004 2005 2006
Source: Bureau of Economic Analysis
14
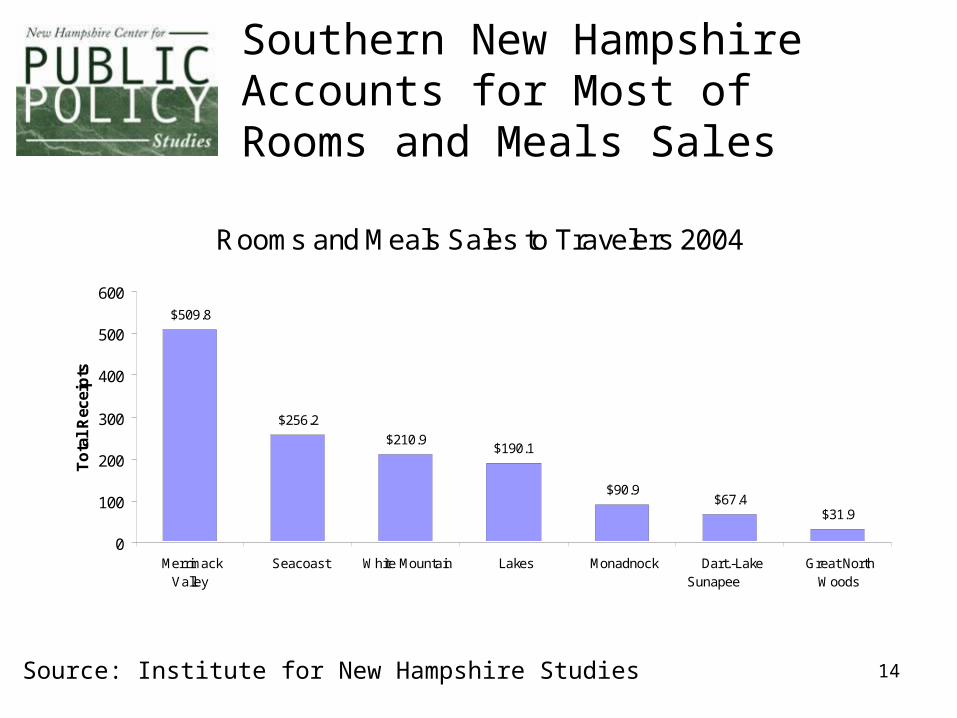
Southern New Hampshire Accounts for Most of Rooms and Meals Sales
Rooms and Meals Sales to Travelers 2004
$509.8
$256.2
$210.9$190.1
$90.9$67.4
$31.9
0
100
200
300
400
500
600
MerrimackValley
Seacoast White Mountain Lakes Monadnock Dart.-LakeSunapee
Great NorthWoods
To
tal
Rec
eip
ts
Source: Institute for New Hampshire Studies
15
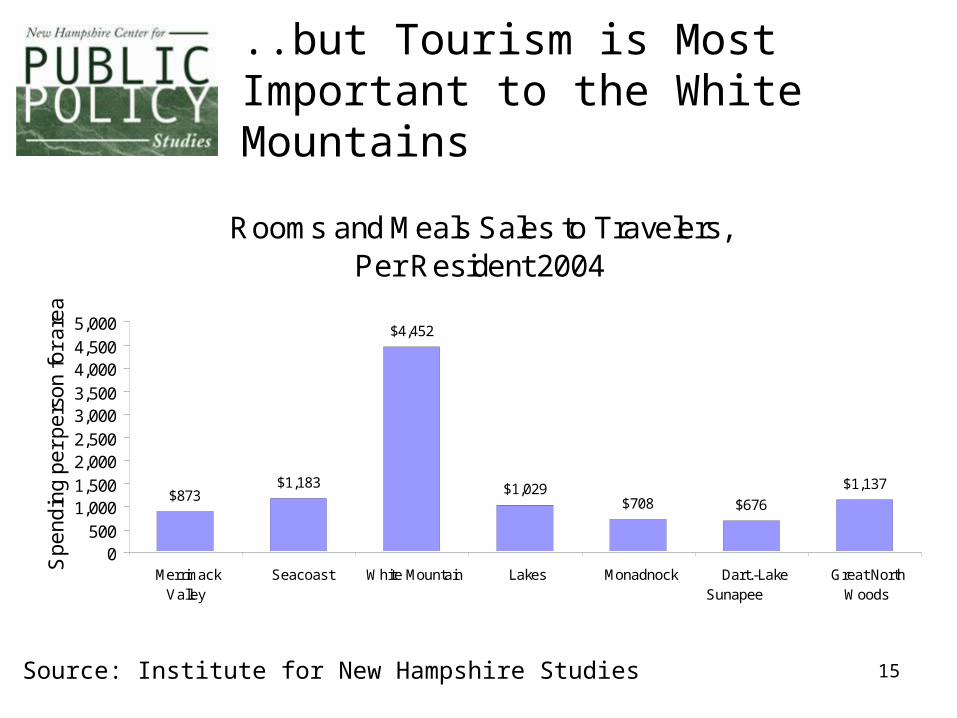
..but Tourism is Most Important to the White Mountains
Rooms and Meals Sales to Travelers, Per Resident 2004
$1,137
$676$708$1,029
$4,452
$1,183$873
0500
1,0001,5002,0002,5003,0003,5004,0004,5005,000
MerrimackValley
Seacoast White Mountain Lakes Monadnock Dart.-LakeSunapee
Great NorthWoods
Sp
en
din
g p
er
pe
rso
n fo
r a
rea
Source: Institute for New Hampshire Studies
16
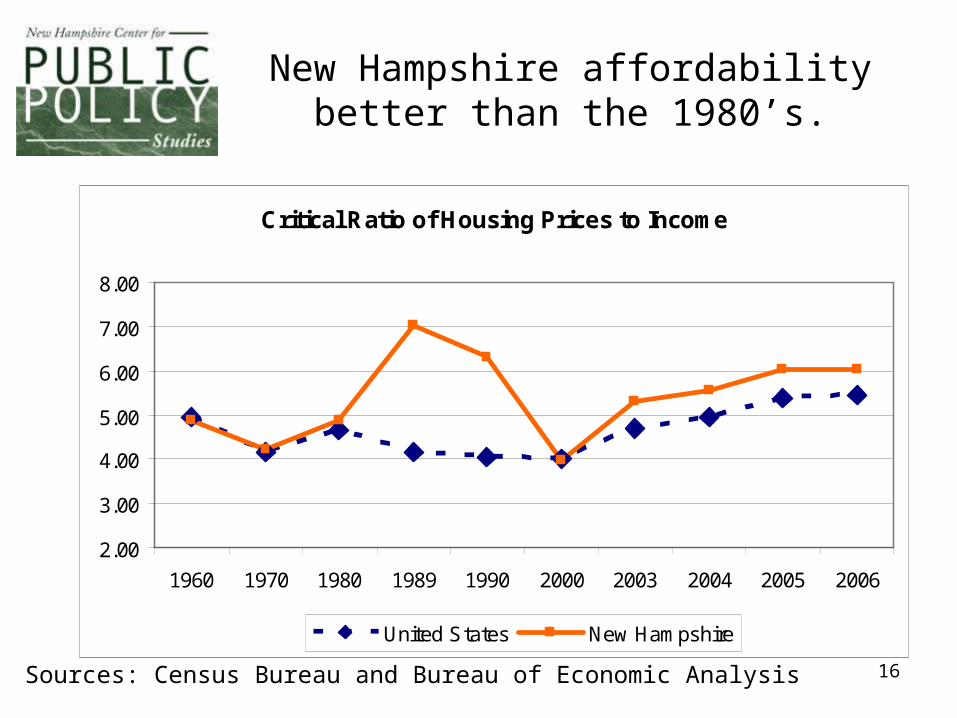
New Hampshire affordability better than the 1980’s.
Critical Ratio of Housing Prices to Income
2.00
3.00
4.00
5.00
6.00
7.00
8.00
1960 1970 1980 1989 1990 2000 2003 2004 2005 2006
United States New Hampshire
Sources: Census Bureau and Bureau of Economic Analysis
17
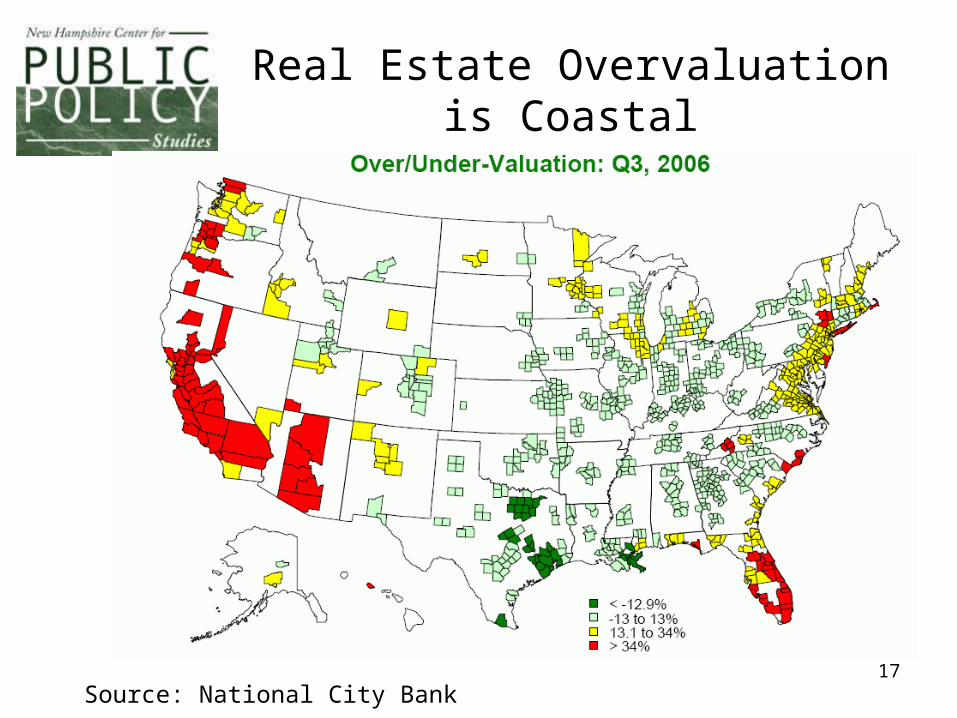
Real Estate Overvaluation is Coastal
Source: National City Bank

18
Northern New England Scores Well
Northern New England Economic Scoreboard for 2006Ranking among the 50 states(Rank of '1' is best; for example 1 is lowest tax rate, highest income, etc.)
ME NH VTCategories Rank Rank RankFavorable State and Local Tax Climate (low burden on income 2004) 43 1 39Standard of Living (by poverty rate) 27 1 3Most Livable State (Morgan Quitno, 2006) 17 1 4Child and Family Well Being (Annie E. Casey Foundation, 2005) 7 1 2Healthiest State (Morgan Quitno, 2006) 4 2 1Safest State (Morgan Quitno, 2006) 2 4 3Education – College Degree or better (2004) 40 4 8Education – High School Degree or better (2004) 27 6 7Per Capita Income (2005) 37 6 25Smartest State (Morgan Quitno, 2005-6) 5 15 1

19
More Information?
• WWW.NHPOLICY.ORG– State Budget– Demographic Trends (What is NH?)– Corrections – Health Care Finance