Embed Size (px)
Citation preview

BENPOSIUM 2016
NGL EXPORTS AND GLOBAL PETROCHEMICAL FEEDSTOCK COMPETITION
Kendall Puig Senior Analyst, NGLs and LPG Platts Analytics, Bentek products
Copyright © 2016 by S&P Global. All rights reserved.

RESTRICTIONS ON USE: YOU MAY USE THE PRICES, INDEXES, ASSESSMENTS AND OTHER RELATED INFORMATION (COLLECTIVELY, “DATA”) IN THIS PRESENTATION ONLY FOR YOUR PERSONAL USE. YOU MAY NOT PUBLISH, REPRODUCE, DISTRIBUTE, RETRANSMIT, RESELL, CREATE ANY DERIVATIVE WORK FROM AND/OR OTHERWISE PROVIDE ACCESS TO DATA OR ANY PORTION THEREOF TO ANY PERSON (EITHER WITHIN OR OUTSIDE YOUR COMPANY INCLUDING, BUT NOT LIMITED TO, VIA OR AS PART OF ANY INTERNAL ELECTRONIC SYSTEM OR INTERNET SITE), FIRM OR ENTITY. DISCLAIMER: PLATTS, ITS AFFILIATES AND ALL OF THEIR THIRD-PARTY LICENSORS DISCLAIM ANY AND ALL REPRESENTATIONS AND WARRANTIES, EXPRESS OR IMPLIED, INCLUDING, BUT NOT LIMITED TO, ANY WARRANTIES OF MERCHANTABILITY OR FITNESS FOR A PARTICULAR PURPOSE OR USE AS TO THE DATA, OR THE RESULTS OBTAINED BY ITS USE OR AS TO THE PERFORMANCE THEREOF. LIMITATION OF LIABILITY: IN NO EVENT WHATSOEVER SHALL PLATTS, ITS AFFILIATES OR THEIR THIRD-PARTY LICENSORS BE LIABLE FOR ANY INDIRECT, SPECIAL, INCIDENTAL, PUNITIVE OR CONSEQUENTIAL DAMAGES, INCLUDING BUT NOT LIMITED TO LOSS OF PROFITS, TRADING LOSSES, OR LOST TIME OR GOODWILL, EVEN IF THEY HAVE BEEN ADVISED OF THE POSSIBILITY OF SUCH DAMAGES, WHETHER IN CONTRACT, TORT, STRICT LIABILITY OR OTHERWISE. THE DATA IS PROVIDED ON AN “AS IS” BASIS AND YOUR USE OF THE DATA IS AT YOUR OWN RISK. COPYRIGHT © 2016 BY PLATTS, MCGRAW HILL FINANCIAL, INC. ALL RIGHTS RESERVED. NO PORTION OF THIS PUBLICATION MAY BE PHOTOCOPIED, REPRODUCED, RETRANSMITTED, PUT INTO A COMPUTER SYSTEM OR OTHERWISE REDISTRIBUTED WITHOUT PRIOR AUTHORIZATION FROM PLATTS. PLATTS IS A TRADEMARK OF MCGRAW HILL FINANCIAL.
Source: Lisa Frank

3 BENPOSIUM 2016
Key Takeaways
• A large spread between gas and liquids prices in the US led to rapid NGL production growth over the past five years. Exports have served as a “relief value” for much of the resulting oversupply.
• Midstream and shipping companies pursued investment projects expecting continued production growth, leading to an infrastructure overbuild.
• US NGLs have found new markets overseas, largely from petrochemical producers looking to move lower on the cost curve, but this demand is not limitless.
• Going forward, the outlook for US NGL exports will vary by product, region, and even individual terminal.
• Gas indexed pricing could make Marcus Hook ethane exports more competitive than USGC Mont Belvieu indexed barrels.
• LPG exports will be flat to declining in the short term and there may be greater competition between terminals for export volumes.

BENPOSIUM 2016
HOW DID WE GET HERE? EXPORTS DRIVEN BY SUPPLY PUSH

5 BENPOSIUM 2016
Large spread between gas and liquids incentivized NGL production growth
5
0
5
10
15
20
25
Jan-10 Jan-11 Jan-12 Jan-13 Jan-14 Jan-15 Jan-16
$/M
MB
tu
WTI Henry Hub Mont Belvieu NGLs Brent
Source: Platts, Bentek
Large “Value Gap” incentivizes: • Increased drilling for
liquids • NGL demand/export
projects

6 BENPOSIUM 2016
A tighter spread makes many US petrochemical and export projects less attractive
6
0
5
10
15
20
25
Jan-10 Jan-11 Jan-12 Jan-13 Jan-14 Jan-15 Jan-16
$/M
MB
tu
WTI Henry Hub Mont Belvieu NGLs Brent
Source: Platts, Bentek
Smaller “Value Gap” leads to: • Decreased drilling activity • Less attractive economics
for NGL demand and export projects

7 BENPOSIUM 2016
Growth of NGL production from gas plants expected to level off
0.0
1.0
2.0
3.0
4.0
5.0
2011 2012 2013 2014 2015 2016 2017 2018 2019 2020 2021
Mb/
d
US NGL Supply from Gas Plants Prior to ethane rejection
Ethane Propane Normal Butane Isobutane Natural Gasoline
Liquids premium leads to 75% growth
in 5 years…
…but is expected to drop to 14% due to
lower prices
Source: Bentek Market Call: North American NGLs 2Q2016

8 BENPOSIUM 2016
Recent NGL oversupply balanced mainly by increased exports and ethane rejection
0%5%10%15%20%25%30%35%40%
0.0
1.0
2.0
3.0
4.0
5.0
6.0
MM
b/d
Domestic Demand vs. Oversupply
Ethane Rejection Exports
Domestic Demand % Oversupply (Exports + Rejection)
Source: Bentek Market Call: North American NGLs 2Q2016

BENPOSIUM 2016
ALLEVIATING CONSTRAINTS

10 BENPOSIUM 2016
Rejection balanced the ethane market, pushed prices to the gas floor
10
0
2
4
6
8
10
12
14
$/M
Mbt
u
Ethane Prices vs. Natural Gas
Henry Hub Natural GasMont Belvieu Ethane
0200400600800
1,0001,2001,4001,6001,8002,000
Mb/
d
Ethane Gas Production From Gas Plants (prior to rejection) vs. Petchem Demand
Gas Plants Petchem

11 BENPOSIUM 2016
Canadian petchem producers are able to take advantage of low-cost US ethane by pipeline
Benposium 2015 11
0
20
40
60
80
100
Mb/
d
US Ethane/Ethylene Exports
Source: Bentek, EIA

12 BENPOSIUM 2016
Enterprise Morgan’s
Point
Waterborne ethane exports require new terminal infrastructure
12
Owner Project Name Location Ethane Capacity (Mb/d)
In-Service Date Region
Sunoco Logistics Marcus Hook Delaware, PA ~40 March 2016 Northeast Enterprise Morgan’s Point Houston Ship Channel, TX 200 3Q2016 US Gulf Coast
Sunoco Marcus Hook
Source: Platts cFlow Source: Platts cFlow

13 BENPOSIUM 2016
Shipping capacity buildout will support waterborne export volumes
13
Ship owner Name/End User Number of ships
Unit capacity (cubic meters)
Est. Unit Capacity (Mb) In-Service Date
Delivered Evergas JS INEOS Insight 27,500 260 2015 Evergas JS INEOS Intrepid 27,500 260 2015 Evergas JS INEOS Ingenuity 27,500 260 2015 Evergas JS INEOS Inspiration 27,500 260 2016 Orderbook Evergas INEOS 4 27,500 260 2015-2016 Evergas INEOS 4 (2) 32,000 301 2018 Reliance/ Mitsui Reliance 6 87,000 835 2016-2017 Navigator Gas Borealis 1 35,000 325 2016 Navigator Gas TBD 3 35,000 301 2016 Ocean Yield SABIC 3 36,000 310 2016 Hartmann Schiffahrts Oriental Energy 5 85,000 802 2017-2018
Source: Bentek, Wartsila, Reliance

14 BENPOSIUM 2016
Propane and butane oversupply pushed US from net importer to a net exporter
14
-800
-600
-400
-200
0
200
400
Mb/
d
US LPG Net Imports
Total Propane Imports Total Normal Butane ImportsTotal Isobutane Imports Total Propane ExportsTotal Normal Butane Exports Total Isobutane ExportsNet Imports
Source: EIA, Bentek

15 BENPOSIUM 2016
Global LPG price spreads have also narrowed as US supply floods market
15
Source: Platts, Bentek
0
50
100
150
200
250
300
Jan-12 Jul-12 Jan-13 Jul-13 Jan-14 Jul-14 Jan-15 Jul-15 Jan-16
Cent
s/ga
l
Global Propane Prices
Mt. Belvieu Northwest Europe Japan FOB Saudi Arabia CP
Large spread between US and Asia/Europe demand markets incentivizes terminal buildout
Lower arbitrage opportunity with tight spread

16 BENPOSIUM 2016
US LPG export volumes no longer constrained by terminal capacity
Source: Bentek Market Call: North American NGLs 2Q2016, NGL Facilities Databank
Company Project Name State Capacity (Mb/d) ISD
Existing LPG Export Terminals 1045 Enterprise Enterprise TX 130 NA Enterprise Enterprise Expansion I TX 120 2013 Enterprise Enterprise Expansion II TX 50 2015 Enterprise Enterprise Expansion III TX 233 2015 Targa Galena Park TX 50 NA Targa Galena Park Expansion I TX 83 2013 Targa Galena Park Expansion II TX 84 2014 Sunoco Logistics Marcus Hook PA 17 NA Sunoco Logistics Marcus Hook Expansion I PA 40 2015 DCP Midstream Chesapeake VA 8 2015 Petrogas Ferndale WA 30 NA Sunoco Logistics Mariner South TX 200 2015
Brownfield Expansions 275 Sunoco Logistics Marcus Hook Expansion II PA 275 2017
Greenfield New Builds 287 AltaGas Prince Rupert BC 40 2018 Occidental Chemical Ingleside TX 100 TBD Phillips 66 Freeport LPG TX 147 2016 Cancelled 112 Waterside Energy WA Storage & Transfer WA 75 TBD Pembina West Coast Terminal OR 37 TBD
6%
91%
3%
Current Waterborne Export Capacity
East CoastUSGCWest Coast
22%
73%
5% 2018 Waterborne Export Capacity
East CoastUSGCWest Coast

17 BENPOSIUM 2016
VLGC spot rates on the decline as more ships enter the market
17
Source: Platts, BW LPG
0
10
20
30
40
50
60
70
80
Cen
ts/g
al
VLGC Spot Freight Rates
VLGC Freight Houston-Northwest EuropeVLGC Freight Houston-JapanVLGC Freight Persian Gulf-Japan
• VLGC capacity was not enough to facilitate increased flows from the US to Asia, leading to high freight rates.
• The current fleet of VLGCs is about 221 vessels with 53 ships on order.
• New ship deliveries have driven down rates. The Panama Canal expansion could lead to further decreases.

18 BENPOSIUM 2016
Propane and butane exports reached a record 962 Mb/d in January 2016 per EIA data
18
-
200
400
600
800
1,000
1,200
Mb/
d
Propane and Butane Exports
Propane Exports Normal Butane Exports Isobutane Exports
2014 Avg: 497 Mb/d
Record high: 962 Mb/d
2012 Avg: 197 Mb/d
Source: EIA, Bentek

BENPOSIUM 2016
FINDING OVERSEAS DEMAND

20 BENPOSIUM 2016
0
100
200
300
400
500
600
700
800
900
1000
0 20,000 40,000 60,000 80,000 100,000 120,000 140,000
$/MT
Cumulative Capacity ('000 MT)
Global Ethylene Cost Curve
Saudi Ethane
Iran Ethane US Ethane
US E/P Mix
WE Naphtha
SE Asia Naphtha NE Asia Naphtha
ME Ethane
CTO/MTO
Ethylene production cost curve highlights US advantage from shale gas ethane
Source: Platts Analytics

21 BENPOSIUM 2016
US cracker feedslate lighter; Europe, Asia remain naphtha dominated
0%
50%
100%
2005 2006 2007 2008 2009 2010 2011 2012 2013 2014 2015
US Steam Cracker Feedslate
Ethane Propane Butane Naphtha
0%
50%
100%
2005 2006 2007 2008 2009 2010 2011 2012 2013 2014 2015
European Steam Cracker Feedslate
Ethane Propane Butane Naphtha GasoilSource: Jacobs Consultancy’s Hodson Report

22 BENPOSIUM 2016
European steam crackers were the first to receive US waterborne ethane shipments
22
Company Location Country
Ethylene Capacity
(MMlbs/yr) Max Ethane
Demand (Mb/d)*
INEOS Rafnes Norway 1,213 32
INEOS Grangemouth UK 1,610 42
ExxonMobil Mossmorran UK 1,830 48
Borealis Stenungsund Sweden 1,378 36
SABIC Wilton UK 1,900 50
Source: Bentek Market Call: North American NGLs, 2Q2016 *Assumes a 95% utilization rate and 100% ethane feedslate

23 BENPOSIUM 2016
Reliance and Braskem have also announced contracts to import US ethane
Benposium 2015 23
Reliance contracted 72.5 Mb/d from Enterprise for 3
crackers
Ethane Propane Naphtha
Ethanol
Braskem purchased ethane from Enterprise
for Camcari cracker

24 BENPOSIUM 2016
Asia is now largest destination for US LPG exports
24
0100200300400500600700800900
1,000
Mb/
d
US LPG Exports to Region
North America South America Central America CaribbeanEurope Asia Africa
Source: EIA data through March 2016 , Bentek. Note: North America includes Canada and Mexico
16%
11%
5% 7%
14%
47%
0%
Export % to Region 2016 YTD

25 BENPOSIUM 2016
US LPG Exports to Asia and Europe Growing
25
0
20
40
60
80
100
Mb/d Western Europe
Netherlands France UK Portugal Spain
- 50
100 150 200 250 300 350 400 450Mb/d Asia
China Japan South Korea Singapore
0
50
100
150
200
250
300
2000 2002 2004 2006 2008 2010 2012 2014 1/1/2016YTD
Mb/d Latin America
Venezuela Panama Honduras Dominican Republic Chile Brazil Mexico
Source: EIA data through March 2016 , Bentek.

26 BENPOSIUM 2016
China is now the largest destination for US LPG, mainly due to new PDH units
Chinese PDH units
Plant Propylene Output (mt/yr)
Est. Propane Demand (Mb/d)
ISD
Tianjin Bohai Chemical 600,000 23.2 Oct 2013
Zhejiang Ningbo Haiyue 600,000 23.2 July 2014
Zhejiang Satellite Petchem 450,000 17.5 Aug 2014
Shaoxing Sanyuan Petchem 450,000 17.5 Sept 2014
Ningbo Oriental Energy I 660,000 29.1 May 2015
Yantai Wanhua 750,000 25.6 Aug 2015
Zhongjing Petrochemical 800,000 35.3 2016
Ningbo Oriental Energy II 660,000 29.1 2016
Hebei Haiwei Group 500,000 22.0 2016
Fujian Meide Petrochemical 660,000 29.1 2017
TOTAL 6,130,000 251.6
Source: Bentek
The US exported 111 Mb/d of LPG to China in 2015. This has increased to 168 Mb/d in 2016 YTD.

27 BENPOSIUM 2016
0200400600800
10001200140016001800
$/M
T
China Propane - Propylene Margin
Propane - Propylene Margin Propane China Propylene China
Development of additional Chinese PDH challenged by lower margins
Source: Platts, Bentek
Low margins decrease utilization of existing
units

28 BENPOSIUM 2016
Asian and European crackers take more LPG when it is at a discount to naphtha
28
Source: Bentek
-300
-200
-100
0
100
200
300
200
300
400
500
600
700
800
Jan-15 May-15 Sep-15 Jan-16 May-16
$/m
t
$/m
t
Japan C3 vs Naphtha
DifferencePlatts Propane Refrigerated CFR Japan 30-45 daysPlatts Naphtha MOPJ strip 45-75 Days
-300
-200
-100
0
100
200
300
0
100
200
300
400
500
600
700
800
$/m
t
$/m
t
Northwest Europe C3 to Naphtha Spread
Difference
Platts Propane CIF NWE 7kt+
Platts Naphtha CIF NWE Cargo
Source: Platts, Bentek

BENPOSIUM 2016
WHAT HAPPENS NEXT?

30 BENPOSIUM 2016
Ethane exports will continue to move, but not all terminals are created equal
Enterprise Morgan’s Point Mont Belvieu index ethane
contracts
Sunoco Marcus Hook Natural gas or naphtha-index ethane contracts
- 50
100 150 200 250 300 350
Mb/
d
US Ethane Exports
Pipeline to Canada Marcus HookEnterprise
Source: Bentek Market Call: North American NGLs, 2Q2016
- 2 4 6 8
10 12 14
$/M
MB
tu
Ethane vs Gas Price Forecast
Henry Hub Mont Belvieu Ethane
31 BENPOSIUM 2016
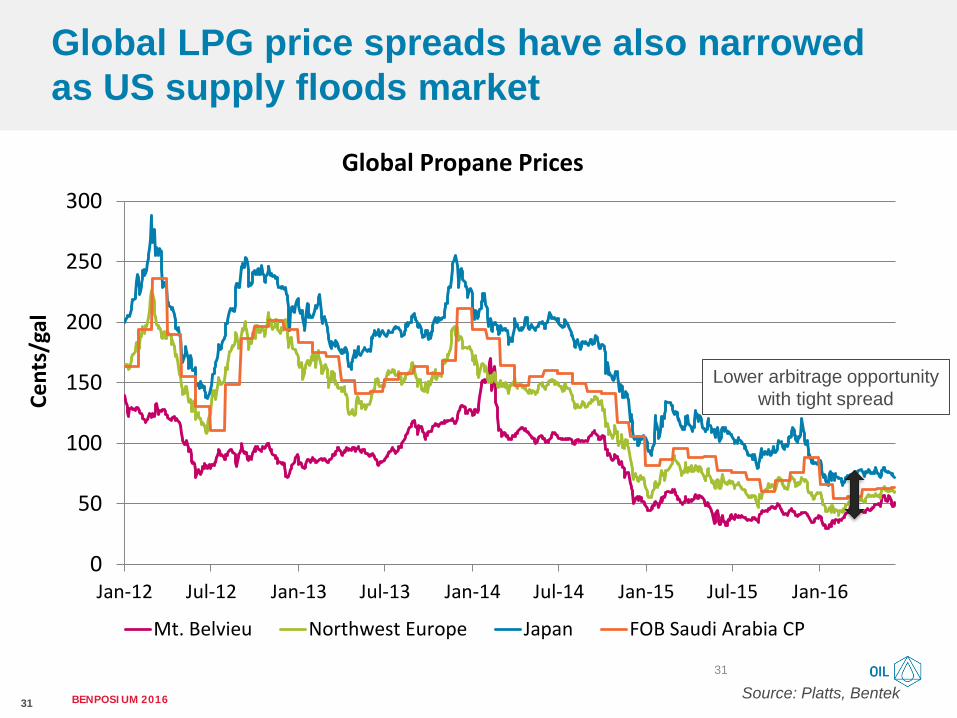
Global LPG price spreads have also narrowed as US supply floods market
31
Source: Platts, Bentek
0
50
100
150
200
250
300
Jan-12 Jul-12 Jan-13 Jul-13 Jan-14 Jul-14 Jan-15 Jul-15 Jan-16
Cent
s/ga
l
Global Propane Prices
Mt. Belvieu Northwest Europe Japan FOB Saudi Arabia CP
Lower arbitrage opportunity with tight spread

32 BENPOSIUM 2016
Record LPG exports are not sustainable as stocks are lower and global price spreads have narrowed
32
Source: Platts, Bentek
Source: EIA weekly estimates
0
20
40
60
80
100
120
MM
bbl
US Propane/Propylene Stocks
5-year range 5-year average2015 2016
0
200
400
600
800
1000
1200
Mb/
d
US LPG Exports
CapacityBentek's Waterborne LPG ModelEIA
Stocks drawn 40% MB prices rose 22%

33 BENPOSIUM 2016
-40
-20
0
20
40
60
80
100
120
Oct-13 Apr-14 Oct-14 Apr-15 Oct-15 Apr-16
Cen
ts/g
al
USGC Propane Export Value
Houston - NW Europe Houston - NE Asia
Relative value of terminal capacity has fallen
Export Value = Destination Price - Freight - Mont Belvieu
Source: Platts, Bentek
Constrained terminal capacity
High freight Fewer constraints, lower spreads

34 BENPOSIUM 2016
High terminal and cancellation fees distorting export economics in the short term
-50
0
50
100
150
200
250
cent
s/ga
l
Propane Firm Contract Economics
Difference Arab Gulf + Freight + US Cancellation Mont Belvieu + Fee + Frieght
Assumes 13 cents/gal terminal
fee and 7 cents/gal cancellation fee
Source: Platts, Bentek
Contract renegotiations?

35 BENPOSIUM 2016
LPG terminal utilization rates to decline from previous highs
Source: Bentek Market Call: North American NGLs, NGL Facilities Databank
0
200
400
600
800
1,000
1,200
1,400
1,600
1,800
Mb/
d
LPG Exports vs Terminal Capacity
LPG Exports Forecast - 2Q2015
LPG Export Forecast - 2Q2016
Total US LPG Export Capacity

36 BENPOSIUM 2016
USGC will face increased competition from Northeast when Mariner East 2 comes online
36
West Coast
Gulf Coast
Northeast
Source: Bentek Market Call: North American NGLs 2Q2016
-
200
400
600
800
1,000
2015 2016 2017 2018 2019 2020 2021
Mb/
d
LPG Exports by Region
PADD 3 PADD 1 PADD 5

37 BENPOSIUM 2016
A lower supply curve and domestic feedstock competition has changed the exports story
37
0200400600800
1,0001,2001,4001,6001,8002,000
2011 2012 2013 2014 2015 2016 2017 2018 2019 2020 2021
Mb/
d
Total US NGL Exports Forecast Comparison
2Q2015 2Q2016
Source: Bentek Market Call: North American NGLs

38 BENPOSIUM 2016
Key Takeaways
• A large spread between gas and liquids prices in the US led to rapid NGL production growth over the past five years. Exports have served as a “relief value” for much of the resulting oversupply.
• Midstream and shipping companies pursued investment projects expecting continued production growth, leading to an infrastructure overbuild.
• US NGLs have found new markets overseas, largely from petrochemical producers looking to move lower on the cost curve, but this demand is not limitless.
• Going forward, the outlook for US NGL exports will vary by product, region, and even individual terminal.
• Gas indexed pricing could make Marcus Hook ethane exports more competitive than USGC Mont Belvieu indexed barrels.
• LPG exports will be flat to declining in the short term and there may be greater competition between terminals for export volumes.

BENPOSIUM 2016
THANK YOU!
Kendall Puig Senior Analyst, NGLs and LPG T: 720.264.6709 [email protected]