Embed Size (px)
Citation preview

NextGen Sequencing: Experimental Planning and Data Analysis
Nadia Atallah

A Next Generation Sequencing (NGS) Refresher
• Became commercially available in 2005
• Construction of a sequencing library clonal amplification to generate sequencing features
• High degree of parallelism
• Uses micro and nanotechnologies to reduce size of sample components• Reduces reagent costs
• Enables massively parallel sequencing reactions
• Revolutionary: has brought high speed to genome sequencing• Changed the way we do research, medicine
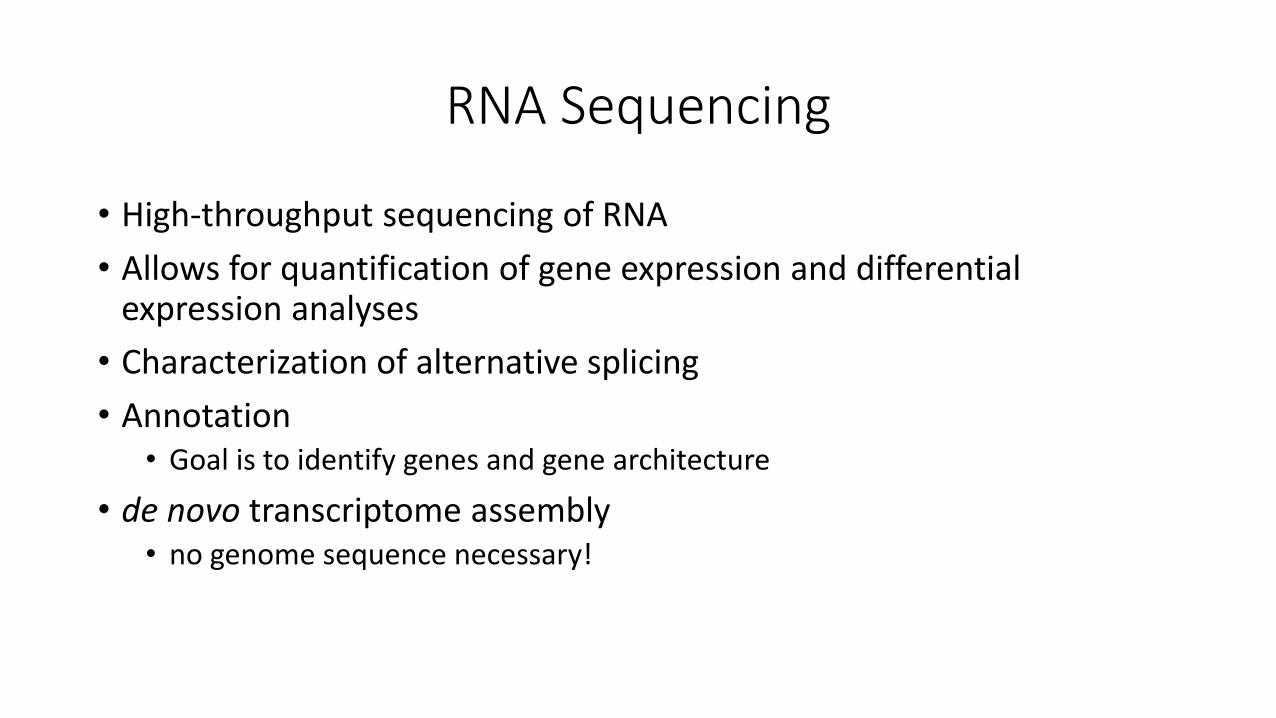
RNA Sequencing
• High-throughput sequencing of RNA
• Allows for quantification of gene expression and differential expression analyses
• Characterization of alternative splicing
• Annotation• Goal is to identify genes and gene architecture
• de novo transcriptome assembly• no genome sequence necessary!

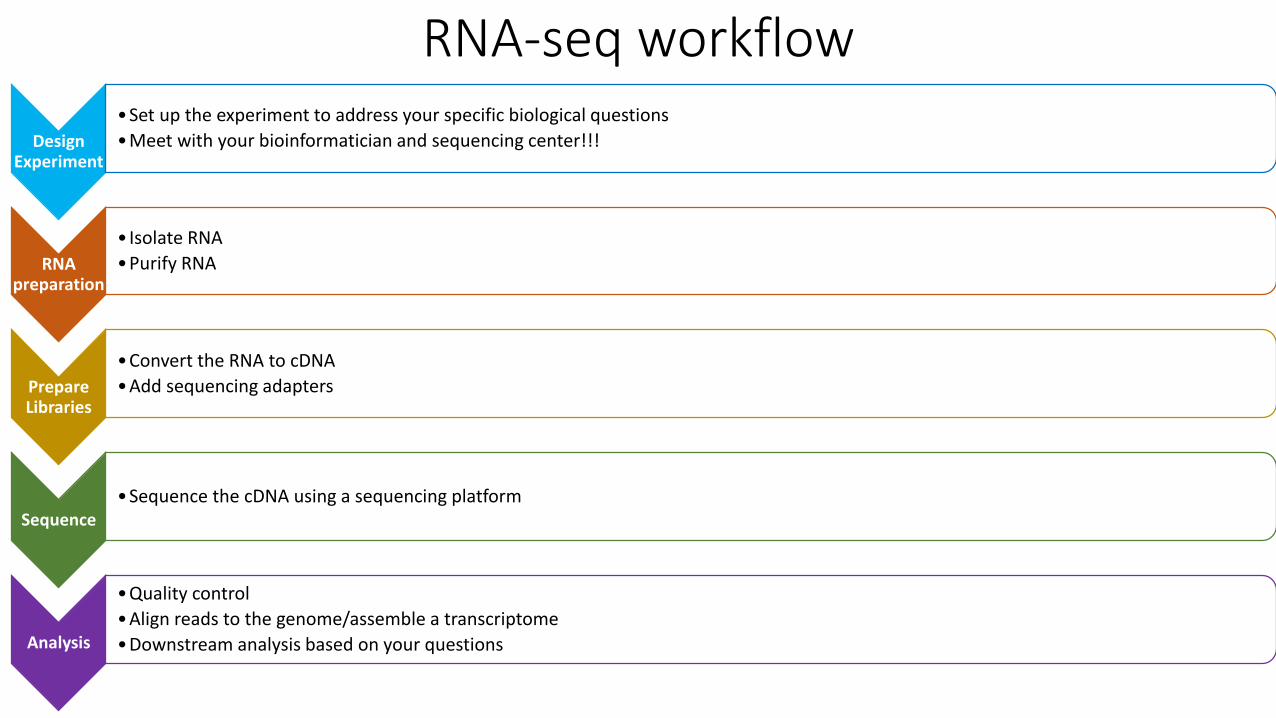
RNA-seq workflow
Design Experiment
•Set up the experiment to address your specific biological questions
•Meet with your bioinformatician and sequencing center!
RNA preparation
• Isolate RNA
•Purify RNA
Prepare Libraries
•Convert the RNA to cDNA
•Add sequencing adapters
Sequence•Sequence the cDNA using a sequencing platform
Analysis
•Quality control
•Align reads to the genome/assemble a transcriptome
•Downstream analysis based on your questions
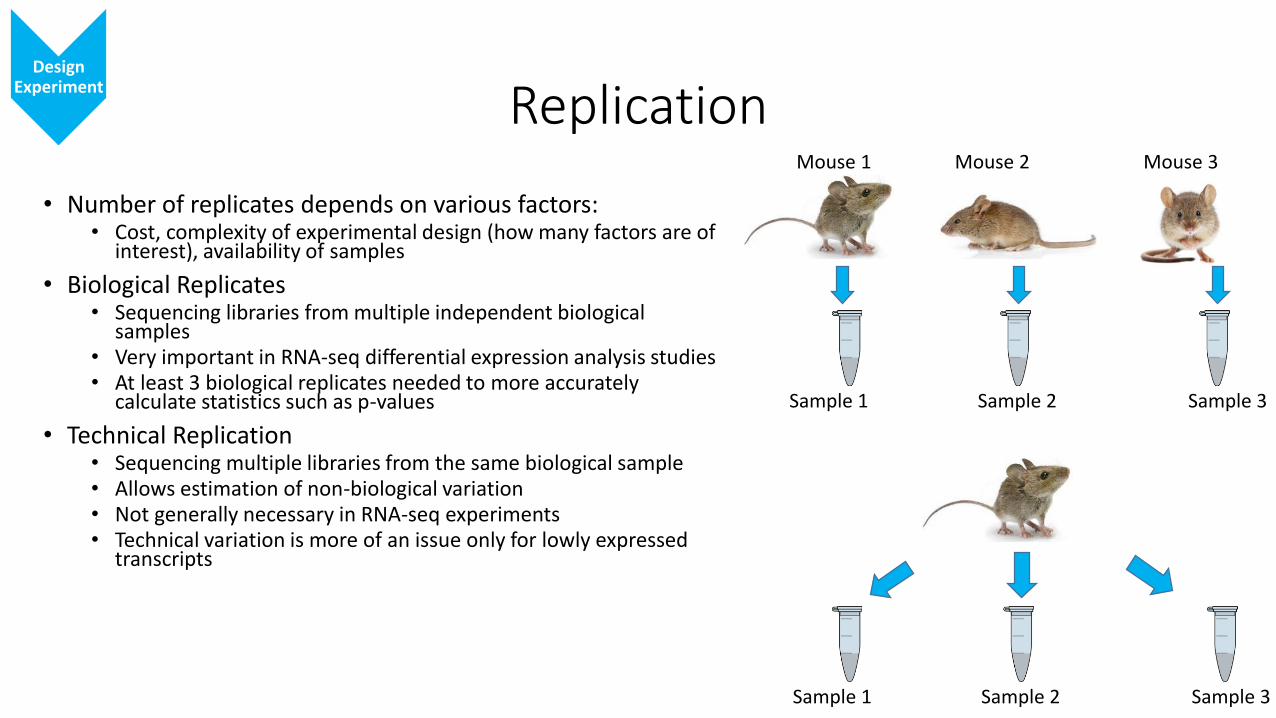
Replication
• Number of replicates depends on various factors:• Cost, complexity of experimental design (how many factors are of
interest), availability of samples
• Biological Replicates• Sequencing libraries from multiple independent biological
samples• Very important in RNA-seq differential expression analysis studies• At least 3 biological replicates needed to more accurately
calculate statistics such as p-values
• Technical Replication• Sequencing multiple libraries from the same biological sample• Allows estimation of non-biological variation • Not generally necessary in RNA-seq experiments• Technical variation is more of an issue only for lowly expressed
transcripts
Design Experiment
Mouse 1 Mouse 2 Mouse 3
Sample 1 Sample 2 Sample 3
Sample 1 Sample 2 Sample 3
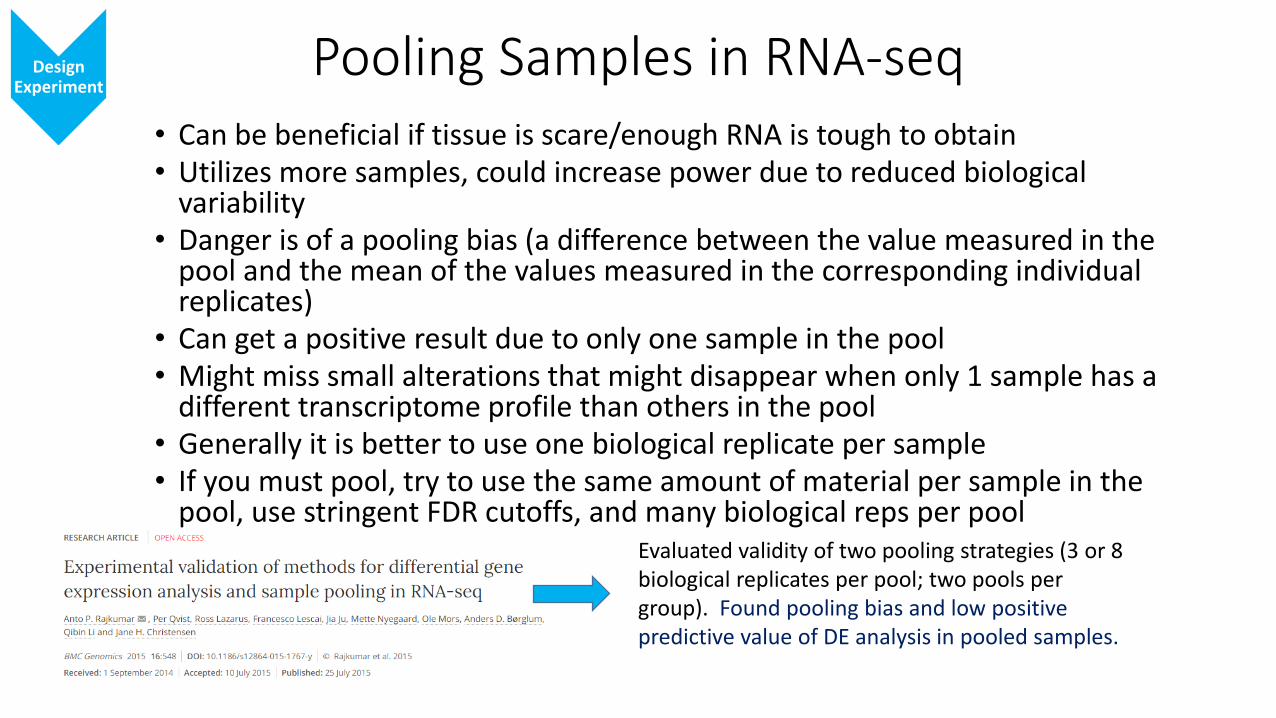
Pooling Samples in RNA-seq• Can be beneficial if tissue is scare/enough RNA is tough to obtain• Utilizes more samples, could increase power due to reduced biological
variability• Danger is of a pooling bias (a difference between the value measured in the
pool and the mean of the values measured in the corresponding individual replicates)
• Can get a positive result due to only one sample in the pool• Might miss small alterations that might disappear when only 1 sample has a
different transcriptome profile than others in the pool• Generally it is better to use one biological replicate per sample• If you must pool, try to use the same amount of material per sample in the
pool, use stringent FDR cutoffs, and many biological reps per pool
Design Experiment
Evaluated validity of two pooling strategies (3 or 8 biological replicates per pool; two pools per group). Found pooling bias and low positive predictive value of DE analysis in pooled samples.
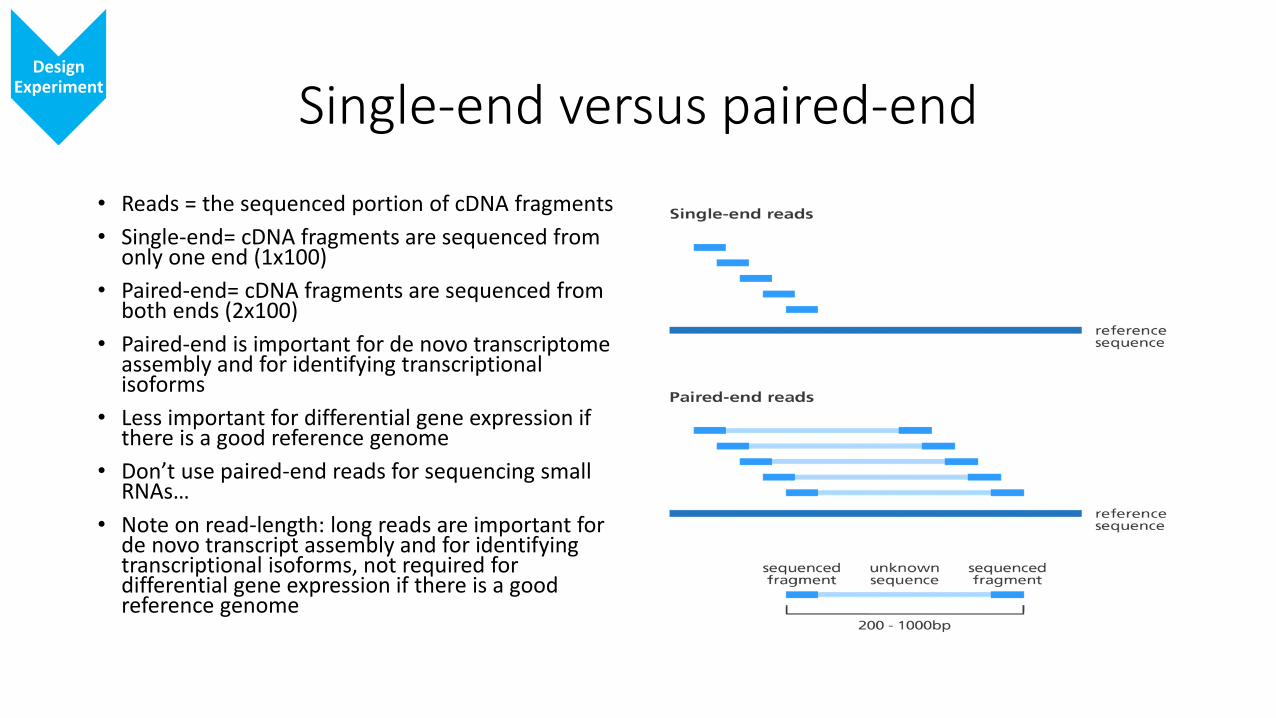
Single-end versus paired-end
• Reads = the sequenced portion of cDNA fragments
• Single-end= cDNA fragments are sequenced from only one end (1x100)
• Paired-end= cDNA fragments are sequenced from both ends (2x100)
• Paired-end is important for de novo transcriptome assembly and for identifying transcriptional isoforms
• Less important for differential gene expression if there is a good reference genome
• Don’t use paired-end reads for sequencing small RNAs…
• Note on read-length: long reads are important for de novo transcript assembly and for identifying transcriptional isoforms, not required for differential gene expression if there is a good reference genome
Design Experiment

Sequencing Depth – How deep should I sequence?
• Depth= (read length)(number of reads) / (haploid genome length)
• Each library prep method suffers from specific biases and results in uneven coverage of individual transcripts in order to get reads spanning the entire transcript more reads (deeper sequencing) is required
• Depends on experimental objectives• Differential gene expression? Get enough
counts of each transcript such that accurate statistical inferences can be made
• De novo transcriptome assembly? Maximize coverage of rare transcripts and transcriptional isoforms
• Annotation?• Alternative splicing analysis?
Design Experiment
1) Liu Y., et al., RNA-seq differential expression studies: more sequence or more replication? Bioinformatics 30(3):301-304 (2014) 2) Liu Y., et al., Evaluating the impact of sequencing depth on transcriptome profiling in human adipose. Plos One 8(6):e66883 (2013) 3) Bentley, D. R. et al. Accurate whole human genome sequencing using reversible terminator chemistry. Nature 456, 53–59 (2008) 4) Rozowsky, J.et al., PeakSeq enables systematic scoring of ChIP-seq experiments relative to controls. Nature Biotech. 27, 65-75 (2009).
Mill
ion
Rea
ds
Strand Specificity
• Strand-specific= you know whether the read originated from the + or – strand
• Important for de novo transcript assembly
• Important for identifying true anti-sense transcripts
• Less important for differential gene expression if there is a reference genome
• Knowledge of strandedness may help assign reads to genes adjacent to one another but on opposite strands
Design Experiment
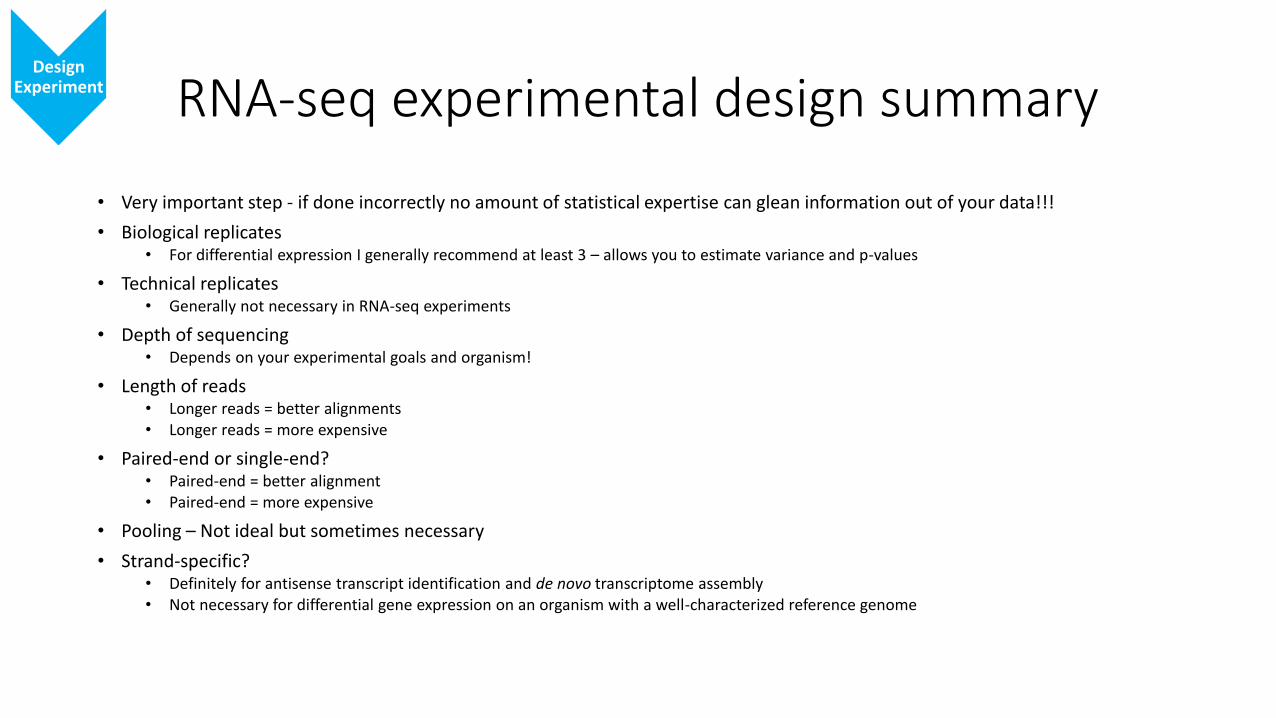
RNA-seq experimental design summary
• Very important step - if done incorrectly no amount of statistical expertise can glean information out of your data!!!
• Biological replicates• For differential expression I generally recommend at least 3 – allows you to estimate variance and p-values
• Technical replicates• Generally not necessary in RNA-seq experiments
• Depth of sequencing• Depends on your experimental goals and organism!
• Length of reads• Longer reads = better alignments • Longer reads = more expensive
• Paired-end or single-end? • Paired-end = better alignment• Paired-end = more expensive
• Pooling – Not ideal but sometimes necessary
• Strand-specific?• Definitely for antisense transcript identification and de novo transcriptome assembly• Not necessary for differential gene expression on an organism with a well-characterized reference genome
Design Experiment
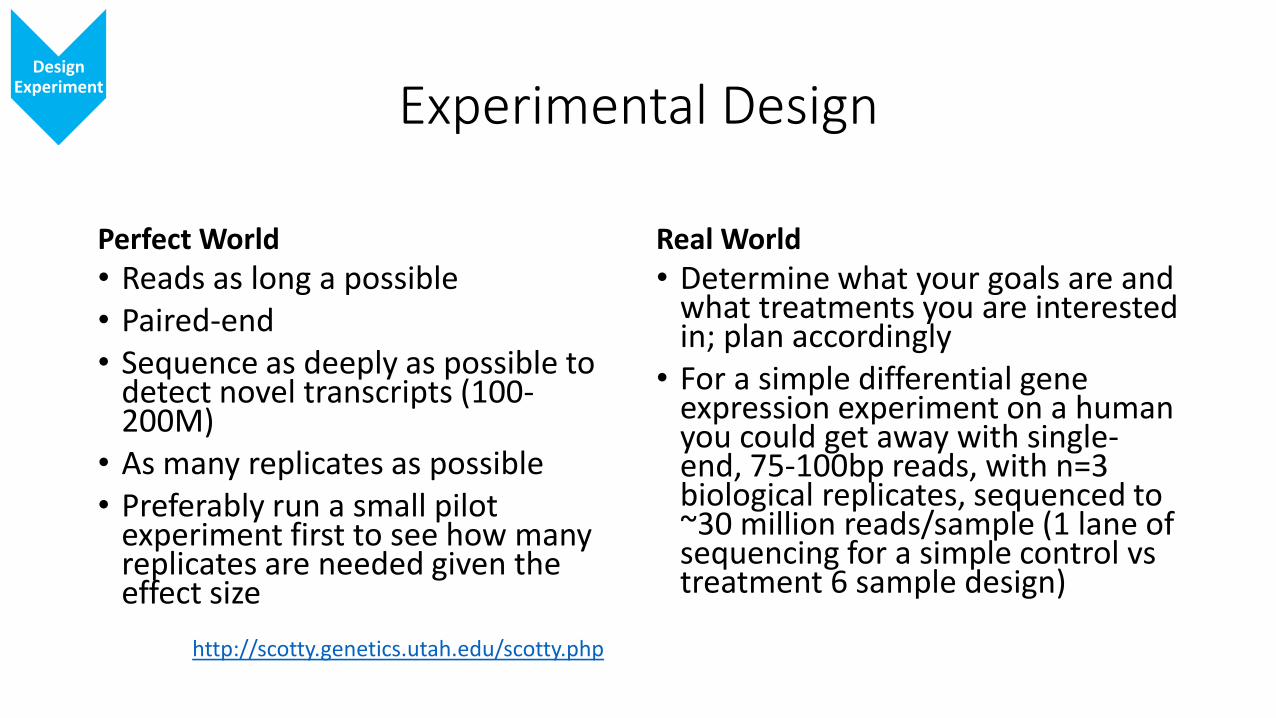
Experimental Design
Perfect World• Reads as long a possible• Paired-end• Sequence as deeply as possible to
detect novel transcripts (100-200M)
• As many replicates as possible• Preferably run a small pilot
experiment first to see how many replicates are needed given the effect size
Real World• Determine what your goals are and
what treatments you are interested in; plan accordingly
• For a simple differential gene expression experiment on a human you could get away with single-end, 75-100bp reads, with n=3 biological replicates, sequenced to ~30 million reads/sample (1 lane of sequencing for a simple control vs treatment 6 sample design)
Design Experiment
http://scotty.genetics.utah.edu/scotty.php
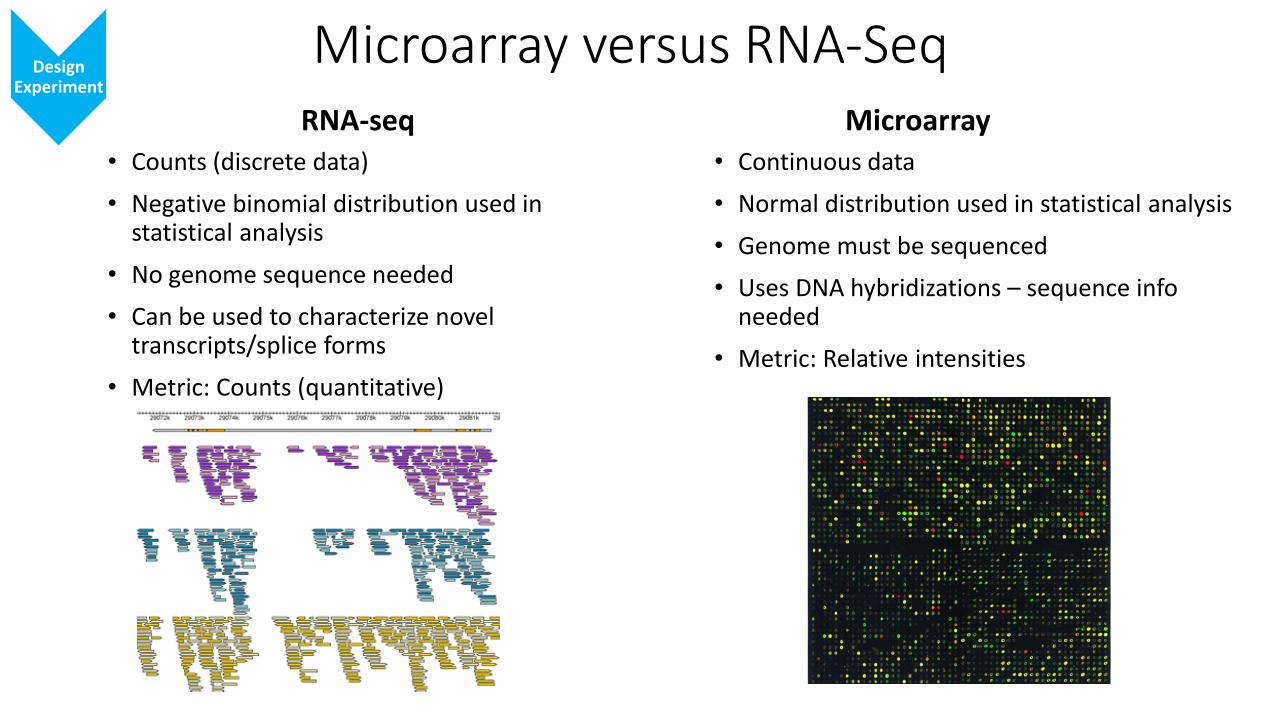
Microarray versus RNA-SeqRNA-seq
• Counts (discrete data)
• Negative binomial distribution used in statistical analysis
• No genome sequence needed
• Can be used to characterize novel transcripts/splice forms
• Metric: Counts (quantitative)
Microarray• Continuous data
• Normal distribution used in statistical analysis
• Genome must be sequenced
• Uses DNA hybridizations – sequence info needed
• Metric: Relative intensities
Design Experiment
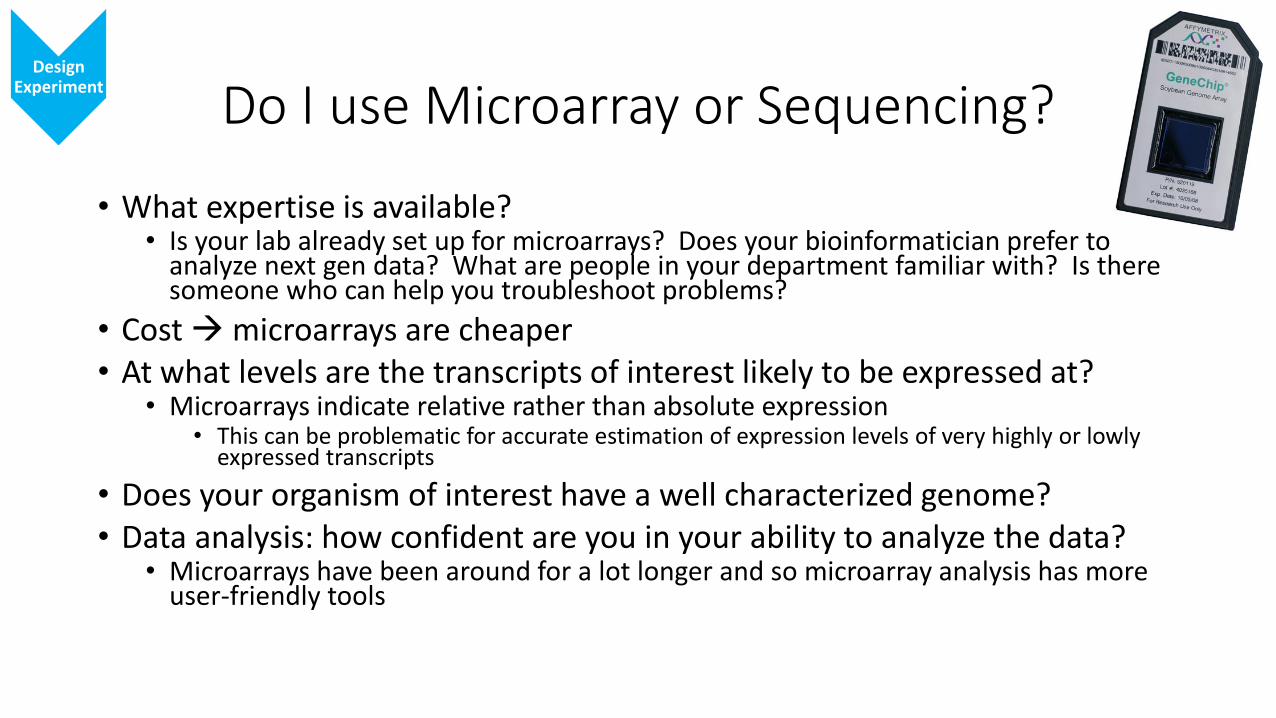
Do I use Microarray or Sequencing?
• What expertise is available? • Is your lab already set up for microarrays? Does your bioinformatician prefer to
analyze next gen data? What are people in your department familiar with? Is there someone who can help you troubleshoot problems?
• Cost microarrays are cheaper• At what levels are the transcripts of interest likely to be expressed at?
• Microarrays indicate relative rather than absolute expression• This can be problematic for accurate estimation of expression levels of very highly or lowly
expressed transcripts
• Does your organism of interest have a well characterized genome?• Data analysis: how confident are you in your ability to analyze the data?
• Microarrays have been around for a lot longer and so microarray analysis has more user-friendly tools
Design Experiment

RNA-seq workflow
Design Experiment
•Set up the experiment to address your specific biological questions
•Meet with your bioinformatician and sequencing center!!!
RNA preparation
• Isolate RNA
•Purify RNA
Prepare Libraries
•Convert the RNA to cDNA
•Add sequencing adapters
Sequence•Sequence the cDNA using a sequencing platform
Analysis
•Quality control
•Align reads to the genome/assemble a transcriptome
•Downstream analysis based on your questions

RNA extraction, purification, and quality assessment
RNA preparation
• RIN= RNA integrity number• Generally, RIN scores >8 are good, depending on the organism• Important to use high RIN score samples, particularly when sequencing small RNAs to be sure you aren’t
simply selecting degraded RNAs
18S28S
RNA-seq workflow
Design Experiment
•Set up the experiment to address your specific biological questions
•Meet with your bioinformatician and sequencing center!!!
RNA preparation
• Isolate RNA
•Purify RNA
Prepare Libraries
•Convert the RNA to cDNA
•Add sequencing adapters
Sequence•Sequence the cDNA using a sequencing platform
Analysis
•Quality control
•Align reads to the genome/assemble a transcriptome
•Downstream analysis based on your questions
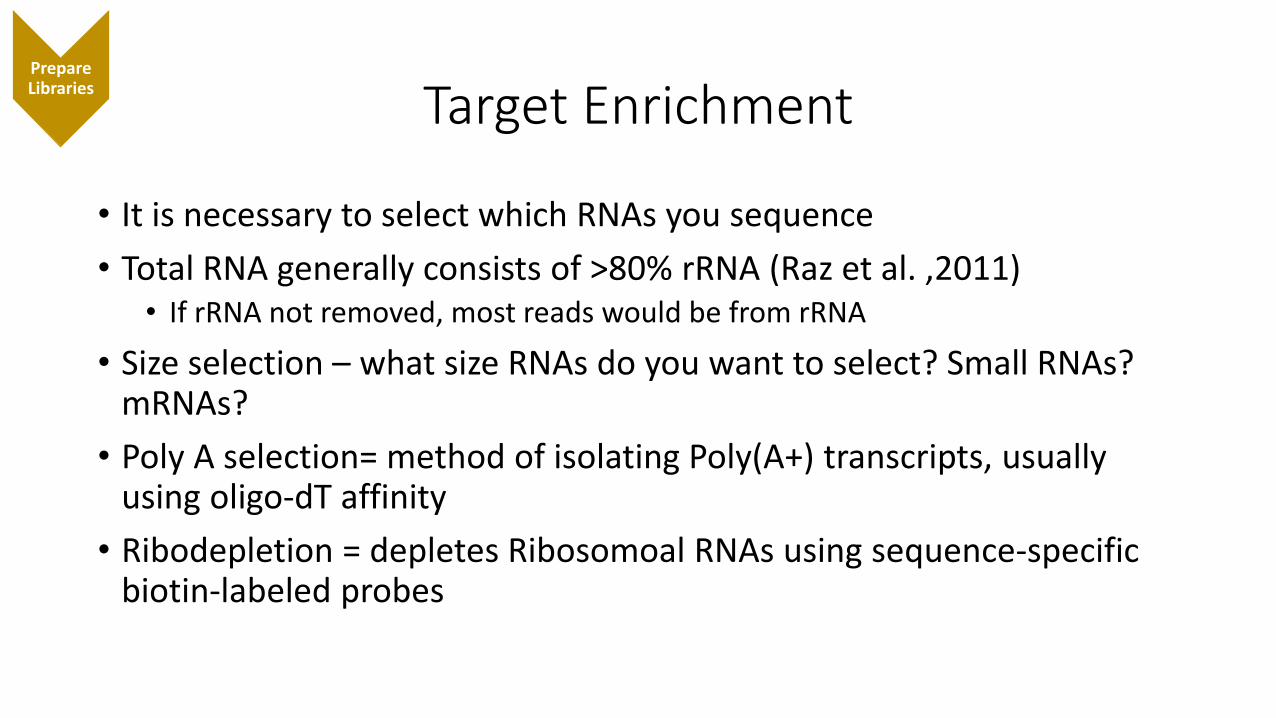
Target Enrichment
• It is necessary to select which RNAs you sequence
• Total RNA generally consists of >80% rRNA (Raz et al. ,2011)• If rRNA not removed, most reads would be from rRNA
• Size selection – what size RNAs do you want to select? Small RNAs? mRNAs?
• Poly A selection= method of isolating Poly(A+) transcripts, usually using oligo-dT affinity
• Ribodepletion = depletes Ribosomoal RNAs using sequence-specific biotin-labeled probes
Prepare Libraries
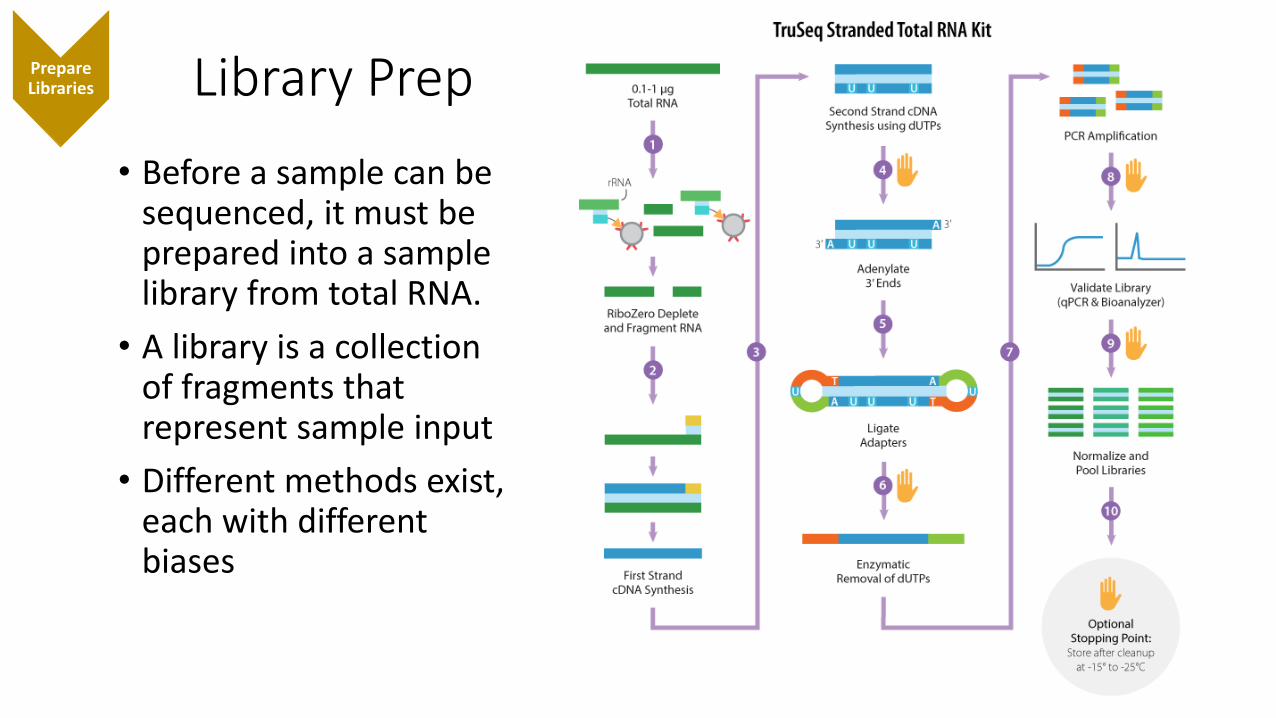
Library PrepPrepare Libraries
• Before a sample can be sequenced, it must be prepared into a sample library from total RNA.
• A library is a collection of fragments that represent sample input
• Different methods exist, each with different biases

RNA-seq workflow
Design Experiment
•Set up the experiment to address your specific biological questions
•Meet with your bioinformatician and sequencing center!!!
RNA preparation
• Isolate RNA
•Purify RNA
Prepare Libraries
•Convert the RNA to cDNA
•Add sequencing adapters
Sequence•Sequence the cDNA using a sequencing platform
Analysis
•Quality control
•Align reads to the genome/assemble a transcriptome
•Downstream analysis based on your questions
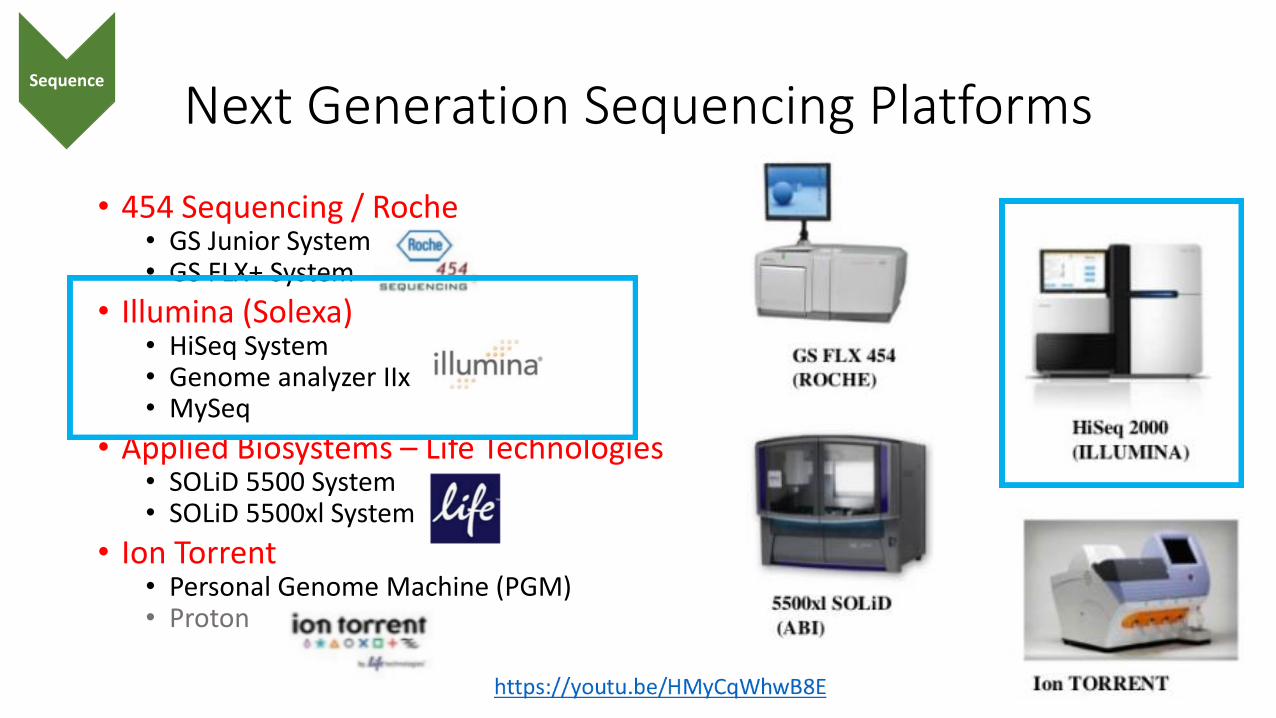
Next Generation Sequencing Platforms
• 454 Sequencing / Roche• GS Junior System• GS FLX+ System
• Illumina (Solexa)• HiSeq System• Genome analyzer IIx• MySeq
• Applied Biosystems – Life Technologies• SOLiD 5500 System• SOLiD 5500xl System
• Ion Torrent• Personal Genome Machine (PGM)• Proton
Sequence

RNA-seq workflow
Design Experiment
•Set up the experiment to address your specific biological questions
•Meet with your bioinformatician and sequencing center!!!
RNA preparation
• Isolate RNA
•Purify RNA
Prepare Libraries
•Convert the RNA to cDNA
•Add sequencing adapters
Sequence•Sequence the cDNA using a sequencing platform
Analysis
•Quality control
•Align reads to the genome/assemble a transcriptome
•Downstream analysis based on your questions
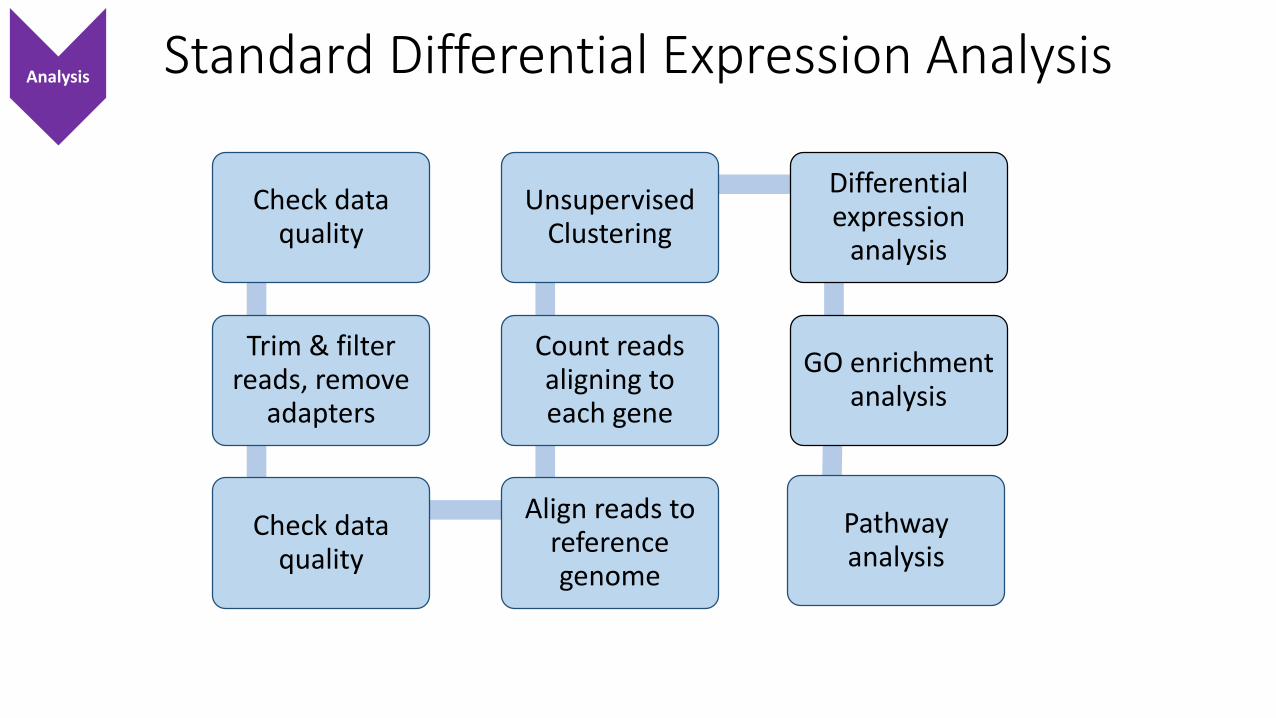
Standard Differential Expression Analysis
Check data quality
Trim & filter reads, remove
adapters
Check data quality
Align reads to reference genome
Count reads aligning to each gene
Unsupervised Clustering
Differential expression
analysis
GO enrichment analysis
Pathway analysis
Analysis

File formats - FASTQ files – what we get back from the sequencing center
• This is usually the format your data is in when sequencing is complete
• Text files• Contains both sequence and base quality information
• Phred score = Q = -10log10P• P is base-calling error probability
• Integer scores converted to ASCII characters
• Example:
@ILLUMINA:188:C03MYACXX:4:1101:3001:1999 1:N:0:CGATGTTACTTGTTACAGGCAATACGAGCAGCTTCCAAAGCTTCACTAGAGACATTTTCTTTCTCCCAACTCACAAGATGAACACAAAATGGAAACT+1=DDFFFHHHHHJJDGHHHIJIJIIJJIJIIIGIIGJIIIJCHEIIJGIJJIJIIJIJIFGGGGGIJIFFBEFDC>@@BB?A9@3;@(553>@>C(59:?
Analysis

Data Cleaning: a Multistep ProcessRemove adapters
• Remove contamination from fastq files
Remove contamination
• Removes adapter sequences
Trim reads • Trim reads based on quality
Separate reads
• Separate reads into paired and unpaired
Analysis

Quality Control – Per Base Sequence QualityAnalysis
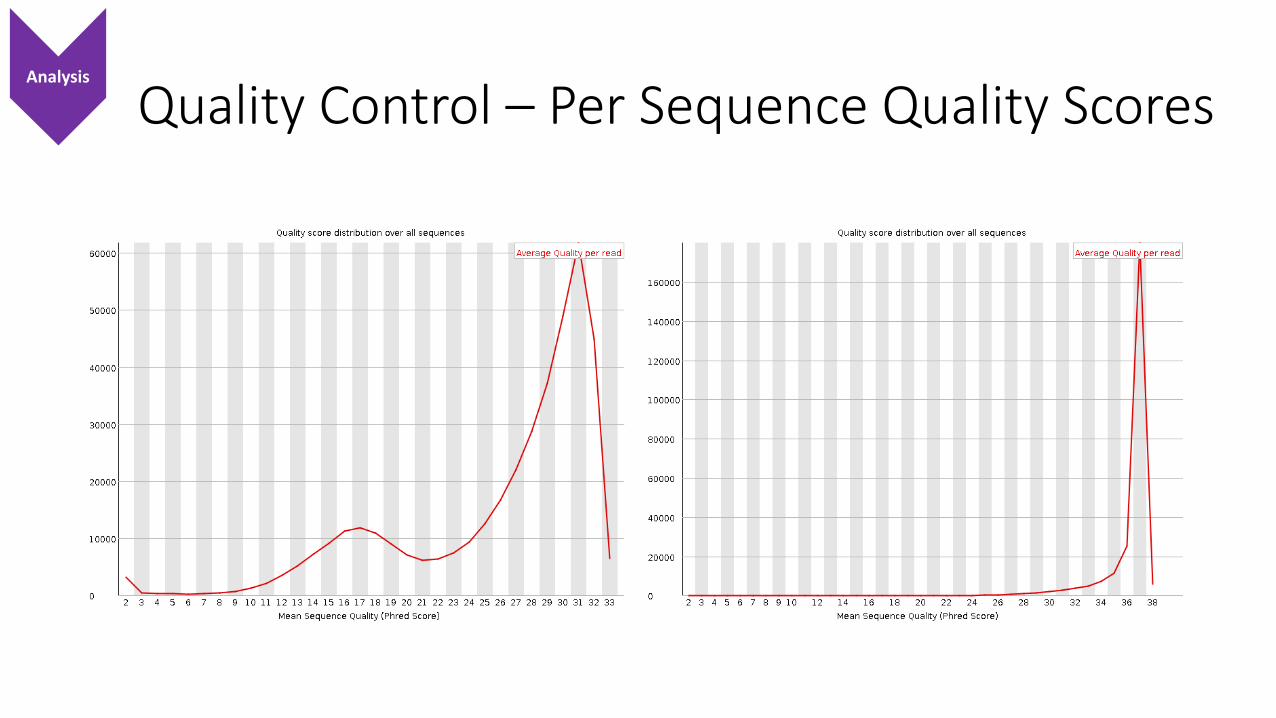
Quality Control – Per Sequence Quality ScoresAnalysis
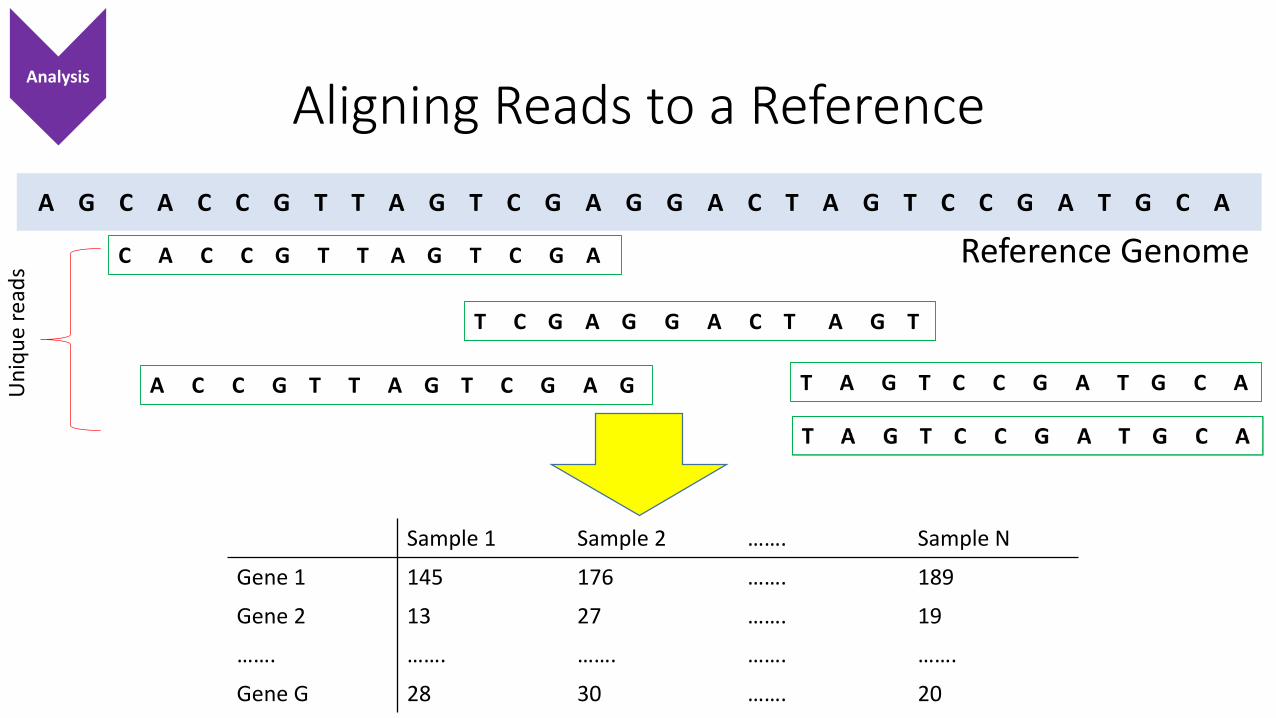
A G C A C C G T T A G T C G A G G A C T A G T C C G A T G C A
Reference GenomeC A C C G T T A G T C G A
T C G A G G A C T A G T
T A G T C C G A T G C AA C C G T T A G T C G A G
Sample 1 Sample 2 ……. Sample N
Gene 1 145 176 ……. 189
Gene 2 13 27 ……. 19
……. ……. ……. ……. …….
Gene G 28 30 ……. 20
Analysis
Aligning Reads to a Reference
Un
iqu
e re
ads

File formats: FASTA files
• Text file with sequences (amino acid or nucleotides)
• First line per sequence begins with > and information about sequence
• Example:
>comp2_c0_seq1GCGAGATGATTCTCCGGTTGAATCAGATCCAGAGGCATGTATATATCGTCTGCAAAATGCTAGAAACCCTCATGTGTGTAATGCAGTGCATTCATGAAAACCTTGTAAGCTCACGTGTCGCTGACTGTCTGAGAACCGACTCGCTAATGTTCCATGGAGTGGCTGCATACATCACAGATTGTGATTCCAGGTTGCGAGACTATTTGCAGGATGCATGCGAGCTGATTGCCTATTCCTTCTACTTCTTAAATAAAGTAAGAGC
Analysis
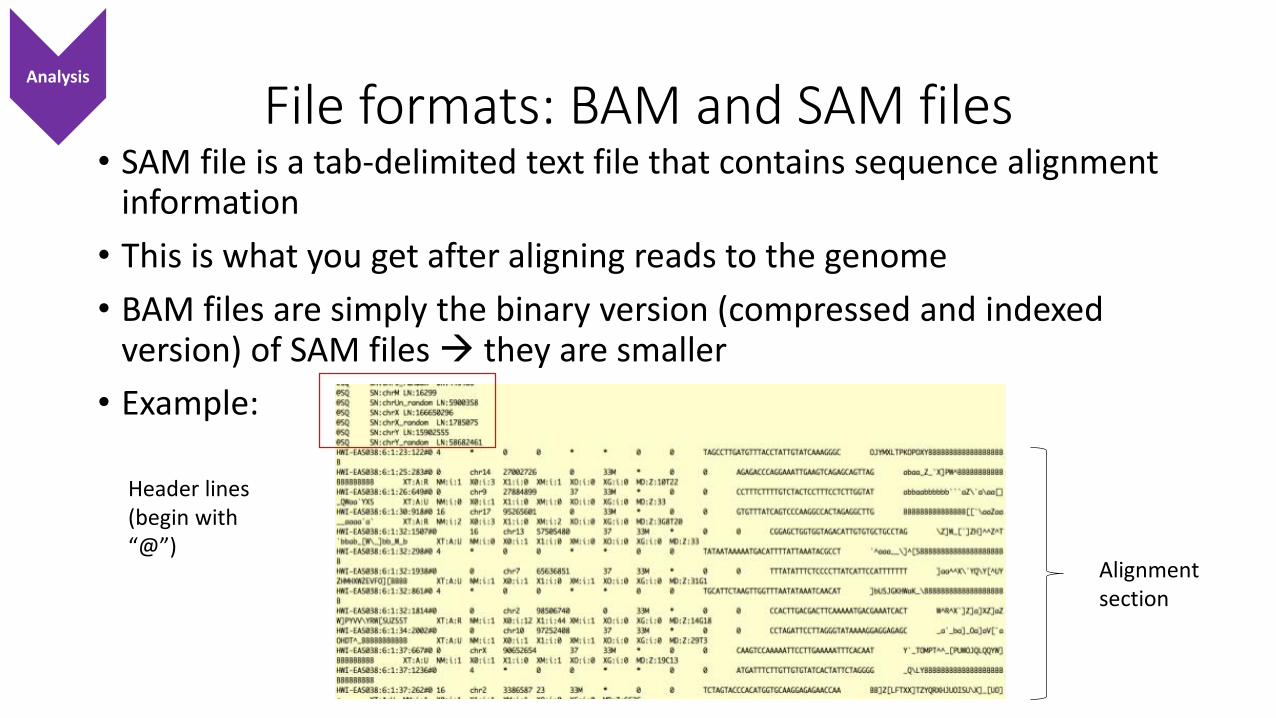
File formats: BAM and SAM files• SAM file is a tab-delimited text file that contains sequence alignment
information
• This is what you get after aligning reads to the genome
• BAM files are simply the binary version (compressed and indexed version) of SAM files they are smaller
• Example:
Header lines (begin with “@”)
Alignment section
Analysis

Terminology
• Counts = (Xi) the number of reads that align to a particular feature i (gene, isoform, miRNA…)
• Library size= (N) number of reads sequenced• FPKM = Fragments per kilobase of exon per million mapped reads
• Takes length of gene (li) into account• FPKMi=(Xi /li*N)*109
• CPM = Counts Per Million mapped reads• CPMi= Xi /N*106
• FDR = False Discovery Rate (the rate of Type I errors – false positives); a 10% FDR means that 10% of your differentially expressed genes are likely to be false positives • we must adjust for multiple testing in RNA-seq statistical analyses to control the FDR
Un
its
Analysis
Caveats
• If you have zero counts it does not necessarily mean that a gene is not expressed at all• Especially in single-cell RNA-seq
• RNA and protein expression profiles do not always correlate well• Correlations vary wildly between RNA and protein expression
• Depends on category of gene
• Correlation coefficient distributions were found to be bimodal between gene expression and protein data (one group of gene products had a mean correlation of 0.71; the another had a mean correlation of 0.28) • Shankavaram et. al, 2007
Analysis
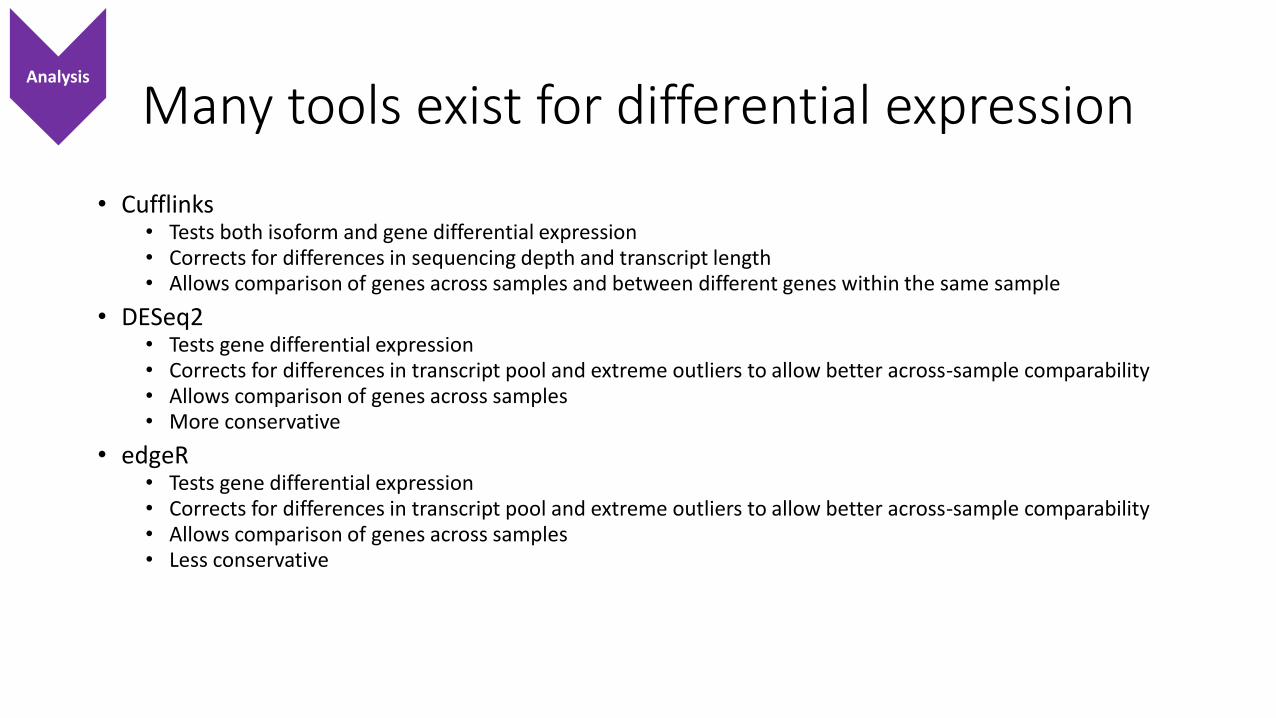
Many tools exist for differential expression
• Cufflinks• Tests both isoform and gene differential expression• Corrects for differences in sequencing depth and transcript length• Allows comparison of genes across samples and between different genes within the same sample
• DESeq2• Tests gene differential expression• Corrects for differences in transcript pool and extreme outliers to allow better across-sample comparability• Allows comparison of genes across samples• More conservative
• edgeR• Tests gene differential expression• Corrects for differences in transcript pool and extreme outliers to allow better across-sample comparability• Allows comparison of genes across samples• Less conservative
Analysis

Downstream analysis: What to do with your gene list
• Annotate DEG
• Find biological processes that are enriched amongst the DEGs
• Pathway analysis
• Clustering analyses
• Biological Validation
Analysis
GO terms
• GO Consortium (Gene Ontology Consortium) seeks to provide consistent descriptions of gene products across databases• Started as a collaboration between FlyBase (Drosophila), Saccharomyces
Genome Database (SGD), and the Mouse Genome Database (MGD)• Now incorporates many more databases
• Comprised of 3 structured ontologies that describe gene products in terms of associated:• Biological processes (operations or sets of molecular events with a defined
beginning and end)• Cellular components (the parts of a cell or its extracellular environment)• Molecular functions (activities of a gene product at a molecular/biochemical
level – such as “catalysis” or “binding”)
Analysis

GO term enrichment analysis
• Which GO terms are enriched in my list of interesting genes?• Find GO terms that are over-represented or under-represented using annotations for
your gene set
• Fisher’s Exact Test/Hypergeometric test often used• Compare GO terms mapping to gene list with GO terms mapping to a
background/reference gene list (such as all the genes in the yeast genome)
• Numerous tools exist for GO term enrichment analysis (the following require no computational background and have GUIs):• AmiGO• OBO-edit• AgriGO• BLAST2GO• DAVID• BiNGO
Analysis
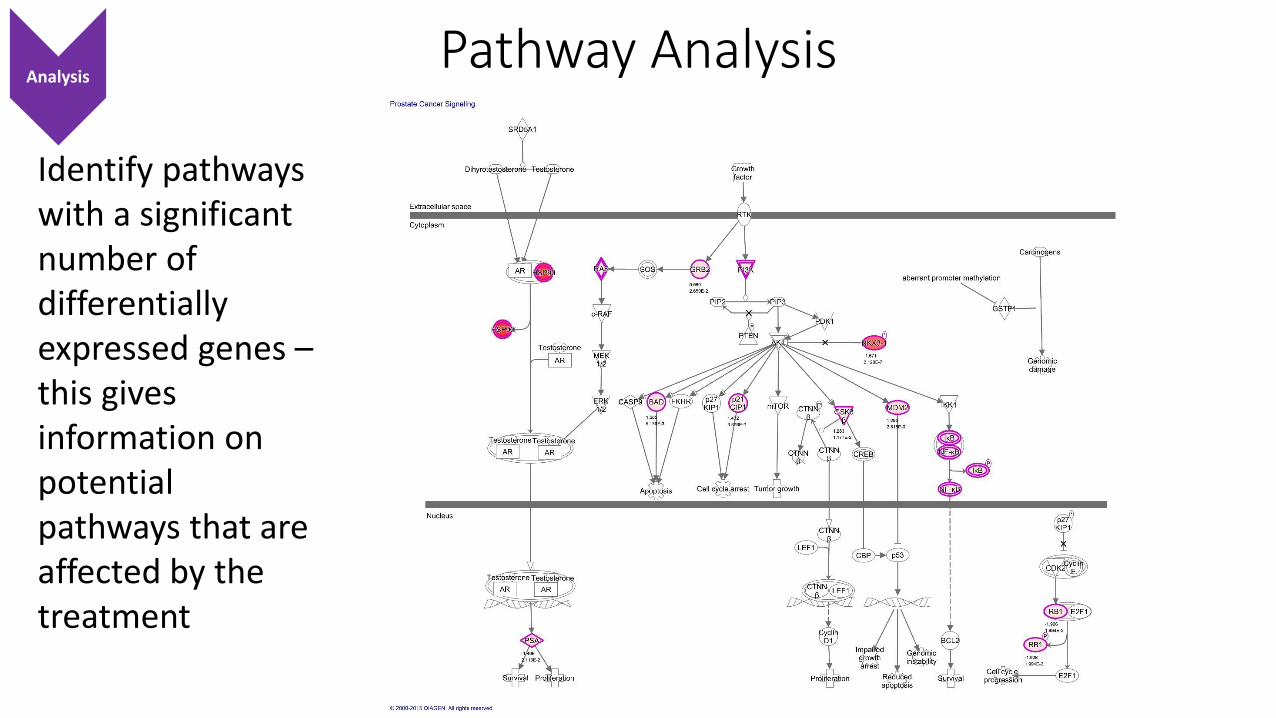
Pathway Analysis
Identify pathways with a significant number of differentially expressed genes –this gives information on potential pathways that are affected by the treatment
Analysis
Acknowledgements
• Purdue University Center for Cancer Research
• Purdue Bioinformatics Core ([email protected])
• Dr. Jyothi Thimmapuram
• Purdue Genomics Core Facility
• C3B (Collaborative Core for Cancer Bioinformatics)
• Walther Grant
Thank you!
Any questions?