Embed Size (px)
Citation preview
1
Presentation
For UMAC
Fred Toepfer/Tim Schneider, Program Manager
Dynamic Core Test Group
June 22, 2016
Next Generation Global
Prediction System
(NGGPS)
Phase 2 Atmospheric Dynamic
Core Evaluation
NCAR MPAS
2
Outline
• NGGPS Goals and Objectives
• NGGPS Strategy
• Dynamic Core Testing Process and Timelines
• Dynamic Core Assessment (Phase 2)
• DTG Findings
• Back-up
– GFS Development and Operational Upgrade Plan
– Detailed Phase 2 Test Results
– Phase 1 Test and Evaluation
– Global Modeling Test Bed (GMTB)
– Common Community Physics Package (CCPP) Strategy
3
NGGPS Goals and Objectives1
• Design/Develop/Implement NGGPS global atmospheric
prediction model
– Non-hydrostatic scalable dynamics
– Accelerated physics improvement profile
• Improve data assimilation
• Position NWS for next generation high performance
computing
1 – From NWS Budget Initiative proposal to OMB
World’s Best Global Forecast Guidance
4
Rationale for Replacing Global
Spectral Model (GSM)
• Continued GFS operational performance improvements
will require non-hydrostatic resolutions
• Hydrostatic GSM at end-of-life
– Does not scale well
• Next-Generation computing paradigm will require scaling
across potentially 100,000’s processors or more
• Semi-Lagrangian spectral cores have significantly poorer
effective resolution than competing cores, for same
nominal resolution
• Parallel efforts initiated at UKMO and ECMWF
5
NGGPS Global Atmospheric
Prediction Model Technical Strategy
• Reduce implementation time and risk by separating dynamic
core and model physics
• Identify and implement optimal core for global weather
forecast applications
– Highly scalable
– Non-hydrostatic
• Accelerate evolution of model physics
– Develop/Implement Common Community Physics
Package (CCPP)
• Based on current GFS physics package
• Integration of best of other existing physics packages
• Scale aware
– Employ Global Modeling Test Bed (GMTB) to encourage
and facilitate community interaction
6
NGGPS Global Atmospheric Prediction
Model Implementation Strategy
• Phase 1 – Identify Qualified Dynamic Cores
– Evaluate technical performance
• Scalability
• Integration of scheme stability and characteristics
• Phase 2 – Select Candidate Dynamic Core
– Integrate with operational GFS Physics/CCPP
– Evaluate meteorological performance
• Phase 3 – Operational Implementation
– Implement candidate dynamic core in NEMS
– Implement Common Community Physics Package
– Implement data assimilation (4DEnVar with 4D
incremental analysis update and stochastic physics)
7
Strategy to Implement
Community Model Environment
• Q1FY17: Hold a workshop to collect input on how to structure the
community model environment, including:
– Code hosting environment (e.g. github)
– Processes for O2R and R2O
– Governance
– How will support be provided?
– What models will be supported (atmosphere dycore, ocean,
land…)?
• Develop detailed documentation, include users guide
• Q1FY18: Code released, with documentation
• Q1FY19: First users workshop/tutorial
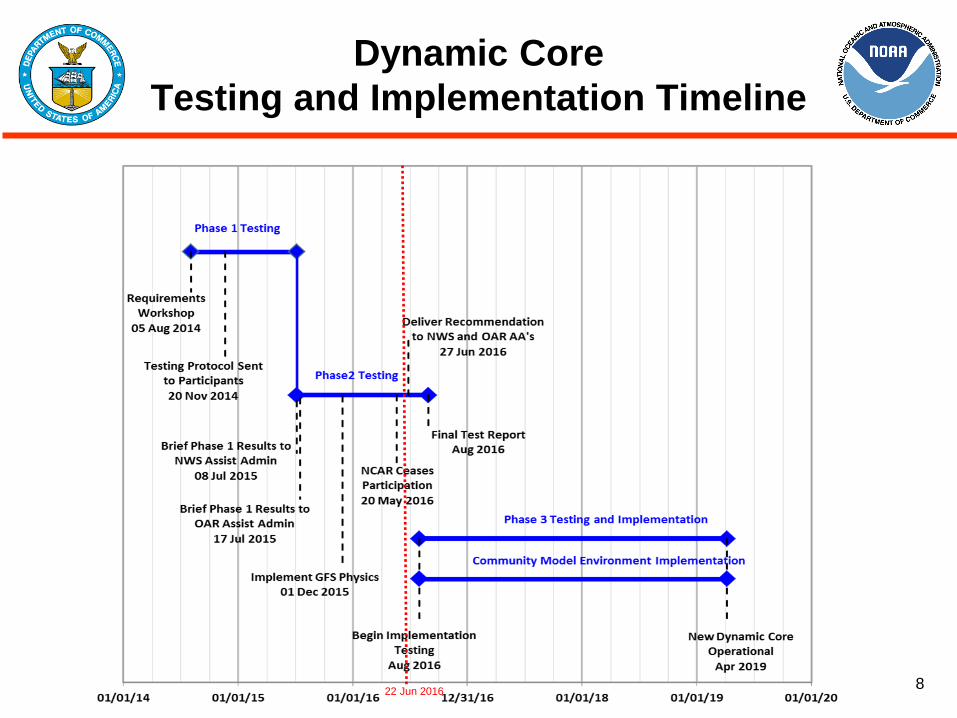
8 22 Jun 2016
Dynamic Core
Testing and Implementation Timeline
9
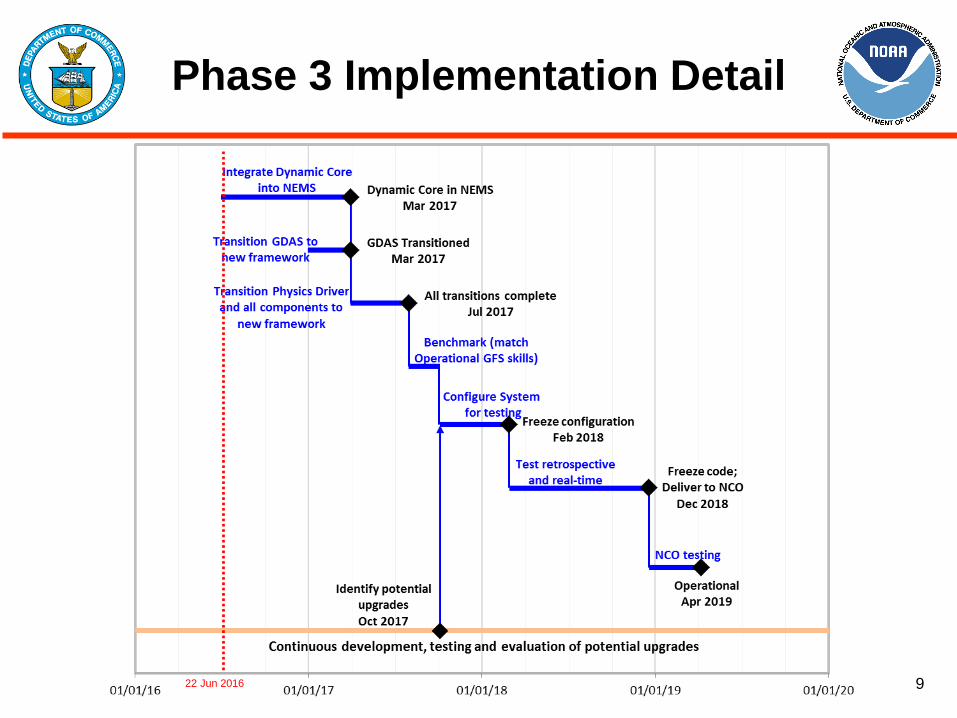
Phase 3 Implementation Detail
22 Jun 2016
10
Testing and Evaluation
Summary
11
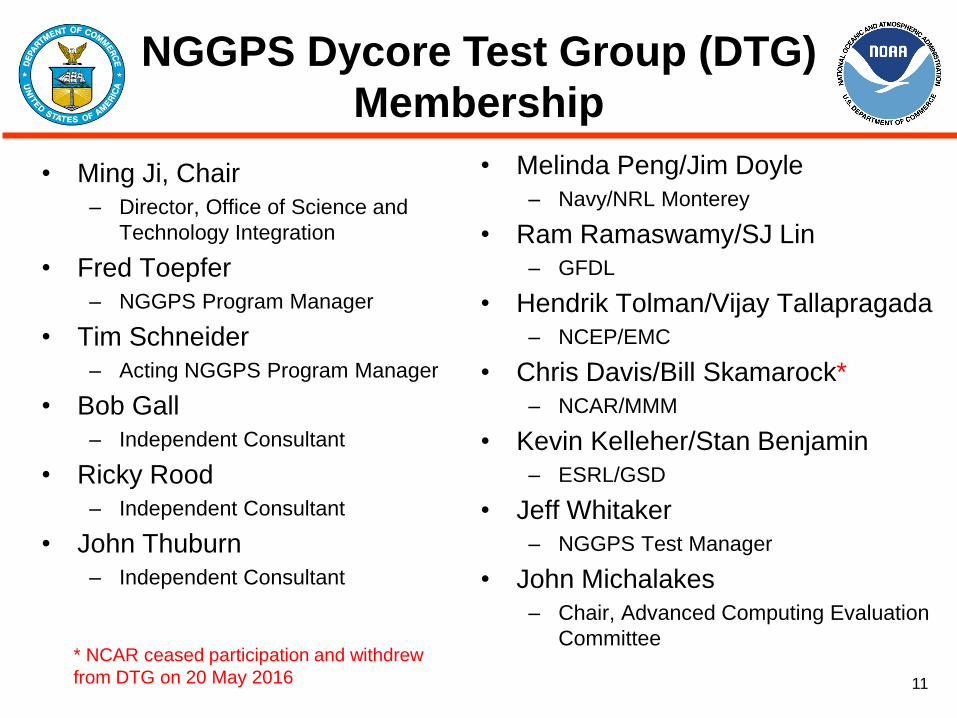
NGGPS Dycore Test Group (DTG)
Membership
• Ming Ji, Chair
– Director, Office of Science and
Technology Integration
• Fred Toepfer
– NGGPS Program Manager
• Tim Schneider
– Acting NGGPS Program Manager
• Bob Gall
– Independent Consultant
• Ricky Rood
– Independent Consultant
• John Thuburn
– Independent Consultant
• Melinda Peng/Jim Doyle
– Navy/NRL Monterey
• Ram Ramaswamy/SJ Lin
– GFDL
• Hendrik Tolman/Vijay Tallapragada
– NCEP/EMC
• Chris Davis/Bill Skamarock*
– NCAR/MMM
• Kevin Kelleher/Stan Benjamin
– ESRL/GSD
• Jeff Whitaker
– NGGPS Test Manager
• John Michalakes
– Chair, Advanced Computing Evaluation
Committee * NCAR ceased participation and withdrew
from DTG on 20 May 2016
12
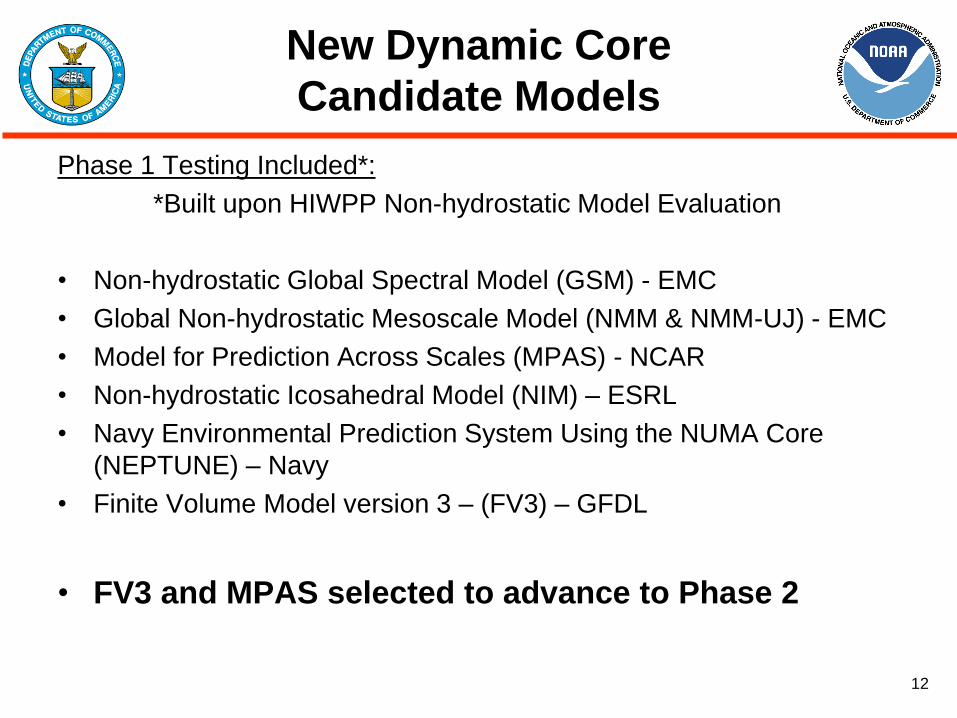
New Dynamic Core
Candidate Models
Phase 1 Testing Included*:
*Built upon HIWPP Non-hydrostatic Model Evaluation
• Non-hydrostatic Global Spectral Model (GSM) - EMC
• Global Non-hydrostatic Mesoscale Model (NMM & NMM-UJ) - EMC
• Model for Prediction Across Scales (MPAS) - NCAR
• Non-hydrostatic Icosahedral Model (NIM) – ESRL
• Navy Environmental Prediction System Using the NUMA Core
(NEPTUNE) – Navy
• Finite Volume Model version 3 – (FV3) – GFDL
• FV3 and MPAS selected to advance to Phase 2
13
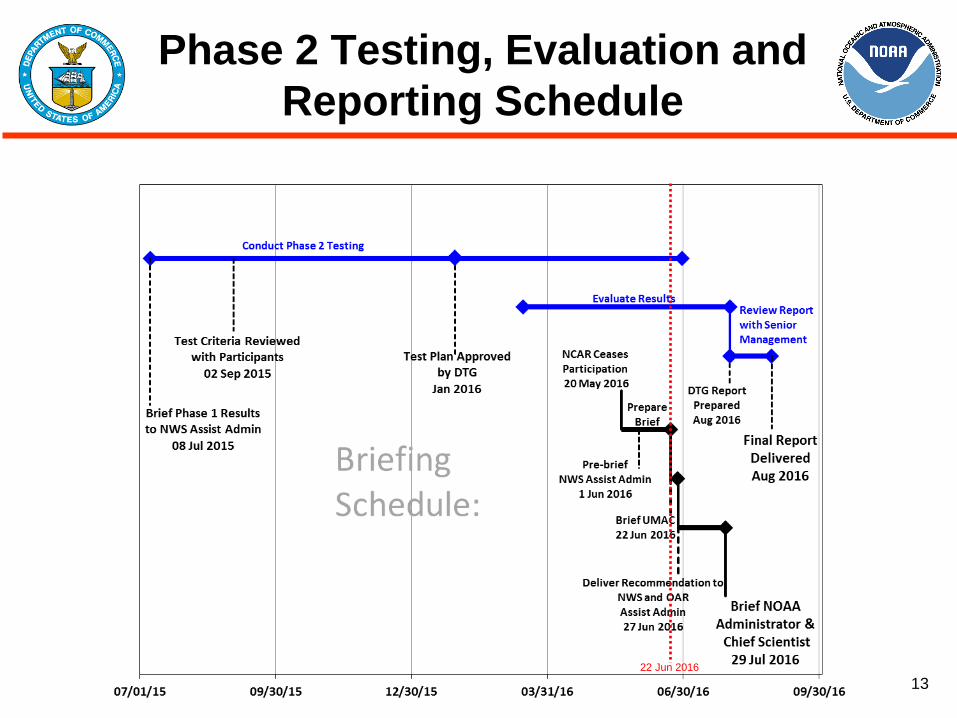
Phase 2 Testing, Evaluation and
Reporting Schedule
22 Jun 2016
14
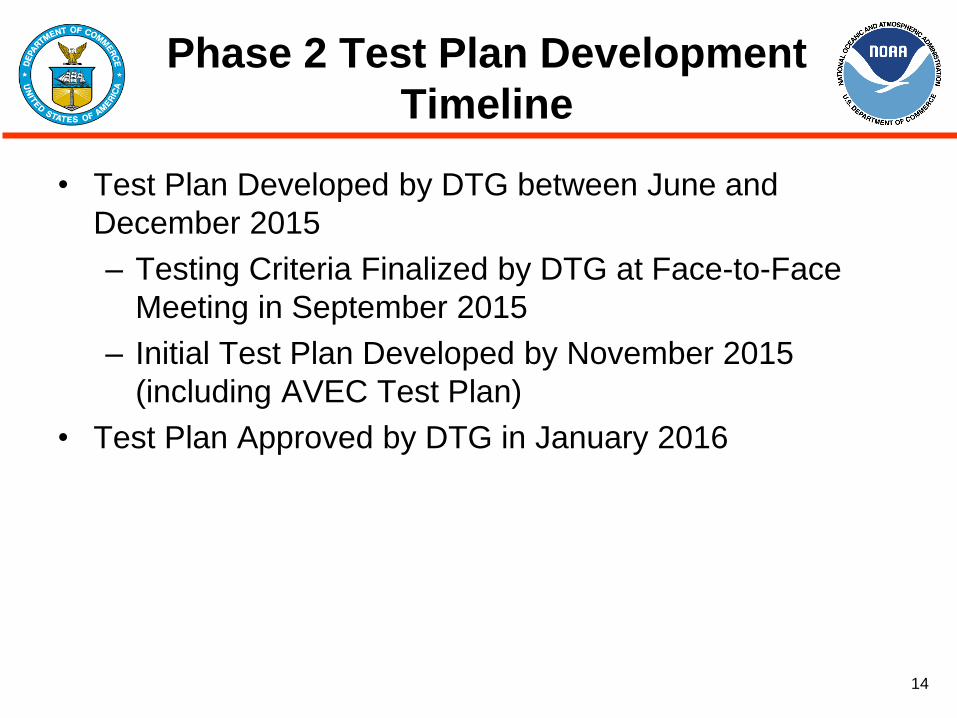
Phase 2 Test Plan Development
Timeline
• Test Plan Developed by DTG between June and
December 2015
– Testing Criteria Finalized by DTG at Face-to-Face
Meeting in September 2015
– Initial Test Plan Developed by November 2015
(including AVEC Test Plan)
• Test Plan Approved by DTG in January 2016
15
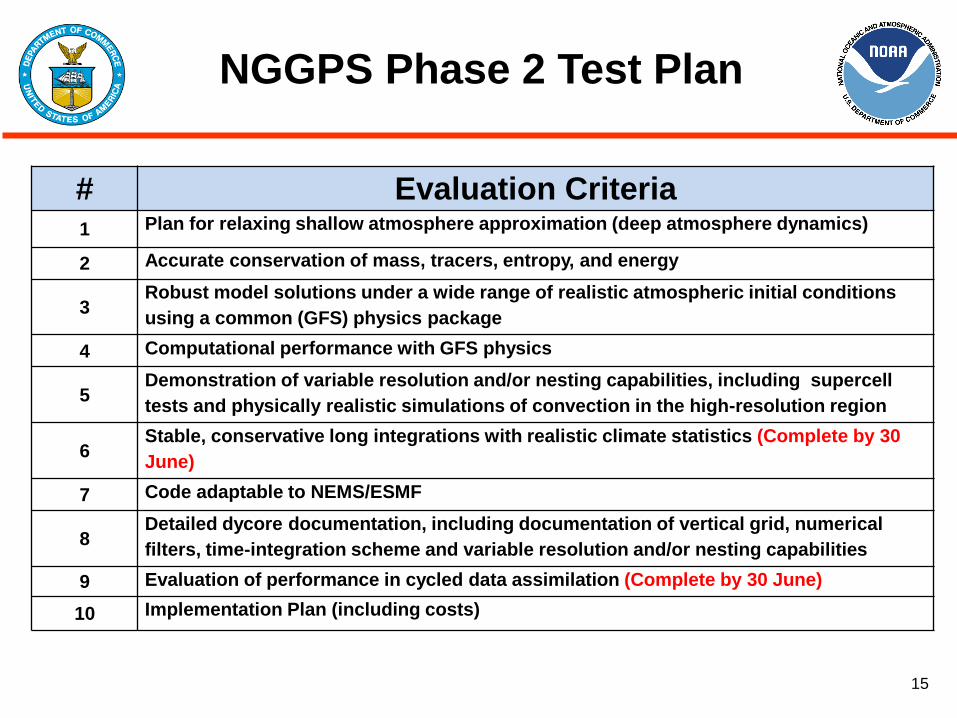
# Evaluation Criteria 1 Plan for relaxing shallow atmosphere approximation (deep atmosphere dynamics)
2 Accurate conservation of mass, tracers, entropy, and energy
3 Robust model solutions under a wide range of realistic atmospheric initial conditions
using a common (GFS) physics package
4 Computational performance with GFS physics
5 Demonstration of variable resolution and/or nesting capabilities, including supercell
tests and physically realistic simulations of convection in the high-resolution region
6 Stable, conservative long integrations with realistic climate statistics (Complete by 30
June)
7 Code adaptable to NEMS/ESMF
8 Detailed dycore documentation, including documentation of vertical grid, numerical
filters, time-integration scheme and variable resolution and/or nesting capabilities
9 Evaluation of performance in cycled data assimilation (Complete by 30 June)
10 Implementation Plan (including costs)
NGGPS Phase 2 Test Plan
16
#1: Whole Atmosphere Model
(WAM) Suitability
• SWPC WAM development team considered approaches by
MPAS and FV3 to SWx requirements:
– Both dycore teams have adequate plans in place for
addressing SWx requirements for the next generation WAM
and no preference was given to either dycore
– Some requirements are not fully addressed by either dycore
such as the approach to thermodynamics in a whole
atmosphere
– Significant effort still remains to adapt both dycores to the
full atmosphere altitude/pressure domain currently covered
by WAM
17
#2: Conservation Tests
• DCMIP-2012 baroclinic wave idealized test, dry and
moist (4.1 and 4.2) run at 13 km resolution. Simple
moist physics (large-scale condensation only) included.
• Conservation of total energy, entropy and dry mass
measured
• Extra advected tracer added, initialized with qe
(difference between advected and diagnosed qe
measured)
• ’Grid imprinting’ (signal of truncation errors at cube
corners and pentagons of icosahedral grid) assessed
18
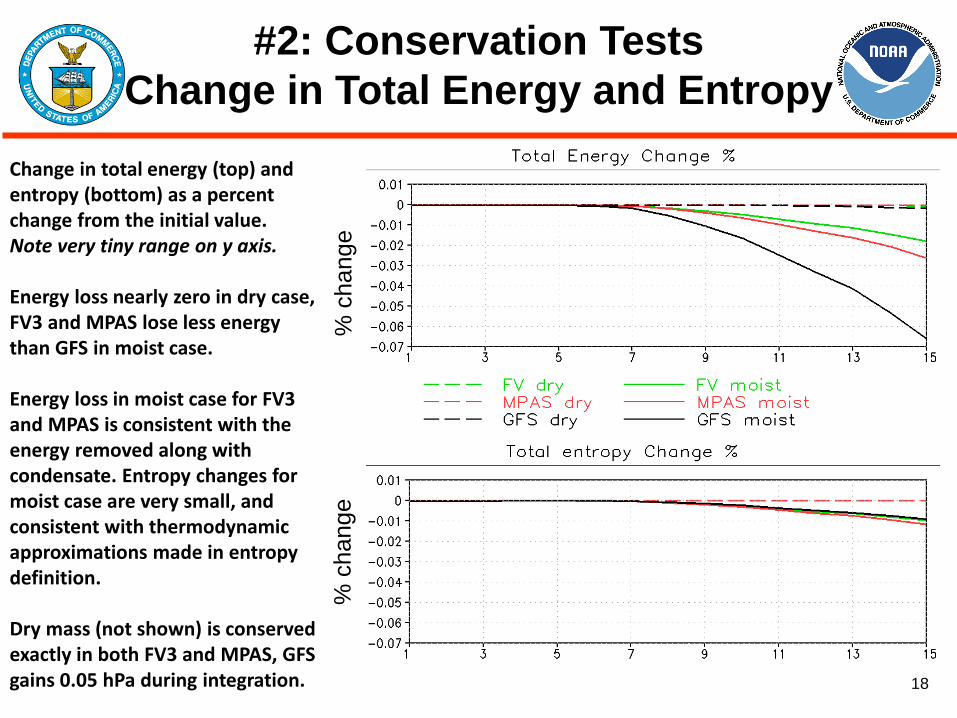
#2: Conservation Tests
Change in Total Energy and Entropy
Change in total energy (top) and entropy (bottom) as a percent change from the initial value. Note very tiny range on y axis. Energy loss nearly zero in dry case, FV3 and MPAS lose less energy than GFS in moist case. Energy loss in moist case for FV3 and MPAS is consistent with the energy removed along with condensate. Entropy changes for moist case are very small, and consistent with thermodynamic approximations made in entropy definition. Dry mass (not shown) is conserved exactly in both FV3 and MPAS, GFS gains 0.05 hPa during integration.
% c
hange
% c
hange
19
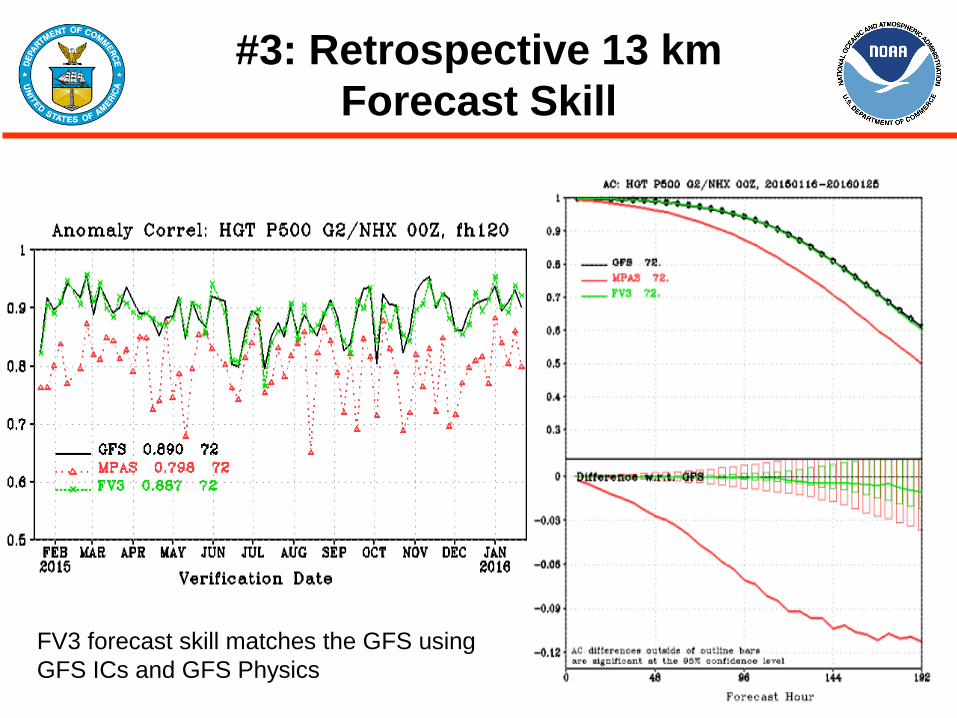
#3: Retrospective 13 km 10-d
Forecasts with GFS physics
• GFS physics package (provided by EMC) implemented
in both models by FV3 and MPAS development teams
• 74 retrospective 10-d forecasts run at 13 km resolution
with 64 vertical levels, initialized from GFS analyses
every 5th day for calendar year 2015
• Validated using NCEP verification suite, compared to
operational GFS forecasts
• Goals:
– Assess ‘robustness’ over a wide-range of
atmospheric flow conditions
– Assess work required to replace spectral dycore in
operational GFS
20
#3: Retrospective 13 km
Forecast Skill
FV3 forecast skill matches the GFS using
GFS ICs and GFS Physics
21
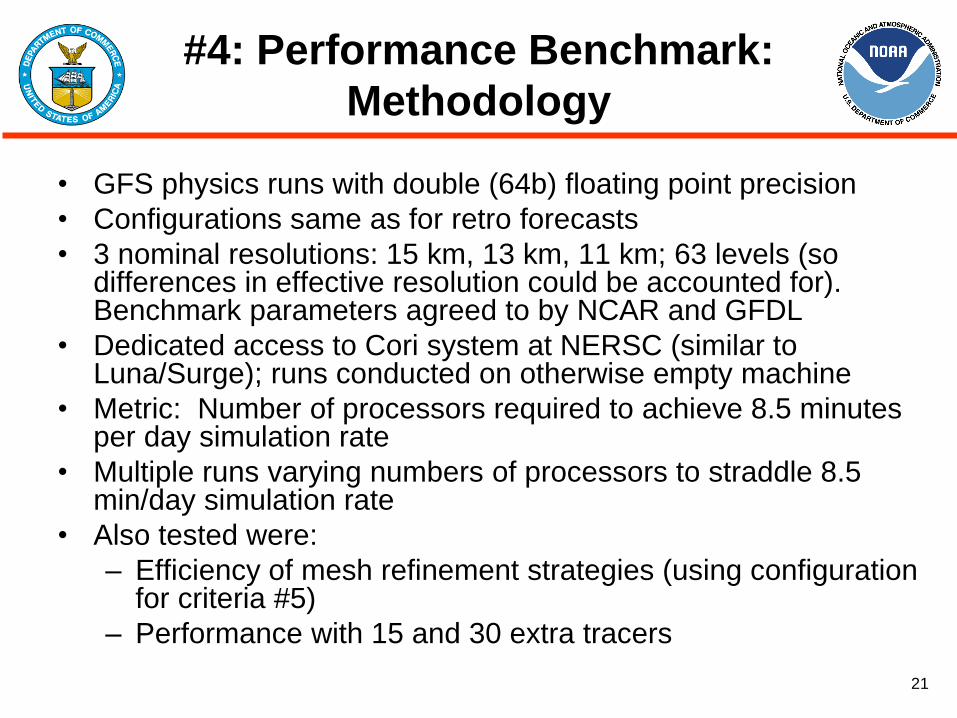
#4: Performance Benchmark:
Methodology
• GFS physics runs with double (64b) floating point precision
• Configurations same as for retro forecasts
• 3 nominal resolutions: 15 km, 13 km, 11 km; 63 levels (so differences in effective resolution could be accounted for). Benchmark parameters agreed to by NCAR and GFDL
• Dedicated access to Cori system at NERSC (similar to Luna/Surge); runs conducted on otherwise empty machine
• Metric: Number of processors required to achieve 8.5 minutes per day simulation rate
• Multiple runs varying numbers of processors to straddle 8.5 min/day simulation rate
• Also tested were:
– Efficiency of mesh refinement strategies (using configuration for criteria #5)
– Performance with 15 and 30 extra tracers
22
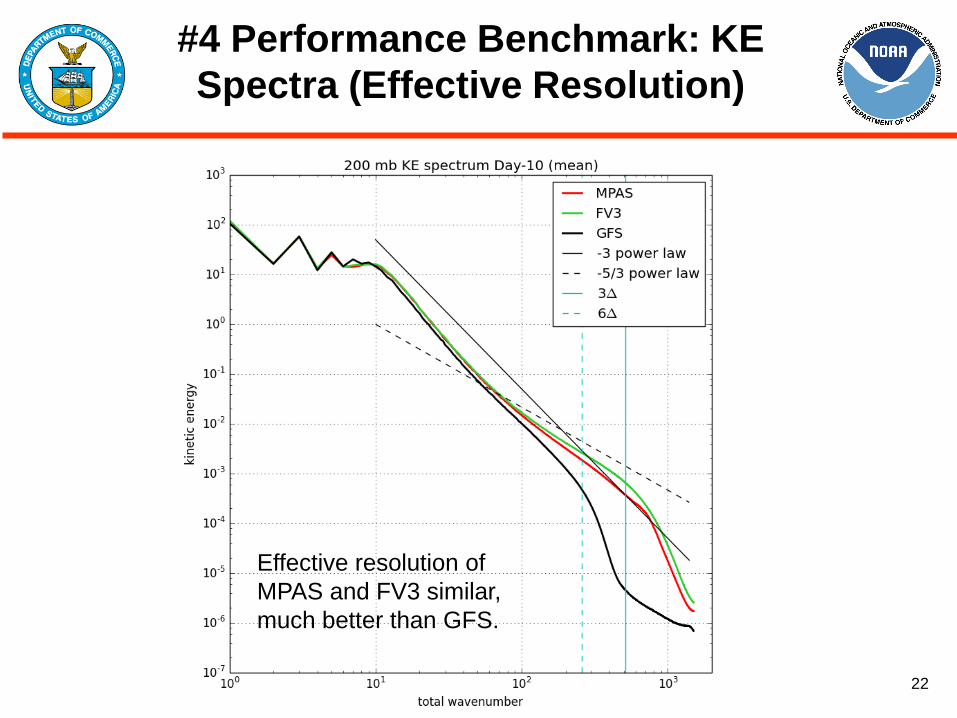
#4 Performance Benchmark: KE
Spectra (Effective Resolution)
Effective resolution of
MPAS and FV3 similar,
much better than GFS.
23
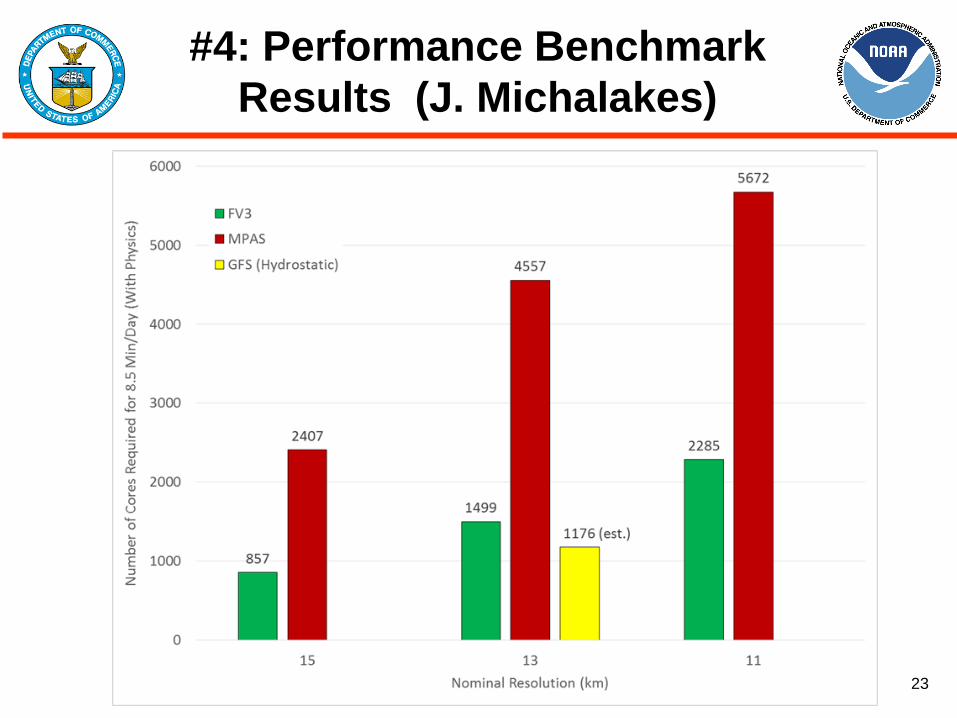
#4: Performance Benchmark
Results (J. Michalakes)
24
#5: Demonstration of Variable Resolution
and Nesting Capabilities
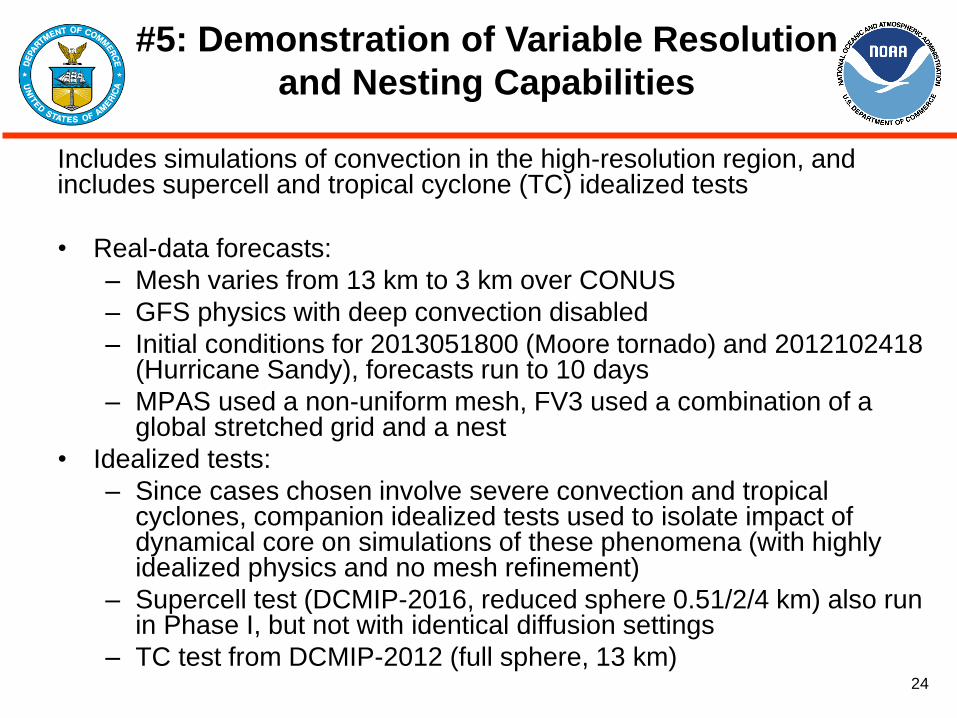
Includes simulations of convection in the high-resolution region, and includes supercell and tropical cyclone (TC) idealized tests
• Real-data forecasts:
– Mesh varies from 13 km to 3 km over CONUS
– GFS physics with deep convection disabled
– Initial conditions for 2013051800 (Moore tornado) and 2012102418 (Hurricane Sandy), forecasts run to 10 days
– MPAS used a non-uniform mesh, FV3 used a combination of a global stretched grid and a nest
• Idealized tests:
– Since cases chosen involve severe convection and tropical cyclones, companion idealized tests used to isolate impact of dynamical core on simulations of these phenomena (with highly idealized physics and no mesh refinement)
– Supercell test (DCMIP-2016, reduced sphere 0.51/2/4 km) also run in Phase I, but not with identical diffusion settings
– TC test from DCMIP-2012 (full sphere, 13 km)
25
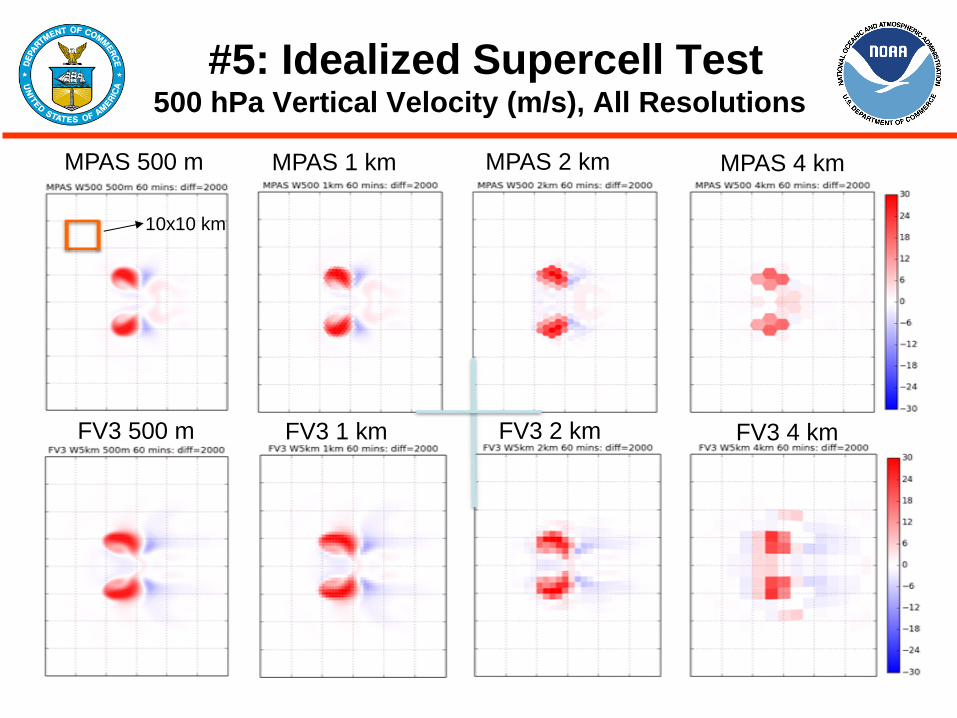
#5: Idealized Supercell Test 500 hPa Vertical Velocity (m/s), All Resolutions
MPAS 500 m MPAS 1 km MPAS 2 km MPAS 4 km
FV3 500 m FV3 1 km FV3 2 km FV3 4 km
10x10 km
26
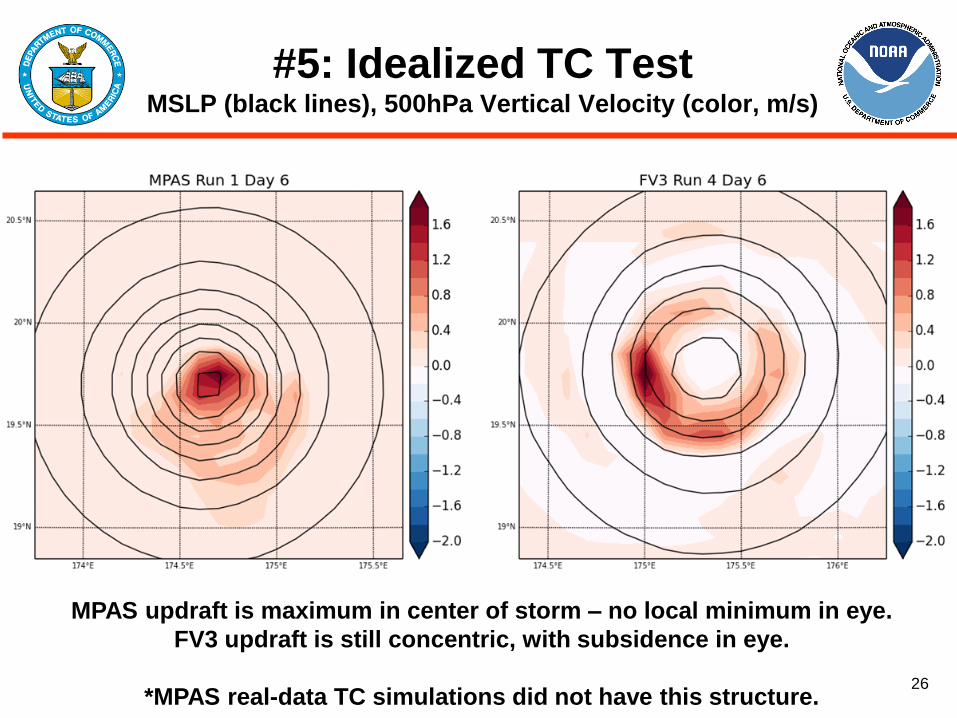
#5: Idealized TC Test MSLP (black lines), 500hPa Vertical Velocity (color, m/s)
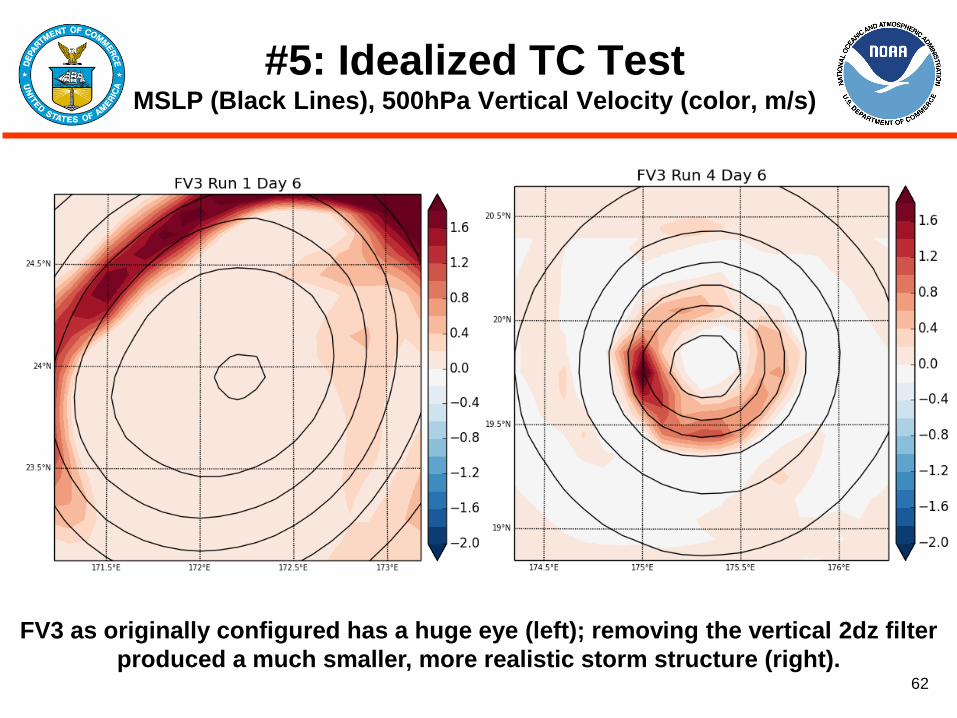
MPAS updraft is maximum in center of storm – no local minimum in eye.
FV3 updraft is still concentric, with subsidence in eye.
*MPAS real-data TC simulations did not have this structure.
27
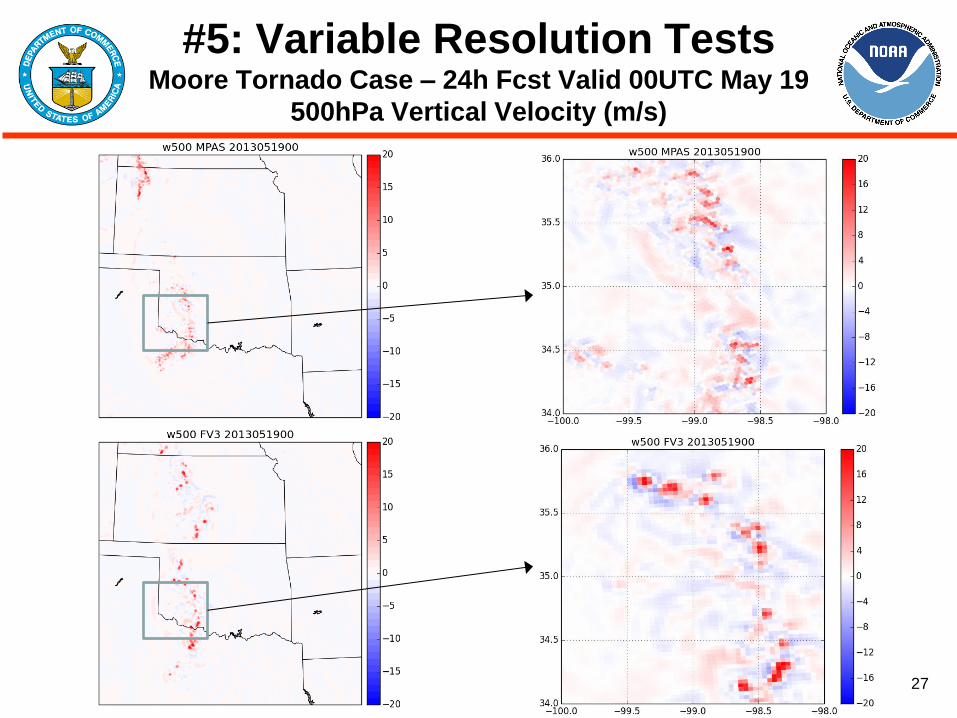
#5: Variable Resolution Tests Moore Tornado Case – 24h Fcst Valid 00UTC May 19
500hPa Vertical Velocity (m/s)
28
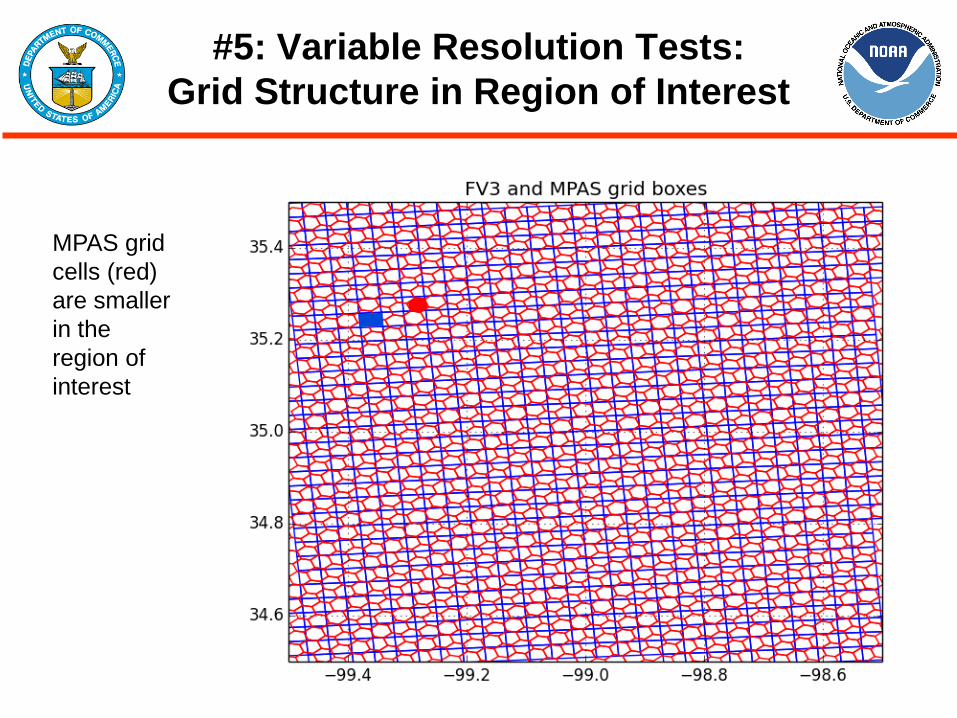
#5: Variable Resolution Tests:
Grid Structure in Region of Interest
MPAS grid
cells (red)
are smaller
in the
region of
interest
29
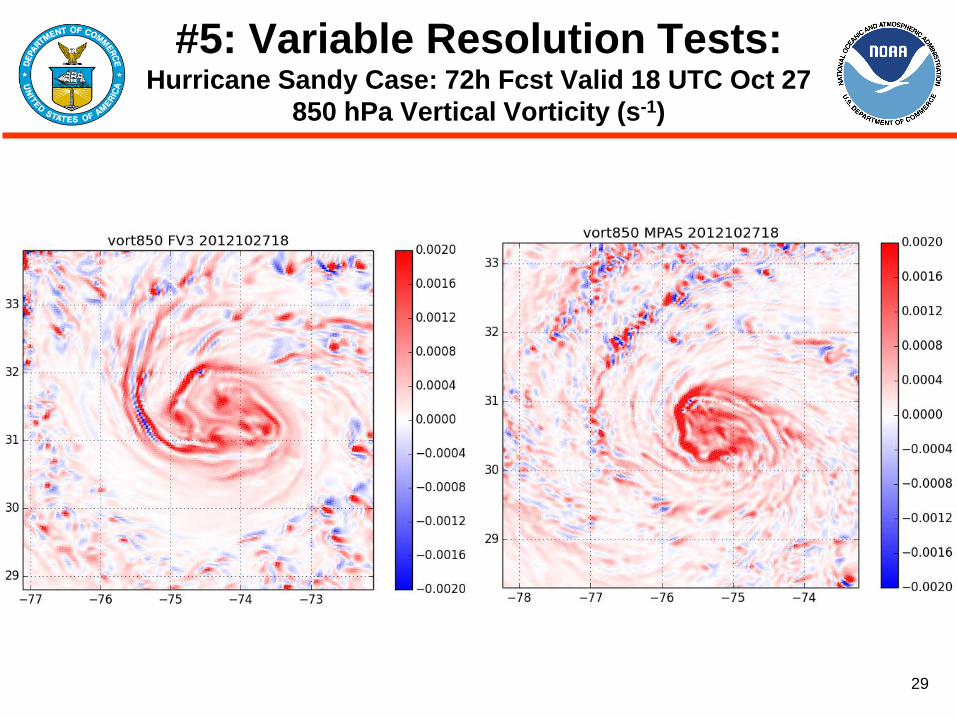
#5: Variable Resolution Tests: Hurricane Sandy Case: 72h Fcst Valid 18 UTC Oct 27
850 hPa Vertical Vorticity (s-1)
30
#6: Stable, Conservative Long Integrations
with Realistic Climate Statistics
• 90 days runs at reduced resolution (~50 km), from
GFS 00UTC Sep 1 2015 analysis, with surface
conditions updated every 6 hours
• Assessment will include:
– 90-day mean statistics
– Time series of dry mass, energy
– Detection of ‘grid imprint’
• Runs are in progress, results are preliminary
31
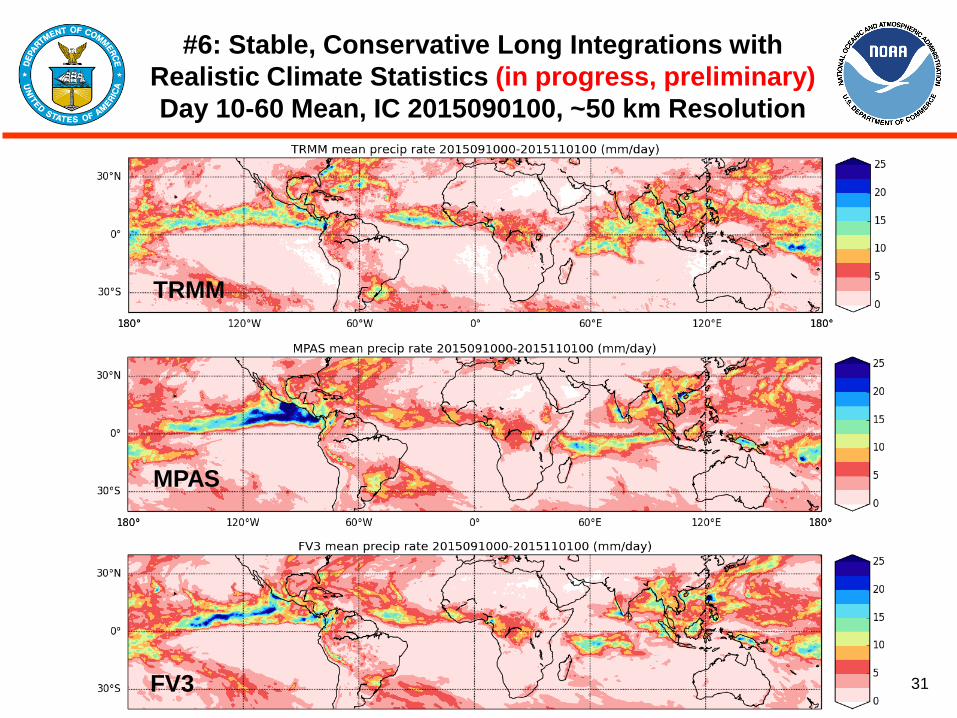
#6: Stable, Conservative Long Integrations with
Realistic Climate Statistics (in progress, preliminary)
Day 10-60 Mean, IC 2015090100, ~50 km Resolution
MPAS
FV3
TRMM
32
Criteria #7 and #8
• #7: Code adaptable to NEMS/ESMF
– Self-reporting on questionnaire from EMC. GFDL completed
(no issues) / NCAR incomplete
• #8: Detailed dycore documentation
– Complete – Both dycores sufficiently documented for Phase
2 evaluation (but more will be needed for community model
environment)
33
#9: Evaluation of Performance in
Cycled Data Assimilation (DA)
• Both models interfaced to operational 4D ensemble-variational DA system
• Due to time and HPC constraints, tests run at reduced resolution (~50 km)
• 80 member ensemble, cycle started at 2015090100 (In progress, results
are preliminary)
• Differences with operational configuration:
– No high-resolution control analysis
– No static background error component (full ensemble used to maximize
feedback between dycore and DA)
– No digital filter or tangent-linear balance constraint
– No stochastic physics in ensemble (multiplicative inflation increased to
compensate)
• Baseline GFS experiment at T382 resolution for reference
• Assessing:
– Work required to replace spectral dycore in GDAS
– Whether issues arise that may not be evident when models initialized
from ‘foreign’ analysis
34
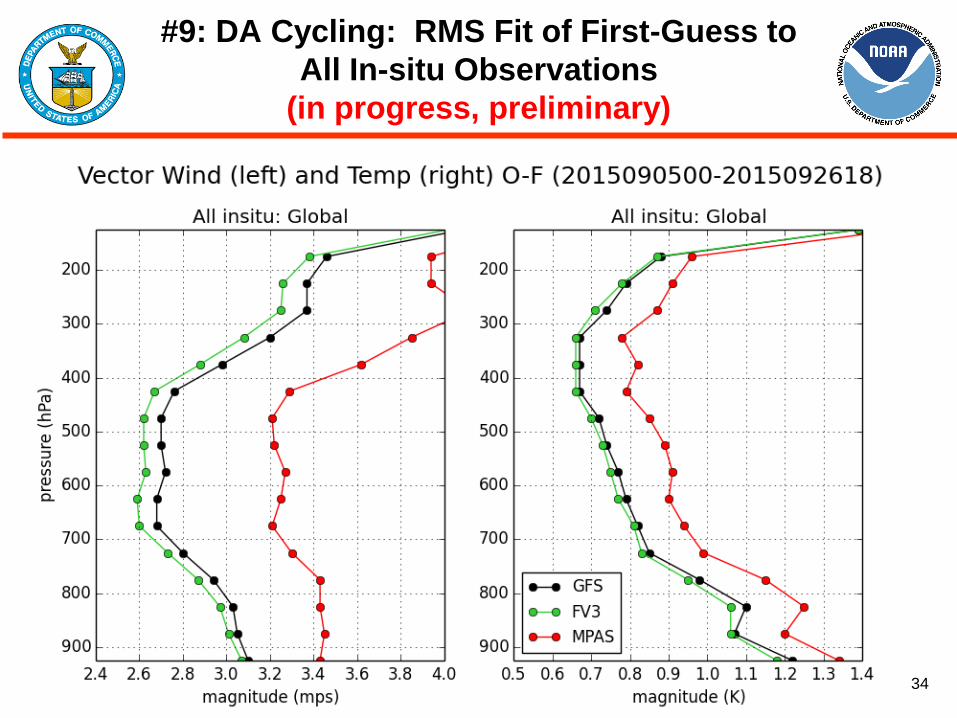
#9: DA Cycling: RMS Fit of First-Guess to
All In-situ Observations
(in progress, preliminary)
35
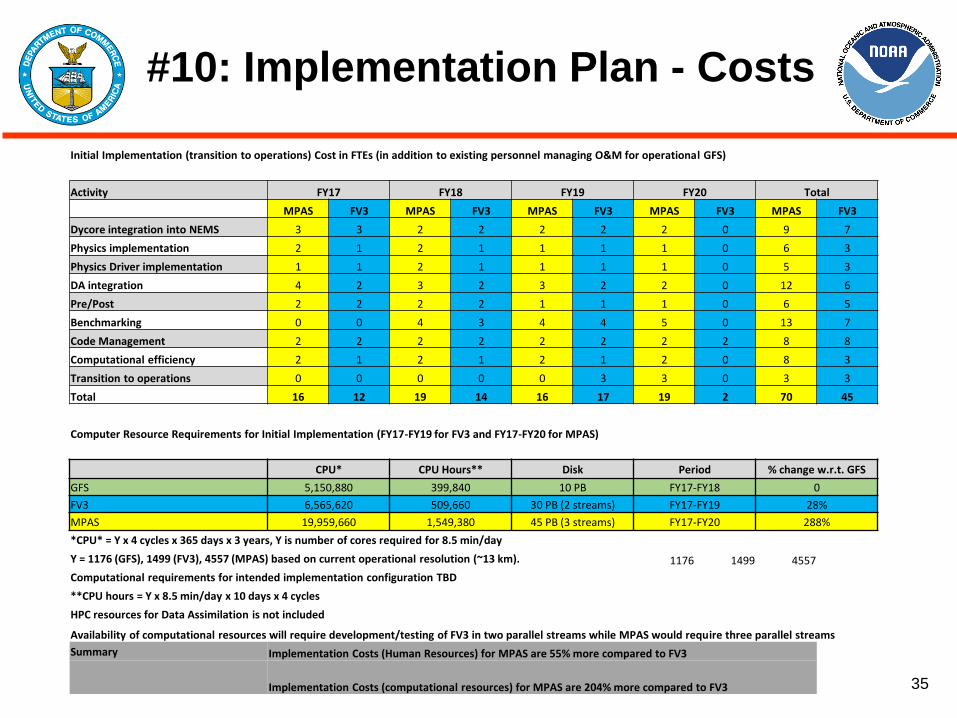
#10: Implementation Plan - Costs
Initial Implementation (transition to operations) Cost in FTEs (in addition to existing personnel managing O&M for operational GFS)
Activity FY17 FY18 FY19 FY20 Total
MPAS FV3 MPAS FV3 MPAS FV3 MPAS FV3 MPAS FV3
Dycore integration into NEMS 3 3 2 2 2 2 2 0 9 7
Physics implementation 2 1 2 1 1 1 1 0 6 3
Physics Driver implementation 1 1 2 1 1 1 1 0 5 3
DA integration 4 2 3 2 3 2 2 0 12 6
Pre/Post 2 2 2 2 1 1 1 0 6 5
Benchmarking 0 0 4 3 4 4 5 0 13 7
Code Management 2 2 2 2 2 2 2 2 8 8
Computational efficiency 2 1 2 1 2 1 2 0 8 3
Transition to operations 0 0 0 0 0 3 3 0 3 3
Total 16 12 19 14 16 17 19 2 70 45
Computer Resource Requirements for Initial Implementation (FY17-FY19 for FV3 and FY17-FY20 for MPAS)
CPU* CPU Hours** Disk Period % change w.r.t. GFS
GFS 5,150,880 399,840 10 PB FY17-FY18 0
FV3 6,565,620 509,660 30 PB (2 streams) FY17-FY19 28%
MPAS 19,959,660 1,549,380 45 PB (3 streams) FY17-FY20 288%
*CPU* = Y x 4 cycles x 365 days x 3 years, Y is number of cores required for 8.5 min/day
Y = 1176 (GFS), 1499 (FV3), 4557 (MPAS) based on current operational resolution (~13 km). 1176 1499 4557
Computational requirements for intended implementation configuration TBD
**CPU hours = Y x 8.5 min/day x 10 days x 4 cycles
HPC resources for Data Assimilation is not included
Availability of computational resources will require development/testing of FV3 in two parallel streams while MPAS would require three parallel streams
Summary Implementation Costs (Human Resources) for MPAS are 55% more compared to FV3
Implementation Costs (computational resources) for MPAS are 204% more compared to FV3
36
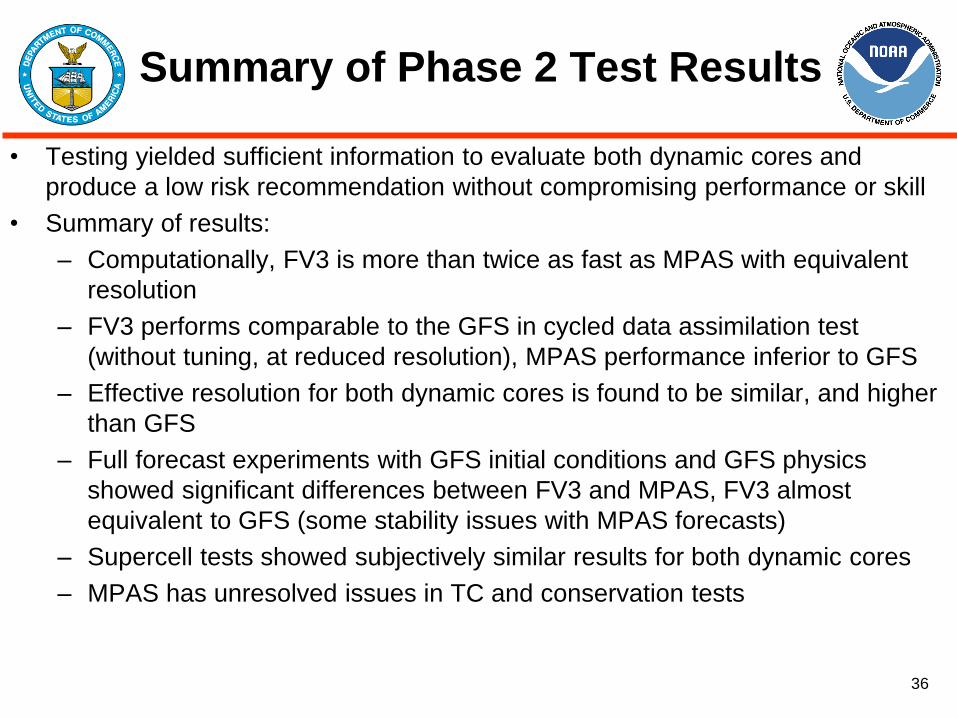
Summary of Phase 2 Test Results
• Testing yielded sufficient information to evaluate both dynamic cores and
produce a low risk recommendation without compromising performance or skill
• Summary of results:
– Computationally, FV3 is more than twice as fast as MPAS with equivalent
resolution
– FV3 performs comparable to the GFS in cycled data assimilation test
(without tuning, at reduced resolution), MPAS performance inferior to GFS
– Effective resolution for both dynamic cores is found to be similar, and higher
than GFS
– Full forecast experiments with GFS initial conditions and GFS physics
showed significant differences between FV3 and MPAS, FV3 almost
equivalent to GFS (some stability issues with MPAS forecasts)
– Supercell tests showed subjectively similar results for both dynamic cores
– MPAS has unresolved issues in TC and conservation tests
37
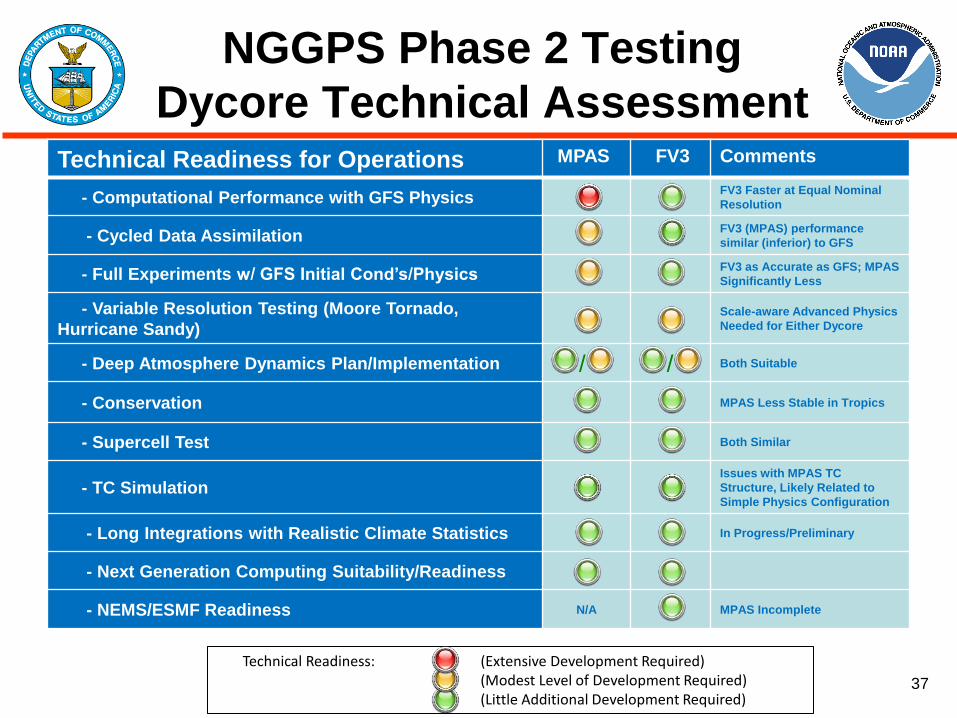
NGGPS Phase 2 Testing
Dycore Technical Assessment Technical Readiness for Operations MPAS FV3 Comments
- Computational Performance with GFS Physics FV3 Faster at Equal Nominal
Resolution
- Cycled Data Assimilation FV3 (MPAS) performance
similar (inferior) to GFS
- Full Experiments w/ GFS Initial Cond’s/Physics FV3 as Accurate as GFS; MPAS
Significantly Less
- Variable Resolution Testing (Moore Tornado,
Hurricane Sandy) Scale-aware Advanced Physics
Needed for Either Dycore
- Deep Atmosphere Dynamics Plan/Implementation / / Both Suitable
- Conservation MPAS Less Stable in Tropics
- Supercell Test Both Similar
- TC Simulation Issues with MPAS TC
Structure, Likely Related to
Simple Physics Configuration
- Long Integrations with Realistic Climate Statistics In Progress/Preliminary
- Next Generation Computing Suitability/Readiness
- NEMS/ESMF Readiness N/A MPAS Incomplete
Technical Readiness: (Extensive Development Required) (Modest Level of Development Required) (Little Additional Development Required)
38
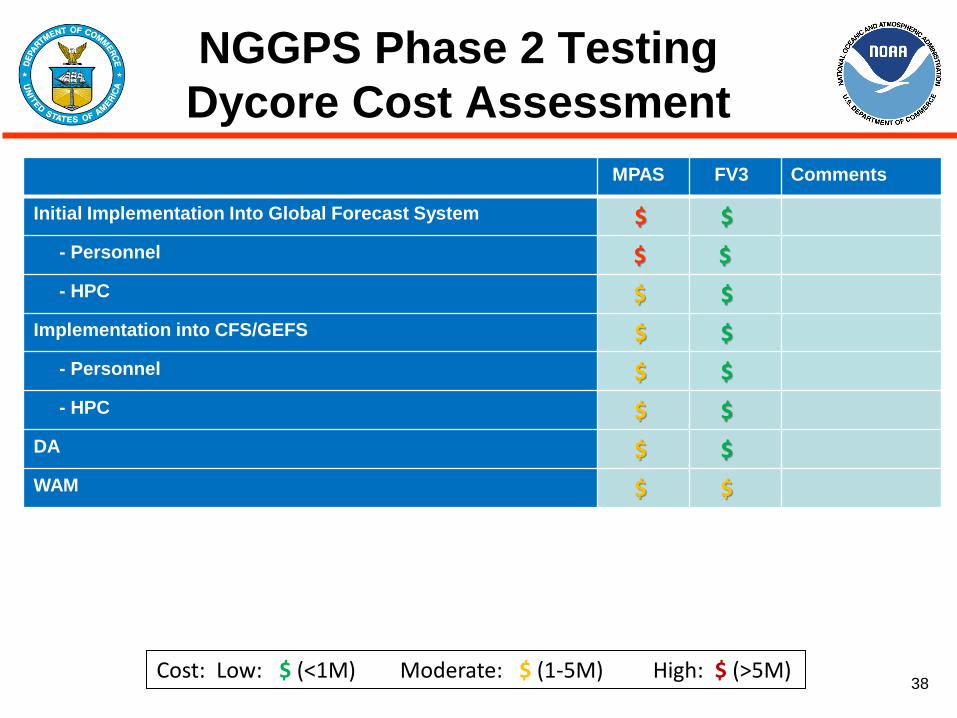
NGGPS Phase 2 Testing
Dycore Cost Assessment
MPAS FV3 Comments
Initial Implementation Into Global Forecast System $ $
- Personnel $ $
- HPC $ $
Implementation into CFS/GEFS $ $
- Personnel $ $
- HPC $ $
DA $ $
WAM $ $
Cost: Low: $ (<1M) Moderate: $ (1-5M) High: $ (>5M)
39
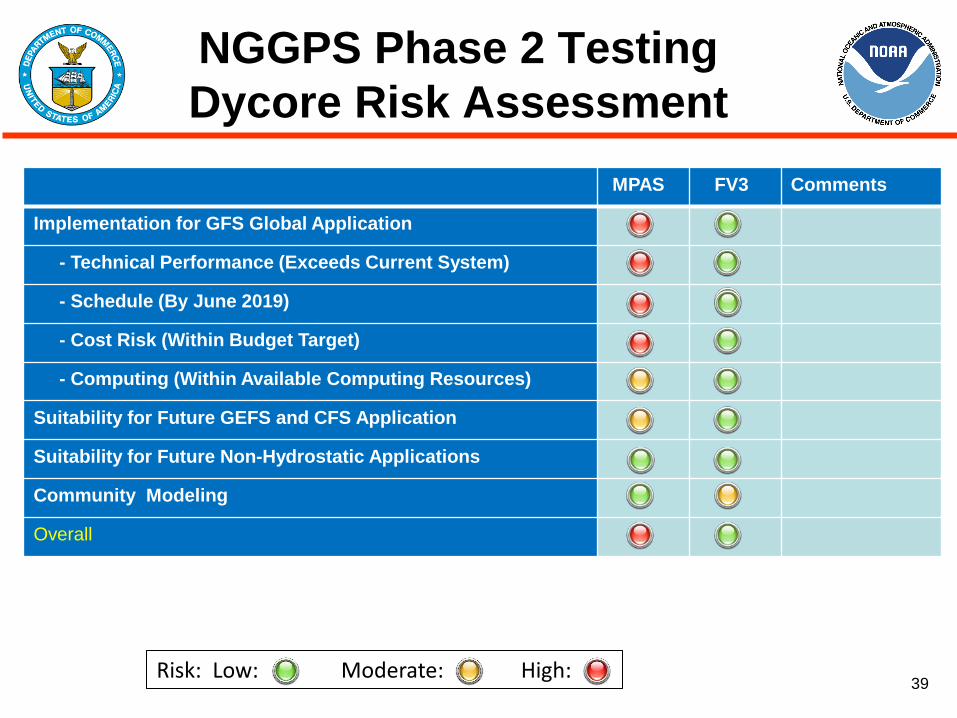
NGGPS Phase 2 Testing
Dycore Risk Assessment
MPAS FV3 Comments
Implementation for GFS Global Application
- Technical Performance (Exceeds Current System)
- Schedule (By June 2019)
- Cost Risk (Within Budget Target)
- Computing (Within Available Computing Resources)
Suitability for Future GEFS and CFS Application
Suitability for Future Non-Hydrostatic Applications
Community Modeling
Overall
Risk: Low: Moderate: High:
40
DTG Assessment
The overarching goal of NGGPS is to develop the World’s best global
numerical weather prediction guidance. FV3's heritage in global
applications is a strength, and the test results suggest that FV3 can have
cost effective, positive impacts on global products in a relatively short
amount of time. The test results have not revealed any deficiencies with
FV3 to preclude the representation of convective storms. For MPAS, the
test results suggest that the extension to NCEP's global application suite
will require more time to provide comparable product quality and the
computational costs will be higher.
– Statement of DTG
41
Summary and Conclusions
• The FV3 Core represents the lowest risk, lowest cost alternative for the new
NGGPS atmospheric model
• Adopting FV3 core brings with it a dynamic, vibrant community
– GFDL is a world-class organization in Global Modeling Applications for
Weather and Climate
– GFDL is a willing partner to the NWS in advancing operational Global
weather modeling applications
– Other Agencies/Entities using Finite Volume Core include NCAR
(CESM), NASA (GEOS/GISS), Harvard (GEOS-Chem), Columbia Univ.
(pollution studies), U. of Washington (Dale Durran), Chinese Academy
of Sciences (IAP), Germany (ECHAM5), Japan (MIROC)
• Integration of FV3 with Common Community Physics Package and GMTB
can support interaction with convective weather modeling community
• From the beginning, the NGGPS strategy has been to find and implement
the best global model (unification at regional scales/picking the best
convective model, while desirable, has not been an objective of NGGPS)
– Nothing in results precludes eventual global-regional unification based
on FV3
42
DTG Findings
Implementation of the FV3 core into the Global Forecast
System to replace the Global Spectral Model represents a
high-quality, cost-effective, low-risk option towards
implementing a new NGGPS global forecast model
• Compared to the MPAS, FV3:
– Meets all technical needs
– Less expensive to implement
– Higher readiness for implementation
– Significantly better technical and computational
performance
– Lower risk
43
Phase 2 Test Results
• Information on NGGPS dycore testing is available at: http://www.weather.gov/sti/stimodeling_nggps_implementation_atmdynamics
– Testing results will be made public at this site as available and on approval by
the DTG/Program Manager

44
Questions?
NGGPS Website: http://www.weather.gov/sti/stimodeling_nggps
45
Back-Up Slides
46 46
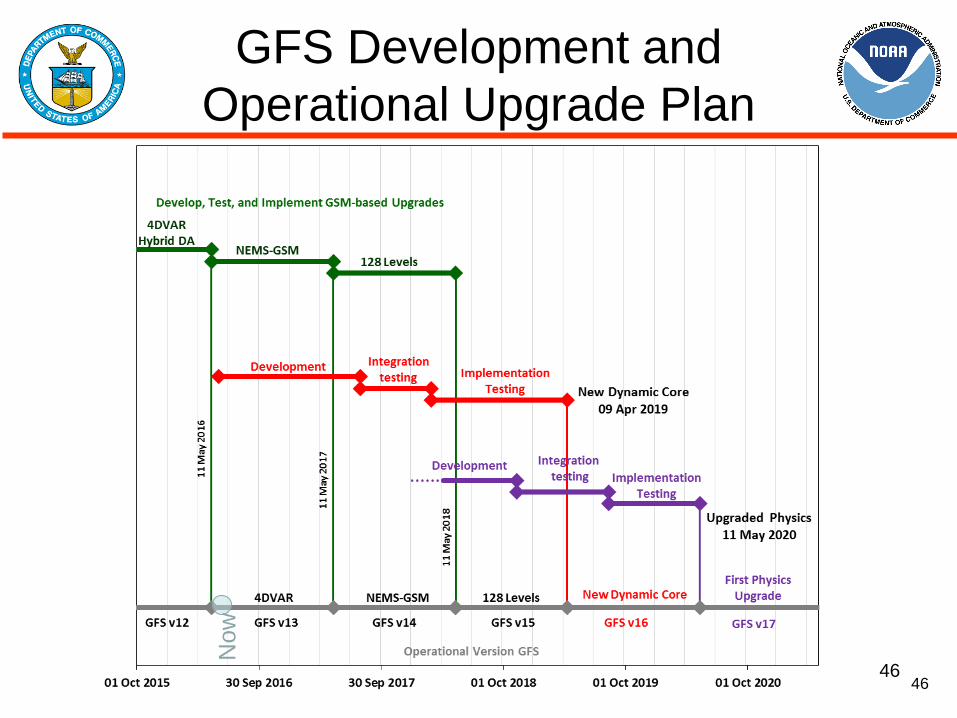
GFS Development and
Operational Upgrade Plan
Now
47
Detailed Phase 2 Test Results
48
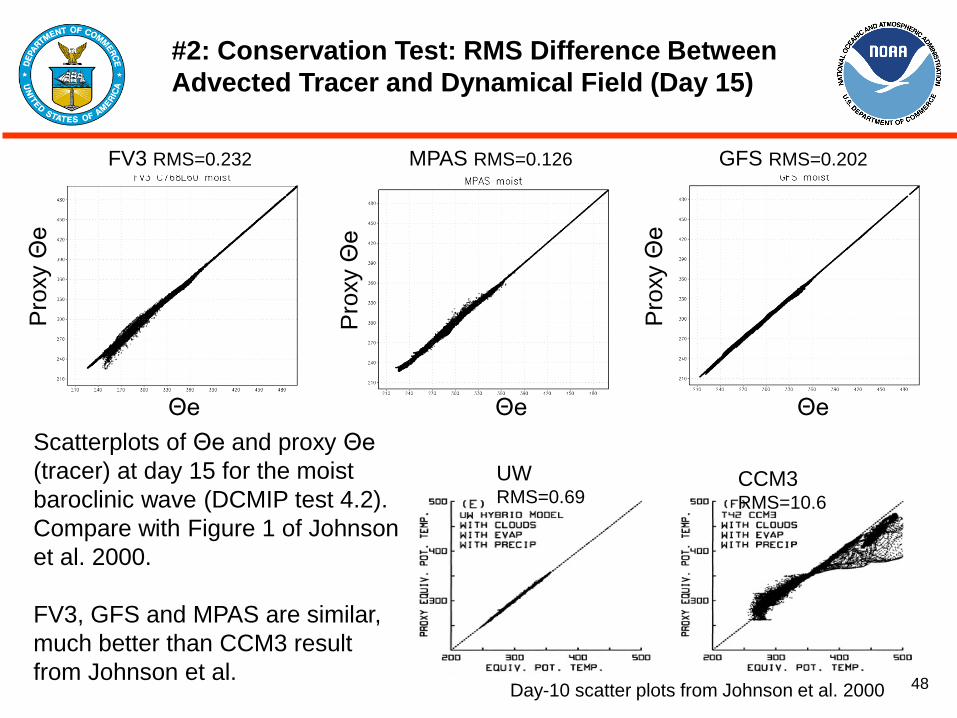
Scatterplots of Θe and proxy Θe
(tracer) at day 15 for the moist
baroclinic wave (DCMIP test 4.2).
Compare with Figure 1 of Johnson
et al. 2000.
FV3, GFS and MPAS are similar,
much better than CCM3 result
from Johnson et al.
Θe
Pro
xy Θ
e
Pro
xy Θ
e
#2: Conservation Test: RMS Difference Between
Advected Tracer and Dynamical Field (Day 15)
MPAS RMS=0.126 FV3 RMS=0.232 GFS RMS=0.202
Θe Θe
Pro
xy Θ
e
Day-10 scatter plots from Johnson et al. 2000
UW
RMS=0.69 CCM3
RMS=10.6
49
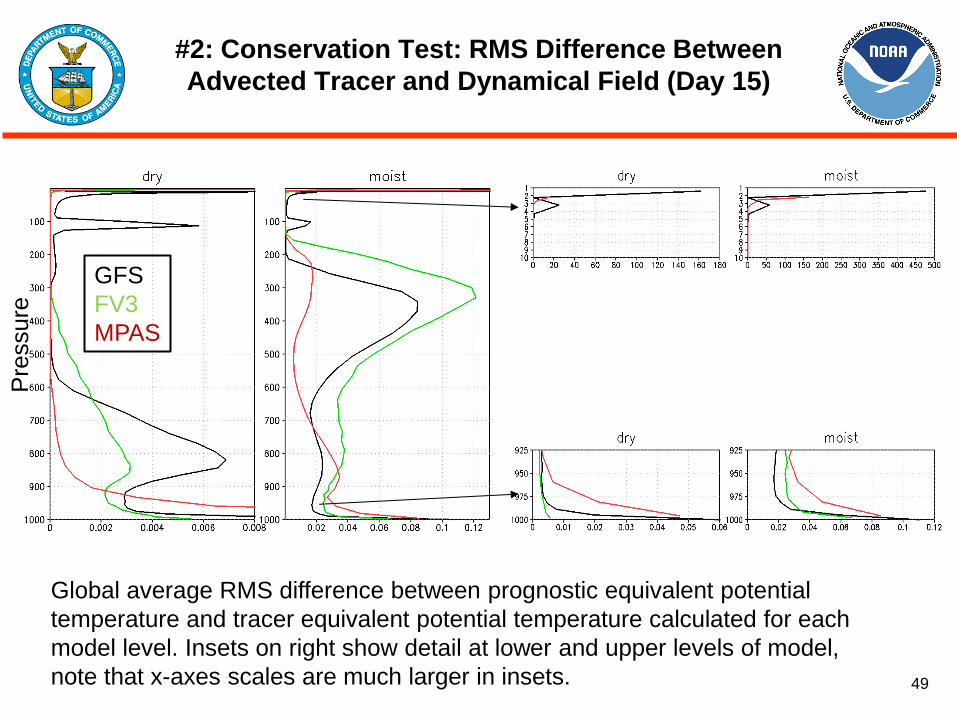
#2: Conservation Test: RMS Difference Between
Advected Tracer and Dynamical Field (Day 15)
GFS
FV3
MPAS
Global average RMS difference between prognostic equivalent potential
temperature and tracer equivalent potential temperature calculated for each
model level. Insets on right show detail at lower and upper levels of model,
note that x-axes scales are much larger in insets.
Pre
ssure
50
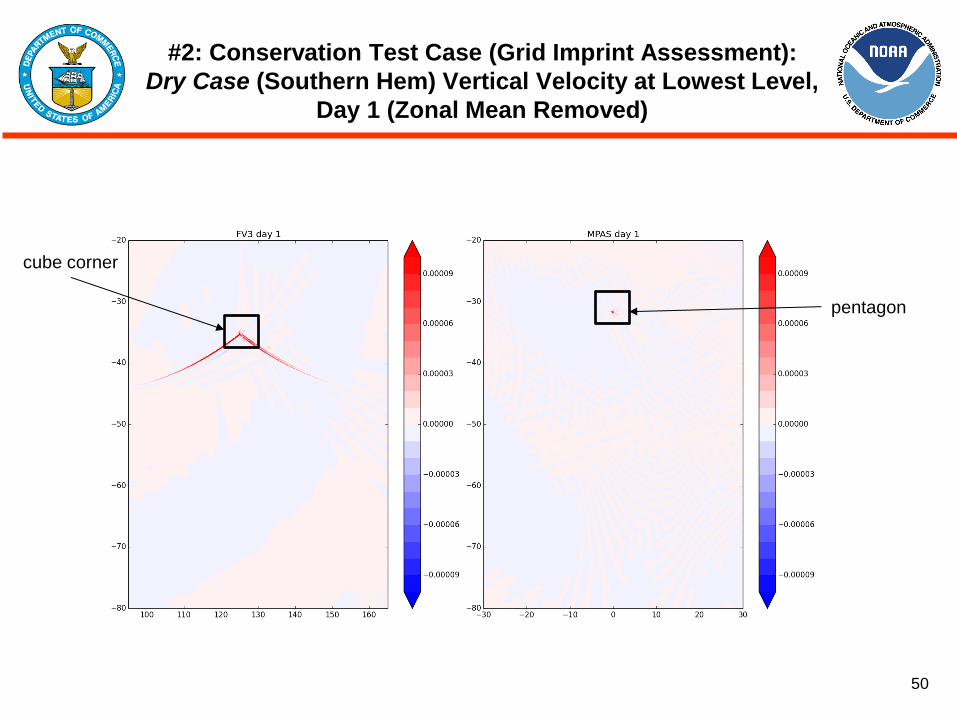
#2: Conservation Test Case (Grid Imprint Assessment):
Dry Case (Southern Hem) Vertical Velocity at Lowest Level,
Day 1 (Zonal Mean Removed)
cube corner
pentagon
51
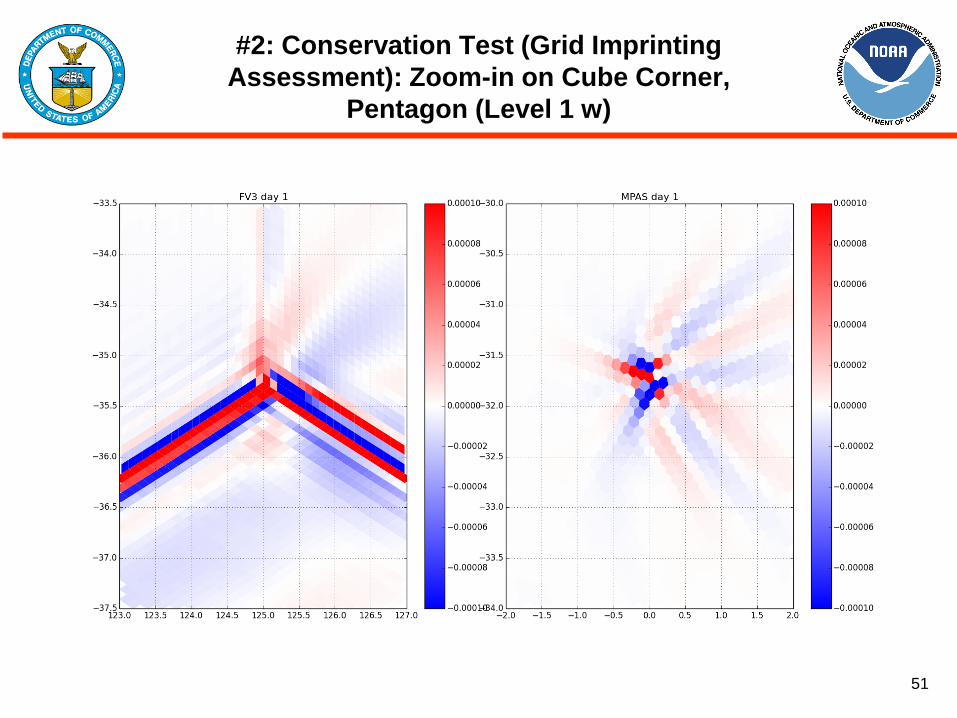
#2: Conservation Test (Grid Imprinting
Assessment): Zoom-in on Cube Corner,
Pentagon (Level 1 w)
52
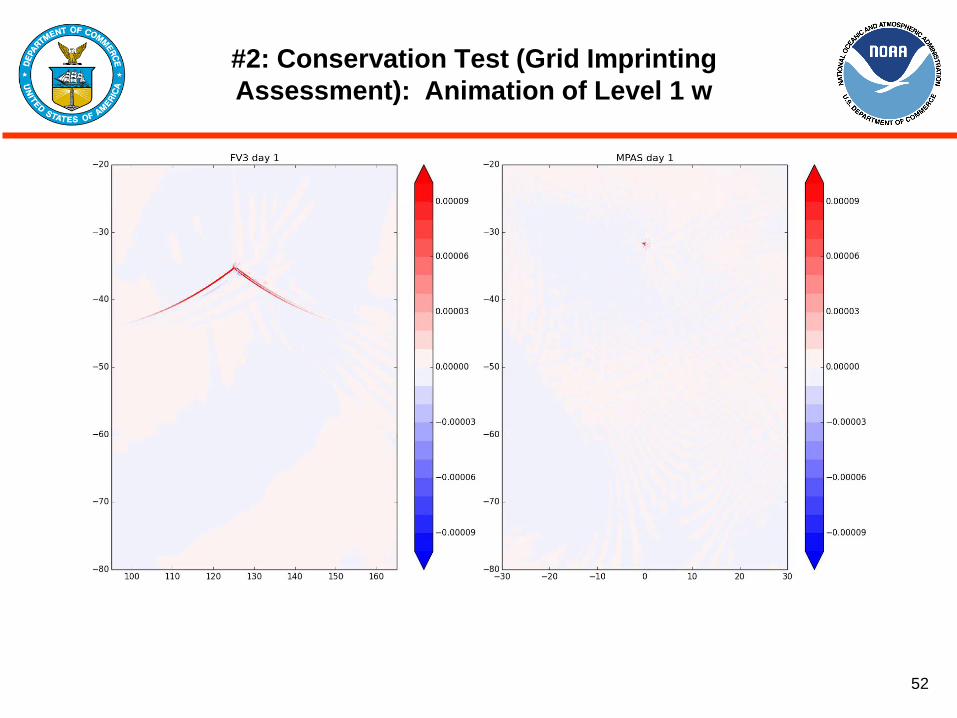
#2: Conservation Test (Grid Imprinting
Assessment): Animation of Level 1 w

53
#4: Performance Benchmark
Results: Estimated Spectral Slope
54
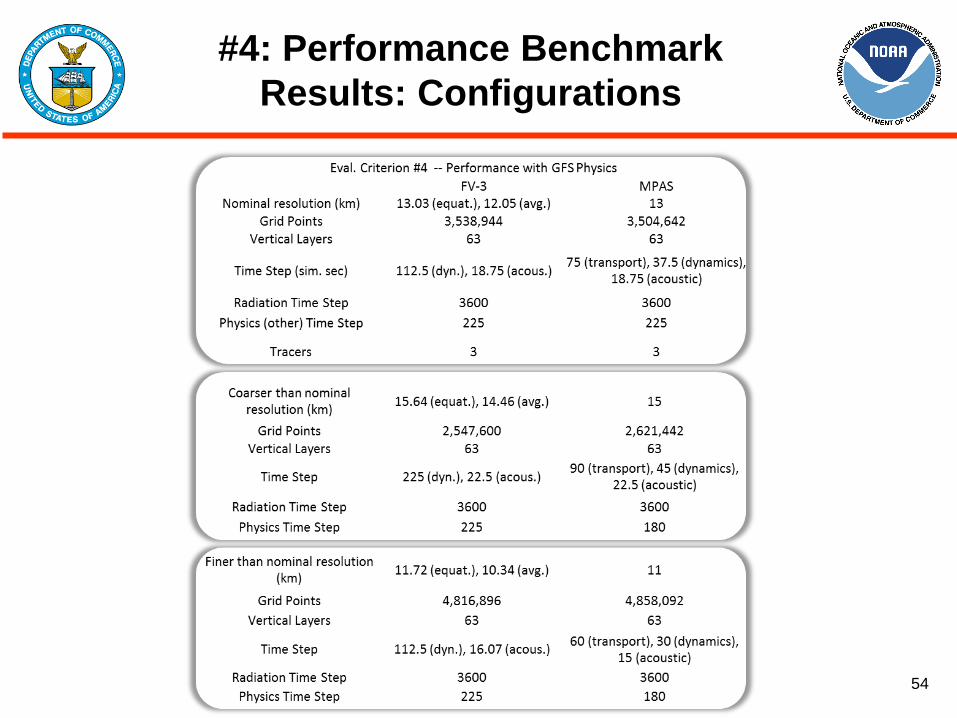
#4: Performance Benchmark
Results: Configurations
55
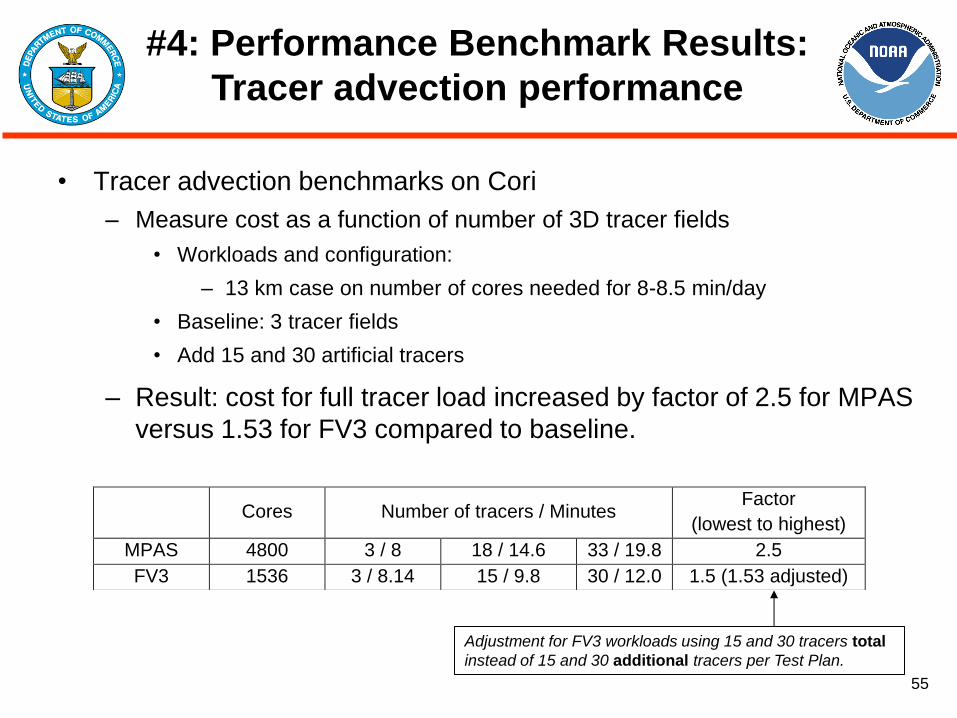
• Tracer advection benchmarks on Cori
– Measure cost as a function of number of 3D tracer fields
• Workloads and configuration:
– 13 km case on number of cores needed for 8-8.5 min/day
• Baseline: 3 tracer fields
• Add 15 and 30 artificial tracers
– Result: cost for full tracer load increased by factor of 2.5 for MPAS
versus 1.53 for FV3 compared to baseline.
#4: Performance Benchmark Results:
Tracer advection performance
Cores Number of tracers / Minutes Factor
(lowest to highest)
MPAS 4800 3 / 8 18 / 14.6 33 / 19.8 2.5
FV3 1536 3 / 8.14 15 / 9.8 30 / 12.0 1.5 (1.53 adjusted)
Adjustment for FV3 workloads using 15 and 30 tracers total
instead of 15 and 30 additional tracers per Test Plan.
56
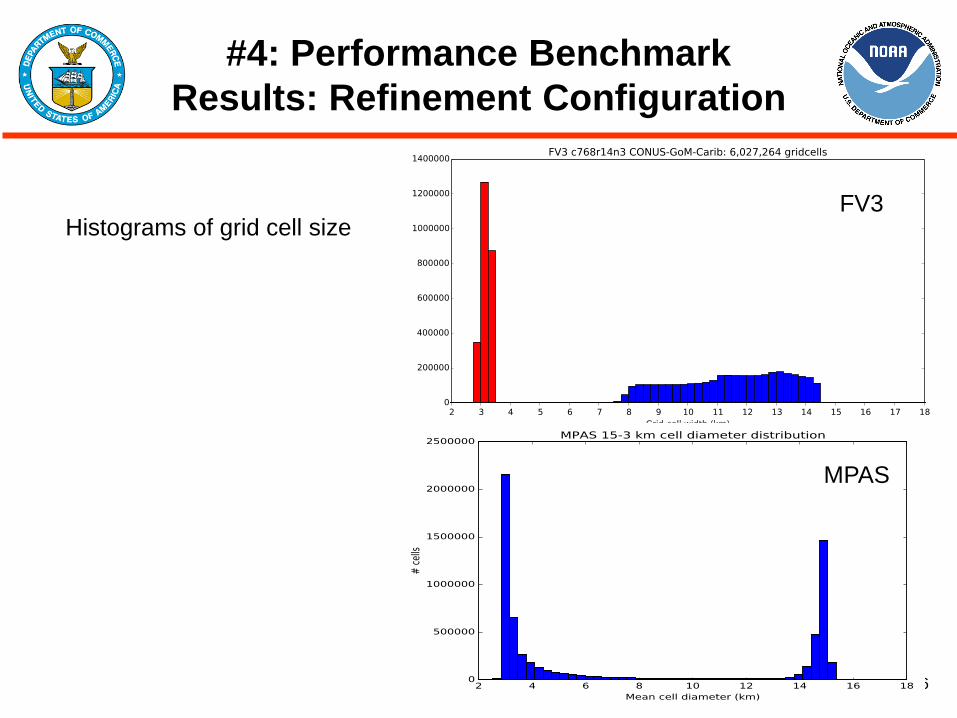
#4: Performance Benchmark
Results: Refinement Configuration
Histograms of grid cell size
FV3
MPAS
57
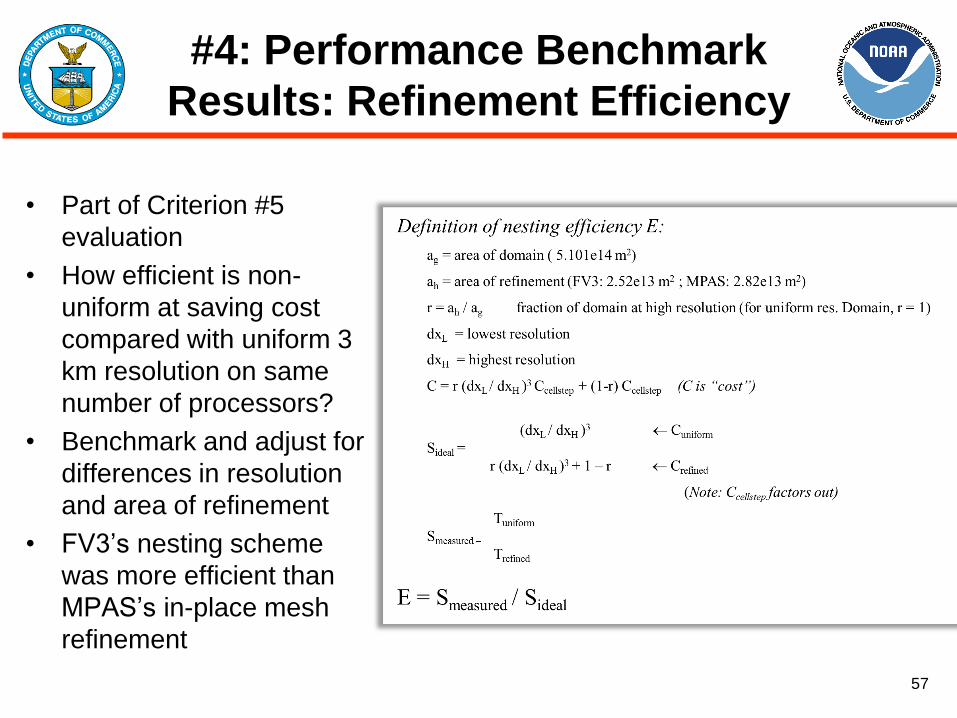
#4: Performance Benchmark
Results: Refinement Efficiency
• Part of Criterion #5
evaluation
• How efficient is non-
uniform at saving cost
compared with uniform 3
km resolution on same
number of processors?
• Benchmark and adjust for
differences in resolution
and area of refinement
• FV3’s nesting scheme
was more efficient than
MPAS’s in-place mesh
refinement
58
#4: Performance Benchmark Results:
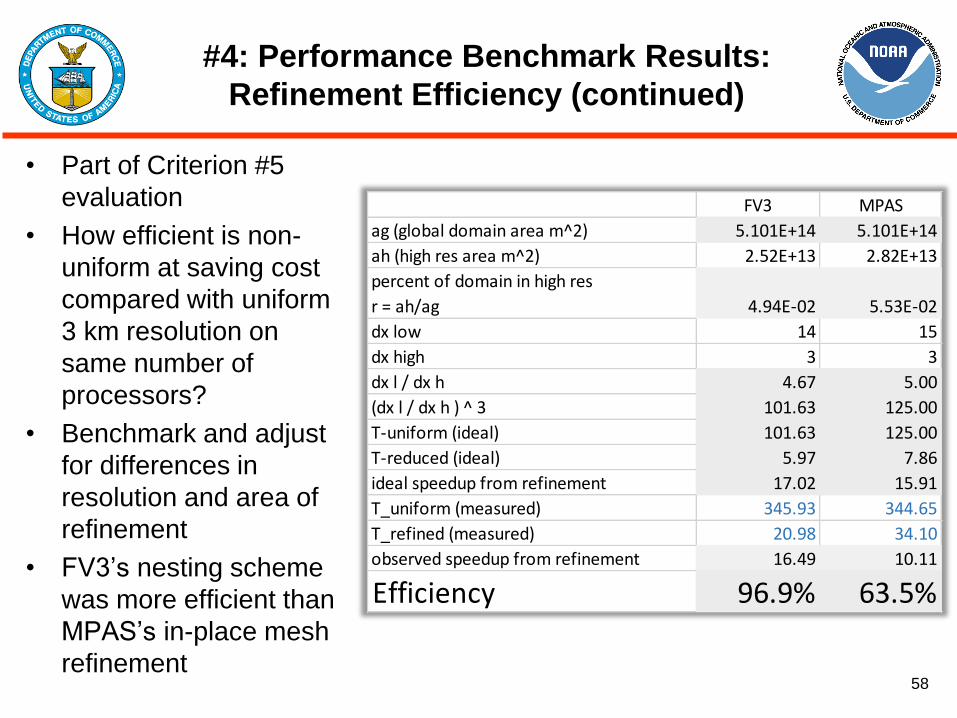
Refinement Efficiency (continued)
• Part of Criterion #5
evaluation
• How efficient is non-
uniform at saving cost
compared with uniform
3 km resolution on
same number of
processors?
• Benchmark and adjust
for differences in
resolution and area of
refinement
• FV3’s nesting scheme
was more efficient than
MPAS’s in-place mesh
refinement
FV3 MPAS
ag (global domain area m^2) 5.101E+14 5.101E+14
ah (high res area m^2) 2.52E+13 2.82E+13
percent of domain in high res
r = ah/ag 4.94E-02 5.53E-02
dx low 14 15
dx high 3 3
dx l / dx h 4.67 5.00
(dx l / dx h ) ^ 3 101.63 125.00
T-uniform (ideal) 101.63 125.00
T-reduced (ideal) 5.97 7.86
ideal speedup from refinement 17.02 15.91
T_uniform (measured) 345.93 344.65
T_refined (measured) 20.98 34.10
observed speedup from refinement 16.49 10.11
Efficiency 96.9% 63.5%
59
#5: Modifications to Phase 1 Supercell
Test Case Configuration
• MPAS
– Disable vertical diffusion
– Set Prandtl number to 1 (so that horizontal diffusion coefficient is same for all variables)
– Physics timestep same as large RK step
– Large RK step set to 3,6,12,24 seconds for 500m,1km,2km,4km resolutions
– Number of acoustic timesteps per large RK step set to 6 in all cases
• FV3
– Disable Smagorinsky diffusion by setting dddmp=0
– Disable monotonic horizontal transport
– Turn on 2nd order horizontal diffusion of tracers (using inline_q=.T. to ensure that tracers are integrated on the same time step as other prognostic variables)
– Physics timestep set to 20,20,20,25 secs for 500m,1km,2km,4km resolutions
– Number of vertical remaps per physics timestep (k_split) set to 8,5,2,1 for 500m,1km,2km,4km resolutions
– Number of acoustic time steps per vertical remap (n_split) set to 5 in all cases
• With these mods, both models use constant 2nd order horizontal diffusion for all variables, no vertical diffusion. A horizontal diffusion coefficient of 2000 m2/s is used, since it appears to produce a converged solution at 500 m for both models.
60
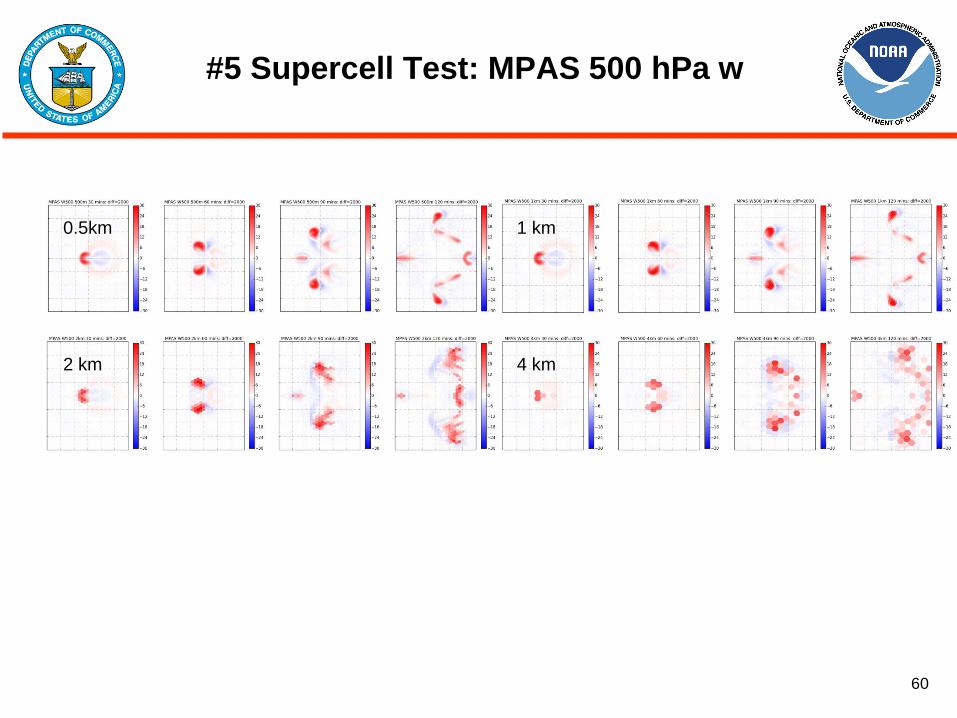
#5 Supercell Test: MPAS 500 hPa w
0.5km 1 km
2 km 4 km
61
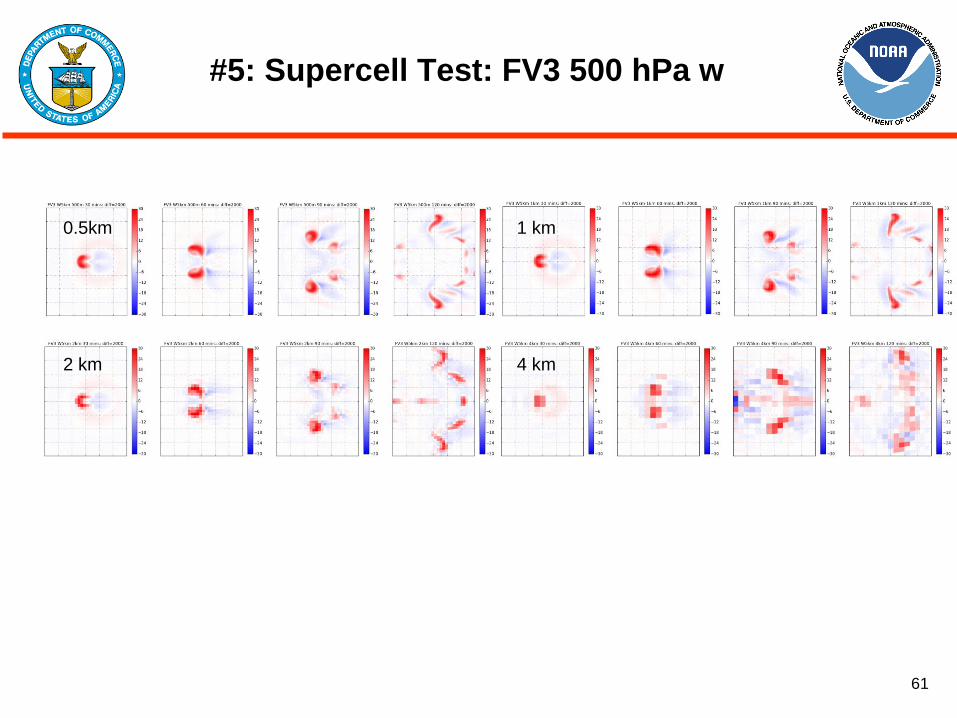
#5: Supercell Test: FV3 500 hPa w
0.5km 1 km
2 km 4 km
62
#5: Idealized TC Test MSLP (Black Lines), 500hPa Vertical Velocity (color, m/s)
FV3 as originally configured has a huge eye (left); removing the vertical 2dz filter
produced a much smaller, more realistic storm structure (right).
63
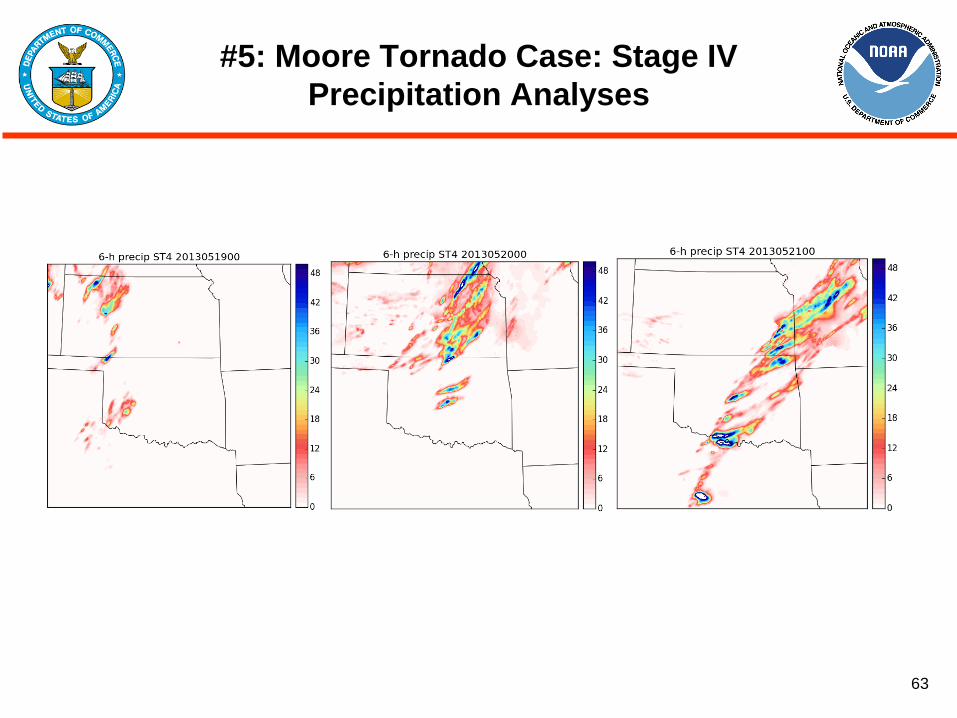
#5: Moore Tornado Case: Stage IV
Precipitation Analyses
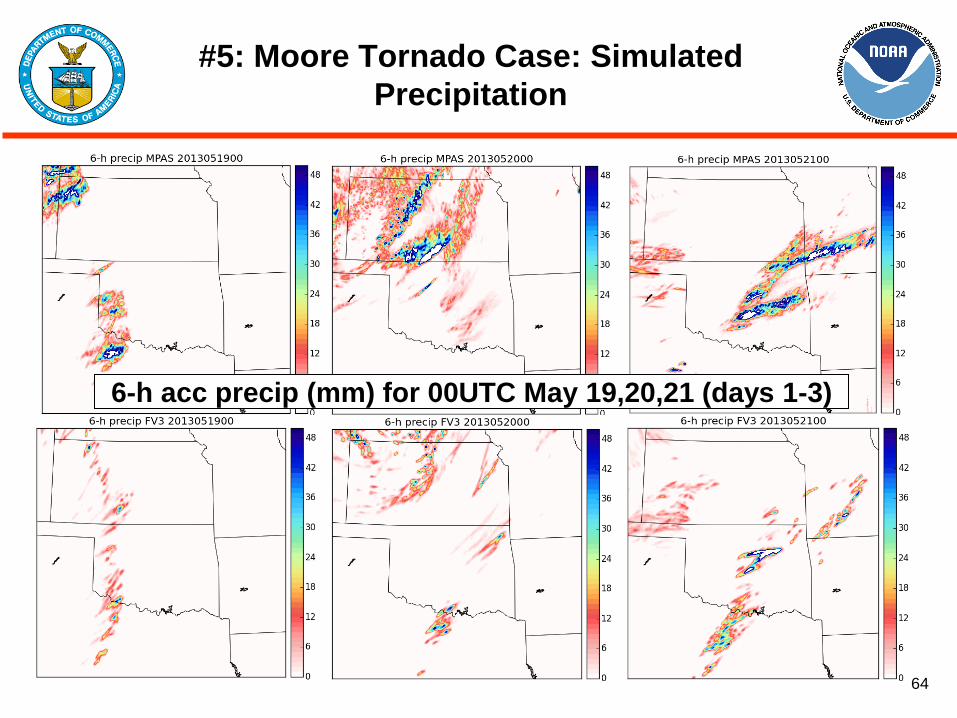
64
6-h acc precip (mm) for 00UTC May 19,20,21 (days 1-3)
#5: Moore Tornado Case: Simulated
Precipitation
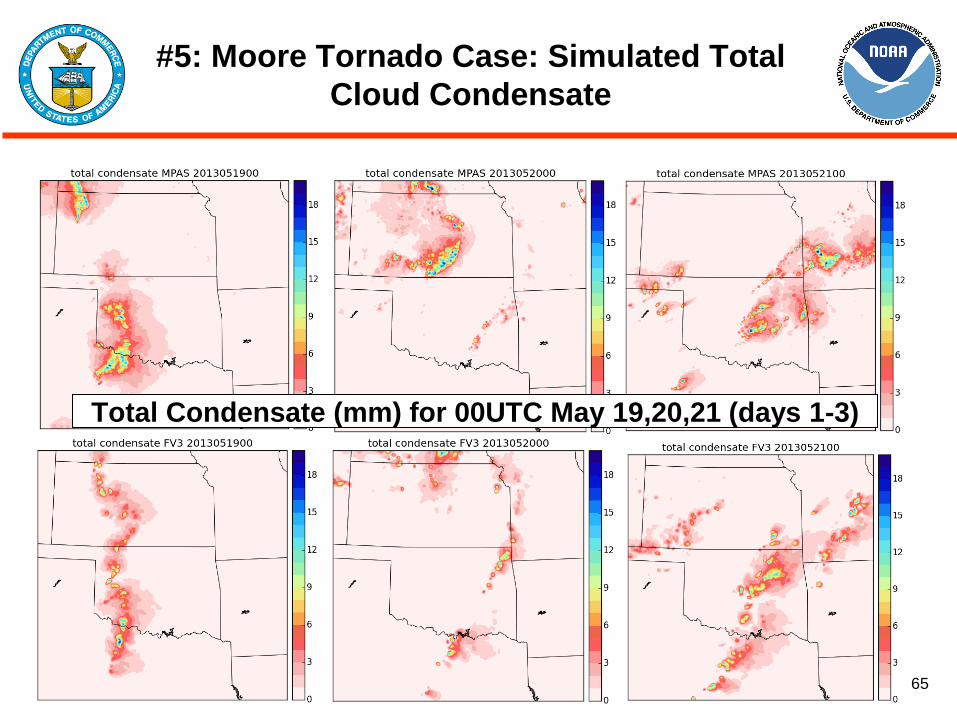
65
Total Condensate (mm) for 00UTC May 19,20,21 (days 1-3)
#5: Moore Tornado Case: Simulated Total
Cloud Condensate
66
Phase 1 Test and Evaluation
67
Selecting a New Operational
Atmospheric Dynamic Core
• Evaluate, select and implement a replacement to current Global
Spectral Model
• Parallel efforts initiated at UKMO and ECMWF
• Next-Generation computing paradigm will require scaling across
potentially 100,000’s processors or more
• Candidate dynamic core testing is being conducted in two
phases
68
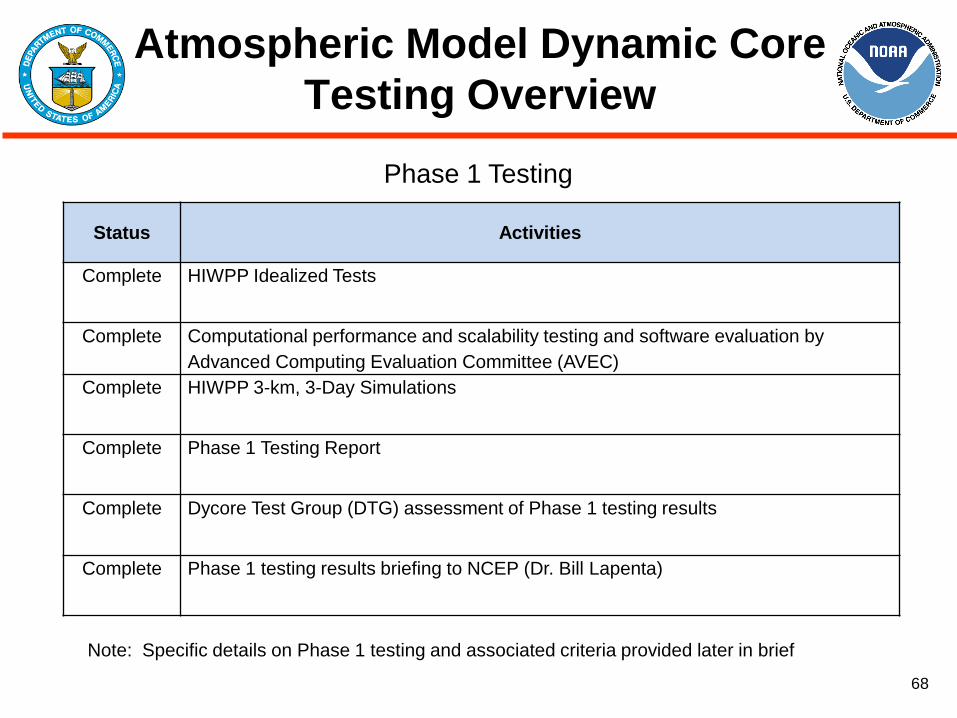
Atmospheric Model Dynamic Core
Testing Overview
Status Activities
Complete HIWPP Idealized Tests
Complete Computational performance and scalability testing and software evaluation by
Advanced Computing Evaluation Committee (AVEC)
Complete HIWPP 3-km, 3-Day Simulations
Complete Phase 1 Testing Report
Complete Dycore Test Group (DTG) assessment of Phase 1 testing results
Complete Phase 1 testing results briefing to NCEP (Dr. Bill Lapenta)
Note: Specific details on Phase 1 testing and associated criteria provided later in brief
Phase 1 Testing
69
NGGPS Phase 1 Testing
• AVEC
– Benchmarks Testing
– Software Evaluation
• HIWPP
– Idealized Tests
– 3-km, 3-Day Simulations
Incorporated Non-hydrostatic Dynamic Core Testing from HIWPP
70
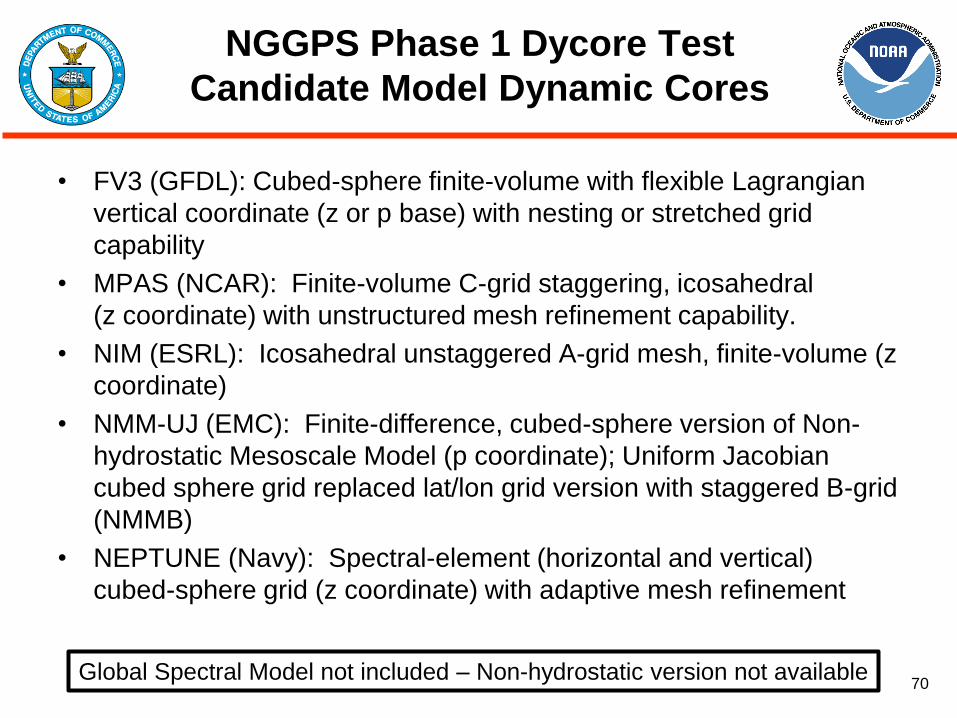
NGGPS Phase 1 Dycore Test
Candidate Model Dynamic Cores
• FV3 (GFDL): Cubed-sphere finite-volume with flexible Lagrangian
vertical coordinate (z or p base) with nesting or stretched grid
capability
• MPAS (NCAR): Finite-volume C-grid staggering, icosahedral
(z coordinate) with unstructured mesh refinement capability.
• NIM (ESRL): Icosahedral unstaggered A-grid mesh, finite-volume (z
coordinate)
• NMM-UJ (EMC): Finite-difference, cubed-sphere version of Non-
hydrostatic Mesoscale Model (p coordinate); Uniform Jacobian
cubed sphere grid replaced lat/lon grid version with staggered B-grid
(NMMB)
• NEPTUNE (Navy): Spectral-element (horizontal and vertical)
cubed-sphere grid (z coordinate) with adaptive mesh refinement
Global Spectral Model not included – Non-hydrostatic version not available
71
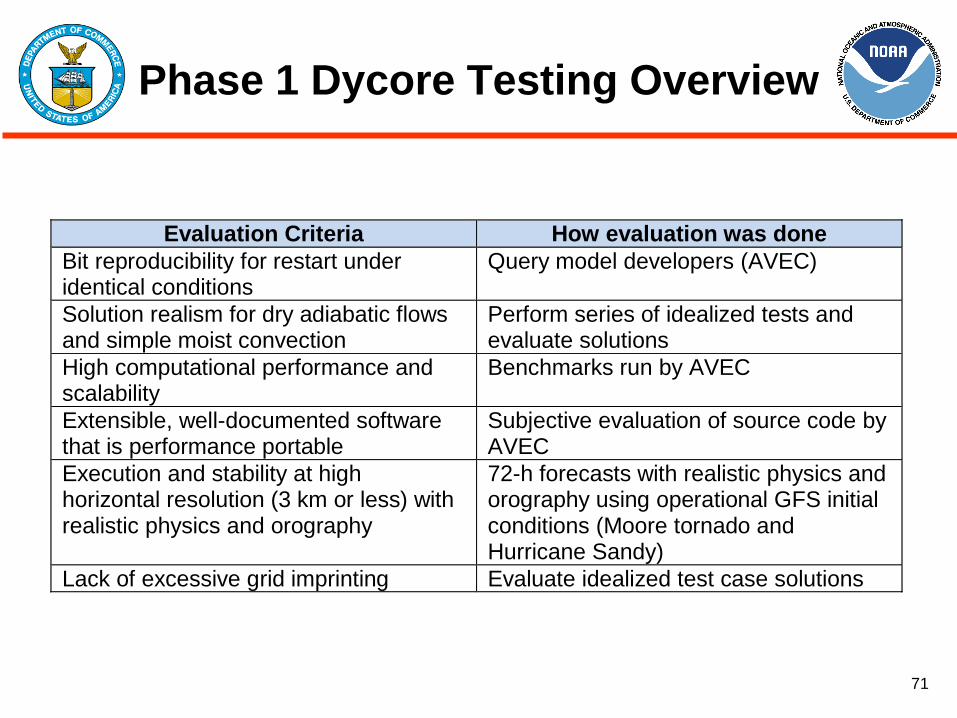
Phase 1 Dycore Testing Overview
Evaluation Criteria How evaluation was done
Bit reproducibility for restart under identical conditions
Query model developers (AVEC)
Solution realism for dry adiabatic flows and simple moist convection
Perform series of idealized tests and evaluate solutions
High computational performance and scalability
Benchmarks run by AVEC
Extensible, well-documented software that is performance portable
Subjective evaluation of source code by AVEC
Execution and stability at high horizontal resolution (3 km or less) with realistic physics and orography
72-h forecasts with realistic physics and orography using operational GFS initial conditions (Moore tornado and Hurricane Sandy)
Lack of excessive grid imprinting Evaluate idealized test case solutions
72
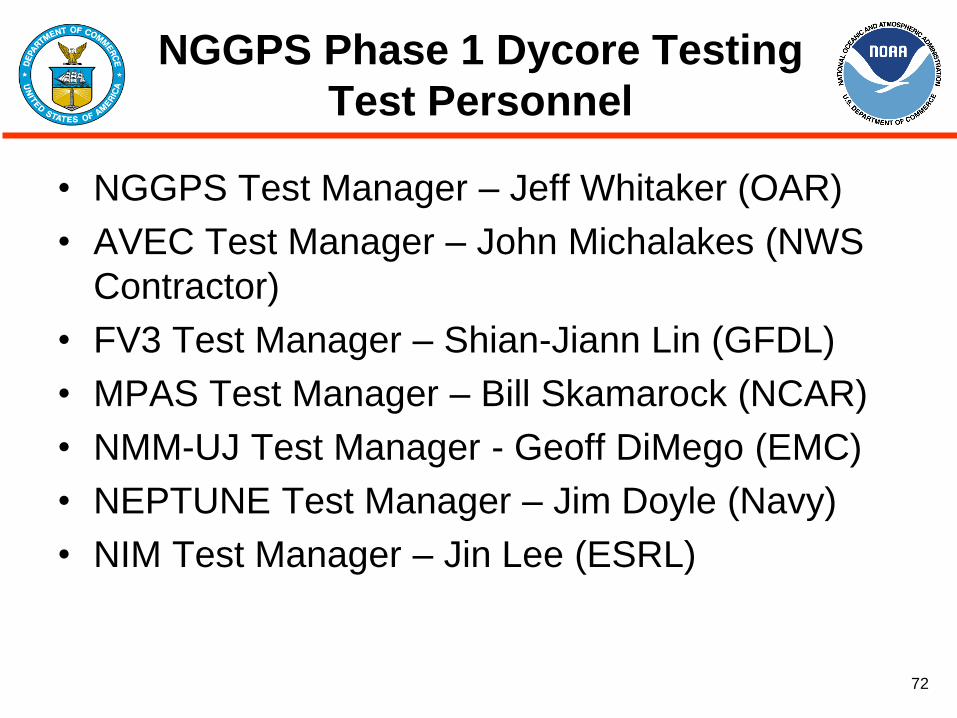
NGGPS Phase 1 Dycore Testing
Test Personnel
• NGGPS Test Manager – Jeff Whitaker (OAR)
• AVEC Test Manager – John Michalakes (NWS
Contractor)
• FV3 Test Manager – Shian-Jiann Lin (GFDL)
• MPAS Test Manager – Bill Skamarock (NCAR)
• NMM-UJ Test Manager - Geoff DiMego (EMC)
• NEPTUNE Test Manager – Jim Doyle (Navy)
• NIM Test Manager – Jin Lee (ESRL)
73
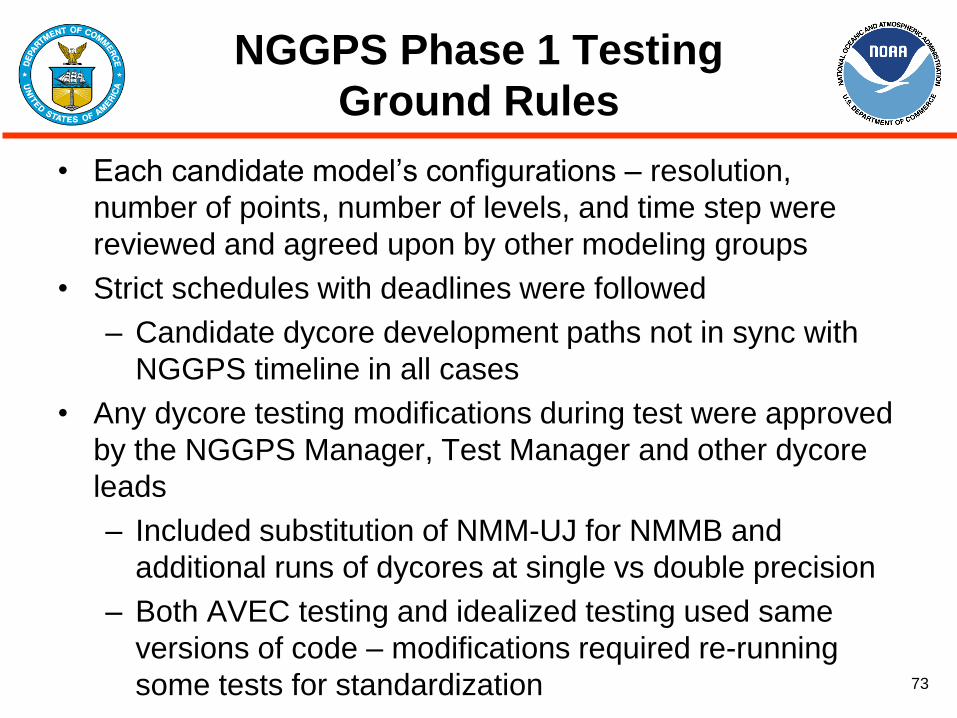
NGGPS Phase 1 Testing
Ground Rules
• Each candidate model’s configurations – resolution,
number of points, number of levels, and time step were
reviewed and agreed upon by other modeling groups
• Strict schedules with deadlines were followed
– Candidate dycore development paths not in sync with
NGGPS timeline in all cases
• Any dycore testing modifications during test were approved
by the NGGPS Manager, Test Manager and other dycore
leads
– Included substitution of NMM-UJ for NMMB and
additional runs of dycores at single vs double precision
– Both AVEC testing and idealized testing used same
versions of code – modifications required re-running
some tests for standardization
74
AVEC Phase 1 Evaluations
75
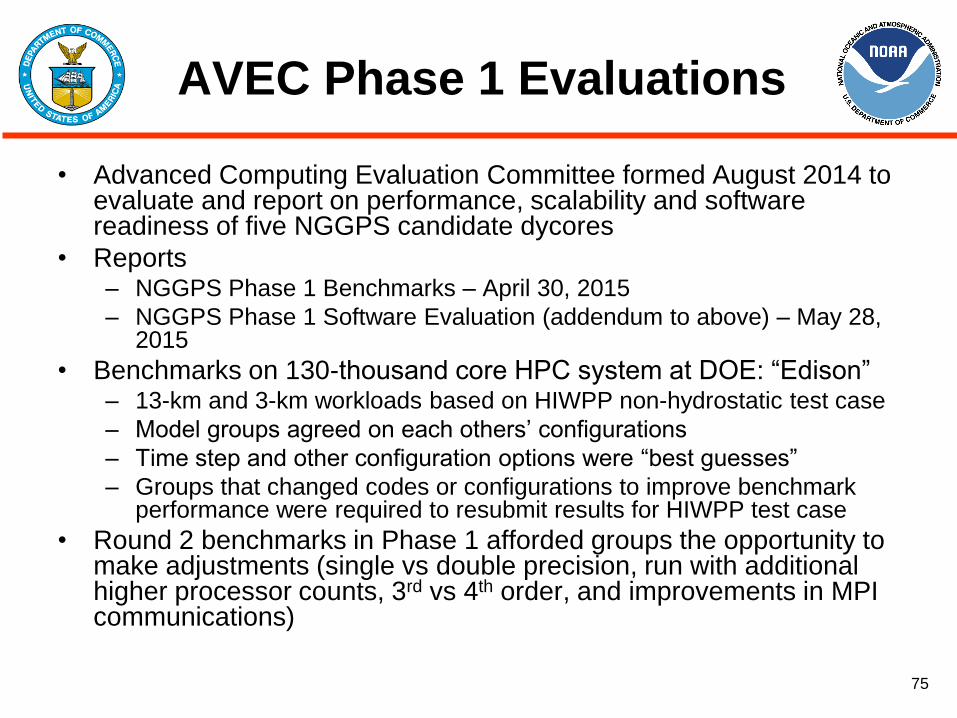
• Advanced Computing Evaluation Committee formed August 2014 to evaluate and report on performance, scalability and software readiness of five NGGPS candidate dycores
• Reports – NGGPS Phase 1 Benchmarks – April 30, 2015
– NGGPS Phase 1 Software Evaluation (addendum to above) – May 28, 2015
• Benchmarks on 130-thousand core HPC system at DOE: “Edison” – 13-km and 3-km workloads based on HIWPP non-hydrostatic test case
– Model groups agreed on each others’ configurations
– Time step and other configuration options were “best guesses”
– Groups that changed codes or configurations to improve benchmark performance were required to resubmit results for HIWPP test case
• Round 2 benchmarks in Phase 1 afforded groups the opportunity to make adjustments (single vs double precision, run with additional higher processor counts, 3rd vs 4th order, and improvements in MPI communications)
AVEC Phase 1 Evaluations
76
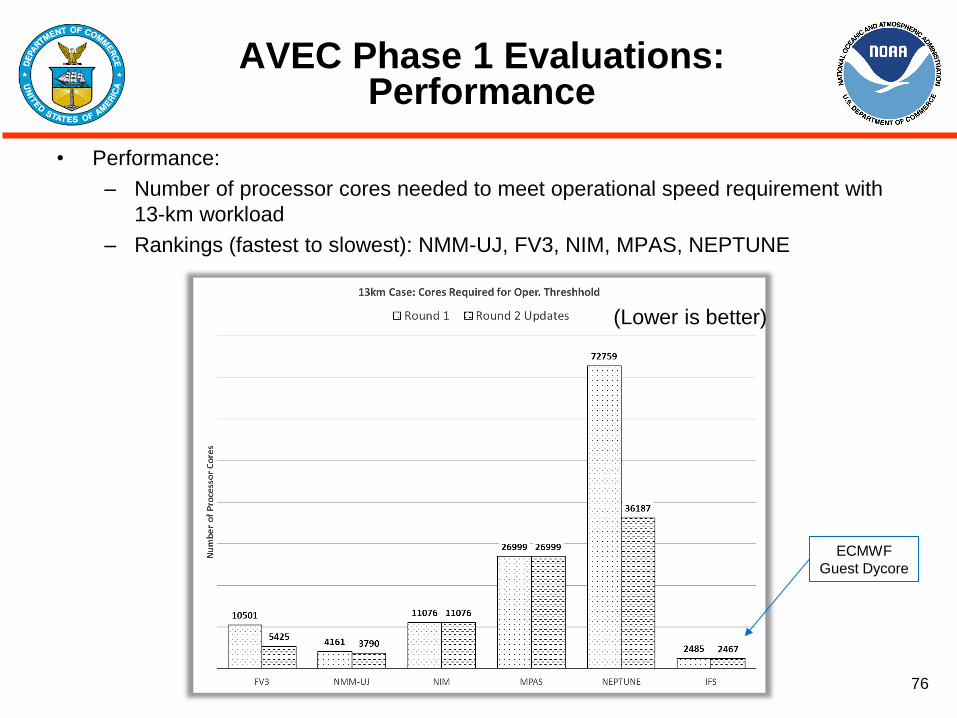
AVEC Phase 1 Evaluations: Performance
• Performance:
– Number of processor cores needed to meet operational speed requirement with
13-km workload
– Rankings (fastest to slowest): NMM-UJ, FV3, NIM, MPAS, NEPTUNE
(Lower is better)
ECMWF
Guest Dycore
77
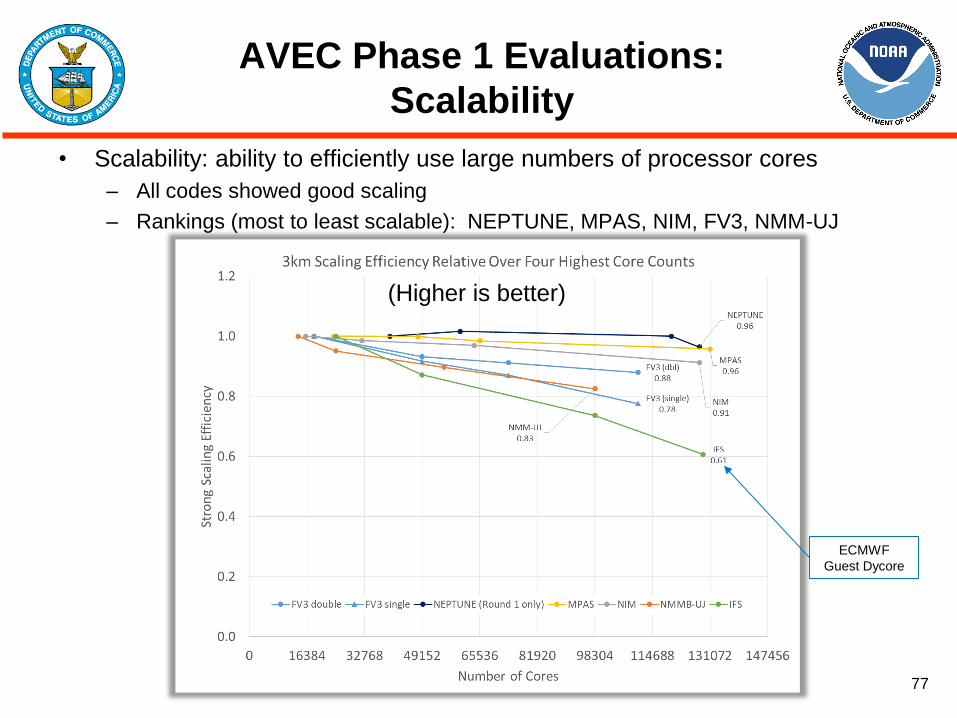
AVEC Phase 1 Evaluations:
Scalability
• Scalability: ability to efficiently use large numbers of processor cores
– All codes showed good scaling
– Rankings (most to least scalable): NEPTUNE, MPAS, NIM, FV3, NMM-UJ
(Higher is better)
ECMWF
Guest Dycore
78
AVEC Phase 1 Evaluations:
Software
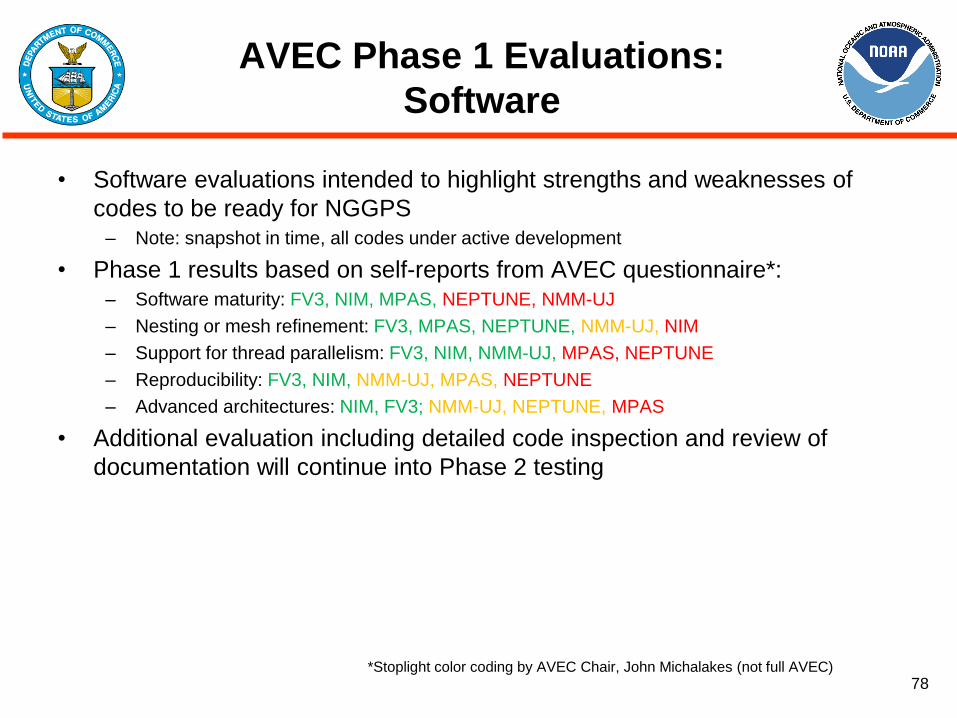
• Software evaluations intended to highlight strengths and weaknesses of
codes to be ready for NGGPS – Note: snapshot in time, all codes under active development
• Phase 1 results based on self-reports from AVEC questionnaire*: – Software maturity: FV3, NIM, MPAS, NEPTUNE, NMM-UJ
– Nesting or mesh refinement: FV3, MPAS, NEPTUNE, NMM-UJ, NIM
– Support for thread parallelism: FV3, NIM, NMM-UJ, MPAS, NEPTUNE
– Reproducibility: FV3, NIM, NMM-UJ, MPAS, NEPTUNE
– Advanced architectures: NIM, FV3; NMM-UJ, NEPTUNE, MPAS
• Additional evaluation including detailed code inspection and review of
documentation will continue into Phase 2 testing
*Stoplight color coding by AVEC Chair, John Michalakes (not full AVEC)
79
HIWPP Tests
Supporting
NGGPS Phase 1 Testing
80
Idealized Tests
• Baroclinic wave test with embedded fronts (DCMIP 4.1)
– Dynamics strongly forces solution to shortest resolvable scales
– Shows impact of truncation error near quasi-singular points on computational grid
(“grid imprinting”)
– 15/30/60/120 km horizontal resolutions with 30 and 60 vertical levels
• Non-hydrostatic mountain waves on a reduced-radius sphere (like DCMIP 2.1/2.2)
– Shows ability to simulate non-hydrostatic gravity waves excited by flow over
orography
– 3 tests: M1 (uniform flow over a ridge-like mountain), M2 (uniform flow over circular
mountain), M3 (vertically sheared flow over a circular mountain). Solutions are all
quasi-linear
• Idealized supercell thunderstorm on a reduced-radius sphere
– Convection is initiated with a warm bubble in a convectively unstable sounding in
vertical shear
– Simple Kessler warm-rain microphysics, free-slip lower boundary (no boundary layer)
– Splitting supercell storms result after 1-2 hours of integration
– 0.5/1/2/4 km horizontal resolutions
81
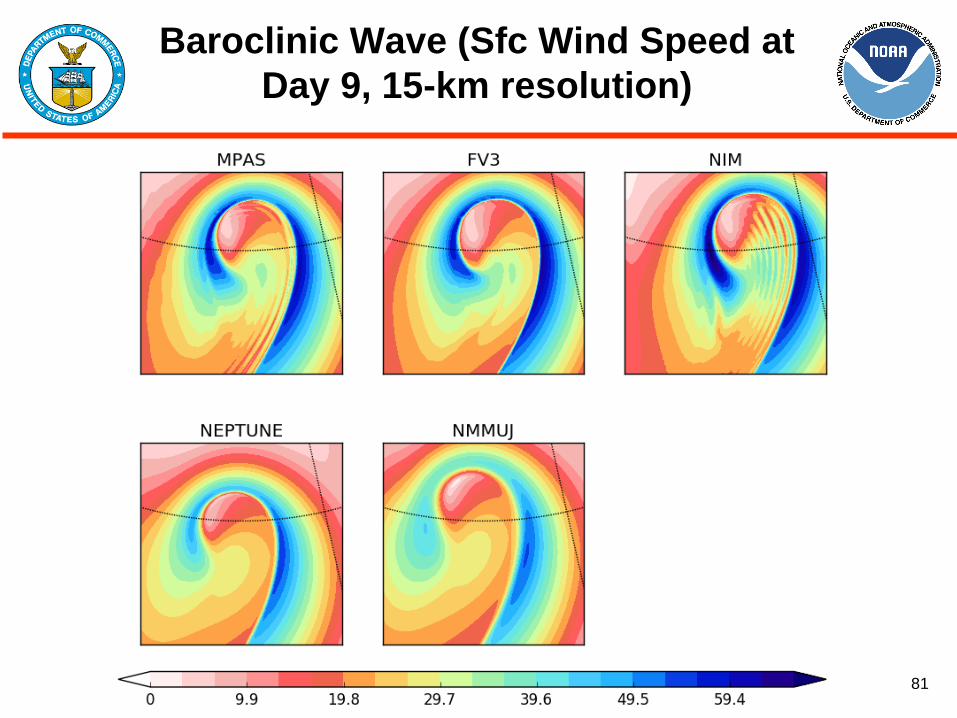
Baroclinic Wave (Sfc Wind Speed at
Day 9, 15-km resolution)
82
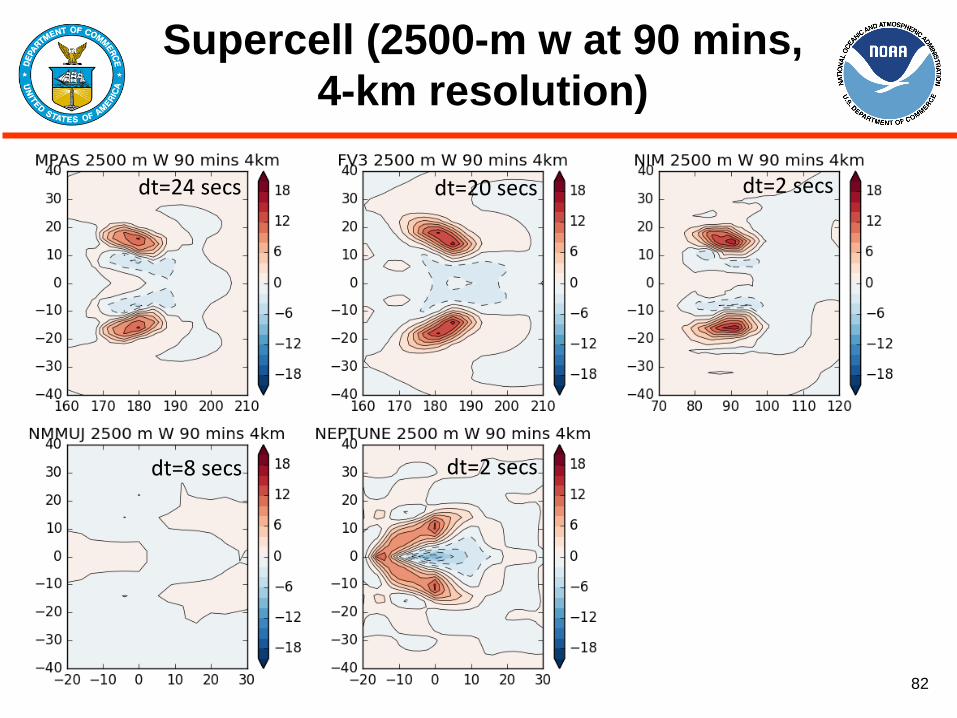
Supercell (2500-m w at 90 mins,
4-km resolution)
dt=24 secs dt=20 secs dt=2 secs
dt=8 secs dt=2 secs
83
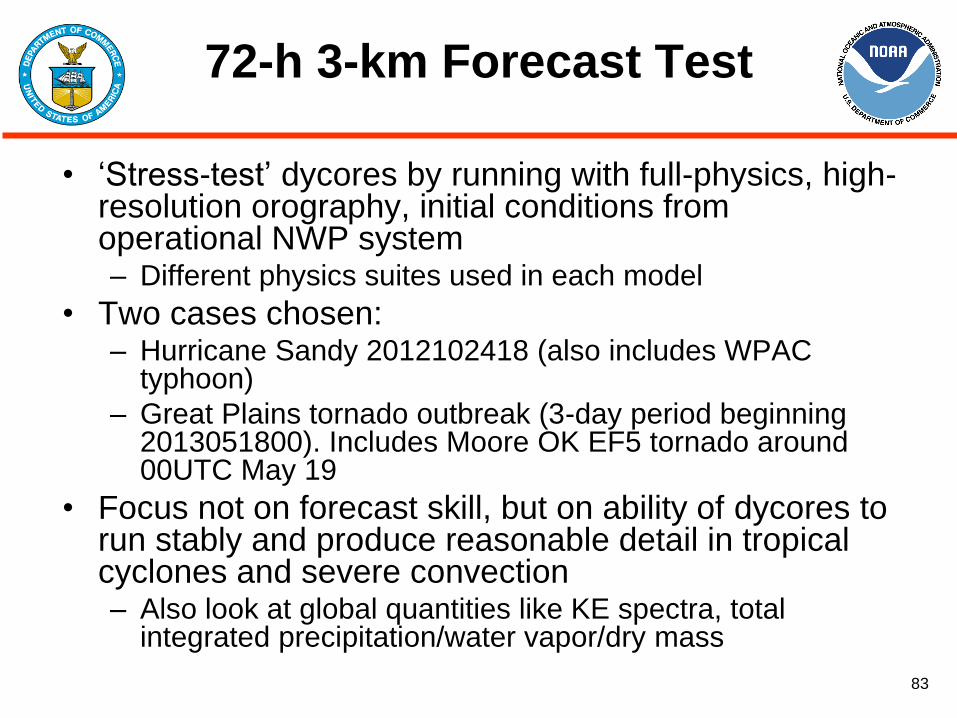
72-h 3-km Forecast Test
• ‘Stress-test’ dycores by running with full-physics, high-resolution orography, initial conditions from operational NWP system – Different physics suites used in each model
• Two cases chosen: – Hurricane Sandy 2012102418 (also includes WPAC
typhoon)
– Great Plains tornado outbreak (3-day period beginning 2013051800). Includes Moore OK EF5 tornado around 00UTC May 19
• Focus not on forecast skill, but on ability of dycores to run stably and produce reasonable detail in tropical cyclones and severe convection – Also look at global quantities like KE spectra, total
integrated precipitation/water vapor/dry mass
84
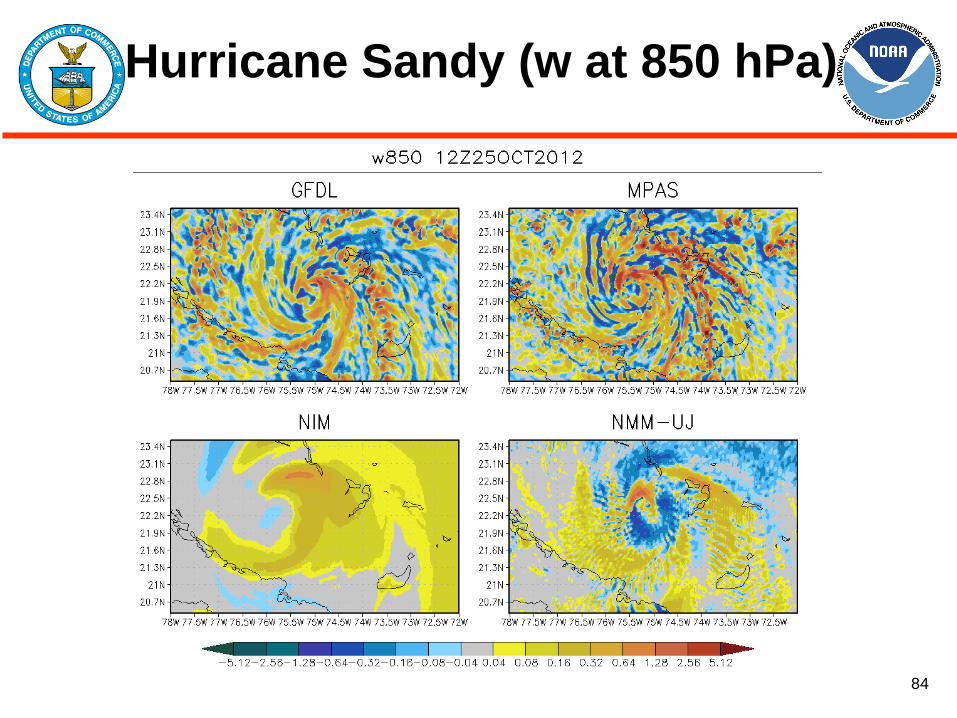
Hurricane Sandy (w at 850 hPa)
85
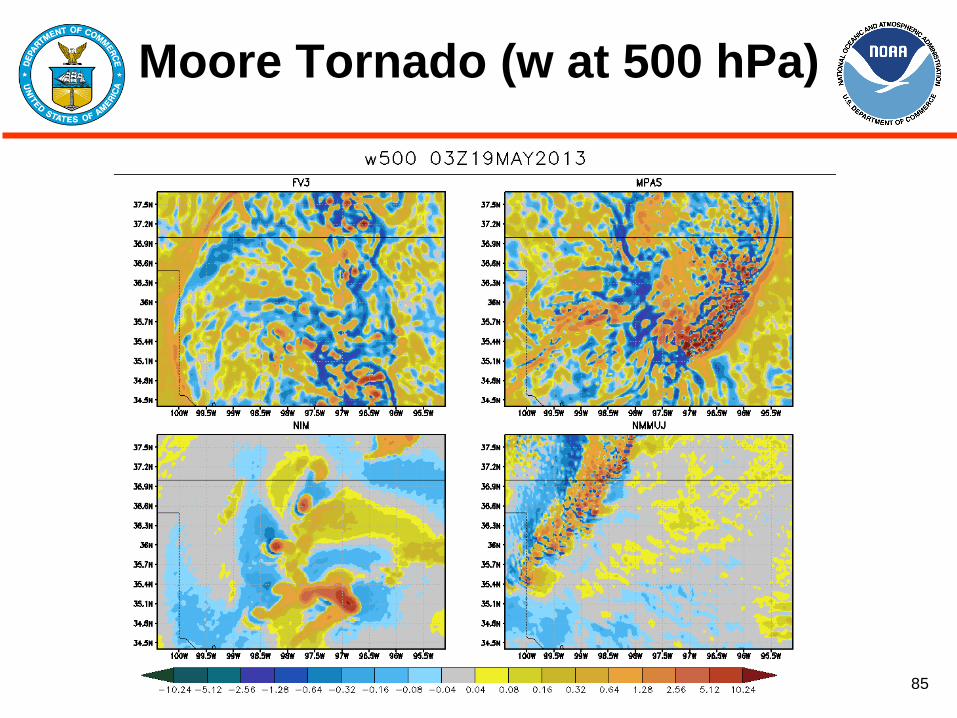
Moore Tornado (w at 500 hPa)
86
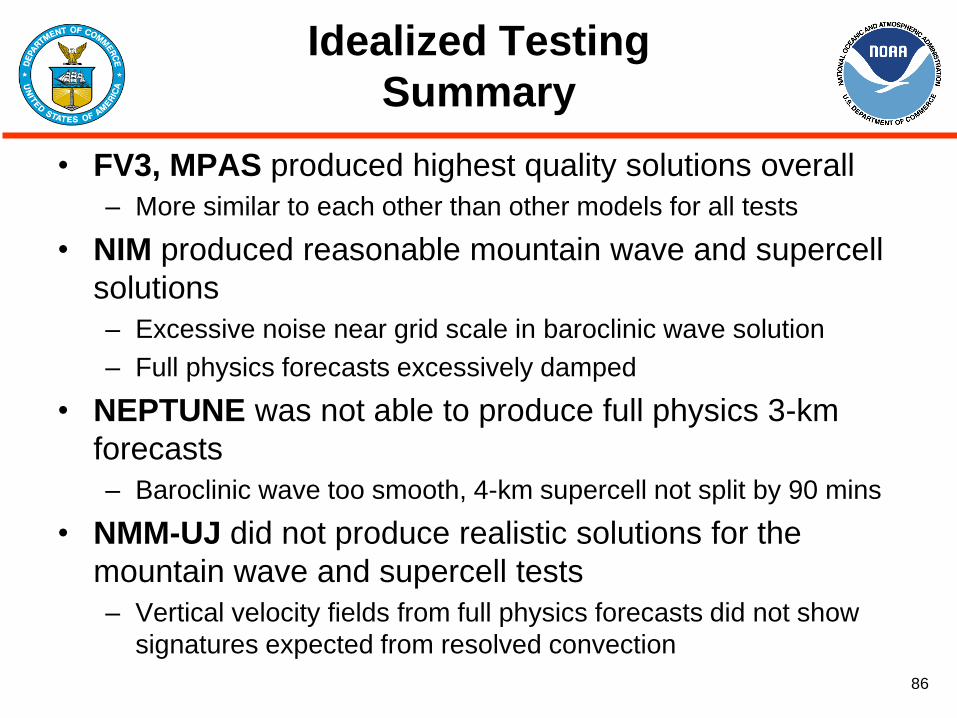
Idealized Testing
Summary
• FV3, MPAS produced highest quality solutions overall
– More similar to each other than other models for all tests
• NIM produced reasonable mountain wave and supercell
solutions
– Excessive noise near grid scale in baroclinic wave solution
– Full physics forecasts excessively damped
• NEPTUNE was not able to produce full physics 3-km
forecasts
– Baroclinic wave too smooth, 4-km supercell not split by 90 mins
• NMM-UJ did not produce realistic solutions for the
mountain wave and supercell tests
– Vertical velocity fields from full physics forecasts did not show
signatures expected from resolved convection
87
Dycore Test Group (DTG)
Membership
• Chair: Ming Ji (Director, Office of Science and
Technology Integration)
• Fred Toepfer (NGGPS Program Manager)
• Bob Gall, Ricky Rood, John Thuburn (Independent
Consultants)
• Melinda Peng (Navy – NEPTUNE)
• Venkatachala Ramaswamy (GFDL - FV3)
• Hendrik Tolman (EMC – NMM-UJ)
• Chris Davis (NCAR – MPAS)
• Kevin Kelleher (ESRL – NIM)
88
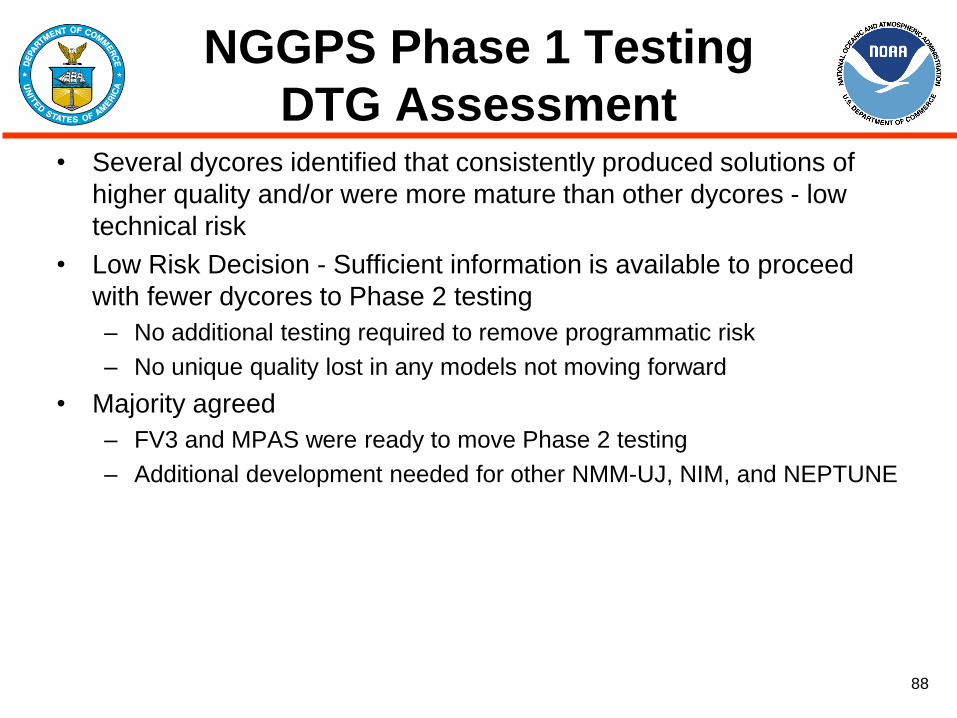
NGGPS Phase 1 Testing
DTG Assessment • Several dycores identified that consistently produced solutions of
higher quality and/or were more mature than other dycores - low
technical risk
• Low Risk Decision - Sufficient information is available to proceed
with fewer dycores to Phase 2 testing
– No additional testing required to remove programmatic risk
– No unique quality lost in any models not moving forward
• Majority agreed
– FV3 and MPAS were ready to move Phase 2 testing
– Additional development needed for other NMM-UJ, NIM, and NEPTUNE

89
NGGPS Phase 1 Testing
Project Summary Assessment
Idealized
Tests
3-km, 3-day
forecasts
Performance Scalability Nesting or
Mesh
Refinement
Software
Maturity
FV3
MPAS
NIM
NMM-UJ
NEPTUNE
Meets or exceeds readiness for needed capability Some capability but effort required for readiness Capability in planning only or otherwise insufficiently ready
90
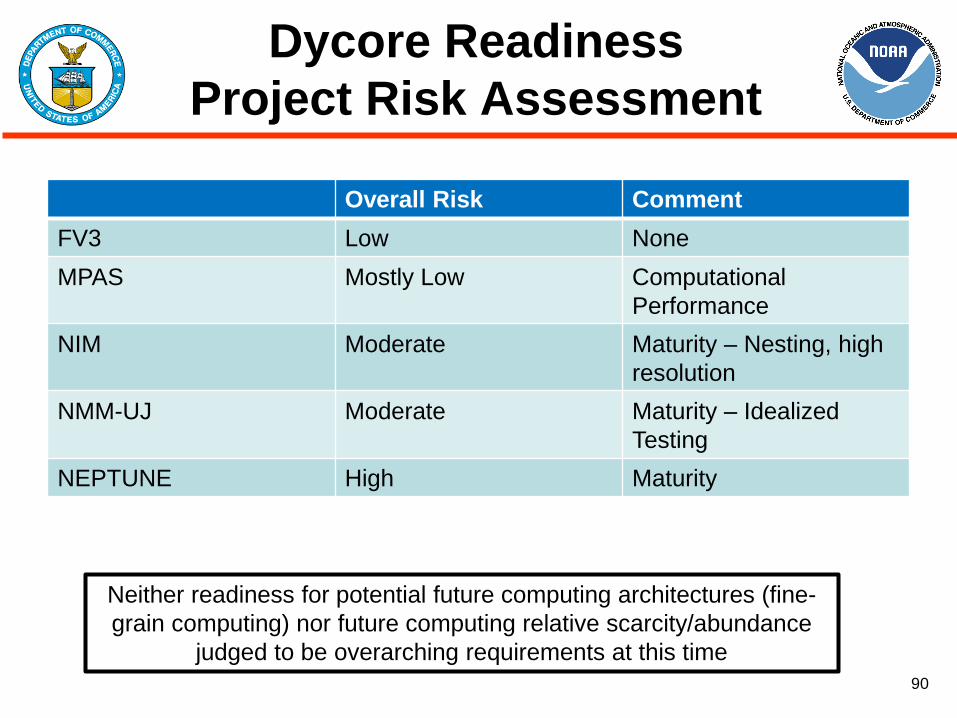
Dycore Readiness
Project Risk Assessment
Overall Risk Comment
FV3 Low None
MPAS Mostly Low Computational
Performance
NIM Moderate Maturity – Nesting, high
resolution
NMM-UJ Moderate Maturity – Idealized
Testing
NEPTUNE High Maturity
Neither readiness for potential future computing architectures (fine-
grain computing) nor future computing relative scarcity/abundance
judged to be overarching requirements at this time
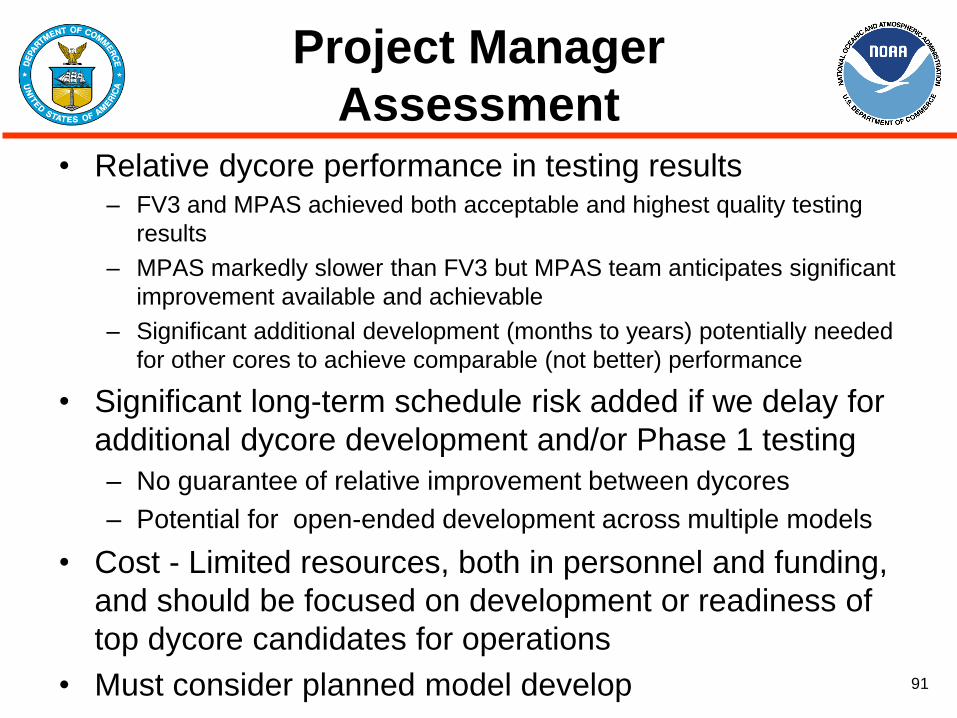
91
Project Manager
Assessment • Relative dycore performance in testing results
– FV3 and MPAS achieved both acceptable and highest quality testing
results
– MPAS markedly slower than FV3 but MPAS team anticipates significant
improvement available and achievable
– Significant additional development (months to years) potentially needed
for other cores to achieve comparable (not better) performance
• Significant long-term schedule risk added if we delay for
additional dycore development and/or Phase 1 testing
– No guarantee of relative improvement between dycores
– Potential for open-ended development across multiple models
• Cost - Limited resources, both in personnel and funding,
and should be focused on development or readiness of
top dycore candidates for operations
• Must consider planned model develop
92
NGGPS Project Manager
Recommendation
• Proceed to Phase 2 testing on schedule with two
dycores:
– FV3 and MPAS
93
Global Modeling Test Bed
(GMTB)
94
GMTB – Role
• Extension of current DTC (NCAR and GSD partnership)
• Developmental testing of new functionality
• Facilitates community involvement in ongoing
development of operational modeling systems
– Community code management
– Facilitates use of code in non-NOAA platforms
– Provides necessary infrastructure for community to
interact with code system
– Supports code system to external developers
– Independent test and evaluation of proposed upgrades
to operational system from external community
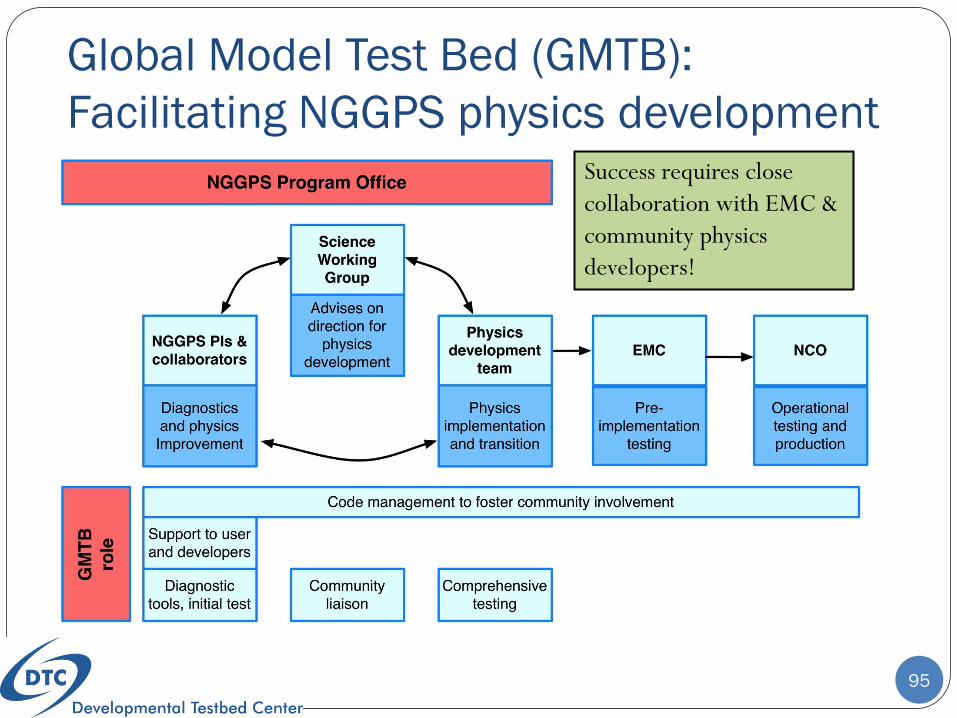
Global Model Test Bed (GMTB):
Facilitating NGGPS physics development
95
Success requires close
collaboration with EMC &
community physics
developers!
96
GMTB – Current Focus
• Atmospheric physics
– Create and support a Common Community Physics
Package (CCPP) with carefully vetted physics suites
for global modeling at various resolutions
– Develop a design and implementation plan to evolve
current Interoperable Physics Driver (IPD) to meet the
needs of NGGPS
– Implement a testbed for innovations
– NGGPS Physics Workshop
• Sea ice model
– Participate in efforts to create a plan for fostering
community collaboration in Los Alamos Sea Ice
Model (CICE) development
97
GMTB – DTC Support
• Cases for each hierarchy tier, from idealized tests using a
single-column model, through more complex tests using a
full global dynamic core. Including:
– Initialization data
– Forcings
– Relevant observation datasets
• Benchmarks
– Output of operational models for each case
• Analysis tools, such as,
– Model Evaluation Tools (MET)
– Tools shared from community
– Scripts
– Diagnostic plot-making capabilities
98
Common Community Physics
Package (CCPP) Strategy
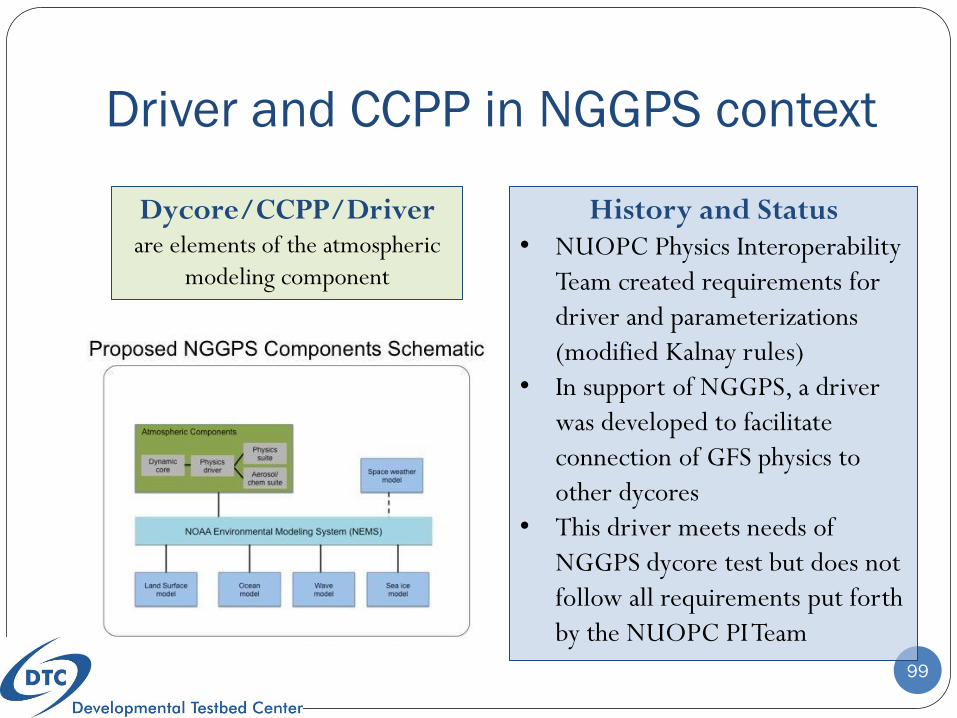
Driver and CCPP in NGGPS context
99
Dycore/CCPP/Driver are elements of the atmospheric
modeling component
History and Status • NUOPC Physics Interoperability
Team created requirements for
driver and parameterizations
(modified Kalnay rules)
• In support of NGGPS, a driver
was developed to facilitate
connection of GFS physics to
other dycores
• This driver meets needs of
NGGPS dycore test but does not
follow all requirements put forth
by the NUOPC PI Team
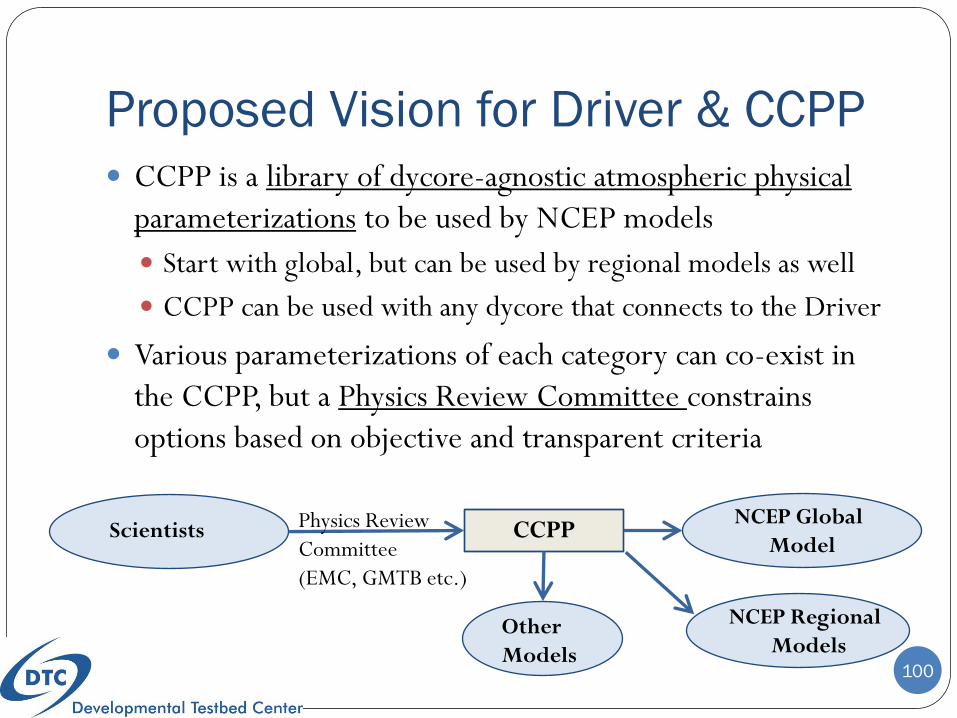
Proposed Vision for Driver & CCPP
100
CCPP is a library of dycore-agnostic atmospheric physical
parameterizations to be used by NCEP models
Start with global, but can be used by regional models as well
CCPP can be used with any dycore that connects to the Driver
Various parameterizations of each category can co-exist in
the CCPP, but a Physics Review Committee constrains
options based on objective and transparent criteria
CCPP NCEP Global
Model Scientists Physics Review
Committee
(EMC, GMTB etc.)
NCEP Regional
Models Other
Models
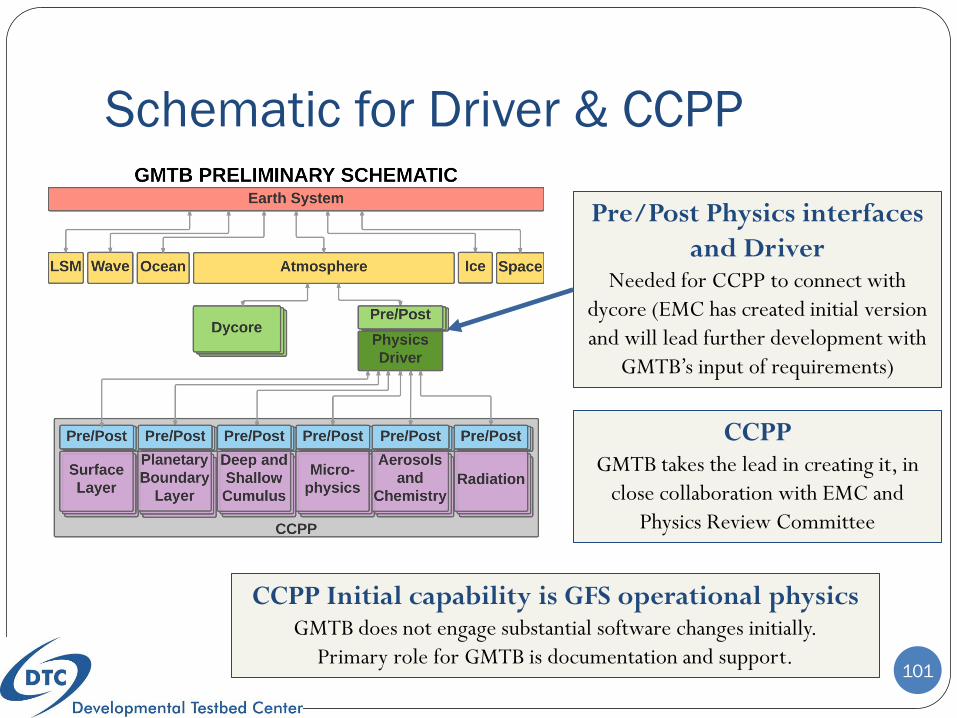
Schematic for Driver & CCPP
101
Pre/Post Physics interfaces
and Driver Needed for CCPP to connect with
dycore (EMC has created initial version
and will lead further development with
GMTB’s input of requirements)
CCPP GMTB takes the lead in creating it, in
close collaboration with EMC and
Physics Review Committee
CCPP Initial capability is GFS operational physics GMTB does not engage substantial software changes initially.
Primary role for GMTB is documentation and support.