Embed Size (px)
Citation preview
News Bulletin
No. 22 June 20171Nation1Cluster
Editorial Cathy Kroll, Swiss Biotech AssociationWe look back on a very successful Swiss Biotech Day 2017 and forward to presenting Swiss Biotech in the Swiss Pavilion at this year’s BIO Conven-tion in San Diego.
In preparation for both events, the NTN Swiss Biotech has compiled valuable information that demonstrates the power and potential of Swiss Biotech: the Swiss Biotech Report and a survey of the biotech patent situation within Switzerland and amongst members of the Swiss Biotech As-sociation (SBA). Enjoy the reading!
NTN partners:
Contents • Facts and figures from the
Swiss Biotech Report• Swiss Biotech Day• The biotechnology patent
landscape with particular focus on Switzerland
Facts and figures from the Swiss Biotech Report
2016 was a suc-cessful year for Swiss Biotech. The Swiss health biotech sector (not counting Roche and Novartis) pro-vided more than 15,000 direct jobs in 281 compa-nies and gener-ated a turnover of CHF 5.7 billion.
This positive result is a sign of a certain maturity in the Swiss biotech industry, with many products well received in the market and a corresponding increase in demand. The Swiss biotech community raised almost CHF 823 million in 2016, and three Swiss biotechs successfully completed an IPO.
Download: www.swissbiotech.org/swiss-biotech/swiss-biotech-report
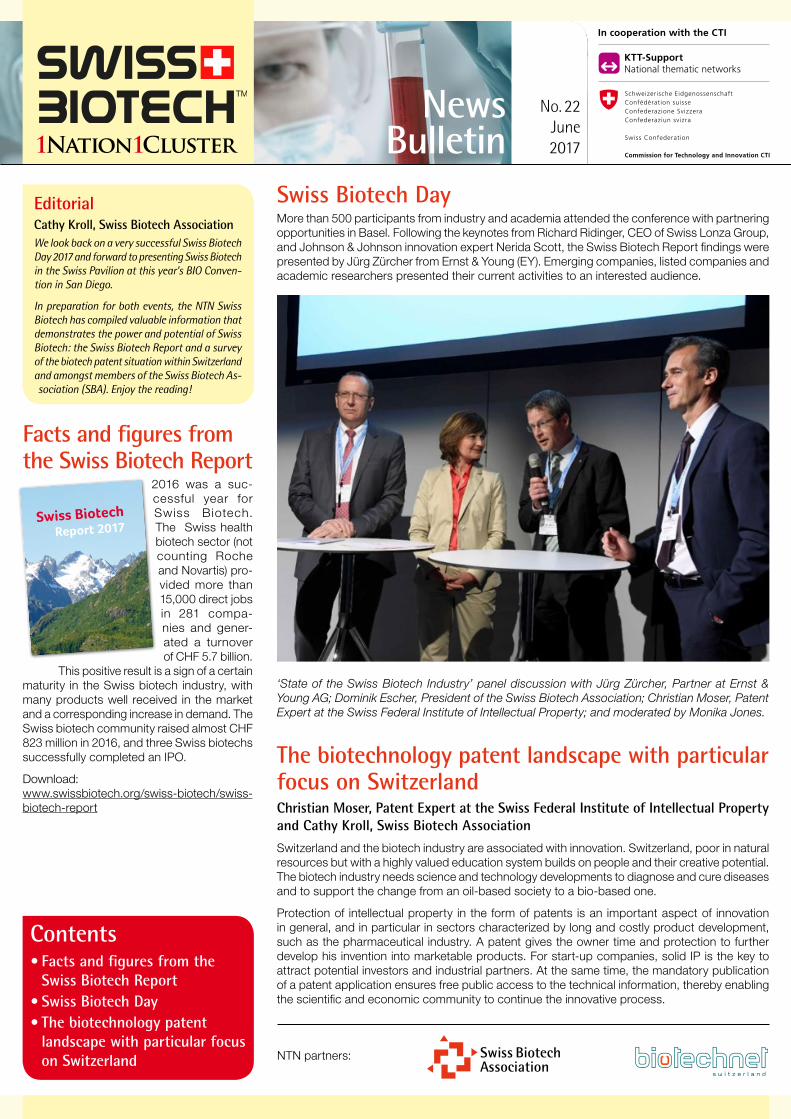
Swiss Biotech DayMore than 500 participants from industry and academia attended the conference with partnering opportunities in Basel. Following the keynotes from Richard Ridinger, CEO of Swiss Lonza Group, and Johnson & Johnson innovation expert Nerida Scott, the Swiss Biotech Report findings were presented by Jürg Zürcher from Ernst & Young (EY). Emerging companies, listed companies and academic researchers presented their current activities to an interested audience.
Swiss Biotech Report 2017
www.swissbiotechreport.ch
‘State of the Swiss Biotech Industry’ panel discussion with Jürg Zürcher, Partner at Ernst & Young AG; Dominik Escher, President of the Swiss Biotech Association; Christian Moser, Patent Expert at the Swiss Federal Institute of Intellectual Property; and moderated by Monika Jones.
The biotechnology patent landscape with particular focus on SwitzerlandChristian Moser, Patent Expert at the Swiss Federal Institute of Intellectual Property and Cathy Kroll, Swiss Biotech Association
Switzerland and the biotech industry are associated with innovation. Switzerland, poor in natural resources but with a highly valued education system builds on people and their creative potential. The biotech industry needs science and technology developments to diagnose and cure diseases and to support the change from an oil-based society to a bio-based one.
Protection of intellectual property in the form of patents is an important aspect of innovation in general, and in particular in sectors characterized by long and costly product development, such as the pharmaceutical industry. A patent gives the owner time and protection to further develop his invention into marketable products. For start-up companies, solid IP is the key to attract potential investors and industrial partners. At the same time, the mandatory publication of a patent application ensures free public access to the technical information, thereby enabling the scientific and economic community to continue the innovative process.
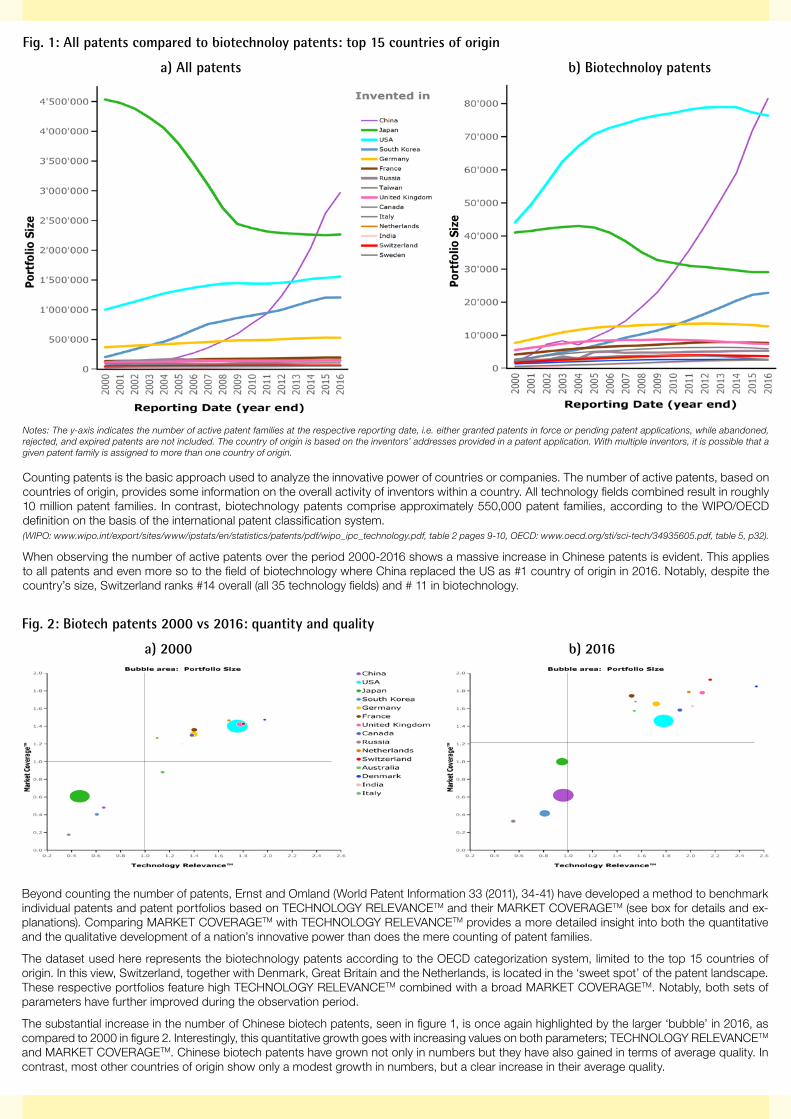
Fig. 1: All patents compared to biotechnoloy patents: top 15 countries of origin
a) All patents b) Biotechnoloy patents
Notes: The y-axis indicates the number of active patent families at the respective reporting date, i.e. either granted patents in force or pending patent applications, while abandoned, rejected, and expired patents are not included. The country of origin is based on the inventors’ addresses provided in a patent application. With multiple inventors, it is possible that a given patent family is assigned to more than one country of origin.
Counting patents is the basic approach used to analyze the innovative power of countries or companies. The number of active patents, based on countries of origin, provides some information on the overall activity of inventors within a country. All technology fields combined result in roughly 10 million patent families. In contrast, biotechnology patents comprise approximately 550,000 patent families, according to the WIPO/OECD definition on the basis of the international patent classification system. (WIPO: www.wipo.int/export/sites/www/ipstats/en/statistics/patents/pdf/wipo_ipc_technology.pdf, table 2 pages 9-10, OECD: www.oecd.org/sti/sci-tech/34935605.pdf, table 5, p32).
When observing the number of active patents over the period 2000-2016 shows a massive increase in Chinese patents is evident. This applies to all patents and even more so to the field of biotechnology where China replaced the US as #1 country of origin in 2016. Notably, despite the country’s size, Switzerland ranks #14 overall (all 35 technology fields) and # 11 in biotechnology.
Fig. 2: Biotech patents 2000 vs 2016: quantity and quality
a) 2000 b) 2016
Beyond counting the number of patents, Ernst and Omland (World Patent Information 33 (2011), 34-41) have developed a method to benchmark individual patents and patent portfolios based on TECHNOLOGY RELEVANCETM and their MARKET COVERAGETM (see box for details and ex-planations). Comparing MARKET COVERAGETM with TECHNOLOGY RELEVANCETM provides a more detailed insight into both the quantitative and the qualitative development of a nation’s innovative power than does the mere counting of patent families.
The dataset used here represents the biotechnology patents according to the OECD categorization system, limited to the top 15 countries of origin. In this view, Switzerland, together with Denmark, Great Britain and the Netherlands, is located in the ‘sweet spot’ of the patent landscape. These respective portfolios feature high TECHNOLOGY RELEVANCETM combined with a broad MARKET COVERAGETM. Notably, both sets of parameters have further improved during the observation period.
The substantial increase in the number of Chinese biotech patents, seen in figure 1, is once again highlighted by the larger ‘bubble’ in 2016, as compared to 2000 in figure 2. Interestingly, this quantitative growth goes with increasing values on both parameters; TECHNOLOGY RELEVANCETM
and MARKET COVERAGETM. Chinese biotech patents have grown not only in numbers but they have also gained in terms of average quality. In contrast, most other countries of origin show only a modest growth in numbers, but a clear increase in their average quality.
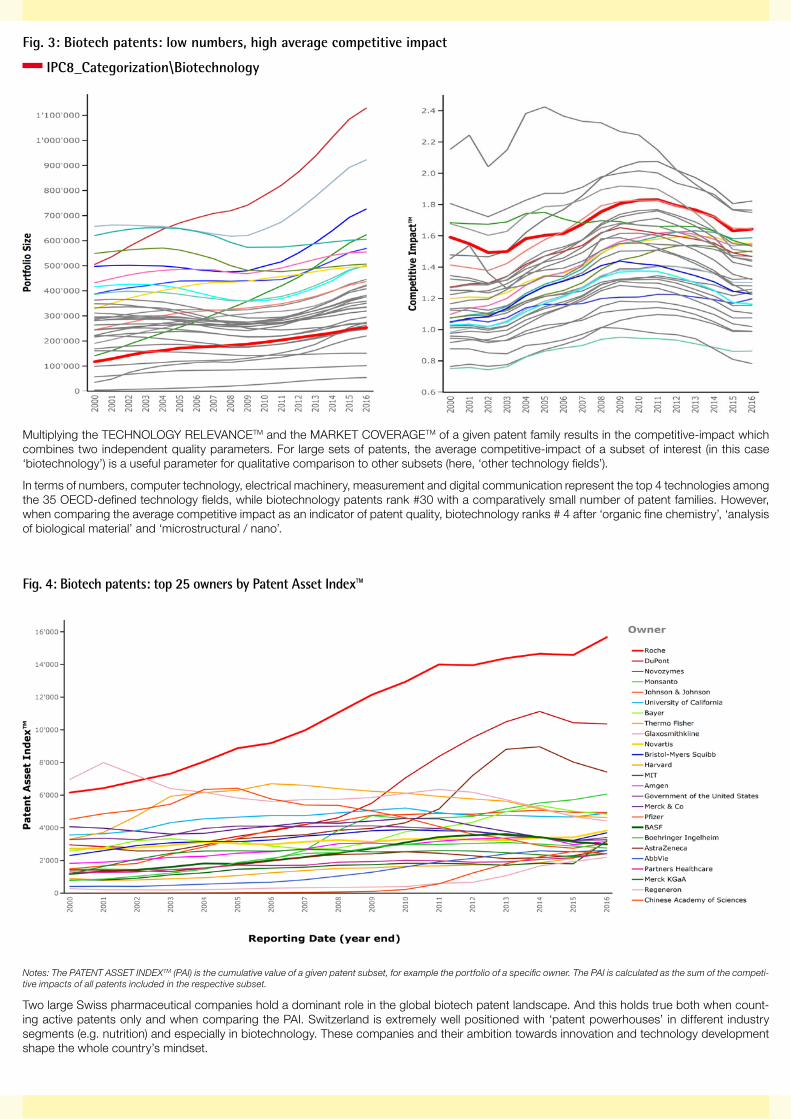
Fig. 3: Biotech patents: low numbers, high average competitive impact
IPC8_Categorization\Biotechnology
Multiplying the TECHNOLOGY RELEVANCETM and the MARKET COVERAGETM of a given patent family results in the competitive-impact which combines two independent quality parameters. For large sets of patents, the average competitive-impact of a subset of interest (in this case ‘biotechnology’) is a useful parameter for qualitative comparison to other subsets (here, ‘other technology fields’).
In terms of numbers, computer technology, electrical machinery, measurement and digital communication represent the top 4 technologies among the 35 OECD-defined technology fields, while biotechnology patents rank #30 with a comparatively small number of patent families. However, when comparing the average competitive impact as an indicator of patent quality, biotechnology ranks # 4 after ‘organic fine chemistry’, ‘analysis of biological material’ and ‘microstructural / nano’.
Fig. 4: Biotech patents: top 25 owners by Patent Asset Index™
Notes: The PATENT ASSET INDEXTM (PAI) is the cumulative value of a given patent subset, for example the portfolio of a specific owner. The PAI is calculated as the sum of the competi-tive impacts of all patents included in the respective subset.
Two large Swiss pharmaceutical companies hold a dominant role in the global biotech patent landscape. And this holds true both when count-ing active patents only and when comparing the PAI. Switzerland is extremely well positioned with ‘patent powerhouses’ in different industry segments (e.g. nutrition) and especially in biotechnology. These companies and their ambition towards innovation and technology development shape the whole country’s mindset.
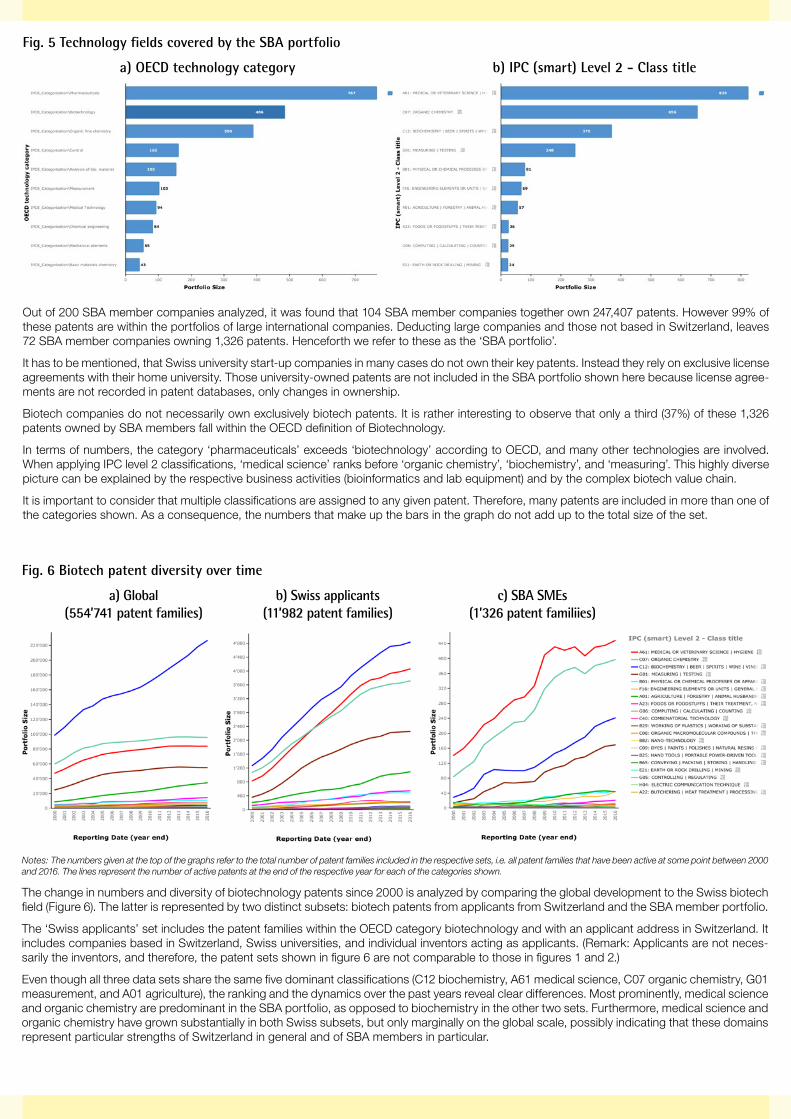
Fig. 5 Technology fields covered by the SBA portfolio
a) OECD technology category b) IPC (smart) Level 2 - Class title
Out of 200 SBA member companies analyzed, it was found that 104 SBA member companies together own 247,407 patents. However 99% of these patents are within the portfolios of large international companies. Deducting large companies and those not based in Switzerland, leaves 72 SBA member companies owning 1,326 patents. Henceforth we refer to these as the ‘SBA portfolio’.
It has to be mentioned, that Swiss university start-up companies in many cases do not own their key patents. Instead they rely on exclusive license agreements with their home university. Those university-owned patents are not included in the SBA portfolio shown here because license agree-ments are not recorded in patent databases, only changes in ownership.
Biotech companies do not necessarily own exclusively biotech patents. It is rather interesting to observe that only a third (37%) of these 1,326 patents owned by SBA members fall within the OECD definition of Biotechnology.
In terms of numbers, the category ‘pharmaceuticals’ exceeds ‘biotechnology’ according to OECD, and many other technologies are involved. When applying IPC level 2 classifications, ‘medical science’ ranks before ‘organic chemistry’, ‘biochemistry’, and ‘measuring’. This highly diverse picture can be explained by the respective business activities (bioinformatics and lab equipment) and by the complex biotech value chain.
It is important to consider that multiple classifications are assigned to any given patent. Therefore, many patents are included in more than one of the categories shown. As a consequence, the numbers that make up the bars in the graph do not add up to the total size of the set.
Fig. 6 Biotech patent diversity over time
a) Global b) Swiss applicants c) SBA SMEs (554’741 patent families) (11’982 patent families) (1’326 patent familiies)
Notes: The numbers given at the top of the graphs refer to the total number of patent families included in the respective sets, i.e. all patent families that have been active at some point between 2000 and 2016. The lines represent the number of active patents at the end of the respective year for each of the categories shown.
The change in numbers and diversity of biotechnology patents since 2000 is analyzed by comparing the global development to the Swiss biotech field (Figure 6). The latter is represented by two distinct subsets: biotech patents from applicants from Switzerland and the SBA member portfolio.
The ‘Swiss applicants’ set includes the patent families within the OECD category biotechnology and with an applicant address in Switzerland. It includes companies based in Switzerland, Swiss universities, and individual inventors acting as applicants. (Remark: Applicants are not neces-sarily the inventors, and therefore, the patent sets shown in figure 6 are not comparable to those in figures 1 and 2.)
Even though all three data sets share the same five dominant classifications (C12 biochemistry, A61 medical science, C07 organic chemistry, G01 measurement, and A01 agriculture), the ranking and the dynamics over the past years reveal clear differences. Most prominently, medical science and organic chemistry are predominant in the SBA portfolio, as opposed to biochemistry in the other two sets. Furthermore, medical science and organic chemistry have grown substantially in both Swiss subsets, but only marginally on the global scale, possibly indicating that these domains represent particular strengths of Switzerland in general and of SBA members in particular.
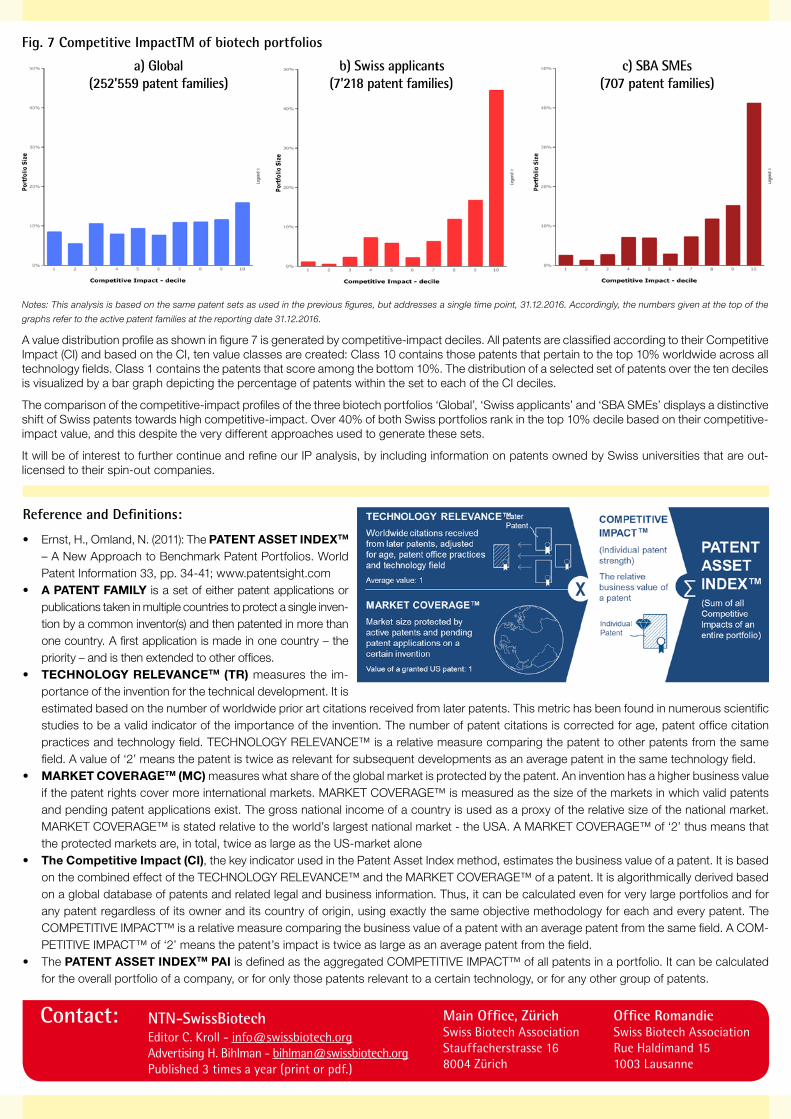
Fig. 7 Competitive ImpactTM of biotech portfolios
Notes: This analysis is based on the same patent sets as used in the previous figures, but addresses a single time point, 31.12.2016. Accordingly, the numbers given at the top of the
graphs refer to the active patent families at the reporting date 31.12.2016.
A value distribution profile as shown in figure 7 is generated by competitive-impact deciles. All patents are classified according to their Competitive Impact (CI) and based on the CI, ten value classes are created: Class 10 contains those patents that pertain to the top 10% worldwide across all technology fields. Class 1 contains the patents that score among the bottom 10%. The distribution of a selected set of patents over the ten deciles is visualized by a bar graph depicting the percentage of patents within the set to each of the CI deciles.
The comparison of the competitive-impact profiles of the three biotech portfolios ‘Global’, ‘Swiss applicants’ and ‘SBA SMEs’ displays a distinctive shift of Swiss patents towards high competitive-impact. Over 40% of both Swiss portfolios rank in the top 10% decile based on their competitive-impact value, and this despite the very different approaches used to generate these sets.
It will be of interest to further continue and refine our IP analysis, by including information on patents owned by Swiss universities that are out-licensed to their spin-out companies.
Contact: NTN-SwissBiotechEditor C. Kroll - [email protected] H. Bihlman - [email protected] 3 times a year (print or pdf.)
Main Office, ZürichSwiss Biotech AssociationStauffacherstrasse 16 8004 Zürich
Office RomandieSwiss Biotech AssociationRue Haldimand 151003 Lausanne
Reference and Definitions:
• Ernst, H., Omland, N. (2011): The PATENT ASSET INDEXTM
– A New Approach to Benchmark Patent Portfolios. WorldPatent Information 33, pp. 34-41; www.patentsight.com
• A PATENT FAMILY is a set of either patent applications orpublications taken in multiple countries to protect a single inven-tion by a common inventor(s) and then patented in more thanone country. A first application is made in one country – thepriority – and is then extended to other offices.
• TECHNOLOGY RELEVANCETM (TR) measures the im-portance of the invention for the technical development. It isestimated based on the number of worldwide prior art citations received from later patents. This metric has been found in numerous scientificstudies to be a valid indicator of the importance of the invention. The number of patent citations is corrected for age, patent office citationpractices and technology field. TECHNOLOGY RELEVANCE™ is a relative measure comparing the patent to other patents from the samefield. A value of ‘2’ means the patent is twice as relevant for subsequent developments as an average patent in the same technology field.
• MARKET COVERAGETM (MC) measures what share of the global market is protected by the patent. An invention has a higher business value if the patent rights cover more international markets. MARKET COVERAGE™ is measured as the size of the markets in which valid patentsand pending patent applications exist. The gross national income of a country is used as a proxy of the relative size of the national market.MARKET COVERAGE™ is stated relative to the world’s largest national market - the USA. A MARKET COVERAGE™ of ‘2’ thus means thatthe protected markets are, in total, twice as large as the US-market alone
• The Competitive Impact (CI), the key indicator used in the Patent Asset Index method, estimates the business value of a patent. It is basedon the combined effect of the TECHNOLOGY RELEVANCE™ and the MARKET COVERAGE™ of a patent. It is algorithmically derived basedon a global database of patents and related legal and business information. Thus, it can be calculated even for very large portfolios and forany patent regardless of its owner and its country of origin, using exactly the same objective methodology for each and every patent. TheCOMPETITIVE IMPACT™ is a relative measure comparing the business value of a patent with an average patent from the same field. A COM-PETITIVE IMPACT™ of ‘2’ means the patent’s impact is twice as large as an average patent from the field.
• The PATENT ASSET INDEXTM PAI is defined as the aggregated COMPETITIVE IMPACT™ of all patents in a portfolio. It can be calculatedfor the overall portfolio of a company, or for only those patents relevant to a certain technology, or for any other group of patents.
a) Global b) Swiss applicants c) SBA SMEs(252’559 patent families) (7’218 patent families) (707 patent families)


![NORSOK LE Standards 12062012.pptx [Read-Only] 2012/Aldring og... · Solvang / Omland 08.06.2012 NORSOK LE Standards Y-002 Life Extension for Transportation Systems U-009 Life Extension](https://img.pdfslide.us/doc/110x75/5aabdd1f7f8b9ac55c8c679b/norsok-le-standards-read-only-2012aldring-ogsolvang-omland-08062012-norsok.jpg)