Embed Size (px)
Citation preview


NewJersey Geological SurveyGeological Survey Report 19
Water-Quality Data for the Potomac-Raritan-Magothy Aquifer Systemin the Northern Coastal Plain of New Jersey, 1923-86
byDouglas A. Harriman, Daryll A. Pope, and Alison D. Gordon
U.S. Geological Survey - Water Resources DivisionWest Trenton, New Jersey
Prepared by the United States Geological Surveyin cooperation with the
New Jersey Department of Environmental ProtectionDivision of Water Resources
NewJerseyDepartmentof EnvironmentalProtectionDivisionof WaterResources
GeologicalSurveyTrenton,NJ 08625
1989

New Jersey Geological Survey Reports (ISSN 0741-7357) are published by the NewJersey Geological Survey, CN-029, Trenton, NJ 08625. This report may be repro.duced in whole or part provided that suitable reference to the source of the copiedmaterial is provided.
Additional copies of this and other n:ports may be obtained fl_om:
Maps and Publications Sales OfficeBureau of RevenueCN-402
Trenton, NJ 08625
A price list is available on request.
Use of brand, commercial, or trade names is for identification pu_ only anddoe_ not constitute endo_ement by the New Jersey Geological Survey.

CONTENTS
PageAbstract .................................................... I
Introduction ................................................ 2
Purpose and scope ....................................... 2
Hydrogeologic setting ............................... •.... 2
Well-numbering system ................................... 5
Acknowledgments ......................................... 5
Data collection and analysis ................................ 7Well selection .......................................... 7
Sample-collection methods ............................... 7
Laboratory analysis ..................................... 8
Quality-assurance program ............................... ii
Water-quallty data .......................................... 12Data statistics ............................................. 13
References cited .............. :............................. 21
ILLUSTRATIONS
Plate l.--Map showing location of wells in the upper aquifer
of the Potomac-Raritan-Magothy aquifer system
and hydrogeologlc section ...................... in pocket
2.--Hap showing location of wells in the middle aquifer
of the Potomac-Raritan-Magothy aquifer system and
hydrogeologic section .......................... in pocket
Figure l.--Map showing location of study area in New Jersey
and line of hydrogeologic section .............. 3
2.--Hydrogeologic section through study area ......... 6
TABLES
Table l.--Geologic and hydrogeologic units in the Coastal
Plain of New Jersey ............................ 4
2.--Records of sampled wells ......................... 23
3.--Chemlcal constituents and physical character-
istics determined in well-water samples ........ 9
4.--Water-quality analyses of well-water samples,1923-86 ........................................ 32
5.--Chloride concentrations and field measurements
of well-water samples, 1923-86 ................. 78
6.--Volatile organic and pesticide compounds greaterthan the detection limit ....................... 15
7.--Statlstical summary of water analyses from the
upper aquifer of the Potomac-Raritan-Magothy
aquifer system, 1984-86 ........................ 19
8.--Statistical s,mmary of water analyses from the
middle aquifer of the Potomac-Raritan-Magothy
aquifer system, 1984-86 ........................ 20
iii

CONVERSION FACTORS
Factors for converting inch-pound units to metric (International
System) units are given below:
Multiply (Inch-Pound-Unit) By To Obtain (Metric Unit)
Length
inch (in.) 25.4 millimeter (mm)
foot (ft) 0.3048 meter (m)
mile (mi) 1.609 kilometer (km)
Area
square mile (mi2) 2.590 square kilometer (km 2)
Flow
cubic foot per second cubic meter per second
(ftS/s) 0.02832 (mS/s)
million gallons cubic meter per second
per day (Mgal/d) 0.04381 (mS/s)
Temperature Conversion Formula: °F = 1.8°C + 32
Sea Level: In this report "sea level" refers to the National Geodetic
Vertical Datum of 1929 (NGVD of 1929)--a geodetic datum derived from ageneral adjustment of the first order level nets of both the United States
and Canada, formerly called "Sea Level Datum of 1929."
iv

WATER-QUALITY DATA FOR THE POTOMAC-RARITAN-MAGOTHY AQUIFERSYSTEM IN THE NORTHERN COASTAL PLAIN OF NEW JERSEY, 1923-86
By Douglas A. Harriman, Daryll A. Pope, and Alison D. Gordon
ABSTRACT
Ground-water-quality data for the upper and middle aquifers of the
Potomac-Raritan-Magothy aquifer system in Middlesex and Monmouth Counties
are compiled for the period 1923-86. A total of 330 wells were sampled: 192
wells in the upper aquifer and 138 wells in the middle aquifer. Most of the
complete water-quality analyses were collected after September 1984, as partof a regional ground-water assessment. Well-construction data for the
sampled wells also are presented. Public-supply, domestic-supply,
industrial, commercial, irrigation, and observation wells were sampled forthe study. Field measurements made at the time of sample collection include
water temperature, specific conductance, dissolved oxygen, pH, alkalinity,and bicarbonate concentration. Laboratory determinations include common
ions, silica, dissolved solids, trace metals, volatile organic compounds,and pesticides. A quality-assurance program was followed to evaluate and
assure the quality of the data.
The report also contains a table of lithologie and hydrologic
characteristics of the geologic units in the study area, a table of chloride
concentrations and field measurements from 1923-86, and statistical
summaries of selected water-quallty data for the upper and middle aquifers.
Many constituents were found in a wide range of concentrations.
Water from more than 25 percent of the wells sampled contained lead
concentrations above the detection limit of I0 _g/L (micrograms perliter). Included in this number are some wells that had lead concentrations
greater than the U.S. Environmental Protection Agency (USEPA) primary
drinking-water regulation of 50 _g/L. Cadmium concentrations, althoughlower than lead concentrations, followed a similar pattern. Water from
approximately 25 percent of the wells in the upper aquifer, contain cadmium
concentrations equal to or greater than the detection limit of I _g/L.
Dissolved iron concentrations ranged from 5 _g/L to 480,000 _g/L.
Water from more than 50 percent of the wells sampled contained iron
concentrations in excess of the USEPA secondary drinking-water recommended
limit of 300 _g/L.
Chloride concentrations greater than the USEPA secondary drinking-
water recommended limit of 250 milligrams per liter were found in samples
from wells located in the cities of Perth Amboy and South Amboy; in theboroughs of Keanshurg, Sayreville, Keyport, and Union Beach; and in the
townships of Old Bridge and Woodbridge.
Of 21 samples collected from wells screened in the upper aquifer and
analyzed for 30 volatile organic compounds (VOCs), 5 samples contained atleast I VOC at or above the detection limit. In the middle aquifer, 12 of
the 21 samples collected and analyzed for VOCs contained at least i VOC
greater than the detection limit.
i

Concentrations of pesticides generally were low. Of the 43 samples
collected from wells screened in the upper aquifer and analyzed for
pesticides, 4 samples contained concentrations of pesticides at or greaterthan the detection limit. In the middle aquifer, 6 of 38 samples collected
and analyzed for 32 pesticides had at least i pesticide with a concentration
greater than the detection limit.
INTRODUCTION
Ground water from the Potomae-Raritan-Magothy aquifer system is the
major potable water source in the 600-square mile study area (fig. I).
During 1980, ground-water withdrawals for public supply, industrial,
commercial, and agricultural uses in the Coastal Plain part of Middlesex
County were about 48 Mgal/d (million gallons per day); in Monmouth County,
they were about 33 Mgal/d (Vowinkel, 1984, p. 19). Approximately 90 percentof these withdrawals were from the Petomac-Raritan-Magothy aquifer system.
Land development in the area is increasing with the growth in
population. The resulting changes in land use and increases in ground-waterwithdrawals can affect the quality of ground water in the Potomac-Raritan-
Magothy aquifer system; however, the effects of local contamination and
development on the regional water quality in the area are largely unknown.
In addition, declining water levels in the Potomac-Raritan-Magothy
aquifer system have caused saltwater to intrude into the aquifer system
through submerged outcrop areas. This has increased the potential for
lateral movement of the regional saltwater transition zones toward pumping
centers (Leahy, 1985, p. 18). Saltwater contamination of wells has occurred
in some areas near the coast, including parts of Keyport and Union Beach
Boroughs in Monmouth County (Schaefer and Walker, 1981), and Sayreville
Borough, South River Borough, and South Amboy City in Middlesex County(Schaefer, 1983).
Purpose and Scope
The purpose of this report is to present the water-quality data
collected from 1923-86 for the upper and middle aquifers of the Potomac-
Rarltan-Magothy aquifer system in the study area. A total of 330 wells weresampled: 192 wells in the upper aquifer and 138 wells in the middle aquifer.
Most of the complete water-quality analyses were collected after September
1984. This report includes tables of water-quality data, a table of wells
where pesticide or volatile organic compounds were detected, and well-
construction data for the sampled wells. Statistical s-mmaries of results
of the chemical analyses are tabulated for each aquifer, and the locationsof sampled wells are shown on plates i and 2. This report was prepared in
cooperation with the New Jersey Department of Environmental Protection,
Division of Water Resources. It is one of a series of products originating
from the South River vicinity ground-water investigation, a study funded bythe New Jersey Water-Supply Bond of 1981.
HvdroReolo_ic Setting
The Coastal Plain sediments of New Jersey overlie a pre-Cretaeeous
basement. The Coastal Plain hydrogeologic units (aquifers and confining
2

75 ° 74 °I I
-- p
suss , Oo_.
41 ° -,..J
CO _MORRl \J
/'_ _ UNION
• RARITANBA Y
0
EXPLANATION
_m_ Line of hydrogeologic sectio
shown in figure 2. AREA
Physiographic province / •HIGHLANDS _ /
40 ° , _' kS -
_ BURLINGTON OCEAN O
\ %'-, \
LLI S ALE M_ _'* \/_ __,\ I %('1
< ,/'\. I"..,./ TL A NTIC
I<_ CUMBERLAND _/
IuJ ._ _"
DELA WA RE0 10 20 30 MILES
BAY I u, ,n I39 ° 0 1'0 20 30 KILOMETERS --
I
Figure l.--Location of study area in New Jersey and line of hydrogeologlcsection.
3

Table 1,--Geologic and hydrogeoto_c units in the Coastal Plain of New Jersey
SYSTEM _R[ES _OtO6t C L;THOLOCY _tOROCEOEOGI C #VOROt 0¢1C CXABACT_R[ST _C$
Att_Niat $_+ Slat, _ bt_ck IsJd.deOo=t•=
Surfi¢tat _steri=t ¢omlxmty )lydrautics&tyK°l°cet_ Belch lind =and, _¢UJ._,rtz tt'ght-¢otored mediLll*¢O c_lrse- L_differen. cmlnect•d to under y _g 4_J fers.
_lterPary _ gravQt gpa ned, pe¢_ y. tilted LCCm&l_, some uni_l _y I¢¢ ell¢onfimng units. Thicker farads are¢a_41ble of yielding t•rge ¢F_am[(tie'l
pt e_llt ocetle CapeF=rcmst_onHi of uater *
Per,_l_kl_ _ (_lrtz Hght_cotored heteroger_,_FOrlmti¢#l C ayey, pebbly.
Bridget OnFOrl_lt I¢_
Kirkvood. A m Jot i_Jifer sylt_*
|eacc_ Hilt Grieve&, C_IIrTZ, tight ¢o&orld, slndy* Coh_ef GtOUlld rater acoJrll gen_r=t&yGrmvet =qJifer Under wa•ep-tmb&l conditional.
llytt¢_ in Ca_ MaY C_Jn_y theCC_li_ICrf Sand _ll u_erart esi_*_ ¢0¢1di t i o_.
COhan_ey $lnd, ¢_.u=..._rtztight-co&ored _diu_ to ¢olr|e-gra ned, i=¢_b y; treat c If b4d_.
MIo¢en_
Confining unitThick d[l_¢_ltxal Oily _ Occurs
li= Grlr_e •tong •¢*l$t I_d fo• a Ibo•tlertlaw _lt•r bearing distance inta_d. A thin _l•er-
KirkkOad Sind, _J_rtz, grz In_ tan, very fir_-tn. | 9r_ . _ar(ng •lr_ it _ll_mt i_ the
FOC_-a¢iO_ m_dlum-gralnld m_••c_J= =rl_ dark- Confining unit li_dte of _ht• unit.colored diatoml¢ac4Js • ay.
_t[anttc City • _j_ _FJife• along the ¢O_lt*_- foot lind
Poo•ty _rme•bta ll_<flmentl.
Ot tg¢¢e_l_iPey Point
FO_l_lt_on $4md, q_lrt| _ gt_Jcontte, firw-to _l_ Point fSe&da mode•at• qu_ltitiel of uater*
¢oarlle .g r ei rUl_. _ a_JI let
EI_ hark liver
$11_ rtz leay _ gr••n ihl- O COl_ae* _I _(fer
Vlnc_to._ _rl¢_J_, 91_¢0_ittc _ brown ¢ fry _ V_nC_C_ y(II_ mat[ ell
Pa[ _1_",_ ¢41 ¢&r_l _e, Irll ,
_rlIo_ 5and •layer qtiM¢o_it_c i_srk lf_ f(ne
lied Ba,_
N•_e•lnk S_ql_ trey•y, llt_ty, gl_,_onttl¢ 9r._ _,_For_tlon bllc_, aedlU=l.lO co+rse.grl r_d. POOrly l_ebl• ll_l_tll.
SI_ •_ese+Qr•_r_, still y 9 _¢on t ¢. _o_nt LImpet A llJor l_ifer.• _oi far
_no_a_ $_nd _ fl_D-to fir_- rlln_d gray w_d
Rar_•[ It_-
_ _ &llky ¢_flnlng unit,
_arsgalllo_ Clly •lilly dar_ greenish gray+ c°_fini_'g unitForint(on iltl_onit(¢ _•tz $_,
Ic_Jifer I _jo¢ a_utflr, lw sand units in
• mjor c_lffni unit, LOCallyMerch=n_v(tle- _hl p4rchantvitr_l For_l o_ my ¢_ta(n
Crltaclo_ Merch_tv_tle bl•c_" (_*ca&t very flne'grl1_ _tl•tz ¢o_finir_ _it
_g_*thy ;_,_+ rtl, Hgh N ay. _-I¢_ •oe••e.
+".*+•+++.,.......i=_ ,irate =._+++_ +• mi++tm¢ ,o _e
lqulFer +llrr+r_tm a_J++ep. In he 0e awl •_. l(vlr vlttay tP+ree a4_Jife • •r•..... _°+,ed.,. ,+o=_+.=.+P flo(r_ l_rfKe mite• _lm P+e up_r
Lmr mot¢_l¢ • terP_[il_l CLIy siLt+ ll_d, and grlvet. Pal + IP Ipl ur_iff+pl_t+itm.¢retaclm= G•o_ LO_l r
l_(++r
_rl_++l_ _ trap l+ll4_li• •r_l • nl NO w&la obtl++i =•tap frmPrI-CPItlCm +e_•c< k ro•kll l_¢mtl_+c +thai _ _ ll$" tocatl |_rO•k
Tr e • ¢ lllM_ato_ ••haLe i_ Juplls+ c _lla_t t_Ise ¢o_oL +mild ro_kl
kod+f+l_ from Zap_cll, ZQ_+ table I
4

units) do not always coincide with the geologic units (Zapecza, 1984, p. 9).The names of individual geologic and hydrogeologic units, and their
lithologies, are given in table I.
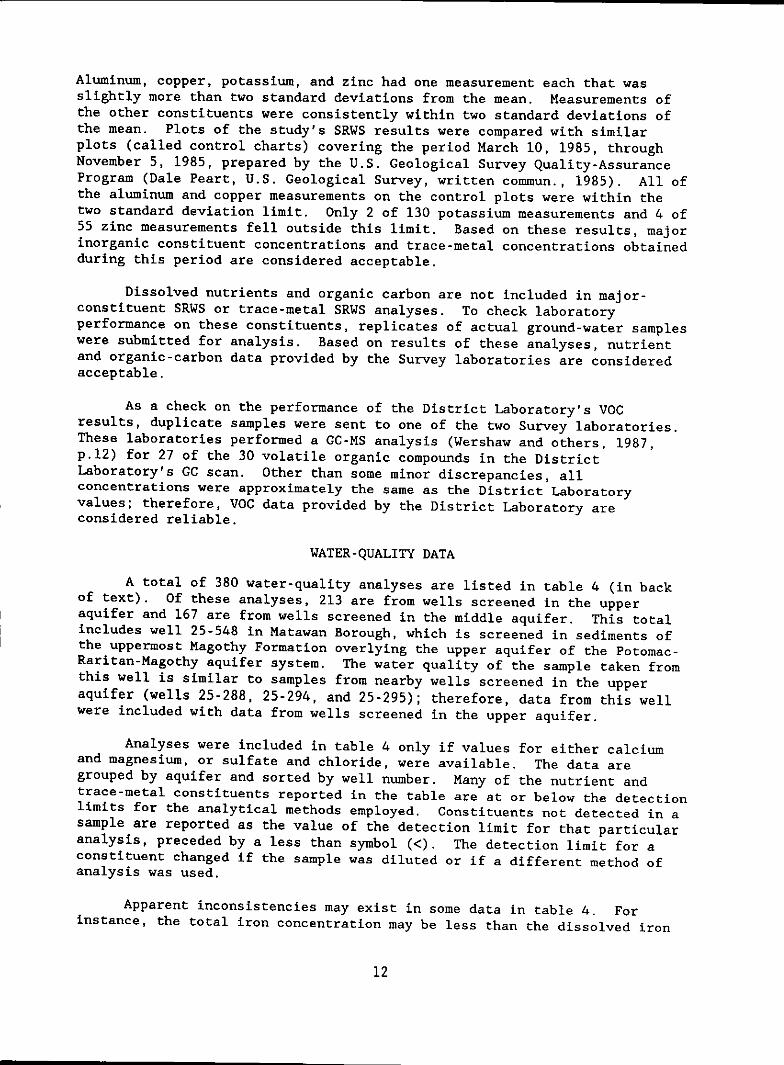
Figure 2 shows a representative hydrogeologic section through the
study area. Zapecza (1984) describes the subsurface occurrence and
configuration of hydrogeologic units in the New Jersey Coastal Plain.
Discussion of hydrogeologic units in this report is limited to those units
within the Potomac-Raritan-Magothy aquifer system and the overlying
confining unit. The Potomac-Raritan-Magothy aquifer system is composed
primarily of an upper aquifer, a middle aquifer, and a lower aquifer. Each
aquifer is separated by a confining unit. The lower aquifer is not present
in the study area.
The overlying confining unit is composed primarily of the
Merchantville Formation and the Woodbury Clay. It also includes the Amboy
Stoneware Clay Member and the discontinuous Cliffwood and Morgan beds.
The upper aquifer of the Potomac-Raritan-Magothy aquifer system is
composed primarily of the Old Bridge Sand Member of the Magothy Formation.
Where the South Amboy Fire Clay Member is thin or missing, the SayrevilleSand Member of the Raritan Formation also is part of the aquifer (Farlekas,
1979, p. 22). The upper aquifer is characterized by coarse-grained sandsand gravels.
The confining unit between the upper and middle aquifers is formed bythe Woodbridge Clay Member of the Raritan Formation. Locally, this
confining unit also includes the Sayreville Sand Member and the South AmboyFire Clay Member of the Raritan Formation.
The middle aquifer of the Potomac-Raritan-Magothy aquifer system is
composed of the Farrington Sand Member of the Raritan Formation in most of
central New Jersey (Zapecza, 1984 and Farlekas, 1979, p. 8). This sand
member is characterized by sands and gravels with lenses of clay. In
downdip areas of Monmouth County, the middle aquifer also includes the
uppermost sands of the Potomac Group (Farlekas, 1979, p. 9). The lower
confining unit, where it exists, consists of the Raritan fire clay of the
Raritan Formation and the pre-Cretaeeous basement bedrock.
Well-Numbering System
The well-numbering system used in this report was developed by the New
Jersey District, U.S. Geological Survey, for the Ground-Water Site Inventory
(GWSI) data base. The NJ-WRD well number consists of a two-digit county
code and a sequence number for the well within the county. County codes
used in this report are 23 for Middlesex County and 25 for Monmouth County.
Acknowledgments
The assistance of state and municipal officials, industry
representatives, and individuals is gratefully acknowledged for providing
well information and permitting access to wells for the collection of water
samples.

A A'Sayreville W.D. Union Beach W.D. Red Bank W.D. 4 Monmouth Beach
200 Morgan Obs, 1 3-77 G Cold Storage7 25-360 ,B.,So°° 200-_ E _' _RED BANK
G G
SEA 23-.04 25__53 .._. SA.O25;'332 SEA/ __ q ___,,, ,_ LEVELLEVEL .._ "_.
-200-I _:"_ Oo_,._ -_ o°_'_",___'_ _. _-._,,_-_-'---__.o_ -200
_-,oo :2
< -8oo-1.0.,_O.TALS_ALE -_ _-_._o..o_ j -6ooO 2 4 MILES S_ORo _ _I , i • ,J C/( _ "_. O/jl_
--800 --_ VERTICAL EXAGGERATION 52:1 _" "_, ,'/ _P"_;_ --800
Location of section shown On figure 1. "_ _' SECTION A-A'
Figure 2.--Hydrogeologic section through study area. (From Zapecza, 1984, plate 3).

DATA COLLECTION AND ANALYSIS
Well Selection
The major objective of the 1984-86 sampling program was to
characterize the regional ground-water quality. Wells were selected toprovide a relatively uniform distribution of sampling points throughout the
study area. However, to more fully characterize the water quality, other
considerations had to be taken into account. Because ground-water quality
can be altered as it moves through the aquifers (Back, 1966, p. AIS), wells
were selected from areas where flow paths remain similar to predevelopment
conditions and from areas where withdrawals have significantly altered the
flow system. Clusters of two or more wells with screen intervals set at
different depths were chosen to allow for comparisons of water quality at
different depths. Wells also were selected in areas where saltwater
intrusion has occurred. In previous years, many of these wells had numeroussamples collected for chloride determinations, but lacked more complete
water-quality data.
Wells were selected primarily from the Ground-Water Site Inventory
(GWSI) data base. All the wells chosen for sampling are screened in only
one aquifer. In areas where suitable wells were not found in GWSI, well
records of additional wells were obtained from the N.J. Department of
Environmental Protection. These additional wells were field checked prior
to sampling, and the appropriate data were entered into GWSI. Table 2
contains well-construction data and water-use information for the sampled
wells. The data are grouped by county and sorted by well number. The
locations of the sampled wells and delineation of outcrops (U.S. Geological
Survey, 1967 and Barksdale and others, 1943) are shown on plates I and 2.
Water samples were collected from a variety of pumped wells,observation wells, and unused wells. An effort was made to select wells
having a wide range of pump capacities so that the data collected would
provide different types of water-quality information. For example, large-
capacity wells draw water from a large volume of an aquifer; therefore, they
represent the average water quality within the aquifer in the vicinity of
the well (Wood, 1976, p. 4). Small-capacity wells draw water from a much
smaller volume of the aquifer; therefore, they represent the water quality
at one point in the aquifer.
Sample-Collection Methods
Methods used to collect and preserve samples for water-quality
analysis by the Survey are discussed in Brown and others (1970), Goerlitzand Brown (1972), and Wood (1976). Fusillo and others (1984, p. 6) outlines
the changes that have taken place in these methods from 1923 through 1983.
All samples consisted of raw (untreated) water. At most wells, waterwas collected from a tap near the wellhead. At a few wells, water passed
through a small holding tank prior to collection. Wells that were not
heavily used were sampled only after evacuating a minimum of at least two
well-casing volumes of water. Stabilization of water temperature, specific
conductance, and pH at these wells was a prerequisite for sample collection
(Wood 1976, p. 4).
7

At each sampled well, the following field measurements were typically
made: water temperature, specific conductance, dissolved oxygen, pH,
alkalinity, and bicarbonate concentration. Ground-water samples were
collected, processed, and preserved according to methods described in Wood
(1976), Brown and others (1970), and Goerlitz and Brown (1972).
Analysis of samples for certain constituents required that some
combination of filtering, preserving, and chilling be provided in the field.
For dissolved metals, samples were filtered through a 0.45 _m (micrometer)
filter and acidified with nitric acid to a pH of 2.0 or lower. To determine
nitrogen and phosphorus species, samples were filtered and preserved in
opaque bottles with mercuric chloride and kept chilled at 4 °C (Celsius).
For dissolved organic carbon, samples were filtered through a 0.45-_m
silver filter into a glass bottle and chilled at 4 °C. For volatile
organic compounds (VOCs), four replicate samples were collected in 40-mL
(milliliter) glass septum bottles and chilled at 4 °C.
Laboratory Analysis
Two different U.S. Geological Survey laboratories analyzed samples for
the study: the Atlanta National Water-Quality Laboratory in Doraville,
Georgia and the Denver Central Laboratory in Arvada, Colorado. In addition
to these laboratories, the New Jersey District Laboratory performed a scan
for volatile organic compounds on samples using a gas chromatograph.
Water samples were analyzed using U.S. Geological Survey methods for
the water-quality constituents listed in table 3. All analyses resulting
from samples collected for the study were checked as described in the
Quallty-Assurance Program section of this report. The laboratory analytical
methods that were used are discussed in Fusillo and others (1984, p. 8).The analytical methods used to determine concentrations of constituents in
samples collected during the 1984-86 sampling program are described in
Fishman and Friedman (1985). Cations were determined by the inductively-
coupled radiofrequency plasma (IGP) method (Fishman and Friedman, 1985, p.
49-50 and 659-671).
The District Laboratory's gas chromatographic (GC) scan can identify
30 VOCs (table 3) (James Kammer and Jacob Gibs, U.S. Geological Survey,written commun., 1988). Methods 601 and 602 of the U.S. Environmental
Protection Agency (19B4) are followed. Compounds detected in the scan are
identified based on retention time and relative response by two detectors: a
photoionization detector and a Hall I electrolytic conductivity detector.
A standard curve is developed for each compound in the scan. At least one
surrogate compound is added to each sample, and at least one blank and one
spiked blank are run for each set of I0 analyses. A concentration range for
a detected compound is estimated by applying the standard curve to the
integrated peak area on the chromatogram.
* The use of trade names in this report is for identification purposes
only and does not constitute endorsement by the U.S. Geological Survey.

Table 3.--Chemical constituents and physical characteristics
determined in well-water samples
FIELD MEASUREMENTS
Alkalinity Dissolved oxygen Temperature
Bicarbonate Specific conductance pH
DISSOLVED INORGANIC CONSTITUENTS
Silica Solids, residue on evaporation at 180 ° C
Cations
Aluminum Copper MolybdenumBarium Chromium Potassium
Beryllium Iron I SilicaBoron Lead Sodium
Cadmium Lithium Strontium
Calcium Magnesium Vanadium
Cobalt Manganese Zinc
Anions
Bicarbonate Fluoride Sulfate
Chloride
Nutrients
Ammonia, as nitrogen Ammonia + organic nitrogen, as nitrogen
Nitrite, as nitrogen Nitrite + nitrate, as nitrogenOrthophosphate, as phosphorus
ORGANIC CONSTITUENTS
Carbon, organic, dissolved Phenols, total
Total Or_anochlorine Compounds 2
Aldrin Chlordane DDD
DDE DDT DieldrinEndosulfan Endrin Gross PCBs
Gross PCNs Heptachlor epoxide Heptachlor
Lindane Methoxychlor Mirex
Perthane Toxaphene

Table 3.--Chemical constituents and physical characteristics
determined i_ well-water samples--Continued.
Total Org_nophospborus Insecticides
Diazinon Ethlon Malathion
Methyl parathion Methyl trithion ParathionTrithion
Total Triazipe Herbicides
Ametryne Atrazine CyanazinePrometone Prometryne Propazine
Simazine Simetryn
Total Volatile Organic Compounds
Chloromethane Bromomethane
Vinyl chloride Chloroethane
Methylene chloride l,l-Dichloroethenel,l-Dichloroethane 1,2-DichloroetheneChloroform 1,2-Dichloroethane
l,l,l-Triohloroethane Carbon tetrachlorideDichlorobromomethane 1,2-Dichloropropane
trans-l,3-Dichloropropene TrichloroetheneChlorodibromomethane l,l,2-Trichloroethane
cls-l,3-Diehloropropene 2-ChloroethylvlnyletherBromoform l,l,2,2-TetrachloroethaneTetrachloroethene Chlorobenzene
1,2-Dichlorobenzene 1,3-Dichlorobenzene
1,4-Dichlorobenzene BenzeneToluene Ethylbenzene
* Both total and dissolved iron concentrations were determined.
2 DDT (l,l,l-Trichloro-2,2-bis(paraehlorophenyl)ethane) and DDD
(l,l-Diehloro-2,2-bis(parachlorophenyl)ethane) are insecticides.DDE is a metabolite of DDT.
PCBs are Polychlorlnated Biphenyls.
PCNs are Polyehlorinated Naphthalenes.
i0

When VOCs were found in the District Laboratory scan at a
concentration of at least 3 #g/L (micrograms per liter), the detection
limit for volatile organic compounds analyzed at the Survey Laboratories,
two replicate septum bottles were sent to one of the two Survey laboratories
for gas chromatography-mass spectrometry (GC-MS) analysis of the sample.
Inadvertently, ten samples that showed positive results on the District GC-
MS scan were not analysed at the Survey laboratories.
Quality-Assurance Program
All laboratory results in this report were provided by Survey
laboratories. Data collected prior to September 1984 were subjected to
laboratory quality-assurance procedures in effect at the time of theanalysis (Fusillo and others, 1984, p. 9). A description of quality-
assurance methods used to check the data collected from October 1984 throughDecember 1986 are described below.
Quality-assurance for the study included (i) a check of the results of
each water-quality analysis, (2) requests for reruns if any aspect of the
results was questionable, and (3) submission of quality-assurance samples to
the laboratory. The quality-assurance samples, consisting of standard-
reference water samples (SRWS) and replicate field samples, were disguised
as ordinary well-water samples and sent to the laboratory intermittently
throughout the sampling period. Determinations of volatile organic
compounds by the District laboratory were checked by sending selected
duplicate samples to one of the Survey laboratories for additional analysis.
Each water-quality analysis was checked using procedures described byFriedman and Erdmann (1982, p. i03-I05). These procedures included (I)
calculation of the ion balance; (2) comparison of field measurements of
specific conductance, pH, and alkalinity with corresponding laboratorymeasurements; and (3) calculation of five different ratios and comparison
with ranges recommended by Friedman and Erdmann (1982, p. 103-105). The
five ratio checks included (i) dissolved solids to laboratory specific
conductance, (2 and 3) cations and anions (in milliequivalents per liter) tospecific conductance, (4) dissolved solids to calculated sum of the
constituents, and (5) calculated sum of the constituents to field specificconductance. Results of the checks were used to decide whether or not to
request laboratory reruns of one or more constituents. Reruns of trace-
metals were requested when the concentration was considered high or unusual.
The SRWS were obtained from the U.S. Geological Survey Quality-
Assurance Program in Lakewood, Colorado. The most probable concentration of
each constituent in a SRWS is determined by sending split samples to a
number of laboratories. A mean (the most probable concentration) andstandard deviation are calculated for each constituent based on the results
obtained from the participating laboratories (Friedman and Erdmann, 1982,
p. 67).
Two types of SRWS were used for quality assurance of the laboratory
results (I) SRWS for major-constituents (at specific conductances of 138,
294, and 1106 microsiemens per centimeter (#S/cm) and (2) SRWS for trace-
metals. For each constituent determined by the laboratory, the number of
standard deviations from the SRWS mean was computed and tabulated.
Ii
Aluminum, copper, potassium, and zinc had one measurement each that was
slightly more than two standard deviations from the mean. Measurements of
the other constituents were consistently within two standard deviations of
the mean. Plots of the study's SRWS results were compared with similar
plots (called control charts) covering the period March i0, 1985, through
November 5, 1985, prepared by the U.S. Geological Survey Quality-Assurance
Program (Dale Peart, U.S. Geological Survey, written commun., 1985). All of
the aluminum and copper measurements on the control plots were within the
two standard deviation limit. Only 2 of 130 potassium measurements and 4 of
55 zinc measurements fell outside this limit. Based on these results, major
inorganic constituent concentrations and trace-metal concentrations obtained
during this period are considered acceptable.
Dissolved nutrients and organic carbon are not included in major-
constituent SRWS or trace-metal SRWS analyses. To check laboratory
performance on these constituents, replicates of actual ground-water samples
were submitted for analysis. Based on results of these analyses, nutrient
and organlc-carbon data provided by the Survey laboratories are considered
acceptable.
As a check on the performance of the District Laboratory's VOC
results, duplicate samples were sent to one of the two Survey laboratories.
These laboratories performed a GC-MS analysis (Wershaw and others, 1987,
p.12) for 27 of the 30 volatile organic compounds in the District
Laboratory's GC scan. Other than some minor discrepancies, all
concentrations were approximately the same as the District Laboratory
values; therefore, VOC data provided by the District Laboratory areconsidered reliable.
WATER-QUALITY DATA
A total of 380 water-quality analyses are listed in table 4 (in back
of text). Of these analyses, 213 are from wells screened in the upper
aquifer and 167 are from wells screened in the middle aquifer. This total
includes well 25-548 in Matawan Borough, which is screened in sediments of
the uppermost Magothy Formation overlying the upper aquifer of the Potomac-
Raritan-Magothy aquifer system. The water quality of the sample taken from
this well is similar to samples from nearby wells screened in the upper
aquifer (wells 25-288, 25-294, and 25-295); therefore, data from this well
were included with data from wells screened in the upper aquifer.
Analyses were included in table 4 only if values for either calcium
and magnesium, or sulfate and chloride, were available. The data are
grouped by aquifer and sorted by well number. Many of the nutrient and
trace-metal constituents reported in the table are at or below the detection
limits for the analytical methods employed. Constituents not detected in a
sample are reported as the value of the detection limit for that particular
analysis, preceded by a less than symbol (<). The detection limit for a
constituent changed if the sample was diluted or if a different method of
analysis was used.
Apparent inconsistencies may exist in some data in table 4. For
instance, the total iron concentration may be less than the dissolved iron
12

concentration. The difference in the inconsistent values, however, is
smaller than the precision of the analytical techniques.
The field measurements and inorganic constituents listed in table 3
are included in table 4. Organic carbon and phenols also are individually
listed in the table, but total VOCs are lumped together under the heading
VOC analysis. Total organochlorine compounds, total organophosphorus
insecticides, and total triazlne herbicides are lumped together under the
heading pesticide analysis. Under the VOC scan heading there are symbols
indicating whether or not any VOCs were found at or greater than 0.8 pg/L
using the New Jersey District gas chromatograph.
Table 5 (in back of text) lists temperature, specific conductance, and
chloride concentrations for ground-water samples collected in the study areafor the period 1923-86. These analyses (in addition to chloride) also are
listed in table 4 if values for either calcium and magnesium, or sulfate,
are available. For samples collected prior to 1975, specific conductance
may not have been measured in the field. Therefore, for the period 1923-74,
specific conductance is considered to be a laboratory measurement.
Table 6 lists the concentrations of volatile organic and pesticidecompounds detected by the U.S. Geological Survey central-laboratory system.
Tables 7 and 8 are statistical summaries of selected water-quality
characteristics of water in the upper and middle aquifers, respectively.
The most complete analysis for 1984-86 was selected to generate the
statistics in the tables. No more than one analysis was used for each wellsampled. For those wells that had more than one complete analysis, the most
recent complete analysis was used to generate the statistics.
DATA STATISTICS
Water from more than 25 percent of the wells sampled for lead
contained concentrations greater than the detection limit of i0 pg/L.Included in this number are some wells that contained lead concentrations
greater than the U.S. Environmental Protection Agency (USEPA, 1976) primary
drinking-water regulation of 50 #g/L. Cadmium concentrations, althoughlower than lead concentrations, followed a similar pattern. In
approximately 25 percent of the wells sampled for cadmium in the upper
aquifer, the concentrations were at or greater than the detection limit of I
#g/L.
Dissolved iron concentrations ranged from 5 pg/L to 480,000 pg/L.
More than 50 percent of the samples from each aquifer had iron
concentrations in excess of the USEPA (1979) secondary drinking-water
recommended limit of 300 pg/L.
The highest dissolved lead and dissolved iron concentrations, 130 and
480,000 _g/L, respectively, were measured in water from an unused well
(25-208) in Keyport Borough. This well is screened in the upper aquifer.
In water from the middle aquifer, the highest dissolved lead and dissolved
iron concentrations were 130 and 240,000 pg/L, respectively, measured in
water from well 23-371, an unused well in Sayreville Borough.
13

Chloride concentrations greater than the USEPA (1979) secondary
drinking-water recommended limit of 250 mg/L were found in samples from
wells in the cities of Perth Amboy and South Amboy, the boroughs ofKeansburg, Sayreville, Keyport, and Union Beach, and the townships of OldBridge and Woodbridge (table 5).
For the upper aquifer, the chloride values ranged from 1.2 to 2,500
"mg/L. The higher value was reported in water from well 25-208 in Keyport
Borough. For the middle aquifer, the chloride concentrations ranged from1.0 to 5,500 mg/L; the higher value was reported in an observation well (23-
1056) in Sayreville Borough.
Of the 21 samples collected from wells screened in the upper aquiferand analyzed for 30 volatile organic compounds, 5 samples contained at leasti VOC at or above the detection limit. This number excludes well 23-31
(table 6). In the middle aquifer, 12 of the 21 samples collected and
analyzed for VOCs contained at least I VOC greater than the detection limit.
Concentrations of pesticides generally were low. Of the 43 samples
collected from wells screened in the upper aquifer and analyzed for
pesticides, 4 samples contained concentrations of pesticides at or greater
than the detection limit. In the middle aquifer, 6 of 38 samples collectedand analyzed for 32 pesticides contained at least I pesticide with aconcentration greater than the detection limit.
14

Table 6.--Volatile orqanic and pesticide compounds
greater than the detection limit
[_g/L is micrograms per liter]
VOC Pesticide
Date of analysis analysis
sample Name of compound (_g/L) I (_g/L)
Upper aquifer, Potomac-Raritan-Maqothv aauifer system
Well 23-15 CRANBURY TWP WD 2-1917
04-15-1985 lindane .09
Well 23-31 MONTREY, A N 1-1970
11-05-1985 dichlorodifluoromethane 2 20
Well 23-172 DUHERNAL WC 1-1938
03-20-1985 tetrachloroethene 15
Well 23-177 DUHERNAL WC 18-1951
03-20-1985 tetrachloroethene 19
Well 23-195 PERTH AMBOY WD 5-1965
04-11-1985 toluene 20
Well 23-292 MONROE TWP MUA OBS 2-61
04-09-1985 DDD .07
Well 23-383 EI DUPONT-PARLIN 8A-1954
03-21-1985 benzene 17
03-21-1985 1,2-dichloroethene 56
Well 23-515 RAAB, GEORGE FARM 1
04-09-1985 atrazine .5
07-16-1986 atrazine .5
Well 23-557 SOUTH AMBOY CITY WD 9A
04-10-1985 tetrachloroethene 3.0
15

Table 6.--Volatile orqanic and pesticide compounds
qreater than the detection limit--Continued.
VOC Pesticide
Date of analysis analysissample Name of compound (_g/L) I (_g/L)
Middle aquifer, Potomac-Raritan-Maqothy aquifer system
Well 23-13 STULTZ 1-1954
08-06-1985 parathion .01
Well 23-80 HERBERT SAND RANNEY WET,T,
04-17-1985 toluene 530
04-17-1985 benzene ii0
04-17-1985 ethylbenzene 33
Well 23-89 ALCOA EDISON WRKS PI-59
04-10-1985 l,l,l-trichloroethane 1304-10-1985 atrazine .3
Well 23-255 CARBORUNDUM CO 1-1955
04-12-1985 trichloroethylene 21
Well 23-283 SIMONSON BROS 2 IRR 1967
06-03-1986 simazine .3
06-03-1986 dieldrin .03
Well 23-319 S BRUNSWICK MUA 12-1963
08-02-1985 l,l-dichloroethene 3.0
08-02-1985 l,l,l-trichloroethane 6.2
Well 23-322 S BRUNSWICK MUA ii-196q
03-19-1985 tetrachloroethene 63
03-19-1985 l,l-dichloroethane ii0
03-19-1985 l,l,l-trichloroethane 210
07-02-1986 tetrachloroethene 44
07-02-1986 l,l-dichloroethene 25
07-02-1986 l,l,l-trichloroethane 68
16

Table 6.--Volatile orqanic and pesticide compounds
qreater than the detection limit--Continued.
VOC Pesticide
Date of analysis analysis
sample Name of compound (_g/L) I (_g/L)
Middle aquifer, Potomac-Raritan-Maqothy aquifer system
Well 23-441 HERBERT SAND HSC 3-1964
04-17-1985 toluene 15
04-17-1985 benzene 14
04-17-1985 chlorobenzene 5.9
Well 23-543 SHELL OIL 5(S2)
04-16-1985 benzene 55
Well 23-704 IBM CORP GW 8-1978
04-18-1985 tetrachloroethene 7.5
Well 23-715 IBM CORP GW 17-1978
04-18-1985 tetrachloroethene 33
04-18-1985 l,l,l-trichloroethane 71
Well 23-734 MIRANOL CHEMICAL 1-1981
04-16-1985 tetrachloroethene 76
04-16-1985 l,l-dichloroethene 180
04-16-1985 l,l,l-trichloroethane 300
Well 23-736 SIMONSON BROS DOM 1965
03-15-1985 dieldrin .02
03-15-1985 atrazine .i
06-03-1986 dieldrin .03
17

Table 6.--Volatile orqanic and pesticide compounds
qreater than the detection limit--Continued.
VOC Pesticide
Date of analysis analysis
sample Name of compound (_g/L) I (_g/L)
Middle aquifer, Potomac-Raritan-Maqothy aquifer system
Well 23-738 ROSENSTOCK,WALTER DOM-56
07-15-1986 toluene 77
07-15-1986 ethylbenzene 5.9
07-15-1986 prometryne .i
07-15-1986 atrazine .9
i VOC analysis: U.S. Geological Survey gas chromatography-massspectrometry (GC-MS) analysis which has a detection limit of3 _g/L.
2 Dichlorodifluoromethane usually is not included in the VOCanalysis
18

Table 7.--Statistical summary of water analyses 1 from the upper aquiferof the Potomac'Rarltan'Magothy aquifer system, 1984-86
['C, degrees Celsius; _S/cm, mlcroslemens per centimeter; mg/L, milligrams per liter; _g/L, microgramS per liter]
Number 25th 75th
Constituent or of per- per-
characteristic analyses Minir_ centile Median centile Maximum
Temperature ('C} 151 9.5 12.5 13.5 14.5 20
Specific conductance (_S/cm) 144 42 71 115 193 7,350Oxygen, dissolved (mg/L) 139 <.1 .2 .3 2.8 12.4
t_ (standsrd units) 151 4 4.7 5.8 6.3 7.8Field alkalinity (mg/L as CaCO3) 114 <1 3 11 27 99
Lab Alkalinity (mg/L as CaCO3) 143 <1 <1 5 13 90Field Bicarbonate (m_/L as HC03) 108 <1 3 15 37 122
Solids 2, dissolved (mg/L) 118 13 43 78 129 4,170Calcium, dissolved (mg/L) 144 .42 3 5.2 g 160
Magnesium, dissolved (r_J/L) 144 .35 1.5 2.4 4.2 120
Sodium, dissolved (rng/L) 144 1.3 1.8 3.3 8.8 910
Potassium, dissolved (mg/L) 119 <.1 1.2 1.7 2.4 10
Chloride, dissolved (mg/L} 152 1.2 2.3 5.8 23.7 2,500
Sulfate, dissolved (mg/L) 140 .2 9.1 17.5 32.7 350
Fluoride, dissolved (mg/L) 83 <.1 <.1 <.1 <.1 .4
Silica as Si04, dissolved (mg/L) 144 2.3 7.5 8.3 9.1 29
Iron, total recoverable (_g/L) 114 30 865 5,100 9,425 500,000
Iron, dissolved (_g/L) 144 5 800 5,500 9,975 480,000
Barium, dissolved (_g/L) 141 11 41 63 97 480
Beryllium, dissolved (_g/L) 141 <.5 <.5 <.5 .7 9
Cadmium0 dissolved (_g/L) 144 <1 <1 <1 1 56
Chromium, dissolved (_9/_) 39 <1 <10 <10 <10 20
Cobalt, dissolved (_g/L) 141 <3 <3 <3 9 250
Copper, dissolved (_g/L) 144 <1 <10 <10 20 320
Lead, dissolved (_g/L) 1_3 <5 <10 <10 20 130Manganese, dissolved (_g/L) 144 2 50 110 170 7,200
Molybdenum, dissolved (_g/L) 141 <10 <10 <10 <10 50
Strontium, dissolved (_gJL) 141 4 28 52 98 1,300
Vanadium, dissolved (_g/L) 141 <6 <6 <6 <6 57
Zinc, dissolved (_g/L) 144 <3 12 28 68 5,200
Aluminum, dissolved (_g/L) 138 <10 <100 100 300 18,000
Lithium, dissolved (#g/L) 141 <4 5 10 15 60
Ammonia as N, dissolved (mg/L) 134 <.01 .01 .05 .09 1.4
Nitrite as N, dissolved (nKj/L) 13& <.01 <.0_ <.01 <.01 .05
Kjeldaht N as N, dissolved (mg/L) 133 <.2 .2 .3 .5 2.8
NO2 + NO S as N, dissolved (mcj/L) 133 <.1 <.1 <.1 .29 13
Orthophosphate as P, diss (mg/L) 133 <.01 <.01 <.01 <.01 .46
Organic Carbon, dissolved (mg/L) 108 .2 .8 1 1.5 30
Phenols, total (mg/L) 104 <1 <1 1 2 23
l Restricted to only one analysis per well
2 Residue on evaporation at 180"c
19

Table 8.--$tatLstical sur_nary of water analyses 1 from the middle aquifer
of the Potomac-Raritan-HaRothy aquifer system, 1984-86
['C, degrees Celsius; #S/om, microsiomens per centimeter; mg/L, milligrams per Liter; #g/L, micrograms per lLter]
Number 25th 75thConstituent or of per- per-characteristic analyses Minimum centile Median centile Xaxim_
Temperature ('C) 111 11.5 12.5 13.5 14.5 19.S
Specific conductance (#S/cm) 110 31 58 110 264 11,100
Oxygen, dissolved (mg/L) 103 .1 .2 .4 5.2 13
pH (sttu_dard units) 110 4 5.1 5.5 5.8 8
Field alkalinity (mg/L as CsC03) 83 <1 4 10 13 288
Lab _tkalinity (rag/L as CaCOs) 109 <1 <1 3 9 304
Field Bicarbonate (mg/L as HC03) 79 <1 5 10 15 351
Solids 2, dissolved (mg/L) 85 21 35 55 119 9,910
Calcium, dissolved (mg/L) 106 .61 2.6 5 12.2 330
Magnesium, dissolved {mg/L) 106 .26 1 2.5 6.1 180
Sodium, dissolved (mg/L) 106 1.4 2.6 5.5 12 1,600
Potassium, dissolved (mg/L) 83 <.1 .9 1.4 2.2 54
Chloride, dissolved (mcj/L) 111 1 3.6 11 27 5,500
Sulfate, dissolved (mg/L) 108 <.2 4.1 10 31.8 790
FLuoride, dissolved (mg/L) 60 <.1 <.1 <.1 <.1 .2
Silica as Si04, dissolved (mg/L) 106 ,4 8 8.8 10 41
lron_ total recoverable (#g/L) 81 <10 160 _,300 4,250 13,000
Iron, dissolved(_g/L) 106 5 99 2,650 6,700 260,000
Barium, dissolved C_9/L) 103 6 38 56 95 670
Beryllium, dissolved {#g/L) 103 <.5 <.5 <.5 <.6 2
Cadmium, dissolved (#g/L) 106 <1 <1 <1 <1 17
Chromium, dissotved(#g/L) 30 <1 <10 <10 10 20
Cobalt, dissolved (#g/L) 103 <3 <3 <3 5 130
Copper, dissotved(_g/L) 106 <1 <10 <10 20 600Lead, dissolved (_g/L) 105 <S <10 <10 10 130
Manganese, dissotved(#g/L) 106 <1 21 61 227 6,200
Molybdenum, dissolved (#g/L) 105 <10 <10 <10 <10 30Strontium, dissolved (_g/L) 105 6 30 49 160 2,100
Vanadium, dissolved (#g/L) 103 <6 <6 <6 <6 <20Zinc, dissolved (#g/L) 106 <3 9 20 46 2,200
Aluminum, dissolved (#g/L) 107 <10 <100 100 300 6,500
Lithium, dissolved (#g/L) 103 <4 <4 8 16 63
Aamonia as N, dissolved (mg/L) 107 <.01 <.01 .03 .09 2.1
Nitrite as N, dissolved (mg/L) 107 <.01 <.01 <.01 <.01 .11
Kjetdahl N as N, dissolved (mg/L) 102 <.2 <.2 .3 .6 5.6
NO2 + NO3 as Nw dissolved (mg/L) 106 <.1 <.1 <.1 2.1 13
Orthophosphate as P, diss (mg/L) 105 <.01 <.01 <.01 <.01 .48
Organic carbon, dissolved (mg/L) 80 .3 .7 .9 1.3 3.7
Phenols, total (mg/L) 68 <1 <1 1 2 11
t Restricted to only one analysis per wett
2 Residue on evaporation at 180"C
2O

REFERENCES CITED
Back, William, 1966, Hydrochemical facies and ground-water flow patterns in
the northern part of Atlantic Coastal Plain: U.S. Geological SurveyProfessional Paper 498-A, 42 p.
Barksdale, H.C., Johnson, M.E., Baker, R.C., Schaefer, E.J., and
DeBuchananne, G.D., 1943, The ground-water supplies of Middlesex County,
New Jersey: State of New Jersey, State Water Policy Supply Commission,
Special Report 8, 160 p.
Brown, Eugene, Skougstad, M.W., and Fishman, M.J., 1970, Methods for
collection and analysis of water samples for dissolved minerals and
gases: U.S.Geological Survey Techniques of Water-Resources
Investigations, Book 5, Chapter AI, 160 p.
Farlekas, G.M., 1979, Geohydrology and digital-simulation model of the
Farrington aquifer in the northern Coastal Plain of New Jersey:
U.S.Geological Survey Water-Resources Investigations 79-106, 55 p.
Fishman, M.J., and Friedman, L.C., eds., 1985, Methods for determination of
inorganic substances in water and fluvial sediments: U.S. Geological
Survey Techniques of Water-Resources Investigations, Book 5, Chapter AI,
Open-File Report 85-495, 709 p.
Friedman, L.C., and Erdmann, D.E., 1982, Quality as§urance practices for the
chemical and biological analyses of water and fluvial sediments: U.S.
Geological Survey Techniques of Water-Resources Investigations, Book 5,
Chapter A6, 181 p.
Fusillo, T.V., Hochreiter, J.J., Jr., and Lord, D.G., 1984, Water-quality
data for the Potomac-Raritan-Magothy aquifer system in southwestern New
Jersey, 1923-83: U.S. Geological Survey Open-File Report 84-737, 127 p.
Goerlitz, D.F., and Brown, Eugene, 1972, Methods for analysis of organicsubstances in water: U.S. Geological Survey Techniques of Water-
Resources Investigations, Book 5, Chapter A3, 40 p.
Leahy, P.P., 1985, Management of ground-water and evolving hydrogeologic
studies in New Jersey: U.S. Geological Survey Water-ResourcesInvestigations Report 85-4277, 27 p.
Schaefer, F.L., 1983, Distribution of chloride concentrations in the
principal aquifers of the New Jersey Coastal Plain, 1977-81: U.S.
Geological Survey Water-Resources Investigations Report 83-4061, 56 p.
Schaefer, F.L., and Walker, R.L., 1981, Saltwater intrusion into the Old
Bridge aquifer in the Keyport-Union Beach area of Monmouth County, New
Jersey: U.S. Geological Survey Water-Supply Paper 2184, 21 p.
U.S. Environmental Protection Agency, 1976, National interim primary
drinking water regulations: U.S. Environmental Protection Agency Office
of Water Supply, Washington, D.C., EPA-570/9-76-O03, 159 p.
21

REFERENCES CITED--Continued
..... 1979, National interim secondary drinking water regulations: Federal
Register, Volume 44, No. 140, Thursday, July 19, 1979, Rules andRegulations, p. 42195.
..... 1984, Methods for organic chemical analysis of municipal and
industrial wastewater, Methods 601 (purgeable halocarbons) and 602
(purgeable aromatics), Appendix A to Part 136: Federal Register,
Volume 49, No. 209, Friday, October 26, 1984, Rules and Regulations,p. 29-48.
U.S. Geological Survey, 1967, Engineering geology of the Northeast Corridor,
Washington, D.C. to Boston, Mass. Coastal Plain and surficial deposits:
U.S. Geological Survey Miscellaneous Geologic InvestigationsMap 1-514-B, 8 sheets, scale 1:250,000.
Vowinkel, E.F., 1984, Ground-water withdrawals from the Coastal Plain of New
Jersey, 1956-80: U.S. Geological Survey Open-File Report 84-226,32 p.
Wershaw, R.L., Fishman, M.J., Grabbe, R.R., and Lowe, L.E., eds., 1987,Methods for determination of organic substances in water and fluvial
sediments: U.S. Geological Survey Techniques of Water-Resources
Investigations, Book 5, Chapter A3, 80 p.
Wood, W.W., 1976, Guidelines for collection and field analysis of ground-
water samples for selected unstable constituents: U.S. Geological
Survey Techniques of Water-Resources Investigations, Book i, ChapterD-2, 24 p.
Zapecza, O.S., 1984, Hydrogeologie framework of the New Jersey Coastal
Plain: U.S. Geological Survey Open-File Report 84-730, 61 p.
22

Table 2.--Records of sampled wetis
[ft, foot; in., inch; --, indicates data not available]
Attitude Screen
NJ-WRD of rand Screen dia- Aqui- Use
weft Locat weft surfacer setting2 meter Year fer of Use of
number identifier Municipatity (ft) (ft) (in.) drilled unit B site 4 water B
23-7 HAGARTY, JUDSON 1-64 CRANBURYTWP 100 Z68- 298 10 1964 FRNG W N
23-8 DAVISON JR, A 1-IRR-55 CRANBURYTWP 100 95- 111 7 1955 ODBG W l
23-13 STULTZ 1-1954 CRANBURYTWP 100 133- 163 10 1954 FRNG W I
23-14 CRANBURYTWP WD 1-1906Z CRANSURYTWP 100 238- 258 8 1906 FRNG Z U
23-15 CRANBURYTWP WI) 2-1917 CRANBURYTWP 95 110" -- 1917 OOBG W P
23-17 CRANBURYTWP ted 5-1963 CRANBURYTWP 98 2645- 298 10 1963 FRNG W P
23-20 CARTERWALLACE3A-68 CRANSURYTWP 120 163- 203 12 1968 ODBG W N
23-24 DANSER, CLENDON1-1959 CRANBURYTWP 120 152" -- 1959 ODBG W I
23-29 NJ TPKE SERV AREA 75-1 CRANBURYTWP 125 385* .... FRNG g P
23-30 NJ TRKE SERV AREA 7S-2 CHANBURYTWP 120 143- 158 8 1951 OOBG Z U
23-31 NONTREY, A N 1-1970 CRANBURYTWP 120 80- 90 4 1970 ODBG W H
23-38 HUTCHINSONN T I(ZAVETZ) EAST BRUNSWICKTWP 145 100- 104 4 1955 FRNG W H
23-39 KOHUK%1956 EAST BRUNSWICKTWP 140 225- 245 8 1956 FRBG W I
23-46 POLYSAR 1-1968 EAST BRUNSWICKTWP 100 200- 230 10 1968 FRNG W N
2]-54 ANBEUSERBUSCH 3-1948 EAST BRUNSWICKTWP 30 57- 72 16 1948 ODBG W N
23-58 TAMARACKGOLFCOURSE1-75 EAST BRUNSWICKTWP 110 87- 107 8 1975 FRNG W I
23-59 EAST BRUNSWICKWO 2-55 EAST BRUNSWICKTWP 120 180- 220 12 1955 FRNG W P
23-63 EAST BRUNSWICKWO 1-51 EAST BRUNSWICKTWP 110 161- 181 12 1951 FRNG W P
23-69 C P S CHEMICAL CO 1975 OLD BRIDGE TWP 10 56- 66 8 1975 OOBG W N
23-72 SMITH, LAWRENCE2-1972 EAST BRUNSWICKTWP 80 120- 130 6 1972 FRNG W I
23-80 HERBERTSAND RANREYNELL EAST BRUNSW]CKTWP 28 18" .... FRNG W F
23"89 ALCOA EDISON WRKS P1"59 EDISON TWP 70 26* -- 1959 FRNG W N
23-94 HELMETTA WC 5-1962(0LD2) HELMETTA BORO 60 183- 193 8 1962 FRNG W N
2.3-96 HELNETTA WC6(4-R) 1972 HELNETTA BORO 40 32- 42 10 1972 OOBG W P
23-98 NJ WATER CO-JAMESBURG6 JAMESBURGBORO 50 99- 120 8 1954 ODBG W P
23-100 NJ WATER CO-JM4ESBURG7 J/_MESBURGBORO 50 118- 129 8 1955 OOBG W P
23-108 DUHERNAL WC 13-1947 OLD BRIDGE TWP 30 87- 107 18 1947 OOBG W N
23-110 DUHERNALWC 11-1942 OLD BRIDGE TWP 20 77- 97 18 1942 (X_BG W N
23-121 DUHERNALWC 12-1968 OLD BRIDGE TWP 20 75- 85 16 19_ 08BG W R
23-127 DUHERNALWC AF-1945 OLD BRIDGE TWP 10 236- 296 12 1945 FRNG W H
23-131 DUHERNAL WC 8-1938 OLD BRIDGE TWP 24 65- 80 17 1938 ODBG W N
23-132 DUHERNALWC 08S-56F-1947 OLD BRIDGE TWP 25 262" 267 3 1947 FRNG O U
23-135 OLD BRIDGE MUA BRN 2-66 OLD BRIDGE TWP 100 190" 248 12 1966 OOBG W P
23-145 OLD BRIDGE MUA 11-1972 OLD BRIDGE TWP 30 80- 120 16 1972 OOBG W P
23-146 OLD BRIDGE MUA BRN 3"66 OLD BRIDGE TWP 80 435- 480 10 1966 FRNG W P
23-147 OLD BRIDGE MUA BRN 4"66 OLD BRIDGE TWP 80 425" 475 10 1966 FRNG W P
23-156 OLD BRIDGE MUA 10-1972 OLD BRIDGE TWP 30 90" 120 16 1972 OOBG W P
23-171 DUHERNALWC BF-1946 OLD BRIDGE TWP 20 240- 300 16 1946 FRNG W N
23-172 DUHERNALWC 1-1938 OLD BRIDGE TWP 10 55- 75 17 1938 OOBG W N
23-177 DUHERNAL WC 18-1951 OLD BRIDGE TWP 10 52" 67 18 1951 ODBG W N
23

Tabte 2.--Records of sampled wefts--Continued.
ALtitude Screen
NJ-WRO of [and Screen dia- Aqui- Use
we|t LocaL" well surface I setting 2 meter Year fer of Use of
nt=_ber identifier Municipality (ft) (ft) (in.) drilled unit 3 site 4 water s
23-192 PERTH AMBOYkl) 3-1951 OLD BRIDGE TWP 20 48- _ 16 1951 OOBG W P
23-193 PERTH M400Y kl) 4-1955 OLD BRIDGE T_/P 20 52- 67 16 1955 OUBG W P
23-196 PERTH AHBOYWD RORYON1 OLD BRIDGE T_P 18 201- 281"* 18 1930 FRNG 0 U
23-195 PERTH AMBOYWD 5-1965 OLD BRIDGE TWP 10 50- 80 16 1965 ODBG W P
23-196 PERTH AMBOYWD 1A-1968 OLD BRIDGE TWP 20 201- 261 12 1968 FRNG W U
23-197 PERTH AMBOY kl)2-1944 OLD BRIDGE TWP 20 205- 260 16 1944 FRNG W U
23-203 O$CHWALDBRICK 1-1914 OLD BRIDGE TWP 60 156- 200 6 1914 ODBG Z
23-205 OLD BRIDGE TWP MUA-LH 1 OLD BRIDGE TWP 60 193- 213 10 1948 OOBG W P
23-206 OLD BRIDGE TWP MUA-LH 2 OLD BRIDGE TWP 60 360- 395 10 1953 ERNG W P
23-218 KOPPEL 1-1968 MONROETWP 130 1T_- 17"[ 3 19_ OOBG W H
23-219 MOMROETWP MUA 8-R 1952 MONROET_P 160 292- 325** -- 1952 ODBG Z U
23-221 PAPROCKI, PETER 1954 MONROETWP 160 175- 179 4 1954 OOBG W H
23-222 MONROE MUA-FORSr_TE 5-54 MONROE TWP 130 182- 202 4 1954 OOBG W P
23-225 INDYK, JOSEPH S 1951 MONROETt_P 60 236- 240 4 1951 OOBG W H23-226 GENERAL FO00S 2-1967 MONROE TWP 130 330- 364 12 1967 FRNG W N
23.227 GENERAL FO00S 3-1967 MONROETWP 140 168- 198 12 1967 OOBG W N
23.228 MONROEMUA-FORSGATE30B MONROETWP 147 128- 138 6 1961 OOBG 0 U
23-229 MONROEMUA-FORSGATE40B MONROET_P 147 319- 330 6 1961 FRNG 0 U23.232 MONROEMUA-FORBGATE11 MONROETWP 130 272- 314 12 1961 FRNG W P
23"234 JH4E$BURG 80_8 _ORE 3 MONROETWP 95 ...... FRMG Z U
23"236 JAMESBURGBOYS HONE4 MONROETWP 100 410" 440 8 1963 FRNG Z U
23-240 MONROETWP MUA 12 1961 MONROETWP 140 305" 353 12 1961 FRNG W P
23"244 REESE, AUGUST 1971 MONROETWP 60 152" 158 4 1971 OOBG W H23-251 RAR]TAH STEEL CO 11 1944 PERTH AMSOYCITY 20 29- 40 10 1944 FRHG U U
23"252 RARITAN STEEL CO 18 1926 PERTH AMBOYCITY 25 55* -- 1926 FRNG Z U
23-253 RARITAN STEEL CO 16A-57 PERTH ANBOYC]TY 20 43- 58 16 1957 FRNG Z U
23-255 CARBORUNDUMCO 1-1955 PERTH AMBOYCITY 20 57- 67 12 1955 FRNG W N
23"261 CHEVROHOIL CO 1-1951 PERTH AMBOYCITY 40 74- 83 12 1951 ERHG g H
23-263 CHEVRONOIL CO 2-1950 PERTH AMBOYCITY 40 96- 106 12 1950 FRNG g N
23-264 CHEVRONOIL CO OBS 2 PERTH AMBOYCITY 40 96" 106 .... FRNG 0 U
23"266 CHEVRONOIL CO 3"1951 PERTH AMBOYCITY 50 67" 96 12 1951 FRNG U U
23"270 HER CYANAMID CO TEST 2 PERTH AMBOYCITY 12 53" 57 .... FRHG 0 U
23"283 $IMONSON BROS 2 IRR 1967 PLAINSBORO TWP 90 80* "" 1967 FRNG W ]
23"289 MONROETWP MUA 15 1956 SOUTH BRUNSWICKTWP 140 227" 257 20 1956 FRNG W g
23-291 MONROEMUA-FORSGATE10B SOUTH BRUNSWICKTWP 100 192- 203 6 1961 FRNG 0 U
23"292 MONROETWPMUAOBS 2"61 SOUTH BRUNSWICKT_P 106 93" 104 6 1961 ODEG 0 U
25-295 INTERN PERMALITE L C 1 SOUTH BRUNSWICKTWP 120 187- 233 -- 1966 FRNG g N
23-299 BASF-WYANDOTTE1 SOUTH BRUNSWICKTWP 120 107- 129 12 -- OOBG W H
23-300 BASF-WYANDOTTE2 1966 SOUTH BRUNSWICKTWP 130 248" 288 12 1966 FRNG W N
23-304 PHELPS DOOGECO 1R-1962 SOUTH BRUNSWICKTWP 127 192- 222 12 1962 FRNG W H
24

Table 2.--Records of sampled wells--Continued.
Attitude Screen
NJ-WRD of land Screen dia- Aqui- Use
welt Local welt surface I setting 2 meter Year fer of Use of
number identifier Municipality (ft) (ft) (in.) drilled unit 3 site 4 water s
23-305 PHELPS DOOGECO 1-1957 SOOTH BRUNSWICKTWP 127 205- 225 8 1957 FRNG Z U
23-307 KORDUS 1-1961 MONROETWP 120 100- 120 8 1961 O08G W !
23-311 SOUTHARO1-WICKMAN, W-57 SOOTH BRUNSWICKTWP 110 104- 107 4 1957 FRHG W H23"319 S BRUNSWICKHUA 12-1963 SOOTH BRUNSWICKTWP 92 110- 135 12 1963 FRNG W P
23-322 S BRUNSWICKMUA 11-1963 SOUTH BRUNSWICKTWP 122 95- 115 12 1963 FRNG W P
23-323 SMITH 1966 (DOMESTIC) SOOTH BRUNSWICKTWP 100 154" 164 6 1966 FRNG W H
23-325 HID EAST ALUM 1ANOOIZNG SOOTH BRUNSWICKTWP 110 10% 116 10 1963 FRNG W N
23-328 GIBBS NURSERY1973 SOOTH BRUNSWICKTWP 130 86- 96 4 1973 OOBG W H
23-332 AHMED, MUSTAPHA2-1958 SOOTH BRUNSWICKTWP 110 178- 208 10 1958 FRNG W !23-346 SAYREVILLE BOROWO B-58 SAYREVILLE BORO 27 71- 81 12 1958 OOBG W P
23-351 SAYERVILLE BORO kl) 10B SAYREVILLE BORO 35 76- 82 6 -- OOBG 0 U
23-352 SAYREVILLE BOROWD N-67 SAYREViLLE SORO 34 225- 280 18 1967 FRNG W U
23-354 SAYREVILLE BORO k_) C-58 SAYREVILLE BORO 32 60- 73 12 1958 OOBG Z U
23-355 SAYREVILLE BORO WD A-69 SAYREVILLE BORO 30 72- 82 12 1969 OOBG W P
23-356 SAYREVILLE BORO WD F-59 SAYREVILLE BORO 28 53- 74 12 1959 OOBG W P
23-358 SAYREVILLE BORO WOK-65 SAYREVILLE BORO 48 70- 80 12 1965 0080 W P
23-359 SAYREVILLE BORO _) 0"58 SAYREVILLE BORO 29 64- 75 12 1958 ODBG W P
23-364 SAYREVILLE BORO WD 3-37 SAYREVILLE BORO 5 107" -- 1937 FRNG 0 U
23-365 OUHERNALSAYER 4 0BS-31 SAYREVILLE BORO 5 148" 160 "" 1931 FRNG 0 U
23-366 SAYREVILLE BOROWD L-65 SAYREVILLE BORO 63 79- 89 12 1965 OOBG W P
23-367 SAYREVILLE BOROWD G'60 SAYREVILLE BORO 46 56- 87 12 1960 OOBG W P
23-368 SAYREVILLE BORO kO 1-60 SAYREVILLE BORO 60 83- 94 12 1960 OOBG g P
23-369 SAYREVILLE BORO WOH-60 SAYREVILLE BORO 45 67- 83 12 1960 OOSG
23-370 HERCULESINC. 6-1946 SAYREVILLE BORO 20 164- 194 10 1946 FRNG W U
23-371 HERCULES IHC. 5-1929 SAYREVILLE BORO 48 102" 228 12 1929 FRNG W U
23-376 HERCULES INC. 3-1928 SAYREVILLE BORO 40 180" 220 12 1928 FRNG W N
23-380 HERCULES INC. 2-1927 SAYREVILLE BORO 48 181- 237 12 1927 FRNG W N
23-382 El DUPONT-PARL]N 8-1937 SAYREVILLE BORO 93 98- 118 16 1937 ODBG Z U
23-383 El OUPONT-PARLIN 8A-1954 SAYREVILLE BORO 96 97- 116 12 1954 ODBG W N
23-384 HERCULES INC. 1R-1939 SAYREVILLE BORO 54 170- 225 12 1939 FRNG W H
23-386 El DUPONT-PARLIN 6-1930 SAYREVILLE BORO 102 253" 314 12 1930 FRNG W N
23-389 El DUPONT-PARLIN 5-1928 SAYREV!LLE BORO 106 249- 304 18 1928 FRNG W N
23-392 EI DUPONT'PARLIN 1"1924 SAYREVILLE BORO 101 237" 291 13 1924 FRNG W N
23-393 El DUPONT-PARLIN 3-1925 SAYREVILLE BORO 94 244- 285 12 1925 FRHG W N
23-401 SAYREVILLE BOROWD P'67 SAYREVILLE BORO 45 254- 288 18 1967 FRNG W P
23-403 SAYREVILLE BORO t/D 0-73 SAYREVILLE BORO 40 78- 136"* 18 1973 OOBG W P
23-411 SOOTH AMBOYCITY WO8-47 SAYREVILLE BORO 10 209- 234 10 1947 FRNG U U
23-412 SOOTH AMBOYCITY WO 5-37 SAYREVILLE BORO 10 52* -- 1937 OOBG Z U
23-413 SOOTH AMBOYCITY WD 9-65 SAYREVILLE BORO 10 25- 47 12 1965 OOBG Z U
23-414 SOOTH AHBOYCITY kl) 10 SAYREVILLE BORO 10 38- 48 12 1967 OOBG W P
25

TabLe 2.--Recerd$ of sampled welLs--Continued.
Attitude Screen
NJ-_D of Land Screen dia- Ao_i- Use
well Local wett surface I setting 2 meter Year fer of Use of
number identifier MLmicipatity (ft) (ft) (in.) driLLed unit 3 site 4 water 5
2_-415 _L %Nt)tJSIRtE$ 4-1952 SA_REVILLE BORO 108 ZZO- 251 16 1952 FRHG M U
23-418 NL INDUSTRIES 3-1934 SAYREVlLLE BORO 117 240- 270 10 1934 FRN6 W U
23-419 NL INDUSTRIES 2-1934 SAYREVXLLE BORO 104 220- 253 1Z 1_4 FRN6 U U
23-425 E! DUPONT-PARLIN 60F-66 SAYREVILLE BORO 150 282" 288 -° 1966 FRNG 0 U
23-428 JERSEY CENT P&L-WERNER5 SOUTH ARBOY CITY 10 160" -" 1956 FRNG U U
23-429 JERSEY CENT P&L-tJIERNER6 SOUTHAMBOY CITY 18 154" 177 12 1969 FRNG U U
23-430 JERSEY CENT P&L-k_RNER 7 SOUTH AHBOY CITY 12 135" 165 12 1972 FRNG _ N
23-431 JERSEY CENT P&L°_RNER 4 SOUTH AHBOY CITY 10 143- 168 12 1952 FRN6 Z U
23-432 SOUTH RIVER BORO_l) 4-75 SOUTH RIVER SORO 18 149- 180 8 1975 FRNG W P
23-434 SOUTH RIVER BORO_) 2-52 SOUTH R|VER BORO 20 173- 198 17 1952 FRHG _ P
23-436 SOUTH RIVER BORO kl) 1-22 SOUTH R!VER BORO 20 163- 192 6 1922 FRHG W P
23-437 SOUTH RIVER BORO _) 3-67 SOUTH RIVER BORO 19 16Z- 198 17 1967 FRNG Z g
23-438 SOUTH R!VER BORO _) 5-77 SOUTH RIVER BORO 19 132- 182 12 1977 FRNG W P
23-459 SOUTH RIVER BORO _ 20B SOUT_ RIVER BORO 20 121- 126 5 1967 FRNG 0 U
23-440 HOOGES8US CO 1-1922 SOUTH RIVER BORO 15 195 _ -- 1922 FRMG W M
23-441 HERBERTSAND HSC 3-1964 SOUTH RIVER BORO 5 49" 52 -- 1964 FRMG T U23-442 SPOTS_OU kl) 3-1973 SPOTSt_O00BORO 30 63" 78 10 1973 ODBG W P
23-456 SC_EITZER, _ J 1R-1956 SPOT$_OU BORO ZO _5" 275 10 1956 FRMG _ M
23-458 $CHWEITZER, P J 7-1946 $POTSIJOOUSORO 30 61" 76 18 1946 O08G W N
23-459 SCHWEITZER0 P J 3R-1960 SPOTStJtXX)SORO 40 58" 68 16 1960 OUSG W N
25-462 UNION CARBIDE CORP 1-65 UOOUSRIDGETWP 20 47- 57 10 1965 FRN6 W N
23-473 HAJ_GEMDAZ$ IMC° 1955 _#OODBRIOGET_P 40 39" 59 12 1955 FRMG _ N
23-478 ANER CYAMAHID CO 2A-58 kl)OUBRIDGE TWP 10 45- 60 8 1958 FRNG W N
23-491 ELIZABETHTN WC PLNSBRO-1PLAINSBORO TWP 70 47- 67 10 1978 FRNG W P
23-494 SPOTS_OU kl) St/_t) 5-1978 SPOTSQ_OUBORO 24 83- 97 12 1978 OOBG W P
23-497 FORSGP,_EtMC. _M 1975 _OMROET_ 130 109- 114 4 1975 OUSG _ H
23-499 SPOTSt_O0 _) S_,I) 4F-77 SPOTS_O0 BORO 20 198- 282 12 1977 FRNG _ P
23-502 AM_EUSERBUSCH 7-1978 EAST BRUNSWICKTWP 40 210" 260 12 1978 FRNG W N
23-503 EORAITIS, PETER 1-64 HONROET_P 140 410- 440 "" 1964 FRNG W !
23°_04 FORSGATEINC. !-IRR 1972 MONROET_P 140 288- 340** 12 1972 FRNG W !
23°506 SMITH 3°1958 ]RR EAST BRUNSWICKTWP 120 213" 223 10 1958 FRNG W !
23-515 RAAB, GEORGEFARH 1 EAST BRUNSWICKTWP 110 48* .... ODBG W !23-517 KAISER AG CHEH 1-63 _O_ROE T_P 120 165" 196 10 -- FRNG _
_3-522 SCH_EITZER,PJ(KIMB CK)11 SPOTSgOODBORO 25 53 ° 63 24 1978 OOBG W N
23-52_ ST_LE¥ CORP 2-1977 PER_H AI_OY CI_Y 20 46" 61 1_ 1977 FRH6 _ M
23-543 SHELL OIL 5($2) _OOBRIDGE T_P 24 42* .... FRNG 0 U
23-548 SHELL OIL 8(R7) I_0OUBRIDGETWP 16 36* .... FRNG 0 U
23"549 SAYREVILLE 80RO _) R'80 SAYREVILLE BORO 25 70" 111 10 1980 OOBG _ P
_'551 SOUT_ RI_ER BORO _ 6"80 SOUTH RI_ER _ORO 45 155" 208 12 1980 FRMG _ P
23"552 S 8RUNS_ICK HUA 15-1979 SOUTHBRUNSWICKTWP 105 116" 166"* 16 1979 FRMG W P
26

Table 2.--Records of sampled welts--Continued.
Altitude Screen
NJ-WRD of land Screen dia- Aqui- Use
well Local well surface I setting 2 meter Year fer of Use of
number identifier Municipality (ft) (ft) (in.) drilled unit 3 site 4 water s
23-554 BAYERVILLE BORO _ S-80 SAYREVILLE BORO 100 213- 286 12 1980 FRNG W P
23-557 SOUTH AMBOYCITY _ 9A SAYREVILLE BORO 20 48- 58 12 1979 OOBG W P
23-565 MONROEMUA ROSSMOREGC17 MONROETWP 130 165- 197 12 1980 OUBG W P
23-569 SAYREVILLE BORO kl) T-82 SAYREVILLE BORO 90 102- 132 10 1982 OOBG W P
23-570 PERTH ARBOY_ 6-1982 OLD BRIDGE TWP 15 60- 80 16 1982 OOBG g P
23-571 PERTH AHBOY _0 7-1983 OLD BRIDGE TWP 15 67- 82 16 1983 OOBG W P
23-581 PARLIN SUPPLY CO 1-1974 SAYREVILLE BORO 80 24- 44 6 1974 OOBG g I
23-583 AIR PROOUCTS1-1978 SOUTH BRUNSWICKTWP 110 152- 172 8 1978 FRNG W N
23-584 T & C METAL GAH CHOY1-78 MONROETWP 130 230- 240 3 1978 OOBG W F
23-585 CHIRLIAN, PAUL 1980 EAST BRUNSWICKTWP 120 238- 248 4 1980 FRNG W Z
23-704 IBM CORPGW8-1978 SOUTH BRUNSWICKTWP 119 32- 67 3 1978 FRNG 0 U23"715 IBM CORP GW17-1978 SOUTH BRUNSWICKTWP 120 25- 55 3 1978 FRNG 0 U
23-729 ANHEUSERBUSCH 10-1983 EAST BRUNSWICKTWP 25 50- 60 18 1983 OOBG W N
23-732 KULESA, RICH DOMESTIC SOUTH BRUNSWICKTWP 110 40* .... FRNG W H23-;33 EDGEBORODSP LNDFL 005 5 SOUTH RIVER BORO 20 18- 28 4 1976 FRNG 0 U
23-734 MIRANOL CHEMICAL 1"1981 SOUTH BRUNSWICKTWP 100 96" 120 6 1981 FRNG g N
23-;35 PERTH AMBOYWD RUNYON8R OLD BRIDGE TWP 10 70- 85 16 1982 ODOG W P
23-736 SIMONSON8ROS DOM 1965 PLAINSBORO TWP 90 71- 78 4 1965 FRNG W H
23-7]8 ROSENSTOCK,WALTERDOM-56 SOUTH BRUNSWICKTWP 90 35- 39 5 1956 FRNG g H
23-739 SYZMANBKI, MIKE DOM-1983 SOUTH BRUNSWICKTWP 110 100- 110 3 1983 FRNG W H
23-740 DALLENBACHTRAILER-1981 SOUTH BRUNSWICKTWP 90 47- 55 4 1981 0000 W H
23"741 SPERLING ROYAL 1-1970 EAST BRUNSWICKTWP 55 41" 44 3 1970 OOBG W H
23-742 APPLEGATE SIMOHSON'1971 CRANBURYTWP 90 50" 60 4 1971 ODBG W H
23";34 MURPHY, RICHARD 19;3 CRANSURYTWP 100 120- 130 4 1973 OOBG g H
23-755 WILLIAHS, MICHAEL 1979 MONROETWP 170 170- 180 4 1979 OOBG W H
2]'756 FALTER, EDWARD1974 MONROETWP 80 170" 175 4 1974 OOBG W H
23-757 CORSE, DOROTHY 1977 JAMESBURGBORO 80 110- 113 4 19;7 OOSG W H
23-758 TARINO, ANGELO 1954 MONROETWP 100 46- 49 3 1954 OOBG W H
23-759 BROWN,DORIS 1982 MONROETWP 120 250" 256 4 1982 OOBG g H
23-760 OLMA, FRANK 1983 MONROETWP 160 350- 360 3 1983 FRNG W H
23-761 WILDEN, JOHANNES 1983 MONROETWP 70 2;3- 285 3 1985 OUBG W H
23"762 SBOVEY, JAMES 1983 OLD BRIDGE TWP 60 178" 184 4 1983 ODBG W H
23"763 STILES, LEN"1976 OLD BRIDGE TWP 100 171- 175 4 1976 OOBG W H
23-764 EHLER, MARY 1980 OLD BRIDGE TWP 40 134- 140 4 1980 ODBG W N
23-765 JORDAN, ANTHONY 198/* OLD BRIDGE TWP 110 230- 236 4 1984 00B0 W H
23-766 S OLD BRIDGE FIRE DPT ] OLD BRIDGE TWP 80 172- 180 6 1975 OOBG W U
23"767 OLBRYS 197q5 MONROETWP 60 181" 186 4 1978 OOBG W H
23"769 MILADINOV, ELIJA 1-1982 MONROETWP 120 228" 234 4 1982 ODBG W H
23-;70 JURGELSKY, FRANK 1982 MONROETWP 140 315- 325 4 1982 OOBG g H
23-771 SCHARF, STEVEN 1982 MONROETWP 110 310- 320 4 1982 0080 W H
27

Tabte 2.--Records of sampted weirs--Continued.
Attitude Screen
RJ-WRD of rand Screen dia- Aqul- Use
uett Locat uett surface I setting 2 meter Year fer of Use of
number identifier Municipality (ft) (ft) (in.) drilled unit a site 4 water s
23-772 KOKOSA 1977 MONROETWP 150 147- 150 3 1956 OOBG _ H
23-773 TEE-N-JAY FARNS 1975 NONROETWP 90 285- 295 6 19T3 OOBG W U
23-774 RESNICK, LEWIS 1-81 HOHROETWR 110 205- 215 4 1981 0080 W H
23-775 SEPTAK_ JOHN 1-1979 HONROETWP 120 182- 190 3 1979 OOBG W H23-776 $[RORSOB HONE 1-1985 PLA[NSSORO TWP 80 65- 70 4 1985 FRNG W X
23-777 CHOU, 1-1981 ERANBURYTWP 100 80- 88 4 1981 OOBG W H
23-778 FINN, WILLIAM 1983 CRANBURYTWP 100 122- 130 4 1983 FRNG W H
23-779 BERESFORD, JAHES 1-1975 CRANBURYTWP 120 110- 120 4 1975 OOBG W C
23-780 ZAITZ, HAX 1969 CRANBURYTWP 100 85- 90 4 1969 FRNG W H23-781 JOCANA CONST CO 1980 OLD BRIDGE TWP 60 225- 235 4 1980 OOBG W H
23-782 OLD BRIDGE HUA 12-1984 OLD BRIDGE TWP 30 230- 337** 12 1984 FRHG W P
23-78] OLD BRIDGE PARKS AND REC OLD BRIDGE TWP 90 243- 265 4 1983 ODBG W I
_-784 NAVEDO, JOE 1-1982 OLD BRIDGE TWP 30 &3- 69 4 1982 OOBG W H
_-785 SKISTIRAS, CHARLES 1974 EAST BRUNSWICKTWP 140 116- 121 4 1974 ODBG W N
23-786 HOSTETLER, HENRY 1-1979 PLAINSBORO TWP 100 55- 63 4 1979 FRNG W H
23-787 ELY, JOHN 1981 SOUTH BRUNSWICKTWP 100 100- 110 4 1981 FRNG W H
23-1008 CLARK, RQNAN 1983 EAST BRUNSWICKTWP 120 58- 66 4 1983 OOBG W H
23-1010 ZINSHE]STER, JACK 1967 PLAINSBORO TWP 60 76- 79 4 1967 FRNG W H23-1056 MCUA MONITORING 3-1978 SAYREVILLE BORO 5 43- 53 4 1978 FRNG 0 U
23-1066 WHITE, STANLEY 1985 CRANBURYTWP 90 80- 90 4 1985 FRNG W H
23-1067 PROTINICK, NICHAEL 1966 CRANBURYTWP 100 64- 70 4 1966 FRNG W H
23-1068 PROTINICK, JOHN 1972 CRANBURYTWP 110 125- 128 4 1972 OOBG W H23-1069 BARCLAY FARHSDON _965 CRANBURYT_P 110 61- 64/* 4 1965 ODBG W H
25-6 ATL HIGHLANDS BORO_ 1 ATL. HIGHLANDS BORO 20 519- 582** 12 1928 OOBG W P
25-8 ATL HIGHLANDS BORO_A) 3 ATE. HIGHLANDS _OBO 20 547- 572 10 1946 _X_BG Z U
25.12 AVON-BY-TRE-$EA _O 3 OBS AVON-BY-THE-SEA BORO 29 916-1,140"* 6 1926 OOBG Z U25.13 AVON-BY-THE-SEA _ 4-74 AVON-BY-THE-SEA BORO 30 1,100-1,160 10 1974 OOBG W P
25-34 NAD EARLE 1-44 COLTS NECK TWP 135 810- 836 8 1944 ODBG W P
25-37 HOMINY H GOLF C 2-63 COLTS NECK TWP 135 686- 706 12 1963 OOBG W i
25.45 FLOCK AND SONS 1-63 COLTS NECK TWP 65 649- 677 8 1963 OOBG W ]
25-55 ENGLISHTOWNBOROWD 1-63 ENGLISHTOWNBORO 80 651" 671 10 1963 FRNG W P
25-56 ENGLISHTOWN80RO WD 2-65 ENGLISHTOWNBORO ?O 363- 384 10 1965 OOBG W P
25-62 ROKEACHAND SONS I(4-DP) FARHINGDALE BORO 80 831- 885 12 1961 OOBG W C
25-68 NESTLE 51947 FREEHOLDBORO 160 557" 607 10 1947 OOBG W N
25-69 NESTLE 2-1956 FREEHOLDBORO 150 564- 614 10 1956 OOBG W N
25"82 FREEHOLDTWP t_)-KOENIG 1 FREEHOLDTWP 130 619- 670 8 1957 008G Z U
25-85 3H CONPAHY1"1957 FREEHOLDTWP 120 653- 700 8 1957 OOBG W N
25-91 BROCKWAYGLASS 2-69 FREEHOLDTWP 140 632- 685 8 1969 ODBG W N
25-97 FREEHOLDTWP _0 6-196(:. FREEHOLDT_ 200 596- 656 6 1966 OOBG W P
25-98 FREEHOLDBORO WD 4-1969 FREEHOLDTWP 120 529- 583 12 1969 OOBG W P
28

Table 2.--Records of sa_ted wells--Continued,
Altitude Screen
NJ-WRD of Land Screen die- Aqui- Use
well Local well surface I setting 2 meter Year fer of Use of
_r identifier MUnicipality (ft) (ft) (in.) drill_ _it 3 site4 water5
25-99 FREEHOLDTWP _ 3-1964 FREEHOLDTWP 105 468- 567 12 1964 OOBG W P
25-111 SHORELANDSWC HAZLET1-58 HAZLET TWP 59 326- 366 10 1958 O08G W P
25-112 SHORELANDSWC HAZLET2-60 HAZLET TWP 43 312- 352 10 1960 OOBG W P
25-113 HAZLET TWP BD ED 1-1970 HAZLET TWP 87 270- 302 6 1970 OOBG W I
25-115 HIGHLANDS BORO UD 1-08 HIGHLANDS BORO 180 687* -- 1_8 OOBG Z U
25-116 HIGHLANDS BORO_JO 2-NEW HIGHLANDS BORO 10 600- 660 10 1961 OOBG W P
25-117 HIGHLANDS BORO_JO4-7"5 HIGHLANDS BORO 20 630- _O 10 1973 OOBG W P
25-118 HIGHLANDS BOROUD 1-49 HIGHLANDS BORO 15 6Z_9- 709 0 1949 OOBG U U
25-119 HIGHLANDS BORO WO3-73 HIGHLANDS BORO 20 719- _ 10 19T_ OOBG W P
25-121 PENNWALTCORP 1-60 HOLMDELTWP 80 560- 590 10 1960 OOBG W N
25-153 SHORELAHDSWC HOLNDL4-70 HOLMDELTWP 65 635- 690** 12 1970 FRNG W P
25-154 SHORELANDSWC HOLMDL3-64 HOLHDELTWP 73 400- 430 10 19(>4 OOBG W P
25"174 ADELPHIA W C 2-1974 He,JELL TWP 102 654- 769 8 1974 OOBG W P
25-175 ADELPHIA WC-HOVBILT CO 1 HOWELLTWP 100 681- 762 8 1969 OOBG W P
25-177 SCHROTH, EMIL 1969 HOWELLTWP 100 781- 801 0 1969 OOBG W N
25"190 KEANSBURGBOROWO4"45 KEANSBURGBORO 10 2_" 340 10 1945 OOBG W P
25"191 NEANSBURGDORO_I) 6"_ KEANSBURGBORO 10 302" 362 12 1968 (X)BG W P25"195 KEANSBURGSORO14D 5A'54 KEANSBURGBORO 10 290" 350 10 1954 OOBG W P
25"196 KEANSBURGBORO k9 3"42 KEANSBURGBORO 12 508" 348 8 1942 OOBG W P
25"197 KEYPORT BORO WD 7"1976 NEYPORTBORO 40 304" 354 12 1976 OOBG W P
25"199 KERR GLASS CO 1964 KEYPORTBORO 20 285" 315 10 1964 OOBG W N
25_201 LEX LUCAS 1965 HAZLET TWP 20 282* "" 1965 OOBG Z U
25"202 KEYPORT BOROWD 5"1955 KEYPORT BORO 10 204" 267 10 1955 OOBG 0 U
25"203 KEYPORT BOROWO 1"1927 KEYPORT BORO 10 211" 271 10 1927 OOBG 0 U
25"206 KEYPORT BOROWD 4"1939 KEYPORT BORO 14 225" 249 8 1939 ODBG 0 U
25"207 KEYPORT GOROWO6"1970 KEYPORT BORO 10 247" 277 12 1970 OOBG 0 U
25"208 INFERM'O'THERM CO 1 KEYPORT BORO 15 300* .... OOBG U U
25"210 MON CON WC-LONGBRANCH1 LONGBRANCHCiTY 10 951" 981 12 1956 OOBG Z U
25-212 CAPUTO 1-1956 HANALAPANTWP 160 675- 706 6 1956 ODBG W I
25-214 HANALAPAN_-LAHSS RD 1 HAHALAPAHTWP 190 585- 641 8 1971 OOBG W P
25-218 QUAIL HILL BS CARP 2-67 HAHALAPAHTWP 250 510- 527 -- 1967 ODBG W T
25-220 BATTLEGROUNDCC-IRRIGAT MANALAPANTWP 120 539- 569 10 1967 O08G W I
25-231 GORDONSCORNERWC 6-74 HANALAPAHTWP 125 592- 708** 12 1974 FRNG W P
25-247 GORDONSCORNERWC 2-64 MAHALAPANTWP 146 762- 832 8 1964 FRHG W P
25-259 MARLBOROS HOSP 12-50 MARLBOROTWP 155 508- 593 8 1950 OOBG W T
25-262 MARLBOROS HOSP 15-66 MARLBOROTWP 140 730- 810 8 19_ FRHG W T
25-268 _RLBORO T MUA 2-PROD-72 MARLBOROTWP 114 632- 698"* 8 1972 FRNG W P
25-269 MARLBOROMUA 1-PROD 1972 MARLBOROTWP 111 647- 716"* 8 1972 FRNG W P
25-282 BAYSHORESEW AU 1-1976 MATAWANBORO 10 245- 260 6 1976 OOBG W Z
25-283 HATAWAHBORO IJO 4-1956 MATAWANBORO 90 220- 266 12 1956 OOBG W P
29

Table 2.--Records of sampted welts--Continued.
Altitude Screen
NJ-WRO of [and Screen dia- Aqui- Use
well Local welt surface I setting 2 meter Year fer of Use of
nulfl_r identifier Municipality (ft) (ft) (in.) dritted unit 3 site 4 water 5
25-284 HATAWANBORO kl) 3-1956 MATAWAN80RO 90 231- 271 10 1956 OOBG W P
25-288 ABERDEENMUA-MATAWAM3 ABERDEEN TWP 83 345- 425 12 1967 ODBG _ P
25-292 ABERDEENMUA-HATAWAN1 ABERDEENTWP 87 341- 414 12 1962 ODBG W P
25-294 MATAWANBOROWO %1944 ABERDEENTWP 20 222- 252 8 1944 ODBG W P
25-295 I_TAWAN BOROWO2-1943 ABERDEENTWP 20 228- 258 8 1943 ODBG W P
25-297 ABERDEENTWP WD 1-56 ABERDEENTWP 80 447- 487 10 1956 FRNG W P
25-299 ABERDEENTWP WO 2-65 ABERDEENTWP 60 422- 457 10 1965 FRNG W P
25-303 BAng4HOLLOWC C 1-66 MIDDLETOWNTWP 70 527- 600 8 1966 OOBG W I
25-314 ENGR PRECISION CAST CO MIDDLETOWNTWP 20 354- 364 8 1965 ODBG Z U
25-316 SANDY HOOKSP OBS 1"1965 MIDDLETOWNTWP 10 371- 397 8 1965 ODBG 0 U
25-317 SEA COAST PROOUCTS1 MIDDLETOWNTWP 10 420* .... OOBG W N
25-318 NPS-SANDY HOO_ 2"1906 MIDDLETOtJNTWP 10 600- 724 6 1906 FRHG W T
25"319 US ARHY'FT HANCOCK5"42 MIOOLETCAJNT_P 14 751- 878 12 1942 FBMG Z U
25"320 NPS'SANDY HOOK5A'1970 MIDDLETOWNTWP 10 838" 878 10 1970 FRNG W P
25"321 NPS'SANDY HOOK4"1941 MIDDLETOWNTWP 10 332" 486 8 1941 OOBG U U
25"341 MON CON WC AMERICAN 2"59 NEPTUNE TWP 20 1,130" "" 1946 OOBG Z U
25"343 MON CON WC LAYNE 2R'56 NEPTUNE TWP 20 1,080"1,120 8 1956 OOBG Z U
25"345 NON CON WC LAYNE 3"58 NEPTUNE TWP 20 1,080"1,120 8 1958 ODBG W P25"358 RED BANK BOROWD 18"50 RED BANK BORO 40 637" 687 8 1950 ODBG W P
25"360 RED BANK BOROWD 4"75 RED BANK BORO 145 668- 759** 10 1975 ODBG W P
25-362 BO0$EVELT 80RO_ 1-56 ROOSEVELTBORO 198 442- 472 8 1956 ODBB u P
25-419 UNION BEACH BORO WD 1-62 UNION BEACH BORO 20 235- 285 10 1962 ODBG W U
25-420 UNION BEACH BORO _O 2-69 UNION BEACH BORO 20 262- 289 12 1969 OO8G W U
25-421 UNION BEACH BORO IdO 1-27 UNION BEACH HOBO 10 249- 3OO 12 1927 OOBG Z U
25-423 INT FLAVOR FRAG 1-1951 UNION BEACH BORO 10 298- 328 6 1951 OOBG W N
25-424 INT FLAVOR FRAG 2-1955 UNION BEACH BORO 10 302- 326 8 1955 OOBG Z U
25-453 UNION BEACH BORO Wt) 3-77 UNION BEACH BORO 10 480- 532 -- 1977 FRNG W P
25-456 INT FLAVOR FRAG 3-1976 UNION BEACH BORO 10 277- 316 10 1976 ODBG W N
25"457 KNOB HILL COUNTRYC 1-74 MANALAPANTWP 110 465- 495 10 1974 ODBG W I25-459 HAVESINK C C 1-78 MIDDLETOWNTWP 80 551- 612"* 8 1978 ODBG W I
25-462 KEANSBURGAMUSEMENTPK 1KEANSDURG BORO 10 200- 250** 8 1969 ODBG W R
25-466 ABERDEEN TWP _ 3-77 ABERDEENTWP 56 420- 470 12 1977 FRNG W P
25-493 HOWELLTWP MUA 1-75 HOWELL TWP 130 860* .... OOBG W P
25-496 ATL HIGHLANDS BORO iJD 4 ATL. HIGHLANDS BORO 20 510- 543 -- 1980 ODBG W P
25-498 BAYSHORESEW AU 2 HAZLET TWP 20 35_* .... ODBG W 2
25-502 FREEHOLDTWP 8"1981 FREEHOLDTWP 130 616- 671 12 1981 OOBG W P
25-513 ATL HIGHLANDS BORO WD 5 ATL. HIGHLANDS BORO 20 506- 548 10 1981 QOBG W P
25"514 INT FLAVOR FRAG 2R'1983 UNION BEACH BORO 10 266" 312"_ 10 1983 ODBG W N
25-543 MARLBOROT MUA 4A-PRO0 MARLBOROTWP 100 638- 720 8 1983 FRNG W P
25-548 EMERY MANORNURS HOME 1 ABERDEENTWP 90 210- 220 6 1964 OOBG W T
3O

TabLe 2.--Records of sae_otedwelts--Continued.
Altitude Screen
NJ-WRD of Land Screen die- Aqui- Usewell Local welt surface I setting 2 meter Year fer of Use of
number identifier Municipality (ft) (ft) (in.) drilled unit 3 site 4 waterS
25"549 NARLBOROT 14tJA3-PRO0 MARLBOROTWP 100 624- 710 8 1981 FRHG W P
25-556 USGSALLENTOWNt_D1-1952 ALLENTOWNBORO 80 273* -- 1952 OOBG W P
25-557 TWITCHELL, CARL1958 HOLMDELT_P 100 604- 622 8 1958 OOBG W H
25"559 COAR, R.J. 1981 MANALAPANTUP 100 331- 341 4 1981 OOBG W H25-560 RICHARDB(RAJEED) 1-1980 MANALAPANTWP 90 300- 306 4 1980 OOBG W H
25-561 FREEHOLDBOROtdD7-198/* FREEHOLDTWP 110 771- 884 lZ 198/* FRNG _ P25-562 KEYPORTBOROM) 8-1984 KEYPORTSORO 30 500- 555 12 1984 FRNG W P25-564 GORDONSCORNERWC11-84 MARLBOROTWP 120 479- 576** 12 1984 ODSG W P
25"567 USGSUNIONBCHWTRTR-86 UNIONBEACHBORO 10 250- 270 4 1986 OOBG 0 U25-568 USGSJCPL*UNIONBEACH-86UN]ONBEACHBORO 10 245" 265 4 1986 OOBG 0 U
z Referenced to sea-Level datum.
2 Referenced to land-surface datum.
S Aquifer L_its
OOBG Upper aquifer (Old Bridge aquifer), Potomac-Hagothy-Raritan aquifer system
FRNG Riddle aquifer (Farr|ngton aquifer), Potemac-Hagothy-Raritan aquifer system
4 Use of site
0 observation W withdrawal
T test Z destroyedU umused
s Use of water
C commercial P pubtic supply
F fire protection R recreationH domestic T institutional
I irrigat|on U unusedN industrial Z other
* Total _elt depth (screen setting unknoun)
** Well has muttipte screens
31

Tabte 4..-Water-quality enat¥se_ of wett-water spmptes, 1923-86(Constituents not detected in a semp[e are reported as the value of
the detection ttmit for that anatysts, preceded by a tess than syraboI(<).)
['C, degree Cetstus; mg/L, mittigranls per titer; --, indicates sampte not anatyzed for this constituent]
Tem- Spe- Oxy- F_eLd at- Lab at- FietdRJ-WRD Date pore- cific gen, Fietd katinity katinity bicar- Sotids,t_eLt Locat wett of ture cordu¢- d_ss pit (mg/L as (mg/L as bonste 2 diss 8
number identifier sampte Time ('C) tsnce I (mg/L) (_its) (CaCOB) (CaCO3) (mg/L) (mg/L)
Upper aauifer, Potomac-Raritsn-Magothy aquifer syste¢_
23-8 DAVISORJR, A 1-[RR-55 13 Jun 1985 1205 12.0 *- 9.0 4.6 <1 1 <1 13123-15 CRANBURYTWPk'O2-1917 04 Aug 1969 -- 15.0 221 -- 5.7 -- 22 -- 1_,
23-15 CRARBURYTWPWO2-1917 15 Apt 1985 1005 13.5 241 7.5 5.3 5 5 6 18023-20 CARTERWALLACE3A-68 08 Nay 1985 1605 13.0 248 7.7 4.9 7 1 -- 16723-24 DANSER,CLENDON1-1959 04 Jun 1986 1400 13.0 140 5.3 4.6 <1 1 <1 73
23-30 NJ TRKESERVAREA7S-2 04 Aug 1969 .... 153 -- 6.9 -- 18 -- 90
23-31 HONTREY_A N 1-1970 10 Jun 1985 1425 14.0 177 8.5 4.5 <1 1 <1 12823-54 AHHEUSERBUSCH3-1948 22 Her 1985 1310 12.0 132 7.0 4.5 <1 2 <1 7223-69 C P S CREHtCALCO 1975 19 Jun 1985 1130 12.3 252 4.9 4.0 <1 <1 <1 132
23-96 HELMETTAWC6(4-R) 1972 12 Apr 1985 1201 14.5 182 7.0 4.9 3 2 4 108
23-98 NJ WATERCO-JAHESBURG6 13 OCt 1971 -- 14.0 56 -- 5.3 -- 2 -- 3223-100 NJ WATERCO-JARES_URG7 19 Msr 1985 1240 12.0 65 2.8 4.5 4 3 5 4223-108 DUHERRALWC13-1947 06 Jun 1969 -- 15.0 224 -- 3.5 -- <1 -- 71
23-108 OUHERNALWC13-1947 20 Her 1985 1615 12.0 166 .4 5.3 8 <1 9 9723-110 DUHERRALWC11-1942 13 Nov 1942 .... 4.8 -- <1 -- 22
23-121 DUHERNALWC12-1968 20 Rar 1985 1455 13.5 147 .2 4.4 <1 <1 <1 77
23-131 DUBERRALWC8-1938 06 Jun 1969 -- 14.0 293 -- 3.4 -- <1 -- 9523-131 DUHERNALWC8-1938 20 Mar 1985 1340 9.5 205 .3 4.7 <1 <1 <1 145
23-135 OLDBRIDGEHUABRN2-66 31 Jut 1969 -- 14.0 105 -- 3.7 -- <1 -- 4023-135 OLDBRIDGEMUABRR2-66 24 OCt 1984 0935 12.0 94 .2 4.8 -- <1 ....
23-145 OLDBRIDGERUA 11-1972 22 Rat 1985 _550 11.5 78 .3 5.5 13 <1 15 38
25-156 OLDBRZDGEMUA10-1972 27 Aug 1985 1540 14.0 185 .4 5.7 15 <1 15 8923-172 DURERRALWC1-1938 13 NOV1942 ........ 4.1 -- <1 -- 2923-172 OUHERNALWC1-1938 20 Her 1985 1020 13.0 145 .4 5.8 23 9 28 7823-177 DUHERRALWC18-1951 06 Jun 1969 -- 15.0 116 -- 5.6 -- 7 -- 72
23-177 DUHERNALWC18-1951 20 Mar 1985 1145 12.0 182 .3 6.2 58 20 71 10823-192 PERTHAMBOY_D 3-1951 13 Jun 1969 -- 11.0 175 -- 7.2 -- 20 -- 10923-192 PERTH_DOY _ 3-1951 01 NOV198/* 1230 13.0 280 .2 7.0 -- 59 ....23-193 PERTHAMBOY_0 4-1955 01 NOV198/* 1425 12.5 266 .3 5.6 -- <1 ....
23-195 PERTHAMBOY_) 5-1965 17 Oct 1984 1010 13.5 218 .4 4.3 -- <1 ....
23-195 PERTHAHBOY_I) 5-1965 11 Apt 1985 1050 12.5 233 .4 4.4 <1 <1 <1 14023-203 OSCH_ALDRRICK1-1914 24 Jut 1969 -- 15.0 54 -- 4.3 -- <1 -- 31
23-205 OLDBRIDGETWPNUA-LH1 22 Aug 1949 70 -- 4.2 ........
23-205 OLDBRIDGETWP_A-LH 1 14 8ep 1973 1430 12.0 65 -- 4.0 -- <1 -- 3323-205 OLDBRIDGETWPHUA-LH1 24 Oct 1984 1045 12.0 _ .3 4.7 -- <1 ....
32

Table 4.--Water-ouality analyses of welt-water samples. 1923-86--Continued.
(Constituents not detected in a sample ere reported as the value ofthe detection limit for that analysis, preceded by a tess than symbol(<).)
Cal- Hagne- Potas- Chtor- Sul- Ftuor- Silica Nanga-
NJ-WRD Date cium, sium, Sodium sium, ide, fate, ide, as Si04 ]r_, Iron, nese,wet[ of diss diss diss diss di'ss diss diss diss total diss diss
number sample (mg/L) (mg/L) (mg/L) (mg/L) (mg/L) (mg/L) (mg/l) (mg/L) (_g/L) (_g/l) (_g/L)
Ui0cer eauifen, Potomac-Rsritan-Rs_othy sauifer system--Cont|nued.
23-8 13 Jun 1985 9.8 10 6.3 2.3 25 21 <.1 8.9 90 28 75
23-15 04 Aug 1969 14 4.4 12 6.8 15 13 .1 6.4 280 280 30
23-15 15 Apt 1985 15 9.2 7.5 4.7 14 23 -- 8.9 1,300 230 25
23-20 08 Hey 1985 12 5.5 17 2.7 55 3.0 <.1 9.4 380 250 11023-24 04 Jun 1986 6.0 4.8 7.3 2.8 22 7.3 <.1 9.3 110 55 47
23-30 04 Aug 1969 6.8 3.0 13 3,5 23 .3 .1 7.8 -- 290 4023-31 10 Jun 1985 7.1 6.1 8.4 3.1 25 -- <.1 8.2 70 23 2423-54 22 Nat 1985 5.9 2.9 8.9 1.8 18 11 -- 9.0 40 8 2623-69 19 Jun 1985 8.9 4.5 7.2 2.2 14 73 <.1 8.8 120 61 390
23-96 12 Apt 1985 8.3 6.7 12 2.6 25 23 -- 8.5 110 85 75
23-98 13 Oct 1971 2.2 .9 4.0 1.2 6.0 3.4 .1 8.5 -- 30 2023-100 19 Hap 1985 2.0 .81 5.2 1.2 8.1 3.0 -- 8.2 120 120 16
23-108 06 Jun 1969 3.5 2.3 2.8 1.5 4.3 41 .3 7.4 -- 18,000 170
23-108 20 Mar 1965 4.1 3.5 6.5 1.7 9.4 48 -- 7.7 17,000 16,000 16023-110 13 Nov 1942 1.0 .9 1.9 .8 2.6 8.1 0 7.1 3,200 10 --
23-121 20 Nat 1985 4.0 2.2 8.5 2.1 15 35 -- 6.1 6,300 6,200 77
23-131 06 Jun 1969 6.2 3.6 4.4 .5 4.5 68 .4 6.8 -- 17,000 11023"131 20 Nar 1985 4.4 4.0 5.6 2.0 7.3 77 -- 10 18,000 18,000 13023-135 31 Jut 1969 1.8 1.6 2.5 4.1 6.8 17 .1 7.1 -- 8,000 8023-135 24 Oct 1984 1.8 2.2 2.9 -- 5.6 27 -- 7.1 -- 9,900 120
23-145 22 Nan 1985 2.3 1.8 2.5 1.0 5.9 19 -- 6.8 8,700 9,000 120
23-156 27 Aug 1985 3.1 2.6 6.1 1.5 14 51 <.1 6.4 30,000 29,000 17023-172 13 Nov 1942 1.1 1.4 3.0 1.1 5.1 12 0 5.9 3,200 20 --23-172 20 Nar 1985 4.5 2.9 8.7 2.3 16 28 -- 6.4 8,800 9,300 9423-177 06 Jun 1969 5.4 2.9 7.2 2.4 13 23 .3 5.5 -- 14,000 120
23-177 20 Her 1985 4.8 3.0 8.1 2.2 16 11 -- 6.4 22,000 20,000 130
23-192 13 J_ 1969 16 4.8 6.0 1.0 12 41 .9 4.4 -- 5,700 70
23-192 01 Nov 1984 33 6.5 11 -- 24 42 -- 4.0 -- 2,800 25023-193 01 Nov 1984 8.6 2.3 15 -- 64 36 -- 6.1 -- 24,000 420
23-195 17 Oct 1984 7.0 2.3 13 -- 32 40 -- 5.8 -- 9,700 160
23-195 11 Apt 1985 7.9 2.5 14 <.1 37 39 -- 5.4 9,500 9,200 16023-203 24 Jut 1969 1.3 .9 1.4 .6 3.8 11 .1 5.9 -- 17,000 80
23-205 22 Aug 1949 ........ 3.8 6.0 .... 3,200 ....23-205 14 Sep 1973 .... 1.6 .8 3.0 8.2 -- 6.9 ......23-205 24 Oct 1984 1.1 1.0 2.9 -- 8.7 14 -- 6.5 -- 5,800 74
33

Table 4.--Water-quetity analyses of w_tt-wa_er sanlotes_ 1923-86--continued.
(Constituents not detected in a sample are reported as the value of the detection timit for that anatyste0preceded by e tess than symbol(<). Concentrations are in _g/L.)
NJ-WRD Date Atu- Beryl- Cad- Chro- Lith- Molyb- Stron- Vana-
welt of minum, Barium, t{um, mium, mium, CobaLt, Copper, Lead, ium, denum, tium, dium, Zinc,
number sample diss diss diss diss d|ss dies diss diss diss d|ss diss diss diss
Upper aqu(fer, potomac-Rar{tan-Magothy aquifer systemllCOntinued.
23-8 13 Jun 1985 300 200 <.5 <1 -- 10 90 <10 13 <10 120 <6 100
?.3-1§ 04 Aug 1969 ..................23-15 15 Apr 1985 50 200 <.5 <1 <t0 7 70 <10 <4 <10 180 <6 2923-20 08 May 1985 300 180 1.0 <1 "" 7 10 <10 10 <10 160 <6 9423"26 04 Jun 1986 150 180 .8 <1 <10 3 20 <10 8 <10 110 <6 29
23"30 04 Aug 1969 ..................23-31 10 Jun 1985 700 340 <.5 <1 -- <3 80 -- <4 <10 160 <6 5623-54 22 Mar 1985 340 76 <.5 1 <10 6 20 20 <4 <10 71 <6 26,
23-69 19 Jun 1985 5,600 100 <.5 <1 -- 30 <10 20 4 <10 98 <6 160
23-96 12 Apt 1985 50 130 <.5 <1 <10 10 30 <10 <4 <10 120 <6 39
23-98 13 Oct 1971 100 ................23-100 19 Mar 1985 120 28 <.5 <1 <10 3 30 <10 25 <10 20 <6 240
2]-108 06 Jun 1969 200 ................23-108 20 Mar 1985 10 61 <.5 I <10 20 <10 <10 15 <10 32 <6 12
23-110 15 Nov 1942 ..................
23-121 20 Mar 1985 320 31 <.5 <1 <10 20 20 <10 28 <10 23 <6 62
23-131 06 Jum 1969 1,500 ................
23-131 20 Mar 1985 1,100 62 2.0 <1 <10 30 <10 20 <4 <10 39 <6 4723-135 31Jul 1969 ..................
23-135 24 Oct 1984 300 53 <.5 <1 -- <3 <10 20 12 <10 17 <6 9
23-143 22 Mar 1985 10 11 <.5 2 <10 10 <10 30 11 <10 10 <6 30
23-156 27 AUg 1985 <100 37 <.5 2 -- <3 <10 20 5 <10 26 <6 1523-172 13 Nov 1942 ..................23-172 20 NaP 1985 130 37 <.5 <1 <10 30 <10 <10 19 <10 31 <6 1523-177 06 Jt,a'l1969 ..................
23-177 20 Mar 1985 10 23 <.5 2 <10 20 <10 <10 <4 <10 28 <6 12
23-192 13 JUn 1969 ..................23-192 01 NOV1984 100 40 <.5 <1 -- <3 <10 20 5 <10 95 <6 323-193 01 Nov 1984 <100 59 <.5 3 "- <3 <10 <10 <4 <10 59 <6 5,200
23-195 17 Oct 1984 t,200 57 <.5 1 "- <3 <10 <10 <4 <10 44 <6 1,800
23-_95 11 Apt 1985 400 53 1.0 <1 <10 20 <10 20 <4 <10 45 <6 1,80023-203 24 Jul 1969 O ................
23-205 22 Aug 1949 ..................
23-205 14 Sep 1973 ..................23"205 24 Oct 1984 300 28 <.5 <1 "" <3 <10 20 7 <10 12 <6 23
34

TabLe 4.--Water-qualitysnal_es of well-watersa_les. 1923-86--Continu_.
(Constituentsnot detected in a sample are re_rtd as the value of
the detection l|m|t for that analysis,precededby a less than symbol(<).)
NJ
Ammonia Nitrite gje|deh[ N02 + Ortho- Organic Dis- CentralLaboratory
NJ-_RO Date as N, as N, N as Hw NO3 as phosphate carbonw Phenols, tr|ct Pesti-
well of diss diss diss 4 Ne diss as P, diss diss total VOC VOC cide
number sea,ore (mg/L) (mg/L) (mg/L) (mg/L) (mg/L) (mg/L) (mg/L) scans analysis s analysis s
Upper aquifer, Potomac-Raritan-Maqothy aouifer svstem--Cont|nued.
23-8 13 Jun 1985 ............ <1 ND -- ND
23-15 04 Aug 1969 ....................
23"15 15 Apr 1985 .18 <.01 2.1 13 <.01 1.0 1 ND -- +23-20 08 Hay 1985 .02 <.01 .4 4.7 <.01 1.2 2 ND ....23-24 04 Jun 1986 .01 <.01 .3 5.3 <.01 .7 1 .... NO
23-30 04 Aug 1969 ....................23-31 10 Jun 1985 <.01 <.01 .... <.01 1.0 2 + -- ND23-54 22 Mar 1985 <.01 .02 <.2 3.7 <.01 1.0 <1 NO ND ND23-69 19 Jun 1985 .01 <.01 .3 .89 <.01 2.3 <1 ND ....
23-96 12 Apr 1985 .1 <.01 .9 5.2 <.01 2.0 1 ND -- ND
23-98 13 Oct 1971 ....................
23-100 19 Nat 1985 <.01 <.01 .7 2.1 <.01 .3 1 NO ND NO23-108 06 Jun 1969 ....................
23-108 20 Mar 1985 .13 <.01 .3 <.1 <.01 1.2 -- NO ND ND23-110 13 Nov 1942 ....................
23-121 20 Nar 1985 .35 <.01 .5 <.1 <.01 i.7 6 NO NO NO23"131 06 JUn 1969 ....................23-131 20 Nat 1985 .22 <.01 .3 <.1 <.01 1.6 3 NO NO NO
23-135 31Jul 1969 ....................
23-135 24 OCt 1984 .04 <.01 .2 <.1 .01 .... ND ....
23-145 22 Her 1985 .04 <.01 <.2 .13 <.01 1.3 <1 NO ND ND
23-156 27 Aug 1985 .1 <.01 .5 <.1 <.01 .9 3 ......23-172 13 NOV1942 ....................
23-172 20 Mar 1985 .62 <.01 .7 .18 <.01 3.6 4 + + ND23-177 06 Jun 1969 ....................
23-177 20 Mar 1985 1.4 <.01 1.4 .14 <.01 5.3 <1 + + ND
23-192 13 Jun 1969 ....................23-192 01 Nov 1984 .08 <.01 <.2 <.1 <.01 .... ND ....23-193 01 NOV1984 .5 <.01 .5 <.1 <.01 .... NO ....
23-195 17 Oct 1984 .27 <.01 .5 <.1 .05 ..........
23-195 11Apr 1985 .3 <.01 1.0 <.1 <.01 1.7 <1 + + ND23-203 24 JuL 1969 ....................
23-205 22 Aug 1949 ....................
23-205 14 Sap 1973 ....................23-205 24 Oct 1984 .03 <.01 <.2 <.1 <.01 .... NO ....
35

Table 4..-Water-quat|ty analyses of Hell-water saml_les+1923-86--Continued.(Constituents not detected in a sample are reported as the value of
the detection limit for that analysis, preceded by a less than syvlbol(<).)
Tam- spa- Oxy- Field al- Lab al- Field
NJ-WRD Date pora- cific gen, Field kstinity katinity bicar- Solids,well Local welt of lure corRk¢- diss pH (_lg/L os (ril_/l as bot_te 2 diss 3
number identifier san_ole Time ('C) lance I (mg/L) (units) (CaC03) (CaC03) (rag/L) 011g/L)
Upper aquifer, Potemac-Raritan-Magothy aauifer system--Continued.
23-218 KOPPEL1-1968 29 Jut 1985 1630 15.0 149 .2 6.5 45 28 55 88
23-219 MONROETWPMUA8-R 1952 25 Apr 1985 1700 12.0 94 3.1 4.6 1 1 <1 58
23-221 PAPROCKI,PETER1954 09 Jut 1985 1045 14.5 112 .1 6.6 41 7 50 6523-222 MONROEMUA-FORSGATE5-54 25 Apr 1985 1200 13.0 206 6.4 5.0 6 6 73 16423-225 iNDYK, JOSEPHS 1951 23 Nay 1985 1350 17.0 73 .1 6.9 37 7 44 13
23-227 GENERALFOOOS3-1967 18 Mar 1985 1025 12.0 118 9.2 5.0 7 5 8 97
23-228 MONROEMUA-FORSGATE30S 07 Aug 1986 1210 12.5 139 .1 4.9 3 <1 1 92
23-244 REEBE,AUGUST 1971 14 Jun 1985 1055 13.5 -- .1 6.3 33 13 41 5823-292 MONROETWPMUA08S 2-61 18 Dec 1984 -- 12.0 89 .4 6.5 48 33 56 52
23-292 MONROET_ MUA _S 2-61 09 Apt 1985 1315 12.0 86 .4 6.4 49 33 60
23-299 BASF-WYANOOTTE1 05 Jun 1969 -- 17.0 88 -- 5.4 -- 2 ,- 6423-299 BASF-WYANDOTTE1 18 Jut 1985 1440 15.5 180 .1 5.9 -- 13 -- 97
23-307 KORDUS1-1961 29 Aug 1985 1330 12.5 242 8,4 4.8 2 3 1 128
23-328 GIBBS NURSERY1973 09 Apt 1985 1400 10.5 242 7.8 5.6 6 5 8 14423-328 GIBBS NURSERY1973 15 Jut 1986 1330 14.0 238 8.4 5.4 5 5 6 153
23-346 SAYREVILLEBOROWDB-58 16 Oct 1984 1020 13.5 292 .3 4.6 -- <1 ....
23-346 SAYREV]LLEBORO_D B-58 10 Apt 1985 1005 12.0 265 .2 4.7 1 <1 1 15323-351 SAYERVILLEBOROLJO1 08 19 Jun 1986 1300 14.0 304 4.9 5.6 4 3 4 15223-355 SAYREVILLEBOROWDA-69 16 Oct 1984 0920 12.0 260 .7 4.3 -- <1 ....23-358 SAYREVILLEBOROWDK-65 05 Jun 1969 -- 12.0 142 -- 4.7 -- 1 -- 103
23-366 BAYREVILLEBORO_ L-65 05 Jun 1969 -- 11.0 115 -- 4.9 -- 1 -- 80
23-366 SAYREV|LLEBOROWDL-65 10 Apt 1985 1110 11.0 152 6.6 4.2 <1 <1 <1 7923-367 SAYREVILLEBOROkO G-60 22 Apt 1985 1215 13.0 .... 4.9 10 -- 6 2,15023-368 SAYREVILLEBOROWDi-60 16 Oct 1984 1120 13.0 390 2.8 4.0 -- <1 ....
23-383 Et DUPONT-PARL[M8A-1954 17 Oct 1984 1530 12.5 106 12.7 5.1 -- 5 ....
23-383 El DUPONT-PARL]N8A-1954 21 Mar 1985 1500 12.0 102 3.8 4.8 4 3 4 6123-403 SAYREVILLE80ROWD0-73 16 Oct 1984 1315 13.0 225 1,6 4.2 -- <1 ....
23-412 SOUTHAMBOYCITY kO 5-37 14 Apr 1950 .... 174 -- 4.1 ........23-413 SOUTHAMBOYCITY WO9-65 12 Oct 1984 1125 12.0 193 3.1 4.2 -- <1 ....
23-414 SOUTHAMBOYCITY WO10 13 Jun 1969 -- 14.0 166 -- 4.2 -- <1 -- 88
23-414 SOUTHAMBOYCiTY WO10 12 Oct 1984 1000 12.5 270 3.3 4.0 -- <1 ....23-442 BPOTSt_OOWD 3-1973 21 Mar 1985 1100 11.5 90 .2 4.2 <1 <1 <1 51
23-442 SPOTSWIXXDWO 3-1973 07 Jul 1986 1130 12.0 99 .3 4.3 -- <1 -- 52
23-458 SCHWEITZER,P J 7-1946 11 Jut 1969 -- 14.0 175 -- 6.3 -- 3 -- 113
23-459 SCHWEITZER,P J 3R-1960 22 Mar 1985 1015 12.0 180 7.0 4.2 <1 <1 <1 92
36

TabLe 4.--Water-qua|ity analyses of well-water samp[es, 1923-86--Continued.
(Constituents not detected in a sample ere reported as the va|ue ofthe detection limit for that analysis, preceded by s less than symbol(<).)
Cat- Hagne- Potss- Chtor- Su[- Ftuor- Sitica Nanga-
NJ-WRD Date cium, slum, Sodium sium, ide, fate, ide, as Si04 Iron, Iron, nese,
well of diss diss diss diss diss diss diss diss total diss diss
number sample (mg/L) (_g/L) (mg/L) (mg/L) (mg/L) (mg/L) (mg/L) (mg/L) (_g/L) (_g/L) (_g/L)
UDDer aouifer. Potomac-Raritan-NaRoth¥ aquifer system--contir_Jed.
23-218 29 Jut 1985 10 3.0 2.4 2.6 3.1 42 .2 12 16,000 17,000 21023-219 25 Apt 1985 5.0 2.1 5.0 1.5 13 6.5 <.1 8.6 380 330 24
23"221 09 Jut 1985 3.0 1.4 2.3 1.1 4.5 "" <.1 10 21,000 20,000 27023"222 25 Apr 1985 12 6.6 9.7 3.4 30 6.9 <.1 9.9 100 19 37
23-225 23 Nay 1985 .56 .35 2.0 .6 2.6 11 <.1 7.4 19,000 18,000 86
23-227 18 Nat 1985 5.5 2.4 8.2 2.2 18 1.9 -- 9.8 70 16 11
23-228 07 Aug 1986 7.7 2.4 8.7 2.3 25 17 <.1 9.7 -- 1,600 4923-244 14 Jun 1985 3.6 2.9 2.1 1.4 3.0 21 .2 8.9 12,000 11,000 11023-292 18 Oec 1984 4.2 2.7 5.5 1.4 2.7 2.1 <.1 13 -- 6,700 15023-292 09 Apr 1985 4.3 2.8 5.3 1.3 2.5 .4 -- 12 8,500 5,500 120
23-299 05 Jim 1969 4.0 1.5 6.4 1.8 14 2.2 0 7.1 -- 240 40
23-299 18 Jut 1985 .42 .43 32 .4 36 20 <.1 4.0 1,600 1,700 1723-307 29 Aug 1985 8.7 6.8 15 2.8 40 .8 <.1 7.6 150 35 34
23-328 09 Apt 1985 16 7.6 13 2.3 23 39 -- 6.8 1,100 770 6223-328 15 Jul 1986 16 7.5 15 2.6 27 33 <.1 7.3 960 710 67
23-346 16 Oct 1984 4.4 5.7 31 -- 53 42 -- 4.0 -- 3,700 14023-346 10 Apt 1985 4.3 5.5 27 2.4 48 40 -- 3.8 3,500 3,200 130
23-351 19 Jun 1986 3.5 3.5 44 1.9 44 50 <.1 2.3 -- 1,100 19023-355 16 Oct 1984 5.8 4.2 24 -- 44 36 -- 5.1 -- 1,400 18023-358 05 Jun 1969 6.4 3.7 7.8 2.2 14 35 0 8.9 -- 40 330
23-366 05 Jun 1969 4.7 2.9 7.1 1.8 11 29 0 7.5 -- 120 49023-366 10 Apt 1985 4.7 3.3 6.7 1.3 11 42 -- 7.3 890 770 470
23-367 22 Apt 1985 120 43 330 4.0 990 110 <.1 7.6 110,000 120,000 2,400
23-368 16 Oct 1984 14 9,8 6.5 -- 11 170 -- 12 -- 310 1,10023-383 17 Oct 1984 4.9 3.0 5.8 -- 13 19 -- 6.1 -- 870 170
23-383 21 Her 1985 4.8 2.9 5.2 1.3 12 22 -- 5.9 480 450 190
23-403 16 Oct 1984 6.4 4.5 16 -- 28 41 -- 10 -- 980 140
23-412 14 Apt 1950 ........ 12 48 ...... 100 --23-413 12 Oct 1984 7.3 3.4 13 -- 24 30 -- 8.6 -- 5 10023-414 13 Jun 1969 5.7 3.7 7.5 1.5 13 35 .2 10 -- 800 150
23-414 12 Oct 1984 10 4.5 16 -- 32 52 -- 11 -- 71 200
23-442 21 Her 1985 2.3 1.8 3.4 1.4 5.5 28 -- 8.3 2,100 2,200 2423-442 07 Jut 1986 2.4 1.7 4.5 1.6 11 28 <.1 8.3 2,500 2,600 3123-458 11 Jut 1969 8.8 4.3 14 2.1 13 31 .2 0.6 -- 320 3023-459 22 Nar 1985 7.9 3.5 8.8 2.0 15 27 -- 10 140 69 34
37

TabLe 4.--Water-Quality analyses of weLl-water sar_otes. 1923-BA--Continued.(Constituents not detected in a sample are reported as the value of the detection limit for that analysis,
preceded by a teas than symbol(<). Concentrations are in #g/L.)
NJ-WRD Date Alu- Beryl- Cad- Chro- Lith- Hotyb- Stron- Vane-
well of mtnum, Barium, tium, milan), mium, CobaLt, Copper, Lead, ium, denum, tium, dium, Zinc,number sample dies diss dies diss diss dies diss diss diss diss diss diss dies
U_r aauifer. Poto_ac-Raritan-Na_othy aquifer system--Continued.
23-218 29 Jut 1985 <100 68 <.5 3 -- <3 <10 20 20 <10 79 <6 823-219 25 Apt 1985 100 52 <.5 <1 -- 8 <10 <10 5 <10 43 <6 2923-221 09 Jut 1985 100 39 <.5 1 -- <3 <10 10 11 <10 26 <6 10
23-222 25 Apt 1985 100 240 <.5 <1 -- 6 20 <10 5 <10 180 <6 3523-225 23 Nay 1985 300 24 <.5 1 -- <3 <10 <10 6 <10 4 <6 19
23-227 18 Nar 1985 10 85 <.5 <1 <10 <3 150 <10 22 <10 76 <6 32
23-228 07 Aug 1986 200 .... <1 <1 -- 11 <5 ........ 4023-244 14 Jun 1985 <100 45 <.5 2 -- <3 <10 10 11 <10 25 <6 1423-292 18 Dec 1984 <10 .... 1 4 -- 3 <5 ........ 24
23-292 09 Apt 1985 <10 32 <.5 <1 <10 30 <10 <10 <4 <10 60 <6 20
23-299 05 Jun 1969 200 ....................
23-299 18 Jut 1985 <100 18 1.0 <1 "" <3 <10 10 <4 <10 5 <6 7323-307 29 Aug 1985 <100 140 .7 <1 -- 3 60 10 10 <10 110 <6 26
23"328 09 Apt 1985 20 60 2.0 <1 10 7 70 10 10 <10 100 <6 77023.328 15 Jut 1986 20 63 <.5 <1 <10 <3 70 <10 4 <10 99 <6 190
23-346 16 Oct 1984 800 61 1.0 <I "" 5 40 <10 <4 <10 40 <6 5323-346 10 Apt 1985 410 53 2.0 <1 <10 20 <10 10 15 <10 39 <6 35
23-351 19 Jun 1986 40 .... 2 <1 -- 150 8 ........ 15023-355 16 Oct 1984 700 88 1.0 <1 -- 8 50 <10 <4 <10 57 <6 7723-358 05 Jun 1969 0 ....................
23-366 05 Jun 1969 600 ....................
23-366 10 Apr 1985 2,400 93 2.0 <1 <10 60 <10 <10 15 <10 58 <6 11023-367 22 Apr 1985 200 210 <2.0 9 -- 250 <30 50 <12 <30 1200 <20 36
23-368 16 Oct 1984 - 73 3.0 <1 -- 120 50 50 13 <10 200 <6 42023-383 17 OCt 1984 200 93 <.5 <1 -" 20 <10 <10 <4 <10 79 <6 20
23-383 21 Her 1985 200 88 2.0 <1 <10 20 <10 <10 7 <10 75 <6 32
23-403 16 Oct 1984 1,800 96 1.0 <1 "" 20 50 20 9 <10 74 <6 9323-412 14 Apt 1950 ......................
23"413 12 Oct 1984 1,800 81 <.5 <1 "" 10 20 <10 8 <10 75 <6 12023"414 13 Jun 1969 2,100 ....................
23-414 12 Oct 1984 4,000 120 1.0 <1 -- 20 50 30 11 <10 140 <6 13023-442 21 Mar 1985 600 31 <.5 <1 <10 10 <10 <10 <4 <10 35 <6 69
?..3-442 07 Jut 1986 900 28 <.5 <1 <10 <3 <10 <10 5 <10 35 <6 6823-458 11 Jut 1969 ......................
23-459 22 Nat 1985 2,400 110 <.5 <1 <10 8 <10 30 15 <10 100 <6 27
38

Table 4.--Water ¢_at|tv analyses of ueH-wa_er samples, 1923-86--Continoed.(Constituents not detected in a sample are reported as the vatue of
the detection limit for that analysis, preceded by s less than symbol(<).)
NJ
Ammonia Nitrite Kjetdaht NO2+ Ortho- Organic Dis- Centra_ _aboratory
NJ-_RD Date as N, as N, N as N, NO3 as phosphate carbon, Phenols, trict Pesti-
k_lt of diss diss diss 4 N, diss as P, diss diss total VOC VOC cide
number sample (mg/L) (mg/L) (mg/L) (mg/L) (mg/L) (mg/L) (l_l/C) scans analysis G analys|s s
Ucoer aauifer. Potomac-Rarita_-HaRothy aquifer system--Continued,
23-218 29 Jut 1985 .03 <.01 <.2 <.1 <.01 9.5 2 --23-219 25 Apr 1985 <.01 <.01 .5 2.4 <.01 ......23-221 09 Jut 1985 <.01 <.01 .4 <.1 <.01 ,9 4 ND ....23-222 25 Apt 1985 <.01 <.01 .7 8.6 <.01 .... ND ....
23-225 23 Nay 1985 <.01 <.01 .3 <.1 .01 1.0 2 NO ....
23-227 18 Mar 1985 .04 <.01 .4 3.9 <.01 .3 <1 ND ND ND
23-228 07 Aug 1986 .03 .01 <.2 .25 <.01 .5 2 --23-244 14 Jun 1985 .......... .7 1 --23-292 18 Dec 1984 <,07 <.01 <.2 <.1 -- 1.4 <1 --
23-292 09 Apt 1985 .07 <.01 .4 <.1 <.01 .9 2 + -- +
23-2_ 05 Jun 1969 ................
23-299 18 Jut 1985 .03 <.01 <.2 <.1 <.01 1.5 <1 --23-307 29 Aug 1985 .12 .02 .8 1.9 .22 .5 ....
23-328 09 Apr 1985 .04 <.01 .4 6.7 <.01 1.0 <1 ND -- ND
23-328 15 Jut 1986 .07 <.01 .3 7.9 <.01 1.0 1 ND
23-346 16 Oct 1984 .32 <.01 .3 <.1 <.01 ..........
23-346 10 Apt 1985 .27 <.01 2.1 .12 <.01 1.3 1 ND23-351 19 Jun 1986 <.01 <.01 <.2 .43 -- 1.5 1 --
23-355 16 Oct 1984 .27 <.01 .3 "_ .17 <.01 .... ND ....23-358 05 Jun 1969 ................
23-366 05 dun 1969 ................
23-366 10 Apr 1985 <.01 <.01 2.8 .29 <,01 1.1 <1 + ND ND23-367 22 Apt 1985 .......... 1.2 ....23-368 16 Oct 1984 .02 <.01 <.2 .3 <.01 .... ND ....23-383 170ct 1984 <.01 <.01 <.2 .31 <.01 .... + ....
23-383 21 Her 1985 .... <.2 .... .9 1 + + ND2]-403 16 Oct 1984 .05 <.01 .2 1.2 <.01 .... ND ....
23-412 14 Apt 1950 ................23-413 12 Oct 1984 .03 <.01 .3 2.2 <.01 .... ND ....23-414 13 Jun 1969 ................
23-414 12 Oct 1984 .02 <.01 .2 2.4 .02 .... ND ....
23-442 21 Mar 1985 <.01 <.01 .2 <.1 ,02 1,5 11 ND NO ND
23-442 07 Jut 1986 .02 <.01 .3 <,1 <.01 .9 1 --23-458 11Jul 1969 ................
23-459 22 Nat 1985 .01 <.01 .3 5.1 <.01 1.3 <1 ND ND ND
39

Table 4.--Water-auality analyses of well-water samples= 1923-86--Continued.(Constituents not detected in a sample are reported as the value of
the detection Limit for that analysis, preceded by a less than symbol(<).)
Tam- Spa- Oxy- Field el- Lab el- Field
MJ-WRD Date papa- cific gen, Field katJnity kalinity bicar- Solids,well Local welt of tune conduc- diss pH (mg/L as (mg/L as bonate2 diss 3
nuatber identifier sample Time ('C) lance I (log/L) (units) (taCOs) (CaCO3) (mg/L) (lag/L)
UDoer aquifer, Potomac-Raritan-Hagoth Y aquifer system--Continued.
23-494 SPOTSk_O0k9 StM) 5-1978 21 Mar 1985 1300 13.0 160 2.9 4.2 <1 <1 <1 15323-494 SPOTBIJO00I_ StAiD5-1978 07 Jut 1986 1030 13.0 144 4.5 4.4 -- <1 -- 8723-497 FORSGATEINC. HWH1975 29 Jut 1985 1415 12.0 72 8.5 5.0 3 3 4 54
23-515 RAAB,GEORGEFARM1 09 Apt 1985 1200 12.0 138 8.6 5.6 9 9 12 8623-515 RAAB,GEORGEFARM1 16 Jut 1986 0900 14.0 107 9.6 5.4 -- 7 -- 67
23-522 SCHWEITZER,PJ(KIMSCK)11 22 Mar 1985 1125 13.0 239 5.6 4.7 4 2 5 13723-549 SAYREVILLESOROI_) R-80 18 Oct 1984 1100 12.5 155 .2 4.3 -- <1 ....
23-549 SAYREVILLEBORO_0 R-80 10 Apt 1985 1200 12.0 185 .2 4.4 <1 <1 <1 9323-557 SOUTHAMBOYCITY _1) 9A 12 Oct 1984 1125 12.0 193 3.1 4.2 ........
23-557 SOUTHAMBOYCITY kl) 9A 10 Apr 1985 1410 12.5 190 2.8 4.2 <1 <1 <1 99
23-565 MONROEMUAROSSMOREGC17 18 Mar 1985 1245 11.0 192 6.9 5.0 7 5 9 14023-569 SAYREVILLEBORO_ T-82 18 Oct 1984 1015 12.5 132 .8 4.2 -- <1 ....23-570 PERTHAMBOYI_ 6-1982 17 Oct 1984 1050 12.0 214 .3 3.9 -- <1 ....
23-570 PERTHAMBOY1,1)6-1982 11 Apr 1985 1155 12.0 259 .3 4.0 <1 <1 <1 12223-571 PERTHANBOYIdO7-1983 11 Apt 1985 1250 11.5 186 .3 4.2 <1 <1 <1 90
23-581 PARLIH SUPPLYCO 1-1974 19 Ju_ 1985 1610 15.0 563 12.4 4.5 1 1 -- 33723-584 T & C METALGN4CHOY1-7826 Jun 1985 1650 13.5 170 .1 7.3 86 82 103 12023-729 ANHEUSERBUSCH10-1983 22 Mar 1985 1425 11.5 181 6.5 4.5 2 2 2 92
23-729 ANHEUSERBUSCH10-1983 01Apr 1986 1500 13.0 175 -- 4.9 ........23-735 PERTHAMBOYWDRUNYON8R 17 Oct 1984 1155 10.0 342 .2 4.1 -- <1 ....
23-735 PERTHAHBOYWI) RUNYON8R 11 Apt 1985 1400 10.5 348 .7 4.2 <1 <1 <1 17023-740 DALLENBACHTRAILER-1981 15 Apt 1985 1315 13.0 275 .4 4.5 1 <1 1 198
23-740 DALLENBACHTRAILER-1981 15 Jut 1986 1200 14.5 170 .3 4.7 -- <1 -- 103
23-741 SPERLINGROYAL1-1970 08 Apt 1985 1210 10.5 172 6.8 5.5 6 5 7 11623-742 APPLEGATESIHONSON-1971 11Apr 1985 1650 12.5 98 .5 6.6 48 41 59 70
23-742 APPLEGATESlMONSON-1971 02 Jun 1986 1000 14.5 100 .3 6.6 -- 40 -- 7423-754 MURPHY,RICHARD1973 14 Jun 1985 1520 13.0 -- .1 4.1 <1 <1 -- 92
23-755 WILLIAMS, MICHAEL1979 14 Jun 1985 1310 14.0 -- .1 6.7 69 36 83 12823-756 FALTER, EDWARD1974 20 Jun 1985 1620 15.0 138 .2 6.6 57 32 69 73
23-757 CORSE,DOROTHY1977 10 Jut 1985 1450 13.0 192 .1 4.3 <1 <1 <1 122
23-758 TARINO, ANGELO1954 11 Ju[ 1985 1045 13.0 260 10.3 5.1 3 3 4 17923-759 BROIJN,DORIS 1982 20 Jun 1985 1210 15.0 77 .1 6.5 33 17 41 42
23-761 WILOER,JOHANNES1983 20 Jun 1985 1430 14.0 51 .1 6.1 20 12 24 37
23-762 SHOVEY,JAMES1983 10 Jut 1985 1240 13.5 73 .1 6.2 24 8 29 36
23-763 STILES, LEN 1976 19 Jun 1985 1340 12.0 81 .1 5.5 7 <1 9 46
4O
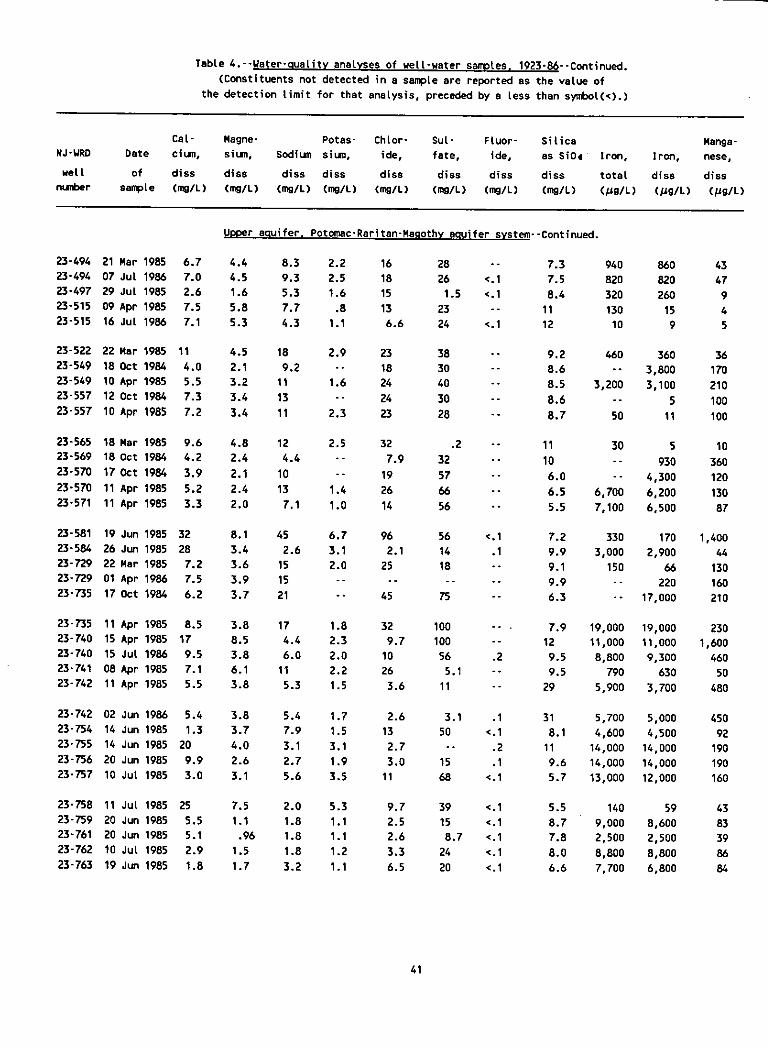
Table 4.--Water-quality analyses of welt-water samples, 1923-8_--Continued.(Constituents not detected in a sample are reported as the value of
the detection limit for that analysis, preceded by a tess than symbol(<).)
Cat- Magne- Potss- Chior- Sut- Ftuor- Silica Manga-
NJ-WRD Date cium, sium, sodium sium, ide, fate, ide, as Si04 Iron, Iron, nese,
welt of diss diss diss dtss diss diss diss diss total diss diss
number sample (mg/L) (mg/L) (mg/L) (r_g/L) (mg/L) (mg/L) (mg/L) (mg/L) (_g/L) (_g/L) (_g/L)
Ulcer eauifer, Potomac-Raritan-Ma8othY aquifer system--Continued.
23-494 21 Mar 1985 6.7 4.4 8.3 2.2 16 28 -- 7.3 940 860 43
23-494 07 Jut 1986 7.0 4.5 9.3 2.5 18 26 <.1 7.5 820 820 4723-497 29 Jut 1985 2.6 1.6 5.3 1.6 15 1.5 <.1 8.4 320 260 923-515 09 Apr 1985 7.5 5.8 7.7 .8 13 23 -- 11 130 15 4
23-515 16 Jut 1986 7.1 5.3 4.3 1.1 6.6 24 <.1 12 10 9 5
23-522 22 Mar 1985 11 4.5 18 2.9 23 38 -- 9.2 460 360 36
23-549 18 Oct 1984 4.0 2,1 9.2 -- 18 30 -- 8.6 -- 3,800 170
23-549 10 Apr 1985 5.5 3.2 11 1.6 24 40 -- 8.5 3,200 3,100 21023-557 12 Oct 1984 7.3 3.4 13 -- 24 30 -- 8.6 -- 5 10023-557 10 Apt 1985 7.2 3.4 11 2.3 23 28 -- 8.7 50 11 100
23-565 18 Mar 1985 9.6 4.8 12 2.5 32 .2 -- 11 30 5 10
23-569 18 Oct 1984 4.2 2.4 4.4 -- 7.9 32 -- 10 -- 930 360
23-570 17 Oct 1984 3.9 2.1 10 -- 19 57 -- 6.0 -- 4,300 120
23-570 11 Apt 1985 5.2 2.4 13 1.4 26 66 -- 6.5 6,700 6,200 13023-571 11Apr 1985 3.3 2.0 7.1 1.0 14 56 -- 5.5 7,100 6,500 87
23-581 19 Jun 1985 32 8.1 45 6.7 96 56 <.1 7.2 330 170 1,40023-584 26 Jun 1985 28 3.4 2.6 3.1 2.1 14 .I 9.9 3,000 2,900 4423-729 22 Mar 1985 7.2 3.6 15 2.0 25 18 -- 9.1 150 66 130
23-729 01 Apt 1986 7.5 3.9 15 ........ 9.9 -- 220 160
23-7]5 17 Oct 1984 6.2 3.7 21 -- 45 75 -- 6.3 -- 17,000 210
23-735 11 Apt 1985 8.5 3.8 17 1.8 32 100 -- • 7.9 19,000 19,000 23023-740 15 Apr 1985 17 8.5 4.4 2.3 9.7 100 -- 12 11,000 11,000 1,60023-740 15 Jut 1986 9.5 3.8 6.0 2.0 10 56 .2 9.5 8,800 9,300 46023-741 08 Apt 1985 7.1 8.1 11 2.2 26 5.1 -- 9.5 790 630 50
23-742 11Apr 1985 5.5 3.8 5.3 1.5 3.6 11 -- 29 5,900 3,700 480
23-742 02 Jun 1986 5.4 3.8 5.4 1.7 2.6 3.1 .1 31 5,700 5,000 45023-754 14 Jun 1985 1.3 3.7 7.9 1.5 13 50 <.1 8.1 4,600 4,500 9223-755 14 Jun 1985 20 4.0 3.1 3.1 2.7 -- .2 11 14,000 14,000 19023-756 20 Jun 1985 9.9 2.6 2.7 1.9 3.0 15 .1 9.6 14,000 14,000 190
23-757 10 Jut 1985 3.0 3.1 5.6 3.5 11 68 <.1 5.7 13,000 12,000 160
23-758 11 Jut 1985 25 7.5 2.0 5.3 9.7 39 <.1 5.5 140 59 43
23-759 20 Jun 1985 5.5 1.1 1.8 1.1 2.5 15 <.1 8.7 9,000 8,600 8323-761 20 Jun 1985 5.1 .96 1.8 1.1 2.6 8.7 <.1 7.8 2,500 2,500 3923-762 10 Jut 1985 2.9 1.5 1.8 1.2 3.3 24 <.1 8.0 8,800 8,800 86
2J3-763 19 Jun 1985 1.8 1.7 3.2 1.1 6.5 20 <.1 6.6 7,700 6,800 84
41

Table 4.--Water-ouetitv anatyses of _ett-ueter san_otes, 19;_3-86--Continued.
(Constituents not detected in a aampte ere reported as the vatue of the detection limit for that anotys|s,
preceded by a Less than symbol(<). Concentrations are in /Jg/L.)
NJ-_D Date Atu- Beryt- Cad- Chro- Lith- Notyb- Stron- Vena-
well of minum, Barium, t_um, mium, m|um, Cobalt, Copper, Lead, ium, denum, tium, dium, Zinc,nt_ber sample diss diss diss diss dtss dtss diss diss diss d|ss d_ss diss diss
UJ_er aau|far. Potomac-Raritan-Nanothv pquifeF s_;tem--Continued.
2]-494 21 Mar 1985 700 63 .5 <1 <10 7 <10 <10 <4 <10 97 <6 24
?,.3-494 07 Jut 1986 770 62 <.5 <1 <10 6 <10 <10 <4 <10 100 <6 26
23-497 29 Jut 1985 200 80 <.5 <1 -- <3 20 20 <4 <10 53 <6 623-515 09 Apt 1985 <10 51 .9 <1 10 <3 20 30 6 <10 61 <6 12
23-515 16 Jut 1986 10 51 <.5 <I <10 <3 20 20 <4 <10 57 <6 13
23-522 22 MaP 1985 2,400 120 <.5 <1 10 8 10 30 11 <10 120 <6 2223-549 18 Oct 198/* 1,100 110 2.0 <1 -- 6 20 <10 10 <10 49 <6 7623-549 10 Apt 1985 1,400 99 4.0 <1 <10 30 20 10 22 <10 62 <6 11023-557 12 Oct 1984 1,800 81 <.5 <1 "" 10 20 <10 8 <10 75 <6 120
23-557 10 Apt 1985 1,600 72 2.0 <1 <10 10 20 10 20 <10 74 <6 110
23-565 18 Nar 1985 10 190 <.5 <1 <10 <3 10 <10 17 <10 150 <6 3223-569 18 Oct 1984 1,300 89 2.0 <1 -- 20 30 <10 11 <10 61 <6 97
23-570 17 Oct 1984 4,500 74 <.5 <1 -- 20 40 <10 9 <10 44 <6 20023-570 11 Apt 1985 2,300 73 2.0 <1 <10 30 20 30 <4 <10 45 <6 25023-571 11Apr 1985 2,000 82 2.0 <1 <10 60 <10 30 26 <10 30 <6 360
23-581 19 Jun 1985 700 62 9.0 2 -- 120 50 <10 <6 <10 190 <6 660
23-584 26 Jun 1985 200 110 <.5 <1 -- <3 <10 <10 13 <10 190 <6 9323-729 22 Xar 1985 290 78 <.5 <1 20 7 10 30 8 <10 98 <6 27
23-729 01Apr 1986 -- 7"3 <.5 <1 -- 6 30 <10 6 <10 96 <6 2323-735 17 Oct 1984 4,800 160 4.0 <1 -- 30 50 20 16 <10 56 <6 430
?-3-735 11 Apt 1985 1,300 140 5.0 <1 10 50 <10 10 18 <10 59 <6 49023-740 15 Apt 1985 430 47 2.0 <1 10 80 10 30 <4 <10 100 <6 15023-740 15 Jut 1986 820 44 1.0 <10 <10 <3 <10 <10 5 <10 72 <6 78
23-741 08 Apr 1985 <10 130 1.0 <1 <10 4 320 <10 <4 <10 150 <6 6523-742 11Apr 1985 10 47 .7 <1 <10 10 <10 10 9 <10 68 <6 12
23-742 02 Jun 1986 <10 45 <.5 <1 <10 <3 <10 10 <4 <10 64 <6 <3
23-754 14 Jun 1985 2,800 110 <.5 <1 -- 10 <10 20 28 <10 30 <6 73
23-755 14 Jun 1985 <100 77 <.5 1 -- <3 <10 <10 7 <10 130 <6 523-756 20 Jum 1985 100 81 <.5 <1 -- <3 <10 <10 14 <10 80 <6 31
23-757 10 Jut 1985 2,500 90 <.5 <1 -- <3 <10 60 9 <10 31 <6 53
23-758 11 Jut 1985 100 80 .9 <1 -- <3 30 10 5 <10 100 <6 1923-759 20 Jtzn 1985 100 48 <.5 <1 -- <3 50 <10 14 <10 40 <6 39
?.3-761 20 Jun 1985 100 41 <.5 <1 -- <3 10 <10 <6 <10 36 <6 20
23-762 10 Jut 1985 100 42 <.5 <1 -- <3 <10 <10 17 <10 22 <6 1223-763 19 Jun 1985 100 170 .8 <1 "" <3 <10 <10 19 <10 20 <6 29
42

Table 4.--Water-auatitv analyses of welt-water ssmotes. 1923-86--Continued.
(Constituents not detected in a sample are reported as the value ofthe detection limit for that analysis, preceded by a tess than symbol(<).)
NJ
Ammonia Nitrite Kjeldahl NO2+ Ortho- Organic Dis- Central Laboratory
NJ-_D Date as M, as M, N as M, NO3as phosphate carbon, Phenols, trict Pesti-
well of diss diss diss t N, diss as P, dlss diss total VOC VOC cide
number sample (rag/L) (rag/L) (rag/L) (rag/L) (rag/L) (mg/L) (rag/L) scan5 analysis 5 analysis 5
Upper aquifer, Poton_c-Rsriten-Msgoth Y aquifer system--Continued.
23-494 21Nar 1985 .07 <.01 .4 3.6 <.01 1.6 1 + ND ND23-494 07 Jut 1986 .08 <.01 .3 4.2 <.01 1.4 1 --23-497 29 Jut 1985 .01 <.01 <.2 .82 <.01 1.3 3 --
23-515 09 Apt 1985 <.01 <.01 .6 2.6 <.01 6.9 <1 ND -- +23-515 16 Jut 1986 .02 <.01 .2 1.8 <.01 .5 ] +
23-522 22 Mar 1985 .03 <.01 .2 6.3 <.01 1.7 <1 + ND ND23-549 18 Oct 1984 .04 <.01 .2 <.1 <.01 ......
23-549 10 Apr 1985 .05 <.01 2.1 .14 <.01 1.1 <1 ND23-557 12 Oct 1984 .03 <.01 .3 2.2 <.01 ......
2.3-557 10 Apt 1985 <.01 <.01 1.4 4.3 <.01 1.0 <1 ND + ND
23-565 18 NaP 1985 .02 .02 .3 5.8 .02 .... ND ND ND
23-569 18 Oct 1984 .15 <.01 .3 .T5 <.01 .... NO ....23-570 170ct 1984 .09 <.01 .] <.1 .02 ......
23-570 11Apr 1985 .2 <.01 1.0 <.1 <.01 1.5 1 + ND ND23-571 11Apr 1985 .05 <.01 1.3 <.1 <.01 1.4 <1 ND -- ND
23-581 19 Jun 1985 <.01 .03 .6 11 <.01 30 <1 --
23-584 26 Jun 1985 .06 .01 <.2 <.1 <.01 .9 <1 --23-729 22 Nar 1985 .1 <.01 <.2 4.6 <.01 1.1 <1 ND ND ND
23-729 01Apr 1986 ................?3-735 170ct 1984 .11 <.01 .3 <.1 .02 ..........
23-735 11Apr 1985 .46 <.01 .7 <.1 .07 1.] <1 ND23-740 15 Apr 1985 .37 <.01 1.2 .13 <.01 1.5 <1 ND -- ND23-740 15 Jut 1986 .07 <.01 <.2 <.1 <.01 .7 <1 ND
73-741 08 Apr 1985 .11 <.01 .3 4.8 <.01 .9 <1 ND -- ND73-742 11Apr 1985 <.01 <.01 .7 <.1 <.01 .8 1 ND -- ND
23-742 02 Jun 1986 .04 <.01 .2 .12 <.01 .8 6 ND -- NO?3-754 14 Jun 1985 <.01 <.01 .5 <.1 <.01 1.0 4 ND ....
23-755 14 Jun 1985 .......... 1.1 1 + ....23-756 20 Jun 1985 .01 .01 <.2 .11 .01 .9 2 + ND ND
23-757 10 Jut 1985 .37 <.01 .5 <.1 .01 1.1 4 --
23-758 11 Jut 1985 .03 <.01 .4 13 <.01 1.6 <1 --
23-759 20 Jun 1985 .06 <.01 .5 <.1 .03 1.5 <1 ND ....
23-761 20 Jun 1985 .09 .01 .2 .13 .08 .9 7 ND ....
23-762 10 Jut 1985 .02 <.01 .4 <.1 <.01 .7 3 --23-763 19 Jun 1985 .15 .01 .2 <.1 .03 1.5 <1 ND ....
43

Table 4.--Water-Duality analyses of well-water samples, 1923-86--Centinued.(Constituents not detected in • sample are reported as the value of
the detection limit for that analysis, preceded by a less than symbol(<).)
Tam- Spa- Oxy- Field at- Lab at- Field
NJ-WRD Date pare- cific gen, Field katinity katinity bicer- Solids,welt Local wetl of ture cortduc- diss pH (mg/L as (mg/L as bonate 2 diss 8
number identifier sample Time ('C) tance 1 (mg/L) (units) (CaCO8) (Cat03) (mg/L) (mg/L)
Ul_oeraauifer, Potomac-Raritan-MaRothY aquifer system--Continued.
23-764 EHLER,HARY1980 10 Jut 1985 1100 12.5 59 .2 4.6 1 <1 2 39
23-765 JORDAN,ANTHONY1984 27 Jun 1985 1530 13.5 69 .2 6.1 20 24 15 4625-766 S OLD BRIDGEFIRE DPT3 18 Jut 1985 1120 13.5 56 .2 6.1 19 8 22 28
23-767 OLBRYS 1975 12 Jut 1985 1430 13.0 45 .1 5.8 4 3 5 3223-769 NILADINOV, ELIJA 1-1982 02 Aug 1985 1540 13.0 53 .1 6.4 19 9 22 33
23-770 JURGELSKY,FRANK1982 25 Jun 1985 1145 13.5 220 .1 7.3 79 70 95 14023-771 SCHARF,STEVEN1982 11 Jut 1985 1500 13.5 42 .1 6.1 11 8 12 2623-772 KONOSA 1977 12 Jut 1985 1240 13.0 136 .1 4.7 1 <1 <1 92
23-773 TEE-N-JAY FARES 1973 11 Jut 1985 1250 13.0 55 .1 6.0 9 2 10 2523-774 REBNICK, LEWIS1-81 17 Jut 1985 1110 13.0 225 .1 6.7 99 90 122 141
23-775 SEPTAK,JOHN 1-1979 01 Aug 1985 1640 12.5 138 .1 6.6 48 26 59 75
23-777 CHOU,1-1981 19 Jut 1985 1020 12.0 250 5.4 4.2 <1 <1 <1 1342]-779 BERESFORO,JAMES 1-1975 30 Jut 1985 1115 17.0 170 .3 4.2 -- <1 -- 9223-781 JOCAHACONSTCO 1980 17 Jut 1985 1400 13.5 103 .1 6.2 26 4 31 6425-783 OLDBRIDGEPARKSANDREC31 Jut 1985 1140 13.0 147 .2 6.3 52 22 63 71
23-784 EAVEDO,JOE 1"1982 07 Aug 1985 0950 12.0 52 .3 6.0 19 8 22 2823-785 SKISTIHAS, CHARLES1974 31 Jut 1985 1515 13.0 74 8.8 5.4 5 4 5 4523-1008 CLARK,ROMAN1983 24 Jun 1986 1115 12.5 212 10.4 5.5 8 7 8 154
23-1068 PROTINICK, JOHN 1972 11 Jun 1986 1500 14.0 100 .3 4.8 -- <1 -- 56
23-1069 8ARCLAYFARHSDON1965 04 Jun 1986 1530 12.5 360 8.5 5.1 -- 3 -- 240
25-6 ATL HIGHLANDS80ROWD1 29 Oct 1984 1055 17.0 95 .2 6.4 -- 17 ....
25-12 AVON-BY-THE-SEAM) 30BS 17 Sep 1926 ............ 31 -- 64
25-12 AVON-BY-THE-SEAM) 30BS 23 Jut 1958 -- 20.0 92 -- 6.0 -- 28 -- 5825-34 NADEARLE1-44 06 Ray 1985 1240 17.0 92 .1 6.4 37 17 44 4725-37 HOtlINYH GOLFC 2-63 10 Nay 1985 1350 16.5 66 .6 6.2 28 15 34 38
25-45 FLOCKANDSONS1-63 14 Nay 1985 1355 15.5 68 .4 6.2 23 12 27 42
25-56 ENGLISHTOWNBOROM) 2-65 14 Oct 1971 -- 14.0 28 -- 5.8 -- 3 -- 2225-62 ROKEACNANDSONSI(4-DP) 05 Jun 1969 -- 20.0 82 -- 7.4 -- 25 "- 5225-62 ROCEACEANDSONGI(4-DP) 15 Oct 1971 -- 18.0 80 -- 6.1 -- 20 -- 49
25-62 ROKEACHANDSONSI(4-DP) 22 Aug 1985 1245 -- 103 .2 6.5 -- 23 68 53
25-(_ NESTLE1-1947 22 Aug 1985 1610 15.5 57 .1 5.4 16 13 21 33
25-69 NESTLE2-1956 22 Aug 1985 1800 16.0 54 -- 6.3 18 13 21 3325-82 FREEROLDTWP_D-KOENIG1 05 Jun 1969 -- 17.0 47 -- 7.5 -- 12 -- 34
25-85 314COMPANY1-1957 17 Jut 1969 -- 16.0 47 -- 6.6 -- 7 -- 4125-85 3N COMPANY1-1957 06 Aug 1985 1420 20.0 125 -- 7.8 52 54 63 79
44

Tabte 4.--Water-quaLity anaLYses of weLt-water samples, 1923-86--Continued.(Constituents not detected fn a sample are reported as the vatue of
the detection Limit for that analysts, preceded by s tess than symboL(<).)
Cat- Magne- PoLes- Chtor- Sut- FLuor- SiLica Manga-
NJ-WRD Date cium, sium, Sodium sium, ida, fate, ida, as St04 Iron, Iron, nese,
welt of dtss dtss dtss dtss dtss dtss dtss dtss total diss dtss
number sample (ne/L) (ne/L) (nelL) (nelL) (nelL) (nelL) (nelL) (nelL) (pg/L) (pg/L) (pg/L)
Ul_oeraauifer. Potomac-Rariton-HaRothy aquifer system--Continued.
• 23-764 10 Jut 1985 .52 1.0 2.3 1.4 4.6 17 <.1 5.1 3,300 2,400 37
23-765 27 Jun 1985 3.3 1.7 1.5 .9 3.0 16 .1 7.9 9,200 9,200 10023-766 18 Jut 1985 2.3 .74 2.0 1.3 2.7 5.6 <.I 6.8 6,900 5,800 55
23-767 12 Jut 1985 1.1 .61 1.9 .8 2.1 6.0 <.1 8.2 5,100 5,100 4823-769 02 Aug 1985 3.0 .81 1,9 .9 2.6 5.2 <.I 8.0 5,700 5,500 52
23-770 25 Jun 1985 31 3.9 2.5 2.9 2.3 39 .1 9.0 4,400 4,300 6123"771 11 Jut 1985 2.9 .75 1.8 .9 2.2 6.7 <.1 7.6 1,900 1,900 3323"772 12 Jut 1985 2.4 2.7 11 2.2 23 19 <ol 9.0 2,600 2,500 7223-773 11 Jut 1985 .64 .41 2.4 .9 3.4 21 <.I 5.9 11,000 6,500 110
23-774 17 Jut 1985 24 7.0 5.7 3.4 2.1 26 <.1 15 8,600 8,700 170
23-775 01 Aug 1985 11 2.4 2.3 1.7 2.2 18 <.1 11 12,000 12,000 17023-777 19 Jut 1985 10 8.4 8.6 3.8 36 15 <.1 8.6 250 220 ';4
23-779 30 Jut 1985 4.5 2.8 6.7 2.3 23 32 <.1 7.9 3,100 2,700 9123-781 17 Jut 1985 4.1 2.3 1.6 1.1 4.7 26 <.1 6.9 15,000 14,000 17023-783 31 Jut 1985 8.9 3.9 1.5 2.2 3.1 20 .2 9.3 18,000 17,000 240
23-784 07 Aug 1985 1.9 1.3 1.4 .9 3.3 5.2 <.1 6.9 6,600 6,400 12023-785 31 Jut 1985 4.9 2.4 3.2 .8 4.6 19 <.1 7.0 310 190 1923-1008 24 Jun 1986 14 11 4.9 1.6 10 32 <.1 12 40 15 10
23-1068 11 Jun 1986 4.2 2.6 5.0 1.5 11 24 <.1 9.0 2,700 2,800 9823-1069 04 Jun 1986 23 18 11 10 36 24 <.1 11 980 85 360
25-6 29 Oct 1984 6.1 1.6 1.5 -- 1.4 10 -- 9.4 -- 13,000 17025-12 17 Sep 1926 13 1.9 2.8 2.0 2.2 12 -- 5.6 7,700 ....
25-12 23 JuL 1958 10 2.4 1.9 3.1 1.2 12 .1 9.8 -- 10,000 220
25-34 06 Hey 1985 5.3 1.6 1.6 1.9 2.5 11 <.1 8.4 9,400 9,900 13025-37 10 May 1985 4.6 1.3 1.7 1.4 2.5 13 -- 8.1 5,900 5,900 77
25-45 14 Hay 1985 3.9 1.3 1.7 1.3 2.7 17 -- 8.3 6,200 6,200 8325-56 14 Oct 1971 1.1 .4 1.7 .6 1.7 4.4 .1 7.7 -- 2,600 40
25-62 05 Jun 1969 9.2 1.8 2.1 2.3 1.9 12 .1 7.3 -- 5,000 17025-62. 15 Oct 1971 8.8 1.7 1.7 1.9 1.7 12 .1 7.8 -- 8,300 12025-62 22 Aug 1985 9.1 1.8 1.7 2.0 2.5 -- <.1 8.4 8,900 8,400 120
25"68 22 Aug 1985 4°7 .96 1.9 1.1 2.2 6.9 <.1 8.2 3,600 3,600 68
25-69 22 Aug 1985 4.3 .95 1.8 1.1 2.2 6.7 <.1 8.1 3,700 3,600 4825-82 05 Jun 1969 4.2 1.1 2.0 1.3 2.0 7.2 .1 7.1 -- 3,600 8025-85 17 Jut 1969 3.8 1.0 1.7 1.1 3.0 9.2 0 7.3 -- 5,600 6025-85 06 Aug 1985 21 37 2.2 .7 2.6 6.7 <.1 8.1 110 14 2
45

Table 6.--Water-Quality analyses of well-water samples, 1923-86--Continued.(Constituents not detected in e Sel_ple are reported as the value of the detection limit fop that analysis,
preceded by a less than symbol(<). Concentrations are in _g/L.)
NJ-_/RD Date ALu- Beryl- Cad- Chro- Lith- MoLyb- Stron- Vans-
well of mir_Jm, Barium, lium, mium, mium, Cobalt, COpper, Lead, ium, denum, tium, dium, Zinc,number sample diss diss diss diss diss diss diss diss diss diss diss diss diss
Uwoer aquifer. Potomac-Raritan-Magothy aquifer syston--Contfnued.
23-764 10 Jut 1985 400 81 <°5 <1 -- <3 <10 <10 10 <10 9 <6 1323-765 27 Jun 1985 200 38 .5 1 -- <3 <10 <10 7 <10 27 <6 1623-766 18 Jut 1985 <100 23 <.5 2 -- <3 <10 <10 13 <10 12 <6 12
23-767 12 Jut 1985 <100 28 <.5 <1 -- <3 <10 <10 18 <10 8 <6 3223-769 02 Aug 1965 <100 28 <.5 <1 -- <3 <10 20 11 <10 23 <6 5
23-770 25 Jun 1985 200 140 <.5 1 -- <3 <10 <10 11 <10 210 <6 4
23-771 11Jul 1985 100 32 <.5 <1 -- <3 <10 10 9 <10 24 <6 15
23-772 12 Jul 1985 600 79 <.5 <1 -- <3 <10 30 12 <10 36 <6 5623-773 11Jul 1985 <100 24 <.5 <1 -- <3 <10 20 13 <10 5 <6 110
23-774 17 Jul 1985 100 110 .9 1 -- <3 <10 10 22 <10 180 <6 3
23-775 01 Aug 1985 <100 39 <.5 1 -- <3 <10 20 11 <10 76 <6 823-777 19 Jut 1985 1,300 350 <.5 <1 -- 8 10 10 6 <10 230 <6 3/,
23-779 30 Jul 1985 2,300 120 <.5 <1 -- <3 <10 10 21 <10 52 <6 5523-781 17 JuL 1985 200 43 1.0 2 -- <3 <10 20 9 <10 35 <6 <3
23-783 31 JuL 1985 <100 78 <.5 3 -- <3 <10 20 20 <10 66 <6 290
23-750, 07 Aug 1985 100 13 <.5 <1 -- <3 <10 10 4 <10 15 <6 1523-785 31Jul 1985 <100 51 <.5 <1 -- <3 20 10 <4 <10 46 <6 28
23-1008 24 Jun 1986 <10 100 <°5 <1 <10 <3 <10 <10 5 <10 160 <6 2323-1068 11 J_ 1986 300 76 <.5 <1 <10 <3 <10 <10 11 <10 57 <6 5423-1069 04 Jun 1986 20 270 <.5 <1 <10 7 140 <10 6 <10 260 <6 66
25-6 29 Oct 1984 <100 120 .5 <1 -- <3 <10 <10 10 <10 56 <6 1225"12 17 Sep 1926 ..................25-12 23 Jut 1958 ........
25-34 06May 1985 200 72 <.5 <1 -" <3 <10 10 16 <10 49 <6 49
25-37 10 May 1985 <100 58 <.5 <1 -- 4 <10 <10 4 <10 60 <6 44
25-45 14 May 1985 100 56 <.5 <1 -- <3 70 <10 10 <10 34 <6 14025-56 14 Oct 1971 0 .......... 10 -- 0 ....25-62 05 Jun 1969 ........ °. . .......
25-62 15 Oct 1971 O ...... °° . .......
25-62 22 Aug 1985 <100 90 <.5 <1 -- <3 <10 5 <4 20 100 <6 12
25-68 22 AUg 1985 300 51 <.5 <1 "" <3 <10 <10 21 <10 40 <6 5
25-69 22 Aug 1985 100 49 <.5 <1 "" <3 <10 <10 20 <10 37 <6 2325-82 05 Jun 1969 ..................25-85 17 Jut 1969 ..................
25"85 06 AUg 1985 200 28 .5 <1 "" <3 <10 <10 21 <10 36 <6 <3
J46

Table 4.--Water-®atity analyses of well-water samtes. 1923-86--Cont|nued.
(Constituents not detected in a sanqple are reported as the value of
the detection limit for that analysis, preceded by a less than symbol(<).)
NJ
Ammonia Nitrite Kjeldahl NO2+ Ortho- Organic Ois- Central Laboratory
NJ-WRO Date as N, as N, N as N, NOs as phosphate carbon, Phenols, trier Pesti-
well of diss diss diss 4 N, diss as P, diss dias total VOC VOC aide
number sample (mg/L) (mg/L) (mg/L) (mg/L) (mg/L) (mg/L) (mg/L) scans analysis s analysis s
Ul3per aquifer. Potomac-Raritan-NaRoth¥ aquifer system--continued.
23-704 10 Jut 1985 <.01 <.01 .3 <.1 <.01 2.4 1 ND ....23-765 27 J_ 1985 .13 <.01 .2 <.1 <.01 15 <1 ND ....
2]-7_ 18 Jut 1985 .18 <.01 .2 <.1 <.01 1.4 2 ......23-767 12 Jut 1985 .04 <.01 .5 <.1 <.01 .7 <1 ND ....23-769 02 Aug 1985 .11 <.01 .5 <.1 .08 .7 <1 ND ....
23-770 25 Jun 1985 .05 <.01 <.2 <.1 <.01 1.1 <1 ND ....
23-771 11 JuL 1985 .09 .01 1.0 .33 .46 -- <1 ......23-772 12 Jul 1985 .05 <.01 <.2 <.1 <.01 .8 <1 ......
23-773 11 Jul 1985 .07 .01 .3 <.1 <.01 .7 <1 ......23-774 17 Jut 1985 .11 <.01 .5 <.1 <.01 3.2 <1 ......
23-775 01 Aug 1985 .09 <.01 .3 <.1 .25 .8 2 ND ....
23-777 19 Jut 1985 <.01 <.01 <.2 8.7 <.01 .8 <1 ND ....23-779 30 Jut 1985 .02 <.01 <.2 <.1 <.01 .5 5 ND ....23"781 17 JuL 1985 .05 <.01 .7 <.1 <.01 2.7 <1 ......
23-783 31 JUt 1985 .34 <.01 .7 <.1 .15 1.0 1 ND ....
23-784 07 Aug 1985 .02 <.01 .3 .12 .01 1.8 <1 + ....
23-785 31 Jut 1985 .16 <.01 .2 1.4 .01 .7 2 ND ....
23-1008 24 Jun 1986 <.07 <.01 .4 10 <.01 1.6 <1 .... ND23-1068 11 Jun 1986 .02 <.01 <.2 <.1 <.01 .6 2 ND -- ND23-1069 04 Jun 1986 .11 <.01 .6 <.1 <.01 1.1 6 ND -- ND
25-6 290ct 1984 .06 <.01 .2 <.1 <.01 .... NO ....
25-12 17 Sep 1926 ....................25-12 23 Jut 1958 ....................
25-3/, 06 Hay 1985 .07 <.01 .4 <.1 .03 1.0 6 ......25-37 10 Nay 1985 .07 <.01 1.6 <.1 <.01 .9 2 ND ....
25-45 14 Hay 1985 .1 <.01 .9 <.1 <.01 -- <1 ND ....25-56 14 Oct 1971 ....................25-62 05 Jun 1969 ....................25-62 15 Oct 1971 ....................
25-62 22 Aug 1985 .03 <.01 .2 <.1 <.01 .4 1 ......
25-08 22 Aug 1985 .04 <.01 .2 <.1 <.01 .7 1 ......25-69 22 Aug 1985 .01 <.01 <.2 <.1 <.01 .5 1 ......25-82 05 Jun 1969 ....................
25-85 17 Jul 1969 ....................
25-85 OOAug 1985 <.01 <.01 .2 <.1 .12 .7 <1 + ....
47

Table 4.--_ater-quality analyses of well-water semples_ 1923_86--Continued.(Constituents not detected in a sample are reported as the value of
the detection limit for that analysis, preceded by a tess than symbol(<).)
Tam- Spe- Oxy- Field at- Lab at- Field
NJ-_D Date pera- cific gen, F|eld kelinity kalinity bicar- Solids,ueLt Local well of t_re condo- diss pN (mg/L 6s (r_l/L es bonate 2 disc 3
number identifier sample Time ('c) tahoe1 (mg/L) (units) (Cat03) (CaCOs) (mg/L) (mg/L)
Upper aquifer, Potomac-RarJtan-Magothy aQuifer system--Continued.
25-91 BROCI_AYGLASS2-69 08 Nay 1985 1250 16.0 132 .5 7.3 57 54 68 7825-97 FREEHOLDTWPWO6-1966 05 Jun 1969 -- 16.0 69 -- 7.1 -- 23 -- 4425-97 FREEHOLDTL/PWD6-1966 27 Jun 1985 1310 14.5 172 .1 7.1 78 74 51 99
25-98 FREEHOLDBORO_D 4-1969 26 Apt 1985 1040 15.0 51 .3 5.6 13 6 18 3025,99 FREEHOLDTUPtJD 3-196/* 23 Apr 1969 37 -- 6.8 -- 6 -- 30
25-99 FREEHOLDTWP_O 3-1964 10 Jut 1975 1530 14.0 42 -- 6.0 -- 10 -- 41
25-111 SHORELANDSWCNAZLET1-5830 Oct 1984 0905 13.5 64 .3 6.1 -- 8 ....25-112 S_ORELANDS_C HAZLET2-6O30 Oct 1984 0945 14.0 67 .2 6.0 -- 8 ....25-117 HIGHLANDSDOROWD4-73 23 Oct 1984 1340 20.0 103 .4 6.3 -- 17 ....25-118 HIGHLANDSBORO_D 1-49 28 Feb 1957 -- 19.5 70 -- 7.4 -- 18 -- 50
25-121PENNWALTCORP1-60 26 Apt 1985 1400 16.0 66 .2 6.2 16 10 17 3225-154 SHORELANDSWCHOLNDL3-6430 Oct 1984 1040 14.0 53 .2 6.0 -- 7 ....
25-174 ADELPHIAW C 2-1974 16 May 1985 1325 16.5 70 .3 6.3 24 16 29 4325-175 ADELPHIAWC-HOVBILTCO1 08 Jun 1970 -- 17.0 73 -- 6.6 -- 22 -- 5925-175 ADELPHIAWC-HOVSILTCO 1 14 Oct 1971 -- 16.0 54 -- 6.1 -- 15 -- 31
25-177 SCHROTH,EMIL 1969 29 Jut 1971 -- 18.0 71 -- 7.3 -- 24 -- 4325-191KEA_SBURQBORO_ 6-68 31 Oct 1984 1005 14.0 -- .3 6.1 -- <_ ....
25-195 KEANSBURGDOROIJD5A-54 01 Sap 1954 .- 15.5 49 -- 5.8 -- 10 ....25-199 KERRGLASSCO 1964 25 Oct 1984 1500 14.0 74 .2 5.9 -- 3 ....
25-202 KEYPORTBOROkO5-1955 24 Jut 1958 "- 13.0 40 -- 5.5 "- 6 -- 27
25-202 KEYPORTBOROkO 5-1955 10 Jut 1975 1130 13.5 120 -- 6.2 -- 16 -- 8925-206 KEYPORTBOROkl) 4-1939 07 Mar 1986 1245 13.0 101 .1 6.3 34 12 38 53
25-207 KEYPORTBOROUO6-1970 10 Jul 1975 1000 13.0 198 -- 6.1 -- 13 -- 142
25-207 KEYPORTBOROkl) 6-1970 18 Apt 1986 1000 13.5 1,680 .3 6.6 34 <1 41 896
25-208 INFERN-O-THERMCO 1 16 Apt 1986 1555 13.0 7,350 <.1 5.7 10 <1 -- 4,170
25-212 CAPUTO1-1956 26 Aug 1985 1500 15.5 66 .4 6.3 26 15 31 4025-214 MANALAPANkO-LAMBSRD 1 06 Aug 1985 1245 14.0 47 .4 5.7 12 10 14 3525-218 QUAILHILL BS CAMP2-67 25 Jun 1985 1t00 13.0 77 .2 6.3 22 8 26 42
25-220 BATTLEGROUNDCC-IRRIGAT 05 Jun 1969 .- 16.0 36 -- 6.9 -- 5 -- 30
25-220 BATTLEGROUNDCC-IRRIGAT 01 May 1985 1540 16.0 46 .3 5.6 8 4 10 32
25-259 MARLBOROS HOSP12-50 10 Nay 1985 1205 17.0 54 .3 6.3 25 9 24 2925-282 BA¥SHORESE_ AU 1-1976 12 Jun 1985 1240 16,0 -- .1 6.4 37 46 49 285
25-283 MATAWANBOROUD 4-1956 30 Apr 1985 1140 14.5 85 .3 5.8 18 1 21 4825-284 MATAWANBORO_ 3-1956 23 Oct 1984 1030 12.5 72 .2 5.7 -- <1 ....
25-288 ABERDEENMUA-MATAWAN3 29 Oct 1984 1920 13.5 55 .2 6.0 -- 7 ....
48

Table 4.--Water-quality analyses of welt-water samples, 1923-86--Continued.(Constituents not detected in e sample are reported as the value of
the detection limit for that analysis, preceded by s less than symbol(<).)
Cat- Nagne- Potas- Chtor- Sut- Ftuor- SiLica Nanga-NJ-WRD Date cium, sium, Sodium sium, ida, fate, ide, as St04 Iron, Iron, nese, _X
well of diss diss diss diss diss diss diss diss total diss diss
number sample (mg/L) (n_l/L) (mg/L) (mg/L) (mg/L) (r_l/L) (mg/L) (mg/L) (_g/L) (_g/L) (_g/L)
UDDer sauifer. Pot_ac-Rsritan-RsRoth Y aquifer system--Continued.
25-91 08 Nay 1985 23 .98 2.2 1.0 2.4 12 <.1 7.8 170 54 4
25-97 05 Jun 1969 7.5 1.4 2.0 1.6 1.5 7.9 .2 7.1 -- 5,000 7025-97 27 Jun 1985 25 2.7 2.5 3.2 1.9 7.9 .4 8.8 1,000 780 4225-98 26 Apt 1985 2.8 .78 1.8 .8 2.2 11 <.1 8.0 3,500 3,600 49
25-99 23 Apt 1969 2.5 .8 2.0 .9 3.3 8.8 0 7.4 "" 3,400 40
25-99 10 Jut 1975 2.6 .7 1.7 .9 2.0 7.0 <.1 8.2 3,600 3,600 5025-111 30 Oct 1984 2.5 1.5 1.4 -- 1.6 8.3 -- 8.5 -- 8,400 12025-112 30 Oct 1984 2.6 1.6 1.4 -- 1.6 9.2 -- 8.4 -- 8,800 130
25-117 23 Oct 1984 6.5 1.5 1.7 -- 1.2 14 -- 9.8 -- 13,000 18025-118 28 Feb 1957 7.1 1.5 1.6 3.0 1.5 12 .1 9.8 -- 100 220
25-121 26 Apt 1985 3.2 1.3 1.6 3.6 1.9 11 <.1 8.3 7,200 7,300 10025-154 30 Oct 1984 2.2 1.4 1.5 -- 7.5 8.6 -- 8.5 -- 7,900 110
25-174 16 Nay 1985 5.3 1.2 1.8 1.4 2.2 6.9 -- 8.2 5,100 5,200 7925-175 08 Jun 1970 .7 .2 13 2.5 3.5 5.9 0 7.3 -- 2,200 5025-175 14 Oct 1971 5.4 1.2 1.6 1.3 1.6 7.2 .1 7.6 -- 5,100 80
25-177 29 Jut 1971 6.1 2.0 2.8 6.0 3.9 3.8 .1 3.9 ......
25-191 31 Oct 1984 7.1 4.2 8.9 -- 44 16 -- 8.8 -- 25,000 35025-195 01Sep 1954 ........ 2.5 11 ...... 2,400 --25-199 25 Oct 1984 2.4 1.6 1.7 -- 3.2 15 -- 8.0 -- 9,500 120
25-202 24 Jut 1958 2.4 1.2 1.7 1.3 2.0 7.9 0 10 -- 7,200 120
25-202 10 Jut 1975 10 2.8 6.3 1.6 27 11 <.1 7.9 15,000 15,000 22025-206 07 Nat 1986 6.1 2.0 2.2 1.6 11 5.9 <.1 9.0 -- 10,000 13025-207 10 Jut 1975 14 4.0 10 1.6 50 12 <.1 8.4 22,000 22,000 310
25-207 18 Apt 1986 44 28 140 4.0 500 66 <.1 9.4 140,000 140,000 2,10025"208 16 Apt 1986 160 120 910 8.3 2,500 350 <.1 9.0 500,000 480,000 7,200
25-212 26 Aug 1985 5.2 1.2 1.8 1.2 2.5 7.7 <.1 8.2 4,100 4,100 6525-214 06 Aug 1985 3.4 .95 2.1 1.5 2.8 9.5 <.1 7.8 1,600 1,700 50
25-218 25 Jun 1985 4.0 1.1 2.2 1.2 3.2 25 <.1 7.2 8,700 8,700 5825-220 05 Jun 1969 2.3 1.0 2.1 .8 4.1 8.5 .1 7.1 -- 3,400 4025-220 01 Nay 1985 2.2 .86 2.0 .9 2.3 9.7 <.1 7.3 2,800 2,800 51
25-259 10 May 1985 2.4 1.2 1.7 1.1 2.1 7.2 -- 8.0 6,000 6,000 77
25-282 12 Jura1985 26 9.9 28 4.2 46 69 .1 14 5,800 5,800 38025-283 30 Apt 1985 2.8 1.8 1.5 1.4 3.7 20 <.1 7.5 11,000 11,000 150
25-284 23 Oct 1984 2.2 1.5 1.8 -- 3.9 15 -- 7.0 -- 8,500 110
25-288 29 Oct 1984 2.1 1.2 1.6 -- 1.7 6.5 "" 8.5 "- 7,100 97
49
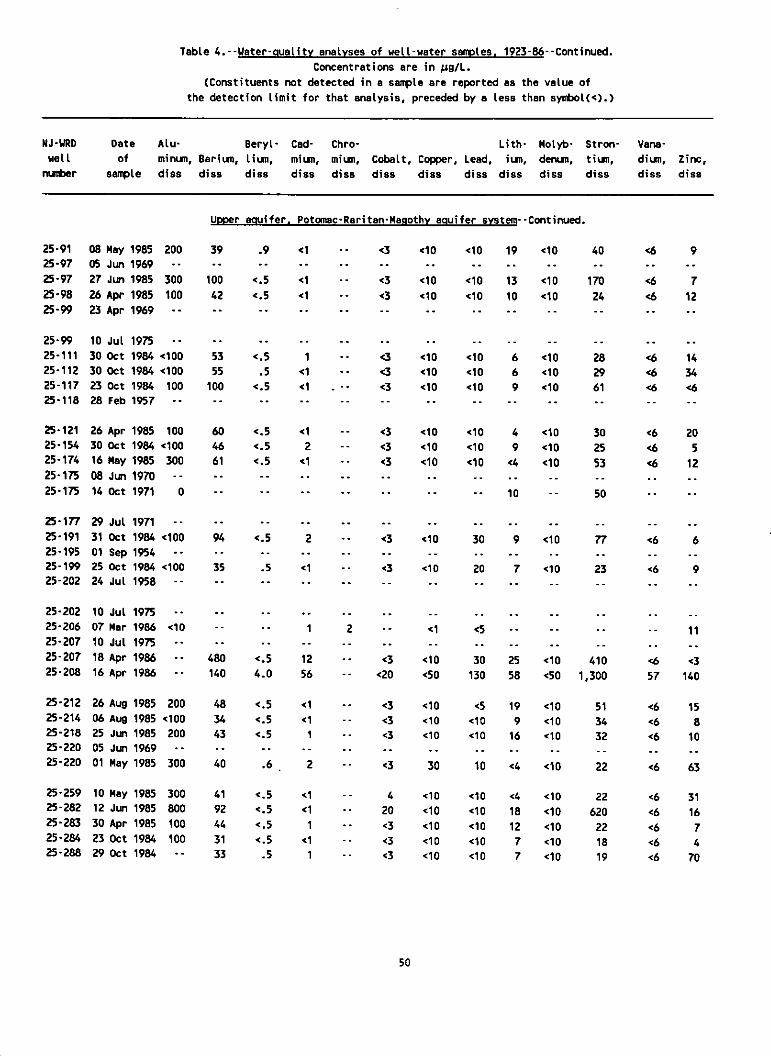
Table 4.--Water-quality analyses of welt-water samples, 1923-86--Continued.
Concentrations ere in _g/L.(Constituents not detected in s sample are reported as the value of
the detection limit for that analysis, preceded by a less than symbol(<).)
MJ-WRD Oats Alu- Beryl- Cad- Chro- Lith- Hotyb- Stron- Vane-
well of minum, Barium, lium+ mium, mium, Cobalt, Copper, Lead, ium, denum, tium, dium, Zinc,number sample dies diss diss dies diss diss diss diss diss diss diss diss diss
UDDer acrJifer. Potomac-Rariten-NaAothy aquifer system--continued.
25-91 08 Hay 1985 200 39 .9 <1 -- <3 <10 <10 19 <10 40 <6 925-97 05 Jun 1969 ......................
25-97 27 Jun 1985 300 100 <.5 <1 -- <5 <10 <10 1] <10 170 <6 7
25-98 26 Apt 1985 100 42 <.5 <1 -- <5 <10 <10 10 <10 24 <6 1225-99 23 Apr 1969 ......................
25-99 10 Jut 1975 ......................
25-111 30 Oct 1984 <100 5] <.5 1 -- <3 <10 <10 6 <10 28 <6 1425-112 50 Oct 1984 <100 55 .5 <1 -- <3 <10 <10 6 <10 29 <6 ]425-117 2] Oct 1984 100 100 <.5 <1 . -- <3 <10 <10 9 <10 61 <6 <625-118 28 Feb 1957 ......................
25-121 26 Apr 1985 100 60 <.5 <1 -- <3 <10 <10 4 <10 30 <6 20
25-154 30 Oct 1984 <100 46 <.5 2 -- <3 <10 <10 9 <10 25 <6 525-174 16 Nay 1985 300 61 <°5 <1 -- <3 <10 <10 <4 <10 53 <6 1225-175 08 Jun 1970 ......................
25-175 14 Oct 1971 0 .............. 10 -- 50 ....
25-177 29 Jul 1971 ......................
25-191 31 Oct 1984 <100 94 <.5 2 -- <5 <10 30 9 <10 77 <6 625-195 01 Sap 1954 ......................25-199 25 Oct 1984 <100 35 .5 <1 -- <3 <10 20 7 <10 23 <6 925-202 24 Jul 1958 ......................
25-202 10 Jut 1975 ......................
25-206 07 Mar 1986 <10 .... 1 2 -- <1 <5 ........ 1125-207 10 JuL 1975 ......................
25-207 18 Apt 1986 -- 480 <.5 12 -- <3 <10 30 25 <10 410 <6 <3
25-208 16 Apr 1986 -- 140 4.0 56 -- <20 <50 130 58 <50 1,300 57 140
25-212 26 Aug 1985 200 48 <.5 <1 -- <3 <10 <5 19 <10 51 <6 15
25-214 06 Aug 1985 <100 34 <.5 <1 -- <3 <10 <10 9 <10 54 <6 825-218 25 Jun 1985 200 43 <.5 1 -- <3 <10 <10 16 <10 32 <6 1025-220 05 Jun 1969 ......................
25-220 01 Hay 1985 300 40 .6 . 2 -- <3 30 10 <4 <10 22 <6 63
25-259 10 May 1985 300 41 <.5 <1 -- 4 <10 <10 <4 <10 22 <6 31
25-282 12 Jun 1985 800 92 <.5 <1 -- 20 <10 <10 18 <10 620 <6 1625-283 30 Apr 1985 100 44 <.5 1 -- <3 <10 <10 12 <10 22 <6 725-284 23 Oct 1984 100 31 <.5 <1 -- <3 <10 <10 7 <10 18 <6 4
25-288 29 Oct 1984 -- 33 .5 1 -- <3 <10 <10 7 <10 19 <6 70
5O

Table 4.--Water-o_Jality analYses of well-water samples, 1923-P_--Continued.(Constituents not detected in a sample ere reported as the value of
the detection limit for that analysis, preceded by a less than symbol(<).)
NJ
Ammonia Nitrite Kjetdahi NO2+ Ontho- Organic Dis- Central Laboratory
NJ-WRD Date as N, as N, H as Nt NO8as phosphate carbon, Phenols, trict Pesti-
uett of diss diss diss 4 N, diss as P, diss diss total VOC VOC cide
number sample (mg/L) (mg/L) (mg/L) (mg/L) (rag/L) (mg/L) (mg/L) scans analysis s analysis s
UDDer acnJifer, Potomac-Raritan-Ha_othy aquifer system--Continued.
25-91 08 Nay 1985 .07 <.01 .3 <.1 .22 1.0 1 ND ....25-97 05 Jun 1969 ................
25-97 27 Jun 1985 .06 .01 .2 <.1 <.01 1.1 <1 NO ....25-98 26 Apt 1985 <.01 <.01 .4 <.1 <.01 .7 -- XD ....25-99 23 Apt 1969 ................
25-99 10 Jut 1975 ................
25-111 30 Oct 1984 <.01 <.01 .2 <.1 <.01 .... ND ....25-112 30 Oct 1984 .03 <.01 .4 <.1 <.01 .... ND ....
25-117 23 Oct 1984 .04 <.01 .3 <.1 <.01 .... ND ....25-118 28 Feb 1957 ................
25-121 26Apt 1985 .02 <.01 .4 <.1 <.01 .6 ....
25-154 30 OCt 1984 .09 <.01 .4 <.1 <.01 .... gO ....
25-174 16 Hay 1985 .01 <.01 .8 <.1 <.01 .8 <1 ND ....25-175 08 Jun 1970 ................25-175 14 Oct 1971 ................
25-177 29 Jul 1971 ................
25-191 31 Oct 1984 .05 <.01 .4 <.1 <.01 .... ND ....25-195 01 Sap 1954 ................
25-199 25 Oct 1984 .08 <.01 <.2 <.1 <.01 .... ND ....25-202 24 Jul 1958 ....................
25-202 10 Jut 1975 ................
25-206 07 Nan 1986 .06 <.01 <.2 <.1 .03 1.1 10 --25-207 10 Jut 1975 ................
25-207 18 Apr 1986 ................25-208 16 Apr 1986 ................
25-212 26 Aug 1985 .02 <.01 <.2 <.1 <.01 .4 3 --
25-214 06 Aug 1985 .02 <.01 .3 .13 .02 .7 <1 ND ....25-218 25 Jun 1985 .01 .05 <.2 <.1 .02 .4 <1 ND ....25-220 05 Jun 1969 ................
25-220 01 Hay 1985 <.01 <.01 .6 <.1 <.01 1.0 <1 --
25-259 10 Nay 1985 .03 <.01 .5 <.1 <.01 .9 2 ND ....
25-282 12 Jun 1985 .08 <.01 -- <.1 <.01 1.1 2 ND ....25-283 30 Apt 1985 .06 <.01 1.0 <.1 <.01 1.0 <1 ND ....25-284 23 Oct 1984 .05 <.01 .2 <.1 .02 .... ND ....25-288 29 Oct 1984 .05 <.01 <.2 <.1 <.01 .... ND ....
51

TabLe 4.--Water-quaLity anstvses of weLL-water samples, 1923-86--continued.(Constituents not detected in a sample are reported as the value of
the detection Limit for that analysis, preceded by e tess than symboL(<).)
Tem- Spe- Oxy- FieLd at- Lab at- Fietd
NJ-WRD Date pera- cific gen, FieLd katinity kat_nity bicar- Solids,welt Local welt of ture conduc- diss pH (rng/L as (rng/L as bonate 2 diss s
number identifier sample Time ('C) tance I (mg/L) (units) (CaC03) (CaC03) (mg/L) (mg/L)
Upper aquifer. Potomac-Raritan-Hsgothy aquifer system--Continued.
25-292 ABERDEENMUA-NATAWAN1 12 Nay 1969 -- 13.0 36 -- 6.7 -- 8 -- 3025-294 NATAWANBORO_D 1-1944 23 Oct 1984 1125 13.5 94 .3 5.6 -- <1 ....
25-295 MATAWARBOROt/O 2-1943 23 Oct 1984 1215 13.0 91 .3 5.6 -- <1 ....25-303 BAHNHOLLOWC C 1-66 09 Jun 1970 -- 16.0 61 -- 6.9 -- 16 -- 42
25-303 BAHHHOLLO[#C C 1-66 30 Apr 1985 1415 16.0 78 .5 6.2 29 14 26 47
25-316 SANDYBOOKSP OB$ 1-1965 07 Sep 1977 1430 15.5 158 -- 7.1 -- 63 -- 96
25-321 NPB-SANDYBOOK4.1941 23 Apr 1969 -- 15.0 290 -- 3.8 -- <1 -- 15125-321 NPS-SANDYHOOK4-1941 25 Sep 1972 1440 15.5 191 -- 7.3 -- 30 -- 11425-341 MONCONWCAHEBICAN2-59 08 Apt 1958 -- 22.0 88 -- 6.4 -- 27 -- 6]25-341 MONCONWCAHERICAN2-59 23 Apt 1969 91 -- 7.1 -- 28 -- 58
25-358 REDBANKBOROt_) 18-50 08 Apt 1958 .... 70 -- 6.2 -- 23 -- 5225-358 REDBANKBOROUD 1B-50 29 Oct 1984 1345 17.5 -- .2 6.3 -- 17 ....
25-360 REDBANKBOROWD4-75 09 May 1985 1135 17.0 103 .8 .... 18 -- 44
25-36Z ROOSEVELTBOROIJO 1-56 10 Apr 1972 -- 16.5 75 -- 6.1 -- 25 -- 4825-419 UNION BEACHBORO_0 1-62 10 Jut 1975 1215 13.5 343 -- 6.2 -- 14 -- 237
25-419 UNION BEACH80ROM) 1-62 22 Apt 1986 1435 13.5 4,000 -- 6.1 21 <1 -- 2,27025-420 UNIONBEACHBORO_0 2-69 24 Oct 1984 1345 13.0 6,000 .3 5.3 -- <1 ....25-420 UN]ONBEACHBOROt_) 2-69 04 Mar 1986 1613 13.0 6,150 -- 5.8 ........
25-420 UNIONBEACHBORO_D 2-69 22 Apt 1986 1535 13.0 6,000 -- 5.7 11 <1 11 3,67025-420 UNION BEACHBORO_/D2-69 25 Apt 1986 0850 13.5 5,860 -- 5.8 12 <1 12 3,100
25-423 INT FLAVORFRAG1-1951 31 Oct 1984 1115 14.0 61 .3 6.0 -- 8 ....
25-423 [H_ FLAVORFRAG%1951 01 Apt 1986 1015 13.5 61 -- 6.4 ........25,457 KNOBHILL COUNTRYC 1-74 25 Jun 1985 1335 14.5 46 .3 5.4 8 3 -- 30
25-459 NAVESINKC C 1-78 08 Jut 1985 1415 16.5 102 .1 6.7 42 18 51 66
25-462 KEANSBURGAHUEEMENTPK 1 07 Aug 1985 1210 13.5 215 .4 6.0 20 <1 22 110
25-493 HO',_ELLTHP HUA1-75 03 Hay 1985 1130 18.0 104 .1 6.5 38 22 47 6425-496 ATL HIGHLANDSBOROkO 4 29 Oct 1984 1135 17.0 96 .2 6.3 -- 16 ....25-502 FREEHOLDTUP8-1981 21Jun 1985 1120 15.0 61 .1 6.1 20 11 24 3425-514 ]NT FLAVORFRAG2R-1983 31 Oct 1984 1150 15.0 49 .3 5.7 -- 8 ....
25-548 EMERYMANORNUMBHOHE1 02 Aug 1985 1110 13.0 94 .3 6.1 27 5 34 40
25-556 USGSALLENTOWNU01-1952 14 Apt 1958 -- 13.0 ........ 44 -- 8025-556 USGSALLENTOWNk01-1952 01 Jut 1958 -- 13.5 ........ 46 -* 80
25-557 T_ITCHELL, CARL1958 18 Jun 1985 1245 15.5 185 .4 7.0 87 71 107 115
25-559 COAR, R.J. 1981 24 Jun 1985 1530 13.0 49 .1 6.2 13 9 15 3025-560 RICHARDS(HAJEED) 1-1980 26 Jun 1985 1455 13.5 61 .1 6.2 14 6 15 29
52

Table 4.--Water-ouality analyses of well-water samolec. 1923-86--continued.
(Constituents not detected in a sa_lple are reported as the value ofthe detection limit for that analysis, preceded by a tess than sy_doot(<).)
Cat- Nagne- Potas- Chief- Sul- Fluor- Silica Mange-
NJ-WRD Date cium, sium, sodium sium, ide, fate, ide, as Si04 Iron, Iron, nese,
uett of diss diss diss diss diss diss diss diss total diss diss
number san_ole (mg/L) (mg/L) (mg/L) (n_g/L) Cmg/L) (mg/L) (mg/L) (mg/L) (_g/L) (_g/L) (_g/L)
Upper aauifer. Potomac-Raritan-Magothy aquifer system--Continued.
25-292 12 May 1969 2.1 1.2 1.7 1.1 2.8 6.6 0 7.6 -- 7,600 9025-294 23 Oct 1984 3.4 2.2 2.0 -- 1.8 26 -- 8.0 -- 11,000 16025-295 23 Oct 198/* 3.3 2.0 2.0 -- 2.0 25 -- 7.9 -- 10,000 150
25-303 09 Jun 1970 4.8 1.5 1.7 1.7 1.2 6.9 .1 7.8 -- 2,600 15025-303 30 Apt 1985 4.7 1.5 1.5 1.7 2.0 13 <.1 8.3 7,900 7,800 110
25-316 07 Sep 1977 15 2.9 7.8 6.0 2.2 13 .1 11 14,000 <10 110
25-321 23 Apt 1969 15 4.0 14 4.0 60 14 0 9.5 -- 32,000 42025-321 25 Sep 1972 18 3.3 10 4.0 31 4.7 .1 8.0 -- 12,000 31025-341 08 Apr 1958 10 2.2 1.1 2.9 1.8 12 .1 9.9 -- 0,700 200
25-341 23 Apt 1969 10 2.1 1.5 2.1 2.7 11 0 8.4 -- 12,000 70
25-358 08 Apt 1958 8.1 1.9 .9 2.2 1.6 8.4 .1 9.9 -- 9,200 19025-358 29 Oct 1984 6.0 1.6 1.5 -- 1.7 9.7 -- 9.1 -- 14,000 200
25-360 09 Hay 1985 6.5 1.7 1.4 1.8 2.1 13 -- 9.3 14,000 13,000 190
25-362 10 Apt 1972 6.8 2.5 2.1 1.9 1.9 5.1 .2 9.8 -- 9,000 16025-419 10 Jut 1975 21 5.9 30 1.9 99 19 <.1 8.5 3,100 3,100 460
25-419 22 Apt 1986 75 52 510 6.7 1,300 170 <.1 8.8 -- 220,000 3,400
25-420 24 Oct 1984 100 77 710 -- 2,300 250 -- 8.4 -- 430,000 5,10025-420 04 Mar 1986 120 85 860 -- 2,100 .... 9.5 -- 340,000 5,00025-420 22 Apr 1986 110 83 8/*0 9.2 2,100 270 <.1 8.9 -- 540,000 5,100
25-420 25 Apt 1986 95 69 700 8.1 1,800 230 <.1 0.7 -- 280,000 4,200
25-423 31 Oct 1984 2.4 1.5 1.5 -- 1.7 9.0 -- 8.4 -- 7,800 11025-423 01 Apt 1986 2.8 1.5 1.5 -- 1.6 .... 9.0 -- 7,700 130
25-457 25 Jun 1985 1.9 .59 2.0 .8 2.9 11 .1 7.1 3,500 3,500 4625-459 08 Jut 1985 6.2 1.6 1.3 2.3 2.1 17 <.1 9.2 13,000 13,000 18025-462 07 Aug 1985 7.0 4.2 7.6 2.3 45 14 <.1 9.0 23,000 23,000 340
25-493 03 May 1985 8.2 1.7 1.5 2.0 2.3 12 .1 8.2 8,900 8,600 12025-496 29 Oct 1984 6.0 1.6 1.5 -- 1.3 11 -- 9.3 -- 13,000 17025-502 21 Jun 1985 4.1 1.1 2.0 1.2 2.3 8.8 <.1 7.9 4,600 4,700 7125-514 31 Oct 1984 2.5 1.6 1.3 -- 1.6 7.7 -- 8.1 -- 3,500 150
25-548 02 Aug 1985 3.5 2.1 1.6 1.3 3.7 4.7 <.1 8.2 13,000 14,000 170
25-556 14 Apr 1958 12 3.6 2.3 2.6 3.2 6.6 .1 15 6,900 ....25"556 01 Jut 1958 13 3.4 2.0 2.8 3.0 5.7 0 17 6,900 ....
25-557 18 Jun 1985 29 1.7 1.8 1.3 2.2 10 <.1 8.4 6,700 6,700 11025-559 24 Jun 1985 3.6 .72 1.9 .7 2.0 6.2 <.1 8.0 3,300 3,200 36
25-560 26 Jun 1985 2.0 .72 1.7 .8 2.0 7.6 <.1 8.1 5,200 5,300 50
53

Tabte 4.--Water-ouat|tv anatYses of watt-water aamoles. 1923-86--Continued.
(Constituents not detected in a sampte ere reported as the vstue of the detection timit for that analysis,preceded by a tess than symbot(<). Concentrations are in pg/L.)
MJ-WRD 0ate Atu- Beryl- Cad- Chro- Lith- Molyb- Stron- Vane-
well of mir_Jm,Barium, lium, mium, mium, Cobatt, Copper, Lead, ium, denum, tium, dium, Zinc,number sampte diss diss diss diss diss diss diss diss diss diss diss diss diss
UDDer aouifer. Poto_c-Raritan-Ma_othy aquifer ayst_--Continuecl.
25-292 12 May 1969 ..................
25-294 23 Oct 1984 100 53 <.5 <1 -- <3 <10 <10 12 <10 29 <6 33
25-295 23 Oct 1984 300 49 <.5 <1 -- <3 <10 10 13 <10 29 <6 2925-303 09 Jun 1970 ..................
25-303 30 Apr 1985 <100 65 <.5 <1 -- <3 <10 10 7 <10 40 <6 12
25-316 07 Sep 1977 ..................
25-321 23 Apt 1969 0 ................
25-321 25 Sep 1972 ..................25-341 08Apr 1%8 ..................25-341 23 Apt 1969 ..................
25-358 08 Apt 1958 ..................
25-358 29 Oct 198/, <100 78 <.5 1 -- <3 <10 10 11 <10 56 <6 210
25-360 09 May 1985 200 85 .8 <1 -- <3 <10 10 14 <10 61 <6 <325-362 10 Apt 1972 ............ 0 -- 60 ....25-419 10 Jut 1975 ..................
25-419 22 Apt 1986 -- 120 5.0 17 -- <9 <30 30 47 40 630 32 10025-420 24 Oct 1984 100 87 <2.0 22 -- 60 <30 180 42 <30 910 <20 26
25-420 04 Mar 1986 -- 74 <3.0 35 -- 900 <50 110 65 <50 930 50 3125-420 ZZ Apt 1986 -- 81 8.0 23 -- <20 <50 90 68 <50 930 51 24
25-420 25 Apt 1986 -- 77 6.0 19 -- <20 <50 60 60 <50 790 42 92
25-423 31 Oct 198/* <100 45 <.5 1 -- <3 <10 30 7 <10 26 <6 7
25-423 01 Apt 1986 -- 39 2.0 3 -- <9 <30 <30 <12 <30 30 <18 4025"457 25 Jun 1985 <100 34 <.5 1 -- <3 <10 <10 16 <10 16 <6 625-459 08 JuL 1985 <100 8/, <.5 2 -- <3 <10 30 15 <10 54 <6 1625-462 07 Aug 1985 100 120 <.5 <1 -- <3 <10 10 11 <10 70 <6 <3
25-493 03 May 1985 200 79 <.5 <1 -- 10 <10 20 8 <10 86 <6 <3
25-496 29 Oct 198/, <100 120 <.5 2 -- <3 <10 <10 7 <10 56 <6 2225-502 21Jun 198S 100 56 <.5 <1 -- <3 <10 <10 10 <10 39 <6 1325-514 31 Oct 1984 <100 51 <.5 <1 -- <3 <10 <10 6 <10 28 <6 38
25"548 02 Aug 1985 <100 35 <.5 2 -- <3 <10 20 12 <10 25 <6 13
25-556 14 Apt 1958 ..........25-556 01Jui 1958 ..........
25-557 18 Jun 1985 <100 66 2.0 <1 -- 6 <10 <10 9 <10 58 <6 31
25-559 24 Jun 1985 100 38 <.5 2 -- <3 <10 <10 20 <10 27 <6 320
25-5(>0 26 Jun 1985 200 3,; <.5 2 -- <3 <10 <10 21 <10 14 <6 <3
54
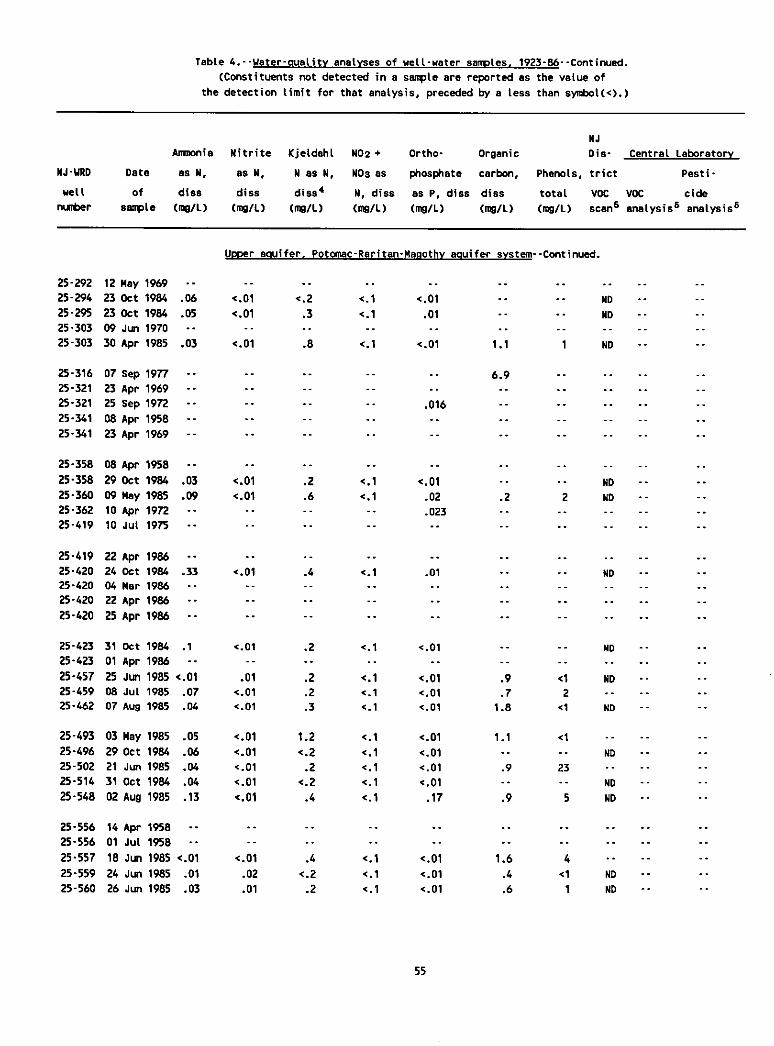
Table 4.--gater-ouality analyses of well-water samples, 1923-84--continued.
(Constituents not detected in a sample are reported as the value ofthe detection limit for that analysis, preceded by a tess than symbol(<).)
NJ
Ammonia Nitrite Kjetdahl NO2 + Ortho- Organic Dis- Central Laboratory
NJ-gRD Oate as N, as N, N as N, NOsas I_osphate carbon, Phenols, trict Pesti-
uett of diss diss diss 4 N, diss as P, dtss d{ss total VOC VOC cidenumber sample (ntg/L) (rag/L) (mg/L) (mg/L) (mg/L) (mg/L) (mg/L) scans anolysis s analysis 5
U_oer aau|fer. Potomac-Raritan-Magothy aquifer system--Continued.
25-292 12 Nay 1969 ................25-294 23 Oct 1984 .06 <.01 <.2 <.1 <.01 .... ND ....
25-295 23 Oct 1984 .05 <.01 .3 <.1 .01 .... ND ....25-303 09 Jun 1970 ................
25-303 30 Apt 1985 .03 <.01 .8 <.1 <.01 1.1 1 ND ....
25-316 07 Sap 1977 .......... 6.9 ....25-321 23 Apt 1969 ................25-321 25 Sap 1972 ........ .016 ......
25-341 08 Apr 1958 ................25-341 23 Apt 1969 ................
25-358 08 Apt 1958 ................
25-358 29 Oct 1984 .03 <.01 .2 <.1 <.01 .... ND ....
25-360 09 Nay 1985 .09 <.01 .6 <.1 .02 .2 2 ND ....25-362 10 Apt 1972 ........ .023 ......25-419 10 Jut 1975 ................
25-419 22 Apr 1986 ................25-420 24 Oct 1984 .33 <.01 .4 <.1 .01 .... ND ....25"420 04 Mar 1986 ................
25-420 22 Apt 1984 ................
25-420 25 Apt 1986 ................
25-423 31 Oct 1984 .1 <.01 .2 <.1 <.01 .... ND ....
25-423 01Apr 1984 ................
25-457 25 Jun 1985 <.01 .01 .2 <.1 <.01 .9 <1 NO ....25-459 08 Jut 1985 .07 <.01 .2 <.1 <.01 .7 2 --
25-462 07 Aug 1985 .04 <.01 .3 <.1 <.01 1.8 <1 ND ....
25-49] 03 Nay 1985 .05 <.01 1.2 <.1 <.01 1.1 <1 --25-496 29Oct 1984 .06 <.01 <.2 <.1 <.01 .... ND ....
25-502 21 Jun 1985 .04 <.01 .2 <.1 <.01 .9 23 --25-514 31 Oct 1984 .04 <.01 <.2 <.1 <.01 .... ND ....
25-548 02 Aug 1985 .13 <.01 .4 <.1 .17 .9 5 ND ....
25-556 14 Apt 1958 ................25-556 01 Jut 1958 ................
25-557 18 Jun 1985 <.01 <.01 .4 <.1 <.01 1.6 4 --
25-559 24 Jun 1985 .01 .02 <.2 <.1 <.01 .4 <1 ND ....25-560 26 Jun 1985 .03 .01 .2 <.1 <.01 .6 1 ND ....
55

TabLe 4.--Water-auat{ty analyses of Melt-Meter sanoles. 1923-86--continued.
(Constituents not detected in a sample are reported as the value ofthe detection Limit for that analysis, preceded by a Less than symbol(<).)
Tom- Spa- Oxy- Field el- Lab at- Field
NJ-WRD Date pera- cific gen, Field ka|inity katlnity bicar- Solids,well Local welt of tune ¢onduc- diss pH (mg/L as (mg/L as borate 2 diss 3
number identifier sample Time ('C) tance I (mg/L) (units) (COCO3) (CaC03) (mg/L) (mg/L)
ul:_oeraauifer. Potomac-Rsritan-Magothy aquifer system--Continued.
25-564 GOROONSCORNERUC 11-84 23 Rpn 1985 1350 15.0 53 .2 6.1 10 9 8 --25-567 USGSUNION 8CHWTRTR-86 15 Jut 1986 1415 14.5 84 .9 6.1 28 16 34 50
25-568 USGSJCPL-UNiONBEACH-8615 Apt 1986 1440 13.5 6,000 .4 5.6 11 <1 -- 3,420
Col- Ragne- Poles- Chtor- Sui- FLuor- Silica Nanga-
NJ-WRD Date cium, s|ura, Sodium sium, ide, fate, ide, as Si04 iron, Iron, nose,
uetL of diss diss diss diss diss diss diss diss total diss dlss
number sample (mg/L) (mg/L) (mg/L) (mg/L) (mg/L) (mg/L) (mg/L) (mg/L) (#g/L) (_g/L) (_g/L)
UlCer aquifer. PototaaClRaritan-Hagothy aquifer system--Continued.
25-564 23 Apt 1985 2.8 1.1 1.6 .9 2.0 5.5 .1 8.4 5,300 5,200 6725-567 15 JuL 1986 4.4 1.5 4.8 1.3 1.8 19 .1 8.9 12,000 7,400 11025-568 15 Apr 1986 100 78 840 7.8 2,000 290 <.1 8.9 300,000 L:_O,O00 4,300
NJ-WRD Date ALu- Beryl- Cad- Chro- Lith- Motyb- Stron- Vane-Melt of minum, Barium, tium, mium, mium, Cobalt, Copper, Lead, ium, denum, tium, dium, Zinc,
number sample diss diss diss diss diss diss diss diss diss diss diss diss diss
(_g/L) (_g/L) (_g/L) (_g/L) (_g/L) (_g/L) (_g/L) (_g/L) (_g/L) (_g/L) (_g/L) (_g/L) (_g/L)
UDDeraauifer. Potomac-Raritan-Magothy aquifer system--Continued.
25-564 23 Apt 1985 200 41 <.5 <1 -- <3 <10 <10 5 <10 24 <6 <3
25-567 15 Jut 1986 30 40 <.5 <1 -- <3 <10 <10 8 <10 34 <6 9825-568 15 Apr 1986 -- 98 <3.0 42 -- <20 <50 <50 48 <50 860 32 52
56

Table 6.--Water-quality analyses of weli-uster samples. 1923-,_O--continued.(Constituents not detected in a sample are reported as the value of
the detection limit for that analysis, preceded by a less than sy,_bot(<).)
NJ
Ammonia Nitrite Kjeldahl NO2+ Ortho- Organic Dis- Central Laboratory
HJ-WRD Date as H, as N, H as N, NO3as phosphate carbon, Phenols, trict Pesti o
Melt of diss diss diss 4 N, diss as P, diss diss total VOC VOC cide
nud_r sample (mg/L) (n_/L) (r_l/L) (mg/L) (n_/L) (mg/L) (mg/L) scan6 anaLysis 5 analysis s
Upper aquifer, Potemac-Rariten-Regoth Y aquifer system--Continued.
25-564 23 Apr 1985 <.01 <.01 .4 <.1 <.01 .9 -- ND ....25-567 15 Jut 1986 .05 <.01 <.2 .1 <.01 2.0 ....25-568 15 Apt 1986 ................
57

TabLe 4.--Water-auality analyses of well-water samples. 1923-86--Continued.
(Constituents not detectecl in a Se,TT)te are reported as the value of
the detection Limit for that analysis, preceded by s tess than symboL(<).)
Tem- Spe- Oxy- FieLd st- Lab at- FieLdBJ-IJRD Date pets- cific gen, FieLd katinity kstinity bicar- SoLids,
weLL LocaL ueit of ture cemduc- diss pH (mg/L as (mg/L as b<)nate2 d|ss 3nL_ber identifier senxoLe Time ('C) Lance1 (mg/L) (units) (COCO3) (CAD03) (mg/L) (ITeg/L)
Middle aquifer, Potomac-Raritan-Ma_othy aquifer system
23-7 BACd_RTY,JLIOSOM1-64 07 Hay 1985 1250 13.0 81 .1 4.6 1 <1 <1 4123-13 STULTZ1-1954 06 Aug 1985 1010 12.5 100 2.4 5.9 10 11 12 96
23-14 CRANBURYTWP_ 1-1906Z 04 Aug 1969 -- 14.5 51 -- 5.6 -- 7 -- 4023-17 CRANBURYTI/P WD3-1963 04 Aug 1969 -- 15.0 52 -- 5.4 -- 1 -- 41
23-17 CRANBURYTWP_) 3-1963 28 Nay 1985 1420 15.5 43 4.0 5.0 2 2 1 27
23-29 NJ TPKESERVAREA7S-1 04 Aug 1969 -- 14.0 109 -- 5.8 -- 1 -- 79
23-38 HUTCHINSONH T I(7AVETZ) 22 Hay 1985 1245 14.5 56 9.4 5.3 6 6 4 3623-39 KONUK1-1956 26 Aug 1985 1100 12.5 55 .8 .... <1 -- 3623-46 POLYSAR1-1968 30 Jut 1985 1315 12.5 58 .1 5.3 4 <1 5 3723-58 TAI4ARACKGOLFCOURSE1-T5 19 Jut 1985 1240 13.0 124 .2 4.5 <1 <1 <1 65
23-59 EASTBRUNSWICKWD2-55 31 Aug 1969 -- 14.0 41 -- 5.9 -- 2 -- 40
23-59 EASTBRUNSMICKkl)2-55 19 JuL 1985 1450 12.5 65 .2 5.5 7 <1 9 3423-03 EASTBRUNSWICKWO1-51 16 Hay 1985 1135 13.0 96 .1 5.6 13 <1 16 55
23-72 SMITH, LAWRENCE2-1972 24 Hay 1985 1500 14.0 205 .5 5.0 5 3 5 138
23-80 HERBERTSANDRABNEYWELL17 Apr 1985 1535 11.5 168 3.6 4.7 5 3 6 88
23-89 ALCOAEDISONWRKSP1-59 10 Apr 1985 1230 13.5 275 1.2 6.4 50 37 61 16023-94 HELHETTAWC5-1962(0LD2) 21 Mar 1985 0955 11.5 55 .3 4.4 1 <1 1 35
23-94 HELHETTAWC5-1962(0LD2) 10 Jut 1986 1015 12.0 50 .3 4.7 -- <1 -- 2823-127 DUHERNALWCAF-1945 06 Jun 1969 -- 15.0 57 -- 7.4 -- 13 -- 4123-132 DUHERNALWCOBS-56F-1947 05 Aug 1985 1320 14.0 44 -- 5.8 10 1 12 36
23-146 OLDBRIDGENUA6RN3-66 31 Jut 1969 -- 15.0 37 -- 6,3 -- 2 -- 3623-146 OLDBRIDGEI_JABRB3-_ 01 Hay 1985 1125 15.5 48 .3 5.7 13 3 7 3023-147 OLDBRIDGEHUABRN4-66 27 Aug 1985 1725 13.5 47 .1 5.8 8 2 10 2823-171 DUHERNALWCBF-1946 05 Aug 1985 1100 12.5 50 .2 5.9 14 11 16 3623-194 PERTHANBOYkl) RUNYON1 18 Ju[ 1923 ............ 5 -- 38
23-194 PERTHANBOY_ RUBYON1 15 Apt 1933 ............ 4 -- 3723-196 PERTHANBOY_ 1A-1968 13 Jun 1969 -- 13.0 50 -- 7.3 -- 10 -- 38
23-197 PERTHANBOY_ 2-1944 17 Oct 1984 1305 12.5 1,080 ,2 5.4 -- 1 ....23-206 OLDBRIDGETWPNUA-LH2 12 Apr 1956 -- 13.5 53 -- 6.0 -- 8 ....23-206 OLDBRIDGETWPNUA-LH2 31 Jut 1969 -- 15.0 44 -- 6:5 -- 6 -- 39
23-206 OLDBRIDGETWPNUA-LH2 14 Sep 1973 1450 13.5 42 -- 5.8 -- 7 -- 4423-206 OLDBRIDGETWPHUA-LH2 24 Oct 1984 1115 13.0 103 .4 6.3 -- 8 ....23-226 GENERALFOOOS2-1967 26 Aug 1985 1700 13.5 82 13.0 5.0 3 3 4 5823-229 HONROENUA-FORSGATE40B 13 Aug 1986 1410 12.0 146 1.0 5.9 16 6 17 117
23-232 HONROEHUA-FORSGATE11 25 Apt 1985 1340 13.0 150 8.1 5.8 12 11 12 111
58

Table 4.--Water-cpJatitv analyses of welt-water ssmplesa 1923-86--Continued,(Constituents not detected in a sample are reported as the value of
the detection tit, it for that anatysis, preceded by e tess than symbol(<).)
Cat- Magne- Potas- Chtor- Sul- Ftuor- Silica Mange-
NJ-t/RD Date cium, sium, Sodium slum, idew fate, ide, as Si04 Iron, Iron, nese#
welt of diss diss diss diss diss diss diss diss total diss diss
r_rnber ampte (rag/L) (mg/L) (mg/L) (mg/L) (mg/L) (mg/L) (mg/L) (mg/L) (_g/L) (_g/L) (_g/L)
Middle aauifer. Potemac-Raritan-Magoth¥ aquifer system--Continued.
23-7 07 Nay 1985 2.8 .92 5.0 1.2 11 8.3 <.1 8.5 380 350 5
23-13 06 Aug 1985 4.7 2.8 7.7 2.1 14 4.0 <.1 26 910 590 10023-14 04Aug 1969 3.8 .8 2.8 1.0 5.0 O .1 9.9 520 520 O23-17 04 Aug 1969 2.2 .9 3.2 1.2 6.0 .1 .1 9.6 -- 600 1023-17 28 Nay 1985 1.6 .75 2.8 1.0 3.6 4.1 <.1 10 30 30 3
2.]-29 04 Aug 1969 5.5 2.8 6.1 1.7 20 0 .1 8.1 -- 350 40
23-38 22 Nay 1985 2.3 2.0 3.5 .8 4.7 5.2 <.1 8.0 150 16 6
23-39 26 Aug 1985 2.0 .61 2.8 .9 5.3 11 <.1 9.3 3,600 3,100 49
23-46 30 Jut 1985 2.3 .73 3.0 .8 5.8 12 <.1 9.9 6,600 4,400 5323-58 19 Jut 1985 ........ 8.3 40 <.1 -- 4,600 ....
23-59 31 Aug 1969 2.0 .6 2.5 1.1 4.0 9.1 .1 9.5 -- 4,800 60?.3-59 19 Jut 1985 ........ 8.4 15 <.1 ........
23-63 16 Nay 1985 3.6 1.2 5.6 1.2 8.8 22 -- 13 7,000 7,100 11023-72 24 Nay 1985 12 5.4 12 2.6 29 40 <.1 18 880 720 320?.3-80 17Apr 1985 5.3 5.9 11 2.2 22 26 -- 8.9 470 380 290
23-89 10 Apt 1985 20 5.6 17 2.1 38 28 -- 14 5,600 4,800 8923-94 21 Mar 1985 1.3 .48 2.2 .6 5.0 11 -- 7.7 1,300 1,400 21
23-94 10 Jut 1986 1.3 .5 2.6 .7 5.5 12 <.1 8.3 1,400 1,700 2123-127 06 Jull 1969 5.8 1.4 1.9 .7 2.4 9.6 .I 7.1 -- 1,100 1023-132 05 Aug 1985 2.3 .66 1.4 .7 2.3 9.5 <.1 6.4 6,100 3,900 41
23-146 31 Jut 1969 2.3 .7 1.6 .6 1.3 10 0 8.9 -- 4,800 6023-146 01 May 1985 2.3 .79 1.9 .6 2.6 14 <.1 9.0 4,100 4,200 6523-147 27 Aug 1985 2.1 .71 1.7 .6 2.6 11 <.1 8.5 4,100 4,000 61
23-171 05 Aug 1985 5.0 1.2 1.4 .6 2.4 8.7 <.1 7.8 1,200 1,300 18
23-194 18 Jut 1923 2.9 .9 .... 3.0 11 -- 8.0 4,400 800 --
23-194 15 Apr 1933 3.8 .9 2.1 .4 3.0 10 -- 8.7 6,000 20 O
23-196 13 Jun 1969 3.9 1.3 2.2 .4 3.3 11 .2 7.4 -- 5,700 70
23-197 17 Oct 1984 47 15 85 -- 290 33 -- 8.4 -- 59,000 98023-206 12 Apt 1956 ........ 2.0 9.9 ..........
23-206 31 Jut 1969 3.2 .9 2.2 1.1 3.0 8.7 0 8.4 -- 6,200 100
23-206 14 8ep 1973 .... 2.5 1.1 1.9 7.7 -- 9.0 ......
23-206 24 Oct 198-4 3.3 1.1 2.5 -- 2.2 10 -- 8.5 -- 5,600 9623-226 26 Aug 1985 4.2 1.7 4.9 1.7 11 .7 <.1 8.9 -- 67 7
23-229 13 Aug 1986 8.1 2.6 12 2.7 19 4.1 <.1 9.4 -- 5,300 91
23-232 25 Apr 1985 8.5 3.5 12 2.0 20 .5 <.1 9.4 70 7 2
59

Table 4.--Water-quatity analyses of welt-water samples, 1923-86--Continued.
(Constituents not detected in a sample are reported as the vatue of the detection [imit for that analysis,
preceded by a less than symbol(<). Concentrations are in _g/L.)
NJ-_D Date Alu- Beryl- Cad- Chro- Lith- Molyb- St,on- Vans-
weLL of minum, Barium, lium, mium, mium, CobaLt, Copper, Lead, rum, denum, tim, dium, Zinc,number sample diss diss diss diss diss diss diss diss diss diss diss diss diss
Middle aquifer, Potomec-Raritan-Magothy aquifer system--Continued.
23-7 07 May 1985 400 19 <.5 <1 -- 20 <10 <10 18 <10 20 <6 7623-13 06 Aug 1985 100 15 <.5 <1 -- <3 <10 <10 7 <10 48 <6 1623-14 04 Aug 1969 ..................
23-17 04 Aug 1969 ..................
23-17 28 Nay 1985 500 15 <.5 <1 -- 9 20 <10 <6 <10 19 <6 22
23-29 04 Aug 1969 ..................
23"38 22 May 1985 700 68 <.5 <1 "" <3 450 10 <4 <10 34 <6 63
23"39 26 Aug 1985 300 41 <.5 <1 "" <3 20 13 15 <10 26 <6 1323"46 30 JUt 1985 100 34 .9 <1 "" <3 <10 <10 18 <10 30 <6 <323"58 19 Jut 1985 ..................
23-59 31 Aug 1969 ..................23-59 19 Jut 1985 ..................
23-63 16 Hay 1985 300 53 <.5 <1 -- <3 <10 <10 20 <10 69 <6 523-72 24 Hay 1985 500 170 .7 2 -- 30 20 <10 6 <10 180 <6 76023-80 17 Apr 1985 430 100 .9 <1 10 20 <10 <10 <4 <10 54 <6 69
23-89 10 Apr 1985 <10 160 2.0 <1 <10 20 <10 20 14 <10 200 <6 523-94 21 Her 1985 300 22 .6 <1 <10 3 <10 <10 <6 <10 11 <6 30
23-94 10 Jut 1986 350 18 <.5 <1 <10 <3 20 <10 11 <10 11 <6 9223-127 06 Jun 1969 ..................
23-132 05 Aug 1985 <100 37 .7 <1 -- <3 <10 <10 22 <10 13 <6 280
23-146 31 Jut 1969 ..................
23"146 01 Nay 1985 200 67 <.5 1 -- <3 60 10 15 <10 27 <6 823-147 27 Aug 1985 <100 45 <.5 <1 -- <3 <10 <5 24 <10 25 <6 3
23-171 05 Aug 1985 <100 26 1.0 <1 -- <3 <10 <10 24 <10 21 <6 <323-194 18 Jut 1923 ..................
23-196 15 Apt 1933 ..................23-196 13 Jun 1969 ..................
23-197 17 Oct 1984 400 360 <.5 5 -- <3 <10 <10 17 <10 550 <6 1023-206 12 Apt 1956 ..................23-206 31 Jut 1969 ..................
23-206 14 Sep 1973 ..................
23-206 24 Oct 1984 100 45 <.5 <1 -- <3 <10 10 8 <10 45 <6 <3
23-226 26 Aug 1985 300 60 <.5 <1 -- 4 30 10 5 <10 52 <6 2923-229 13 Aug 1986 <10 .... <1 <1 -- <1 <5 ........ 43
23-232 25 Apt 1985 <100 88 <.5 <1 -- 4 20 <10 <4 <10 100 <6 20
6O

Table 4.--Weter-quatfty analyses of welt-water samples, 1923-86--Continued.(Constituents not detected in a sample are reported as the value of
the detection limit for that analysis, preceded by a tess then symbol(<).)
MJ
Ammonia Nitrite Kjeldaht NO2 �Ortho-Organic Dis- Central Laboratory
NJ-_D Date as N, as N, N as M, NOaas p41osphate carbon, Phenols, trict Pesti-
welt of diss diss diss 4 M, diss as P, diss diss total VOC VOC cide
number sample (mg/L) (G/L) (mg/L) (mg/L) (mg/L) (mg/L) (mg/L) scans analysis s analysis s
Middle e®ifer. Potomac-Raritan-MagothY aquifer system--Continued.
23-7 07 Nay 1985 <.01 <.01 .8 <oi <.01 .9 <1 ND ....23-13 06 Aug 1985 <.01 <.01 .2 2.5 <.01 .4 <1 NO -- +23-14 04 Aug 1969 ....................23-17 04 Aug 1969 ....................
23-17 28 May 1985 .05 <.01 .7 1.1 <.01 .9 1 ......
23-29 04 Aug 1969 ....................
23-38 22 Hey 1985 <.01 <.01 1.0 1.6 <.01 .7 -- ND ....23-39 26 Aug 1985 <.01 <.01 <.2 <.1 <.01 .6 3 ......?3-46 30 Jut 1985 .01 <.01 <.2 <.1 <.01 .7 <1 ND ....
23-58 19 Jut 1985 <.01 <.01 -- <.1 <.01 1.3 <1 ND ....
2.3-59 31 Aug 1969 ....................
23-59 19 Jut 1985 .02 <.01 -- <.1 <.01 .9 1 ND ....
23-63 16 Nay 1985 .02 <.01 .9 <.1 <.01 .9 2 MD ....23-72 24 Hay 1985 .05 <.01 2.9 .22 <.01 1.0 ........
23-80 17 Apr 1985 .04 .04 .9 2.0 <.01 1.9 2 + + ND
23-89 10 Apr 1985 .31 .02 3.2 1.0 <.01 1.1 1 + +23-94 21 Mar 1985 <.01 <.01 .2 <.1 <.01 .8 2 ND ND ND
23-94 10 Jut 1986 <.01 <.01 <.2 <.1 <.01 ........ MD23-127 06 Jun 1969 ....................
23-132 05 Aug 1985 <.01 <.01 <.2 <.1 .06 2.0 2 ND ....
23-146 31 Jut 1969 ....................
23-146 01 May 1985 .01 .01 .7 1.2 .03 .7 <1 ND ....23-147 27 Aug 1985 <.01 <.01 .3 <.1 <.01 .4 1 ......23-171 05 Aug 1985 <.01 <.01 .2 <.1 <.01 .4 1 ND ....23-194 18 Jut 1923 ....................
25-194 15 Apt 1933 ....................23-196 13 Jun 1969 ....................
23-197 17 Oct 1984 .03 <.01 <.2 <,1 .03 .... ND ....
23-206 12 Apr 1956 ....................23-206 31 Jut 1969 ....................
23-206 14 Sep 1973 ....................23-206 24 Oct 1984 .04 <.01 .2 <.1 <.01 .... ND ....
23-226 26 Aug 1985 <.01 .02 .3 5.3 <.01 .4 1 ......
23-229 13 Aug 1986 .22 .01 .4 7.3 <.01 .6 4 ......23-232 25 Apr 1985 <.01 <.01 .5 .19 .01 .6 -- ND ....
61

TabLe 4.--Water-quality analyses of wetl-ueter samotes. 1923-86--Continued.(Constituents not detected in a sample ere reported as the vaLue of
the detection Limit for that analysis, preceded by a Less than symboL(<).)
Tem- Spa- Oxy- FieLd at- Lab at- FieLdNJ-WRO Date pore- ¢|f|c gen, FieLd kaLinity katinJty bicar- SoLids,
weLL Local welt of ture conduc- diss ptl (mg/L as (mg/L as bonate2 diss 3!
number identifier sa_Rple Time ('C) tance (rag/L) (units) (CSC03) (CaCOS ) (rag/L) (rag/L)
Middle sauifer, Potomac-Rar|tan-Maaothy aquifer system--Continued.
23-240 MONROETWPM'UA12 1961 25 Apt 1985 1515 12.5 59 4.3 5.3 11 4 8 4023-253 RARITANSTEELCO 16A-57 23 Jut 1969 -- 16.0 576 -- 8.6 -- 156 -- 35523-255 CARBORUNDUMCO 1-1955 24 Jut 1969 -- 14.0 286 -- 8.2 -- 98 -- 178
23-255 CARBORUNDUM00 1-1955 26 Oct 1984 0945 13.5 280 .1 6.8 "- 97 ....
23-255 CARBORUNDUMCO 1-1955 12 Apr 1985 1225 13.5 290 .2 6.9 102 97 125 172
23-26] CHEVRONOIL CO2-1950 13 Mar 1951 -- 11.5 291 -- 7.3 -- 123 -- 16523-263 CHEVRONOIL CO2-1950 22 Jut 1969 -- 14.0 279 -- 8.2 -- 80 -- 172
23-264 CHEVRON01L COOBS2 02 Nov 1984 1045 13.0 293 .3 6.5 -- 116 ....
23-266 CHEVRONOIL CO3-1951 16 Apr 1985 1125 13.5 289 -- 6.3 82 65 100 17323-266 CHEVRONOIL CO3-1951 17 Mar 1986 1300 13.0 318 -- 6.4 ........
23-270 AMERCYANAMIDCOTEST2 29 May 1986 1345 15.0 -- .4 6.3 10 2 13 6,45023-283 SIMONSONDROS2 IRR 1967 09 Aug 1985 1030 12.5 215 11.3 4.9 3 3 -- 16823-283 SIMORSON8ROS2 IRR 1967 03 Jun 1986 1030 12.0 227 10.2 5.1 -- 3 -- 15423-289 MONROETWPMUA15 1956 11 Jun 1985 1530 12.0 110 -- 5.8 10 11 12 6923-291 MONROEMUA-FORSGATE1 CO 04 Dec 1984 1515 12.0 41 5.2 6.2 8 9 7 32
23-295 1XTERRPERRALLTEL C 1 23 Ray 1985 1140 12.5 102 7.3 5.2 5 4 5 7623-300 BASF-WYANDOTTE2 1966 05 Jun 1969 -- 16.0 80 -- 4.6 -- 1 -- 6523-300 BASF-WYANDOTTE2 1966 18 Jut 1985 1530 12.0 121 2.9 4.4 <1 <1 <1 63
23-304 PHELPSO00GECO 1R-1962 13 Jun 1969 -- 14.0 83 -- 5.2 -- 2 -- 59
23-305 PHELPSDOOGECO 1-1957 15 May 1985 1215 13.0 142 8.6 4.9 4 3 ....
23-311 SOUTHARD1-WICI(MAN,W-5708Apr 1985 1355 11.5 65 3.1 5.4 7 7 8 4423-311 SOUTHARD1-WICIQ4AN,W-57 10 Jut 1986 1200 13.0 73 3.2 5.5 -- 7 -- 47
23-319 S BRUNSWICKMUA12-1963 02 Aug 1985 1320 12.5 145 8.2 5.1 4 3 5 8523-322 S BRUNSWICKNUA11-1963 19 Mar 1985 1430 12.0 114 7.2 4.8 2 5 2 7923-322 S BRUNSWICKMUA11-1963 02 Jut 1986 1030 12.5 110 0.2 4.9 2 3 1 73
23-323 SMITH 1966 (DO_ESTIC) 08 Aug 1985 1230 12.5 42 3.5 5.1 3 2 3 3223-325 RID EASTALUM1ANCOLZRG24 Apr 1985 1245 14.0 101 5.8 4.9 4 3 5 6923-332 AHMED,MUSTAPHA2-1958 24 Jun 1985 1225 13.5 360 4.5 5.1 20 2 23 202
23-352 SAYREVILLEBOROWOM-67 22 Apr 1985 1400 13.5 240 .4 5.6 12 2 4 135
23-365 DUHERNALSAYER4 065-31 02 Nov 1984 1335 12.5 5,500 .Z 5.3 -- <1 ....
23-365 DUHERNALSAYER4 08S-31 10 Mar 1986 1410 13.5 6wOO0 -- 5.6 ........
23-371 HERCULESINC. 5-1929 25 Oct 1984 1250 14.0 8_000 -- 5.3 -- <1 ....23-371 HERCULESINC. 5-1929 04 Mar 1986 140S 12.5 8,200 -- 5.4 ........
25-376 HERCULESINC. 3-1928 25 Oct 1984 1125 12.5 6,750 .6 5.3 -- <1 ....23-380 HERCULESINC. 2-1927 25 Oct 1984 1045 14.0 975 .7 5.6 -- <1 ....
62

Tabte 4.--Water-auatitv anatyses of wett-water samptes, 1923-86--Continued.
(Constituents not detected in a sampte ere reported as the vstue ofthe detection Limit for that analysis, preceded by a tess than symboL(<).)
Cat- Hagne- Potes- Chtor- $ut- Ftuor- Sitica Hangs-NJ-WRD Date cium, sium, Sodium sium, ide, fate, ide, as Si04 Iron, Iron, nese,well of diss diss diss diss diss diss diss diss total diss diss
number sample (mg/L) (mg/L) (mg/L) (mg/L) (mg/L) (mg/L) (mg/L) (mg/L) (_g/L) (_g/L) (_D/L)
Hidd(e aauifer. Potomac-Raritan-Hanothy aquifer system--Continued.
23-240 25 Apt 1985 2.9 .99 4.3 1.1 7.4 .8 -- 7.9 110 8 2
23-253 23 Jut 1969 80 14 25 .3 28 87 .5 21 -- 1,100 50
23-255 24 Jut 1969 39 6.2 9.3 .2 18 30 .3 13 -- 4,300 7023-255 26 Oct 1984 39 6.0 7.4 -- 7.7 36 -- 15 -- 2,500 5723-255 12 Apr 1985 39 6.1 7.3 1.0 8.2 39 -- 15 2,700 2,500 56
?3-263 13 Mar 1951 39 6.9 10 1.7 6.6 17 0 9.6 4,600 40 110
?.3-263 22 Jut 1969 34 7.8 1.9 .4 8.6 53 .4 11 18,000 -- 11023-264 02 _ov 1984 35 8.7 10 -- 7.4 18 -- 9.1 -- 9,400 20023-266 16 Apt 1985 32 6.8 8.5 1.0 8.9 55 -- 13 6,600 6,600 120
23-266 17 Mar 1986 29 6.2 9.0 -- 58 .... 14 -- 6,400 120
23-270 29 Hay 1986 330 180 1600 18 3,200 590 ,.1 1.4 -- 51,000 2,20023-283 09 Aug 1985 14 9.2 5.3 6.2 27 .5 <.I 8,8 100 9 220
23-283 03 Ju_ 1986 14 10 4.0 5.9 31 1.3 <.1 9.2 <10 9 240
23-289 11 Jun 1985 5.2 2.7 5.5 1.6 16 4.2 ,.1 12 3,500 3,300 6023-291 04 Dec 1984 1.2 .92 3.3 1.4 3.0 .8 ,.1 14 -- 450 15
23-295 23 Hay 1985 4.9 3.2 6.2 1.5 7.0 20 <.1 7.6 140 71 1023-300 05 Jun 1969 3.4 1.4 4.7 1.4 12 3.1 0 7.0 -- 90 10
23-300 18 Jut 1985 3.1 1.4 10 1.2 18 11 <.1 7.4 80 62 10
2.3-304 13 Jun 1969 3.7 2.1 5.0 1.0 13 2.0 .1 6.4 -- 50 2023-305 15 Hay 1985 6.9 4.7 6.4 2.1 18 .... 7.8 60 13 18
23-311 08 Apr 1985 2.1 3.1 3.8 2.4 6.1 7.8 -- 9.8 430 75 1223-311 10 Jut 1986 2.0 4.2 3.4 1.4 5.9 12 <.1 11 130 50 923-319 02 Aug 1985 3.7 2.9 16 1.9 16 17 ,.1 7.3 30 18 2323-322 19 Mar 1985 6.2 3.7 6.2 3.5 16 ,.2 -- 6.3 110 9 37
23-322 02 Jut 1986 6.5 3.9 5.7 3.4 13 .6 ,.1 6.6 ,10 10 41
23-3?3 08 Aug 1985 1.7 .97 2.7 1.1 6.9 .8 ,.1 6.9 140 130 823-325 26 Apr 1985 5,9 2.1 5.8 1.6 15 1.6 -- 7.9 40 22 10
23-332 24 Jun 1985 8.3 2.1 53 2.1 89 17 ,.1 3.7 650 350 54
23-352 22 Apt 1985 5.6 2.6 19 1.1 32 42 .2 3.9 12,000 12,000 41023"365 02 NOV1984 140 71 770 "" 1,900 170 "" 7.0 "" 87,000 1,700
23-365 10 Nat 1986 150 69 780 -- 1,800 .... 8.9 -- 98,000 1,60023-371 25 Oct 1984 210 110 1000 -- 2,500 350 -- 8.5 -- 240,000 4,20023-371 04 Mar 1986 210 120 1300 -- 2,700 .... 9.0 -- 190,000 3,700
23-376 25 Oct 1984 170 94 960 -- 2,100 310 -- 8.3 -- 190,000 3,50023-380 25 Oct 1984 41 15 110 -- 260 86 -- 8.6 -- 43,000 970
63

Table 6.--Wster-auatitv analyses of wett-water samples, 1923-86--Continuad.(Constituents not detected in a sample are reported as the value of the detection lim|t for that analysis,
preceded by a less than symbol(<). Coccentrations ere in pg/L.)
NJ-WRD Date Alu- Beryl- Cad- Chro- Lith- Motyb- Stron- Vane-well of minum, Barium, Lium, mium, mium, Cobalt, Copper, Lead, ium, denum, tium, dium, zinc,
number sample diss diss diss diss diss diss diss diss diss diss diss diss diss
Middle aquifer. Potomac-Raritan-Magothy aquifer system--Continued.
23-240 25 Apr 1985 <100 27 <.5 <1 -- 4 20 <10 <4 <10 22 <6 2723-253 23 Jut 1969 ......................
23-255 24 Jut 1969 ......................
23-255 26 Oct 198/, <100 92 <.5 <1 -- <3 <10 20 <4 <10 140 <6 10
23-255 12 Apr 1985 <10 90 <.5 <1 10 <3 <10 <10 <6 <10 140 <6 <3
23-263 13 Mar 1951 ......................23-263 22 Jut 1969 ......................
23-264 02 Nov 1984 <100 41 <.5 <1 -- <3 <10 30 6 <10 200 <6 2023-266 16 Apr 1985 <10 64 <.5 <I 10 20 <10 <10 9 <10 140 <6 423-266 17 Mar 1986 -- 70 <.5 <1 -- <3 <10 <10 <4 <10 140 <6 24
23-270 29 May 1986 <10 .... <1 <1 -- 1 ...... 10023-283 09 Aug 1985 <100 470 2.0 <1 -- <3 <10 <10 <4 <10 220 <6 12023-283 03 Jun 1986 90 690 .8 <1 <10 <3 <10 <10 <4 <10 230 <6 41
23-289 11Jun 1985 600 81 .5 2 -- <3 40 <10 20 <10 (>8 <6 16
23-291 04 Dec 1984 10 .... <1 1 -- 5 9 ........ 24
23-295 23 Nay 1985 500 53 <.5 <1 -- <3 20 10 <4 <10 43 <6 1623-300 05 Jun 1969 200 ....................
23-300 18 Jut 1985 800 35 .8 <1 -- <10 <40 10 <8 <10 23 <6 3/*23-304 13 Jun 1969 200 ....................
23-305 15 Nay 1985 <100 80 <.5 <1 -- 8 320 60 <4 <10 58 <6 29
23-311 08 Apt 1985 <10 34 <.5 <1 <10 <3 130 <10 <4 <10 30 <6 8323-311 10 Jul 1986 10 39 <.5 <1 <10 <3 120 <10 <4 <10 41 <6 18
23-319 02 Aug 1985 100 76 <.5 <1 -- 3 10 20 <4 <10 43 <6 923-322 19 Mar 1985 30 120 <.5 <1 <10 <3 <10 <10 13 <10 48 <6 823-322 02 Jut 1986 30 120 <.5 <1 <10 3 10 <10 <4 <10 55 <6 20
23-323 08 Aug 1985 <100 23 <.5 <1 -- 4 <10 <10 <4 <10 19 <6 130
23-325 24 Apr 1985 30 41 <.5 <1 <10 4 10 <10 5 <10 36 <6 4723-332 24 Jun 1985 100 86 <.5 1 -- <3 20 <10 12 <10 53 <6 7
23-352 22 Apr 1985 700 80 2.0 <1 -- 50 10 <10 <4 <10 43 <6 3923-365 02 Nov 198/, 100 110 <2.0 8 -- <9 <30 60 24 <30 1400 <20 820
23-365 10 Mar 1986 -- 120 <.5 15 -- <3 <10 50 40 <10 1300 18 660
23-371 25 OCt 198/, 100 78 <2.0 15 -- <9 <30 130 49 <30 2100 <20 /,623-371 04 Mar 1986 -- 66 <3.0 20 -- <20 <50 80 76 <50 2000 32 9823-376 25 Oct 1984 <100 72 <2.0 12 -- <9 <30 70 40 <30 1800 <20 38
23-380 25 Oct 1984 100 95 <.5 3 -- <3 <10 <10 13 <10 490 <6 10
64

Table 4.--Water-quality analyses of welt-water samples, 1923-86--Continuecl.(Constituents not detected in a sen_oleere reportecl as the value of
the detection limit for that analysis, preceded by a tess than symbol(<).)
MJ
Anlmonia Nitrite Kjeldahl NO2+ Ortho- Organic Dis- Central Laboratory
NJ-WRD Date as N, as M, N as N, NO3as phosphate carbon, Phenols, trict Pesti-
welt of diss diss diss 4 M, diss as P, diss diss total VOC VOC cide
P4Jni:_r sa_ole (rig/L) (mg/L) (rig/L) (q/L) (nlg/L) (q/L) (rig/L) scans analysis s analysis s
Middle aquifer, Potomac-Raritan-MaRothY aquifer system--Continued.
23-240 25 Apt 1985 <.01 <.01 .6 2.4 <.01 1.2 -- XD ....23-253 23 Jut 1969 ....................
23-255 24 Jul 1969 ....................
23-255 26 Oct 1984 .04 <.01 <.2 <.1 <.01 ....�....
23-255 12 Apr 1985 .12 <.01 1.9 <.1 <.01 1.1 <1 + + ND
23"263 13 Mar 1951 ....................23-263 22 JuL 1969 ....................
23-264 02 Nov 1984 <.01 <.01 <.2 <.1 <.01 .... ND ....
23-266 16 Apr 1985 .13 <.01 .4 <.1 <.01 1.1 <1 .... NO23-266 17 Mar 1986 ....................
23-270 29 Nay 1986 .42 .01 .5 <.1 -- 2.2 <1 ......23-283 09 Aug 1985 <.01 <.01 <.2 .31 <.01 3.1 3 NO ....23-283 03 Jun 1986 .03 <.01 .3 14 <.01 .8 5 NO -- +
23-289 11 Jun 1985 .15 <.01 -- 2.1 <.01 1.0 <1 ND ....?_3-291 04 Dec 1984 <.01 <.01 1.2 1.2 -- .5 3 ......
23-295 23 Nay 1985 <.01 <.01 2.0 2.2 <.01 .8 4 + ....23-300 05 Jun 1969 ....................
23-300 18 Jul 1985 .03 <.01 <.2 -- <.01 1.4 <11 ......23-304 13 dun 1969 ....................
23-305 15 May 1985 .08 <.01 .8 5.3 <.01 .... ND ....
23-311 08 Apr 1985 .02 <.01 .2 1.6 <.01 .9 <1 ND -- NO23-311 10 Jut 1986 .01 <.01 .2 1.6 <.01 .4 4 .... ND23-319 02 Aug 1985 .04 <.01 .2 4.3 <.01 1.2 <1 + + NO23°322 19 Mar 1985 .01 .02 .6 4.8 <.01 1.1 <1 + + ND
23-322 02 Jul 1986 .1 <.01 .4 6.4 <.01 .6 3 + * ND
23-323 08 Aug 1985 <.01 <.01 <.2 .16 <.01 3.0 -- ND ....
23-325 24 Apt 1985 .07 <.01 .6 3.7 .03 .9 <1 + ND NO23-332 24 Jun 1985 .14 .11 .3 2.6 .04 1.2 <1 ND ....
23-352 22 Apr 1985 .......... 2.4 ........23-365 02 Nov 1984 2.1 <.01 2.2 <.1 <.01 .... ND ....
23-365 10 Mar 1986 ....................23-371 25 Oct 1984 .34 <.01 .3 <.1 <.01 ..........
23-371 04 Mar 1986 ....................
23-376 25 Oct 1984 .25 <.01 .3 <.1 <.01 .... ND ....23-380 25 Oct 1984 .12 <.01 <.2 <.1 <.01 .... + ....
65

TabLe 4.--Water-quality analyses of well-Hater aan_lea, 1923-86--Continued.(Constituents not detected in a sample ere reported as the value of
the detection Limit for that analysis, preceded by a Less than symbol(<).)
T_- Spa- Oxy- Field el- Lab at- FieldNJ-WRD Date papa- cLfic gen, Field kaifnity kaLinity bLcar- Solids,
welt Local well of ture conduc- diss pH (mg/L as (m/L as bonate 2 d|ss 3
number identifier sample Time ('C) tanoe I (mg/L) (units) (CeC03) (CeC03) (mg/L) (mg/L)
Middle aquifer, Pqtemac-Raritan-Manothy aquifer system--Continued.
23-384 RERCULESINC. 1R-1939 25 Oct 1984 1000 14.5 845 .3 5.6 -- <1 ....23-386 E! DUPONT-PARLIN6-1930 15 Oct 1984 1215 13.0 130 .9 5.7 -- <1 ....23.389 El DUPONT-PARLIH5-1928 15 Oct 1984 1330 13.0 170 .9 5.6 -- <1 ....
23-392 El DUPONT-PARLIR1-1924 15 Oct 1984 1100 13.0 345 -- 5.5 -- <1 ....23-393 El DUPONT-PARL|N3-1925 15 Oct 1984 1500 13.5 1,070 .6 5.5 -- <1 ....
23-401 SAYREVILLEBOROWDP-67 16 Oct 1984 1245 13.0 62 .3 5.9 -- 3 ....
23-411 SOUTHANBOYCITY t_O8-47 14 Apr 1950 .... 45 -- 5.5 -- 5 ....23-411 SOUTHANBOYCITY WO8-47 13 Jun 1969 -- 13.0 43 -- 6.8 -- 6 -- 3623-411 SOUTHAMBOYCITY WO8-47 12 Oct 1984 1040 13.0 70 .3 5.9 -- 2 ....23-415 NL INDUSTRIES4-1952 17 Jut 1969 -- 14.0 54 -- 7.3 -- 4 -- 36
23-418 NL INDUSTRIES3-1934 17 Jut 1969 -- 15.0 46 -- 7.3 -- 8 -- 37
23-419 NL INDUSTRIES2-1934 17 JuL 1969 -- 15.0 1,000 -- 2.8 -- <1 -- 283
23-425 El DUPONT-PARLIN60F-66 17 Oct 1984 1420 16.5 3,780 .1 5.6 "- <1 ....23-429 JERSEYCENTP&L-WERNER6 15 Mar 1972 -- 13.5 68 -- 6.9 -- 7 -- 51
23-430 JERSEYCENTP&L-WERNER7 30 Oct 1984 1410 14.0 3,200 .2 5.6 -- <1 ....
23-436 SOUTHRIVER BOROgO 2-52 04 Jun 1969 -- 14.0 43 -- 7.0 -- 9 -- 4123-434 SOUTHRIVER BOROWD2-52 11 Oct 1984 1225 13.0 115 .5 4.6 -- <1 ....23-436 SOUTHRIVER BOROgO 1-22 04 Jun 1969 -- 15.0 44 -- 6.8 -- 7 -- 3523-437 SOUTHRIVER BOROgO 3-67 04 Jun 1969 -- 13.0 46 -- 6.8 -- 7 -- 35
2]-4_ SOUTH RIVER 80ROgO 5-77 11 Oct 1984 1115 12.0 84 .I 5.4 -- 2 ....
23-439 SOUTHRIVER BOROgO 20B 11Apr 1983 1200 13.5 318 .4 5.0 6 .... 18923-439 SOUTHRIVER BOROgO 20B 01 NOV1984 1650 13.0 750 .3 5.0 -- <1 ....23-439 SOUTHRIVER BOROgO 20B 06 Mar 1986 1250 13.5 775 -- 5.1 ........
23-440 ROOGESBUSCO 1-1922 30 JuL 1969 -- 18.0 40 -- 5.6 -- 1 -- 35
23-440 HOOGESBUSCO 1-1922 12 Oct 1984 1445 14.5 309 -- 5.5 -- <1 ....
23-441 HERBERTSANDHSC3-1964 17 Apt 1985 1400 14.0 362 .5 4.3 <1 <1 <1 18623-456 SCHWEITZER,P J 1R-1956 11 Jut 1969 -- 15.0 53 -- 7.2 -- 10 -- 31
23-462 UNION CARBIDECORP1-65 23 Aug 1985 1455 16.0 392 .3 7.1 123 102 150 26023-473 HAAGERDAZS INC. 1955 28 JuL 1960 1200 12.0 525 -- 3.8 -- <1 -- 384
23.473 HAAGENDAZS INC. 1955 18 Mar 1969 -- 12.0 600 -- 3.7 -- <1 -- 360
23-473 HAAGBNDAIS 1NC. 1955 26 Oct 1984 1300 14.0 1,100 .2 4.8 -- <1 ....23-473 RAAGENDAZS iNC. 1955 12 Apr 1985 1350 13.5 860 .2 5.0 11 5 13 67123-473 HAAGENDAZS INC. 1955 17 Mar 1986 1040 13.5 1,160 -- 5.1 ........23-478 AMERCYANAMIDCO2A-58 26 Oct 1984 1110 15.0 970 .3 5.3 -- 12 ....
23-478 ARERCYANAMLDCO2A-58 12 Apr 1985 1025 14.0 930 .4 5.7 49 31 60 692
66

TabLe 4.--Water-aualitY analyses of welt-water san_otes, 1923-86--continued.(Constituents not detected in a seff_oleare reported as the value of
the detection limit for that analysis, preceded by a less than Sylllbo[(<).)
Cat* Magne- Potas- Chtor- SuL- Ftumr- Silica Manga-NJ-WRD Date cium, s|um, Sodium sium, ida, fate, ide, as Si04 iron, iron, nasa,
Mell of diss diss diss diss diss diss diss diss total diss diss
nur_ber sample (mg/L) (ff_W/L) (mg/L) (mg/L) (mg/L) (mg/L) (mg/L) (G/L) (_g/L) (_g/L) (_g/L)
Riddle aauifer. Potomac-Raritan-Ma�oth Y aquifer system--Continued.
23-384 25 Oct 1984 33 13 83 -- 210 75 -- 8.3 -- 38,000 84023-386 15 Oct 1984 6.2 2.3 2.8 -- 10 26 -- 8.2 -- 9,800 190
23-389 15 Oct 1984 8.8 3.1 4.3 -- 25 26 -- 8.6 -- 14,000 27023-392 15 Oct 1984 18 6.3 13 -- 76 37 -- 8.9 -- 27,000 55023-393 15 Oct 1984 51 18 71 "" 270 100 "" 8.8 -- 66,000 1,400
23"401 16 Oct 1984 2.9 1.1 2.1 "" 2.9 11 "" 8.9 "" 5,900 10023-411 14 Apt 1950 ........ 2.5 12 ...... 9,400 --
23-411 13 Jun 1969 3.1 1.1 2.1 .6 1.9 11 .2 7.7 -- 9,600 110
23-411 12 Oct 1984 3.1 1.3 2.6 -- 4.8 12 -- 8.6 -- 7,100 12023-415 17 Jul 1969 4.8 1.6 1.2 .2 3.3 12 .1 7.3 -- 20,000 250
23-418 17 Jul 1969 2.2 1.0 1.9 .2 2.6 9.0 .1 7.7 -- 21,000 16023-419 17 Jut 1969 37 14 13 .2 35 210 .3 8.7 -- 12,000 1,70023-425 17 Oct 1984 120 49 390 -- 1,300 240 -- 9.1 -- 200,000 3,600
23-429 15 Nar 1972 3.5 1.3 5.3 1.4 9.6 10 0 7.4 15,000 ....23-430 30 Oct 1984 70 36 370 -- 1,100 97 -- 9.3 -- 190,000 3,100
23-434 04 Jun 1969 3.0 .9 2.5 .8 4.2 5.9 0 8.9 -- 1,600 3023-434 11 Oct 1984 5.7 2.1 6.3 -- 14 18 -- 9.8 -- 800 53
23-436 04 Jun 1969 3.2 .9 2.6 .7 4.9 6.1 0 9.5 -- 1,700 3023-437 04 Jun 1969 3.1 .8 2.6 1.8 6.1 6.4 0 8.7 -- 2,000 40
23-438 11 Oct 1984 5.1 1.4 4.7 -- 12 14 "" 9.9 -- 3,100 55
23-439 11 Apt 1983 13 4.5 27 1.9 71 38 <.1 9.6 -- 18,000 33023-439 01 Nov 1984 26 9.3 77 -- 200 65 -- 10 -- 37,000 69023-439 06 Mar 1986 27 9.6 78 -- 200 .... 12 -- 43,000 770
23-440 30 Jut 1969 1.5 .5 2.5 1.4 5.0 7.9 .1 9.2 -- 4,600 6023-440 12 Oct 1984 9.8 3.9 21 -- 54 49 -- 10 -- 29,000 400
23-441 17 Apt 1985 8.4 7.7 30 3.5 55 65 -- 11 3,500 2,800 530
23-456 11 Jut 1969 4.2 1.2 2.1 .4 3.3 12 .1 7.4 -- 2,800 4023-462 23 Aug 1985 58 7.3 9.3 1.0 9.6 84 .1 17 3,900 3,400 10023-473 28 Jut 1960 55 15 12 2.4 8.5 210 .1 24 11,000 30 1,100
23-473 18 Mar 1969 50 15 24 3.8 38 200 .1 21 9,000 70 1,700
23-473 26 Oct 1984 64 22 110 -- 220 210 -- 19 -- 8,800 3,90023-473 12 Apt 1985 63 20 100 2.9 210 210 -- 19 8,600 8,600 3,500
23-473 17 Mar 1986 78 24 130 -- 290 .... 20 -- 9,200 3,90023-478 26 Oct 1984 70 22 76 -- 170 200 -- 20 -- 10,000 1,100
23-478 12 Apt 1985 84 25 96 3.0 210 220 -- 20 9,500 9,400 920
67

Table 4.--Water-auatity analyses of well-water samples, 1923-86--Continued.(Constituents not detected in a sample are reported as the value of the detection Limit for that analysis,
preceded by a leas than symbol(<). Concentrations are in _g/L.)
BJ-WRD Date Alu- Beryl- Cad- Chro- Lith- Nolyb- Stron- Vona-
well of minum, Bariuma [ium, miUma mium, Cobalt, Copper, Lead, ium, denum, tium, dium, Zinc_number sample diss dtss diss diss diss diss diss diss diss diss diss diss diss
Ni(_q:fleaquifer, Potomac-Raritan-Ma_othv aquifer System--Continued.
23-384 25 Oct 1984 100 150 <.5 3 -- <3 <10 <10 9 <10 400 <6 2223-386 15 Oct 1984 <100 70 <.5 1 -- <3 <10 60 24 <10 82 <6 1623-389 15 Oct 1984 <100 97 <.5 1 -- <3 <10 <10 13 <10 120 <6 10
23-392 15 Oct 1984 100 190 <.5 2 -- <3 <10 <10 22 <10 230 <6 2023-393 15 Oct 1984 <100 200 <.5 5 -- <3 <10 10 33 <10 610 <6 10
23-401 16 Oct 1984 <100 44 <.5 <1 -- <3 <10 <10 9 <10 37 <6 <323-411 14 Apt 1950 ......................23-411 13 Jun 1969 ......................
23-411 12 Oct 1984 900 47 <.5 <1 -- 10 <10 30 15 <10 40 <6 823-415 17 Jul 1969 ......................
23-418 17 Jut 1969 ......................23-419 17 Jut 1969 ......................
23-425 17 Oct 1984 200 59 <2.0 11 -- <9 <30 50 63 <30 1200 <20 2,20023-629 15 Mar 1972 ......................
23-430 30 Oct 1984 <100 220 <2.0 17 -- <9 <30 80 32 <30 780 <20 31
_-434 04 Jt,_q1969 ......................
23-434 11 Oct 1984 1,600 110 <.5 <1 "" 4 10 <10 <4 <10 62 <6 4023-436 04 Ju_ 1969 ......................23-437 04 Jon 1969 ......................
23"438 11 Oct 1984 <100 25 <.5 <1 "" <3 <10 <10 <4 <10 43 <6 21
23"439 11Apr 1983 -- 74 <1.0 <1 -- 20 <10 <10 11 <10 170 <6 25
23-439 01 NOV1984 <100 120 <.5 3 -- <3 <10 40 16 <10 360 <6 2223-439 06 Mar 1986 -- 120 2.0 6 -- <9 110 60 21 <30 360 <18 7923-440 30 Jut 1969 ......................
23-440 12 Oct 1984 800 37 <.5 2 -- 40 <10 <10 6 <10 130 <6 620
23-441 17 Apt 1985 1,700 75 1.0 <1 <10 70 <10 <10 20 <10 100 <6 15023-456 11 Ju[ 1969 ......................
23-462 23 Aug 1985 100 180 <.5 <1 -- <3 <10 <5 <4 10 170 <6 823-473 28 Jut 1960 ......................
23-473 18 Mar 1969 200 ....................
23-473 26 OCt 1984 1,400 36 1.0 <1 -- 120 <10 <10 34 <10 370 <6 34023-473 12 Apr 1985 700 29 2.0 <1 10 130 <10 <10 29 <10 350 <6 25023-473 17 Mar 1986 -- 31 <.5 <1 -- 110 <10 10 37 <10 430 <6 290
23-478 26 Oct 1984 100 51 <.5 <1 -- 20 <10 10 20 <10 320 <6 6623-478 12 Apr 1985 <10 60 <.5 <1 10 20 <10 <10 5 <10 330 <6 36
68

Table 4.--Water-quality analyses of well-water samples, 1923-86--Continued.(Constituents not detected in a SelTMOteare reported as the value of
the detection limit for that analysis, preceded by a less than symbol(<).)
MJ
A_ia Nitrite Kjeldeht NO2 �Ortho-Organic Dis- CentralLaboratory
NJ-WRD Date as N, as N, N as N, NOaas phosphate carbon, Phonots, trict Pesti-
welt of d+ss diss diss 4 N, diss as P, diss diss total VOC VOC cide
number sample (mg/L) (mg/L) (mg/L) (mg/L) (mg/L) (mg/L) (mg/L) scans analysis s analysis s
Hiddle aouifer, Potomac-Rar|tan-Na_othv aauifer system--continued.
23-386 25 Oct 1984 .15 .01 <.2 <.1 <.01 .... ND ....23-386 15 Oct 1984 .04 <.01 <.2 <.1 <.01 .... NO ....
23-389 15 Oct 1984 .1 <.01 <.2 <.1 <.01 .... ND ....23-392 15 Oct 1984 .04 <.01 <.2 <.1 <.01 .... ND ....23"393 15 OCt 1984 .07 <.01 <.2 <.1 <.01 .... NO ....
23-401 16 Oct 1984 .03 <.01 <.2 <.1 <.01 .... ND ....23-411 14 Apr 1950 ....................23-411 13 Jun 1969 ....................
23-411 12 Oct 1984 .06 <.01 <.2 <.1 <.01 .... ND ....23-415 17 Jut 1969 ....................
23-418 17 Jul 1969 ....................
23-419 17 Jut 1969 ....................
23-G25 17 OCt 1984 .1 <.01 <.2 <.1 .03 .... ND ....23-429 15 Nar 1972 ........ .003 ..........
23-430 30 Oct 1984 .43 <.01 .4 <.1 <.01 .... NO ....
23-434 04 Jun 1969 ....................
23-434 11 OCt 1984 .03 .03 .2 1.5 .02 .... ND ....23-436 04 Jun 1969 ....................23-437 04 Jun 1969 ....................
23-438 11 Oct 1984 .03 <.01 .2 <.1 <.01 .... ND ....
23-439 11Apr 1983 ...... <.1 .02 ..........23-439 01 Nov 1984 .23 <.01 .3 <.1 <.01 ..........23-439 06 Nar 1986 ....................23-440 30 Jut 1969 ....................
23-440 12 Oct 1984 .12 <.01 <.2 <.1 <.01 .... ND ....
23-441 17 Apr 1985 .27 <.01 .7 <.1 <.01 1.5 <1 + + ND23-456 11 Jut 1969 ....................
23-462 23 Aug 1985 <.01 <.01 .3 <.1 <.01 .7 2 ......23-473 28 Jut 1960 ....................
25-473 18 Nat 1969 ....................
23-473 26 Oct 1984 .19 <.01 .6 <.1 <.01 ..........
23-473 12 Apt 1985 .16 <.01 1.6 <.1 <.01 2.0 <1 + NO ND23-473 17 Nan 1986 ....................
23-478 26 OCt 1984 .11 .01 .2 <.1 <.01 ..........
23-478 12 Apt 1985 .06 <.01 1.1 <.I <,01 1.9 <1 + NO 4D
69

Table 4.--Wster-auelity anatyses of welt-water samotes. 1923-86--Continued.
(Constituents not detected in a sample are reported as the value ofthe detection Limit fop that analysis, preceded by a Less than syKibol(<).)
Tern- Spe- Oxy- Fietd at- Lab at- Fietd
NJ-WRD Date pora- cific gen, Fietd katinity katinity bicar- Sotids,weLL Local weir of ture conduc- diss pH (mg/L as (rag/L as bonate2 diss 3
number identifier sampte Time ('C) tance 1 (mg/L) (units) (CaC03) (CsCOs) (mg/L) (mg/L)
Middle aauifer. Potomac-Raritan-Maqothy aauifer system--Continued.
23-491 ELIZABETHTNWCPLNSBRO-127 Aug 1985 1200 13.0 162 6.1 6.2 31 20 -- 10523-491 ELIZABETNTNWCPLNSBRO-I08 Jut 1986 1230 14.0 126 6.9 5.7 12 12 11 9223-499 SPOTSWO00kl) SWD 4F-77 22 Hay 1985 1500 12.5 45 .3 5.3 5 1 5 31
23-502 ANHEUSERBUSCH7-1978 30 May 1985 1130 13.5 68 .2 5.8 20 13 23 4623-503 EONAITIS, PETER1-64 15 Hay 1985 1500 14.0 34 .3 5.3 5 3 6 22
23-504 FORB6ATEINC. i-IRR 1972 29 Ju[ 1985 1245 15.0 110 11.1 5.1 3 3 3 91
23-506 SNITH 3-1958 IRR 08 Aug 1985 1115 12.5 80 .3 5.3 6 <1 7 53
23-517 KAISERAG CHEN1-63 29 Apr 1985 1105 14.0 156 -- 5.3 13 4 12 10723-523 STANLEYCORP2-1977 12 Apr 1985 1515 13.5 538 .1 5.6 36 15 44 400
23-543 SHELLOIL 5(22) 16 Apr 1985 1705 14.5 760 .4 8.0 288 304 351 461
23-548 SHELLOIL 8(R7) 16 Apr 1985 1445 15.0 495 3.0 6.5 116 112 142 26723-551 SOUTHRIVER BOROWO6-80 11 Oct 1984 1000 11.5 60 .1 5.5 -- 4 ....23-552 S BRUNSWICKRUA15-1979 19 Mar 1985 1000 12.0 38 5.5 5.9 13 11 16 38
23-552 S BRUNSWICKMUA15-1979 02 Jut 1986 1230 12.0 39 6.3 5.9 11 11 12 36
23-554 SAYERVILLEBOROttD S-80 08 Aug 1985 1500 12.5 58 .2 5.8 10 3 12 40
23-583 AIR PROOUCTS1-1978 10 Jun 1985 1150 12.0 123 11.5 4.2 <1 <1 <1 6023-585 CHIRLIAN, PAUL1980 12 Jun 1985 1430 12.5 56 .1 5.5 6 5 10 4123-704 IBM CORPGW8-1978 18 Apt 1985 1220 13.0 122 10.7 4.9 5 3 6 55
23-715 IBM CORPGW17-1978 18 Apr 1985 1040 14.5 121 6.3 4.8 1 2 2 54
23-732 KULESA,RICH DOMESTIC 18 Apr 1985 1450 14.0 150 6.9 5.1 4 4 4 73
23-733 EDGEBORODSP LNDFLOBS5 17 Apr 1985 1200 12.0 255 9.8 4.1 <1 <1 <1 12123-734 MIRANOLCHEMICAL1-1981 16 Apr 1985 1500 14.0 73 6.6 5.1 5 3 6 45
23-736 SIMONSONBROBDON1965 15 Mar 1985 1430 14.0 221 9.2 4.7 3 -- 3 15023-736 SIMONSONBROSDON 1965 03 Jun 1986 1200 13.0 233 10.0 4.8 -- 3 -- 167
23-738 ROSENSTOCK,WALTERDOM-5615 Apr 1985 1100 12.5 72 9.8 5.5 5 4 6 61
23-738 ROSENSTOCK,WALTERDOM-5615 Jul 1986 1000 13.0 57 10.8 5.2 -- 4 -- 5023-739 SYZI4ANSKI,MIKEDON-1983 09 Apt 1985 0920 11.5 41 .5 5.7 8 8 10 33
23-760 OLMA, FRANK1983 17 Jun 1985 1530 13.5 31 .1 5.2 4 1 5 2323-776 SIMONSONHOME1-1985 09 Aug 1985 1215 12.5 52 8.6 6.1 13 15 15 3823-776 SINONSONHOME1-1985 02 Jun 1986 1300 12.5 44 8.6 6.2 -- 15 -- 43
23-778 FINN, WILLIAN 1983 09 Jut 1985 1445 14.5 197 4.1 5.7 11 11 13 174
23-780 ZAITZ, MAX 1969 12 Jut 1985 1040 12.5 207 7.9 5.8 16 12 12 17223-782 OLDBRIDGEMUA12-1984 24 May 1985 1240 13.5 72 .2 5.2 19 17 -- 4123-786 HOSTETLER,HENRY1-1979 30 Jut 1985 1700 13.0 166 9.2 5.8 3 4 -- 128
23-786 HOSTETLER,HENRY1"1979 03 Jun 1986 1400 13.0 167 10.0 5.0 -- 4 -- 108
7O

Table 4.--Water-quality analyses of wetl-water samples, 1923-86--Continued.(Constituentsnot detected in e sample are reportedas the value of
the detection Limit for that analysts, preceded by a less than symbol(<).)
Cat- Nagne- Pates- Chtor- Sut- Ftuor- Sitica Manga-
NJ-NRD Date ciurn, sium, Sedium sium, ida, fate, ida, as SiO4 Iron, Iron, nasa,
well of diss diss diss diss diss diss diss diss total diss diss
ruJntber sample (mg/L) (mg/L) (n_/L) (mg/L) (G/L) (n_g/L) (mg/L) (G/L) (#g/L) (pg/L) (pg/L)
Middle aquifer, Potomac-Raritan-MagothY aquifer system--Contir_Jed.
?.3-491 27 Aug 1985 11 3.5 9.0 2.2 12 5.2 <.1 13 190 47 4223-491 08 Jut 1986 8.9 3.3 6.9 2.6 22 5.4 <.1 14 70 58 49
23-499 22 May 1985 2.6 .7 1.7 .6 2.6 11 <.1 7.9 1,500 1,400 2123-502 30 Nay 1985 6.1 1.4 3.1 .7 3.7 11 <.1 8.8 1,900 2,000 3/*23-503 15 May 1985 .96 .4 1.7 .5 3.2 8.2 -- 8.0 2,100 2,000 27
23-504 29 Jut 1985 7.4 2.4 5.9 1.8 16 .2 <.1 8.3 150 31 15
23-5_ 08 Aug 1985 2.8 .92 4.2 1.2 8.1 22 <.1 9.5 6,600 6,100 5523-517 29Apr 1985 9.1 4.3 8.3 3.1 27 .8 <.1 10 1,100 1,200 36
23-523 12 Apr 1985 74 17 27 2.2 53 230 -- 26 10,000 11,000 1,50025-543 16 Apt 1985 23 12 120 .5 51 36 -- 17 9,800 210 620
23-548 16 Apt 1985 _ 25 18 1.5 34 60 -- 22 2,400 270 1123-551 11 Oct 1984 3.5 .91 3.6 -- 7.8 6.5 -- 9.5 -- 2,100 3623-552 19 Mar 1985 2.2 .97 2.8 1.2 2.7 .5 -- 13 50 5 <1
23-552 02 Jut 1986 2.3 1.0 3.0 1.4 2[8 .7 <.1 13 10 6 <1
23-554 08 Aug 1985 2.8 1.2 2.6 .9 3.0 14 <.1 8.7 4,200 4,300 92
23-583 10 Jun 1985 3.6 2.6 4.9 1.1 12 7.3 <.1 7.3 180 160 15
23-585 12 Jun 1985 2.0 1.0 2.5 .7 7.0 6.9 <.1 9.3 6_000 6,000 10023-704 18 Apt 1985 3.1 2.9 11 2.0 24 3.8 -- 5.9 170 45 2123-715 18 Apr 1985 1.7 2.5 13 1.1 25 <.2 -- 6.7 130 29 10023-732 18 Apt 1985 4.8 5.5 6.9 2.9 35 .3 -- 7.5 650 480 27
23-733 17 Apr 1985 13 3.5 8.4 1.7 17 70 -- 9.8 140 91 25023-734 16 Apr 1985 1.5 2.3 5.2 1.4 9.5 <.2 -- 6.9 160 11 2323-736 15 Nar 1985 17 8.8 4.8 3.0 28 7.8 -- 8.1 40 23 61
23-736 03 Jun 1986 18 8.7 4.9 3.2 29 5.9 <.1 8.7 90 9 64
23-738 15 Apr 1985 2.9 2.7 3.0 1.3 8.7 .6 -- 5.9 130 95 31
23-738 15 Jut 1986 2.6 2.1 3.3 1.3 7.2 1.5 <.1 6.8 50 38 18
23-739 09 Apr 1985 1.2 .82 4.4 1.2 6.4 .5 -- 13 550 160 35
23-760 17 dun 1985 .75 .4 2.0 -- 2.4 10 <.1 7.3 1,600 1,600 2123-776 09 Aug 1985 3.1 .9 4.7 1.0 3.9 .3 <.1 24 880 100 923-776 02 Jun 1986 2.5 .9 4.6 1.0 2.4 .5 <.1 25 30 17 2
23-778 09 Jut 1985 11 7.0 8.2 3.3 18 1.8 <.1 20 20 20 1623-780 12 Jut 1985 11 6.6 11 3.1 23 1.8 <.1 26 10 5 <1
23-782 24 Hay 1985 6.2 2.0 1.7 .6 2.4 7.9 <.1 7.6 3,500 3,500 6023-786 30 Jut 1985 11 4.9 7.6 3.2 20 <.2 .1 8.8 50 12 18
23-786 03 Jun 1986 11 5.0 7.4 3.1 17 >.2 <.1 9.6 40 5 19
71

Table 4.--Water-quality analyses of ueU-ueter samples, 1923-86--Continued.(Constituents not detected in • sample are reported as the value of the detection limit for that analysts,
preceded by a tess than symbol(<). Concentrations are in _g/L.)
NJ-WRD Date Atu- Beryl- Cad- Chro- L_th- Holy'o- Stron- Vans-
yell of mtnum, Barium, tium, mtum, mium, Cobalt, Copper, Lead, furs, denum, tium, dium, Zinc,number sample diss diss dies diss diss dias dies diss diss diss diss dies diss
NJddle aauifer. Potomac-Raritan-Haqothy aautfer system--Continued.
23-491 27 Aug 1985 300 150 <.5 <1 -- <3 <10 <5 5 <10 110 <6 723-491 08 Jut 1986 10 210 2.0 <1 <10 <3 <10 <10 4 <10 100 <6 39
23-499 22 May 1985 700 26 .6 <1 -- <3 <10 10 9 <10 14 <6 2323-502 30 Nay 1985 200 42 <.5 <1 -- <3 <10 <10 10 <10 43 ,-6 <3
23-503 15 Nay 1985 200 30 <.5 <1 -- <3 <10 <10 12 <10 11 <6 8
23-504 29 Jut 1985 100 66 <.5 <1 -- 9 230 10 5 <10 60 <6 56
23-506 08Aug 1985 <100 52 .5 <1 -- <3 10 20 8 <10 37 <6 3323-517 29 Apr 1985 100 170 <.5 <1 -- <3 210 <10 <4 <10 96 <6 4423-523 12 Apr 1985 10 44 <.5 <1 <10 30 <10 <10 6 <10 340 <6 1823-543 16 Apr 1985 30 100 <.5 <1 10 <3 <10 <10 <4 <10 62 <6 <3
23-548 16 Apr 1985 10 140 <.5 <1 10 <3 <10 <10 <4 <10 160 <6 13
23-551 11 Oct 1984 1,500 26 <.5 <1 "" <3 <10 <10 <4 <10 29 <6 <323"552 19 Mar 1985 <10 25 <.5 <1 10 <3 <10 <10 16 <10 26 <6 1023-552 02 Jul 1986 <10 24 <.5 <1 <10 <3 <10 <10 <4 <10 29 <6 15
23-554 08 Aug 1985 <100 41 <.5 <1 "- <3 <10 <10 9 <10 35 <6 8
23-583 10 Jon 1985 1,400 43 <.5 <1 -- 10 60 <10 <4 <10 32 <6 4023-585 12 Jon 1985 600 41 <.5 <1 -- 5 <10 <10 21 <10 24 <6 17
23-704 18 Apt 1985 40 64 .7 <1 10 <3 <10 <10 <4 <10 35 <6 1423-715 18 Apt 1985 50 99 <.5 <1 <10 <3 10 <10 <4 <10 25 <6 1323"732 18 Apr 1985 10 390 .9 <1 10 4 30 20 <4 <10 130 <6 110
23-733 17 Apr 1985 4,500 60 .9 <1 <10 20 30 <10 25 <10 98 <6 160
23-734 16 Apt 1985 60 96 .5 <1 20 <3 600 <10 <4 <10 30 <6 2223-736 15 Mar 1985 80 270 2.0 <1 <10 <3 120 <10 12 <10 190 <6 18
23-736 03 Jun 1986 90 280 <.5 <1 <10 <3 40 10 <4 <10 180 <6 2523-738 15 Apt 1985 10 95 <.5 <1 10 <3 560 40 <4 <10 39 <6 180
23-738 15 Jut 1986 20 75 <.5 <1 <10 <3 150 20 <4 <10 33 <6 41
23-739 09 Apt 1985 10 26 .5 <1 <10 4 90 10 <4 <10 11 <6 1023-760 17 Jun 1985 <100 30 .7 <1 -- <3 <10 <10 20 <10 6 <6 61
23-776 09 Aug 1985 <100 30 <.5 <1 -- <3 <10 <10 <4 <10 31 <6 523-776 02 Jun 1986 <10 25 <.5 <1 <10 <3 <10 <10 <4 <10 32 <6 <3
23-778 09 Jut 1985 100 110 <.5 <1 -- 5 20 20 8 <10 170 <6 21
23-780 12 Jut 1985 <100 33 .6 <1 -- <3 <10 <10 10 <10 140 <6 823-782 24 May 1985 400 48 <.5 <1 "" <3 <10 <10 5 <10 43 <6 1023-786 30 Jut 1985 100 280 .8 <1 "" <3 <10 <10 6 <10 140 <6 310
23-786 03 dun 1986 30 280 <.5 <1 <10 <3 10 10 <4 <10 140 <6 170
72

Table 4.--Water-tt_Jalityanalysesof well-watersamples,1923-86--Contir_Jed.
(Constituentsnot detected in e sampleare reportedas the value of
the detection limit for that analysis, preceded by a Less than symbol(<).)
NJ
Ammonia Nitrite Kjetdaht NO2+ Ortho- Organic Die- Central Leboratqry
NJ-WRD Date as N, as N, N as N, NO3as phosphate carbon, Phenols, trict Pesti-
well of diss diss diss 4 N, dies as P, diss dies total VOC VOC cide
number sample (mg/L) (mg/L) (mg/L) (mg/L) (mg/L) (mg/L) (mg/L) scans analysis 5 analysis s
Middle aauifer. Potomac-Rsritsn-Nagothy aquifer system--Continued.
23-491 27 Aug 1985 .43 <.01 .6 5.5 .02 .7 <1 ......
23-491 08 Jut 1986 .12 .01 .7 6.8 <.01 .3 3 .... ND23-499 22 Nay 1985 <,01 <.01 5.4 <.1 <.01 .9 -- ND ....23-502 30 Nay 1985 <.01 <.01 .6 <.1 <.01 -- 2 MD ....23-503 15 Nay 1985 .03 <.01 .8 <.1 .02 .4 1 ND ....
23-504 29 JuL 1985 .04 <.01 <.2 6.9 .02 1.1 <1 ......23-506 08 Aug 1985 .......... 2.6 -- ND ....
23-517 29 Apr 1985 .01 <.01 .2 4.9 <.01 .6 <1 ND ....23-523 12 Apr 1985 .07 <.01 .7 <.1 <.01 1.4 <1 + NO ND
23-543 16 Apr 1985 <.01 <.01 .5 <.1 .48 2.2 2 + + ND
23-548 16 Apr 1985 <.01 <.01 .3 4.9 .02 1.3 <1 + ND ND23-551 11 Oct 1984 .03 <.01 <.2 <.1 <.01 .... ND ....
23-552 19 Man 1985 <.01 <.01 .3 1.0 <.01 ,1 <1 ND ND ND23-552 02 Jul 1986 <.01 <.01 .3 1.3 <.01 .3 3 .... ND23-554 08Aug 1985 <.01 <.01 .2 1.0 .04 2.7 -- ND ....
23-583 10 Jun 1985 .06 <.01 -- 3.4 .01 .5 <1 ......
23-585 12 Jun 1985 .02 .03 -- <.1 .01 1.0 4 . ND ....23-704 18 Apt 1985 <.01 <.01 1.4 2.1 <.01 .9 <1 + + ND23-713 18 Apr 1985 <.01 <.01 .3 2.5 <.01 .9 <1 + + ND
23"732 18 Apt 1985 .08 <.01 .2 1.2 <.01 1.1 <1 + ND ND
23-733 17 Apt 1985 .03 <.01 .5 .31 <.01 3.7 2 ND -- ND
23-734 16 Apt 1985 .13 <.01 <.2 3.5 <.01 .6 <1 + + ND23-736 15 Her 1985 <.01 <.01 .4 11 <.01 .6 <1 ND ND +23-756 03 Jun 1986 <.01 <.01 .4 13 <.01 .6 0 ....23-738 15 Apt 1985 .09 <.01 1.0 3.8 <.01 .7 <1 .... ND
23-738 15 Jut 1986 .02 .01 <.2 2.9 .01 .6 3 + + +
23"739 09 Apr 1985 <.01 <.01 <.2 .17 <.01 .9 <1 ND -- NO23-760 17 Jun 1985 ............ <1 �....23-776 09 AUg 1985 <.01 .02 <.2 3.8 .07 3.1 1 + ....
23-776 02 Jun 1986 .01 <.01 .3 1.1 .04 1.1 4 .... NO
23-778 09 Jul 1985 .03 <.01 .2 13 <.01 .8 2 ......23-780 12 Jut 1985 .28 .01 .4 11 <.01 .7 <1 ND ....23-782 24 Nay 1985 .04 <.01 2.6 <.1 <.01 .... ND ....
23-786 30 Jut 1985 <.01 <.01 <.2 8.6 <.01 1.0 <1 ......23-786 03 Jun 1986 <.01 <.01 .3 11 <.01 .3 6 ND -- ND
73

Table 4.--Water-aualitv analyses of well-water samples, 1923-86--Continued.(Constituents not detected in a sample are reported as the value of
the detection limit for that analysis, preceded by a less then symbol(<).)
Tem- SI0e- Oxy- Field st- Lab st- FieldNJ-WRD Bate pets- cific gen, Field katinity katinity bicar- Solids,
well Local well of ture conduc- diss pH (mg/L as (mg/L as bonate 2 diss 3r_J_iber identifier sample T{me ('C) tance I (R/L) (units) (C8C03) (CaC03) (mg/L) (fr_/L)
Niddte aquifer_ Potomac-Raritan-Hagothy aquifer system--Continued.
23-787 ELY, JOHN 1981 09 Jut 1985 1230 14.0 142 .1 5.9 15 <1 18 10423-1010 ZINSI4E|STER,JACK1967 04 Jun 1986 1115 13.0 140 .3 7.8 69 69 85 111
23-1056 NCUAHON]TORING3-1978 06 Nov 1986 1500 13.5 -- .9 5.3 28 258 38 9,91023-1066 WHITE, STANLEY 1985 11 Jun 1986 1030 12.5 128 10.9 5.5 -- 5 -- 102
23-1067 PROTIN|CK, NICHAEL 1966 11 Jun 1966 1300 13.0 86 12.5 4.9 -- 2 -- 48
25-55 ENGLISHTO_NBORO_/D 1-63 14 Oct 1971 -- 14.0 31 -- 4.8 -- 1 -- 1725-55 ENGLISHTOWNBOROkl) 1-63 24 Apr 1985 1425 15.0 32 .3 4.0 4 1 4 21
25-153 SNORELANBS_C HOLHDL4-7021 Mar 1972 -- 15.0 54 -- 7.1 -- 13 -- 4025-153 SHORELANDSWCHOLHDL4-7030 Oct 1984 1120 15.0 76 .2 6.2 -- 13 ....
25-231 GORDONSCRNRWC6-74 23 Apt 1985 1225 15.0 39 .1 5.3 7 2 8 27
25-247 GORDONSCRNR_ 2-04 23 Apr 1985 1110 16.0 38 .2 5.5 7 <1 <1 2925-262 NARLBOROS HOSP15-66 10 Nay 1985 1030 16.0 50 .3 5.6 12 7 13 28
25-268 NARLBOROT HUA2-PROD-72 29 Apr 1985 1445 18.0 50 .6 5.9 12 5 15 2825-269 NARLBOROHUA 1-PRO01972 07 Aug 1985 1530 16.0 47 .4 5.8 12 5 15 3425-297 ABERDEENTWP_ 1-56 29 Oct 1984 0945 14.0 59 .2 6.1 -- 8 ....
25-297 ABERDEENTWP_/D 1-56 01 Apt 1986 1200 14.0 65 -- 6.2 ........25-318 NPS-SANDYHOOK2-1906 10 Nay 1954 -- 18.0 .... 6.6 -- 20 ....25-319 US ARHY-FTHANCOCK5-42 07 Jut 1953 .... 97 -- 6.9 -- 22 -- 9525-319 US ARHY-FTHANCOCK5-42 10 Hay 1954 -- 18.0 97 -- 6.8 -- 21 -- 61
25-319 US ARHY-FTHANCOCK5-42 29 Aug 1957 -- 16.0 103 -- 7.1 -- 21 -- 68
25-320 NPS-SANDYHOOK5A-1970 23 Oct 1984 1500 19.5 129 .2 6,6 -- 20 ....
25-453 UNIONBEACHBOROWD3-77 29 Hay 1985 1530 15.0 83 .2 6.3 29 12 34 3525-466 ABERDEENTWP_O 3-77 29 Hay 1985 1200 14.5 65 .3 5.9 19 9 23 37
25-543 NARLBOROT NUA4A-PRO0 07 Aug 1985 1415 15.5 48 .2 5.8 12 5 13 3225-549 tlARLBOROT HUA3-PRO0 29 Apr 1985 1640 16.0 50 .2 5.8 11 5 12 31
25-561 FREEHOLDBOROWD7-1984 26 Apr 1985 1200 16.0 41 .2 5.2 12 5 11 2325-562 KEYPORTBOROM) 8-1984 23 Aug 1985 1110 14.5 74 .3 6.3 33 9 23 35
74

TabLe 4.--Water-auatit¥ analyses of weLt-water samples. 1923-86--Continued.(Constituents not detected in a aa_r_oteere reported as the value of
the detectLon Limit for that analysis, preceded by a Less than symboL(<).)
Cat- Magne- Potas- Chtor- Su[- Ftuor- SiLica Manga-
NJ-WRD Date cium, slum, Sodium sium, ida, fate, ide, as Si04 Iron, Iron, nese,
weLL of diss diss diss diss diss disa diss diss total diss diss
ruJr_ber a_te (n_D/L) (_/L) (mg/L) (_/L) (_/L) (_/L) (_/L) (rag/L) (_g/L) (_g/L) (_g/L)
Middle aouifer. Potomac-Raritan-Ma_oth¥ aquifer system--Continued
23-787 09 Jut 1985 4.5 2.5 5.8 2.4 12 -- <.1 17 13,000 13,000 26023-1010 04 Jun 1986 13 3.2 11 1.6 3.6 3.7 .2 41 480 400 260
23-1056 06 Nov 1986 10 120 1300 54 5,500 790 <.1 .4 11,000 640 32023-1066 11Jun 1986 8.3 3.0 8.8 2.0 14 .7 <.1 15 50 5 1223-1067 11 J_ 1986 ...... 1.9 11 .5 <.1 -- 200 ....
25-55 14 Oct 1971 .6 .2 1.9 .6 1.8 6.8 0 7.9 -- 1,600 20
25-55 24 Apr 1985 .61 .26 2.2 .53 2.6 7.4 <.1 7.3 970 1,000 1325-153 21 Mar 1972 4.2 .8 2.7 1.7 2.8 8.6 0 5.5 20,000 -- 14025-153 30 Oct 1984 4.7 1.3 2.4 -- 2.5 9.4 -- 8.1 -- 9,400 150
25-231 23 Apr 1985 1.6 .54 1.7 .5 1.0 3.4 <.1 8.3 2,600 2,600 37
25-247 23 Apr 1985 2.0 .51 2.1 .5 2.4 10 <.1 8.8 2,400 2,400 3525-262 10 May 1985 2.8 .78 1.7 .8 2.0 7.0 -- 8.4 4,200 4,300 62
25-268 29 Apt 1985 2.5 .71 1.6 2.8 2.2 9.6 <.1 8.6 4,100 4,200 69
25-269 07 Aug 1985 2.5 .72 1.7 2.8 2.3 7.9 <.1 8.5 4,400 4,300 6525-297 29 Oct 1984 3.1 1.0 2.5 -- 2.2 9.6 -- 8.5 -- 5,600 100
25-297 01Apr 1986 3.8 1.1 2.6 ........ 9.2 -- 5,600 11025-318 10 May 1954 8.7 1.4 .... 4.3 15 0 8.7 -- 3,900 --25-319 07 Jut 1953 8.7 1_5 .... 6.9 18 0 8.2 -- 4,800 --25-319 10 May 1954 8.7 1.8 .... 4.4 15 0 8.0 -- 2,600 --
25-319 29 Aug 1957 9.2 1.6 .... 9.4 13 .2 9.6 -- 4,700 210
25-320 23 Oct 1984 8.3 1.7 4.7 -- 5.6 19 -- 8.9 -- 8,600 15025-453 29 May 1985 ...... <.1 2.5 10 <.1 -- 9,000 ....
25-466 29 May 1985 3.9 1.2 2.2 1.0 2.2 10 <.1 8.9 6,000 6,100 11025-543 07 Aug 1985 2.6 .81 1.8 .8 2.2 8.7 <.1 8.7 4,300 4,200 61
25-549 29 Apt 1985 2.5 .74 1.8 1.3 2.0 8.2 <.1 8.7 4,100 4,200 66
25-561 26 Apr 1985 2.1 .52 1.9 .6 2.0 6.5 <.1 8.8 2,300 2,400 5125-562 23 Aug 1985 3.9 1.2 2.1 1.1 2.5 9.3 <.1 8.4 6,900 7,000 120
75

Table &.--Water-®a|itv analyses of welt-water samplesr 1923-86--Continued.(Constituents not detected in • sample are reported as the value of the detection limit for that analysis,
preceded by a less than symbol(<). Concentrations are in _g/L.)
NJ-WRD Date Atu- Beryl- Cad- Chro- Lith- Nolyb- Stron- Vane-
well of minum, Barium, tium, mium, mium, Cobalt, Copper, Lead, ium, denum, tium, dium, Zinc,nuld_r sample diss diss diss diss dies dies diss diss dies diss dies diss diss
Middle aquifer, Potomac-RaritanlMa_othy aquifer system--Continued.
23-787 09 Jul 1985 <100 62 <.5 2 -- <3 <10 <10 11 <10 55 <6 6/,23-1010 04 Jtal 1986 <10 49 <.5 <1 <10 <3 <10 <10 6 <10 130 <6 62.3-1056 06 Nov 1986 10 6 <.5 1 -- <3 <10 20 23 <10 120 <6 56
23-1066 11 Jun 1986 <10 16 <.5 <I <10 <3 <10 <10 5 <10 100 <6 523-1067 11 Jun 1986 40 ...... <10 ............
25-55 14 Oct 1971 100 .......... 10 -- 0 ....
25-55 24 Apr 1985 300 18 <.5 <1 -- 6 20 <10 55 <10 6 <6 1725-153 21 Mar 197"2 ..............
25-153 30 Oct 1984 <100 59 <.5 1 -- <3 <10 <10 <4 <10 76 <6 1325-231 23 Apr 1985 100 43 <.5 <1 -- <3 <10 <10 15 <10 21 <6 220
25-247 23 Apt 1985 100 39 <.5 <1 -- <3 <10 <10 24 <10 22 <6 26
25-262 10 Nay 1985 300 45 <.5 <1 -- <3 <10 <10 <4 <10 38 <6 1925-268 29 Apt 1985 <100 49 <.5 <1 -- <3 <10 40 11 <10 30 <6 2625-269 07 Aug 1985 <100 38 <.5 <1 -- <3 <10 10 15 <10 30 <6 <3
25-297 29 Oct 1984 <100 45 <.5 <1 -- <3 <10 20 7 <10 46 <6 24
25-297 01Apr 1986 -- 39 2.0 4 "" <9 <30 <30 19 <30 43 <18 2025"318 10 May 1954 ..............25-319 07 Jut 1953 ..............
25-319 10 Hay 1954 ..............25-319 29 Aug 1957 ..............
25-320 23 Oct 1984 100 77 <.5 <1 -- <3 <10 20 <4 <10 150 <6 <325-453 29 May 1985 ..............
25-466 29 Nay 1985 100 54 <.5 <1 -- <3 <10 <10 <4 <10 51 <6 <325-543 07 Aug 1985 <100 39 <.5 <1 -- <3 <10 <10 14 <10 32 <6 4
25-549 29 Apt 1985 <100 50 <.5 <I -- <3 <10 <10 14 <10 31 <6 44
25-561 26 Apt 1985 <100 54 <.5 <1 -- <3 <10 <10 18 <10 28 <6 14
25-562 2] Aug 1985 <100 57 <.5 <1 -- <3 <10 <5 7 20 49 <6 15
76

Table 4.--Water-auatity analyses of welt-water samples, 1923-P,_--cont|nued.(Constituents not detected in a sample are reported as the value of
the detection Limit for that analysis, preceded bye Less than symbol(<).)
NJ
Ammonia Nitrite Kjetdaht NO2+ Ortho- Organic Dis- Central LabOratory
NJ-NRD Date as M, as N, N as g, NO3as p_osphete carbon, Phenols, trLct Pesti*
well of diss diss diss 4 N, diss as P, disa diss total VOC VOC cide
number sample (mg/L) (mg/L) (mg/L) (mg/L) (mg/L) (mg/L) (mg/L) scans analysis 5 analysis s
Middle aquifer, Potemac-Raritan-MaRoth¥ aquifer system--Continued.
23-787 09 Jut 1985 .07 <.01 .4 <.1 <.01 .9 2 ND ....
23-1010 04 Jun 1986 .54 <.01 .6 <.1 .08 .4 2 ND -- ND23-1056 06 Nov 1986 .35 .01 .5 <.1 <.01 1.6 ........
23-1066 11 dun 1986 .02 <.01 .4 11 <.01 .... ND -- ND23-1067 11 Jtal 1986 .02 <.01 .3 3.6 <.01 .... ND -- ND
25-55 14 Oct 1971 ....................
25-55 24 Apr 1985 <.01 <.01 .4 <.1 <.01 .8 -- ND ....25-153 21 Mar 1972 ........ .009 ..........
25-153 30 Oct 1984 <.01 <.01 .3 <.1 <.01 .... NO ....25-231 23 Apt 1985 <.01 <.01 .3 <.1 .01 .8 -- ND ....
25-247 23 Apr 1985 <.01 <.01 .5 <.1 .01 .7 -- ND ....25-262 10 Nay 1985 .06 <.01 .5 <.1 .01 1.6 1 ND ....25-268 29 Apr 1985 .03 <.01 .5 <.1 <.01 .5 <1 ......25-269 07 Aug 1985 .02 <.01 .3 .12 .08 1.2 2 ND ....
25-297 29 OCt 1984 .01 <.01 <.2 <.] <.01 .... ND ....
25-297 01 Apt 1986 ....................25-318 10 Nay 1954 ....................25-319 07 Jut 1953 ....................
25-319 10 Nay 1954 ....................
25-319 29 Aug 1957 ....................
25-320 23 OCt 1984 .02 <.01 <.2 <.1 <.01 .... ND ....
25-45] 29 Nay 1985 .07 <.01 .7 <.1 .02 .7 5 ND ....25-466 29 May 1985 <.01 <.01 .5 <.1 <.01 .9 1 ND ....25-543 07 Aug 1985 .22 <.01 .2 .13 • <.01 .8 2 ND ....25"549 29 Apr 1985 <.01 <.01 .2 <.1 <.01 .7 <1 ......
25-561 26 Apt 1985 <.01 <.01 .5 <.1 <.01 .8 -- ND ....
25-562 23 Aug 1985 .04 <.01 .3 <.1 <.01 .5 1 ......
1 Field specific conductance in microSiemons per centimeter at 25 "C.
2 Computed field-bicarbonate concentrations may be higher than actual bicarbonate concentrations for uater samples that
have high concentrations of metals.
s Dissolved solids, residue on evaporation at 180 "C.
4 Ammoniaplus organic nitrogen, as N.
s + Indicates at Least one compoundat or above the detection Limit of 0.8 pg/L (microgrants per Liter) for the VOC
scan or 3.0 pg/L for the VOCanalysis.
ND Indicates none detected.
-- Indicates sample not analyzed for these constituents.
77

Table 5.--Chloride concentrations and field measurements of well-water samples, 1923-86.
[°C, degrees Celsius; mg/L, milligrams per Liter; --, indicates data not available]
Spe- Chlo- $pe- Chlo- Spe- Chlo-Date Temper- cific ride, Date Temper- cific ride, Date Temper- cific ride,
of ature condu - diss of ature conduc- diss of ature condu - disssample (=C) Lance _ (mg/L) sample (°C) Lance I (mg/L) sample (°C) Lance [ (mg/L)
Upper aquifer, Potomac-Rar tan-Ma_othy aquifer system
Well 23-15 CRAHBURY TWP WD 2-1917
08-04-1969 15.0 221 15 04-15-1985 13.5 241 14
Well 23-20 CARTERWALLACE3A-68
05-08-1985 13.0 248 55
Well 23-69 C P S CHEMICAL CO 1975
06-19-1985 12.5 252 14 03-06-1986 12,5 237 15 10-28-1986 12.5 250 50
Well 23-108 DUHERNAL WC 13-1947
07-25-1958 .... 3.6 06-06-1969 15.0 224 4.3 03-20-1985 12.0 166 9,4
Well 23-135 OLD @RIDGE MUA BRH 2-_
07-31-1969 14.0 105 6.8 10-24-1981, 12.0 94 5.601-05-1977 12.0 82 2.7 09-26-1985 12.5 99 5.3
Well 23-172 DUHERNAL WC 1-1938
11-13-1942 .... 5.1 03-20-1985 13.0 145 16
Well 23-192 PERTH AMBOY WD 3-1951
09-13-1957 .... 6,1 06-13-1969 11.0 175 12 08-21-1978 13.5 270 3602-27-1958 .... 8.2 03-10-1970 10.0 180 12 09-20-1979 11.5 278 3307-23-1958 .... 6.5 09-27-1972 15.5 171 16 09-23-1981 12.0 289 4504-14-1959 .... 2.7 08-27-1974 15.0 173 13 11-01-1984 13,0 280 2404-07-1960 .... 2.6 08-18-1977 12.5 241 31
Well 23-193 PERTH AMBOY _I)4-1955
09-13-1957 3.7 09-14-19T5 13,5 244 23 08-18-1977 12.0 461 5503-10-1970 i3.5 170 12 04-25-1974 13.0 190 26 08-21-1978 12.0 320 5909-27-1972 14.5 170 17 08-27-1974 13.0 181 21 09-20-1979 13.0 420 10005-31-1973 12.5 17_ 24 04-06-1977 12.5 287 51 11-01-1984 12.5 266 64
Well 23-195 PERTH AMBOY WD 5-1965
03-10-1970 12.0 180 9.0 08-21-1978 12.5 125 6.9 10-17-198/* 13.5 218 3209-27-1972 12.0 196 13 09-20-1979 12,5 161 14 04-11-1985 12.5 233 3709-14-19T3 12.5 190 12 09-23-1981 11.5 165 5.0 09-20-1985 13.0 232 3506-03-1975 11.0 291 23 08-18-1982 12.0 214 30 03-04-1986 14.0 247 4308-18-1977 12.5 212 12 09-09-1983 12.0 265 35 10-07-1986 12.5 315 150
Well 23-205 OLD BRIDGE TWP MUA-LH 1
08-22-1949 -- 70 3.8 07-23-1958 .... 3.1 03-17-1972 13.0 45 3.004-14-1950 .... 3.1 04"14-1959 .... 3.0 09-27-1972 12.0 65 5.008"29"1950 .... 3.2 09-01-1959 .... 2.8 09-14-1973 12.0 65 3.003-26-1951 .... 1.2 04-08-1960 .... 2.7 04"25-1974 12.5 60 5,008-22-1951 .... 3.5 08-30-1960 .... 2.0 08"27-1974 12,5 59 4.504"17"1952 .... 3.8 03-21-1961 .... 2.6 01-05-1977 12.0 69 3.909-04-1952 .... 2.6 08-22-1961 12.0 52 3.0 08-18-1977 12.5 70 4.203-30-1953 .... 3.0 05-01-1962 13.0 74 3.8 08"22-1978 -- 50 3.409-03-1953 .... 5.4 09"18-1962 13.0 58 2.1 10-24-1979 12,5 64 4.004"08"1954 .... 5.0 04-01-1963 13.0 58 3.2 09-19-1980 12,5 54 4.309-01-1954 .... 3.7 08-28-1963 13.5 57 3.6 08-31-1982 12.5 61 6.004-13-1955 .... 3.3 04"27-1964 13.0 48 3.5 12-02-1983 12.5 61 7.808-30-1955 .... 3.0 08"24-1964 13,5 55 3.0 10-24-1984 12.0 66 8.704-12-1956 .... 2.0 04-19-1965 12.0 58 3.0 09-26-1985 12.5 76 1208-29-1956 .... 3.4 08-19-1965 14,0 61 2,5 02"27-1986 12,5 82 1504-03-1957 .... 3.6 04-18-1966 13.0 45 3.5 10-02-1986 12.5 89 1208-28-1957 .... 3.0 09-22-1966 13.5 53 3.002-27-1958 .... 3.0 10-29-1970 14.0 -- 3.0
Well 23-299 BASF-WYANDOTTE I
06-05-1969 17.0 88 14 06-05-1970 17.0 88 14 07-18-1985 15,5 180 36
78

Table 5.--Chloride concentrations and field measurementsof weU-water samples, 1923-86.--Continued.
Sloe- Ch[o- Spe- Ch[o- Spe- Chlo-Date Temper- cific ride, Date Temper- cific ride, Date Temper- ciflc ride,
of ature caO_e - diss of ature condu - diss of ature cc_- disssample ('C) t (rag/L) sample ('C) lance_ (mg/L) sample ('C) ta (r_l/L)
Upper aouifer. Potomac-Raritan-Ma_othy aquifer system--Continued.
Well 23-307 KORDUS1-1961
08-29-1985 12.5 242 40
' Well 23-346 SAYREVILLEBOROWOB-58
08-31-1959 .... 9.8 08-25-1964 11.5 106 13 04-25-1974 12.5 135 1304-08-1960 .... 10 04-20-1965 11.0 102 13 08-27-1974 13.0 137 1507-12-1960 .... 11 08-20-1965 -- 101 12 04-06-1977 13.5 314 6308-29-1960 .... 10 04-19-1966 11.0 103 13 09-30-1977 14.5 545 13003-21-1961 -- 12 09-22-1966 11.5 111 12 08-21-1978 15.0 590 12008-21-1961 11.0 92 12 03-20-1969 -- 133 16 09-26-1979 -- 460 0105-01-1962 11.0 96 12 03-10-1970 11.5 130 17 08-19-1982 13.0 420 9609-17-1962 11.0 94 11 10-30-1970 11.0 161 19 09-08-1983 13.0 400 8705-01-1963 -- 101 11 03-17-1972 11.5 146 17 10-16-1984 13.5 292 5308-28-1963 15.0 109 13 09-27-1972 12.0 217 45 04-10-1985 12.0 265 4804-28-1964 10.5 87 10 05-31-1973 12.5 148 12 09-20-1985 13.5 285 52
Well 23-354 SAYREVILLEBOROk'D C-58
08-31-1959 .... 18 04-02-1963 11.5 213 27 03-10-1970 11.0 172 2204-08-1960 .... 69 08-28-1963 18.5 84 7.7 10-30-1970 11.5 209 2007-12-1960 .... 67 08-25-1964 11.5 203 24 03-17-1972 11.0 167 1608-29-1960 .... 110 04-20-1965 10.5 212 24 09-27-1972 12.5 164 1409-05-1961 11.5 246 3/* 08-20-1965 11.0 206 24 09-14-1973 12.5 153 1105-01-1962 11.0 193 26 09-22-1966 11.0 375 53 09-26-1979 13.0 360 7809-17-1962 15.0 147 14 03-20-1969 -- 224 26
Wetl 23-355 SAYREVXLLEBOROWDA-69
09-30-1977 12.5 431 85 10-16-1984 12.0 260 44 03-03-1986 14.5 285 5609-08-1983 13.0 395 88 09-20-1985 14.5 268 53 09-30-1986 14.0 295 56
Wetl 23-356 SAYREVXLLEBOROla) F-59
09-24-1981 12.5 357 73 08-19-1982 13.0 525 120
Welt 23-358 SAYREVILLEBORO_D K-65
06-05-1969 12.0 142 14 08-27-1974 12.0 187 24 09-20-1985 12.5 212 2606-05-1970 11.5 142 14 08-21-1978 13.0 215 3009-14-1973 11.5 233 37 09-24-1981 12.5 210 32
Welt 23-359 SAYREVILLEBOROWDD-58
06-03-1975 21.5 597 69
Well 23-366 SAYREVXLLEBOROWOL-65
06-05-1969 11.0 115 11 09-12-1973 12.0 144 13 08-19-1982 13.0 136 1306-05-1970 11.0 115 11 08-21-1978 12.0 142 10 04-10-1985 11.0 152 11
Wet[ 23-367 SAYREVlLLE80RO_D 0-60
12-16-1970 .... 160 04-22-1985 13.0 -- 990
WeLL23-3_ SAYREVILLEBOROW9 Z-60
06-05-1969 11.0 122 8.9 08-27-1974 11.5 131 9.4 09-08-1983 12.0 310 1203-10-1970 11.0 122 8.0 06-03-1975 12.0 162 13 10-16-1984 13.0 390 1106-05-1970 11.0 122 8.9 04-06-1977 11.5 142 13 03-03-1986 12.0 335 9.903-17-1972 12.0 140 10 09-30-1977 12.0 147 12 09-30-1986 13.0 345 1109-14-1973 11.5 139 10 08-21-1978 12.5 155 1204-25-1974 12.0 127 9.8 09-24-1981 12.0 212 9.7
Well 23-369 SAYREVILLEBOROWOH+O0
09-24-1981 13.0 420 63
Welt 23-382 El DUPONT-PARLIN8-1937
03-04-1958 .... 12 05-05-1959 .... 12 09-14-1973 12.5 170 1307-29-1958 .... 12 03-15-1972 12.5 176 1309-16-1958 .... 8.0 09-27-1972 13.0 172 16
79

TabLe 5.--Chloride concentrations and field measurementsof well-Mater samples, 1923-86.--continued.
sloe- Chto- spa- Chto- SlOe- Chto-Date Temper- cific ride, Date Temper- ciffc ride, Date Temper- cific ride,
of ature ct°ndu(;ance`"dfss of ature t_c°ndt¢" diss of ature tocldUCCance1- dissample ('C) (mg/L) smpte ('C) (mg/L) sample ('C) (mg/L)
UDDer ao_Jifer. Potomac-Rariten-NaoothY aquifer s'(stem--Continued.
Well 23-383 El OUPOflT-PARLIN8A-1954
04-25-1974 13.0 161 10 09-30-1977 12.5 186 17 10-17-1984 12.5 106 1308-27-1974 12.5 173 14 08-19-1982 12.5 121 12 03-21-1985 12.0 102 12
Well 23-403 SAYREVILLEBOROkl)Q-73
01-04-1977 12.0 50 4.0 09-24-1981 12.5 206 26 09-20-1983 13.0 226 3009-30-1977 12.0 175 16 09-08-1985 12.5 220 29 03-05-1986 12.5 215 2909-26-1979 12.5 180 24 10-16-1984 13.0 225 28 09-30-1986 14.0 215 27
Well 23-412 SOUTHANBOYCITY _) 5-37
04-12-1950 .... 12 04-13-1955 .... 14 09-17-1962 13.5 157 1204-14-1950 -- 174 12 08-30-1955 .... 9.5 04-01-1963 12.0 161 1208-29-1950 .... 11 04-11-1956 .... 11 08-27-1963 13.5 147 1203-26-1951 .... 9.1 08-29-1956 .... 11 04-27-1964 12.0 152 1408-22-1951 .... 14 04-03-1957 .... 12 08-24-1964 14.0 155 1404-17-1952 .... 15 07-23-1958 .... 10 04-19-1965 12.0 159 1209-04-1952 .... 12 09-22-1958 .... 10 08-19-1965 13.5 157 1203-30-1953 .... 11 08-29-1960 .... 9.4 04-18-1966 12.0 154 1209-02-1953 .... 14 03-20-1961 -- 10 09-22-1966 14.0 150 1204-08-1954 .... 14 08-21-1961 i3.0 140 8.509-01-1954 .... 10 04-30-1962 12.0 204 12
Well 23-413 SOUTHAMOOYCITY _) 9-65
03-18-1969 -- 116 10 09-25-1972 12.0 43 1.2 11-16-1976 12.0 145 1503-09-1970 12.0 122 11 09-13-1973 12.0 126 11 08-18-1977 12.0 151 1510-29-1970 12.0 118 7.8 08-26-1974 12.0 97 9.0 08-22-1978 -- 110 1303-16-1972 12.0 97 8.8 06-03-1975 12.0 162 15
WeLL23-414 SOUTHAHBOYCITY Mg 10
06-13-1969 14.0 166 13 08-26-1974 12.5 165 13 09-14-1983 13.0 242 2403-09-1970 12.o 161 15 01-04-1977 12.5 196 17 10-12-1984 12.5 270 32I0-29-1970 12.5 169 16 08-18-1977 13.0 220 18 03-04-1986 12.0 279 7903-16-1972 12.5 160 14 08-22-1978 -- 200 16 10-02-1986 13.0 310 3809-25-19T2 12.5 158 16 08-31-1982 12.5 190 20
Welt 23-442 SPOTSWO00_ 3-19_
03-21-1985 11.5 90 5.5 07-07-1986 12.0 99 11
Well 23-458 SCHWEITZER,P J 7-1946
10-03-1957 .... 6.7 07-25-1958 .... 7.502-26-1958 .... 7.4 07-11-1969 14.0 175 13
Welt 23-549 SAYREVILLEBOROMOR-80
08-31-1982 12.5 57 2.2 04-10-1985 12.0 185 24 09-30-1986 12.5 292 4510-18-1984 12.5 155 18 03-03-1986 12.5 351 40
Welt 23-55? SOUTHAHBOYCITY _I) 9A
08-31-1982 12.5 170 27 09-14-1983 12.5 187 23 10-12-1984 12.0 193 2404-10-1985 12.5 190 23
Welt 23-569 SAYREVILLEBOROkl) T-82
09-08-1983 12.5 134 12 03-03-1986 12.5 138 8.810-18-1984 12.5 132 7.9 09-30-1986 13.0 149 11
Well 23-570 PERTHN4BOYkE)6-1982
09-09-1983 12.0 142 8.7 04-11-1985 12.0 259 26 03-04-1986 11.5 303 3210-17-1984 12.0 214 19 09-20-1985 11.5 278 29 10-07-1986 12.5 345 41
8O
J

Tabte 5.--Chloride concentrations and field measurementsof welt-water samptes, 1923-86.--Continued.
Spe- Chto- Spe- Chto- Spe- Chlo-Date Temper- cific ride, Date Temper- cific ride, Date Temper- cific ride,
of ature condu - diss of ature condu%- diss of ature condu£- disssampte ('C) tance _ (mg/L) sampte ('C) tance- (mg/L) sample ('C) tahoe = (mg/L)
Upper aquifer, Potemac-Raritan-MaRoth¥ aquifer system--Continued.
Wetl 25-571 PERTHAMBOYgo 7-1985
09-09-1985 12.0 115 9.1 09-20-1985 11.5 164 11 10-07-1986 11.5 212 1004-11-1985 11.5 186 14 03-05-1986 11.5 300 17
WeLt 23-581 PARLINSUPPLYCO1- CO 1-1974
06-19-1985 15.0 563 96
We_l 23-735 PERTHAHBOYgo RUNYON8R
10-17-1984 10.0 342 45 09-20-1985 11.5 312 28 10-07-1986 11.5 327 5304-11-1985 10.5 348 32 03-05-1986 11.0 380 32
Well 25-6 ATL HIGHLANDSBOROgO 1
08-25-1949 .... 1.8 04-08-1954 .... 4.8 04-05-1960 .... 1.004-11-1950 .... 1.5 09-01-1954 .... 1.7 08-51-1960 .... 1.608-29-1950 .... 1.4 04-13-1955 .... 2.0 01-15-1977 16.0 63 3.105-26-1951 .... 2.0 08-]1-1955 .... .8 08-25-1978 16.5 101 1.308-23-1951 .... 2.0 04-11-1956 .... 1.5 10-29-1984 17.0 95 1.409-05-1952 .... .9 09-04-1956 .... 1.4 09-18-1985 16.5 102 1.705-30-195] .... 1.7 04-03-1957 .... 2.1 02-25-1986 16.0 95 1.409-02-195] .... 1.2 07-24-1958 .... 1.8 10-08-1986 17.0 98 1.4
Well 25-8 ATL HXGHLANDSBOROgo ]
04-11-1950 .... 1.5 09-02-1959 .... 1.2 08-27-1968 17.0 67 3.508-28-1950 .... 1.2 04-05-1961 .... 1.3 02-26-1969 16.0 61 3.003-26-1951 .... 1.8 08-30-1961 15.5 70 1.5 10-29-1970 15.5 65 3.508-23-1951 .... 1.8 04-25-1962 15.5 72 1.5 05-21-1972 16.0 61 1.704-18-1952 .... 1.4 09-04-1962 16.5 68 1.7 09-25-1972 17.0 62 1.509-05-1953 .... .7 04-03-1963 16.5 70 2.0 06-01-1973 16.5 62 1.504-08-1954 .... .8 08-28-196] 16.5 64 1.4 09-11-1973 16.5 63 .909-01-1954 .... 1.2 04-28-1964 16.5 66 2.0 04-29-1974 16.5 67 1.904-I]-1955 .... 4.5 09-02-1964 17.0 64 1.5 08-29-1974 18.0 65 ].708-]1-1955 .... 1.8 04-05-1965 15.5 63 1.5 05-22-1975 16.5 69 4.209-04-1956 .... 1.4 08-31-1965 16.5 64 2.0 01-15-1977 13.5 150 6.004-0]-1957 .... 3.8 04-26-1966 17.0 63 1.5 08-]1-1977 16.5 68 .208-28-1957 .... 1.5 09-07-1966 17.0 67 1.5 08-23-1978 16.5 104 1.204-08-1958 .... 1.8 05-24-1967 15.5 67 1.0 09-12-1979 -- 162 3.809-10-1958 .... 1.4 08-29-1967 16.5 87 2.004-08-1959 .... 1.8 03-25-1968 16.0 70 2.5
Wett 25-12 AVON-BY-THE-SEAgO ]OBS
09-17-1926 .... 2.2 09-03-1964 15.5 86 1.0 08-28-1968 16.0 91 5.007-23-1958 20.0 92 1.2 08-31-1965 15.0 88 1.5 09-12-1973 23.5 91 1.204-03-196] 15.0 90 2.0 08-31-1966 20.5 93 2.008-28-196] 16.0 86 1.5 08-30-1967 16.5 89 1.5
WeLt 25-13 AVON-BY-THE-SEAM) 4-74
08"29"1974 24.0 96 2.8 08-22-1978 .... 1.8 09"21-1985 .... 2.107-28-1977 23.5 98 2.0 08-01-1979 25.5 128 1.2
WeLt 25-111 SHORELANDSWCHAZLET1-58
08-26-1958 .... 1.8 08-]1-1965 14.5 42 1.5 01-06-1977 13.5 29 1.804-08-1959 .... 1.9 04-26-1966 14.0 42 2.0 08-]1-1977 13.5 44 3.009-02-1959 .... 2.1 09-07-1966 14.5 44 2.5 08-24-1978 13.5 67 1.504-05-1960 .... 1.7 05-24-1967 14.0 42 1.5 09-13-1979 13.5 65 1.508-31-1960 .... 1.7 08-29-1967 14.5 50 2.0 09-18-1980 13.5 67 1.504-05-1961 .... 1.7 03-25-1968 15.0 49 2.2 09-30-1981 14.0 66 1.508-30-1961 13.5 40 2.0 08-27-1968 15.0 44 4.8 09-08-1982 13.5 70 1.904-25-1962 14.0 40 2.0 10-29-1970 13.5 41 3.5 10-12-1983 13.5 68 1.509-04-1962 14.5 141 2.5 03-21-1972 13.5 40 1.8 10-30-1984 13.5 64 1.604-03-1963 14.5 46 2.4 09-25-1972 14.5 42 1.5 09"19-1985 13.0 68 2.208-28-1963 14.0 42 1.7 06-01-1973 15.5 41 2.1 02-26-1986 13.5 65 1.804-29-1964 14.0 42 2.0 09-11-1973 13.5 41 1.9 I0-01-1986 I].5 72 1.709-02-1964 14.0 42 1.5 05-22-1975 I].5 45 5.504-05-1965 13.5 40 1.5 10-20-1976 13.5 44 3,3
81

TabLe 5.--ChLoride concentrations and field measurementsof welt-water samples, 1923-86.--Continued.
Spe- Ohio- Spa- Ohio- Spe- Chlo-Date Temper- cific ride, Date Temper- cific ride, Date Temper- cific ride,
of ature condu;- diss of sture conduc1- diss of ature condu_- disssample ('C) tance" (mg/L) sample ('c) tance- (mg/L) sample ('C) tance" (mg/L)
UDDeraquifer. Potoenac-Raritan-HagothY aquifer system--Continued.
Welt 25-112 SHORELANDSWCHAZLET2-60
02-26-1969 14.0 43 4.0 08-24-1978 13.5 69 1.4 10"12-1983 13.5 71 1.504-29-1974 13.5 56 2.7 09-13-1979 13.5 68 1.2 10-30-1984 14.0 67 1.608"30-1974 14.5 42 2.6 09"18"1980 13.5 70 1.4 09-19-1985 13.5 71 1.910"20-1976 13.5 47 2.4 09"30"1981 13.5 68 1.4 10-01-1986 14.0 7"5 1.708-31-1977 13.5 45 2.0 09-08-1982 13.5 72 1,6
Welt 25-113 HAZLETTWPBD ED 1-1970
02-26-1986 12.0 66 1.8 11-05-1986 13.5 68 1.6
Welt 25-115 HIGHLANDSBOROkl) 1-08
03-30-1953 .... 1.5 04-08-1959 .... 1.4 09-02-1964 20.5 71 1.504-08-1954 .... 2.5 09-02-1959 .... 1.6 04-05-1965 16.0 68 1.009-01-1954 .... 1.8 04-05-1960 .... 1.2 08-31-1965 19.5 154 1.504-14-1955 .... 2.0 08-31-1960 .... 1.3 04-26-1966 19.0 72 .508-30-1955 .... 1.2 04-05-1961 .... 1.3 09-07-1966 20.0 67 1.504-11-1956 .... 1.3 08-30-1961 19.5 85 1.5 03-25-1968 20.0 71 2.009-04-1956 .... 1.9 04-25-1962 20.0 67 1.6 02-26-1969 20.0 66 3.504-03-1957 .... 2.7 09-04-1962 19.5 70 1.6 03-21-1972 19.5 67 1.608-28-1957 .... 1.3 04-03-1963 19.5 73 1.8 08-29-1974 19.5 69 2.904-08-1958 .... 1.4 08-28-1963 19.5 71 1.208-26-1958 .... 1.9 04-29-1964 19.0 69 1.0
WeLt 25-116 HIGHLANDSBOROWD2-NEW
08-29-1967 20.0 96 1.5 06-01-1973 19.5 66 1.6 05-22-1975 19.5 73 3.508-27-1968 20.0 76 3.5 09-11-1973 19.5 67 1.0 08-23-1978 20.0 107 1.110-29-1970 19.5 182 3.0 1 04-29-1974 19.5 69 3.9 09-12-1979 20.0 106 .6
WeLt 25-117 HIGHLANDSBOROM) 4-73
08"03-1977 19.5 70 2.4 09"14-1982 19.5 103 1.2 10-23-1984 20.0 103 1.208"20-1980 19.5 105 1.1 1 12-01-1983 -- 102 1.2 09-18-1985 19.5 102 1.1
WeLt 25-119 HIGHLANDSBOROkO 3-T5
08-23-1978 20.0 107 1.5 1 09-12-1979 -- 107 .7 08-20-1980 20.5 108 1.3
WeLL25-154 SHORELANDSWCHOLMDL3-64
01-06-1977 13.5 45 .4 10-12-1983 13.5 84 4.1 09-19-1985 13.5 63 2.208-31-1977 14.0 41 2.8 10-30-1984 14.0 53 7.5
WeLt 25-190 KEANSBURGBOROWD 4-45
04-12-1950 .... 1.8 04-08-1959 .... 1.8 08-27-1968 14.0 49 4.208-29-1950 .... 1.6 09-02-1959 .... 1.8 02-26-1969 13.0 47 4.003-26-1951 .... 2.1 04-05-1960 .... .9 10-29-1970 13.0 48 2.508-22-1951 .... 2.0 08-51-1960 .... 1.9 03-21-1972 15.0 54 3.104-18-1952 .... 2.4 04-05-1961 .... 1.6 10-20-1976 13.5 52 3.409-04-1952 .... .9 08-30-1961 13.5 45 1.6 08-31-1977 13.5 50 2.003-30-1953 .... 1.3 04-25-1962 14.0 54 1.9 08-24-1978 13.5 81 2.009-02-1953 .... 1.3 09-04-1962 13.5 53 2.6 09-12-1979 13.5 83 1.804-08-1954 ...... 04"03-1963 14.0 51 1.7 09-18-1980 13.5 98 6.909-01-1954 .... 1.8 08-28-1963 14.0 47 1.6 09-30-1981 13.5 162 2604-13-1955 .... 1.8 04-29-1964 13.0 48 2.0 09-08-1982 13.5 300 6508"30-1955 .... 1.8 09-02-1964 14.0 55 2.0 10-12-1983 13.5 495 12004-11-1956 .... 2.1 04-05-1965 13.5 50 2.0 03-14-1984 13.5 460 12008"29-1956 .... 1.6 08"31-1965 14.0 55 2.0 09"23"1985 13.5 755 19004"03-1957 .... 2.2 04-20-1966 14.0 58 2.0 10-08-1986 13.5 800 29004-08-1958 .... 2.0 09-07-1966 14.0 52 1.008"26-1958 .... 1.6 08"29-1967 14.5 55 1.5
WeLt 25-191 KEANSBURGBOROI_D6-68
09-11-1973 14.0 47 1.5 09-18-1980 13.5 139 18 10-31-1984 14.0 -- 4410-20-1976 13.5 54 3.6 09-30-1981 14.0 139 18 09-23-1985 13.5 120 3108-31-1977 13.5 55 4.6 09-08-1982 13.5 82 2.3 02"26-1986 13.0 190 4208"23-1978 14.0 92 4.4 10-12-1983 13.5 172 26 10-08-1986 13.5 272 5909-12-1979 13.5 90 1.6 03-14-1984 13.5 222 43
82

Table 5.--Chlorideconcentrations and field measurementsof welt-water samples, 1923-86.--Continued.
SLoe- Ch[o- . SI0e- Chlo- Spa- Chlo-Date Temper- cific ride, Date Temper- cific ride, Date Temper- civic ride,
of ature condu_- diss of ature condu_- diss of ature cond - disssample ('C) tance- (mg/L) sample ('C) tance" (mg/L) sample ('C) tenc_ (mR/L)
Upper aquifer, Potomac-Raritan-HaRothy aquifer system--Continued.
Well 25-195 KEANSBURGBOROM) 5A-54
09-01-1954 15.5 49 2.5 08-29-1967 14.0 52 1.0 08-23-1978 14.0 86 4.204-13-1955 .... 5.0 08-27-1968 14.0 47 4.2 09-12-1979 14.0 83 4.808-30-1955 .... 2.0 08-30-1974 14.5 45 3.1 09-18-1980 14.0 74 1.904-11-1956 .... 1.6 10-20-1976 13.5 51 4.0 09-30-1981 13.5 73 1.708-29-1956 .... 2.8 01-07-1977 13.5 44 1.8 09-08-1982 13.5 81 4.104-03-1957 .... 2.2 08-31-1977 14.0 52 4.0 10-12-1983 14.0 75 2.1
Well 25-196 KEANSBURGB_O _ 3-42
10-20-1976 13.5 49 3.3 09-12-1979 13.5 78 1.5 10-12-1983 13.5 84 4,101-07-1977 13.5 47 2.0 09-18-1980 13.5 78 1.9 10-08-1986 13.5 77 2.708-31-1977 13.5 50 .4 09"30"1981 13.5 67 1.608-24-1978 13.5 78 1.4 09"08-1982 13.5 91 4.5
Melt 25-197 KEYPORTBOROM) 7-1976
10-20-1976 13.5 53 2.6 09-13-1979 14.0 61 1.6 09-09-1982 13.5 71 2.606-23-1978 14.0 62 1.5 09-18-1980 13.5 61 1.6 10-12-1983 . 13.5 7"5 4.508-31-1978 14.0 61 1.9 09-30-1981 13.5 62 1.7 I0-08-1986 13.5 118 15
Well 25-199 KERR GLASSCO 1964
01-05-1977 13.5 34 2.0 09-30-1981 13.5 72 1.9 02-25-1986 13.5 83 1.808-31-1978 14.0 68 1.6 09-09-1982 13.5 74 1.8 10-01-1986 13.5 78 1.909-13-1979 14.0 70 1.6 10-25-1984 14.0 74 3.209-18-1980 13,5 70 1,6 09-20-1985 13.5 83 1.7
Well 25-201 LEX LUCAS1965
04-20-1977 13.0 67 3.1
Well 25-202 KEYPORT8OROM) 5-1955
01-31-1956 .... 3.0 04-25-1962 13.5 38 2.0 08-27-1968 14.0 57 5.204-11-1956 .... 1.8 09-04-1962 14.5 44 2.4 10-29-1970 13.0 40 4.508-29-1956 .... 2.3 04-03-1963 14.5 44 2.7 03-21-197"2 13.0 39 3.204-03-1957 .... 2.1 08-28-1963 13.5 39 1.9 09-25-1972 14.5 44 1.502-27-1958 .... 1.9 04-29-1964 13.5 38 2.0 06-01-1973 13.5 48 6.704-08-1958 .... 2.2 09-02-1964 13.5 39 2.5 09-11-19T_ 13.5 50 6.707-24-1958 13.0 40 2.0 04-05-1965 13.0 40 2.0 08-30-1974 15.0 72 1108-26-1958 .... 2.0 08-31-1965 14.0 39 2.0 07-10-1975 13.5 120 2709-02-1959 .... 3.5 04-26-1966 14.0 47 1.5 10-20-1976 13.5 155 9.004-05-1960 .... 1.7 09-07-1966 14.0 48 2.0 06-23-1978 13.5 163 1308-31-1960 .... 1.8 05-24-1967 13.0 38 2.0 07-31-1981 14.0 386 9404-05-1961 .... 2.0 08-29-1967 14.0 42 2.008-30-1961 13.5 41 1.8 03-25-1968 13.0 44 2.8
Well 25-203 KEYPORTBOROWO1-1927
06-23-1978 13.5 441 100 07-30-1981 14.0 180 36
Well 25-206 KEYPORTBOROI_O4-1939
04-20-1949 .... 2.0 03-30-1953 .... 2.0 08-28-1957 .... 2.308-22-1949 .... 1.6 09-02-1953 .... 2.4 02-27-1958 .... 1.904-12-1950 .... 1.8 09-01-1954 .... .8 07-23-1958 .... 1.908-30-1950 .... 1.9 04-13-1955 .... 1,8 09-22-1958 .... 1.803-26-1951 .... 2.0 08-30-1955 .... 1.5 04-08-1959 .... 1.708-22-1951 .... 2.0 04-11-1956 .... 1.6 03-30-1977 13.0 69 7.304-17-1952 .... 2,2 08-29-1956 .... 1.8 06-22-1978 13.5 131 1609-04-1952 .... .8 04-03-1957 .... 2.6 03-07-1986 13,0 101 11
Well 25-207 KEYPORT 80ROM) 6-1970
05-22-1975 13.0 298 66 06-22-1978 13.5 155 17.0 04-18-1986 13.5 1,680 50007-10-1975 13.0 198 50 07-30-1981 13.5 158 25.0 10-20-1986 13.0 1,970 560
Melt 25-208 IMFERM-O-THERHCO1
03-31-1977 13.5 391 98 03-17-1986 13.0 7,270 2,700 10-09-1986 13.5 8,250 2,80006-28-1978 13.5 1,010 320 04-16-1986 13.0 7,350 2,500
83

Tebte 5.--Chtoride concentrations and fietd measurementsof wetl-water samples_ 1923-86.--Continued.
SLoe- Chto- spe- Chto- Spe- Chto-Date Temper- cific ride, Date Temper- cific ride, Date Temper- cific ride,of ature conduq- • diss of ature condu_- diss of ature condu_- diss
sampte ('C) tance" (mg/L) sampte (*C) tance" (n_g/L) s_te ('C) tance_ (mg/L)
Upper aquifer_ Potomec-Raritan-Magothy aquifer system--Continued.
Weft 25-210 NONCONWC-LONGBRANCH1
08-26-1958 .... 1.4 08-31-1960 .... 2.2 08-28-1963 15.5 89 1.209-02-1959 .... 1.5 08-30-1961 15.5 94 1.5 09-02-1964 16.0 80 1.5
Well 25-282 BAYBHORESEWAU 1-1976
06-12-1985 16.0 -- 46 02-27-1986 13.0 93 3.0 10-01-1986 13.5 115 12
Wetl 25-283 MATAWANBOROgo 4-1956
04-30-1985 14.5 85 3.7 09-19-1985 14.0 90 3.1
gett 25-284 MATAWANBOROgO 3-1956
10-21-1976 13.0 59 6.2 09-13-1979 12.5 78 3.2 10-23-1984 12.5 72 3.901-05-1977 12.5 55 4.4 09-18-1980 12.5 77 3.2 02-25-1986 12.5 75 3.809-01-1977 12.5 55 3.9 09-09-1982 13.0 69 3.7 10-06-1986 12.0 8/* 3.908-31-1978 12.5 7] 3.3 10-13-1983 12.5 72 3.5
gett 25-288 ABERDEENMUA-MATAWAN3
01-05-1977 13.0 38 2.3 02-25-1986 14.5 56 1.610-29-1984 13.5 55 1.7 10-06-1986 14.0 62 1.8
Welt 25-292 ABERDEEN14UA-MATAUANI
05"12-1969 13.0 36 2.8 09"19-1985 13.5 57 2.3
Weft 25-294 MATAWANBOROgO 1-1944
04-14-1950 .... 2.0 09-22-1958 .... 4.7 09-07-19_ 14.5 53 2.508-30-1950 .... 2.1 04-08-1959 .... 2.1 08-29-1967 14.5 50 2.003-26-1951 .... 2.0 09-02"1959 .... 2.1 10-29-1970 13.5 46 2.608-22-1951 .... 9.0 04-05-1960 .... 1.9 10-21-1976 14.0 71 3.304-17-1952 .... 6.5 08-03-1960 .... 2.1 09-01-1977 13.5 72 .709-04-1952 .... 1.1 04-05-1961 .... 2.1 08-31-1978 13.5 82 1.703"30-1953 .... 1.5 08-30-1961 14.0 45 2.5 09-13-1979 13.5 83 1.609-02-1953 ...... 04-25-1962 14.0 51 2.6 09"18-1980 13.0 84 1.604-08-1954 .... 7.0 09-04-1962 14.0 47 2.3 09-09-1982 13.0 89 1.809-01-1954 .... 3.5 04-03-1963 14.5 49 2.6 10-13-1983 13.0 95 1.804-13-1955 .... 2.3 08-28-1963 14.0 46 2.0 I0-23-1984 13.5 94 1.808-30-1955 .... 2.2 04-29-1964 13.5 45 2.0 09"19-1985 13.5 99 1.604"11"1956 .... 1.9 09-02-1961, 14.0 45 1.5 02-25-19_ 12.5 92 1.808-29-1956 .... 2.2 04-05-1965 13.5 44 2.0 10-06-19_ 13.0 102 2.004-03-1957 .... 2.5 08-31-1965 14.5 44 2.O08-28-1957 .... 1.9 04-26-19_ 14.0 48 2.0
Weft 25-295 MATAWANBORO gO 2-1943
10-21-1976 13.0 7O 4.3 01-04-1977 13.0 81 2.8 I0-23-1984 13.0 91 2.0
Weft 25-314 ENGRPRECISIONCASTCO
01-13-1977' 13.5 52 2.1
Well 25-317 SEACOASTPROOUCTS1
03-31-1977 15.0 72 6.3 08-23-1978 15.5 116 8.6 08-20-1980 -- 108 5.408-31-1977 15.0 80 9.3 09-12-1979 15.5 116 6.2
We[[ 25-321 HPB-SANDYHOOK4-1941
08-30-1961 15.5 167 36 08-31-1965 15.5 259 53 03-21-1972 14.5 210 4204-25-1962 15.5 237 53 04-20-1966 13.5 252 57 09-25-1972 15.5 193 1709-04-1962 15.5 209 45 09-07-1966 16.0 151 40 09-25-1972 15.5 191 3104-03-1963 15.5 234 50 08-29-1967 16.5 289 54 09-11-1973 16.5 138 1908-28-1963 15.5 220 50 03-25-1968 15.0 265 59 04-29-1974 15.5 178 2704-29-1964 14.0 161 21 08-27-1968 16.0 271 68 09-01-1977 15.5 242 4209-02-1964 15.5 258 61 04-23-1969 15.0 290 6004-05-1965 14.5 222 39 10-29-1970 15.5 945 170
84

Tabte 5.--Chtoride concentrations and fietd measurementsof welt-water samples, 1923-86.--continued.
Spe- Ch[o- Spa- Ch[o- Spa- Chlo-Date Temper- cific ride, Date Temper- cific ride, Date Ten,per- cific ride,
of ature conduq- diss of ature condu_* diss of ature condu_- disssample ('C) tance" (mg/L) sampte (*C) tance- (mg/L) sen_ole ('C) tance _ (mg/L)
Upper aquifer= Potemac-Rar tan-MaRothY aquifer system--Continued.
WeLt 25-341 MOBCOSWCAMERICAN2-59
03-27-1951 .... 1.6 04-04-1957 .... 1.6 09-04-1962 23.0 93 3.508-27-1951 .... 2.0 08-29-1957 .... 1.4 08-28-1963 22.0 92 1.304-24-1952 .... 2.0 04-08-1958 22.0 88 1.8 09-02-1964 23.0 88 2.509-05-1952 .... 2.1 08-26-1958 .... 1.5 08-31-1965 22.0 89 2.003-31-1953 .... 8.2 04-08-1959 .... 1.5 04-26-1966 22.0 97 2.509-03-1953 .... 1.8 08-29-1959 .... 1.6 09-07-1966 23.5 90 2.004-09-1954 .... 2,8 09-02-1959 .... 1.8 05-23-1967 21.0 90 1.509-02-1954 .... 1.5 04-05-1960 .... 1.2 04-23-1969 -- 91 2,704-14-1955 .... 1.5 08-31-1960 .... 1.5 03-21-1972 22.5 88 2.108-31-1955 .... 2.2 04-05-1961 .... 1.4 09-25-1972 30.0 88 1.708-31-1956 .... 1.8 08-30-1961 22.0 89 1.5 06-04-1973 23.0 88 1.9
Wett 25-343 MONCONWCLAYNE2R-56
03-25-1968 23.0 90 2.2
WeLt 25-345 NONCOBWCLAYNE3-58
04-25-1962 23.0 87 2.0 09-07-1966 22.0 90 2.0 10-29-1970 21.5 88 3.504-03-1963 22.0 98 2.2 05-24-1967 21.0 90 1.5 03-21-1972 22.0 88 2.504-29-1964 21.5 87 2.0 08-30-1967 23.0 94 2.0 09-25-1972 22.0 88 1.709-02-1964 21.5 86 1.5 03-25-1968 23.0 96 2,0 06-04-1973 22.5 87 2.304-05-1965 20.5 85 2.0 08-28-1968 23.0 94 3.004-26-1966 21.5 89 2.5 02-26-1969 22.0 93 2.0
Weft 25-358 REDBANKBOROWD1B-50
08-29-1950 .... 2.0 04-08-1959 .... 2.0 05-24-1967 16.5 63 1.503-27-1951 .... 3.1 09-02-1959 .... 1.9 03-25-1968 18.0 92 2.108-23-1951 .... 2.0 04-05-1961 .... 1.7 06-27-1968 18.0 70 3.504-24-1952 .... 2.6 08-30-1961 16.5 71 1.5 10-29-1970 16.5 65 4.009-05-1952 .... 1.7 04-25-1962 17.0 76 2.1 03-21-1972 17.0 60 1.903-30-1953 .... 2.0 09-04-1962 16.5 64 2.1 09-25-1972 17.5 61 1.709-03-1953 .... 3.1 04-03-1963 18.0 68 2.1 06-04-1973 17.0 61 2.509-01-1954 .... 9.9 08-28-1963 18.5 64 1.6 09-11-1973 17.0 61 1.504-14-1955 .... 1.5 04-29-1964 17.0 63 1.5 08-29-1974 17.0 64 3.008-30-1955 .... 2.0 09-02-1964 17.0 60 2.0 08-03-1977 17.0 79 7.204-12-1956 .... 1.9 04"05-1965 17.0 63 2.0 08"22-1978 17.0 106 1.609"04-1956 .... 2.1 08"31-1965 18.0 63 2.0 08-01-1979 17.0 105 1.408"28-1957 -- "" 2.3 04"26-1966 16.5 68 1.0 08"20"1980 17.0 104 1.504-08-1958 -- 70 1.6 09-07-1966 17.0 65 1.0 10-29-1984 17.5 -- 1.7
Wett 25-360 REDBANKBOROM) 4-75
08-22-1978 16.5 107 1.5 05-09-1985 17.0 103 2.1
Watt 25-419 UNION BEACHBQROWD1-62
04-03-1963 14.0 44 2.3 08-29-1967 13.5 87 2.0 07-10-1975 13.5 343 9908-28-1963 14.0 41 1.6 08-27-1968 14.0 44 5.5 10-21-1976 13.0 716 19004-29-1964 13.0 40 2.0 10-29-1970 13.0 46 5.0 01-06-1977 13.0 1,000 20009-02-1964 13.5 42 2.5 09-25-1972 14.5 116 11 03-30-1977 13.5 842 22004-05-1965 13.5 43 2.0 06-01-1973 14.0 67 13 04-20-1977 13.0 843 23008-31-1965 14.0 44 2.0 09-11-1973 13.5 215 36 08-15-1977 13.0 1,040 26004-20-1966 13.5 42 .5 08-30-1974 14.0 371 68 09-01-1977 13.5 1,020 25009-07-1966 13.5 44 1.0 05-22-1975 13.5 534 120 04-22-1986 13.5 4,000 1,300
Weir 25-420 UNION BEACHBOROt_) 2-69
09-25-1972 14.0 55 3.5 10-24-1979 13.0 950 03-04-1986 13.0 6,150 2,10008-30-1974 13.5 119 22 10-01-1981 13.5 4,400 1,400 04-22-19862 13.0 6,000 2,10010-21-1976 -- 1,410 400 09-14-1982 13.0 4,550 1,600 04-25-1986 13.5 5,860 1,80003-30-1977 13.5 2,390 660 10-13-1983 13.5 5,500 1,700 10-09-1986 13.5 6,750 2,30008-24-1978 13.5 3,100 440 10-24-1984 13.0 6,000 2,300
85

Table 5.--Chloride concentrations and field measurementsof welt-water samples, 1923-86.--Continued.
Spe- Chlo- Spe- Chlo- Spe- Chlo-Date Temper- cific ride, Date Temper- cific ride, Date Temper- cif|c ride,
of ature conduq- diss of ature condu_- diss of ature condu_- disssample ('C) tance" (mg/L) sample ('C) tance" (mg/L) sample ('C) tance" (mg/L)
Upper aquifer+ Potomac-Raritan-MaRothY aquifer system--Continued.
Welt 25-421 UNIONBEACHBORO_0 1-27
04-20-1949 .... 2.2 09-03-1953 .... 1.1 04-08-1958 .... 1.708-23-1949 .... 1.8 04-08-1954 .... 3.5 08-26-1958 .... 1.804-12-1950 .... 1,8 09-01-1954 .... 1.9 04-08-1959 .... 1.908-30-1950 .... 1.6 04-13-1955 .... 2.0 09-02-1959 .... 1.903-23-1951 .... 2.2 08-30-1955 .... 2.0 08-31-1960 .... 1.708-22-1951 .... 1.8 04-11-1956 .... 5.6 08-30-1961 13.0 44 1.704-18-1952 .... 2.5 08-29-1956 .... 2.0 04-25-1962 13.5 78 2.309-04-1952 .... .7 04-03-1957 .... 2.2 09-04-1962 13.5 41 2.103-30-1953 .... 1.6 08-28-1957 .... 3.2
Well 25-423 ZNT FLAVORFRAG1-1951
10-20-1976 13.5 47 2.3 09-19-1980 13.5 65 1.6 09-20-1985 13.5 68 2.001-06-1977 13.5 45 2.8 10-01-1981 13.5 63 1.8 04-01-1986 13.5 61 1.609-01-1977 13.5 45 1.0 09-08-1982 13.5 62 1.7 10-09-1986 13.5 67 1.908-31-1978 13.5 65 1.6 10-13-1983 14.0 65 1.609-13-1979 13.5 67 1.3 10-31-1984 14.0 61 1.7
Well 25-424 INT FLAVORFRAG2-1955
10-20-1976 14.0 45 3.3 08-31-1976 14.0 68 2.2 10-01-1981 14.0 60 1.601-06-1977 13.0 44 2.2 09-13-1979 -- 66 1.4 09-08-1982 13.5 63 1.609-01-1977 14.0 45 .2 09-19-1980 -- 66 1.6
Welt 25-456 LNT FLAVORFRAG3-1976
09-13-1979 13.5 67 1.3 09-08-1982 13.5 64 1.6 09-20-1985 14.0 52 1.610-01-1981 13.5 65 2.2 10-13-1983 -- 52 1.5
Well 25-462 KEANSBURGAMUSEMENTPK 1
09-22-1978 13.5 130 18 10-01-1981 13.5 200 38 08-07-1985 13.5 215 4509-13-1979 13.5 139 20 09-20-1982 13.0 163 28
Well 25-496 ATL HIGHLANDSBORO_,_ 4
08-20-1980 16.5 100 1.2 12-01-1983 16.0 100 1.2 02-25-1986 15.5 95 1.509-14-1982 16.5 106 1.3 10-29-1984 17.0 96 1.3 10-08-1986 16.5 99 1.4
Well 25-498 SAYSHORESEWAU 2
09-22-1978 14.0 35 1.9 10-01-1981 -- 170 3.0
Welt 25-513 ATL HIGHLANDSBOROWD5
09-14-1982 16.5 97 1.5 09-18-1985 16,5 101 1.6
Well 25-514 INT FLAVORFRAG2R-1983
10-13-1983 14.0 63 1,5 09-20-1985 13.5 66 1.610-31-1984 15.0 49 1.6 10-09-1986 13.5 72 1.9
Well 25-568 USGSJCPL-UNIONBEACH-86
04-15-1986 13.5 6,000 2,000 10-30-1986 13.5 6,700 2,300
86

Table 5.--Chloride concentrations and field measurementsof welt-water samples, 1923-86.--Continued.
Spe- Chlo- Spe- Chto- Bpe- Chto-Date Temper- cific ride, Date Temper- cific ride, Dote Temper- cific ride,o, atureoondu-diaa o, etore dise of atore disa
sempte ('C) tance" (mg/L) sample ('C) t_ (mg/L) sampte ('C) tonce 1 (mg/L)
Middle aquifer, Potemac-Raritan-Magoth Y aquifer system
Welt 23-80 HERBERTBANDRANNEYWELL
04-17-1985 11.5 168 22 03-10-1986 12.5 177 21 10-28-1986 16.0 155 17
Wet[ 23-127 DUEERNALUC AF-1945
07-25-1958 .... 2.5 06-06-1969 15.0 57 2.4
Well 23-146 OLD BRIDGEHUABRN3-66
07-31-1969 15.0 37 1.3 05-01-1985 15.5 48 2.6 09-26-1985 14.0 48 2.5
Welt 23-194 PERTHAHHOY_O RUNYON1
07-18-1923 .... 3.0 04-15-1933 .... 3.0
Well 23-196 PERTHAHBOYWO1A-1968
06-13-1969 13.0 50 3.3 08-27-1974 12.5 54 4.7 08-18-1982 12.0 183 3703-10-1970 12.0 61 8.0 04-06-197'7 12.0 62 4.8 05-25-1983 13.5 565 15003-16-197'2 12.5 57 4.3 08-18-1977 12.5 61 6.3 09-09-1963 -- 127 2109-27-1972 12.5 50 5.5 08-21-1978 12.5 67 2.9 09-20-1985 12.5 475 12009-14-19T3 12.5 50 3.0 09-20-1979 12.5 66 4.2 03-04-1986 12.0 597 14004-25-1974 13.0 55 4.1 09-23-1981 12.5 168 32 10-07-1986 12.0 673 44
Weir 23-197 PERTHAJ48DYWO2-1944
09-13-1957 .... 2.9 04-28-1964 11.5 51 2.5 06-03-1975 12.0 126 2802-27-1958 .... 2.8 08-25-1964 13.0 51 2.5 04-06-1977 12.0 88 9.007-23-1958 .... 2.5 04-20-1965 12.0 52 2.5 07-06-1977 12.5 233 4909-23-1958 .... 3.2 08-20-1965 13.0 52 2.5 08-18-1977 12.5 201 4204-14-1959 .... 2.7 04-19-1966 11.5 53 2.5 08-21-1978 12.0 87 6.004-07-1960 .... 2.6 09-22-1966 12.0 58 3.0 09-20-1979 12.5 158 2703-20-1961 2.5 03-20-1969 -- 59 6.0 09-23-1981 12.5 248 5408-21-1961 ii.5 56 3.1 10-30-1970 12.0 71 10 08-18-1982 12.0 171 7,804-30-1962 12.0 52 2.4 03-16-1972 12.5 83 13 05-25-1983 12.0 85 7.009-17-1962 11.5 53 2.2 09-27-1972 12.0 87 16 09-09-1983 12.5 318 7404-18-1963 12.0 57 2.5 05-31-1973 12.5 88 16 10-17-1984 12.5 %080 29008-28-1963 12.0 52 2.4 09-14-1973 12.0 93 16
Welt 23-206 OLDBRIDGETIJPMUA-LH2
04-12-1956 13.5 53 2.0 04-18-1966 13.5 50 2.5 09-19-1980 13.5 59 1.908-22-1961 12.0 55 2.9 09-22-1966 13.5 49 2.0 08-31-1982 12.5 61 6.005-01-1962 12.0 39 2.4 07-31-1969 15.0 44 3.0 08-31-1982 13.0 63 2.109-18-1962 13.0 47 2.2 10-29-1970 13.5 46 3.0 12-02-1983 13.0 63 2.204-01-1963 12.0 33 3.2 03"17-1972 13.5 57 2.8 10-24-1984 20.0 103 2.208-28-1963 14.0 44 2.0 09-27-1972 13.5 46 3.7 09-26-1985 13.5 63 1.904-27-1964 13.5 47 2.0 09-14-1973 13.5 42 1.9 02-27"1986 13.0 60 2.008-24-1964 15.0 50 2.0 08-27-1974 13.5 41 2.4 10-02-1986 13.0 65 2.204-19-1965 13.0 48 2.0 08-18-1977 13.5 49 3.308-19"1965 14.0 52 2.0 08-22-1978 -- 63 1.9
Well 23-234 JAHEB8URGBOYSH(_E 3
07-07-1942 .... 2.0 09-18-1962 14.0 41 2.3 09-23-1966 14.0 47 2.009-09-1957 .... 1.6 04-02-1963 13.0 43 2.1 03-19-1969 -- 39 3.007-24-1958 .... 1,9 08-28-1963 15.0 43 3.0 03-09"1970 -- 41 2.009-22-1958 .... 2.4 04-28-1964 14.0 44 2.5 10-30-1970 13.5 37 3.004-14-1959 .... 2.0 08-25-1964 14.5 44 2.5 09-14-1975 13.5 40 2.003"21-1961 .... 2.5 04-20-1965 14.0 45 2.0 08-27-1974 13.5 42 2.608-22-1961 14.0 41 2.4 08-19-1965 14.5 42 2.005-01-1962 13.5 42 2.3 04-19-1966 -- 41 2.0
Welt 23-236 JAMESBURGBOYSHOME4
03-17-1972 12.5 41 2.6 04-25-1974 14.0 43 2.5 08-21-1978 -- 44 2.0
87

Table 5.--Chloride concentrations end field measurementsof well-water samples, 1923-86.--Continued.
Spa- Chlo- Spa- Chto- SLoe- Chlo-Date Temper- cific ride, Date Temper- cific ride, Date Temper- cific ride,
of ature conduq- diss of ature condu - diss of ature tence_COndu- disssample ('C) tance= (mg/L) sample ('C) tanc__ sample(mg/L) ('C) (mg/L)
Middle aquifer, Potomc-Raritan-Masothy aquifer system--continued.
Well 23-251 RARITANSTEELCO11 1944
09-12-1957 .... 66 04-30-1962 13.5 1,070 120 09-22-1966 19.0 548 4004-18-1958 .... 40 09-17-1962 14.0 1,000 100 03-18-1969 -- 1,040 11011-06-1958 .... 85 04-01-1963 14.0 1,050 98 03-08-1970 14.0 1,030 11004-13-1959 .... 59 08-27-1963 15.0 984 86 09-25-1972 14.0 802 5308-31-1959 .... 98 04-27-1964 15.5 743 52 05-31-1973 14.0 906 9004-07-1960 .... 78 08-24-1964 17.0 856 78 09-13-1973 14.0 908 7808-29-1960 .... 89 04-19-1965 15.0 856 64 08-26-1974 13.5 860 7203-20-1961 .... 110 08-19-1965 16.5 853 64 06-03-1975 12.5 945 7208-21-1961 14.0 989 100 04-18-1966 14.5 877 75
We[[ 23-252 RARITANSTEELCO18 1926
04-28-1942 .... 85 08-29-1960 .... 50 04-27-1964 14.5 878 5409-12-1957 .... 90 03-20-1961 .... 60 08-24-1964 15.5 777 3404-18-1958 .... 96 08-21-1961 14.0 843 64 04-19-1965 -- 733 3411-06-1958 .... 50 04-30-1962 14.0 907 68 08-19-1965 16.5 719 3504-13-1959 .... 54 09-17-1962 14.0 955 74 09-22-1966 15.5 911 4908-31-1959 .... 54 04-01-1963 14.5 866 3604-07-1960 .... 35 08-27-1963 15.0 789 34
WeLt 23-253 RARITANSTEELCO 16A-57
09-12-1957 .... 45 04-30-1962 13.5 1,090 140 09-22-1966 14.5 591 2604-18-1958 .... 41 09-17-1962 14.0 1,010 110 03-18-1969 -- 652 3811-06-1958 .... 41 04-01-1963 13.5 993 84 07-23"1969 16.0 576 2804-13-1959 .... 64 00-27-1963 16.0 1,000 110 03"08-1970 14.0 640 3608-31-1959 .... 44 04-27-1964 14.5 878 84 09"25-1972 14.5 744 5204-07-1960 .... 44 08-24-1964 16.0 871 81 09-13-1973 14.0 9<71 10008"29-1960 .... 64 04-19-1965 14.0 660 29 04-25-1974 14.0 963 9503-20-1961 .... 63 08-19-1965 15.5 658 30 08-26"1974 14.0 970 9108-21-1961 14.0 948 100 04-18-1966 13.5 685 29 06-03-1975 14.0 1,130 140
Welt 23-255 CARSORUNDUMCO1-1955
09-12-1957 .... 4.7 08-27-1963 14.0 220 5.8 08-26-1974 13.0 298 1404-18-1958 .... 4.9 04-27-1964 14.0 223 6.5 11-16-1976 13.0 292 1311-06-1958 .... 4.2 08-24-1964 14.0 223 5.5 09-29-1977 13.0 298 1204-13-1959 .... 4.8 04-19-1965 13,0 223 5.5 08-23-1978 -- 310 1008-31-1959 .... 4.7 08-19-1965 15.0 233 6.5 10-25-1979 13.0 286 1104-07-1960 .... 4.4 04-18-1966 13.0 244 11 09-02-1982 15.0 275 7.008-29-1960 .... 6.7 09-22-1966 13.5 254 11 09-15-1983 13.5 280 7.203-20-1961 .... 5.7 03-18-1969 -- 304 15 10-26-1984 13.5 280 7.708-21-1961 12.0 211 5.4 07-24-1969 14.0 206 18 06-12-1985 13.5 290 8.204-30-1962 13.5 218 5.3 05-08-1970 13.0 280 17 04-01-1986 14.0 283 9.709-17-1962 13.5 225 4.9 03-15-1972 13.0 286 15 11-05-1986 13.5 299 1104-01-1963 13.5 232 4.9 09-25-1972 13.0 316 18
Well 23-261 CHEVRONOIL CO 1-1951
08-23-1978 -- 400 14
_eil 23-263 CHEVRONOIL CO2-1950
03-13-1951 11.5 291 6.6 09-17-1962 13.5 225 7.0 03-08-1970 13.0 280 8.008-21-1951 .... 9.0 04-01-1963 12.0 254 7.8 03-15-1972 12.0 343 9.309-12-1957 .... 5.8 08-27-1963 13.5 227 7.2 09-25-1972 13.0 358 1104-17-1958 .... 6.4 04-27-1964 13.5 221 7.5 09-13-1973 13.0 320 8.011-06-1958 .... 6.7 08-24-1964 13.0 224 8.0 08-26-1974 13.0 275 8.284-13-1959 .... 6,9 04-19-1965 12.0 223 7.5 11-16-1976 12.5 308 8.708-31-1959 .... 6.8 08-19-1965 13.5 224 8.0 09-29-1977 13.0 362 9.204-07-1960 .... 6.6 84-18-1966 13.5 225 8,0 08-23-1978 -- 350 7.503-20-1961 .... 6.9 09-22-1966 13.5 258 8,0 10-25-1979 13.0 325 8.308-21-1961 12.0 209 6.5 03-18-1969 -- 283 8.0 09-01-1982 -- 295 7.704-30-1962 12.0 216 6.8 07-22-1969 14.0 279 8.6
Well 23-264 CHEVRONOIL CO095 2
11-02-1984 13.0 293 7.4 10-22-1986 13.5 326 34
Welt 25-266 CHEVRONOIL CO3-1951
04-16-1985 13.5 289 8.9 03-17-1986 13.0 318 58 10-22-1986 13.0 245 9.3
88

TabLe 5.--ChLoride concentrations end field measurementsof weLl-water samples, 1923-86.--Continued.
Spe- Chto- Spe- ChLo- Spe- Chto-Date Temper- cific ride, Date Temper- cif|c ride, Date Temper- cif|c ride,
of eture condu;- diss of eture condu¢,- diss of eture conduf- disssample ('C) tahoe- (mg/L) sample ('C) tance" (mg/L) s_pte ('C) tence" (lAg/L)
Hiddte aquifer, Potomac-Reritan-Ma.qothy aquifer system--Continued.
WeLt 23-270 AMERCYANAMIDCOTEST 2
05-29-1986 15.0 11,100 5,200
WeLt 23-300 BASE-WYANDOTTE2 1966
06-05-1969 16.0 80 12 06-05-1970 16.5 80 12;0 07-18-1985 12.0 121 18
WeLL23-332 AHMED,MUSTAPHA2-1958
06-24-1985 13.5 360 89.0
WeLL23-352 SAYREVILLEBORO_) M-67
09-30-1977 12.0 391 100 09-08-1983 -- 1,860 520 09-30-1986 15.0 2,450 78008-21-1978 -- 550 140 04-22-1985 13.5 240 3209-26-1979 12.0 690 190 09-20-1985 13.5 3,180 960
WeLL23-364 SAYREVILLEBOROWD3-37
05-29-1958 .... 4.0 03-21-1961 -- 9.0 04-28-1964 13.0 55 4.007-30-1958 .... 3.9 08-22-1961 12.0 169 21 08-25-1964 13.0 53 4.505-05-1959 .... 4.3 05"01" 1962 11.5 2,830 800 04-20-1965 11.5 55 4.009-01-1959 .... 3.4 09"18"1962 12.0 136 19 08-20-1965 12.0 52 4.004-08-1960 .... 5.3 04-01-1963 8.5 182 18 09-23-1966 13.0 66 5.007-15-1960 .... 4.1 04"02-1963 11.0 82 7.1 03-20-1969 -- 36 4.008-30-1960 .... 3.3 08-28-1963 13.0 61 5.1
Wett 23-365 DUHERNALSAYER40BS-31
09-28-1983 13.5 6,000 1,700 03-10-1986 13.5 6,000 1,80011-02-1984 12.5 5,500 1,900 10-27-1986 13.0 5,550 1,800
WeLL23-370 HERCULESIHC. 6-1946
09-14-1983 -- 3,350 1,100
WeLt 23-371 HERCULESINC. 5-1929
03-17-1972 12.5 1,280 330 09-23-1981 12.5 6,400 2,000 09-26-1985 -- 8,700 2,90007-06-1977 -- 4,180 950 09-14-1983 -- 7,200 2,200 03-04-1986 12.5 8,200 2,70007-07-1978 12.0 3,830 1,100 10-25-1984 14.0 8,000 2,500 10-07-1986 13.5 8,200 2,800
WeLL23-376 HERCULESINC. 3-1928
06-16-1957 .... +9.6 07-07-1978 12.5 3,200 910 09-26-1985 8,600 2,90011-24-1957 .... 11 09-23-1981 -- 4,900 1,500 03-04-1986 i2.0 5,900 2,10003-17-1972 12.5 2,520 570 09-14-1983 -- 5,200 2,000 10-07-1986 12.5 6,700 2,30007-06-1977 -- 3,550 850 10-25-1984 12.5 6,750 2,100
WeLL23-380 HERCULESXNC.2-1927
10-07-1942 .... 3.2 07-06-1977 -- 1,890 370 10-25-1984 14.0 975 26011-24-1955 .... 14 07-07-1978 13.5 1,200 300 09- 26-1985 -- 1,270 35006-16-1957 .... 11 09-23-1981 13.5 820 190 03-04-1986 13.5 1,300 35003-17-1972 13.0 2,250 480 09-14-1983 -- 730 170
WeLt 23-384 HERCULESINC. 1R-1939
03-17-1972 14.0 1,420 320 09- 23-1981 14.0 670 150 09-26-1985 14.0 890 25007-_- 1977 -- 1,050 200 09-14-1983 -- 800 190 03-04-1986 13.0 910 23007-07-1978 -- 735 170 10-25-1984 14.5 845 210 10-07-1986 13.5 1,070 290
WeLt 23-386 E! DUPONT-PARL!N6-1930
I0"04-1942 .... 2.1 04-30-1963 -- 45 2.2 03"15-1972 12.0 44 4.507-29-1958 .... 8.9 08"28-1965 13.0 40 1.9 09"27-1972 12.0 40 3.809-16-1958 .... 6.2 04-28- 1964 12.0 45 2.5 09-14-19TJ 12.0 39 2.305-05-1959 .... 2.0 08-25-1964 13.5 42 2.5 08-27-1974 12.0 41 4.209-01-1959 .... 2.0 04-20-1965 11.5 41 2.5 09-30-1977 12.0 45 1.104-08-1960 .... 2.0 08+24"1965 -" 42 2.5 09-26-1979 12.5 67 3.508-30-1960 .... 1.9 04-19-1966 13.0 57 4.0 09-22-1981 12.0 81 6.103-21-1961 .... 2.1 09-18-1966 -- 75 5.0 08"19-1982 12.5 97 7.808-22-1961 11.5 38 2.5 03-19-1969 -- 39 3.0 09-09-1983 12.0 100 7.605"01"1962 11.5 39 2.0 03"09"1970 12.0 55 5.0 10-15-1984 13.0 130 1009-16-1962 -- 42 2.0 10"50-1970 12.0 38 6.0
89

Table 5.--Chtoride concentrations and fietd measurementsof weft-water sarmles. 1923-86.--Contirtued.
sloe- Chto- Spa- Ohio- Sloe- Chlo-Date Temper- cific ride, Date Temper- cific ride, Date Temper- cific ride,
of ature condu_- diss of ature condu_* diss of ature conduQ- disssample ('c) tance- (mg/L) sampte ('C) tance- (mg/L) sample ('0) tance" (mg/L)
Middle aquifer_ Potomac-Raritan+MaAothY aquifer system--Cocttinued.
Net[ 23-389 El DUPONT-PARLIN5-1928
04-14-1933 .... 3.0 05-01-1962 11,5 42 2.2 10-30-1970 12.5 40 5.210-04-1942 .... 2.1 09-16-1962 -- 45 1.9 03-15-1972 12.5 45 4.003-04-1958 .... 11 04-30-1963 -- 47 2.3 09-27-1972 12.0 42 4.107-29-1958 .... 2.0 08-28-1963 13.5 206 11 09-14-1973 12.0 41 2.209-16-1958 .... 2.2 04-28-1964 13,0 53 3.0 08-27-1974 12.0 43 2.005-05-1959 .... 1.9 08-25-1964 15.0 41 2.0 09-30-1977 13.5 208 1709-01-1959 .... 2.2 04-20-1965 12.0 99 6.0 09-26-1979 12.5 63 3.804-08-1960 .... 1.9 08-24-1965 -- 40 2.0 09-22-1981 12.5 86 8.808-30-1960 .... 2.0 04-19-1966 13.5 43 2.0 08-19-1982 12.5 97 1303-21-1961 .... 2.2 09-18-1966 -- 44 3.0 09-09-1983 12.5 127 1908-22-1961 13.0 44 2.6 03-09-1970 12.0 -- 3.5 10-15-1984 13.0 170 25
Nett 23-392 EI DUPONT-PARLIN1-1924
10-04-1942 .... 2.1 04-30-1963 -- 54 2.3 03-15-1972 12.5 50 4.807-29-1958 .... 2.1 08-28-1963 13.0 43 1.9 09-27-1972 12.5 43 5.209-16-1958 .... 2.2 04-20-1964 13.0 42 2.0 09-14-1973 12.5 43 2.405-05-1959 .... 2.8 00-25-1964 13.0 45 2.0 08-27-1974 12.5 45 2.209-01-1959 .... 2.3 04-20-1965 12.0 44 2.0 04-06-1977 12.5 74 6.004-08-1960 .... 2.0 08-24-1965 -- 68 2.0 09-30-1977 13.0 64 7.508-30-1960 .... 2.1 04-19-1966 13.5 43 2.5 09-26-1979 13.0 120 1603-21-1961 .... 2.8 09-18-1966 -- 44 2.0 09-22-1981 13.5 216 4508-22-1961 11.5 42 2.6 03-19-1969 -- 52 3.0 08-19-1982 13.0 259 5305-01-1962 12.0 41 2.2 03-09-1970 12.5 55 4.0 09-09-1983 13.3 340 8009-16-1962 -- 45 2.1 10-30-1970 12.5 41 5.2 10-15-1984 13.0 345 76
Nett 23-393 El DUPONT-PARLIN3-1925
10-01-1942 .... 2.0 05-01-1962 12.0 44 2.4 10-30-1970 -- 48 6.411-24-1957 .... 2,3 09-16-1962 -- 45 2.4 03-15-1972 13.5 52 5.303-04-1958 .... 2.4 04-30-1963 -- 50 2.5 09-27-1972 13.0 54 7.107-29-1958 .... 2.4 08-28-1963 13.5 45 2.2 09-14-1973 13.0 70 8.109-16-1958 .... 2.6 04-28-1964 13.0 50 3.0 08-27-1974 13.0 61 7.005-05-1959 .... 2.6 08-25-1964 13.5 45 3.0 09-30-1977 13.0 357 4709-01-1959 .... 2.5 04-20-1965 11.5 44 3.0 09-26-1979 13.5 298 6004-08-1960 .... 2.5 08-24-1965 46 3.0 09-22-1981 13.5 460 9608-30-1960 .... 2.3 04-19-1966 i2.0 45 3.0 08-19-1982 13.5 620 15003"21-1961 .... 2.3 09"18-1966 -- 46 3.0 09-09-1983 13.5 1,000 24008-22-1961 11.5 42 2.3 03"09-1970 12.0 -- 3.5 10-15-1984 13.5 1,070 270
Nell 23-401 SAYREVILLEBORO _ P-67
03-17-1972 13.0 58 2.9 08-21-1978 12.5 60 2.0 10-16-198/* 13.0 62 2.909-30-19_ 12.5 47 2.2 09-26-1979 12.5 61 2.1 09-20-1985 -- 140 13
Nell 23-411 SOUTHAHBOYCITY _D 8-47
04-12-1950 .... 2.5 04-13-1959 .... 2.5 09-22-1966 13.5 49 3.004-14-1950 -- 45 2.5 08-31-1959 .... 2.2 03-18-1969 -- 45 3.008-29-1950 .... 2.1 04-07-1960 .... 2,0 06-13-1969 13.0 43 1.903-26-1951 .... 2.4 08-29-1960 .... 1.9 03-09-1970 13.0 60 3.008-22-1951 .... 2.5 03-20-1961 -- 2.2 10-29-1970 13.0 42 1.804-17-1952 .... 2.2 08-21-1961 i3.0 49 2.2 03-16-1972 13.0 57 2.709-02-1953 .... 4.4 04-30-1962 13.0 44 2.2 09-25-1972 12.5 111 1209-01-1954 .... 2.1 09-17-1962 13.5 46 2.2 04-25-1974 13.0 55 3.108-20-1955 .... 2.2 04-01-1963 13.0 50 2,2 06-03-1975 13.0 57 4.008-29-1956 -: -- 2.1 08-27-1963 13.5 44 2,1 11-16-1976 13.0 55 4.204-03-1957 .... 2.6 04-27-1964 14.0 47 3.0 09-14-1983 -- 70 4.708-28-1957 .... 2.4 08-24-1964 15.0 46 2.5 10-12-1984 13.0 70 4.802-27-1958 .... 2,0 04-19-1965 13.5 46 2.5 03-04-1986 13.0 68 4.907-23-1958 .... 2.1 08-19-1965 13.5 44 2.5 10-02-1986 13.5 75 5.409-22-1958 .... 3.1 04"18-1966 13.0 46 2.5
9O

Table 5.--Chloride concentrations and field measurementsof well-water samples. 1923-86,--Continued.
Spe- Ohio- Spe- Chto- SLoe- Chlo-Date Temper- cific ride, Date Temper- ciflc ride, Date Te_oer- cific ride,
of ature condu;- diss of ature condu_- dies of ature condu;- diessample . ('C) tance= (mg/L) sample ('C) tance" (mg/L) sample ('C) tart:e" (mg/L)
Middle aquifer, Potomac-Raritan-MaRothY aquifer system--Continued.
Welt 23-415 NL INDUSTRIES4-1952
10-03-1957 .... 2.9 09-16-1962 -- 45 2.1 03-09-1970 12.0 85 8.002-28-1958 .... 2.5 04-30-1963 -- 45 2.2 03-16-1972 12.5 50 3.407-23-1958 .... 2.5 08-Z7-1963 12.0 47 2.9 09-25-1972 12.0 67 3.609-24-1958 .... 2.4 04-28-1964 12.0 55 2.5 08-26-1974 12.0 64 2.104-14-1959 .... 3.1 08-24-1964 13.0 47 3.0 06-03-1973 12.0 51 4.809-01-1959 .... 2.3 04-19-1965 11.5 51 2.0 04-06-1977 11.5 86 6.704-07-1960 .... 1.9 08-24-1965 -- 59 2.0 08-22-1978 -- 87 2.908"30-1960 .... 2.0 04-24-1966 12.0 50 2.5 10-24-1979 12.0 80 2.803-21-1961 -- 2.1 09-20-1966 -- 47 2.0 09-01-1982 12.0 73 2.508-22-1961 11.5 54 2.4 03-19-1969 -- 48 6.005-01-1962 12.0 56 2.4 07-17-1969 14.0 56 3.3
Weir 23-418 NL INDUSTRIES3-1934
09-10-1942 .... 2.2 05-01-1962 11.5 44 2.3 07"17-1969 15.0 66 2.610-03-1957 .... 2.4 09"16-1962 -- 45 2.1 03-09-197D 12.0 60 3.002-28-1958 .... 2.1 04-30-1963 -- 47 2.1 03-16-1972 12.0 50 2.707-23-1958 .... 2.1 08"27-1963 15.0 42 2.2 09-25-1972 12.0 76 6.309"24-1958 .... 2.1 04-23-1964 13.0 50 2.5 04-25-1974 12.5 52 3.0D4-14-1959 .... 2.5 08-24-1964 16.0 43 2.0 00-26-1974 12.5 54 2.6D9-01-1959 .... 2.5 04-19-1965 12.0 43 2.0 06-03-1973 12.0 17G 8.904-07-1960 .... 2.1 08-24-1965 -- 43 2.0 0-4-06-1977 12.0 122 7.608-20-1960 .... 2.0 04-18-1966 12.0 45 2.8 08-22-1978 -- 320 1803-21_1961 .... 3.0 09-20-1966 -- 46 2.5 10-24-1979 12.0 710 5508-22-1961 11.5 46 2.8 03-19-1969 -- 66 4.0
Well 23-419 NL INDUSTRIES2-1934
09-10-1942 .... 2.2 03-21-1961 .... 4.2 08-24-1965 -- 206 6.010-03-1957 .... 2.3 08-22-1961 11.5 173 7.5 04-18-1966 12.0 385 8.002-28-1958 .... 2.9 05-01-1962 12.0 92 4.7 09-20-1966 -- 311 1207-23-1958 .... 2.9 09-16-1962 -- 82 3.8 03-19-1969 -- 1,180 7009-24-1958 .... 2.8 04-30-1963 -- 80 3.8 07-17-1969 15.0 1,000 3504-14-1959 .... 3.3 08-27-1963 12.0 56 3.4 03-09-1970 12.0 950 6509-01-1959 .... 3.4 04-28-1964 13.0 95 5.5 03-16-1972 12.5 1,760 12004-07-1960 .... 3.4 08-24-1964 13.5 124 5.5 09-25-1972 12.0 2,360 10008-30-1960 .... 4.1 04-19-1965 12.0 168 5.5
Well 23-425 EI DUPONT-PARLIN60F-66
03-09-1970 15.5 370 80 04-25-1974 15.5 610 140 08-19-1982 15.5 4,050 1,20010-30-1970 16.0 490 70 08-27-1974 15.5 587 130 09-09-1983 15.5 4,020 1,20003-15-1972 17.0 373 55 04-06-1977 15.0 1,930 540 10-17-1984 16.5 3,780 1,30009-27-1972 16.0 253 55 09-30-1977 15.5 2,410 680 09-25-1985 15.5 4,250 1,30005-31-1973 15.5 544 130 09-26-1979 15.5 3,020 75009-14-1973 15.5 622 140 09-22-1981 15.5 4,000 1,300
Well 23-428 JERSEYCENTP&L-WERNER5
09-13-1957 .... 27 03-20-1961 -- 52 04-19-1965 13.0 244 5002-27-1958 .... 28 08-21-1961 13.0 296 67 08-19-1965 13.5 279 7107-23-1958 .... 9.5 04"30"1962 13.0 52 3.4 04-18-1966 13.5 633 20009-22-1958 .... 2.8 09-17-1962 13.5 193 49 09-22-1906 14.5 420 19004-15-1959 .... 2.6 04-01-1963 13.0 56 4.2 03-18-1969 -- 358 10008-31-1959 .... 8.0 08-27-1963 16.5 66 8.4 03-09-1970 13.0 37304-07-1960 .... 22 04-27-1964 13.5 189 45 03-15-1972 13.5 1,050 19008-29-1960 .... 59 08-24-1964 13.5 390 86,
Well 23-429 JERSEYCENTP&L-WERNER6
03-09-1970 13.5 100 24 05-31-1973 14.0 567 110 08-26-1974 13.5 44503-15-1972 13.5 68 9.6 09-13-1973 14.0 501 13009-25-1972 13.5 317 16 04-25-1974 14.0 516 120
Well 23-430 JERSEYCENTP&L-WERNER7
11-16-1976 13.0 1,340 380 09-24-1981 13.5 3,000 900 10-30-1984 14.0 3,200 1,10009-29-1977 13.5 2,800 710 08-31-1982 13.5 3,300 920 03-03-1966 13.0 4,070 1,40008-22-1978 -- 2,500 630 09-15-1983 13.5 3,700 1,100 10-08-1986 13.5 4,000 1,300
9I

Table 5.--Chloride concentrations and field measurementsof well-water samples, 1923-86.--Continued.
spe- Chto- SI0e- Chto- Spa- Chto-Date Temper- cific ride, Date Temper- cific ride, Date Temper- cific ride,of ature conduq- diss of ature condu_c,- diss of ature condu_- diss
sampte ('C) tance* (mg/L) sampte ('C) tance" (mg/L) sample ('C) tance- (mg/L)
MiddLe aquifer, Potomac-Raritan-MaRothY aquifer system--Continued.
Weft 23-431 JERSEYCENTP&L-WERNER4
09-13-1957 .... 52 04-07-1960 .... 47 04-01-1963 13.5 303 5402- 27-1958 .... 44 08- 29-1960 .... 40 08- 27-1963 14.5 293 5507-23-1958 .... 39 03-20-1961 .... 44 04-19-1965 13.5 315 5609-22-1958 .... 36 08-21-1961 13.0 218 44 08-19-1965 14.5 342 5804-13-1959 .... 42 04-30-1962 13.0 313 57 04-18-1966 14.0 180 3708-31-1959 .... 55 09-17-1962 13.5 275 49 09-22-1966 14.0 161 32
Wet( 23-432 SOUTHRIVER 80RO_JO4-75
08-18-1977 12.5 55 6.1 08-21-1978 13.5 62 5.9 09-20-1979 13.5 76 8.0
gett 23-434 SOUTHRIVER BOROkO 2-52
09-13-1957 .... 2.7 04-02-1963 13.0 50 3.1 09-27-1972 12.0 44 8.402-27-1958 .... 2.8 08-28-1963 13.0 51 3.0 09-13-1973 12.0 44 5.505-29-1958 .... 2.0 04-28-1964 11.5 48 3.5 08-18-1977 12.0 49 7.207-24-1958 .... 2.6 08-25-1964 13.0 46 3.5 08-21-1978 13.0 51 5.509-23-1958 .... 2.6 04-20-1965 11.5 73 3.5 09-20-1979 12.5 53 5.709-01-1959 .... 3.0 08-20"1965 12.0 49 3.0 09"22-1981 13.0 132 1204-08-1960 .... 2.8 04-19-1966 11.5 45 3.0 08-18-1982 12.0 94 1008-30-1960 .... 2.6 09-23-1966 12.0 48 3.0 09-08-1983 12.5 73 7.603-21-1961 .... 2.9 06-04-1969 14.8 43 4.2 10-11-1984 13.0 115 1408"22"1961 11.0 46 2.9 06"04-1970 14.0 43 4.2 09-25-1985 13.0 95 1304-30-1962 12.0 47 2.9 10-29-1970 12.0 43 4.6 03-06-1986 12.0 121 1109-17-1962 11.5 50 3.0 03-16-1972 12.5 42 4.8 10-21-1986 13.5 130 14
Well 23-436 SOUTHRIVER BORO_D 1-22
08-28-1942 .... 2.4 04-30-1962 12.0 43 3.9 03-20-1969 -- 44 4.009-13-1957 .... 2.8 09-17-1962 12.0 40 3.6 06-04-1969 15.0 44 4.902- 27-1958 .... 3.4 04 -02 - 1963 12.0 44 3.7 06- 04-1970 15.0 44 4.905-29-1958 .... 3,0 06-28-1963 12.0 40 3.9 10-29-1970 11.5 46 4.607-24-1958 .... 3.0 04-28-1964 11.5 41 4.0 03-16-1972 12.5 46 4.809-23-1958 .... 3.1 08-25-1964 13.0 42 4.0 09-27-1972 12.0 46 6.804-14-1959 .... 3.4 04-20-1965 13.5 43 4.0 09-13-1973 12.0 48 4.808 -30 - 1960 .... 3.1 08- 20- 1965 13.0 43 4.0 04- 25- 1974 12.0 48 4.303-21-1961 .... 3.3 04-19-1966 12.0 41 4.0 08-26-1974 12.5 46 4.508-22-1961 11.0 43 3.4 09-23-1966 12.0 44 5.0
Well 23-437 SOUTHRIVER BOROWO3-67
06-04-1969 13.0 46 6.1 10-29-1970 11.5 42 6.506-04-1970 13.0 46 6.1 09-13-1973 12.0 44 4.5
Welt 23-438 SOUTHRIVER BOROWD5-77
08-31-1977 12.0 52 7.0 09-22-1981 14.0 92 12 09-25-1985 12.5 86 1208-21-1978 -- 57 5.6 08-18-1982 12.5 75 8.9 03-06-1986 11.0 93 1109-20-1979 12.0 57 6.3 10-11-1984 12.0 84 12 10-21-1986 12.5 96 23
Wet[ 23-439 SOUTHRIVER BOROWD20B
04-15-1981 13.5 146 26 09-28-1983 14.0 522 130 03-06-1986 13.5 77"5 20004-11-1983 13.5 318 71 11-01-1984 13.0 750 200 10-21-1986 13.5 630 170
Welt 23-440 flODDESBUSCO 1-1922
03-05-1958 .... 4.3 08-28-1963 14.5 42 4.1 08-26-1974 16.5 46 4.307-24-1958 .... 4.0 04-28-1964 14.5 49 4.5 09-29-1977 -- 78 1609-23-1958 .... 4.3 08-25-1964 15.5 54 4.0 08-21-1978 -- 81 1404-14-1959 .... 4.4 04-20-1965 14.0 41 4.0 09"20-1979 -- 248 4209-01-1959 .... 4.1 08"20"1965 14.5 40 4.0 09"02-1982 15.5 280 4704-08-1960 .... 4.0 04-19-1966 14.0 37 4.0 09"08-1983 14.5 295 5108"30-1960 .... 4.0 09"23-1966 16.5 84 10 10-12-1984 14.5 309 5403-21-1961 .... 4.3 07"30-1969 18.0 40 5.0 09-25-1985 14.5 345 7008-21-1961 14.0 38 4.2 03-10-1970 -- 40 6.0 02-26-1986 13.5 350 6804-30-1962 16.5 46 4.4 03-16-1972 15.0 31 8.5 I0"28-1986 13.5 167 1109-17-1962 16.5 40 4.8 09-27-1972 17.0 35 6.604-02-1963 14.5 45 4.3 04-25-1974 16.0 40 4.1
Wet[ 23-441 HERBERTSAND HSC 3-1964
04-17-1985 14.0 362 55
92

TabLe 5.--ChLoride concentrations end field measurementsof weLt-water samples, 1923-86.--Continued.
spe- Chto- spe- Chto- Spe- Chto-Date Temper- cific ride, Date Temper- cif|c ride, Date Temper- cific ride,
of ature condu;- diss of ature condu_- diss of ature ca_e- disssample ('C) tahoe" (mg/L) sample ('C) Lance" (mg/L) sample ('C) t (mg/L)
MiddLe aquifer, Potomac-Raritan-MaRoth¥ aquifer system--Continued.
WeLL23-473 HAAGENDAZS INC. 1955
07-28-1960 12.0 525 8.5 09-22-1966 13.0 490 21 09-29-1977 12.5 1,300 24008-21-1961 13.0 476 8.4 03-18-1969 12.0 600 38 08-23-1978 -- 2,000 47004-30-1962 12.0 533 8.7 03-08-1970 12.5 540 22 10-25-1979 12.5 1,060 22009"17-1962 12.0 546 8.8 03"15-1972 12.5 635 61 09-01-1982 13.5 1,550 34006-01-1963 12.0 566 9.5 09-25-1972 13.0 744 96 09-15-1983 -- 1,310 27008-27-1963 13.5 494 8.7 05-31-1973 13.0 628 69 10-26-1984 14.0 1,100 22004-27-1964 13.0 500 11 09-12-1973 13.0 635 68 04-12-1985 13.5 860 21008-24-1964 12.0 502 12 04-25-1974 12.5 644 66 03-17-1986 13.5 1,160 29004-19-1965 12.0 512 12 08-26-1974 12.5 621 63 10-08-1986 14.0 1,290 26008-19-1965 13.5 503 11 06-03-1975 13.0 756 8604-18-1966 13.0 512 12 11-16-1976 12.5 712 82
Well 23-478 AHERCYANAMIDCOZA-58
08-21-1961 13.0 560 35 09-22-1966 15.5 583 33 08-23-1978 1,100 15004-30-1962 13.5 573 35 03-08-1970 14.0 660 52 10-25-1979 i4.0 1,160 200
09-17-1962 13.5 604 34 03-15-1972 13.5 1,_ 120 09-01-1982 14.0 1,360 26004-01-1963 14.0 622 31 09-25-1972 16.0 130 09-15-1963 14.5 1,130 20008-27-1963 15.0 583 33 05-31-1973 14.0 898 120 10-26-1984 15.0 970 17004-27-1964 14.0 578 32 09-13-1973 14.0 912 120 04-12-1985 14.0 930 21008-24-1964 15.5 587 32 04-25-1974 14.0 680 110 03-04-1986 14.0 1,200 22004-19-1965 13.5 576 31 08-26-1974 14.0 745 110 10-08-1986 14.5 1,140 19008-19-1965 15.5 575 31 11-16-1976 14.0 736 7604-18-1966 13.5 575 33 09-29-19T/ 14.0 898 110
WeLL23-543 SHELLOIL 5($2)
04-16-1985 14.5 760 51 10-22-1986 14.0 800 61
WeLL23-548 SHELLOIL 8(R7)
04-16-1985 15.0 495 34 10-22-1986 14.5 498 43
WeLt 23-551 SOUTHRIVER BORO_/D6-80
09-22-1981 14.0 75 7.5 10-11-1984 11.5 60 7.8 10-21-1986 12.0 66 8.708-18-1982 12.0 52 6.2 09-25-1985 12.0 62 9.509-08-1983 12.0 56 6.6 03-06-1986 11.5 64 8.7
WeLL23-554 SAYERVILLEBORO_/DS-80
09-24-1981 13.0 59 3.6 09-08-1983 12.5 56 2.1 09-20-1985 12.5 59 2.008-31-1982 12.0 60 2.0 08-08-1985 12.5 58 3.0 09-30-1986 13.0 63 2.0
WeLt 23-1056 MCUAMONITORING3-1978
11-06-1986 13.5 -- 5,500
WeLt 25-153 SHORELANDSWCHOLNDL4-70
03-21-1972 15.0 54 2.8 08-30-1974 16.0 56 3.3 10-30-1984 15.0 76 2.509-25-1972 16.0 55 1.9 05-22-1975 15.0 58 4.6 09-19-1985 15.5 84 2.306-01-1973 16.0 55 2.8 10-20-1976 15.5 63 4.304-29-1974 15.5 67 3.9 08-31-1977 16.0 58 .4
WeLt 25-297 ABERDEENTWPWD1-56
09-18-1980 14.0 61 1.8 10-29-1984 14.0 59 2.210-13-1983 14.0 62 2.0 02-25-19_ 15.0 75 1.9
WeLL25-299 ABERDEENTWPI_D 2-65
09-11-1973 14.0 45 1.6 10-21-1976 13.5 49 5.508-30-1974 14.0 49 3.6 09-01-1977 14.0 49 2.9
93

Table 5.--Chloride concentrations and field _easurements of well-voter samples. 1923-86.--Continued.
Spa- Chto- Spe- Chlo- Spa- Chlo-Dote Temper- cific ride, Date Temper- cific ride, Date Temper- ciflc ride,
of ature COncr_e- diss of ature condu_- diss of ature eondu_- disssample ('C) to (mg/L) sample (*C) tance" (mg/L) sample (°C) tance- (mg/L)
Riddle aquifer, Potomac-Raritan-Hagothy aquifer system--Comtinued.
Well 25-318 NPS-SANDYHOOK2-1906
05-10-1954 18.0 -- 4,3 04-05-1965 16,0 97 5.0 03-21-1972 18.0 88 4.808-30-1961 18.5 86 4.8 08o31-1965 16,0 81 5.0 09-25-1972 19,0 88 3.004-25-1962 19.0 132 18 04-26-1966 16.0 87 4.5 06-01-1973 18.5 89 5.609-04-1962 17.0 94 4.6 09-07-1966 16.5 75 4.5 09-11-1973 18.5 91 4.504-03-1963 17.0 97 5.0 08-29-1967 17.0 98 5.0 04-29-1974 18.5 90 6.808-20-1963 17,0 91 4.7 03-25-1968 18.0 94 5.4 08-30-1974 18.5 91 5,604-29-1964 16.5 89 4.0 08-27-1968 17.0 97 6.5 05-22-1975 19.5 98 8.209-02-1964 18.5 87 5.0 10-29-1970 18.0 93 4.0
Well 25-319 US ARNY-FTHANCOCK5-42
03-18-1948 .... 6,1 09-04-1956 .... 5.8 09-02-1964 20,0 94 5.504-21-1949 .... 5.2 04-03-1957 .... 6.0 04-05-1965 -- 93 5.008-23-1949 .... 5.8 08-28-1957 .... 5.4 08-3%1965 19.5 99 5.504-11-1950 .... 6,2 08-29-1957 16.0 103 9.4 04-20-1966 19.5 96 5,503-27-1951 .... 5.4 04-08-1958 .... 5.4 09-07o1966 19.0 101 5.508-22-1951 .... 5,4 08-26-1958 .... 8.9 08-29-1967 20.0 90 6,004-18-1952 .... 5,6 04-08-1959 .... 5.6 03-25-1968 19,0 97 5,609-05-1952 .... 5,8 09-02-1959 .... 5.5 08-27-1968 19.0 102 6,503-30-1953 .... 5.2 04-05-1960 .... 5.9 02-26-1969 18.0 100 5.007-07-1953 -- 97 6.9 08-31-1960 .... 5.4 03-21-1972 18.5 93 5.109-02-1953 .... 6,2 04-05-1961 .... 5.2 09-25-1972 19.5 94 3.204-08-1954 .... 5.0 08-30-1961 19.0 107 5.8 06-01-1973 19.0 93 5.105-10-1954 18.0 97 4.4 04-25-1962 19.5 93 5.6 09-11-1973 19.5 95 5.509-01-1954 .... 5.3 09-04-1962 19.5 100 5.3 04-29-1974 19.0 96 6.704-14-1955 .... 5.5 04-03-1963 19.5 103 5.8 08-30-1974 20.0 93 7.308-30-1955 .... 5.2 08o28-1963 19.0 98 5.2 05-22-1975 19.0 106 9.004-11-1956 .... 5.4 04-29-1964 18.5 94 5.0
Well 25-320 NPS-SANDYHOOK5A-1970
09-01-1977 19.5 101 7.0 08-20-1980 19.0 121 5.3 10-23-1984 19.5 129 5.608-23-1978 19.5 117 5,0 09-14-1982 19.0 129 5.5 09-18-1985 19.5 125 5.609-12-1979 19.0 121 5.1 12-01-1983 19.0 117 5.3
Welt 25-453 UNIONBEACHBOROWD3-77
09-01-1977 14.5 61 4.3 09-14-1982 14.0 78 2.4 03-04-1986 14.0 78 2.308-24-1978 14.5 84 2.4 10-13-1983 14.5 82 4.5 10-09-198& 14.5 82 2.409-13-1979 14.5 81 1.9 05-29-1985 15.0 83 2.510-01-1981 14.0 79 2.2 09-23-1985 14.0 84 3.2
WeLL25-46& ABERDEENTWPWD3-77
05-29-1985 14.5 65 2.2 09-19-1985 14.0 69 2.1 10-06-1986 14.0 68 --
Well 25-562 KEYPORTBOROI_ 8-1984
08-23-1985 14.5 74 2.5 09-20-1985 14.5 -- 2.3 03-07-1986 15.0 66 3.0
1 Nost specific conductances uere measured in the laboratory prior to 1975, and in the field thereafter.Units are microsie_zens/em.
2 On April 25, 1986, sample was collected from Welt 25-420 after three days of continuous pumping for an aquifertest.
94
WATER-QUALITY DATA FOR THE POTOMAC-RARITAN-MAGOTHY AQUIFER SYSTEM IN THE NORTHERN COASTAL PLAIN OF NEW JERSEY, 1923-86(New Jersey Geological Survey Report 19)
i,e-
L,,