Embed Size (px)
Citation preview

Newbuildings & Yards20 June 2018
Marine Money Week |New York
Prepared by Angelica Kemene |Head of Market Analysis & Intelligence
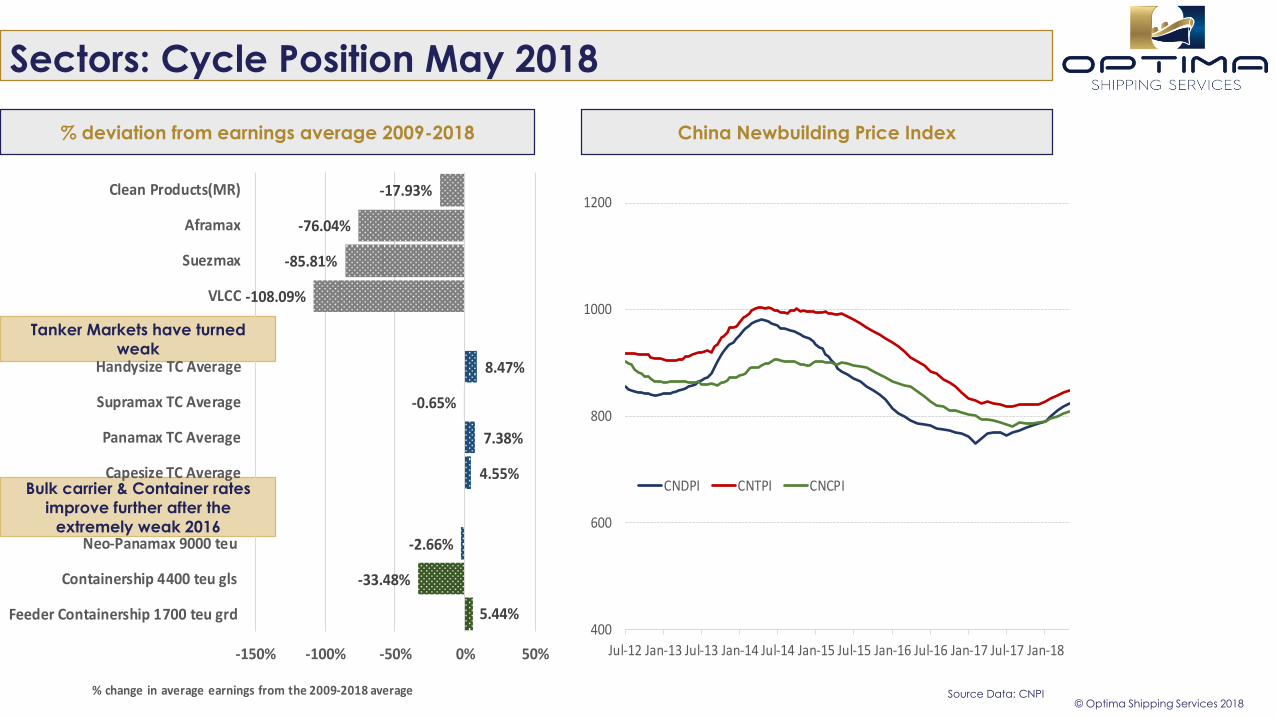
Sectors: Cycle Position May 2018
% deviation from earnings average 2009-2018
© Optima Shipping Services 2018
Tanker Markets have turned
weak
Bulk carrier & Container rates
improve further after the
extremely weak 2016
5.44%
-33.48%
-2.66%
4.55%
7.38%
-0.65%
8.47%
-108.09%
-85.81%
-76.04%
-17.93%
-150% -100% -50% 0% 50%
Feeder Containership 1700 teu grd
Containership 4400 teu gls
Neo-Panamax 9000 teu
Capesize TC Average
Panamax TC Average
Supramax TC Average
Handysize TC Average
VLCC
Suezmax
Aframax
Clean Products(MR)
% change in average earnings from the 2009-2018 average
China Newbuilding Price Index
400
600
800
1000
1200
Jul-12 Jan-13 Jul-13 Jan-14 Jul-14 Jan-15 Jul-15 Jan-16 Jul-16 Jan-17 Jul-17 Jan-18
CNDPI CNTPI CNCPI
Source Data: CNPI

Newbuilding Prices out of the bottom - Bulkers
© Optima Shipping Services 2018
81K DWT Panamax Bulkcarrier NB Prices 61-64K DWT Supramax NB Prices
0
10
20
30
40
50
60
70
80
90
1976 1982 1988 1994 2000 2006 2012 2018
$ Mln
Nominal
Inflation adjusted
0
10
20
30
40
50
60
1985 1988 1991 1994 1997 2000 2003 2006 2009 2012 2015 2018
$ Mln
Nominal
Inflation adjusted
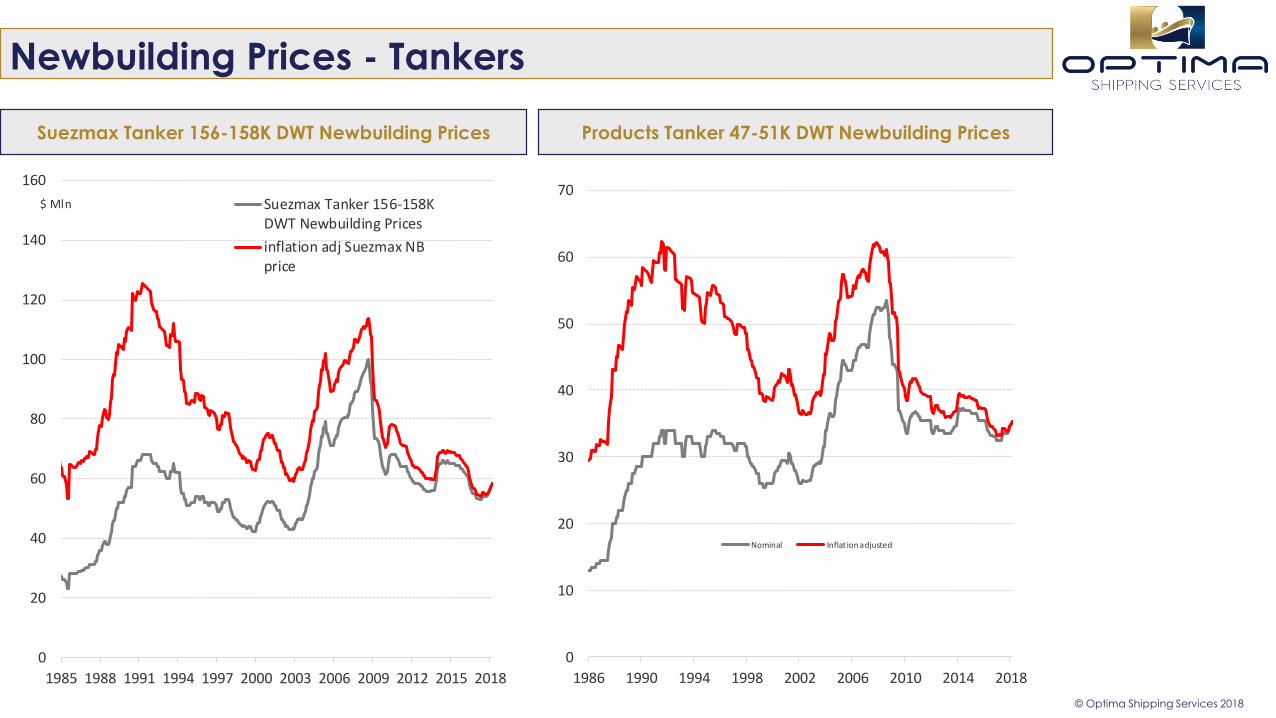
Newbuilding Prices - Tankers
© Optima Shipping Services 2018
Suezmax Tanker 156-158K DWT Newbuilding Prices Products Tanker 47-51K DWT Newbuilding Prices
0
20
40
60
80
100
120
140
160
1985 1988 1991 1994 1997 2000 2003 2006 2009 2012 2015 2018
$ Mln Suezmax Tanker 156-158KDWT Newbuilding Prices
inflation adj Suezmax NBprice
0
10
20
30
40
50
60
70
1986 1990 1994 1998 2002 2006 2010 2014 2018
Nominal Inflat ion adjusted

Newbuilding Prices - Containers
© Optima Shipping Services 2018
Containers 1700 TEU Newbuilding Prices Containers 8800 TEU Newbuilding Prices

Base Payment Terms | What about options placement?
Source Data: Optima Shipping Services, CNPI
© Optima Shipping Services 2018
Bulk Carriers
Payment Term 10% 10% 10% 10% 60%
Key Point Contract Signing Steel Cutting Keel Laying Launching Delivery
Months Before Delivery 24 12 6 3 0
Oil Tankers
Payment Term 10% 10% 10% 10% 60%
Key Point Contract Signing Steel Cutting Keel Laying Launching Delivery
Months Before Delivery 24 14 8 4 0
Containers
Payment Term 10% 10% 10% 10% 60%
Key Point Contract Signing Steel Cutting Keel Laying Launching Delivery
Months Before Delivery 24 12 7 4 0
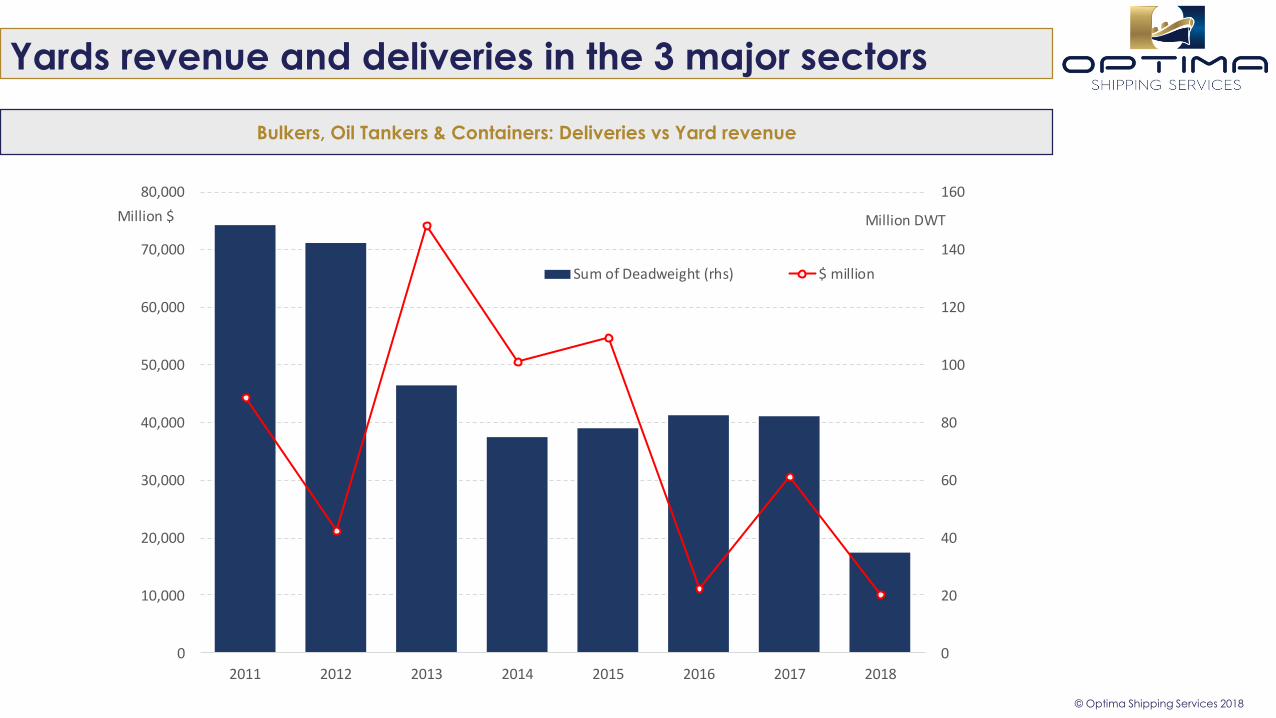
Yards revenue and deliveries in the 3 major sectors
© Optima Shipping Services 2018
Bulkers, Oil Tankers & Containers: Deliveries vs Yard revenue
0
20
40
60
80
100
120
140
160
0
10,000
20,000
30,000
40,000
50,000
60,000
70,000
80,000
2011 2012 2013 2014 2015 2016 2017 2018
Million DWTMillion $
Sum of Deadweight (rhs) $ million

A shift towards Chinese Ship Yards
Major Shipbuilding Countries Current Orderbook %
© Optima Shipping Services 2018
0% 20% 40% 60% 80% 100%
Bulk Carrier
Container
Crude Oil Tanker
Products Tanker
China, People's Republic Of Korea, South Japan Others
For the 3 major sectors there are currently 188active yards – of which 35% is expected todeliver their final order this year, whilst 78% ofthem will deliver their final order until the endof 2019.
In 2007 285 yards received more than 1 order,while in 2017 91 yards received more than 1order – A decrease of 68%.
Inability to secure orders at a profit. Issue: Yard Consolidation China: “Plans on structural reform 2016-2020 in
shipbuilding industry” China’s top 10 state-
owned shipbuilders will be responsible for 70%of the country’s new tonnage by 2020.
Japan follows the trend (capacity cuts &mergers), but S. Korea remains skeptical.
Cost increase: steel prices, labor cost,exchange rates.
The extra cost can be balanced if builderscharge higher.

Asset Play with Newbuildings |Older years vs 2018
© Optima Shipping Services 2018
Asset play was always on thetable, but times havechanged.
Market dynamics havealtered: financing, newregulations, shorter cycles, AI
Need for access to capital,buy fleets instead of a ship,flexibility for financialstructuring
The “asset play” innewbuildings is a differentgame now.

Sectors: Fleet Age Profile
Bulk Carriers: Existing Fleet Age Profile Tankers: Existing Fleet Age Profile
© Optima Shipping Services 2018
133
431
56
175
108
165
163
528
147
325
184
263
214
457
190
296
117
144
111
144
39
126
80
122
78
100
7
50
23
16
0% 20% 40% 60% 80% 100%
Handysize
MR1/MR2
Panamax/LR1
Aframax/LR2
Suezmax/LR3
VLCC/ULCC
0-4 yrs 5-9 yrs 10-14 yrs 15-19 yrs 20 yrs & over

Sectors: Fleet Age Profile
Containers: Existing Fleet Age Profile
© Optima Shipping Services 2018
287
78
9
198
86
88
390
337
84
196
135
7
940
414
100
188
1
8
473
183
67
19
0
0
817
76
10
6
0
0
0% 10% 20% 30% 40% 50% 60% 70% 80% 90% 100%
Feeder
3,000-5,999 TEUs
6,000-7,999 TEUs
8,000-11,999 TEUs
12,000-14,999 TEUs
15,000 + TEUs
0-4 yrs 5-9 yrs 10-14 yrs 15-19 yrs 20 yrs & over
0
200
400
600
800
1000
1200
1400
1600
1800
2012 2013 2014 2015 2016 2017 2018
Bulk Carrier Containers Crude Oil Tanker Products Tanker
Contracting Pace in major sectors No of Contracts
No expectation to
return to firm levels
though
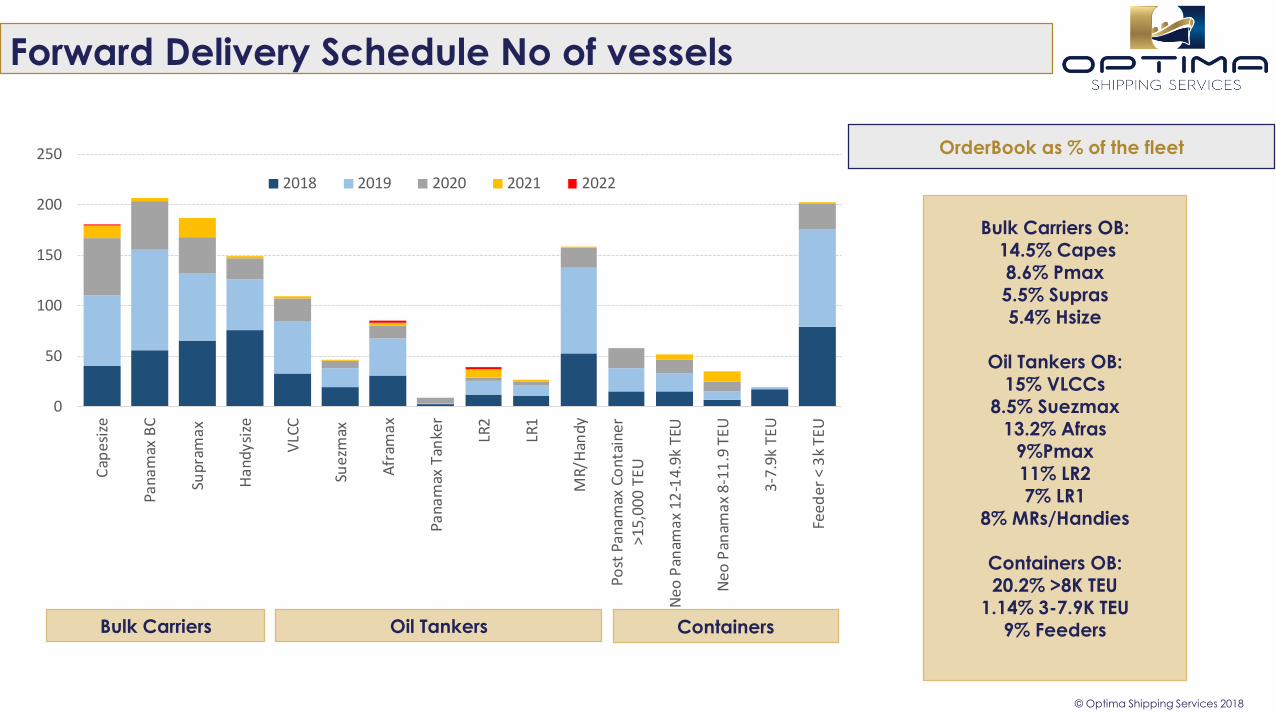
Forward Delivery Schedule No of vessels
© Optima Shipping Services 2018
Bulk Carriers OB:14.5% Capes8.6% Pmax5.5% Supras5.4% Hsize
Oil Tankers OB:15% VLCCs
8.5% Suezmax13.2% Afras
9%Pmax11% LR27% LR1
8% MRs/Handies
Containers OB:20.2% >8K TEU
1.14% 3-7.9K TEU9% Feeders
0
50
100
150
200
250
Cap
esiz
e
Pana
max
BC
Sup
ram
ax
Han
dysi
ze
VLC
C
Suez
max
Afr
amax
Pan
amax
Tan
ker
LR2
LR1
MR
/Han
dy
Post
Pan
amax
Co
ntai
ner
>15,
000
TEU
Neo
Pan
amax
12
-14.
9k T
EU
Neo
Pan
amax
8-1
1.9
TEU
3-7
.9k
TE
U
Feed
er <
3k
TEU
2018 2019 2020 2021 2022
Bulk Carriers Oil Tankers Containers
OrderBook as % of the fleet
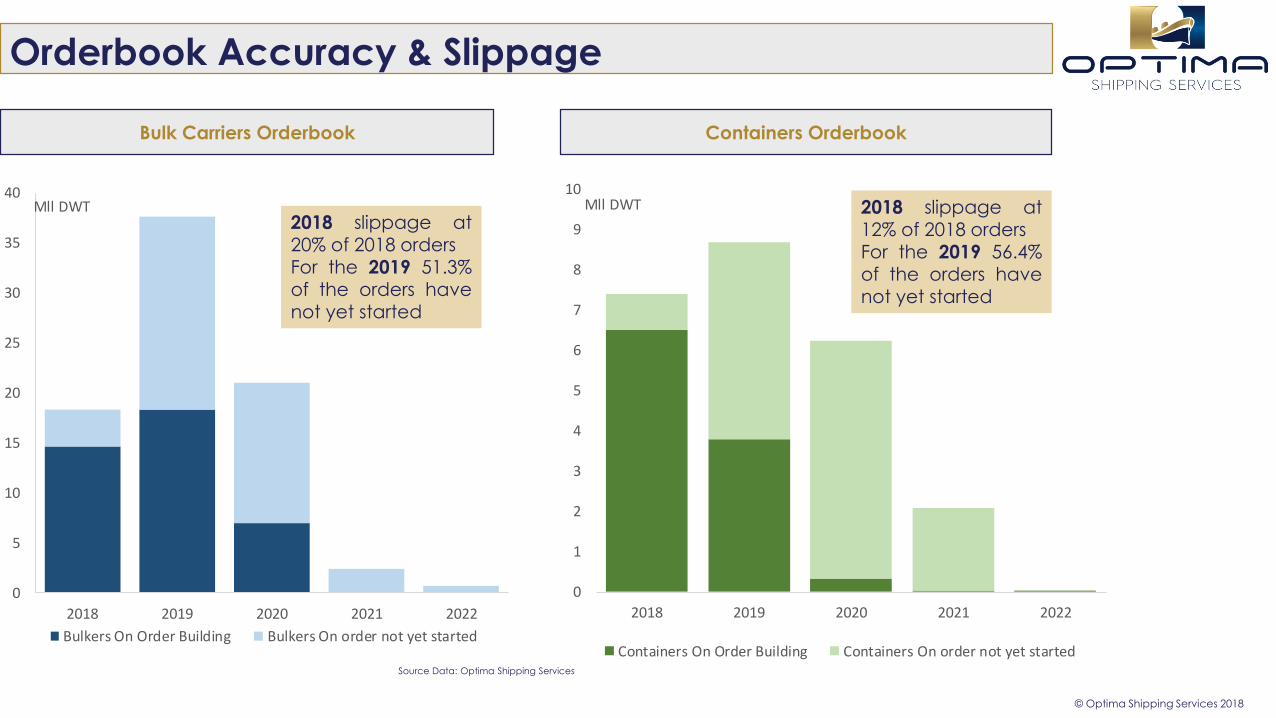
Orderbook Accuracy & Slippage
© Optima Shipping Services 2018
Bulk Carriers Orderbook Containers Orderbook
0
5
10
15
20
25
30
35
40
2018 2019 2020 2021 2022
Mll DWT
Bulkers On Order Building Bulkers On order not yet started
0
1
2
3
4
5
6
7
8
9
10
2018 2019 2020 2021 2022
Mll DWT
Containers On Order Building Containers On order not yet started
2018 slippage at
20% of 2018 ordersFor the 2019 51.3%of the orders havenot yet started
2018 slippage at12% of 2018 ordersFor the 2019 56.4%of the orders havenot yet started
Source Data: Optima Shipping Services
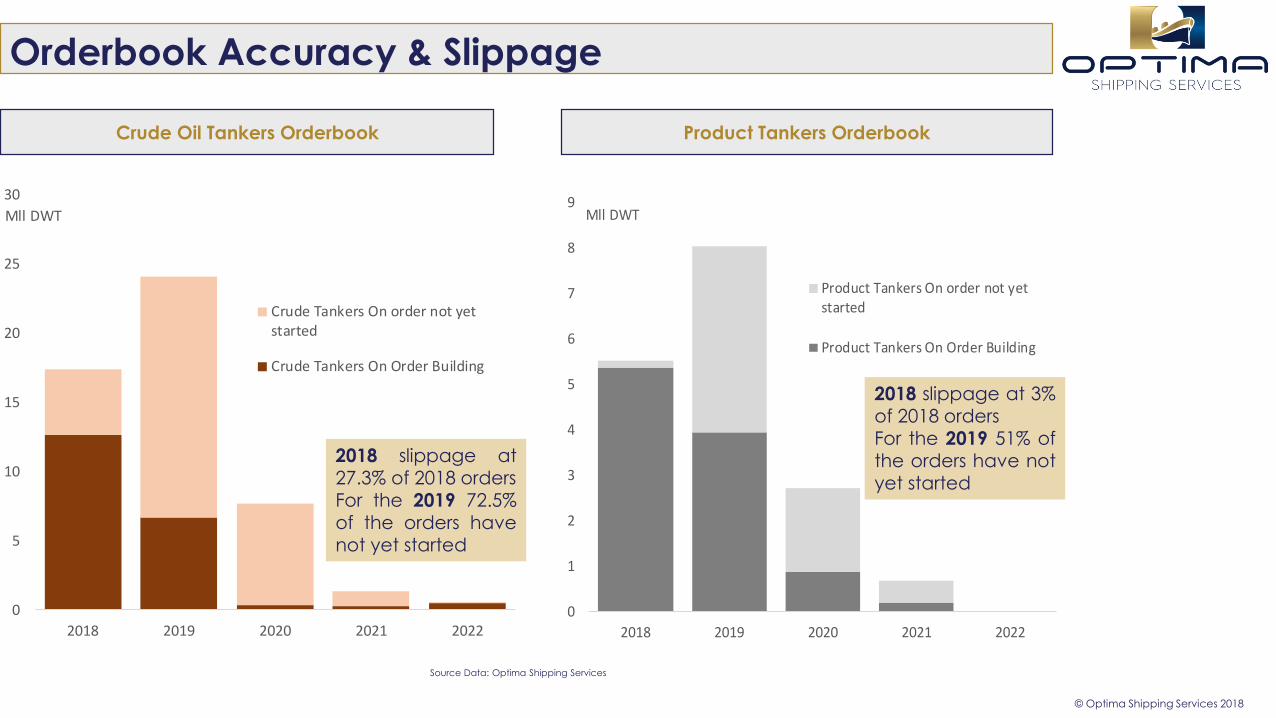
Orderbook Accuracy & Slippage
© Optima Shipping Services 2018
Crude Oil Tankers Orderbook Product Tankers Orderbook
0
5
10
15
20
25
30
2018 2019 2020 2021 2022
Mll DWT
Crude Tankers On order not yetstarted
Crude Tankers On Order Building
0
1
2
3
4
5
6
7
8
9
2018 2019 2020 2021 2022
Mll DWT
Product Tankers On order not yetstarted
Product Tankers On Order Building
2018 slippage at27.3% of 2018 ordersFor the 2019 72.5%of the orders havenot yet started
2018 slippage at 3%of 2018 ordersFor the 2019 51% ofthe orders have notyet started
Source Data: Optima Shipping Services

Orderbook Replacement Tonnage in Mll DWT |SOx
© Optima Shipping Services 2018
0
10
20
30
40
50
60
70
80
90
Crude Tankers Product Tankers Bulkers Containers
age above 20 yrs old Orderbook
0
20
40
60
80
100
120
140
Crude Tankers Product Tankers Bulkers Containers
age above 15 yrs old Orderbook
Orderbook vs Vessels age above 20 years old Orderbook vs Vessels age above 15 years old
Source Data: Optima Shipping Services

Orderbook Replacement Tonnage in Mll DWT |SOx
© Optima Shipping Services 2018
SOxcompliance
Tier 2
Delivery 2019|2020
Retrofit like 2nd hand market
Scrubber Ready
marginally the majority
of the orderbook
Scrubber Fitted
“Wait and see”
attitude

THANK YOU !
© Optima Shipping Services 2018
This report has been prepared by Optima Shipbrokers and is addressed to Optima Shipbrokers customers only and is for distribution only under such circumstances as may be permitted by applicable law. This information has no regard to specific investment objectives, financial situation or particular needs of any specific recipient. It is published solely for informational purposes and this information is not, and should not be construed as, an offer or solicitation to sell or buy any product, investment, security or any other financial instrument. Optima Shipbrokers does not make any representation or warranty, express or implied, as to the accuracy, completeness or correctness of the information contained herein, nor is it intended to be a complete statement or summary of the securities, markets or developments referred to in the report. Neither Optima Shipbrokers , nor any of its directors, employees or agents, accepts any liability for any loss or damage, howsoever caused, arising from any reliance on any information or views contained in this report. While this report, and any opinions expressed in it, have been derived from sources believed to be reliable and in good faith they are not to be relied upon as authoritative or taken in substitution for the exercise of your own commercial judgment. Any opinions expressed in this report are subject to change without notice. Optima Shipbrokers is under no obligation to update or keep current the information contained herein. This report may not be reproduced or redistributed, in whole or in part, without the written permission of Optima Shipbrokers accepts no liability whatsoever for the action of third parties in the respect. This information is the intellectual property of Optima Shipbrokers . Optima Shipbrokers logo is the trademark of the company. All rights reserved.
Produced by Optima Shipbrokers Research
10, Ouranou Str166 71Kavouri VouliagmenisGreeceTel: +30 210 8922000
Email: [email protected] www.optimashipbrokers.com
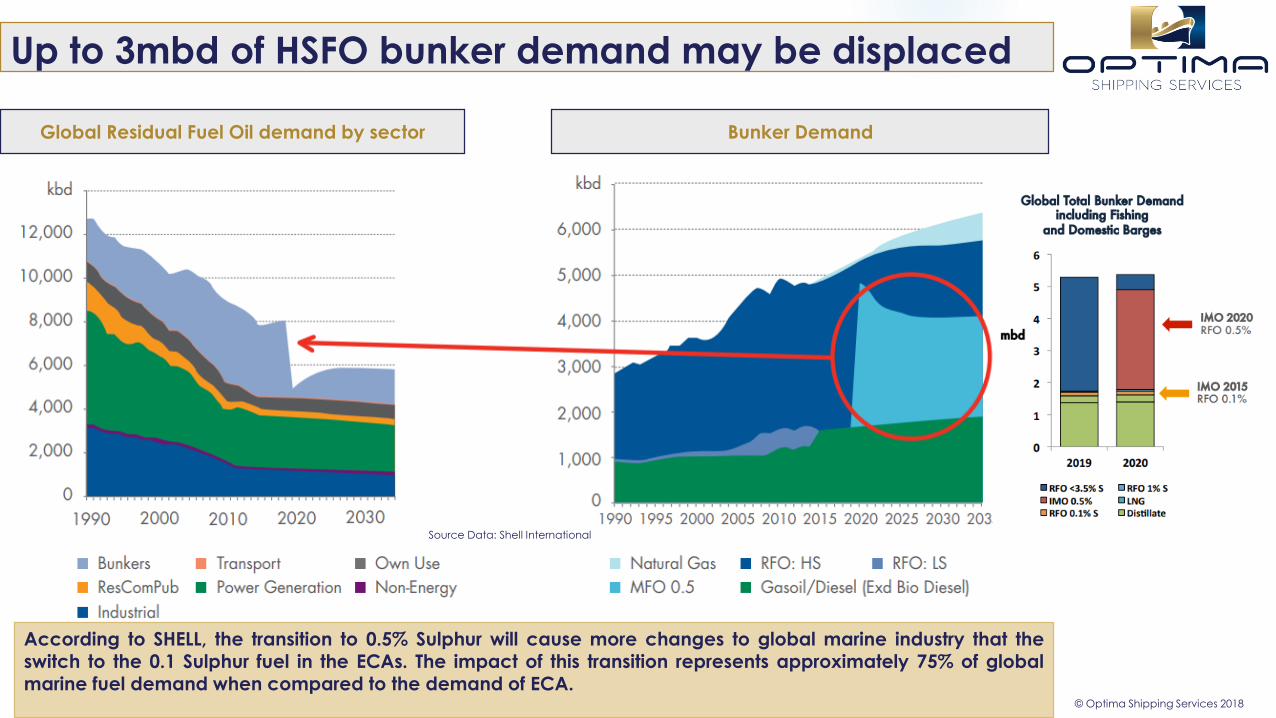
Up to 3mbd of HSFO bunker demand may be displaced
© Optima Shipping Services 2018
Global Residual Fuel Oil demand by sector Bunker Demand
According to SHELL, the transition to 0.5% Sulphur will cause more changes to global marine industry that theswitch to the 0.1 Sulphur fuel in the ECAs. The impact of this transition represents approximately 75% of globalmarine fuel demand when compared to the demand of ECA.
Source Data: Shell International
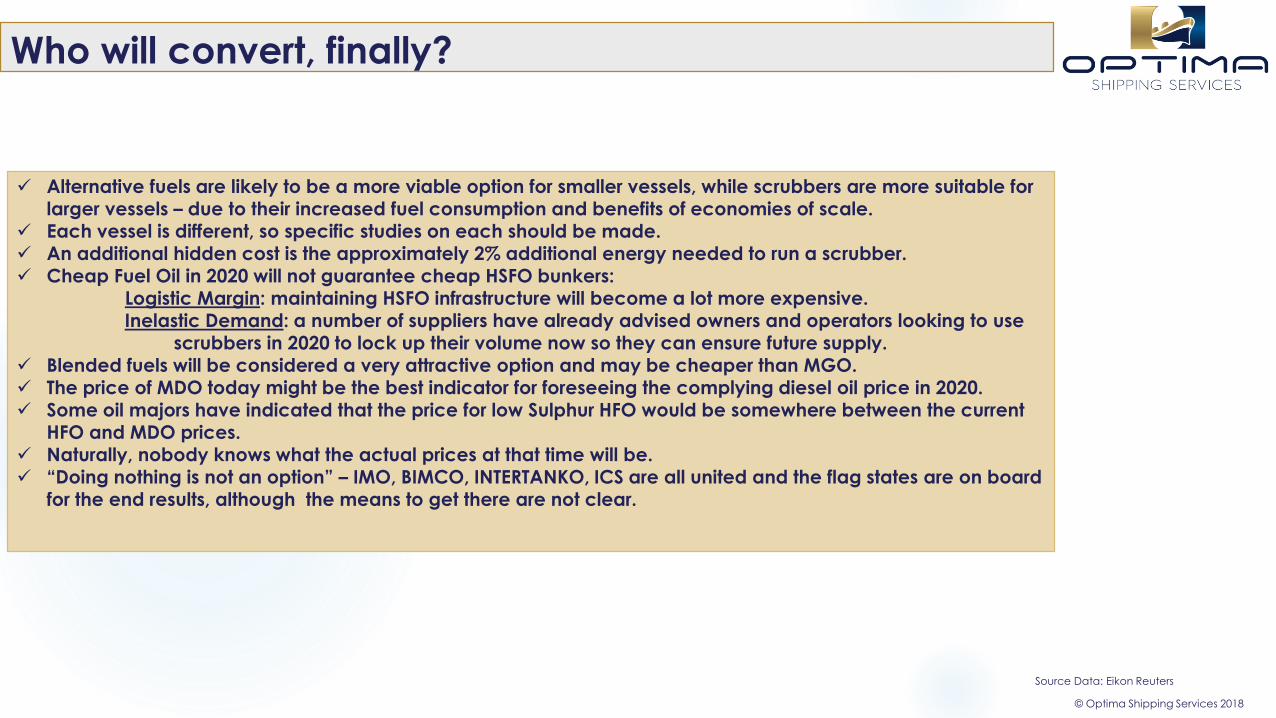
Who will convert, finally?
© Optima Shipping Services 2018
Alternative fuels are likely to be a more viable option for smaller vessels, while scrubbers are more suitable for larger vessels – due to their increased fuel consumption and benefits of economies of scale.
Each vessel is different, so specific studies on each should be made. An additional hidden cost is the approximately 2% additional energy needed to run a scrubber. Cheap Fuel Oil in 2020 will not guarantee cheap HSFO bunkers:
Logistic Margin: maintaining HSFO infrastructure will become a lot more expensive.Inelastic Demand: a number of suppliers have already advised owners and operators looking to use
scrubbers in 2020 to lock up their volume now so they can ensure future supply. Blended fuels will be considered a very attractive option and may be cheaper than MGO. The price of MDO today might be the best indicator for foreseeing the complying diesel oil price in 2020. Some oil majors have indicated that the price for low Sulphur HFO would be somewhere between the current
HFO and MDO prices. Naturally, nobody knows what the actual prices at that time will be. “Doing nothing is not an option” – IMO, BIMCO, INTERTANKO, ICS are all united and the flag states are on board
for the end results, although the means to get there are not clear.
Source Data: Eikon Reuters

Is there a real impact in vessel earnings?
© Optima Shipping Services 2018
Bunker Prices vs Vessel Earnings
Source Data: Shell International
0
200
400
600
800
1000
1200
1400
0
10000
20000
30000
40000
50000
60000
70000
80000
90000
Jan-00 Jan-02 Jan-04 Jan-06 Jan-08 Jan-10 Jan-12 Jan-14 Jan-16 Jan-18
$/t
n$/D
ay
TC Rate Pmax TC Rate Afra MDO Spore IFO 380 Spore
Limited evidence fuel costs impact vessel earnings
However, they do impact voyage costs We would expect some extra 1knot speed
(slow steaming) reduction to appear if fuel costs soar to high levels.
Expectations are that since the 2H 2019 the shipping and the refining market will start seeing changes in fuel demand, supply and prices.
Currently, swap curves for middle distillates and fuel oil are in backwardation implying that the IMO2020 has not yet invaded into the oil market. But it will soon do! – No move yet into longer term supply contracts.
Source Data: Eikon Reuters
Fuel Oil Forward curve, $/tonne