Embed Size (px)
Citation preview

LUND UNIVERSITY
PO Box 117221 00 Lund+46 46-222 00 00
New Zr II oscillator strengths and the zirconium conflict in the HgMn star chi Lupi
Sikstrom, C. M; Lundberg, Hans; Wahlgren, G. M; Li, Z. S; Lynga, C; Johansson, S;Leckrone, D. SPublished in:Astronomy & Astrophysics
Published: 1999-01-01
Link to publication
Citation for published version (APA):Sikstrom, C. M., Lundberg, H., Wahlgren, G. M., Li, Z. S., Lynga, C., Johansson, S., & Leckrone, D. S. (1999).New Zr II oscillator strengths and the zirconium conflict in the HgMn star chi Lupi. Astronomy & Astrophysics,343(1), 297-302.
General rightsCopyright and moral rights for the publications made accessible in the public portal are retained by the authorsand/or other copyright owners and it is a condition of accessing publications that users recognise and abide by thelegal requirements associated with these rights.
• Users may download and print one copy of any publication from the public portal for the purpose of privatestudy or research. • You may not further distribute the material or use it for any profit-making activity or commercial gain • You may freely distribute the URL identifying the publication in the public portalTake down policyIf you believe that this document breaches copyright please contact us providing details, and we will removeaccess to the work immediately and investigate your claim.

Download date: 25. Sep. 2018

Astron. Astrophys. 343, 297–302 (1999) ASTRONOMYAND
ASTROPHYSICS
New Zr II oscillator strengths and the zirconium conflictin the HgMn star χ Lupi
C.M. Sikstr om1, H. Lundberg2, G.M. Wahlgren1,3, Z.S. Li2, C. Lynga2, S. Johansson1, and D.S. Leckrone4
1 Atomic Spectroscopy, Department of Physics, University of Lund, Solvegatan 14, S-223 62 Lund, Sweden(e-mail: [email protected])
2 Atomic Physics, Lund Institute of Technology, Professorsgatan 1, S-223 62 Lund, Sweden3 Comp. Sciences Corp., Code 681, GSFC, Greenbelt, MD 20771, USA4 Laboratory for Astronomy and Solar Physics, NASA/GSFC, Code 681, Greenbelt, MD 20771, USA
Received 16 September 1998 / Accepted 17 November 1998
Abstract. Lifetimes on the sub-nanosecond scale for the levelsv2D3/2, v2F3/2 and v2F5/2 in the 4d5s5p configuration in Zr IIhave been measured, using the method of laser-induced fluo-rescence. Combined with branching fractions obtained with theLund Ultraviolet (UV) Fourier Transform Spectrometer (FTS),experimental oscillator strengths have been derived. FromHub-ble Space Telescope/Goddard High-Resolution Spectrographspectra, the zirconium abundance in the HgMn starχ Lupi hasbeen determined from Zr II and Zr III lines. More than an orderof magnitude difference in the Zr II abundance has been derivedfrom these ionization stages. The difference is much too large tobe explained by uncertainties in the oscillator strengths. Possi-ble explanations of this difference have to be found in the stellarmodels, such as the influence of non-LTE or diffusion.
Key words: atomic data – line: identification – methods: labora-tory – stars: abundances – stars: individual:χ Lupi – ultraviolet:stars
1. Introduction
The study of elemental abundances in stellar atmospheres pro-vides evidence for the chemical composition of the stellar pri-mordial cloud, processes occurring within the stellar interior,and the dynamics of the stellar atmosphere. In the case of thechemically peculiar stars of the upper main sequence, tremen-dous abundance enhancements for many elements are inferredfrom the observed intensities of spectral lines, and are most of-ten interpreted in terms of diffusion processes in the outer layersof the stellar atmosphere.
A key ingredient in quantitative stellar abundance analysesis the intrinsic atomic line strength, which represents the proba-bility that an atom in a certain state will, through radiative decayor absorption, transfer to another state of lower or higher energy,respectively. The corresponding parameter used in astronomi-cal work is the oscillator strength orf-value. The accuracy of
Send offprint requests to: C.M. Sikstrom
the f-value for a given transition is critical to the astrophysicalinterpretation of the observed stellar line since the line area, asmeasured by its equivalent width, is directly proportional to theproduct of thef-value and the element abundance. Therefore,an error in thef-value is directly transferred to the determinedabundance, independent of other errors inherent to the analysis.
From the spectrum of the HgMn starχLupi it had been noted(Leckrone et al. 1993a,b) that an anomaly existed between theLTE values of the zirconium abundance, as determined fromweak lines of Zr II at optical wavelengths and strong Zr III linesdetected in the ultraviolet. While such ionization imbalanceshave been noted for other elements inχ Lupi, the order of mag-nitude difference in abundance derived from lines of Zr II andZr III is remarkable. An ionization imbalance of similar magni-tude was also noted from lines of Y II and Y III, and investigatedfurther (Brage et al. 1998) in order to determine the role playedby f-value uncertainties. These elements are part of the Sr-Y-Zrtriad, which is vital to the study of s-process nucleosynthesis,and has in the past (Cowley & Aikman 1975) been pointedout as presenting a non-nuclear abundance pattern in HgMnstars. Yttrium and zirconium are often found to be overabun-dant in HgMn stars by one to three orders of magnitude (Heacox1979). Observations at ultraviolet wavelengths for lines of thethird spectra allow us now to understand that 1) the non-nuclear(odd-even effect) pattern is, in part, the result of mixing abun-dance data from different ionization stages, and 2) that largeionization imbalances appear to exist for some elements.
The most obvious interpretations for this anomaly may in-deed rest with the diffusion theory or the need to account fornon-LTE physics. However, a potential lien against any inter-pretation is the accuracy of thef-values for the lines studied. Itis this lien we aim to remove by measuring decay lifetimes forenergy levels and the branching ratios involved with observedspectral lines of Zr II. We describe our experiments, their re-sults, and application to the observed spectral anomaly in theHgMn starχ Lupi.
298 C.M. Sikstrom et al.: Zr II oscillator strengths and the zirconium conflict inχ Lupi
2. Branching fractions
Oscillator strengths were determined from measurements ofbranching fractions (BF) and lifetimes. This method is basedon the relations
BFul =Φul∑l Φul
=Aul∑l Aul
and
τu =1
∑l Aul
where∑
Φul and∑
Aul are the sums of the fluxes (inphotons·s−1) and the transition probabilities, respectively, froma certain upper level. The flux is measured as an intensity, usinga photon counting detection system, for example a photomulti-plier tube (PMT). By measuring the lifetime of the upper level,τu, one can put the transition probabilities on an absolute scale.From this,f-values can be derived.
In order to get the correctBF, the intensities of all lines froman upper level have to be observed. Weak lines or lines outsidethe detector sensitivity region are therefore a problem, whichmust be dealt with. Weak lines usually contribute less than afew percent of the total branching fraction from an upper level.The strength of weak and unobserved lines can be estimated byperforming a calculation.
The FTS is a well suited instrument for these kinds of mea-surements, as it is able to collect spectral data over a wide re-gion in a single run. Transitions from theLS terms of interestin this work, 4d5s5p v2D and 4d5s5p v2F, fall in the region1740–3600A. The strong transitions fall within a narrower re-gion, between 1900–2700A, which means that it is possible tomeasure all such lines in a single spectrum. A solar blind detec-tor, Hamamatsu R166, was used to record the interferogram.
The zirconium spectrum was emitted from a hollow cathodedischarge. The cathode was made from a 50 mm long zirconiumtube with an inner diameter of 10 mm. A mixture of neon at apressure of 0.8 torr and argon at 0.2 torr was used as a carriergas. Neon was used to achieve an effective charge and energytransfer in order to excite the Zr II spectrum, and argon was usedfor calibration purposes. The spectrum was recorded using theUV FTS in Lund, optimized for use in the UV-region (Thorneet al. 1987). The transmittance of the silica beamsplitter sets thelower wavelength limit at roughly 1750A. The reponse of the in-strument and the detectors varies with wavelength, and intensitycalibration is therefore necessary. The shape of the spectral re-sponse was determined from a deuterium lamp having a knownintensity curve. The lamp emits a continuous spectrum over theregion 1800–3000A. Also, known branching fractions of Ar II(Whaling et al. 1993) were used as an internal check, since ar-gon lines originate from the same discharge as the Zr lines andtravel an identical light path. The resulting efficiency curve hasa sharp cutoff at 3000A, which is the upper wavelength limit ofthe solar blind PMT. The curve peaks at 2500A, and falls off tothe lower wavelength limit at around 1800A, set by the silicabeamsplitter and a number of quartz optical components.
Another potential problem is whether or not self absorptionis affecting the intensity of strong lines. This effect is most se-vere for transitions combining down to the ground state, or tolevels with low excitation energy. In Zr II, the ground state is a4D3/2 level and the two lowest terms are both quartets. Transi-tions from the upper terms of interest, 4d5s5p v2D and 4d5s5pv2F, to the quartets are intercombination lines and are forbiddenin the LS-coupling scheme. The lowest doublet term has an en-ergy of 4400 cm−1, and therefore has a lower population, whichleads us to believe that self absorption has little effect on the lineintensities. This conclusion was verified by comparing line in-tensities of strong and weak lines from the same upper level,when running the hollow cathode lamp at different currents.
The spectrum was analysed using the computer codeGREMLIN, which is a development of the computer code DE-COMP (Brault & Abrams 1989). The program fits a Voigt func-tion to the observed line. The area under the fitted profile wasused as the line intensity. Uncertainties in the calibrated intensi-ties were assumed to arise from statistical and calibration errors.The noise level in a FTS spectrum can be assumed to be constantover the entire spectral region. The signal-to noise ratio (S/N)is therefore only dependent on the observed intensity of a line.Note that a line with a highf-value does not necessarily havea high observed intensity due to the wavelength dependenceof the instrumental response. The intensity calibration was as-sumed to be accurate to within 5% at the maximum response ofthe sensitivity curve. Calibration becomes relatively more un-certain in regions of lower instrumental response, giving linesin the wings of the calibration curve larger uncertainties. The re-sulting uncertainty thus depends on both the observed intensityand the intensity calibration.
3. Radiative lifetimes
In the lifetime measurements the experimental technique em-ployed a laser-produced plasma, pulsed laser excitation andtime-resolved detection. Zirconium ions in the ground level andlow-lying metastable levels were created by irradiating a zirco-nium target with laser pulses. The pulses had an energy of about25 mJ, a duration of 10 ns and were focused onto the target by a30 cm focal-length lens. Ions in the expanding plasma were thenexcited from one of the low levels to the level under investigationby the UV light from a pulsed laser system. Tunable radiationin the region 7000–8000A was obtained from a distributed-feedback dye laser. The dye laser was pumped by a part of theoutput from a mode-locked and Q-switched Nd:YAG laser. Thedye laser output was amplified to a few mJ and converted toUV using frequency-mixing crystals. For the high-lying levelsof the 4d5s5p configuration the tunable dye-laser output wasmixed with the fourth harmonic of the Nd:YAG laser givingthe desired excitation wavelengths around 195 nm. The pulseduration was 70 ps, which is much shorter than the measuredlifetimes. The excitation beam interacted with the ions about 10mm above the target. In these measurements the excitation couldbe performed from low metastable levels, which is favourablefor lifetime observations. Whereas the higher metastable levels

C.M. Sikstrom et al.: Zr II oscillator strengths and the zirconium conflict inχ Lupi 299
0
200
400
600
800
1000
1200
0 1 2 3 4 5 6 7 8 9 10 11 12 13 14 15
Time (ns)
Nor
mal
ized
inte
nsity
Fig. 1.Lifetimes were measured using the method of laser induced flu-orescence. The solid line shows the recorded pulse and the dashed linethe fitted fluorescence decay curve. The data points for the fluorescenceare marked as x in the figure. The curve was recorded observing thedecay from the upper level v2D3/2, and the lifetime was found to be770(80)ps.
decay rapidly due to collisions and only are present early inthe plasma evolution, the lower metastable levels persist to latertimes when the plasma background-radiation and temperaturehas diminished.
Fluorescent light was detected in a direction perpendicularto the flight direction of the ions and the direction of the excit-ing radiation. One decay channel, different from the excitation,was selected using a 0.25 m monochromator. The decay wasrecorded by a Hamamatsu 1564U micro-channel plate photo-multiplier connected to a Textronix Model No DSA 602 digitaloscilloscope. A more detailed description of the experimentalsetup can be found in Larsson et al. (1996). For each lifetimemeasurement two recordings were made; the dye laser pulseand the fluorescence decay. An example of recorded curves isshown in Fig. 1. The time response of the detection system wasmainly limited by the bandwidth of the oscilloscope input am-plifier. The finite rise-time of the PMT and signal cables alsocontributed to limiting the time response. The measured FWHMof the recorded laser pulse is therefore about 1 ns. The lifetimevalues were obtained in a least-square fit of the recorded flu-orescence to a convolution of the recorded laser pulse and anexponential. The lifetime values are given in Table 1. Two levelsbelonging to the 4d25p configuration were measured for com-parison with previous results, reported by Biemont et al. (1981)and Langhans et al. (1995), and a good agreement was obtained.
4. Oscillator strengths
The transition probability,Aul, can be derived by dividing thebranching fraction,Bul, with the lifetime of the upper level,τu.The transition probability can then be converted into an oscil-lator strength,f, by a numerical factor. Table 2 presents the loggf-values. Before deriving the oscillator strength, the intensityof the transitions too weak to be detected must be estimated.A Hartree-Fock calculation was performed, using the Cowancomputer code package (Cowan 1981), modified for PC by
Ralchenko & Kramida (1995). The configurations 4d3, 4d25s,4d25p, 4d26s, 4d26p, 4d5s5p, 4d5s2 and 5s25p were includedin the calculation. The wavefunctions used in the final calcula-tions were obtained after a least squares fit of calculated levelsto observed energy levels obtained by Kiess & Kiess (1930),Kiess (1953) and Johansson & Nilsson (1996). The theoreticalbranching fractions were compared with the experimental val-ues and were in most cases found to be in good agreement. Thecombined theoretical intensity of lines too weak to be detectedwas on the order of 10% of the total intensity from a given up-per level. The sum of the theoretical branching fractions wasused to correct the experimental values. This sum is given asthe residual in Table 2. The uncertainty in thef-values is esti-mated to be 25% in lines with high observed intensities and nomore than 40% in the weakest lines observed. The uncertaintyhas been estimated for each line individually, and is given in thelast column in Table 2.
The Zr III oscillator strengths used in the astrophysicalapplications of the next section were calculated by Redfors(1991) using the Cowan computer code. Using these oscillatorstrengths, a zirconium abundance of logNZr=3.92 (on a scalewhere logNH=12.00) has been derived for Zr III lines in theUV region (Leckrone et al. 1998). In a recent paper by Reader& Acquista (1997), oscillator strengths of Zr III transitions werecalculated also using the Cowan code. A comparison betweenthese two studies shows no significant difference in the oscil-lator strengths used in the determination of the Zr abundanceby Leckrone et al. (1998). However, in a paper by Brage et al.(1998) the importance of including core polarization in the cal-culation off-values for the spectra Sr II and Y III was pointedout. The Hartree-Fock values of Brage et al. (1998) agree withthe relativistic values of Redfors (1991). Adding the effect ofcore polarization for Y III, on average the values of Redforsshould be scaled down by a factor of 1.4 to account for thiseffect. A comparison of the Zr III oscillator strengths calculatedby Redfors and by Brage (1998) shows the same effect. By anal-ogy, a rough estimate of the effect of including the influence ofcore polarization in Redfors calculations on Zr III can be madeby dividing hisgf-values by a factor of 1.4. This scaling fac-tor was found by taking an average of the difference betweenRedfors’ and Brage’sgf-values. This had to be done since onlysome of the transitions calculated by Redfors were calculatedby Brage. In particular, the transitions of interest, in the region1900–2000A were not included by Brage. We estimate the accu-racy of the scaled values to be better than 30%. The scale factorof 1.4 in thef-value corresponds to an increase in the abundanceof appoximately 0.15 dex. This implies that the abundance ofZr in χ Lupi derived by (Leckrone et al. 1998) from Zr III linesin the ultraviolet should be corrected to be 4.07 dex.
5. Astrophysical applications
We have applied the newf-values described above to the de-termination of the zirconium abundance in the cool HgMn starχ Lupi (B9.5VpHgMn + A2Vm) from data obtained using theechelle mode of the Goddard High Resolution Spectrograph
300 C.M. Sikstrom et al.: Zr II oscillator strengths and the zirconium conflict inχ Lupi
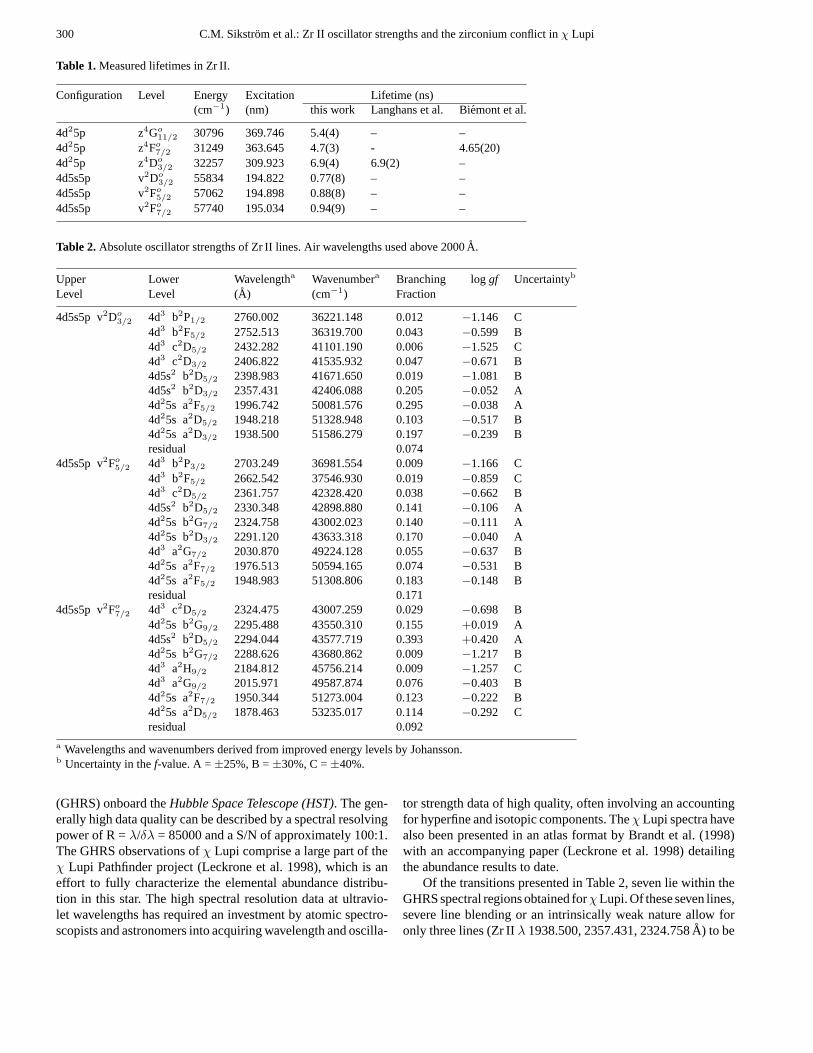
Table 1.Measured lifetimes in Zr II.
Configuration Level Energy Excitation Lifetime (ns)(cm−1) (nm) this work Langhans et al. Biemont et al.
4d25p z4Go11/2
30796 369.746 5.4(4) – –4d25p z4Fo
7/231249 363.645 4.7(3) - 4.65(20)
4d25p z4Do3/2
32257 309.923 6.9(4) 6.9(2) –4d5s5p v2Do
3/255834 194.822 0.77(8) – –
4d5s5p v2Fo5/2
57062 194.898 0.88(8) – –4d5s5p v2Fo
7/257740 195.034 0.94(9) – –
Table 2.Absolute oscillator strengths of Zr II lines. Air wavelengths used above 2000A.
Upper Lower Wavelengtha Wavenumbera Branching loggf Uncertaintyb
Level Level (A) (cm−1) Fraction
4d5s5p v2Do3/2
4d3 b2P1/2 2760.002 36221.148 0.012 −1.146 C4d3 b2F5/2 2752.513 36319.700 0.043 −0.599 B4d3 c2D5/2 2432.282 41101.190 0.006 −1.525 C4d3 c2D3/2 2406.822 41535.932 0.047 −0.671 B4d5s2 b2D5/2 2398.983 41671.650 0.019 −1.081 B4d5s2 b2D3/2 2357.431 42406.088 0.205 −0.052 A4d25s a2F5/2 1996.742 50081.576 0.295 −0.038 A4d25s a2D5/2 1948.218 51328.948 0.103 −0.517 B4d25s a2D3/2 1938.500 51586.279 0.197 −0.239 Bresidual 0.074
4d5s5p v2Fo5/2
4d3 b2P3/2 2703.249 36981.554 0.009 −1.166 C4d3 b2F5/2 2662.542 37546.930 0.019 −0.859 C4d3 c2D5/2 2361.757 42328.420 0.038 −0.662 B4d5s2 b2D5/2 2330.348 42898.880 0.141 −0.106 A4d25s b2G7/2 2324.758 43002.023 0.140 −0.111 A4d25s b2D3/2 2291.120 43633.318 0.170 −0.040 A4d3 a2G7/2 2030.870 49224.128 0.055 −0.637 B4d25s a2F7/2 1976.513 50594.165 0.074 −0.531 B4d25s a2F5/2 1948.983 51308.806 0.183 −0.148 Bresidual 0.171
4d5s5p v2Fo7/2
4d3 c2D5/2 2324.475 43007.259 0.029 −0.698 B4d25s b2G9/2 2295.488 43550.310 0.155 +0.019 A4d5s2 b2D5/2 2294.044 43577.719 0.393 +0.420 A4d25s b2G7/2 2288.626 43680.862 0.009 −1.217 B4d3 a2H9/2 2184.812 45756.214 0.009 −1.257 C4d3 a2G9/2 2015.971 49587.874 0.076 −0.403 B4d25s a2F7/2 1950.344 51273.004 0.123 −0.222 B4d25s a2D5/2 1878.463 53235.017 0.114 −0.292 Cresidual 0.092
a Wavelengths and wavenumbers derived from improved energy levels by Johansson.b Uncertainty in thef-value. A =±25%, B =±30%, C =±40%.
(GHRS) onboard theHubble Space Telescope (HST). The gen-erally high data quality can be described by a spectral resolvingpower of R =λ/δλ = 85000 and a S/N of approximately 100:1.The GHRS observations ofχ Lupi comprise a large part of theχ Lupi Pathfinder project (Leckrone et al. 1998), which is aneffort to fully characterize the elemental abundance distribu-tion in this star. The high spectral resolution data at ultravio-let wavelengths has required an investment by atomic spectro-scopists and astronomers into acquiring wavelength and oscilla-
tor strength data of high quality, often involving an accountingfor hyperfine and isotopic components. Theχ Lupi spectra havealso been presented in an atlas format by Brandt et al. (1998)with an accompanying paper (Leckrone et al. 1998) detailingthe abundance results to date.
Of the transitions presented in Table 2, seven lie within theGHRS spectral regions obtained forχLupi. Of these seven lines,severe line blending or an intrinsically weak nature allow foronly three lines (Zr IIλ 1938.500, 2357.431, 2324.758A) to be

C.M. Sikstrom et al.: Zr II oscillator strengths and the zirconium conflict inχ Lupi 301
Fig. 2.Zr II λ1938.500 forχ Lupi. The observed spectrum (solid line)is plotted along with synthetic spectrum computed for the the zirconiumabundances, log NZr = 2.60 (solar, dashed line), 2.86 (best fit, dotted),and 3.92 (Zr III best fit, dotted). This GHRS observation has R = 87000,LA/LB = 6.58 and∆λAB = +0.80A.
studied with confidence. Our synthetic spectrum technique hasbeen described in previous abundance analyses. It involves fit-ting the observed, flux normalized spectra with synthetic spectragenerated with the SYNTHE code (Kurucz 1993), and utilizesATLAS8 model atmospheres generated for stellar parametersas given by Wahlgren, Adelman, & Robinson (WAR, 1994) forboth components of theχ Lupi binary system. Synthetic spectrafor each of theχ Lupi components were coadded according tothe orbital ephemeris of Dworetsky (1972) and the light ratios,LA/LB , of WAR.
The line list data is that of Kurucz (1993), with the exceptionof the Zr II line data presented by this paper and changes made tothe line list that address blending issues in the immediate vicinityof the zirconium lines. Line broadening by radiative and colli-sional processes are accounted for through the semi-empiricalformalisms of Kurucz (1993). To our knowledge, neither experi-mental nor more elaborate calculations of broadening constantsspecific to the transitions of our study have been carried out.None of the three Zr II lines we are able to study provide mean-ingful line width information, particularly for the line wings,from which alternative Stark broadening formalisms may betested.
A thorough examination of line identifications for the wave-length region 1938–1948A has been undertaken from the GHRSspectrum ofχ Lupi (Leckrone, unpublished) and has been usedin this study. The lines of Zr II are represented as single com-ponent structures. Although terrestrial zirconium is comprisedof five stable isotopes, two of which are of odd atomic num-ber and possess hyperfine structure (hfs), no line broadeninghas been observed in our laboratory FTS spectra. Therefore, theline broadening mechanisms of hfs and isotopic shifs (IS) arenot a concern in our analysis. On the other hand, we do not havethe possibility to study the IS that are so important as constraintsto diffusion theory.
The results of the synthetic spectrum fitting are presentedgraphically in Figs. 2, 3 and 4. The figure captions provide
Fig. 3. Zr II λ2324.758 forχ Lupi. An upper limit abundance of logNZr = 3.26 is obtained from this feature. Figure symbols are as inFig. 2. The identity of the strong line at 2324.82A is unknown but hasbeen modeled to account for absorption in the wing of the Zr II line.For this observation R = 84100, LA/LB = 6.08, and∆λAB = +0.28A.
Fig. 4. Zr II λ2357.431 forχ Lupi. The upper limit abundance of logNZr = 3.26 is obtained for this feature. Figure symbols are as in Fig. 2.For this observation R = 87600, LA/LB = 6.06, and∆λAB = +0.59A.
details of the observations concerning the spectral resolvingpower, R =λ/δλ, and the wavelength shift,∆λAB = λA − λB ,between the binary components at the time of the observation.In each figure the observed spectrum (solid line) is comparedagainst three synthetic spectra representing the zirconium abun-dances (log NZr) for cases of the solar abundance (2.60, Anders& Grevesse 1989, dashed line), the best fit to the observed fea-ture (dotted), and the best fit to Zr III lines found in GHRSspectra (4.07, corrected Leckrone et al. 1998, dotted line).
Zr II λ1938.500 provides the most reliable zirconium abun-dance from among the Zr II lines. This line is unblended and isone of the strongest of the Zr II lines which we have investigated.It is best fit by the value log NZr = 2.86, which represents a weakzirconium enhancement (+0.26 dex) compared to the 1.47 dexenhancement evident from strong Zr III lines.
The remaining two lines analysed (Zr IIλ2324.758,2357.431) serve to confirm the result from the 1938.500 line.However, due to unresolved line blending issues the abundancesderived are considered to be upper limits. For both of these lines

302 C.M. Sikstrom et al.: Zr II oscillator strengths and the zirconium conflict inχ Lupi
the zirconium abundance must be less than log NZr = 3.26. ForZr II λ2324.758 the line blending concerns centered around thepotential contributions to the line wings by the relatively distantlines Ni I λ2324.654 and Mn IIλ2324.664. The original syn-thetic spectrum (not pictured) produced strong absorption fromthe Ni I line. Its oscillator strength was reduced from the valuefound in the Kurucz line list (loggf = +0.009) by an arbitraryamount to the value of loggf = -1.000. This result is presentedby Fig. 2. The contribution of this feature at the location of theZr II line is trivial. An unidentified line(s) exists at the locationnear 2324.82A. We have included a fictitious Fe II line into ourline list at this location for the purpose of reproducing the lineabsorption contribution in the wing of the Zr II line. The resultsof this calculation show that the Zr abundance based on Zr IIIproduces absorption for Zr II that is significantly greater thanthe observation.
Absorption at the location of the Zr IIλ2357.431 line alsosuffers from the effects of line blending. We chose not to in-clude fictitious lines into the analysis since the broader natureof the blend indicates multiple line blending with perhaps con-tributions from the companion star. The zirconium abundanceof 3.26 dex produces absorption that attains the depth of the ob-servation and clearly indicates that the abundance from Zr IIIlines is greater than that afforded by this Zr II line.
6. Conclusions
A conflict in the zirconium abundance derived from lines of Zr IIand Zr III in the UV region in the starχ Lupi has been observed.Using the emission method, combining experimental branchingfraction measurements with radiative lifetimes, we have derivedabsolute oscillator strengths for 27 lines of Zr II. Also, Redfors’(1991) theoreticalgf-values for Zr III lines have been scaled toaccount for the influence of core polarization which was nottaken into account in that calculation.
The application of the new oscillator strength data to thespectra of the HgMn starχ Lupi confirms the earlier ionizationimbalance determined from computed oscillator strength datafor Zr II lines at ultraviolet wavelengths. The small differencefrom the earlier work acts to slightly increase the magnitudeof the imbalance, which is significantly greater than the uncer-tainties of the experimentalf-value determination. We thereforeconclude that the LTE abundance difference obtained from dif-ferent ions is not the result of incorrectf-values. The cause ofthe imbalance must therefore lie in other sources, such as theappropriateness of the stellar model and the effects of non-LTEand diffusion processes.
Acknowledgements. The authors would like to thank Dr. U. Litzen forassistance and guidance especially during the laboratory FTS work.This project is supported by the Swedish National Science ResearchCouncil and the Swedish National Space Board. GMW wishes toacknowledge financial support from the Crafoord Foundation.
References
Anders E., Grevesse N.; 1989, Geochim. Cosmochim. Acta 53, 197Biemont E., Grevesse N., Hannaford P., Lowe R.M., 1981, ApJ 248,
867Brage T., Wahlgren G.M., Johansson S.G., Leckrone D.S., Proffitt C.R.,
1998, ApJ 496, 1051Brage T., 1998, Private communicationBrandt J.C., Heap S.R., Beaver E.A., et al., 1999, AJ in pressBrault J.W., Abrams M.C., 1989, High Resolution Fourier Transform
Spectroscopy. OSA Technical Digest Series, vol. 6, Optical Societyof America, Washington, 110
Cowan R.D., 1981, The Theory of Atomic Structure and Spectra. Univ.of California Press, Berkeley
Cowley C.R., Aikman G.C.L., 1975 ApJ 196, 521Dworetsky M.M., 1972, PASP 84, 254Heacox W.D., 1979, ApJS 41, 675Johansson S., Nilsson A.E., 1996, Private communicationKiess C.C., Kiess H.K., 1930, J. Res. Nat. Bur. Stand. 5, 1205Kiess C.C., 1953, JOSA 43, 1024Kurucz R.L., 1993, SYNTHE Synthesis Programs and Line Data. Ku-
rucz CD-ROM No. 18Langhans G., Schade W., Helbig V., 1995, Z. Phys. D 34, 151Larsson J., Zerne R., Lundberg H., 1996, J. Phys. B 29, 1895Leckrone D.S., Johansson S., Wahlgren G.M., Adelman S.J., 1993a,
Phys. Scripta T47, 149Leckrone D.S., Wahlgren G.M., Johansson S., Adelman S.J., 1993b,
Peculiar versus Normal Phenomena in A-Type and Related Stars.In: Dworetsky M.M., Castelli F., Faraggiani R. (eds.) ASP Conf.Ser. 44, 42
Leckrone D.S., Johansson S.G., Wahlgren G.M., Proffitt C.R., BrageT., 1998, The Scientific Impact of the Goddard High ResolutionSpectrograph. In: Brandt J.C., Ake III T.B., Petersen C.C. (eds.)ASP Conf. Ser. 143, 135
Leckrone D.S., Proffitt C.R., Wahlgren G.M., Johansson S., Brage T.,1999, AJ in press
Ralchenko Yu. V., Kramida A.E., 1995, private communicationReader J., Acquista N., 1997, Physica Scripta 55, 310Redfors A., 1991, A&A 249, 589Thorne A.P., Harris C.J., Wynne-Jones I., Learner R.C.M., Cox G.,
1987, J. Phys. E 20, 54Wahlgren G.M., Adelman S.J., Robinson R.L., 1994, ApJ 434, 349Whaling W., Carle M.T., Pitt M.L., 1993, JQSRT 50, 7


![Zrii+Vics+Ultimate+O.M.[1] Final[1]](https://img.pdfslide.us/doc/110x75/554eb6f6b4c905fb7c8b54c0/zriivicsultimateom1-final1.jpg)