Embed Size (px)
Citation preview
New Zealand socio-economic index 2006
Barry J Milne, PhD
Ui Byun, MSc
Alan Lee, PhD
Crown copyright ©
This work is licensed under the Creative Commons Attribution 3.0 New Zealand licence. You
are free to copy, distribute, and adapt the work, as long as you attribute the work to Statistics
NZ and abide by the other licence terms. Please note you may not use any departmental or
governmental emblem, logo, or coat of arms in any way that infringes any provision of the
Flags, Emblems, and Names Protection Act 1981. Use the wording 'Statistics New Zealand' in
your attribution, not the Statistics NZ logo.
Disclaimer This report represents the views of the authors. It does not necessarily represent the views of Statistics NZ and does not imply commitment by Statistics NZ to adopt any findings, methodologies, or recommendations. Any data analysis was carried out under the security and confidentiality provisions of the Statistics Act 1977. Unless otherwise stated, results presented are the result of data analysis undertaken by the authors.
Liability statement While all care and diligence has been used in processing, analysing, and extracting data and information in this publication, Statistics New Zealand gives no warranty it is error free and will not be liable for any loss or damage suffered by the use directly, or indirectly, of the information in this publication.
Citation
Milne, BJ, Byun, U, & Lee, A (2013). New Zealand socio-economic index 2006. Wellington:
Statistics New Zealand.
This report is an update and revision of the New Zealand socio-economic index 1996.
ISBN 978-0-478-40833-1 (online) ISBN 978-0-478-40834-8 (print)
Published in June 2013 by
Statistics New Zealand
Tatauranga Aotearoa
Wellington, New Zealand
Contact
Statistics New Zealand Information Centre:
Phone toll-free 0508 525 525
Phone international +64 4 931 4610
www.stats.govt.nz
3
Contents
Acknowledgements ............................................................................................................ 8
Abbreviations used in this report ..................................................................................... 9
Executive summary .......................................................................................................... 10 Using NZSEI-06 ............................................................................................................. 11
1 Introduction and background to the report .............................................................. 12 1.1 Development of NZSEI ............................................................................................ 12 1.2 Issues for resolution in NZSEI-06 study .................................................................. 16 1.3 Planned validation of NZSEI-06 .............................................................................. 20 1.4 Summary.................................................................................................................. 21
2 NZSEI-06 dataset ......................................................................................................... 22 2.1 Construction of the variables for NZSEI-06 ............................................................. 22 2.2 Selected demographic data ..................................................................................... 27 2.3 Summary and discussion ........................................................................................ 36
3 Construction of NZSEI-06 scale ................................................................................. 37 3.1 Statistical algorithm used in the construction of NZSEI-06 scale ........................... 37 3.2 Interim NZSEI-06 scores (full-time workforce only) ................................................ 38 3.3 Incorporation of part-time workers into the finalised scale ...................................... 38 3.4 Assessment of potential understatement of income of self-employed workers ...... 42 3.5 Overall effect of including part-time workers. .......................................................... 43 3.6 Dividing NZSEI-06 scores into socio-economic groups .......................................... 46 3.7 Summary and discussion ........................................................................................ 48
4 Assessing the finalised NZSEI-06 .............................................................................. 49 4.1 Comparison between NZSEI-06 and NZSEI-96...................................................... 49 4.2 Comparison between NZSEI-06 and AUSEI06....................................................... 50 4.3 Analyses by sex and ethnicity ................................................................................. 52 4.4 Construct validation of NZSEI-06 – bivariate results .............................................. 63 4.5 Construct validation of NZSEI-06 – multi-variable analyses ................................... 70 4.6 Summary and discussion ........................................................................................ 75
5 Imputing NZSEI-06 scores in the absence of occupational data ........................... 77 5.1 Imputing NZSEI-06 scores: results of two alternative methods .............................. 77 5.2 Comparison of actual and imputed scores .............................................................. 85 5.3 Validation against health and socio-economic correlates ....................................... 87 5.4 Summary and discussion ........................................................................................ 90
New Zealand socio-economic index 2006
4
6 Conclusion ................................................................................................................... 92 6.1 Advantages of NZSEI-06 as a measure of socio-economic status......................... 93 6.2 Limitations of NZSEI-06 ........................................................................................... 94 6.3 Future work .............................................................................................................. 94
7 References.................................................................................................................... 96
Appendix I: Occupation by sex ...................................................................................... 98
Appendix II: Occupations of waged and self-employed workers ............................. 102
Appendix III: Final NZSEI-06 scores ............................................................................. 106
Appendix IV: NZSEI-06 groups and final scores ......................................................... 113
Appendix V: Using NZSEI-06 ......................................................................................... 117 Coding occupation ....................................................................................................... 117 Coding NZSEI-06 ......................................................................................................... 117 Coding those not in the workforce ............................................................................... 118
5
List of tables and figures
Tables by chapter
1 Introduction and background to the report 1 NZSEI-96 results aggregated at the NZSCO95 sub-major group (two-digit level) .... 14 2 Distribution of workforce over NZSEI groups, 1996 ................................................... 15 3 Major occupational groups, NZSO95 and ANZSCO classifications .......................... 18 4 Comparison of beta values, New Zealand, Australian, and international
socioeconomic indexes ............................................................................................. 19
2 NZSEI-06 dataset 5 Educational classifications converted to years of education, 1996 and 2006
Censuses .................................................................................................................. 23 6 Highest qualification and years of education, full-time workers aged 21–69 ............. 24 7 Proportion of workers in various income bands, full-time workers aged 21–69 ........ 25 8 Income bands and assigned mid points, 2006 Census ............................................. 26 9 Income by occupation, full-time workers aged 21–69 years ...................................... 28 10 Income by highest qualification, full-time workers aged 21 to 69 years .................. 30 11 Highest qualification by occupation, full-time workers aged 21–69 ......................... 31 12 Income distribution by ethnicity, full-time workers aged 21 to 69 years .................. 32 13 Highest qualifications by ethnicity, full-time workers aged 21–69 years .................. 33 14 Ethnicity by occupation, full-time workers aged 21–69 ............................................ 34
3 Construction of NZSEI-06 scale 15 Interim NZSEI 06 scores, full-time workers .............................................................. 38 16 NZSEI-06 scores, full-and part-time workers ........................................................... 39 17 NZSEI-06 scores, full-time workers, full-time and part-time workers combined ...... 44 18 Comparison of beta values, NZSEI-06, NZSEI-96, NZSEI-91, ANU4, AUSEI06,
and ISEI-88 ............................................................................................................... 45 19 Suggested SES group divisions, six, four (quartile), and ten (decile) groups .......... 48
4 Assessing the finalised NZSEI-06 20 Differences in mean income and education, males compared with females ........... 54 21 Differences in mean income, European and Other ethnic group compared with
Māori, Pacific, and Asian .......................................................................................... 60 22 Differences in mean education, European and Other ethnic group compared with
Māori, Pacific, and Asian .......................................................................................... 62 23 Odds ratios for smoking, NZSEI-06 continuous measure ........................................ 71 24 Odds ratios for living in an owned home, NZSEI-06 continuous measure .............. 72 25 Odds ratios for having access to two or more vehicles, NZSEI-06 continuous
measure .................................................................................................................... 73
New Zealand socio-economic index 2006
6
26 Beta coefficients for scores on the NZDep2006 scale, NZSEI-06 continuous measure .................................................................................................................... 74
5 Imputing NZSEI-06 scores in the absence of occupational data 27 Distribution of people with an occupation, by age-band and qualification ............... 78 28 Imputed mean NZSEI-06 scores, for each age/qualification category, method 1 ... 80 29 Imputed mean NZSEI-06 scores by sex, for each age/qualification category,
method I .................................................................................................................... 81 30 Imputed mean NZSEI-06 scores, for each age/qualification category, both
unadjusted and adjusted for sex, method II ............................................................. 82 31 Imputed mean NZSEI-06 scores by sex, for each age/qualification category,
method II ................................................................................................................... 84 32 Imputed mean NZSEI-06 score, for each age/qualification category, method II ..... 85 33 Correlations between actual and imputed NZSEI-06 scores, workers ages 15+
years ......................................................................................................................... 86 34 Mean error (absolute difference) between imputed and actual NZSEI-06 scores,
method I (simple averages) and method II (regression equation) ........................... 86
Appendixes A1 Occupation by sex, full-time workers aged 21–69 years ......................................... 98 A2 Occupations of waged and self-employed workers, full- and part-time workers aged
21–69 years ............................................................................................................ 102 A3 Final NZSEI-06 scores, ANZSCO major, sub-major, and minor group level ........ 106 A4 NZSEI-06 groups and final scores ......................................................................... 113 A5 Suggested imputed NZSEI-06 scores for those not in the workforce, based on age
and highest qualification ......................................................................................... 119
Figures by chapter
1 Introduction and background to the report 1 Representation of NZSEI path model ......................................................................... 13
3 Construction of NZSEI-06 scale 2 Comparison of NZSEI-06 scores, full-time workers compared with full-time and part-
time workers (both sexes)......................................................................................... 40 3 Comparison of NZSEI-06 scores, full-time workers compared with full-time and part-
time workers, by sex and ethnicity ............................................................................ 41 4 Difference between waged and self-employed incomes, minor-group occupations . 42 5 Mean income and education for ANZSCO minor group occupations, workers aged
21–69 years .............................................................................................................. 47
4 Assessing the finalised NZSEI-06 6 NZSEI-96 versus NZSEI-06 scores, NZSCO95 and ANZSCO minor group ............. 50 7 NZSEI-06 versus AUSEI06 scores, ANZSCO minor group ....................................... 51 8 Comparison of male and female NZSEI-06 scores, ANZSO minor group ................. 53
New Zealand socio-economic index 2006
7
9 Mean values for income, years of education, and age, males compared with females for each occupation (ANZSCO minor group) ........................................................... 53
10 NZSEI-06 scores (ANZSCO minor group), comparison of ethnicities ..................... 55 11 Mean income ($000s) for ANZSCO minor group occupations, comparison of
ethnicities .................................................................................................................. 56 12 Mean years of education for ANZSCO minor group occupations, comparison of
ethnicities .................................................................................................................. 57 13 Mean age for ANZSCO minor group occupations, comparison of ethnicities ......... 58 14 Smoking prevalence, by NZSEI-06 SES group........................................................ 63 15 Smoking prevalence, by NZSEI-06 SES group, sex, and ethnicity ......................... 64 16 Home ownership, by NZSEI-06 SES group ............................................................. 65 17 Home ownership, by NZSEI-06 SES group, sex, and ethnicity ............................... 66 18 Access to two or more vehicles, by NZSEI-06 SES group ...................................... 67 19 Access to two or more vehicles, by NZSEI-06 SES group, sex, and ethnicity ........ 68 20 Mean scores on NZDep2006 scale, by NZSEI-06 SES group ................................ 69 21 Mean scores on NZDep2006 scale, by NZSEI-06 SES group, sex, and ethnicity .. 70 22 Odds ratios for smoking, NZSEI-06 categorical measure ........................................ 72 23 Odds ratios for housing tenure, NZSEI-06 categorical measure ............................. 73 24 Odds ratios for access to two or more vehicles, NZSEI-06 categorical measure ... 74 25 Beta coefficients for scores on the NZDep2006 scale, NZSEI-06 categorical
measure .................................................................................................................... 75
5 Imputing NZSEI-06 scores in the absence of occupational data 26 Odds ratios for smoking, comparison between actual and imputed NZSEI-06
scores (per 10 units) ................................................................................................. 88 27 Odds ratio for housing tenure, comparison between actual and imputed NZSEI-06
scores (per 10 units) ................................................................................................. 89 28 Odds ratio for access to two or more vehicles, comparison between actual and
imputed NZSEI-06 scores (per 10 units) .................................................................. 89 29 Beta coefficients for scores on the NZDep2006 scale, comparison between actual
and imputed NZSEI-06 scores (per 10 units) ........................................................... 90
8
Acknowledgements
This report would not have been possible without the support of Statistics New Zealand, who provided the data, helped release the results, and edited the report. Fiona Wharton, James Sinclair, Eleanor Meecham, Jaap Jasperse and John Upfold deserve the greatest praise, and Joanne Alexander and other staff at the Statistics NZ office in Auckland also deserve thanks for the working environment they provided at the Data Lab. I would like to thank Martin von Randow for my introduction to Statistics NZ’s data and processes, and to thank Gerry Cotterell, Katharina Bauer, Alex Zadoyanov, Tom Crick, and Kirsten Brown for their administrative assistance during the research and writing of this report. Useful comments on various drafts of this report were made by Peter Davis, Roy Lay-Yee, Charles Crothers, Kristie Carter, Julie McMillan, and Andrew Sporle.
9
Abbreviations used in this report
ANU4 Australian National University occupational status scale 4
ANZSCO Australian and New Zealand Standard Classification of Occupations
AUSEI Australian socio-economic index
AUSEI06 Australian socio-economic index 2006
ISEI International socio-economic index
ISEI-88 International socio-economic index 1988
ISCO88 International Standard Classification of Occupations 1988
NZDep NZDep index of deprivation
NZDep2006 NZDep index of deprivation 2006
NZiDep New Zealand index of socioeconomic deprivation for individuals
NZSEI New Zealand socio-economic index
NZSEI-06 New Zealand socio-economic index 2006
NZSEI-91 New Zealand socio-economic index 1991
NZSEI-96 New Zealand socio-economic index 1996
NZSCO90 New Zealand Standard Classification of Occupations 1990
NZSCO95 New Zealand Standard Classification of Occupations 1995
SES Socio-economic status
10
Executive summary
This report describes the construction and initial assessment of the New Zealand socio-economic index 2006 (NZSEI-06), which is an update of the New Zealand socio-economic index (NZSEI) using 2006 Census data. Both NZSEI-06 socio-economic scores (ranging from 10–90) and NZSEI-06 socio-economic groups (a six-group classification, NZSEI-06 quartiles and NZSEI-06 deciles) are described and evaluated.
Section 1 describes the construction of the previous NZSEI indexes – NZSEI-91 derived from 1991 Census data and NZSEI-96 derived from 1996 Census data. The validation of the most-recent NZSEI-96 is also summarised. Issues to be considered in the development of NZSEI-06 are described. These include:
(i) transforming the scale to reduce skew (ii) re-assessing the need to adjust the incomes of self-employed workers (iii) using the recently-adopted Australian and New Zealand Standard
Classification of Occupations (ANZSCO) system to classify occupations, as a replacement for the system used in previous versions of NZSEI – the New Zealand Standard Classification of Occupations (eg, NZSCO90 and NZSCO95)
(iv) examining whether the path coefficients for the education-occupation and occupation-income paths are closer to international scales than was the case for NZSEI-96
(v) validating results for a wider range of New Zealand ethnic groups than Māori versus non-Māori.
Section 2 describes the variables used to construct NZSEI-06, and cross-tabulates relevant demographic data from the 2006 Census against these variables.
Section 3 describes the construction of NZSEI-06. An ‘interim’ scale is first constructed using data for full-time workers only (21–69-year-olds). The finalised scale is then constructed using data for both full- and part-time workers, with income adjustments for those in part-time work. There was little evidence that the incomes of self-employed workers were underestimated. As such, the finalised scale did not include any inflation of the incomes of self-employed workers, as had been undertaken in NZSEI-96 and international scales, eg, the Australian socio-economic index (AUSEI06). The beta values obtained during construction of NZSEI-06 are presented for each of the regression paths estimated, and comparisons with the AUSEI06 and the international socio-economic index (ISEI) are made. The beta values for the education-occupation and the occupation-income paths were found to be far closer to the AUSEI06 and ISEI values than had been the case for NZSEI-96. Pragmatic ways to divide NZSEI-06 scores into discrete categorical occupational socio-economic groups are described in this section. Four-group, six-group, and 10-group categorisations are described.
Section 4 describes four assessments of the finalised NZSEI-06.
First, a comparison between NZSEI-06 and the earlier NZSEI-96 showed that both scales classified individuals from the 2006 Census similarly, but not identically.
Second, a comparison between NZSEI-06 and AUSEI06 showed that the scales classified occupations very similarly, suggesting both that NZSEI-06 is robust and that the socio-economic structure of the New Zealand and Australian workforces is similar.
Third, an assessment was undertaken of whether NZSEI-06 methodology assigns scores similarly for males and females, and similarly for different ethnic groups. This showed that, despite some differences in average scores between males and females and between different ethnic groups, occupations were classified very similarly by sex-specific
New Zealand socio-economic index 2006
11
and ethnic-specific scales, suggesting NZSEI-06 is applicable to both sexes and to these ethnic groups.
Fourth, validation of NZSEI-06 against four constructs – smoking, housing tenure, motor vehicle access, and residential deprivation – revealed expected socio-economic patterning for each of these outcomes, with results clearest for smoking and residential deprivation.
Section 5 compares two methods for imputing NZSEI-06 scores when data on occupation are unavailable:
• a method based on the average NZSEI-06 score by age and education
• a method using the results of a regression model of NZSEI-06 against age and education.
An evaluation of these methods against actual scores, and validation of both methods against health and socio-economic correlates, revealed that there was little to separate the two methods. However, both methods produced a restricted range of scores compared with the actual NZSEI-06, suggesting that neither was suitable for the assignment of socio-economic groups. It is suggested that in the absence of other evidence to choose between them, and in the absence of other ‘proxy’ information, such as previous occupation, the simplicity of the ‘averages’ method favours it as the preferred approach.
Section 6 concludes the report, with a summary of key findings and their implications for future work in the assessment of occupation-based socio-economic status, as well as a discussion of advantages and disadvantages of the scale.
Using NZSEI-06 Readers wishing to use NZSEI-06 without learning about its background and construction should see appendixes III to V.
Appendix III presents a list of NZSEI-06 scores for each ANZSCO major, sub-major, and minor group occupation.
Appendix IV presents a list of NZSEI-06 groups for each ANZSCO minor group occupation.
Appendix V presents some brief notes on how to use NZSEI-06 and a table of ‘imputed’ NZSEI-06 scores to be used for individuals for whom there are no occupational data.
12
1 Introduction and background to the report
This report describes the construction of an updated version of the New Zealand socio-economic index (NZSEI), an occupation-based measure of socio-economic status (SES). The original version, NZSEI-91, was derived using 1991 Census data (Davis, McLeod, Ransom, & Ongley, P, 1997), while the follow-up, NZSEI-96, was derived using 1996 Census data (Davis, Jenkin, & Coope, 2003). The updated version described in this report, NZSEI-06, is derived using 2006 Census data and uses a new classification system for occupation, the Australian and New Zealand Standard Classification of Occupations (ANZSCO). This section describes the development of NZSEI, including some results from the most recent NZSEI-96, and outlines the issues to be tackled in the construction of NZSEI-06.
1.1 Development of NZSEI Theoretical basis The forerunner of NZSEI was the widely-used Elley-Irving scale (Elley and Irving 1972; 1976; 1985; Irving and Elley, 1977), which assigned occupations into one of six SES groups based on equal weighting of the education-level and income associated with each occupation. NZSEI represented an attempt to derive an occupation-based measure of SES for New Zealand that could be used both as a continuous or group measure, and was grounded on a conceptual model that differed slightly from the Elley-Irving framework, as described in the ‘Statistical algorithm’ section, below.
The framework used for NZSEI is the ‘returns to human capital’ model, which was first developed for the international socio-economic index (ISEI) (Ganzeboom, De-Graaf, Treiman, and De-Leeuw, 1992). This model posits that there is a relationship between cultural capital (ie, education) and material rewards (ie, income), and that this relationship is mediated through occupation. More simply, the ‘returns to human capital’ model views occupation as the means by which one’s education is converted into income. Thus, differences in occupation are likely to represent differences in life chances and opportunity, and on this basis occupation can be used to stratify individuals according to socio-economic status.
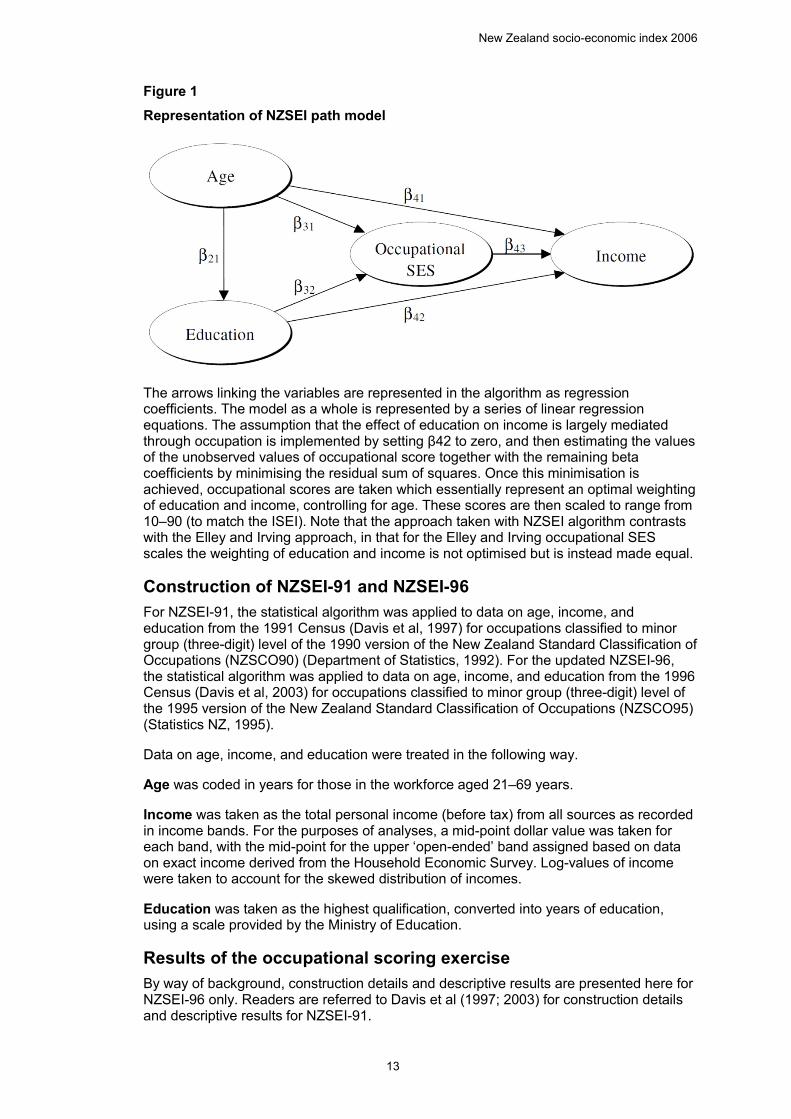
Statistical algorithm Operationalising the ‘returns to human capital’ model involves specifying the path model developed for the ISEI by De Leeuw in an appendix to Ganzeboom et al (1992). Regression equations are estimated iteratively such that the direct effect of education on income is minimised, while the indirect effect of education on income that is mediated by occupation is maximised. Occupational scores that maximise this mediated path are generated in the process. The effect of age is controlled in analyses because of its confounding relationship with education and income (ie, older people tend to have fewer qualifications but higher incomes). The model is represented in figure 1.
New Zealand socio-economic index 2006
13
Figure 1 Representation of NZSEI path model 1 Representation of NZSEI path model
The arrows linking the variables are represented in the algorithm as regression coefficients. The model as a whole is represented by a series of linear regression equations. The assumption that the effect of education on income is largely mediated through occupation is implemented by setting β42 to zero, and then estimating the values of the unobserved values of occupational score together with the remaining beta coefficients by minimising the residual sum of squares. Once this minimisation is achieved, occupational scores are taken which essentially represent an optimal weighting of education and income, controlling for age. These scores are then scaled to range from 10–90 (to match the ISEI). Note that the approach taken with NZSEI algorithm contrasts with the Elley and Irving approach, in that for the Elley and Irving occupational SES scales the weighting of education and income is not optimised but is instead made equal.
Construction of NZSEI-91 and NZSEI-96 For NZSEI-91, the statistical algorithm was applied to data on age, income, and education from the 1991 Census (Davis et al, 1997) for occupations classified to minor group (three-digit) level of the 1990 version of the New Zealand Standard Classification of Occupations (NZSCO90) (Department of Statistics, 1992). For the updated NZSEI-96, the statistical algorithm was applied to data on age, income, and education from the 1996 Census (Davis et al, 2003) for occupations classified to minor group (three-digit) level of the 1995 version of the New Zealand Standard Classification of Occupations (NZSCO95) (Statistics NZ, 1995).
Data on age, income, and education were treated in the following way.
Age was coded in years for those in the workforce aged 21–69 years.
Income was taken as the total personal income (before tax) from all sources as recorded in income bands. For the purposes of analyses, a mid-point dollar value was taken for each band, with the mid-point for the upper ‘open-ended’ band assigned based on data on exact income derived from the Household Economic Survey. Log-values of income were taken to account for the skewed distribution of incomes.
Education was taken as the highest qualification, converted into years of education, using a scale provided by the Ministry of Education.
Results of the occupational scoring exercise By way of background, construction details and descriptive results are presented here for NZSEI-96 only. Readers are referred to Davis et al (1997; 2003) for construction details and descriptive results for NZSEI-91.
New Zealand socio-economic index 2006
14
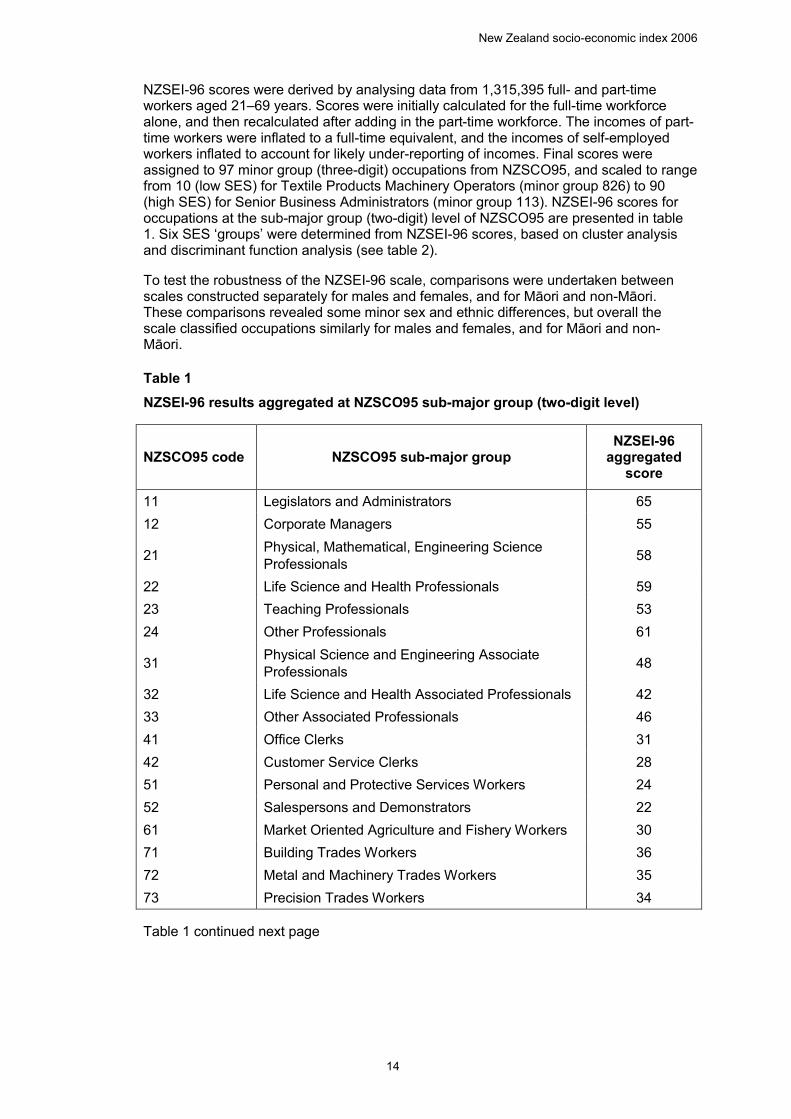
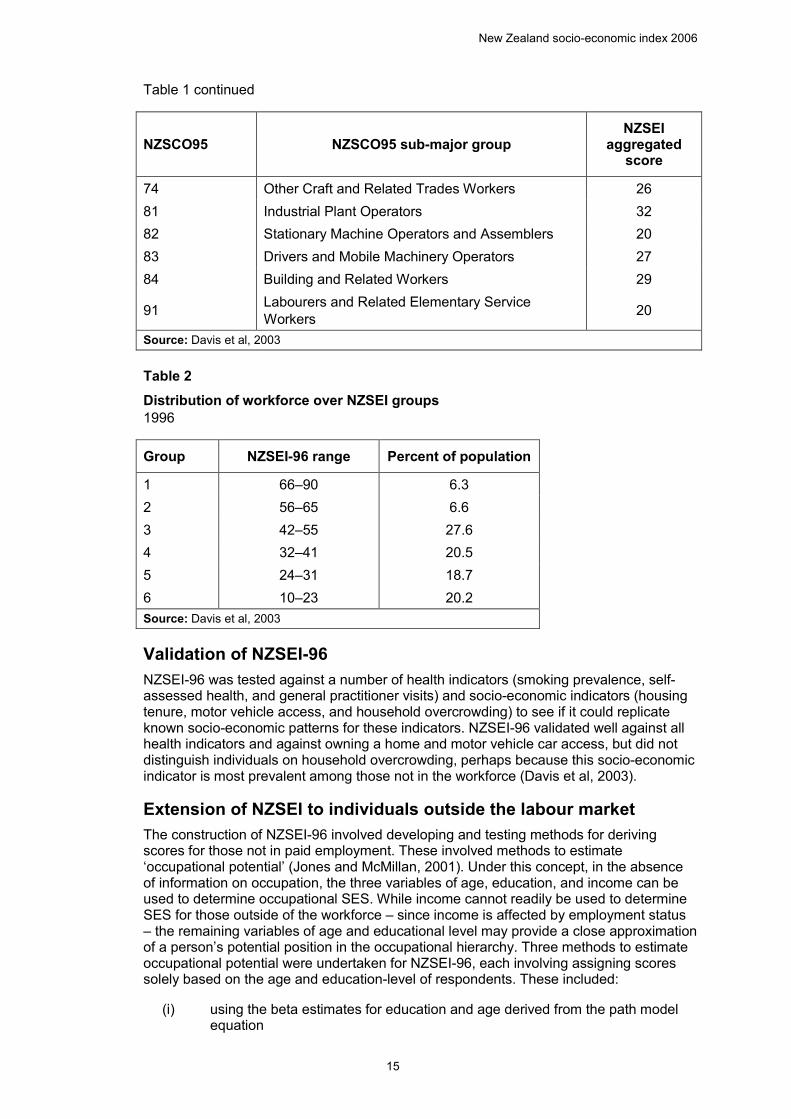
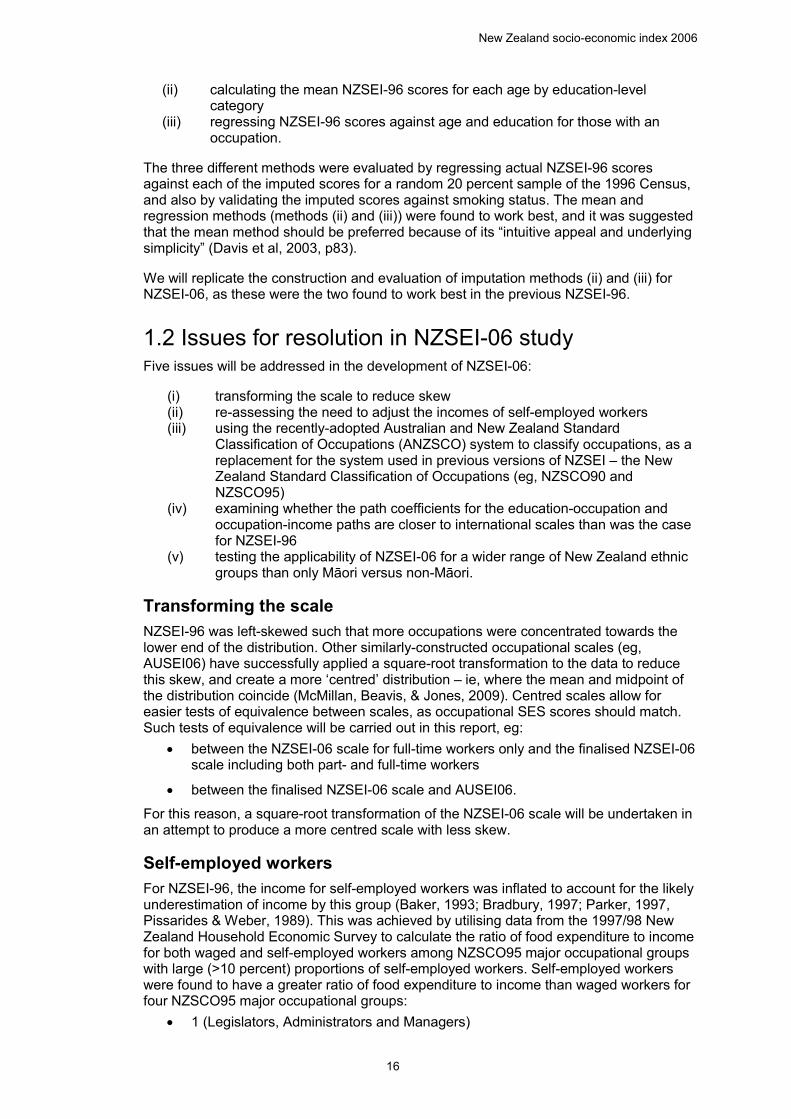
NZSEI-96 scores were derived by analysing data from 1,315,395 full- and part-time workers aged 21–69 years. Scores were initially calculated for the full-time workforce alone, and then recalculated after adding in the part-time workforce. The incomes of part-time workers were inflated to a full-time equivalent, and the incomes of self-employed workers inflated to account for likely under-reporting of incomes. Final scores were assigned to 97 minor group (three-digit) occupations from NZSCO95, and scaled to range from 10 (low SES) for Textile Products Machinery Operators (minor group 826) to 90 (high SES) for Senior Business Administrators (minor group 113). NZSEI-96 scores for occupations at the sub-major group (two-digit) level of NZSCO95 are presented in table 1. Six SES ‘groups’ were determined from NZSEI-96 scores, based on cluster analysis and discriminant function analysis (see table 2).
To test the robustness of the NZSEI-96 scale, comparisons were undertaken between scales constructed separately for males and females, and for Māori and non-Māori. These comparisons revealed some minor sex and ethnic differences, but overall the scale classified occupations similarly for males and females, and for Māori and non-Māori.
Table 1 NZSEI-96 results aggregated at NZSCO95 sub-major group (two-digit level) 1 NZSEI-96 results aggregated at the NZSCO95 sub-major group (two-digit level)
NZSCO95 code NZSCO95 sub-major group NZSEI-96
aggregated score
11 Legislators and Administrators 65 12 Corporate Managers 55
21 Physical, Mathematical, Engineering Science Professionals 58
22 Life Science and Health Professionals 59 23 Teaching Professionals 53 24 Other Professionals 61
31 Physical Science and Engineering Associate Professionals 48
32 Life Science and Health Associated Professionals 42 33 Other Associated Professionals 46 41 Office Clerks 31 42 Customer Service Clerks 28 51 Personal and Protective Services Workers 24 52 Salespersons and Demonstrators 22 61 Market Oriented Agriculture and Fishery Workers 30 71 Building Trades Workers 36 72 Metal and Machinery Trades Workers 35 73 Precision Trades Workers 34
Table 1 continued next page
New Zealand socio-economic index 2006
15
Table 1 continued
NZSCO95 NZSCO95 sub-major group NZSEI
aggregated score
74 Other Craft and Related Trades Workers 26 81 Industrial Plant Operators 32 82 Stationary Machine Operators and Assemblers 20 83 Drivers and Mobile Machinery Operators 27 84 Building and Related Workers 29
91 Labourers and Related Elementary Service Workers 20
Source: Davis et al, 2003
Table 2 Distribution of workforce over NZSEI groups 1996 2 Distribution of workforce over NZSEI groups, 1996
Group NZSEI-96 range Percent of population
1 66–90 6.3 2 56–65 6.6 3 42–55 27.6 4 32–41 20.5 5 24–31 18.7 6 10–23 20.2 Source: Davis et al, 2003
Validation of NZSEI-96 NZSEI-96 was tested against a number of health indicators (smoking prevalence, self-assessed health, and general practitioner visits) and socio-economic indicators (housing tenure, motor vehicle access, and household overcrowding) to see if it could replicate known socio-economic patterns for these indicators. NZSEI-96 validated well against all health indicators and against owning a home and motor vehicle car access, but did not distinguish individuals on household overcrowding, perhaps because this socio-economic indicator is most prevalent among those not in the workforce (Davis et al, 2003).
Extension of NZSEI to individuals outside the labour market The construction of NZSEI-96 involved developing and testing methods for deriving scores for those not in paid employment. These involved methods to estimate ‘occupational potential’ (Jones and McMillan, 2001). Under this concept, in the absence of information on occupation, the three variables of age, education, and income can be used to determine occupational SES. While income cannot readily be used to determine SES for those outside of the workforce – since income is affected by employment status – the remaining variables of age and educational level may provide a close approximation of a person’s potential position in the occupational hierarchy. Three methods to estimate occupational potential were undertaken for NZSEI-96, each involving assigning scores solely based on the age and education-level of respondents. These included:
(i) using the beta estimates for education and age derived from the path model equation
New Zealand socio-economic index 2006
16
(ii) calculating the mean NZSEI-96 scores for each age by education-level category
(iii) regressing NZSEI-96 scores against age and education for those with an occupation.
The three different methods were evaluated by regressing actual NZSEI-96 scores against each of the imputed scores for a random 20 percent sample of the 1996 Census, and also by validating the imputed scores against smoking status. The mean and regression methods (methods (ii) and (iii)) were found to work best, and it was suggested that the mean method should be preferred because of its “intuitive appeal and underlying simplicity” (Davis et al, 2003, p83).
We will replicate the construction and evaluation of imputation methods (ii) and (iii) for NZSEI-06, as these were the two found to work best in the previous NZSEI-96.
1.2 Issues for resolution in NZSEI-06 study Five issues will be addressed in the development of NZSEI-06:
(i) transforming the scale to reduce skew (ii) re-assessing the need to adjust the incomes of self-employed workers (iii) using the recently-adopted Australian and New Zealand Standard
Classification of Occupations (ANZSCO) system to classify occupations, as a replacement for the system used in previous versions of NZSEI – the New Zealand Standard Classification of Occupations (eg, NZSCO90 and NZSCO95)
(iv) examining whether the path coefficients for the education-occupation and occupation-income paths are closer to international scales than was the case for NZSEI-96
(v) testing the applicability of NZSEI-06 for a wider range of New Zealand ethnic groups than only Māori versus non-Māori.
Transforming the scale NZSEI-96 was left-skewed such that more occupations were concentrated towards the lower end of the distribution. Other similarly-constructed occupational scales (eg, AUSEI06) have successfully applied a square-root transformation to the data to reduce this skew, and create a more ‘centred’ distribution – ie, where the mean and midpoint of the distribution coincide (McMillan, Beavis, & Jones, 2009). Centred scales allow for easier tests of equivalence between scales, as occupational SES scores should match. Such tests of equivalence will be carried out in this report, eg:
• between the NZSEI-06 scale for full-time workers only and the finalised NZSEI-06 scale including both part- and full-time workers
• between the finalised NZSEI-06 scale and AUSEI06.
For this reason, a square-root transformation of the NZSEI-06 scale will be undertaken in an attempt to produce a more centred scale with less skew.
Self-employed workers For NZSEI-96, the income for self-employed workers was inflated to account for the likely underestimation of income by this group (Baker, 1993; Bradbury, 1997; Parker, 1997, Pissarides & Weber, 1989). This was achieved by utilising data from the 1997/98 New Zealand Household Economic Survey to calculate the ratio of food expenditure to income for both waged and self-employed workers among NZSCO95 major occupational groups with large (>10 percent) proportions of self-employed workers. Self-employed workers were found to have a greater ratio of food expenditure to income than waged workers for four NZSCO95 major occupational groups:
• 1 (Legislators, Administrators and Managers)
New Zealand socio-economic index 2006
17
• 3 (Technicians and Associate Professionals)
• 6 (Agriculture and Fishery Workers)
• 7 (Trades Workers).
The income adjustment was then calculated as the factor required to make the expenditure-to-income ratio of self-employed workers the same as that of waged workers in the same occupational group. The incomes for self-employed workers was inflated by factors of 1.77, 1.35, 1.43, and 1.31 for those in major occupational groups 1, 3, 6, and 7, respectively, and NZSEI-96 scores were calculated based on these inflated incomes (Davis et al, 2003).
Another approach to income inflation for the self-employed is to estimate the extent to which incomes are ‘split’ with a marriage partner (ie, the incomes of those in self-employment are thought to be underestimated by the amount ‘spilt’ with family). For example, in the construction of AUSEI06, incomes for all self-employed workers were inflated by 75 percent to reflect the fact that approximately 75 percent of the labour force is married (McMillan et al, 2009). This approach has the advantage of being applicable to all self-employed, not just those from a subset of occupational groups. Against this, inflation of incomes by up to 75 percent for a substantial proportion of workers (20 percent in the 2006 Census) may seem unwarranted without accompanying evidence that incomes of self-employed workers are underestimated, let alone by how much. Moreover, inflation by such a large factor results in very high incomes for those already reporting incomes in the highest bracket.
Data on the ratio of food expenditure to income for waged and self-employed workers are unavailable for the 2006 period, so it is not possible to assess underestimation in this way. However, it is possible to compare the reported incomes of waged and self-employed workers for each of the 97 occupation categories. Evidence for underestimation of incomes by self-employed workers would exist if self-reported workers report lower incomes than waged workers for a majority of occupations (comparing the mean incomes of the two groups for each occupation). Where such evidence exists, inflation of incomes by an ‘equivalising’ factor will be undertaken for those occupations for which incomes were underestimated. However, if self-employed workers are as likely to report greater incomes as they are to report lower incomes, then this might be considered normal variation between self-employed and waged workers and, as such, does not suggest evidence that incomes have been underestimated. Further, if self-reported workers actually report higher incomes than waged workers for a majority of occupations, this does not suggest evidence for underestimation. Where no evidence for underestimation exists, no inflation of incomes will be undertaken.
Note that it is possible for self-employed incomes to be underestimated and for self-employed workers to report earning the same or even more than waged workers. However, as there is no way to assess whether such reports are underestimates, a conservative approach will be taken whereby the incomes of self-employed workers will only be inflated where there is evidence for underestimation.
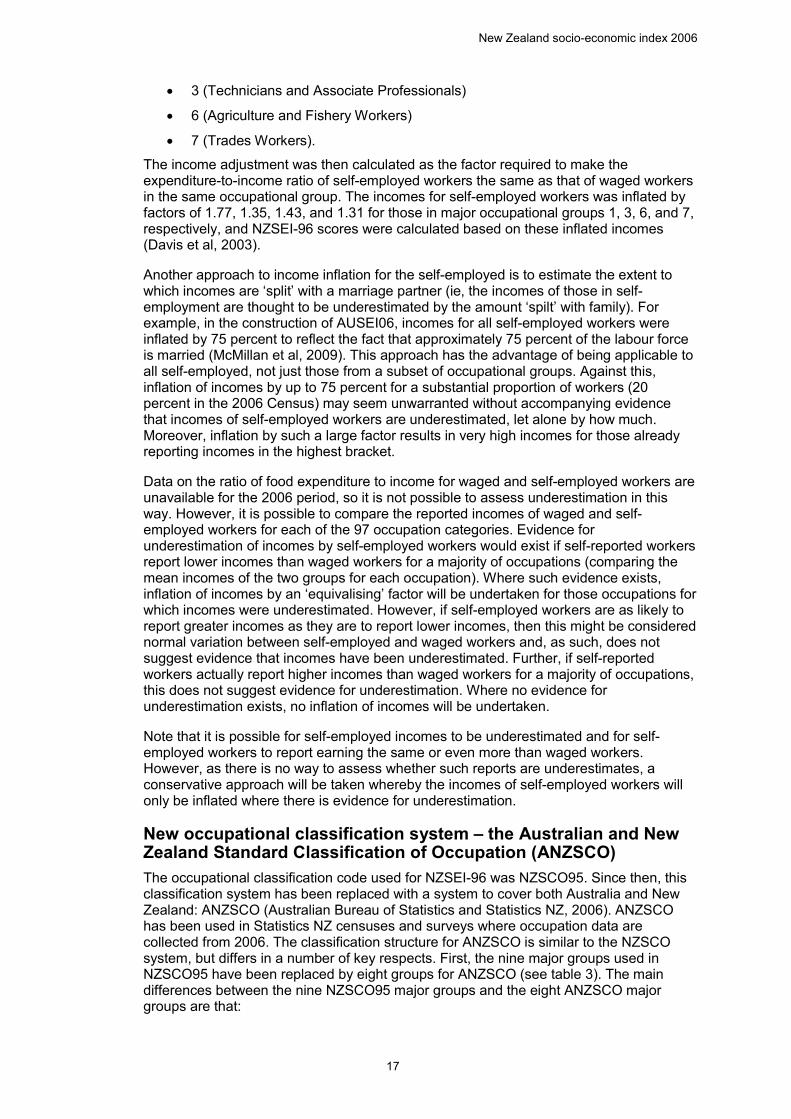
New occupational classification system – the Australian and New Zealand Standard Classification of Occupation (ANZSCO) The occupational classification code used for NZSEI-96 was NZSCO95. Since then, this classification system has been replaced with a system to cover both Australia and New Zealand: ANZSCO (Australian Bureau of Statistics and Statistics NZ, 2006). ANZSCO has been used in Statistics NZ censuses and surveys where occupation data are collected from 2006. The classification structure for ANZSCO is similar to the NZSCO system, but differs in a number of key respects. First, the nine major groups used in NZSCO95 have been replaced by eight groups for ANZSCO (see table 3). The main differences between the nine NZSCO95 major groups and the eight ANZSCO major groups are that:
New Zealand socio-economic index 2006
18
• NZSCO95 group 6 (agriculture and fishery workers) has been spread across ANZSCO groups:
o 1 (managers)
o 3 (technicians and trades workers)
o 8 (labourers)
• NZSCO95 group 5 (service and sales workers) has been split into two ANZSCO groups:
o 4 (community and personal service workers)
o 6 (sales workers).
Table 3 Major occupational groups NZSCO95 and ANZSCO classifications 3 Major occupational groups, NZSO95 and ANZSCO classifications
NZSCO95 occupational group ANZSCO occupational group
1. Legislators, Administrators and Managers 1. Managers 2. Professionals 2. Professionals 3. Technicians and Associate Professionals 3. Technicians and trade workers 4. Clerks 4. Community and personal service workers 5. Service and Sales Workers 5. Clerical and administrative workers 6. Agriculture and Fishery Workers 6. Sales workers 7. Trades Workers 7. Machinery operators and drivers 8. Plant and Machine Operators and Assemblers 8. Labourers 9. Elementary Occupations
Beneath ANZSCO’s eight major groups (one-digit) are: • 43 sub-major group (two-digit) categories
• 97 minor group (three-digit) categories
• 358 unit group (four-digit) categories
• 998 group (six-digit) categories.
As with NZSEI-96, the 97 minor group categories will be used for constructing NZSEI-06. These are made freely available by Statistics NZ – data at the unit group and group levels are not.
The use of ANZSCO for NZSEI-06 has the obvious disadvantage of hampering comparability with previous NZSEI scales, as many of the 97 group categories are different between ANZSCO and NZSCO systems. Even the major groups are not directly comparable, as described above. However, the main and arguably greater advantage is that it allows direct comparability between the New Zealand and Australian SEI scales. That is, NZSEI-06 scores can be compared with AUSEI06 scores for each of the 97 groups classified in both countries from data collected at the same time (2006). This comparison will be described in section 4.2 as part of the assessment of the finalised NZSEI-06 scale.
New Zealand socio-economic index 2006
19
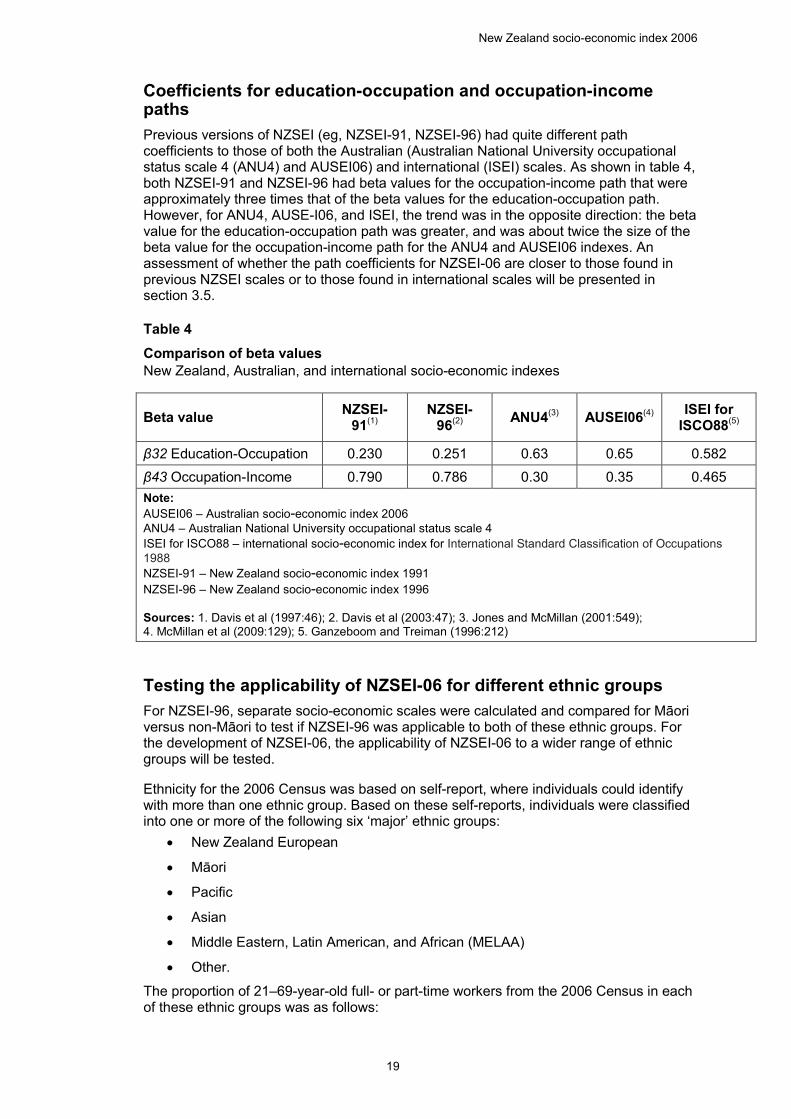
Coefficients for education-occupation and occupation-income paths Previous versions of NZSEI (eg, NZSEI-91, NZSEI-96) had quite different path coefficients to those of both the Australian (Australian National University occupational status scale 4 (ANU4) and AUSEI06) and international (ISEI) scales. As shown in table 4, both NZSEI-91 and NZSEI-96 had beta values for the occupation-income path that were approximately three times that of the beta values for the education-occupation path. However, for ANU4, AUSE-I06, and ISEI, the trend was in the opposite direction: the beta value for the education-occupation path was greater, and was about twice the size of the beta value for the occupation-income path for the ANU4 and AUSEI06 indexes. An assessment of whether the path coefficients for NZSEI-06 are closer to those found in previous NZSEI scales or to those found in international scales will be presented in section 3.5.
Table 4 Comparison of beta values New Zealand, Australian, and international socio-economic indexes 4 Comparison of beta values, New Zealand, Australian, and international socioeconomic indexes
Beta value NZSEI-91(1)
NZSEI-96(2) ANU4(3) AUSEI06(4) ISEI for
ISCO88(5)
β32 Education-Occupation 0.230 0.251 0.63 0.65 0.582 β43 Occupation-Income 0.790 0.786 0.30 0.35 0.465 Note: AUSEI06 – Australian socio-economic index 2006 ANU4 – Australian National University occupational status scale 4 ISEI for ISCO88 – international socio-economic index for International Standard Classification of Occupations 1988 NZSEI-91 – New Zealand socio-economic index 1991 NZSEI-96 – New Zealand socio-economic index 1996
Sources: 1. Davis et al (1997:46); 2. Davis et al (2003:47); 3. Jones and McMillan (2001:549); 4. McMillan et al (2009:129); 5. Ganzeboom and Treiman (1996:212)
Testing the applicability of NZSEI-06 for different ethnic groups For NZSEI-96, separate socio-economic scales were calculated and compared for Māori versus non-Māori to test if NZSEI-96 was applicable to both of these ethnic groups. For the development of NZSEI-06, the applicability of NZSEI-06 to a wider range of ethnic groups will be tested.
Ethnicity for the 2006 Census was based on self-report, where individuals could identify with more than one ethnic group. Based on these self-reports, individuals were classified into one or more of the following six ‘major’ ethnic groups:
• New Zealand European
• Māori
• Pacific
• Asian
• Middle Eastern, Latin American, and African (MELAA)
• Other.
The proportion of 21–69-year-old full- or part-time workers from the 2006 Census in each of these ethnic groups was as follows:
New Zealand socio-economic index 2006
20
• New Zealand European (68.8 percent)
• Māori (10.6 percent)
• Pacific (4.5 percent)
• Asian (8.0 percent)
• MELAA (0.7 percent)
• Other’ (14.0 percent).
Because of the similarity between the New Zealand European and Other ethnic groups (in particular, >95 percent of those in the Other ethnic group self-identify as ‘New Zealander’), we will follow the Statistics NZ recommendation to combine these ethnicities into a ‘European and Other (including New Zealander)’ ethnic group (Statistics NZ, 2007).
The proportion of 21–69-year-old full- or part-time workers in the European and Other (including New Zealander) group was 82.2 percent. Because of the small number of MELAA among 21–69-year-old full- or part-time workers, this group will not be analysed in this report. Thus, just four ethnic groups will be compared.
Note that these four ethnic groups cannot be considered mutually exclusive, as individuals could identify with more than one group. Results need to be interpreted with this in mind. The proportion of 21–69-year-old full- and part-time workers to identify with two or more ethnic groups was:
• 6.5 percent among those identifying as European and Other (including New Zealander)
• 44.0 percent among those identifying as Māori
• 22.8 percent among those identifying as Pacific
• 6.0 percent among those identifying as Asian.
The primary analysis that will be conducted in relation to NZSEI-06 and ethnicity will be to compare NZSEI-06 scores when separate scales are constructed for each of the four ethnic groups. If occupational scores are patterned similarly across ethnic groups, NZSEI-06 will be considered to be applicable for each.
1.3 Planned validation of NZSEI-06 Validation with health indicators As described above, NZSEI-96 was validated against three health indicators: smoking, self-assessed health, and general practitioner visits. We can only replicate analyses for one of these indicators in the current study: smoking. Data on the other two constructs are not available from the 2006 Census, and datasets that do collect information on these constructs (eg, the 2006/7 New Zealand Health Survey, Ministry of Health, 2008) do not collect occupational information.
Validation with correlates of SES NZSEI-96 was also validated against other correlates of SES, including motor vehicle access, housing tenure, and household overcrowding. NZSEI-06 will be validated against motor vehicle access and housing tenure but will not be validated against overcrowding as this measure was not found to be associated with occupational status when tested against NZSEI-96. We will, however, validate NZSEI-06 against an area-based measure of deprivation, the NZDep index of deprivation 2006 (NZDep2006).
Deprivation Socio-economic scales based on deprivation levels in area units have become popular in recent years. In New Zealand, a series of these have been developed for each of the
New Zealand socio-economic index 2006
21
1991–2006 Censuses, called NZDep91, NZDep96, NZDep2001 and NZDep2006, respectively (Crampton, Salmond, & Sutton, 1997; Salmond, Crampton, & Sutton, 1998; Salmond & Crampton 2002; Salmond, Crampton, & Atkinson, 2007). In the scale version of these indexes, each mesh block in New Zealand (geographical units defined by Statistics NZ, typically containing less than 100 people) is assigned a score from 1 (least deprived) to 10 (most deprived), with roughly the same number of mesh blocks in each of the 10 categories. The designation of mesh blocks is based on a principal component score derived from census data for nine variables indexing deprivation. Variables are calculated as proportions for each mesh block, and are listed below in order of decreasing factor loadings:
1 Income People aged 18–64 receiving a means tested benefit 2 Income People living in households with income below an income threshold 3 Owned home People not living in owned home 4 Support People aged <65 living in a single parent family 5 Employment People aged 18–64 unemployed 6 Qualifications People aged 18–64 without any qualifications 7 Living space People living in households below a bedroom occupancy threshold 8 Communication People with no access to a telephone 9 Transport People with no access to a car
There are a number of reasons to believe that NZDep2006 should be associated with NZSEI-06. First, both can be considered as – and both have been used as – measures of SES. Whereas NZSEI-06 measures SES via the occupation of the individual, NZDep2006 measures SES via the deprivation-level of the area in which individuals live. Second, research of health samples showed that previous versions – NZSEI-96 and NZDep2006 – were moderately correlated (r= -0.34, Metcalf et al, 2008; note that high scores indicate higher SES for NZSEI-96, whereas high scores indicate greater deprivation for NZDep2006). Third, both scales use some of the same information in their derivation: NZSEI uses income and education to derive occupation-based SES scores for the individual, whereas NZDep uses levels of income, education, and employment among residents to derive area-based deprivation scores.
Thus, NZDep2006 can be considered a reasonable measure against which to assess the validity of NZSEI-06. We expect to find an ‘SES-gradient’, whereby lower NZSEI-06 scores are expected to be associated with increasing levels of deprivation.
1.4 Summary NZSEI-06 will be constructed using 2006 Census data and the methodological approach adopted in the development of its predecessor, NZSEI-96. The only two methodological changes planned are:
(i) to attempt to produce a centred scale by undertaking a square-root transformation of the data
(ii) to inflate the incomes of the self-employed only if there is evidence that self-employed workers underestimate incomes (ie, that self-employed workers are more likely to be report lower incomes than waged workers).
Validation of NZSEI-06 will focus on smoking, motor vehicle access, housing tenure, household overcrowding, and deprivation. As with NZSEI-96, different methods will be tried to derive socio-economic scores for the economically inactive and others for whom no occupational data are recorded. The construction and assessment of NZSEI-06 are described in the following sections of this report.
22
2 NZSEI-06 dataset
This section presents tabulated and cross-tabulated data on the 2006 Census variables used to construct NZSEI-06: education, income, and occupation. These variables will be compared against data from the 1996 Census used for the most recent NZSEI (NZSEI-96), and cross-tabulated against sex and ethnicity using 2006 Census data.
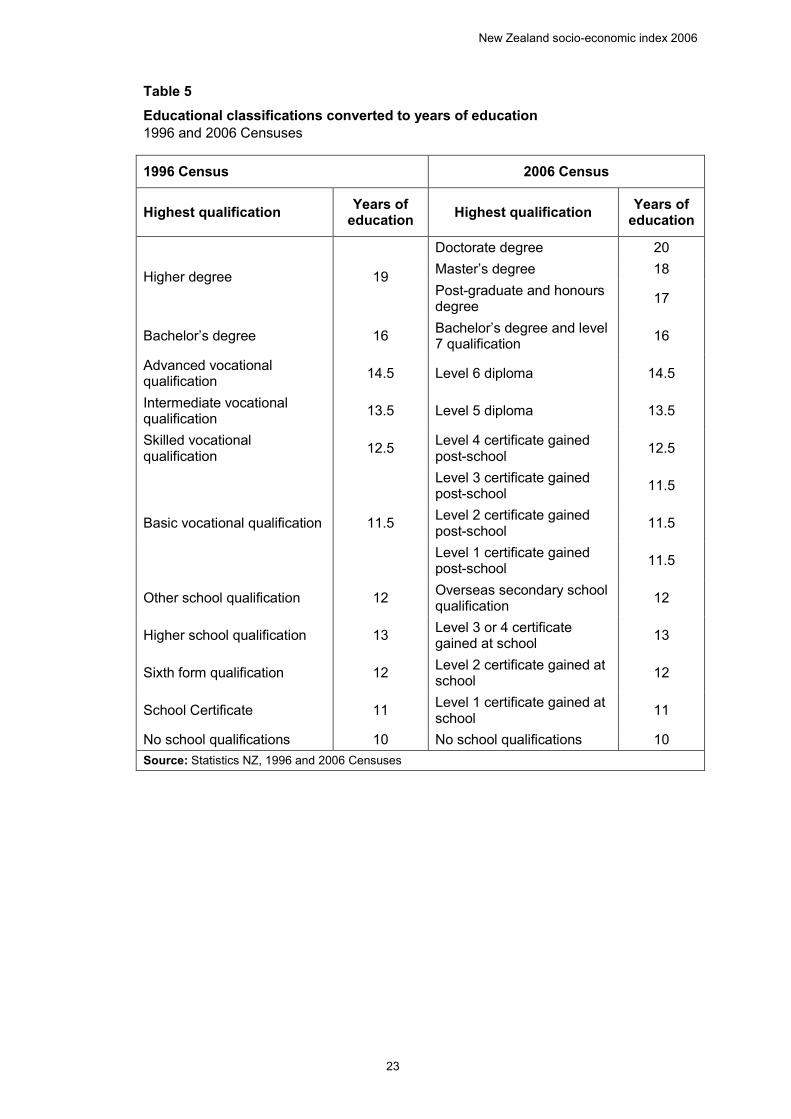
2.1 Construction of the variables for NZSEI-06 Education As with the previous NZSEI versions, census data on educational qualification need to be converted into years of education for the purposes of the NZSEI-06 statistical algorithm. The conversion into years of education for both the 1996 and 2006 Censuses is shown in table 4. Note that a change to the 2006 Census highest qualification classification – and to the structure of New Zealand qualifications – means that it is not possible to make direct comparisons between the 1996 and 2006 Censuses on data for all qualification categories. However, school and vocational qualifications from 1996 can be mapped on to the ‘levels’ used in 2006, and this is reflected in the correspondences shown in table 5.
For example, for qualifications gained at school, school certificate maps to level 1, sixth form certificate maps to level 2, higher school certificate maps to levels 3 and 4, and ‘other’ school qualifications in 1996 included those with overseas school qualifications.
For qualifications obtained post-school, basic vocational qualifications map to levels 1–3 (and each of these levels will be assigned the same number of years of education), skilled vocational qualifications map to level 4, intermediate vocational qualifications map to level 5, and advanced vocational qualifications map to level 6.
The only categories that do not map are postgraduate qualifications; the ‘higher degree’ category in 1996 has been split into individual higher degrees in 2006. We coded these degrees – postgraduate/honours degree, master’s degree, and doctoral degree – as requiring 17, 18, and 20 years of education, respectively, reflecting that they typically take 1, 2, and 4 years more than a bachelor’s degree, respectively.
New Zealand socio-economic index 2006
23
Table 5 Educational classifications converted to years of education 1996 and 2006 Censuses 5 Educational classifications converted to years of education, 1996 and 2006 Censuses
1996 Census 2006 Census
Highest qualification Years of education Highest qualification Years of
education
Higher degree 19
Doctorate degree 20 Master’s degree 18 Post-graduate and honours degree 17
Bachelor’s degree 16 Bachelor’s degree and level 7 qualification 16
Advanced vocational qualification 14.5 Level 6 diploma 14.5
Intermediate vocational qualification 13.5 Level 5 diploma 13.5
Skilled vocational qualification 12.5 Level 4 certificate gained
post-school 12.5
Basic vocational qualification 11.5
Level 3 certificate gained post-school 11.5
Level 2 certificate gained post-school 11.5
Level 1 certificate gained post-school 11.5
Other school qualification 12 Overseas secondary school qualification 12
Higher school qualification 13 Level 3 or 4 certificate gained at school 13
Sixth form qualification 12 Level 2 certificate gained at school 12
School Certificate 11 Level 1 certificate gained at school 11
No school qualifications 10 No school qualifications 10 Source: Statistics NZ, 1996 and 2006 Censuses
New Zealand socio-economic index 2006
24
Table 6 Highest qualification and years of education Full-time workers aged 21–69 years 1996 and 2006 Censuses 6 Highest qualification and years of education, for full-time workers aged 21–69 years, 1996 and 2006 Censuses
2006 Census 1996 Census
Highest qualification
Males Females Total Highest qualification
Total
Percent Percent
Doctorate degree 1.0 0.6 0.9 … … Master’s degree 2.9 3.1 3.0 … … Post-graduate and honours degree 2.3 3.6 2.8 Higher
degree(1) 4.5
Bachelor’s degree and level 7 qualification
13.2 18.6 15.4 Bachelor’s degree 8.9
Level 6 diploma 4.4 8.4 6.1 Advanced vocational certificate
10.0
Level 5 diploma 5.4 4.8 5.2 Intermediate vocational qualification
2.5
Level 4 certificate gained post-school 18.2 7.2 13.7
Skilled vocational qualification
10.0
Level 3 certificate gained post-school 2.4 3.3 2.7 … …
Level 2 certificate gained post-school 1.6 1.5 1.6 … …
Level 1 certificate gained post-school 0.4 0.4 0.4
Basic vocational qualification(2)
3.7
Overseas secondary school qualification
4.4 5.2 4.7 Other school qualification(3) 9.0
Level 3 or 4 certificate gained at school
4.6 4.3 4.5 Higher school qualification 3.7
Level 2 certificate gained at school 8.4 10.0 9.1 Sixth form
qualification 11.3
Level 1 certificate gained at school 11.6 14.3 12.7 School
Certificate 12.2
No school qualifications 19.2 14.5 17.3 No school
qualifications 24.2
Total 100 100 100 Total 100 1. This category is the 1996 equivalent of honours, master’s or doctorate degree 2. This category is the 1996 equivalent of level 1, 2, or 3 certificates 3. This category includes overseas school qualifications in 1996 Symbol: … not applicable Source: Statistics NZ, 1996 and 2006 Censuses
New Zealand socio-economic index 2006
25
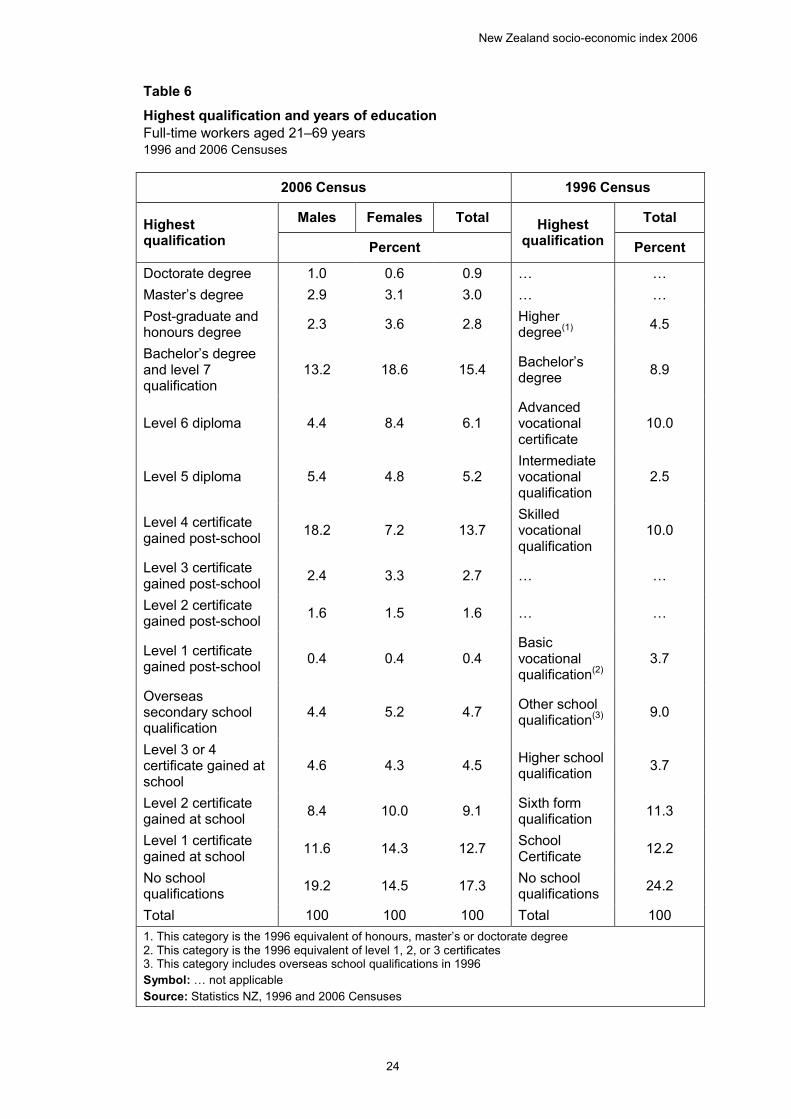
Table 6 shows the distribution of male and female full-time workers by highest education qualification for the 2006 Census. The proportion of females with university degrees was greater than for males (25.9 percent vs 19.4 percent). Females were less likely than males to have no formal qualifications (14.5 percent vs 19.2 percent).
Table 6 also shows the distribution of full-time workers by highest education qualification for the 1996 and 2006 Censuses, with equivalent qualifications mapped as explained above and as described in table 6’s footnotes. There were substantial changes to the highest qualification distribution for New Zealanders from 1996 to 2006. The 2006 Census showed an increase in the proportion of full-time workers classified as having a bachelor’s degree (from 8.9 percent to 15.4 percent), and an increase in the proportion holding a postgraduate/honours degree, master’s degree, or doctoral degree (from 4.5 percent to 6.7 percent). Conversely, there was a sizeable drop in the proportion of the population with no formal qualifications, from 24.2 percent in 1996 to 17.3 percent in 2006.
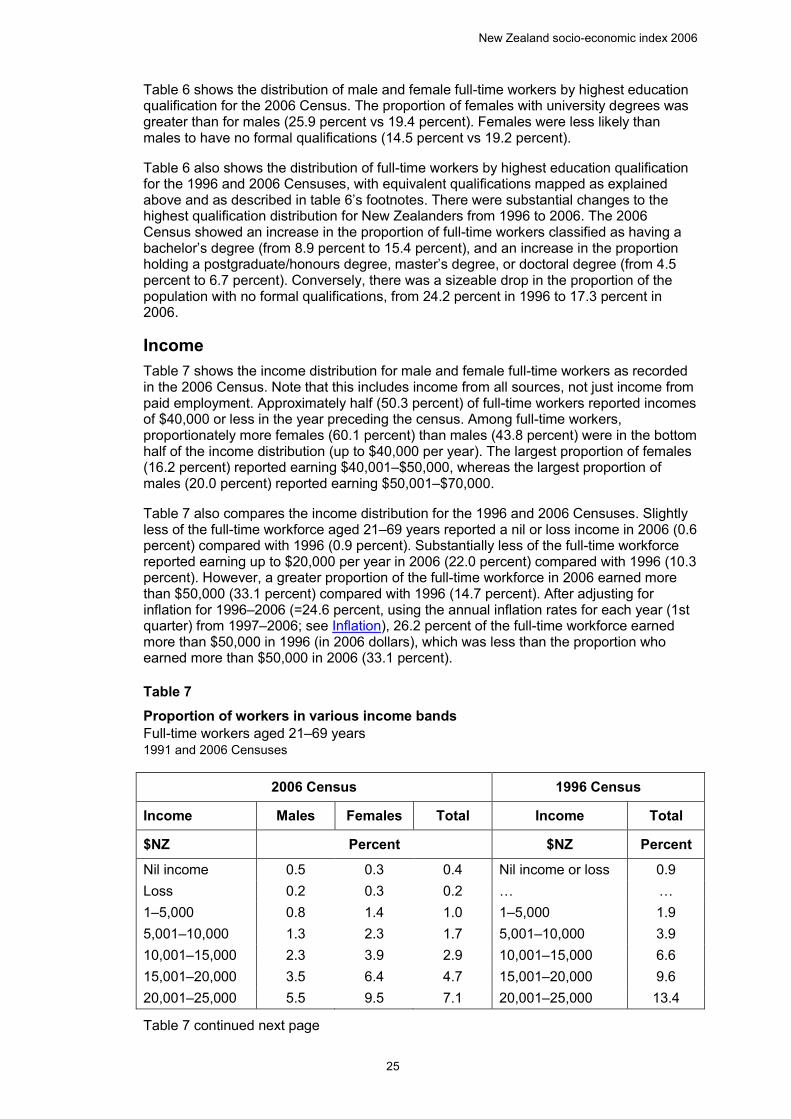
Income Table 7 shows the income distribution for male and female full-time workers as recorded in the 2006 Census. Note that this includes income from all sources, not just income from paid employment. Approximately half (50.3 percent) of full-time workers reported incomes of $40,000 or less in the year preceding the census. Among full-time workers, proportionately more females (60.1 percent) than males (43.8 percent) were in the bottom half of the income distribution (up to $40,000 per year). The largest proportion of females (16.2 percent) reported earning $40,001–$50,000, whereas the largest proportion of males (20.0 percent) reported earning $50,001–$70,000.
Table 7 also compares the income distribution for the 1996 and 2006 Censuses. Slightly less of the full-time workforce aged 21–69 years reported a nil or loss income in 2006 (0.6 percent) compared with 1996 (0.9 percent). Substantially less of the full-time workforce reported earning up to $20,000 per year in 2006 (22.0 percent) compared with 1996 (10.3 percent). However, a greater proportion of the full-time workforce in 2006 earned more than $50,000 (33.1 percent) compared with 1996 (14.7 percent). After adjusting for inflation for 1996–2006 (=24.6 percent, using the annual inflation rates for each year (1st quarter) from 1997–2006; see Inflation), 26.2 percent of the full-time workforce earned more than $50,000 in 1996 (in 2006 dollars), which was less than the proportion who earned more than $50,000 in 2006 (33.1 percent).
Table 7 Proportion of workers in various income bands Full-time workers aged 21–69 years 1991 and 2006 Censuses 7 Proportion of workers in various income bands, full-time workers aged 21–69 years, 1991 and 2006 Censuses
2006 Census 1996 Census
Income Males Females Total Income Total
$NZ Percent $NZ Percent
Nil income 0.5 0.3 0.4 Nil income or loss 0.9 Loss 0.2 0.3 0.2 … … 1–5,000 0.8 1.4 1.0 1–5,000 1.9 5,001–10,000 1.3 2.3 1.7 5,001–10,000 3.9 10,001–15,000 2.3 3.9 2.9 10,001–15,000 6.6 15,001–20,000 3.5 6.4 4.7 15,001–20,000 9.6 20,001–25,000 5.5 9.5 7.1 20,001–25,000 13.4
Table 7 continued next page
New Zealand socio-economic index 2006
26
Table 7 continued
2006 Census 1996 Census
Income Males Females Total Income Total
$NZ Percent $NZ Percent
25,001–30,000 8.3 11.5 9.6 25,001–30,000 16 30,001–35,000 9.8 12.1 10.8 30,001–40,000 21.5 35,001–40,000 11.6 12.4 11.9 … … 40,001–50,000 16.7 16.2 16.5 40,001–50,000 11.5 50,001–70,000 20.0 15.4 18.2 50,001–70,000 8.1 70,001–100,000 10.2 5.2 8.2 70,001–100,000 3.5 100,001 or more 9.2 3.1 6.7 100,001–or more 3.1 Total 100 100 100 Total 100 Symbol: … not applicable Source: Statistics NZ, 1991 and 2006 Censuses
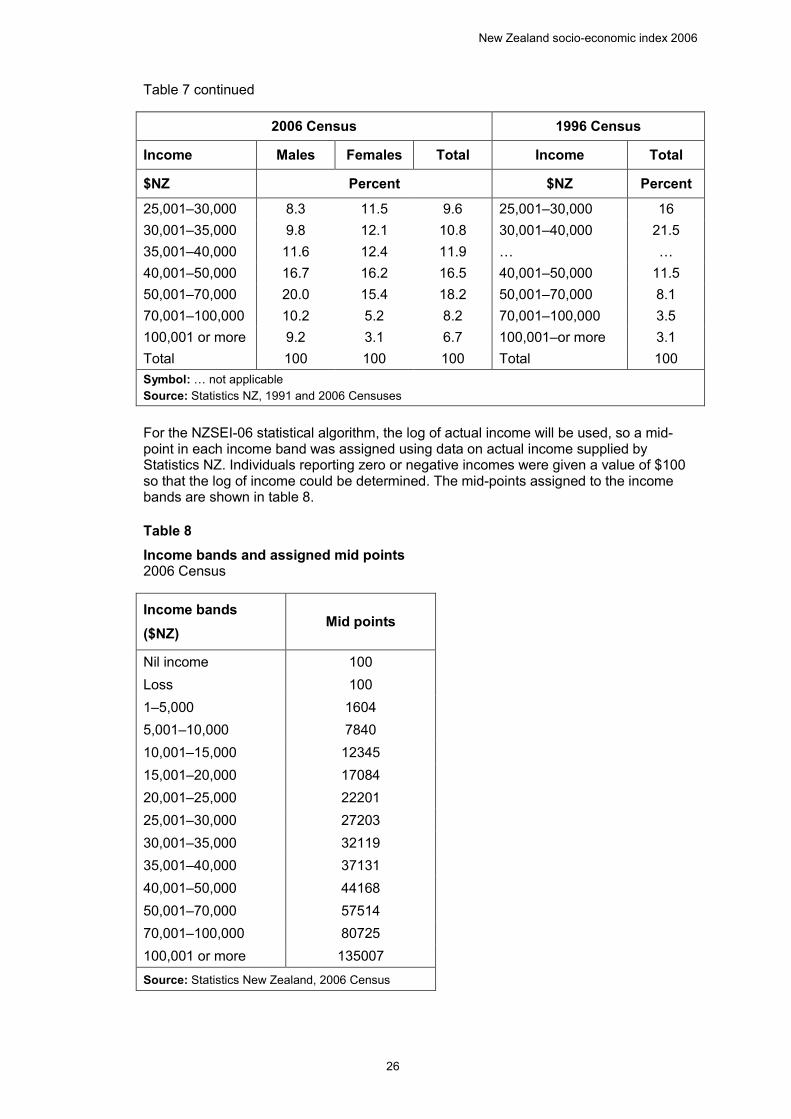
For the NZSEI-06 statistical algorithm, the log of actual income will be used, so a mid-point in each income band was assigned using data on actual income supplied by Statistics NZ. Individuals reporting zero or negative incomes were given a value of $100 so that the log of income could be determined. The mid-points assigned to the income bands are shown in table 8.
Table 8 Income bands and assigned mid points 2006 Census 8 Income bands and assigned mid points, from the 2006 Census
Income bands ($NZ)
Mid points
Nil income 100 Loss 100 1–5,000 1604 5,001–10,000 7840 10,001–15,000 12345 15,001–20,000 17084 20,001–25,000 22201 25,001–30,000 27203 30,001–35,000 32119 35,001–40,000 37131 40,001–50,000 44168 50,001–70,000 57514 70,001–100,000 80725 100,001 or more 135007 Source: Statistics New Zealand, 2006 Census
New Zealand socio-economic index 2006
27
Occupation For the 2006 Census, individuals provided details about their occupation. Those working more than one job provided details about their primary occupation only (ie, the occupation in which they worked the most hours). As described in section 1.2, NZSCO95, the occupation classification used for the 1996 Census, was replaced by ANZSCO for the 2006 Census. The main impact of this change was that the nine major groups in NZSCO95 were replaced by eight major groups in ANZSCO, so these classification schemes are not comparable across time. Further, while there were 97 minor groups for both NZSCO95 and ANZSCO, many of the groups do not have equivalents across time, so comparability at this level is also not possible (eg, see appendix A of Australian and New Zealand Standard Classification of Occupations, Australian Bureau of Statistics and Statistics NZ, 2006).
The distribution of the full-time workers aged 21–69-years-old by occupation at the major and minor group levels is produced in appendix I. The number of people in each minor group category ranged from over 50,000, in the General Managers category, to just over 2,500 people, in the Textile, Clothing and Footwear Trades Workers category.
Sex differences in the number of full-time workers in each occupation were apparent. At the major group level, there was a clear male excess for four groups:
• Machinery Operators and Drivers (male : female ratio = 6.2)
• Technicians and Trades Workers (male : female ratio = 5.7)
• Labourers (male : female ratio = 2.4)
• Managers (male : female ratio = 2.1)
There was a clear female excess for two groups: • Clerical and Administrative Workers (female : male ratio = 2.9)
• Community and Personal Service Workers (female : male ratio = 1.5).
There were approximately the same number of male and female Professionals and Sales Workers. Within the major groups, males and females also tended to be concentrated in particular types of occupations. For instance, for individuals classified as Professionals, women were more prevalent among education (except for Tertiary Teaching), health therapy, and nursing occupations, whereas men were more prevalent among Engineering Professionals, and Business and Systems Analysts and Programmers.
Age Age, in years, is included as a control variable as it is negatively associated with education (younger workers have higher qualifications) but positively correlated with income (older workers earn more). As with the previous scales (NZSEI-91 and NZSEI-96) analyses will be restricted to those aged 21–69. Those under the age of 21 years are not included because of the likelihood that young workers first entering the workforce may take on occupations that do not reflect their education and skill level. Those over the age of 69 years are excluded because very few of this group (6.5 percent) are in the workforce. Note that those aged 65–69 years are included because involvement in occupational roles is still relatively common in this group (28.1 percent of 65–69-year-olds are in the workforce), even though the retirement age in New Zealand is 65.
2.2 Selected demographic data This section provides tabulations and cross-tabulations of demographic data from the 2006 Census to provide context for the analyses conducted in subsequent sections of the report.
New Zealand socio-economic index 2006
28
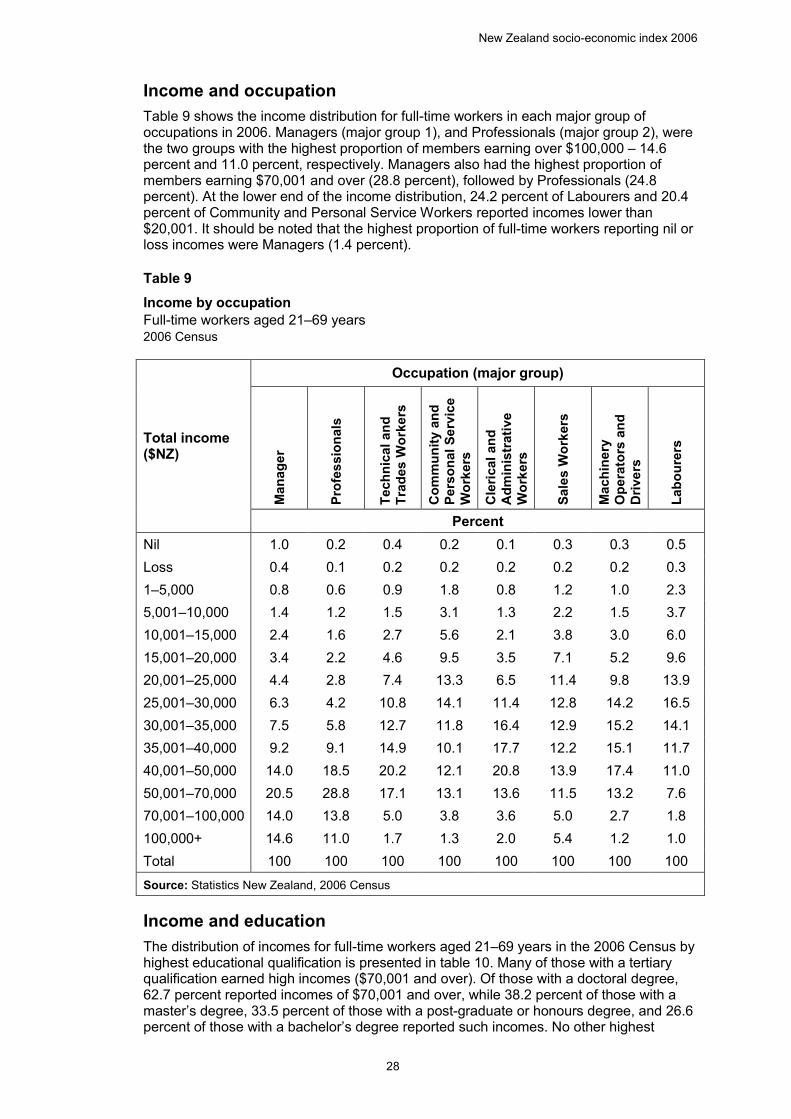
Income and occupation Table 9 shows the income distribution for full-time workers in each major group of occupations in 2006. Managers (major group 1), and Professionals (major group 2), were the two groups with the highest proportion of members earning over $100,000 – 14.6 percent and 11.0 percent, respectively. Managers also had the highest proportion of members earning $70,001 and over (28.8 percent), followed by Professionals (24.8 percent). At the lower end of the income distribution, 24.2 percent of Labourers and 20.4 percent of Community and Personal Service Workers reported incomes lower than $20,001. It should be noted that the highest proportion of full-time workers reporting nil or loss incomes were Managers (1.4 percent).
Table 9 Income by occupation Full-time workers aged 21–69 years 2006 Census 9 Income by occupation, full-time workers aged 21–69 years, 2006 Census
Total income ($NZ)
Occupation (major group)
Man
ager
Prof
essi
onal
s
Tech
nica
l and
Tr
ades
Wor
kers
Com
mun
ity a
nd
Pers
onal
Ser
vice
W
orke
rs
Cle
rical
and
A
dmin
istr
ativ
e W
orke
rs
Sale
s W
orke
rs
Mac
hine
ry
Ope
rato
rs a
nd
Driv
ers
Labo
urer
s
Percent Nil 1.0 0.2 0.4 0.2 0.1 0.3 0.3 0.5 Loss 0.4 0.1 0.2 0.2 0.2 0.2 0.2 0.3 1–5,000 0.8 0.6 0.9 1.8 0.8 1.2 1.0 2.3 5,001–10,000 1.4 1.2 1.5 3.1 1.3 2.2 1.5 3.7 10,001–15,000 2.4 1.6 2.7 5.6 2.1 3.8 3.0 6.0 15,001–20,000 3.4 2.2 4.6 9.5 3.5 7.1 5.2 9.6 20,001–25,000 4.4 2.8 7.4 13.3 6.5 11.4 9.8 13.9 25,001–30,000 6.3 4.2 10.8 14.1 11.4 12.8 14.2 16.5 30,001–35,000 7.5 5.8 12.7 11.8 16.4 12.9 15.2 14.1 35,001–40,000 9.2 9.1 14.9 10.1 17.7 12.2 15.1 11.7 40,001–50,000 14.0 18.5 20.2 12.1 20.8 13.9 17.4 11.0 50,001–70,000 20.5 28.8 17.1 13.1 13.6 11.5 13.2 7.6 70,001–100,000 14.0 13.8 5.0 3.8 3.6 5.0 2.7 1.8 100,000+ 14.6 11.0 1.7 1.3 2.0 5.4 1.2 1.0 Total 100 100 100 100 100 100 100 100 Source: Statistics New Zealand, 2006 Census
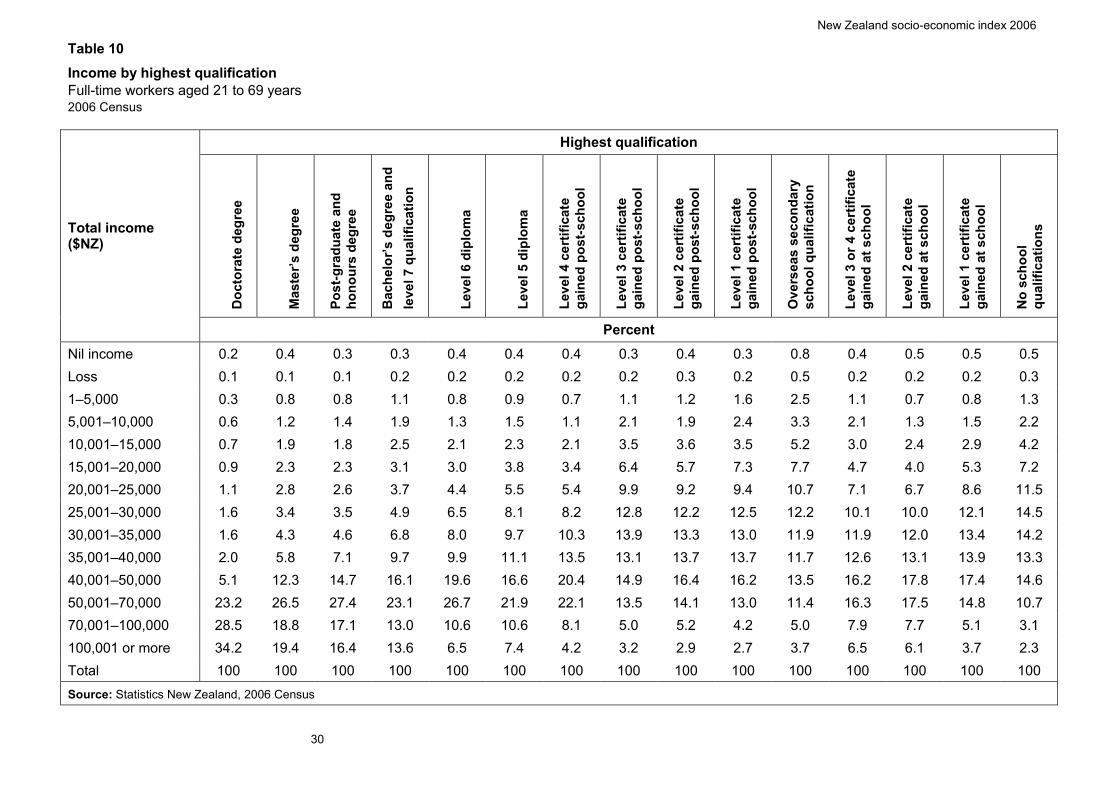
Income and education The distribution of incomes for full-time workers aged 21–69 years in the 2006 Census by highest educational qualification is presented in table 10. Many of those with a tertiary qualification earned high incomes ($70,001 and over). Of those with a doctoral degree, 62.7 percent reported incomes of $70,001 and over, while 38.2 percent of those with a master’s degree, 33.5 percent of those with a post-graduate or honours degree, and 26.6 percent of those with a bachelor’s degree reported such incomes. No other highest
New Zealand socio-economic index 2006
29
qualification group had >18 percent of workers earning $70,001 and over. In the lower income bracket, 69.2 percent of those with no school qualifications, 66.5 percent of those with overseas secondary school qualifications, and 63.9 percent of those with a Level 1 certificate gained post-school as their highest qualifications reported earning $40,000 or less (the lower half of the income distribution) in the year preceding the 2006 Census.
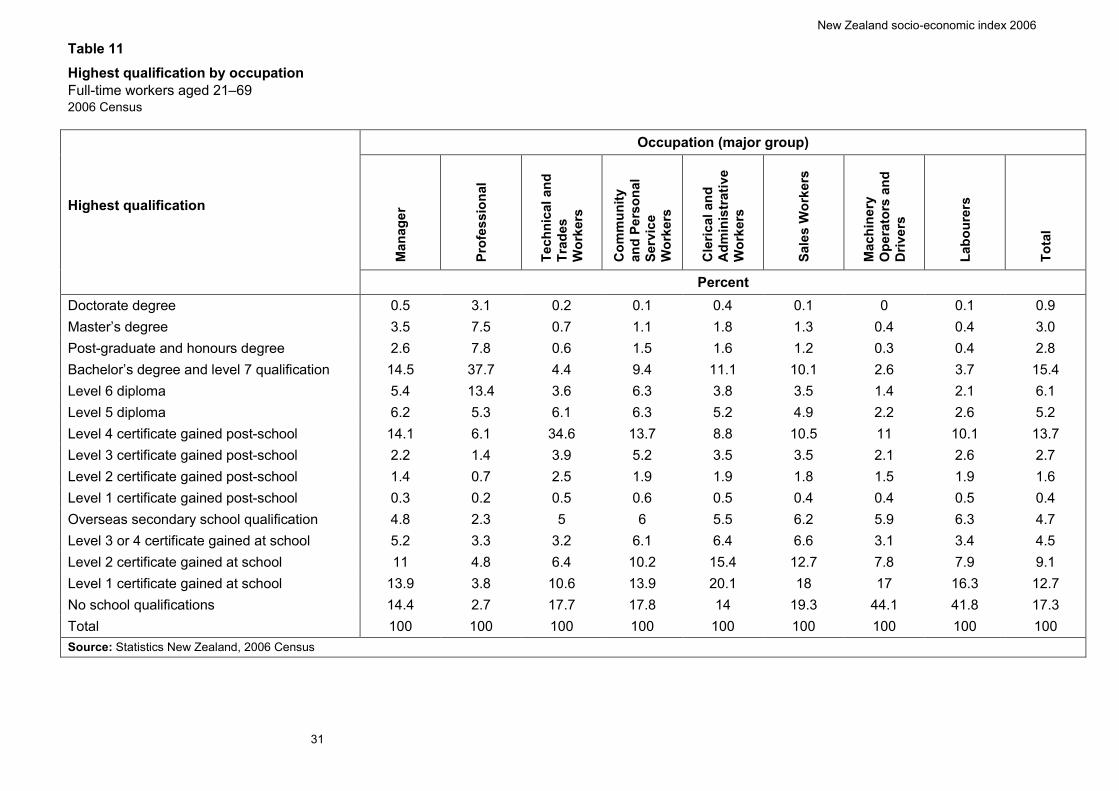
Occupation and education Table 11 shows the range of educational qualifications across ANZSCO occupational groups. Professionals were the most highly qualified occupational group, with 56.3 percent holding a university qualification, and less than 3 percent having no school qualifications. Labourers and Machinery Operators and Drivers had the highest proportion of members with no school qualifications (both >40 percent).
New Zealand socio-economic index 2006
30
Table 10 Income by highest qualification Full-time workers aged 21 to 69 years 2006 Census 10 Income by highest qualification, full-time workers aged 21 to 69 years, 2006 Census
Total income ($NZ)
Highest qualification
Doc
tora
te d
egre
e
Mas
ter’s
deg
ree
Post
-gra
duat
e an
d ho
nour
s de
gree
Bac
helo
r’s d
egre
e an
d
leve
l 7 q
ualif
icat
ion
Leve
l 6 d
iplo
ma
Leve
l 5 d
iplo
ma
Leve
l 4 c
ertif
icat
e ga
ined
pos
t-sch
ool
Leve
l 3 c
ertif
icat
e ga
ined
pos
t-sch
ool
Leve
l 2 c
ertif
icat
e ga
ined
pos
t-sch
ool
Leve
l 1 c
ertif
icat
e ga
ined
pos
t-sch
ool
Ove
rsea
s se
cond
ary
scho
ol q
ualif
icat
ion
Leve
l 3 o
r 4 c
ertif
icat
e ga
ined
at s
choo
l
Leve
l 2 c
ertif
icat
e ga
ined
at s
choo
l
Leve
l 1 c
ertif
icat
e ga
ined
at s
choo
l
No
scho
ol
qual
ifica
tions
Percent Nil income 0.2 0.4 0.3 0.3 0.4 0.4 0.4 0.3 0.4 0.3 0.8 0.4 0.5 0.5 0.5 Loss 0.1 0.1 0.1 0.2 0.2 0.2 0.2 0.2 0.3 0.2 0.5 0.2 0.2 0.2 0.3 1–5,000 0.3 0.8 0.8 1.1 0.8 0.9 0.7 1.1 1.2 1.6 2.5 1.1 0.7 0.8 1.3 5,001–10,000 0.6 1.2 1.4 1.9 1.3 1.5 1.1 2.1 1.9 2.4 3.3 2.1 1.3 1.5 2.2 10,001–15,000 0.7 1.9 1.8 2.5 2.1 2.3 2.1 3.5 3.6 3.5 5.2 3.0 2.4 2.9 4.2 15,001–20,000 0.9 2.3 2.3 3.1 3.0 3.8 3.4 6.4 5.7 7.3 7.7 4.7 4.0 5.3 7.2 20,001–25,000 1.1 2.8 2.6 3.7 4.4 5.5 5.4 9.9 9.2 9.4 10.7 7.1 6.7 8.6 11.5 25,001–30,000 1.6 3.4 3.5 4.9 6.5 8.1 8.2 12.8 12.2 12.5 12.2 10.1 10.0 12.1 14.5 30,001–35,000 1.6 4.3 4.6 6.8 8.0 9.7 10.3 13.9 13.3 13.0 11.9 11.9 12.0 13.4 14.2 35,001–40,000 2.0 5.8 7.1 9.7 9.9 11.1 13.5 13.1 13.7 13.7 11.7 12.6 13.1 13.9 13.3 40,001–50,000 5.1 12.3 14.7 16.1 19.6 16.6 20.4 14.9 16.4 16.2 13.5 16.2 17.8 17.4 14.6 50,001–70,000 23.2 26.5 27.4 23.1 26.7 21.9 22.1 13.5 14.1 13.0 11.4 16.3 17.5 14.8 10.7 70,001–100,000 28.5 18.8 17.1 13.0 10.6 10.6 8.1 5.0 5.2 4.2 5.0 7.9 7.7 5.1 3.1 100,001 or more 34.2 19.4 16.4 13.6 6.5 7.4 4.2 3.2 2.9 2.7 3.7 6.5 6.1 3.7 2.3 Total 100 100 100 100 100 100 100 100 100 100 100 100 100 100 100 Source: Statistics New Zealand, 2006 Census
New Zealand socio-economic index 2006
31
Table 11 Highest qualification by occupation Full-time workers aged 21–69 2006 Census 11 Highest qualification by occupation, full-time workers aged 21–69, 2006 Census
Highest qualification
Occupation (major group)
Man
ager
Prof
essi
onal
Tech
nica
l and
Tr
ades
W
orke
rs
Com
mun
ity
and
Pers
onal
Se
rvic
e W
orke
rs
Cle
rical
and
A
dmin
istr
ativ
e W
orke
rs
Sale
s W
orke
rs
Mac
hine
ry
Ope
rato
rs a
nd
Driv
ers
Labo
urer
s
Tota
l
Percent Doctorate degree 0.5 3.1 0.2 0.1 0.4 0.1 0 0.1 0.9 Master’s degree 3.5 7.5 0.7 1.1 1.8 1.3 0.4 0.4 3.0 Post-graduate and honours degree 2.6 7.8 0.6 1.5 1.6 1.2 0.3 0.4 2.8 Bachelor’s degree and level 7 qualification 14.5 37.7 4.4 9.4 11.1 10.1 2.6 3.7 15.4 Level 6 diploma 5.4 13.4 3.6 6.3 3.8 3.5 1.4 2.1 6.1 Level 5 diploma 6.2 5.3 6.1 6.3 5.2 4.9 2.2 2.6 5.2 Level 4 certificate gained post-school 14.1 6.1 34.6 13.7 8.8 10.5 11 10.1 13.7 Level 3 certificate gained post-school 2.2 1.4 3.9 5.2 3.5 3.5 2.1 2.6 2.7 Level 2 certificate gained post-school 1.4 0.7 2.5 1.9 1.9 1.8 1.5 1.9 1.6 Level 1 certificate gained post-school 0.3 0.2 0.5 0.6 0.5 0.4 0.4 0.5 0.4 Overseas secondary school qualification 4.8 2.3 5 6 5.5 6.2 5.9 6.3 4.7 Level 3 or 4 certificate gained at school 5.2 3.3 3.2 6.1 6.4 6.6 3.1 3.4 4.5 Level 2 certificate gained at school 11 4.8 6.4 10.2 15.4 12.7 7.8 7.9 9.1 Level 1 certificate gained at school 13.9 3.8 10.6 13.9 20.1 18 17 16.3 12.7 No school qualifications 14.4 2.7 17.7 17.8 14 19.3 44.1 41.8 17.3 Total 100 100 100 100 100 100 100 100 100 Source: Statistics New Zealand, 2006 Census
New Zealand socio-economic index 2006
32
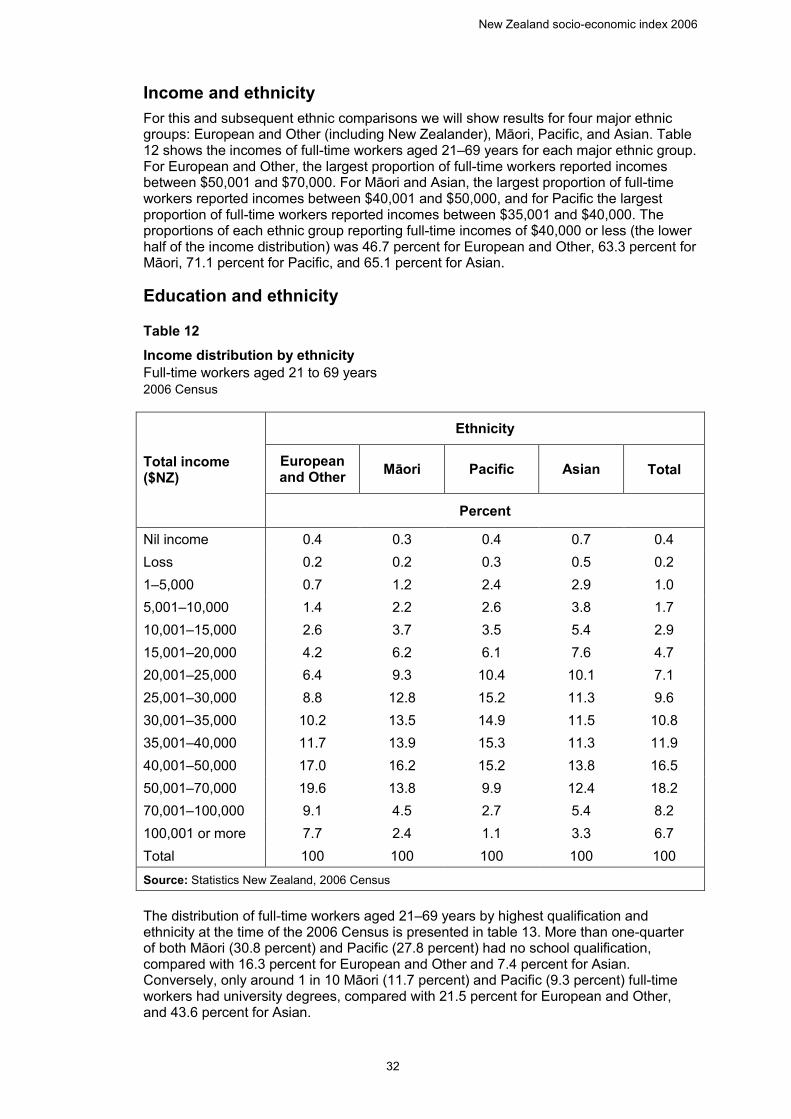
Income and ethnicity For this and subsequent ethnic comparisons we will show results for four major ethnic groups: European and Other (including New Zealander), Māori, Pacific, and Asian. Table 12 shows the incomes of full-time workers aged 21–69 years for each major ethnic group. For European and Other, the largest proportion of full-time workers reported incomes between $50,001 and $70,000. For Māori and Asian, the largest proportion of full-time workers reported incomes between $40,001 and $50,000, and for Pacific the largest proportion of full-time workers reported incomes between $35,001 and $40,000. The proportions of each ethnic group reporting full-time incomes of $40,000 or less (the lower half of the income distribution) was 46.7 percent for European and Other, 63.3 percent for Māori, 71.1 percent for Pacific, and 65.1 percent for Asian.
Education and ethnicity
Table 12 Income distribution by ethnicity Full-time workers aged 21 to 69 years 2006 Census 12 Income distribution by ethnicity, full-time workers aged 21 to 69 years, 2006 Census
Total income ($NZ)
Ethnicity
European and Other Māori Pacific Asian Total
Percent
Nil income 0.4 0.3 0.4 0.7 0.4 Loss 0.2 0.2 0.3 0.5 0.2 1–5,000 0.7 1.2 2.4 2.9 1.0 5,001–10,000 1.4 2.2 2.6 3.8 1.7 10,001–15,000 2.6 3.7 3.5 5.4 2.9 15,001–20,000 4.2 6.2 6.1 7.6 4.7 20,001–25,000 6.4 9.3 10.4 10.1 7.1 25,001–30,000 8.8 12.8 15.2 11.3 9.6 30,001–35,000 10.2 13.5 14.9 11.5 10.8 35,001–40,000 11.7 13.9 15.3 11.3 11.9 40,001–50,000 17.0 16.2 15.2 13.8 16.5 50,001–70,000 19.6 13.8 9.9 12.4 18.2 70,001–100,000 9.1 4.5 2.7 5.4 8.2 100,001 or more 7.7 2.4 1.1 3.3 6.7 Total 100 100 100 100 100 Source: Statistics New Zealand, 2006 Census
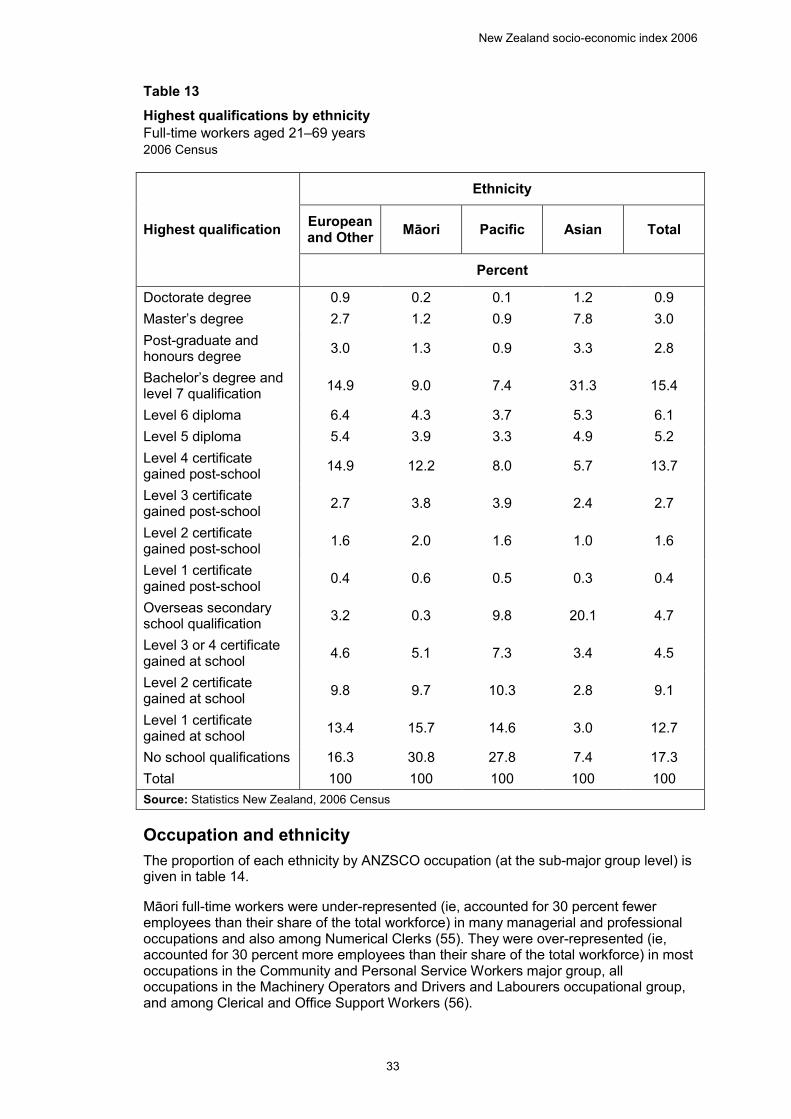
The distribution of full-time workers aged 21–69 years by highest qualification and ethnicity at the time of the 2006 Census is presented in table 13. More than one-quarter of both Māori (30.8 percent) and Pacific (27.8 percent) had no school qualification, compared with 16.3 percent for European and Other and 7.4 percent for Asian. Conversely, only around 1 in 10 Māori (11.7 percent) and Pacific (9.3 percent) full-time workers had university degrees, compared with 21.5 percent for European and Other, and 43.6 percent for Asian.
New Zealand socio-economic index 2006
33
Table 13 Highest qualifications by ethnicity Full-time workers aged 21–69 years 2006 Census 13 Highest qualifications by ethnicity, full-time workers aged 21–69 years, 2006 Census
Highest qualification
Ethnicity
European and Other Māori Pacific Asian Total
Percent
Doctorate degree 0.9 0.2 0.1 1.2 0.9 Master’s degree 2.7 1.2 0.9 7.8 3.0 Post-graduate and honours degree 3.0 1.3 0.9 3.3 2.8
Bachelor’s degree and level 7 qualification 14.9 9.0 7.4 31.3 15.4
Level 6 diploma 6.4 4.3 3.7 5.3 6.1 Level 5 diploma 5.4 3.9 3.3 4.9 5.2 Level 4 certificate gained post-school 14.9 12.2 8.0 5.7 13.7
Level 3 certificate gained post-school 2.7 3.8 3.9 2.4 2.7
Level 2 certificate gained post-school 1.6 2.0 1.6 1.0 1.6
Level 1 certificate gained post-school 0.4 0.6 0.5 0.3 0.4
Overseas secondary school qualification 3.2 0.3 9.8 20.1 4.7
Level 3 or 4 certificate gained at school 4.6 5.1 7.3 3.4 4.5
Level 2 certificate gained at school 9.8 9.7 10.3 2.8 9.1
Level 1 certificate gained at school 13.4 15.7 14.6 3.0 12.7
No school qualifications 16.3 30.8 27.8 7.4 17.3 Total 100 100 100 100 100 Source: Statistics New Zealand, 2006 Census
Occupation and ethnicity The proportion of each ethnicity by ANZSCO occupation (at the sub-major group level) is given in table 14.
Māori full-time workers were under-represented (ie, accounted for 30 percent fewer employees than their share of the total workforce) in many managerial and professional occupations and also among Numerical Clerks (55). They were over-represented (ie, accounted for 30 percent more employees than their share of the total workforce) in most occupations in the Community and Personal Service Workers major group, all occupations in the Machinery Operators and Drivers and Labourers occupational group, and among Clerical and Office Support Workers (56).
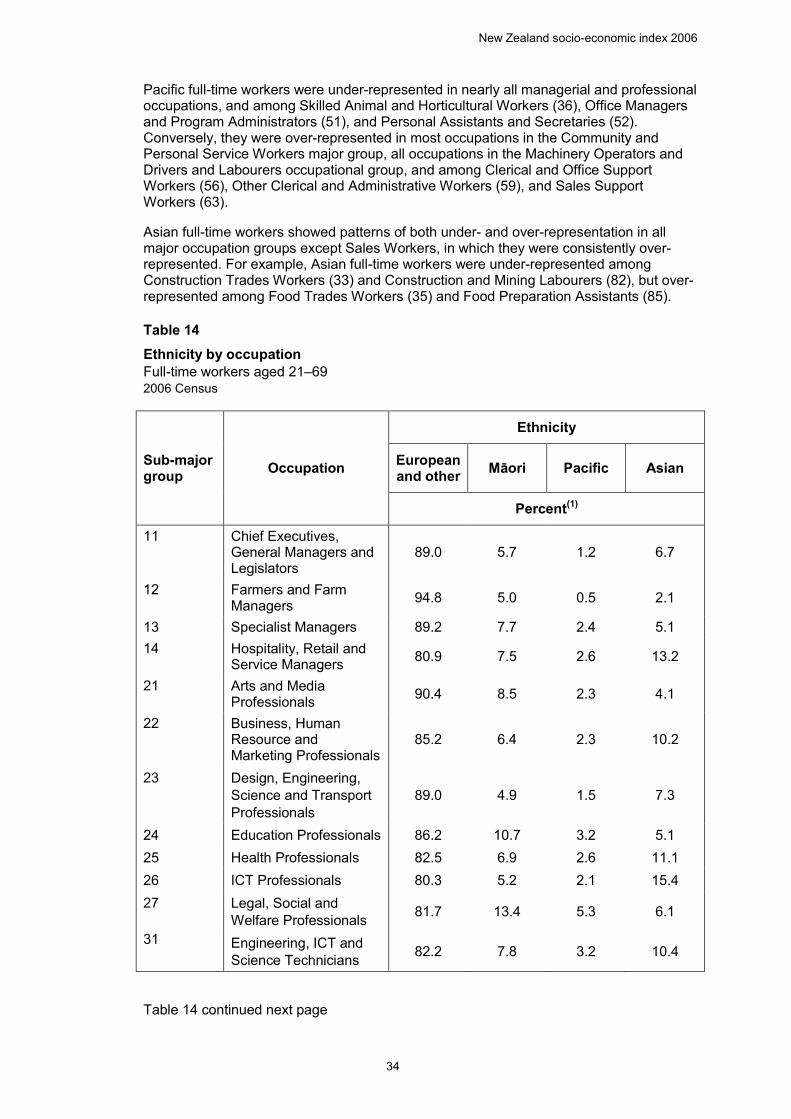
New Zealand socio-economic index 2006
34
Pacific full-time workers were under-represented in nearly all managerial and professional occupations, and among Skilled Animal and Horticultural Workers (36), Office Managers and Program Administrators (51), and Personal Assistants and Secretaries (52). Conversely, they were over-represented in most occupations in the Community and Personal Service Workers major group, all occupations in the Machinery Operators and Drivers and Labourers occupational group, and among Clerical and Office Support Workers (56), Other Clerical and Administrative Workers (59), and Sales Support Workers (63).
Asian full-time workers showed patterns of both under- and over-representation in all major occupation groups except Sales Workers, in which they were consistently over-represented. For example, Asian full-time workers were under-represented among Construction Trades Workers (33) and Construction and Mining Labourers (82), but over-represented among Food Trades Workers (35) and Food Preparation Assistants (85).
Table 14 Ethnicity by occupation Full-time workers aged 21–69 2006 Census 14 Ethnicity by occupation, full-time workers aged 21–69, 2006 Census
Sub-major group Occupation
Ethnicity
European and other Māori Pacific Asian
Percent(1)
11 Chief Executives, General Managers and Legislators
89.0 5.7 1.2 6.7
12 Farmers and Farm Managers 94.8 5.0 0.5 2.1
13 Specialist Managers 89.2 7.7 2.4 5.1 14 Hospitality, Retail and
Service Managers 80.9 7.5 2.6 13.2
21 Arts and Media Professionals 90.4 8.5 2.3 4.1
22 Business, Human Resource and Marketing Professionals
85.2 6.4 2.3 10.2
23 Design, Engineering, Science and Transport Professionals
89.0 4.9 1.5 7.3
24 Education Professionals 86.2 10.7 3.2 5.1 25 Health Professionals 82.5 6.9 2.6 11.1 26 ICT Professionals 80.3 5.2 2.1 15.4 27 Legal, Social and
Welfare Professionals 81.7 13.4 5.3 6.1
31 Engineering, ICT and Science Technicians 82.2 7.8 3.2 10.4
Table 14 continued next page
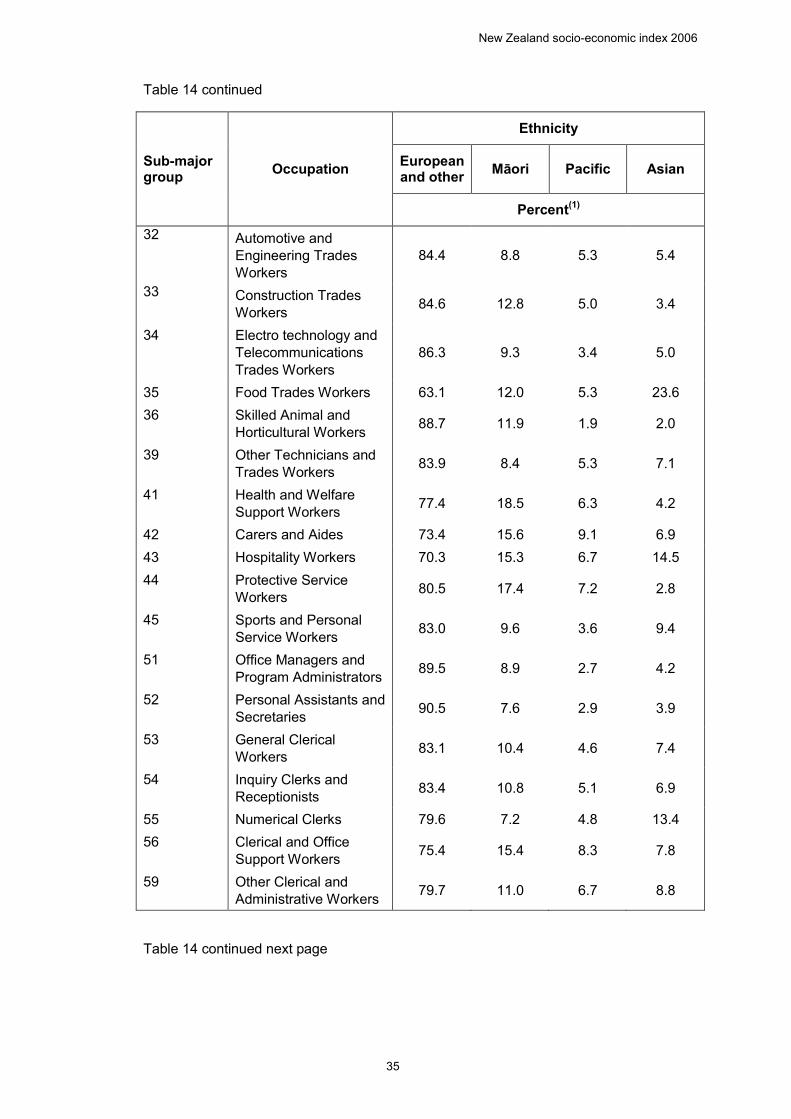
New Zealand socio-economic index 2006
35
Table 14 continued
Sub-major group Occupation
Ethnicity
European and other Māori Pacific Asian
Percent(1)
32 Automotive and Engineering Trades Workers
84.4 8.8 5.3 5.4
33 Construction Trades Workers 84.6 12.8 5.0 3.4
34 Electro technology and Telecommunications Trades Workers
86.3 9.3 3.4 5.0
35 Food Trades Workers 63.1 12.0 5.3 23.6 36 Skilled Animal and
Horticultural Workers 88.7 11.9 1.9 2.0
39 Other Technicians and Trades Workers 83.9 8.4 5.3 7.1
41 Health and Welfare Support Workers 77.4 18.5 6.3 4.2
42 Carers and Aides 73.4 15.6 9.1 6.9 43 Hospitality Workers 70.3 15.3 6.7 14.5 44 Protective Service
Workers 80.5 17.4 7.2 2.8
45 Sports and Personal Service Workers 83.0 9.6 3.6 9.4
51 Office Managers and Program Administrators 89.5 8.9 2.7 4.2
52 Personal Assistants and Secretaries 90.5 7.6 2.9 3.9
53 General Clerical Workers 83.1 10.4 4.6 7.4
54 Inquiry Clerks and Receptionists 83.4 10.8 5.1 6.9
55 Numerical Clerks 79.6 7.2 4.8 13.4 56 Clerical and Office
Support Workers 75.4 15.4 8.3 7.8
59 Other Clerical and Administrative Workers 79.7 11.0 6.7 8.8
Table 14 continued next page
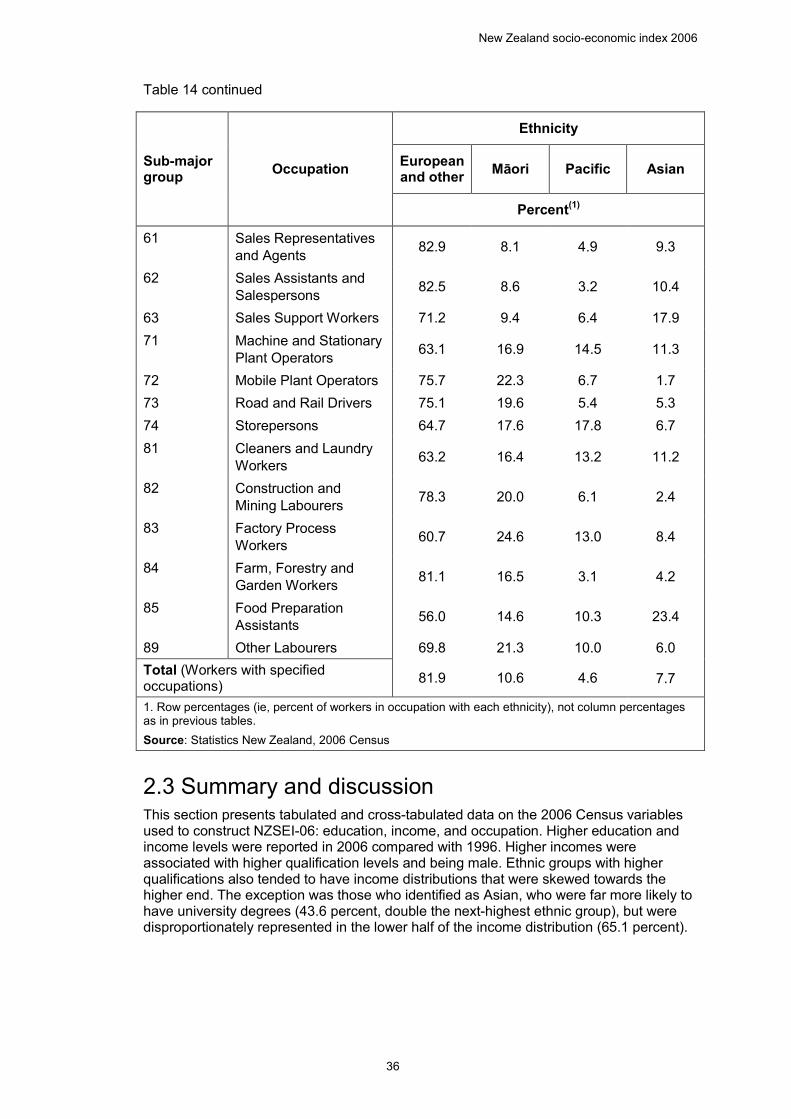
New Zealand socio-economic index 2006
36
Table 14 continued
Sub-major group Occupation
Ethnicity
European and other Māori Pacific Asian
Percent(1)
61 Sales Representatives and Agents 82.9 8.1 4.9 9.3
62 Sales Assistants and Salespersons 82.5 8.6 3.2 10.4
63 Sales Support Workers 71.2 9.4 6.4 17.9 71 Machine and Stationary
Plant Operators 63.1 16.9 14.5 11.3
72 Mobile Plant Operators 75.7 22.3 6.7 1.7 73 Road and Rail Drivers 75.1 19.6 5.4 5.3 74 Storepersons 64.7 17.6 17.8 6.7 81 Cleaners and Laundry
Workers 63.2 16.4 13.2 11.2
82 Construction and Mining Labourers 78.3 20.0 6.1 2.4
83 Factory Process Workers 60.7 24.6 13.0 8.4
84 Farm, Forestry and Garden Workers 81.1 16.5 3.1 4.2
85 Food Preparation Assistants 56.0 14.6 10.3 23.4
89 Other Labourers 69.8 21.3 10.0 6.0 Total (Workers with specified occupations) 81.9 10.6 4.6 7.7
1. Row percentages (ie, percent of workers in occupation with each ethnicity), not column percentages as in previous tables. Source: Statistics New Zealand, 2006 Census
2.3 Summary and discussion This section presents tabulated and cross-tabulated data on the 2006 Census variables used to construct NZSEI-06: education, income, and occupation. Higher education and income levels were reported in 2006 compared with 1996. Higher incomes were associated with higher qualification levels and being male. Ethnic groups with higher qualifications also tended to have income distributions that were skewed towards the higher end. The exception was those who identified as Asian, who were far more likely to have university degrees (43.6 percent, double the next-highest ethnic group), but were disproportionately represented in the lower half of the income distribution (65.1 percent).
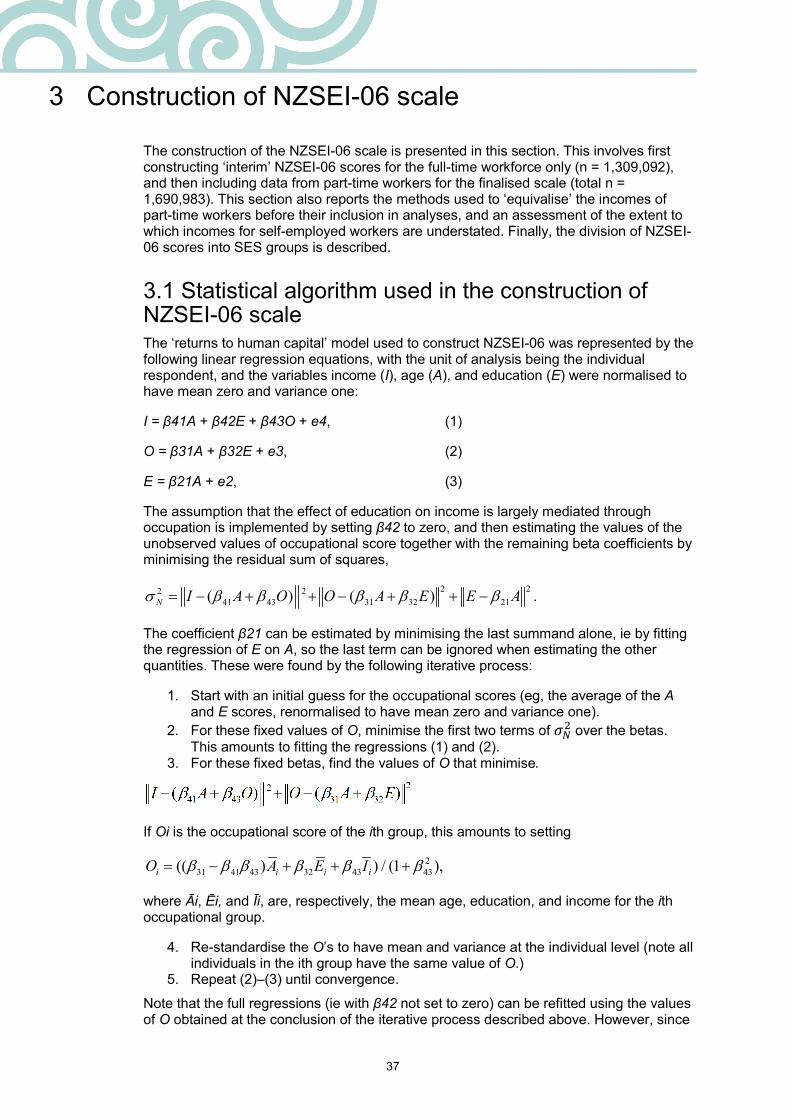
37
3 Construction of NZSEI-06 scale
The construction of the NZSEI-06 scale is presented in this section. This involves first constructing ‘interim’ NZSEI-06 scores for the full-time workforce only (n = 1,309,092), and then including data from part-time workers for the finalised scale (total n = 1,690,983). This section also reports the methods used to ‘equivalise’ the incomes of part-time workers before their inclusion in analyses, and an assessment of the extent to which incomes for self-employed workers are understated. Finally, the division of NZSEI-06 scores into SES groups is described.
3.1 Statistical algorithm used in the construction of NZSEI-06 scale The ‘returns to human capital’ model used to construct NZSEI-06 was represented by the following linear regression equations, with the unit of analysis being the individual respondent, and the variables income (I), age (A), and education (E) were normalised to have mean zero and variance one:
I = β41A + β42E + β43O + e4, (1)
O = β31A + β32E + e3, (2)
E = β21A + e2, (3)
The assumption that the effect of education on income is largely mediated through occupation is implemented by setting β42 to zero, and then estimating the values of the unobserved values of occupational score together with the remaining beta coefficients by minimising the residual sum of squares,
2 22 2
41 43 31 32 21( ) ( ) .N
I A O O A E E Aσ β β β β β= − + + − + + −
The coefficient β21 can be estimated by minimising the last summand alone, ie by fitting the regression of E on A, so the last term can be ignored when estimating the other quantities. These were found by the following iterative process:
1. Start with an initial guess for the occupational scores (eg, the average of the A and E scores, renormalised to have mean zero and variance one).
2. For these fixed values of O, minimise the first two terms of ���over the betas.
This amounts to fitting the regressions (1) and (2). 3. For these fixed betas, find the values of O that minimise.
If Oi is the occupational score of the ith group, this amounts to setting
2
31 41 43 32 43 43(( ) ) / (1 ),i i i iO A E Iβ β β β β β= − + + +
where Āi, Ēi, and Īi, are, respectively, the mean age, education, and income for the ith occupational group.
4. Re-standardise the O’s to have mean and variance at the individual level (note all individuals in the ith group have the same value of O.)
5. Repeat (2)–(3) until convergence.
Note that the full regressions (ie with β42 not set to zero) can be refitted using the values of O obtained at the conclusion of the iterative process described above. However, since
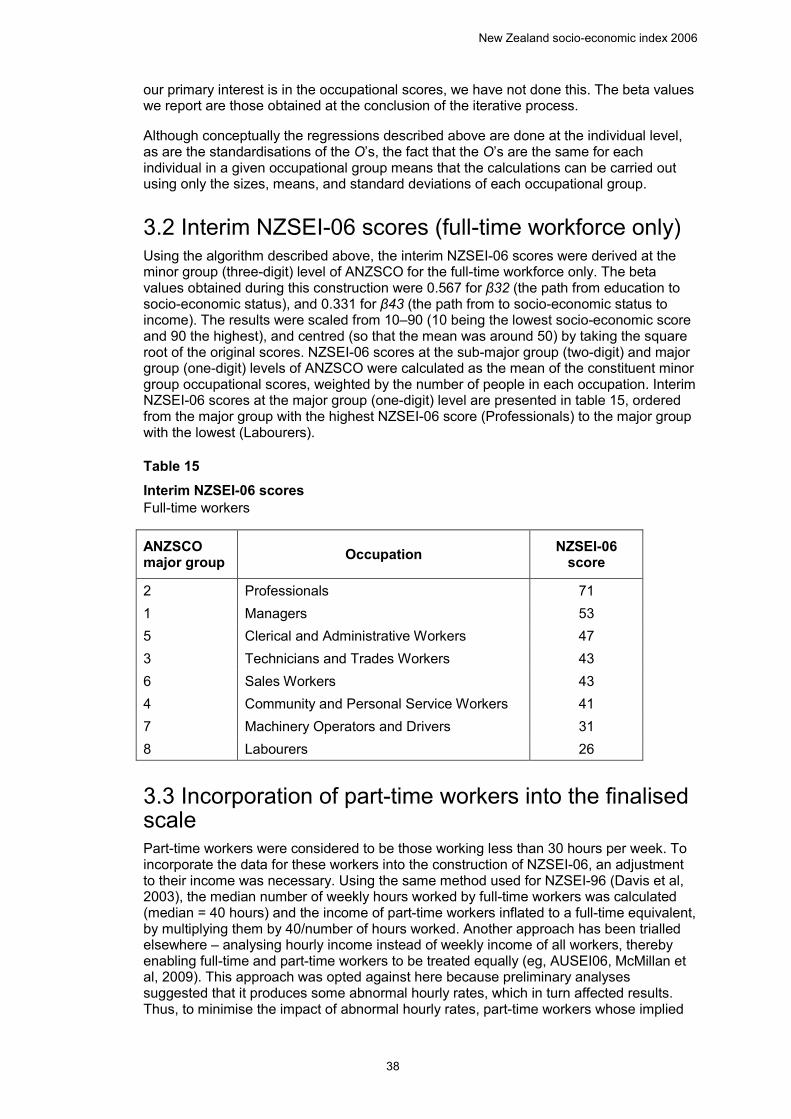
New Zealand socio-economic index 2006
38
our primary interest is in the occupational scores, we have not done this. The beta values we report are those obtained at the conclusion of the iterative process.
Although conceptually the regressions described above are done at the individual level, as are the standardisations of the O’s, the fact that the O’s are the same for each individual in a given occupational group means that the calculations can be carried out using only the sizes, means, and standard deviations of each occupational group.
3.2 Interim NZSEI-06 scores (full-time workforce only) Using the algorithm described above, the interim NZSEI-06 scores were derived at the minor group (three-digit) level of ANZSCO for the full-time workforce only. The beta values obtained during this construction were 0.567 for β32 (the path from education to socio-economic status), and 0.331 for β43 (the path from to socio-economic status to income). The results were scaled from 10–90 (10 being the lowest socio-economic score and 90 the highest), and centred (so that the mean was around 50) by taking the square root of the original scores. NZSEI-06 scores at the sub-major group (two-digit) and major group (one-digit) levels of ANZSCO were calculated as the mean of the constituent minor group occupational scores, weighted by the number of people in each occupation. Interim NZSEI-06 scores at the major group (one-digit) level are presented in table 15, ordered from the major group with the highest NZSEI-06 score (Professionals) to the major group with the lowest (Labourers).
Table 15 Interim NZSEI-06 scores Full-time workers 15 Interim NZSEI 06 scores, full-time workers
ANZSCO major group Occupation NZSEI-06
score
2 Professionals 71 1 Managers 53 5 Clerical and Administrative Workers 47 3 Technicians and Trades Workers 43 6 Sales Workers 43 4 Community and Personal Service Workers 41 7 Machinery Operators and Drivers 31 8 Labourers 26
3.3 Incorporation of part-time workers into the finalised scale Part-time workers were considered to be those working less than 30 hours per week. To incorporate the data for these workers into the construction of NZSEI-06, an adjustment to their income was necessary. Using the same method used for NZSEI-96 (Davis et al, 2003), the median number of weekly hours worked by full-time workers was calculated (median = 40 hours) and the income of part-time workers inflated to a full-time equivalent, by multiplying them by 40/number of hours worked. Another approach has been trialled elsewhere – analysing hourly income instead of weekly income of all workers, thereby enabling full-time and part-time workers to be treated equally (eg, AUSEI06, McMillan et al, 2009). This approach was opted against here because preliminary analyses suggested that it produces some abnormal hourly rates, which in turn affected results. Thus, to minimise the impact of abnormal hourly rates, part-time workers whose implied
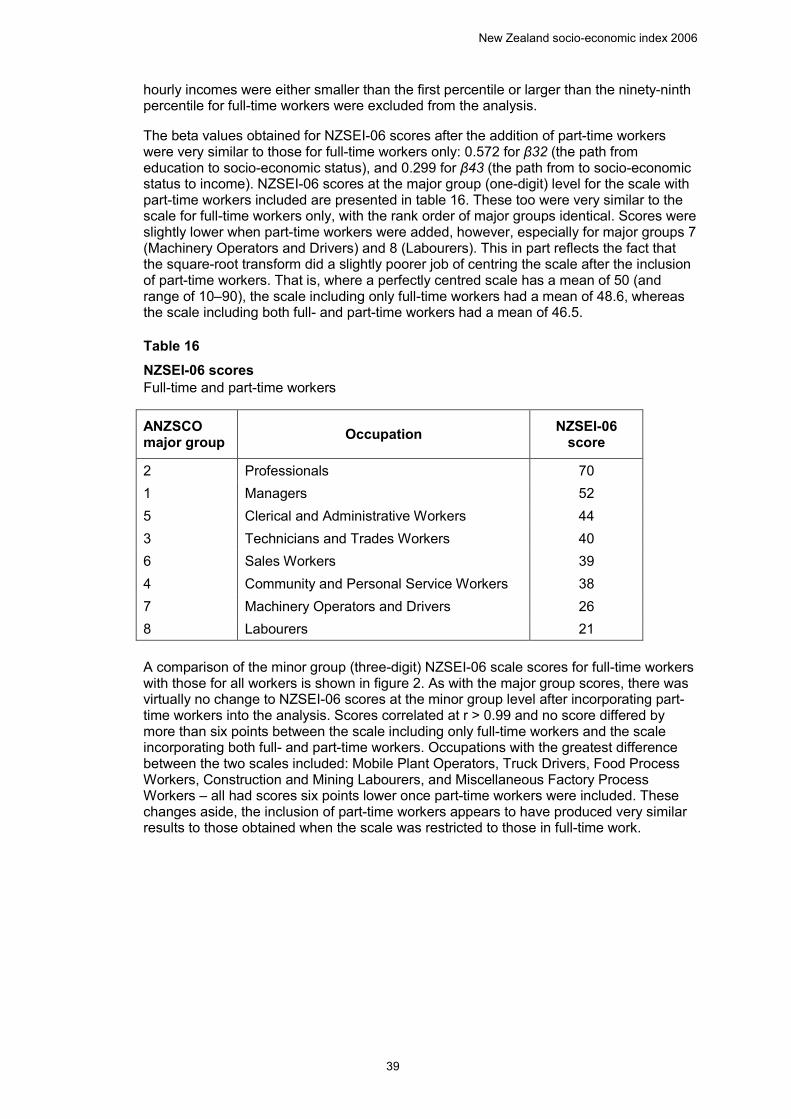
New Zealand socio-economic index 2006
39
hourly incomes were either smaller than the first percentile or larger than the ninety-ninth percentile for full-time workers were excluded from the analysis.
The beta values obtained for NZSEI-06 scores after the addition of part-time workers were very similar to those for full-time workers only: 0.572 for β32 (the path from education to socio-economic status), and 0.299 for β43 (the path from to socio-economic status to income). NZSEI-06 scores at the major group (one-digit) level for the scale with part-time workers included are presented in table 16. These too were very similar to the scale for full-time workers only, with the rank order of major groups identical. Scores were slightly lower when part-time workers were added, however, especially for major groups 7 (Machinery Operators and Drivers) and 8 (Labourers). This in part reflects the fact that the square-root transform did a slightly poorer job of centring the scale after the inclusion of part-time workers. That is, where a perfectly centred scale has a mean of 50 (and range of 10–90), the scale including only full-time workers had a mean of 48.6, whereas the scale including both full- and part-time workers had a mean of 46.5.
Table 16 NZSEI-06 scores Full-time and part-time workers 16 NZSEI-06 scores, full-and part-time workers
ANZSCO major group Occupation NZSEI-06
score
2 Professionals 70 1 Managers 52 5 Clerical and Administrative Workers 44 3 Technicians and Trades Workers 40 6 Sales Workers 39 4 Community and Personal Service Workers 38 7 Machinery Operators and Drivers 26 8 Labourers 21
A comparison of the minor group (three-digit) NZSEI-06 scale scores for full-time workers with those for all workers is shown in figure 2. As with the major group scores, there was virtually no change to NZSEI-06 scores at the minor group level after incorporating part-time workers into the analysis. Scores correlated at r > 0.99 and no score differed by more than six points between the scale including only full-time workers and the scale incorporating both full- and part-time workers. Occupations with the greatest difference between the two scales included: Mobile Plant Operators, Truck Drivers, Food Process Workers, Construction and Mining Labourers, and Miscellaneous Factory Process Workers – all had scores six points lower once part-time workers were included. These changes aside, the inclusion of part-time workers appears to have produced very similar results to those obtained when the scale was restricted to those in full-time work.
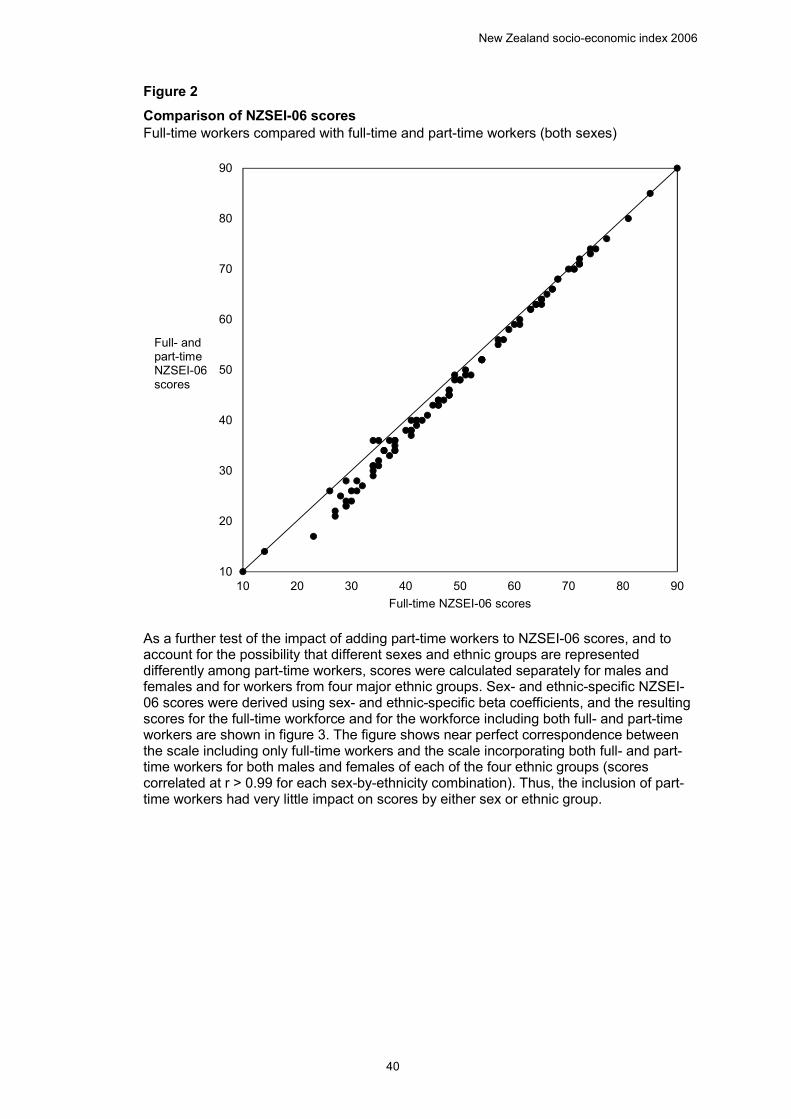
New Zealand socio-economic index 2006
40
Figure 2
Comparison of NZSEI-06 scores
Full-time workers compared with full-time and part-time workers (both sexes) 2 Comparison of NZSEI-06 scores, full-time workers compared with full-time and part-time workers (both sexes)
As a further test of the impact of adding part-time workers to NZSEI-06 scores, and to account for the possibility that different sexes and ethnic groups are represented differently among part-time workers, scores were calculated separately for males and females and for workers from four major ethnic groups. Sex- and ethnic-specific NZSEI-06 scores were derived using sex- and ethnic-specific beta coefficients, and the resulting scores for the full-time workforce and for the workforce including both full- and part-time workers are shown in figure 3. The figure shows near perfect correspondence between the scale including only full-time workers and the scale incorporating both full- and part-time workers for both males and females of each of the four ethnic groups (scores correlated at r > 0.99 for each sex-by-ethnicity combination). Thus, the inclusion of part-time workers had very little impact on scores by either sex or ethnic group.
10
20
30
40
50
60
70
80
90
10 20 30 40 50 60 70 80 90
Full- andpart-time NZSEI-06 scores
Full-time NZSEI-06 scores
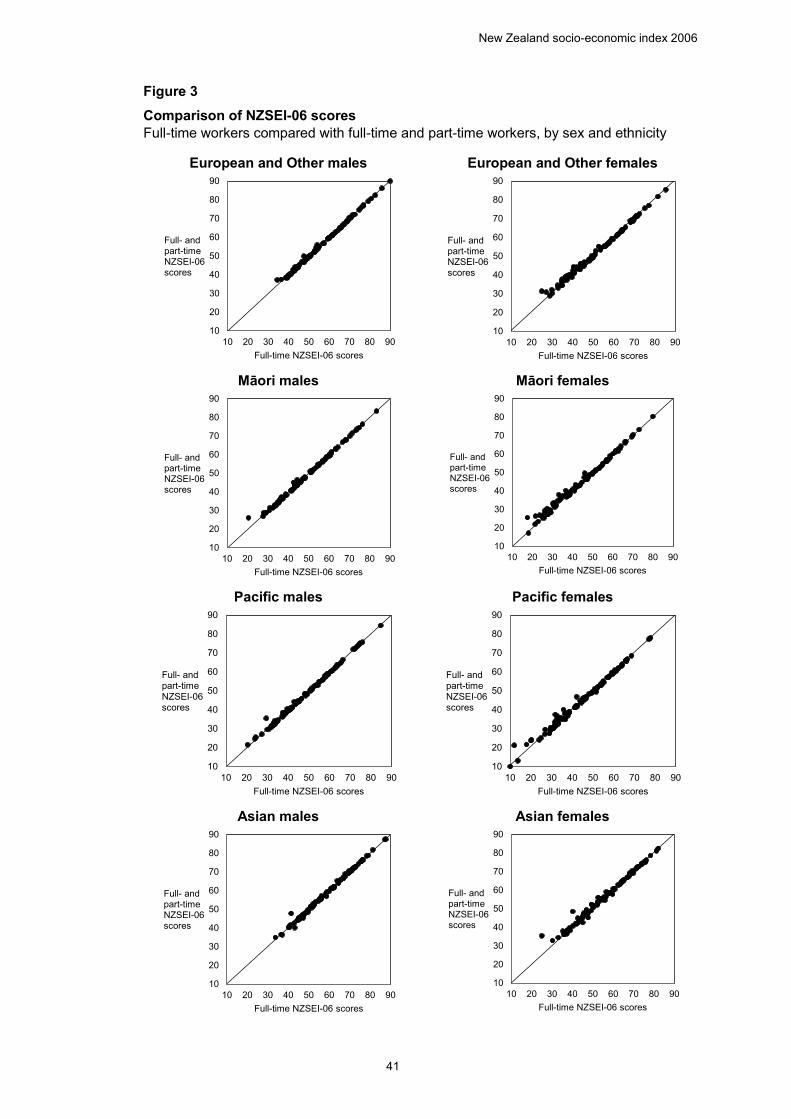
New Zealand socio-economic index 2006
41
Figure 3 Comparison of NZSEI-06 scores Full-time workers compared with full-time and part-time workers, by sex and ethnicity 3 Comparison of NZSEI-06 scores, full-time workers compared with full-time and part-time workers, by sex and ethnicity
European and Other males European and Other females
Māori males Māori females
Pacific males Pacific females
Asian males Asian females
10
20
30
40
50
60
70
80
90
10 20 30 40 50 60 70 80 90
Full- and part-time NZSEI-06 scores
Full-time NZSEI-06 scores
10
20
30
40
50
60
70
80
90
10 20 30 40 50 60 70 80 90
Full- and part-time NZSEI-06 scores
Full-time NZSEI-06 scores
10
20
30
40
50
60
70
80
90
10 20 30 40 50 60 70 80 90
Full- and part-time NZSEI-06 scores
Full-time NZSEI-06 scores
10
20
30
40
50
60
70
80
90
10 20 30 40 50 60 70 80 90
Full- and part-time NZSEI-06 scores
Full-time NZSEI-06 scores
10
20
30
40
50
60
70
80
90
10 20 30 40 50 60 70 80 90
Full- and part-time NZSEI-06 scores
Full-time NZSEI-06 scores
10
20
30
40
50
60
70
80
90
10 20 30 40 50 60 70 80 90
Full- and part-time NZSEI-06 scores
Full-time NZSEI-06 scores
10
20
30
40
50
60
70
80
90
10 20 30 40 50 60 70 80 90
Full- and part-time NZSEI-06 scores
Full-time NZSEI-06 scores
10
20
30
40
50
60
70
80
90
10 20 30 40 50 60 70 80 90
Full- and part-time NZSEI-06 scores
Full-time NZSEI-06 scores
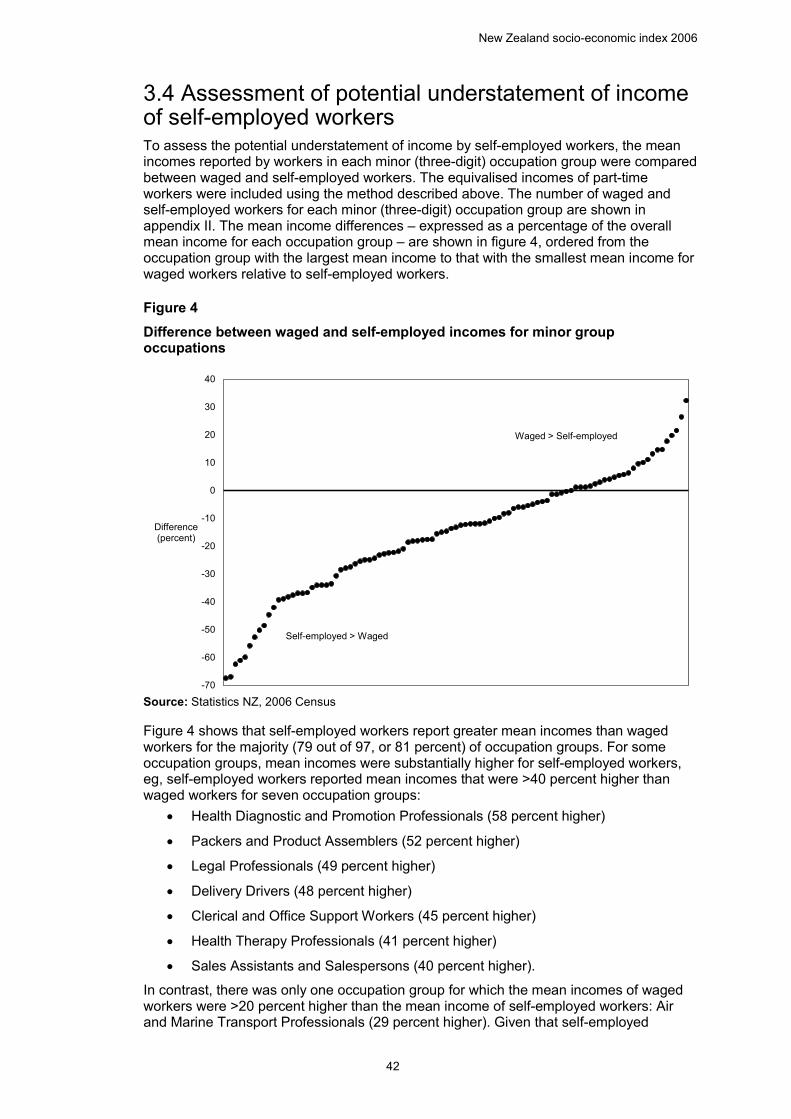
New Zealand socio-economic index 2006
42
3.4 Assessment of potential understatement of income of self-employed workers To assess the potential understatement of income by self-employed workers, the mean incomes reported by workers in each minor (three-digit) occupation group were compared between waged and self-employed workers. The equivalised incomes of part-time workers were included using the method described above. The number of waged and self-employed workers for each minor (three-digit) occupation group are shown in appendix II. The mean income differences – expressed as a percentage of the overall mean income for each occupation group – are shown in figure 4, ordered from the occupation group with the largest mean income to that with the smallest mean income for waged workers relative to self-employed workers.
Figure 4 Difference between waged and self-employed incomes for minor group occupations 4 Difference between waged and self-employed incomes for minor-group occupations
Source: Statistics NZ, 2006 Census
Figure 4 shows that self-employed workers report greater mean incomes than waged workers for the majority (79 out of 97, or 81 percent) of occupation groups. For some occupation groups, mean incomes were substantially higher for self-employed workers, eg, self-employed workers reported mean incomes that were >40 percent higher than waged workers for seven occupation groups:
• Health Diagnostic and Promotion Professionals (58 percent higher)
• Packers and Product Assemblers (52 percent higher)
• Legal Professionals (49 percent higher)
• Delivery Drivers (48 percent higher)
• Clerical and Office Support Workers (45 percent higher)
• Health Therapy Professionals (41 percent higher)
• Sales Assistants and Salespersons (40 percent higher).
In contrast, there was only one occupation group for which the mean incomes of waged workers were >20 percent higher than the mean income of self-employed workers: Air and Marine Transport Professionals (29 percent higher). Given that self-employed
-70
-60
-50
-40
-30
-20
-10
0
10
20
30
40
Difference (percent)
Waged > Self-employed
Self-employed > Waged
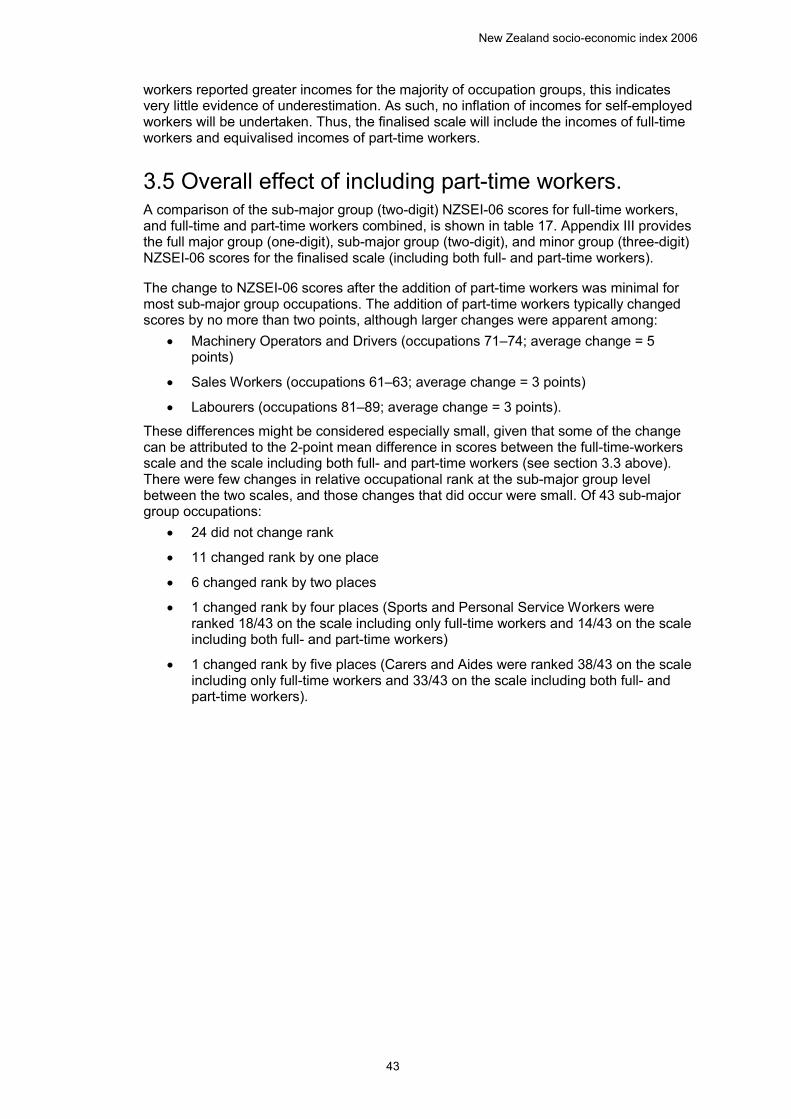
New Zealand socio-economic index 2006
43
workers reported greater incomes for the majority of occupation groups, this indicates very little evidence of underestimation. As such, no inflation of incomes for self-employed workers will be undertaken. Thus, the finalised scale will include the incomes of full-time workers and equivalised incomes of part-time workers.
3.5 Overall effect of including part-time workers. A comparison of the sub-major group (two-digit) NZSEI-06 scores for full-time workers, and full-time and part-time workers combined, is shown in table 17. Appendix III provides the full major group (one-digit), sub-major group (two-digit), and minor group (three-digit) NZSEI-06 scores for the finalised scale (including both full- and part-time workers).
The change to NZSEI-06 scores after the addition of part-time workers was minimal for most sub-major group occupations. The addition of part-time workers typically changed scores by no more than two points, although larger changes were apparent among:
• Machinery Operators and Drivers (occupations 71–74; average change = 5 points)
• Sales Workers (occupations 61–63; average change = 3 points)
• Labourers (occupations 81–89; average change = 3 points).
These differences might be considered especially small, given that some of the change can be attributed to the 2-point mean difference in scores between the full-time-workers scale and the scale including both full- and part-time workers (see section 3.3 above). There were few changes in relative occupational rank at the sub-major group level between the two scales, and those changes that did occur were small. Of 43 sub-major group occupations:
• 24 did not change rank
• 11 changed rank by one place
• 6 changed rank by two places
• 1 changed rank by four places (Sports and Personal Service Workers were ranked 18/43 on the scale including only full-time workers and 14/43 on the scale including both full- and part-time workers)
• 1 changed rank by five places (Carers and Aides were ranked 38/43 on the scale including only full-time workers and 33/43 on the scale including both full- and part-time workers).
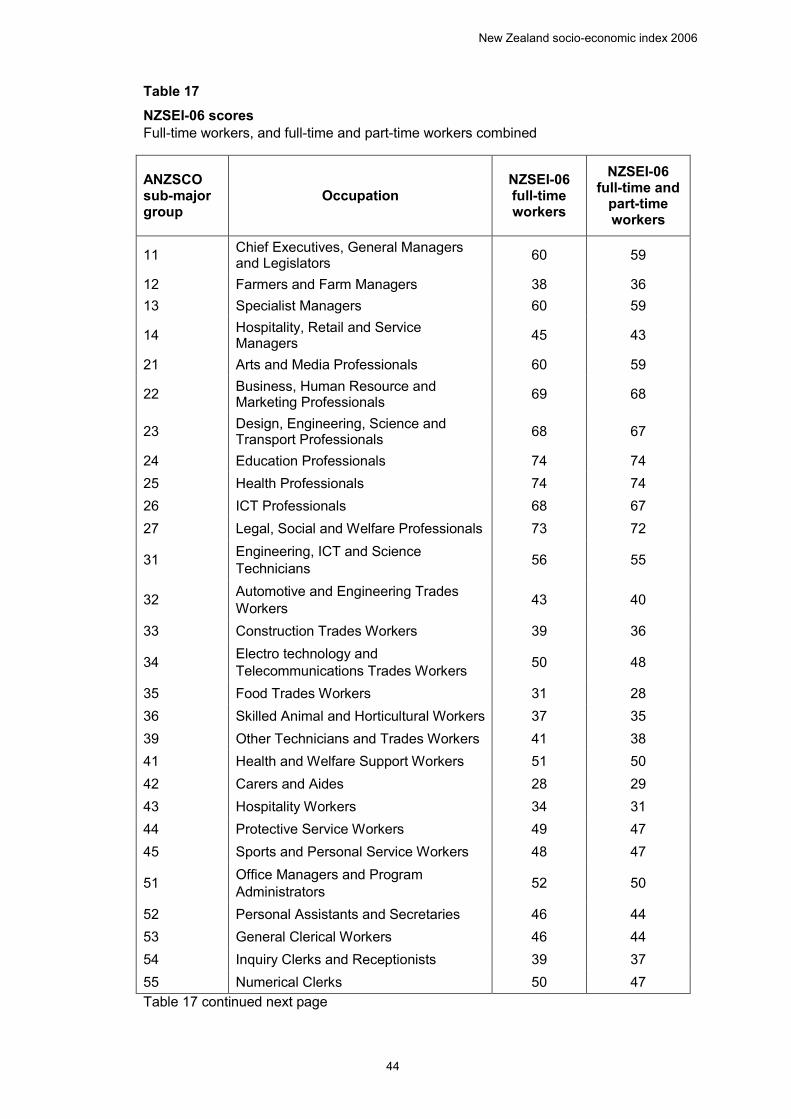
New Zealand socio-economic index 2006
44
Table 17 NZSEI-06 scores Full-time workers, and full-time and part-time workers combined 17 NZSEI-06 scores, full-time workers, and full-time and part-time workers combined
ANZSCO sub-major group
Occupation NZSEI-06 full-time workers
NZSEI-06 full-time and
part-time workers
11 Chief Executives, General Managers and Legislators 60 59
12 Farmers and Farm Managers 38 36 13 Specialist Managers 60 59
14 Hospitality, Retail and Service Managers 45 43
21 Arts and Media Professionals 60 59
22 Business, Human Resource and Marketing Professionals 69 68
23 Design, Engineering, Science and Transport Professionals 68 67
24 Education Professionals 74 74 25 Health Professionals 74 74 26 ICT Professionals 68 67 27 Legal, Social and Welfare Professionals 73 72
31 Engineering, ICT and Science Technicians 56 55
32 Automotive and Engineering Trades Workers 43 40
33 Construction Trades Workers 39 36
34 Electro technology and Telecommunications Trades Workers 50 48
35 Food Trades Workers 31 28 36 Skilled Animal and Horticultural Workers 37 35 39 Other Technicians and Trades Workers 41 38 41 Health and Welfare Support Workers 51 50 42 Carers and Aides 28 29 43 Hospitality Workers 34 31 44 Protective Service Workers 49 47 45 Sports and Personal Service Workers 48 47
51 Office Managers and Program Administrators 52 50
52 Personal Assistants and Secretaries 46 44 53 General Clerical Workers 46 44 54 Inquiry Clerks and Receptionists 39 37 55 Numerical Clerks 50 47 Table 17 continued next page
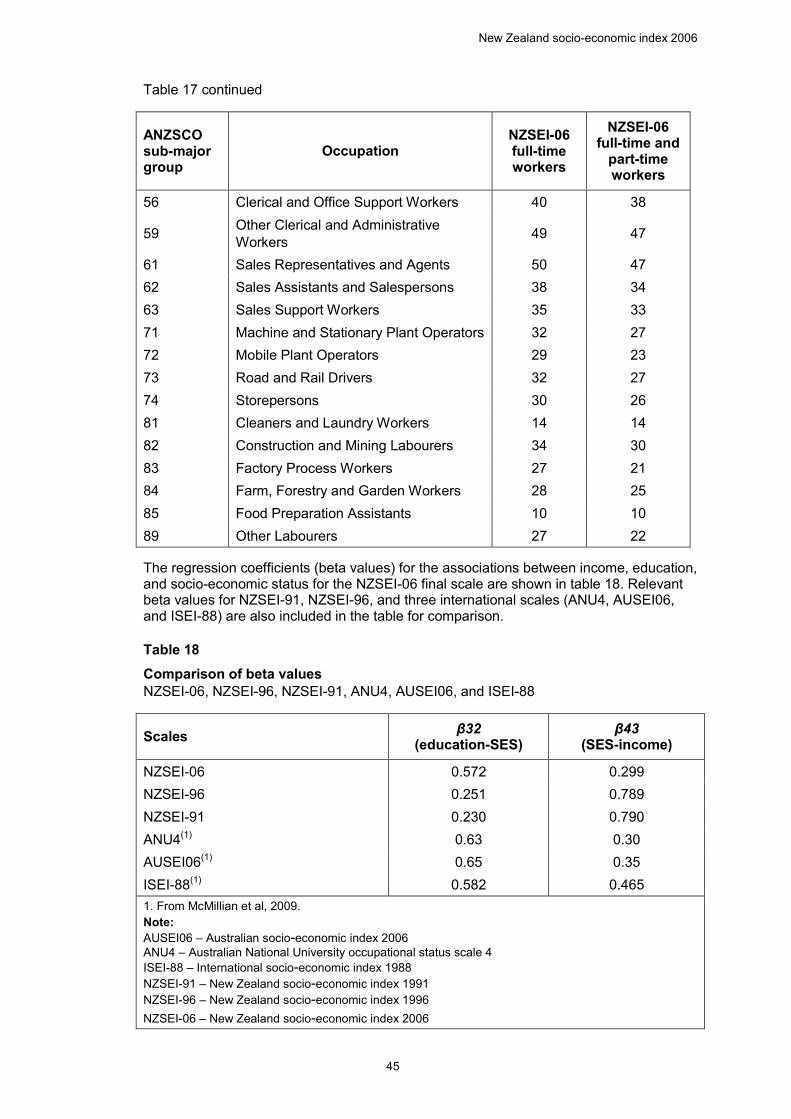
New Zealand socio-economic index 2006
45
Table 17 continued
ANZSCO sub-major group
Occupation NZSEI-06 full-time workers
NZSEI-06 full-time and
part-time workers
56 Clerical and Office Support Workers 40 38
59 Other Clerical and Administrative Workers 49 47
61 Sales Representatives and Agents 50 47 62 Sales Assistants and Salespersons 38 34 63 Sales Support Workers 35 33 71 Machine and Stationary Plant Operators 32 27 72 Mobile Plant Operators 29 23 73 Road and Rail Drivers 32 27 74 Storepersons 30 26 81 Cleaners and Laundry Workers 14 14 82 Construction and Mining Labourers 34 30 83 Factory Process Workers 27 21 84 Farm, Forestry and Garden Workers 28 25 85 Food Preparation Assistants 10 10 89 Other Labourers 27 22 The regression coefficients (beta values) for the associations between income, education, and socio-economic status for the NZSEI-06 final scale are shown in table 18. Relevant beta values for NZSEI-91, NZSEI-96, and three international scales (ANU4, AUSEI06, and ISEI-88) are also included in the table for comparison.
Table 18 Comparison of beta values NZSEI-06, NZSEI-96, NZSEI-91, ANU4, AUSEI06, and ISEI-88 18 Comparison of beta values, NZSEI-06, NZSEI-96, NZSEI-91, ANU4, AUSEI06, and ISEI-88
Scales β32 (education-SES)
β43 (SES-income)
NZSEI-06 0.572 0.299 NZSEI-96 0.251 0.789 NZSEI-91 0.230 0.790 ANU4(1) 0.63 0.30 AUSEI06(1) 0.65 0.35 ISEI-88(1) 0.582 0.465 1. From McMillian et al, 2009. Note: AUSEI06 – Australian socio-economic index 2006 ANU4 – Australian National University occupational status scale 4 ISEI-88 – International socio-economic index 1988 NZSEI-91 – New Zealand socio-economic index 1991 NZSEI-96 – New Zealand socio-economic index 1996 NZSEI-06 – New Zealand socio-economic index 2006
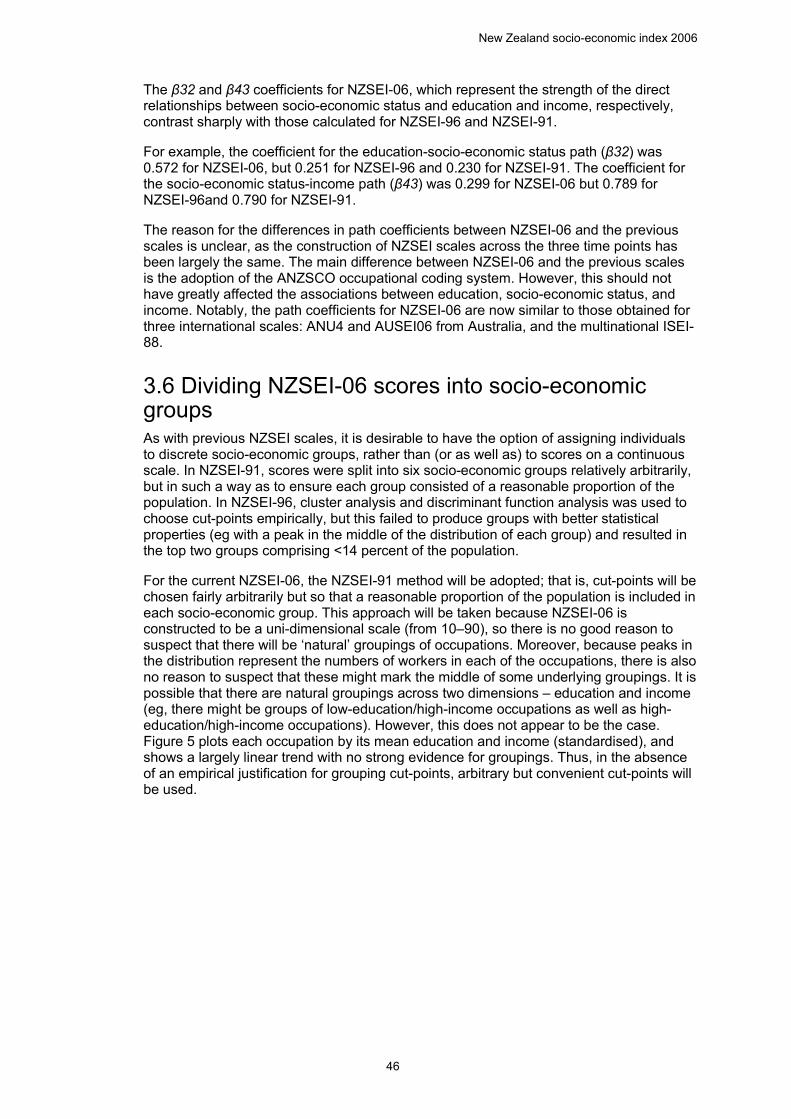
New Zealand socio-economic index 2006
46
The β32 and β43 coefficients for NZSEI-06, which represent the strength of the direct relationships between socio-economic status and education and income, respectively, contrast sharply with those calculated for NZSEI-96 and NZSEI-91.
For example, the coefficient for the education-socio-economic status path (β32) was 0.572 for NZSEI-06, but 0.251 for NZSEI-96 and 0.230 for NZSEI-91. The coefficient for the socio-economic status-income path (β43) was 0.299 for NZSEI-06 but 0.789 for NZSEI-96and 0.790 for NZSEI-91.
The reason for the differences in path coefficients between NZSEI-06 and the previous scales is unclear, as the construction of NZSEI scales across the three time points has been largely the same. The main difference between NZSEI-06 and the previous scales is the adoption of the ANZSCO occupational coding system. However, this should not have greatly affected the associations between education, socio-economic status, and income. Notably, the path coefficients for NZSEI-06 are now similar to those obtained for three international scales: ANU4 and AUSEI06 from Australia, and the multinational ISEI-88.
3.6 Dividing NZSEI-06 scores into socio-economic groups As with previous NZSEI scales, it is desirable to have the option of assigning individuals to discrete socio-economic groups, rather than (or as well as) to scores on a continuous scale. In NZSEI-91, scores were split into six socio-economic groups relatively arbitrarily, but in such a way as to ensure each group consisted of a reasonable proportion of the population. In NZSEI-96, cluster analysis and discriminant function analysis was used to choose cut-points empirically, but this failed to produce groups with better statistical properties (eg with a peak in the middle of the distribution of each group) and resulted in the top two groups comprising <14 percent of the population.
For the current NZSEI-06, the NZSEI-91 method will be adopted; that is, cut-points will be chosen fairly arbitrarily but so that a reasonable proportion of the population is included in each socio-economic group. This approach will be taken because NZSEI-06 is constructed to be a uni-dimensional scale (from 10–90), so there is no good reason to suspect that there will be ‘natural’ groupings of occupations. Moreover, because peaks in the distribution represent the numbers of workers in each of the occupations, there is also no reason to suspect that these might mark the middle of some underlying groupings. It is possible that there are natural groupings across two dimensions – education and income (eg, there might be groups of low-education/high-income occupations as well as high-education/high-income occupations). However, this does not appear to be the case. Figure 5 plots each occupation by its mean education and income (standardised), and shows a largely linear trend with no strong evidence for groupings. Thus, in the absence of an empirical justification for grouping cut-points, arbitrary but convenient cut-points will be used.
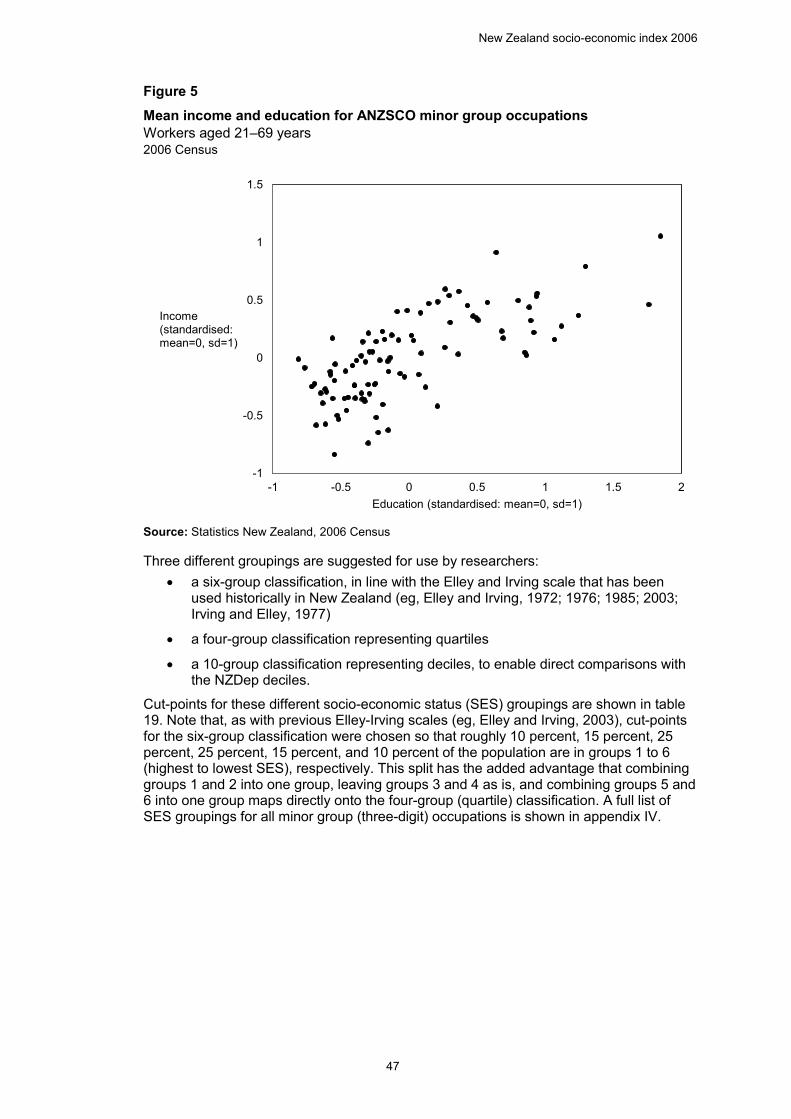
New Zealand socio-economic index 2006
47
Figure 5 Mean income and education for ANZSCO minor group occupations Workers aged 21–69 years 2006 Census 5 Mean income and education for ANZSCO minor group occupations, workers aged 21–69 years
Source: Statistics New Zealand, 2006 Census
Three different groupings are suggested for use by researchers: • a six-group classification, in line with the Elley and Irving scale that has been
used historically in New Zealand (eg, Elley and Irving, 1972; 1976; 1985; 2003; Irving and Elley, 1977)
• a four-group classification representing quartiles
• a 10-group classification representing deciles, to enable direct comparisons with the NZDep deciles.
Cut-points for these different socio-economic status (SES) groupings are shown in table 19. Note that, as with previous Elley-Irving scales (eg, Elley and Irving, 2003), cut-points for the six-group classification were chosen so that roughly 10 percent, 15 percent, 25 percent, 25 percent, 15 percent, and 10 percent of the population are in groups 1 to 6 (highest to lowest SES), respectively. This split has the added advantage that combining groups 1 and 2 into one group, leaving groups 3 and 4 as is, and combining groups 5 and 6 into one group maps directly onto the four-group (quartile) classification. A full list of SES groupings for all minor group (three-digit) occupations is shown in appendix IV.
-1
-0.5
0
0.5
1
1.5
-1 -0.5 0 0.5 1 1.5 2
Income (standardised: mean=0, sd=1)
Education (standardised: mean=0, sd=1)
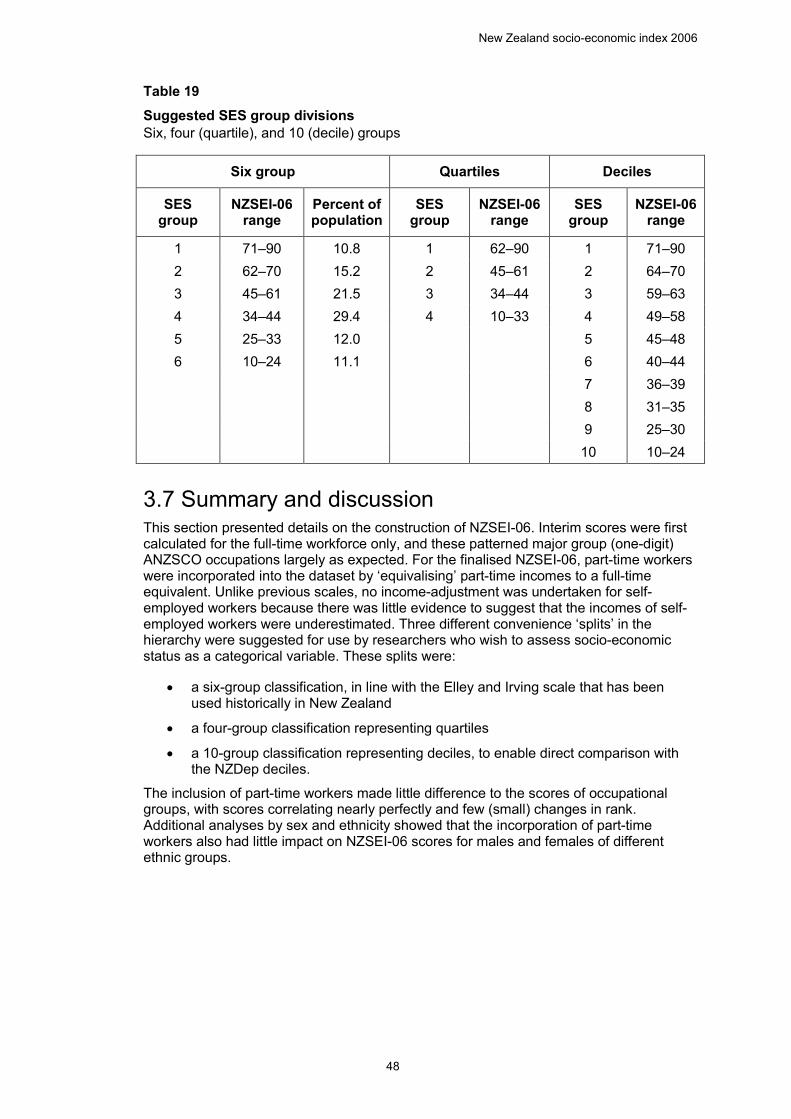
New Zealand socio-economic index 2006
48
Table 19 Suggested SES group divisions Six, four (quartile), and 10 (decile) groups 19 Suggested SES group divisions, six, four (quartile), and ten (decile) groups
Six group Quartiles Deciles
SES group
NZSEI-06 range
Percent of population
SES group
NZSEI-06 range
SES group
NZSEI-06 range
1 71–90 10.8 1 62–90 1 71–90 2 62–70 15.2 2 45–61 2 64–70 3 45–61 21.5 3 34–44 3 59–63 4 34–44 29.4 4 10–33 4 49–58 5 25–33 12.0 5 45–48 6 10–24 11.1 6 40–44 7 36–39 8 31–35 9 25–30 10 10–24
3.7 Summary and discussion This section presented details on the construction of NZSEI-06. Interim scores were first calculated for the full-time workforce only, and these patterned major group (one-digit) ANZSCO occupations largely as expected. For the finalised NZSEI-06, part-time workers were incorporated into the dataset by ‘equivalising’ part-time incomes to a full-time equivalent. Unlike previous scales, no income-adjustment was undertaken for self-employed workers because there was little evidence to suggest that the incomes of self-employed workers were underestimated. Three different convenience ‘splits’ in the hierarchy were suggested for use by researchers who wish to assess socio-economic status as a categorical variable. These splits were:
• a six-group classification, in line with the Elley and Irving scale that has been used historically in New Zealand
• a four-group classification representing quartiles
• a 10-group classification representing deciles, to enable direct comparison with the NZDep deciles.
The inclusion of part-time workers made little difference to the scores of occupational groups, with scores correlating nearly perfectly and few (small) changes in rank. Additional analyses by sex and ethnicity showed that the incorporation of part-time workers also had little impact on NZSEI-06 scores for males and females of different ethnic groups.
49
4 Assessing the finalised NZSEI-06
Section 4 presents the results of four tests of the stability and validity of the finalised NZSEI-06. These include:
(i) a comparison between NZSEI-06 and the previous NZSEI-96 (ii) a comparison between NZSEI-06 and AUSEI06 (iii) an assessment of whether NZSEI-06 methodology assigns scores similarly for
males and females, and similarly for different ethnic groups (iv) an assessment of the construct validation of NZSEI-06 in relation to health and
other socio-economic indicators.
4.1 Comparison between NZSEI-06 and NZSEI-96 A comparison between NZSEI-06 and its predecessor, NZSEI-96, is hampered by the fact that the two scales assign scores according to different occupational classifications: the NZSEI-06 scale assigns scores based on ANZSCO, and the NZSEI-96 scale assigned scores based on NZSCO95. Nonetheless, the data release for the 2006 Census did assign NZSEI-96 scores to all individuals in an occupation. Thus, it is possible to compare the scores assigned to individuals by NZSEI-06 (based on ANZSCO) with the scores assigned to individuals by NZSEI-96 (based on NZSCO95). Note that for both scales the same scale score was often assigned to two or more occupations. For example, for the NZSEI-06 scale, 97 ANZSCO minor group occupations were assigned 52 separate scores, and for the NZSEI-96 scale, 97 NZSCO95 minor group occupations were assigned 48 separate scores.
Figure 6 shows a comparison between NZSEI-06 and NZSEI-96 scores assigned to workers using data from the 2006 Census, with the size of the circles representing the number of individuals classified. The figure shows a wide range of NZSEI-96 scores assigned for a single NZSEI-06 score (and vice-versa), reflecting the fact that there were few one-to-one mappings between occupations from the two occupational scales (NZSCO95 and ANZSCO). Of the 52 NZSEI-06 scale scores assigned:
• 2 were assigned unique NZSEI-96 scores
• 5 were assigned two NZSEI-96 scores
• 5 were assigned three NZSEI-96 scores
• 7 were assigned four NZSEI-96 scores
• 20 were assigned between five and nine NZSEI-96 scores
• 13 were assigned 10 or more NZSEI-96 scores.
However, the large circles in figure 6 indicate there were many one-to-one mappings for large numbers of individuals. In fact, most (34 out of 52) NZSEI-06 scale scores mapped to a single NZSEI-96 scale score for at least half of the individuals assigned.
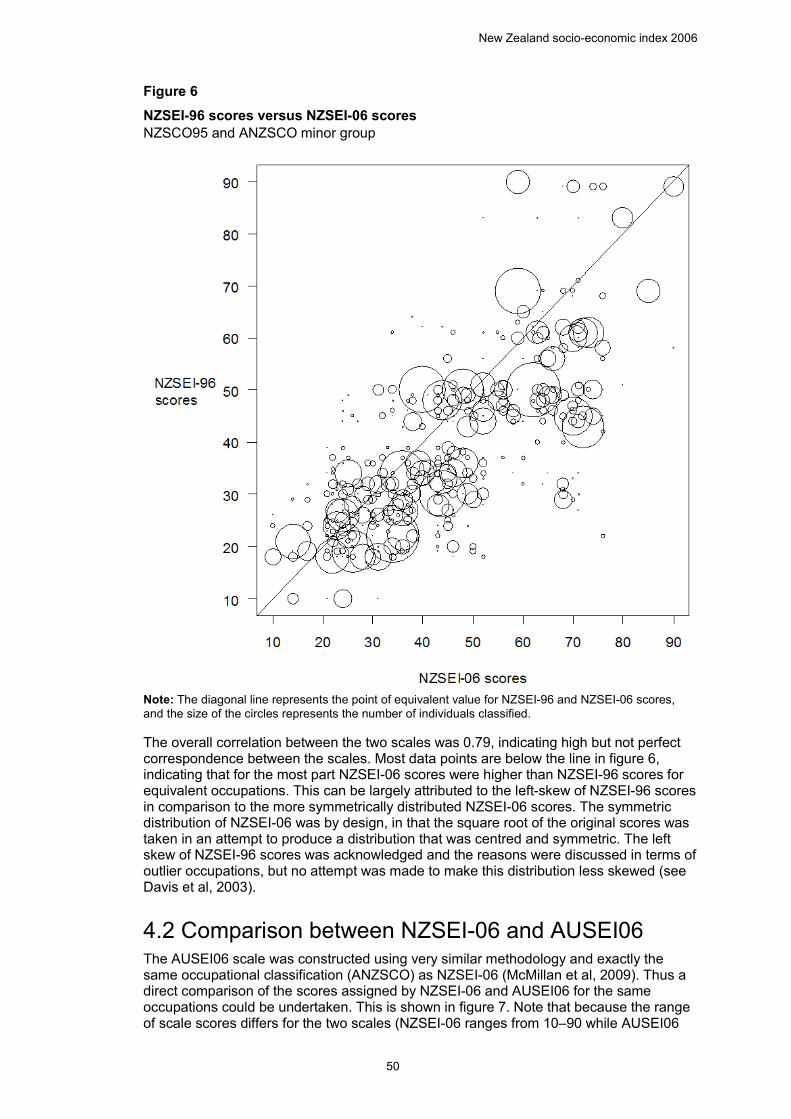
New Zealand socio-economic index 2006
50
Figure 6 NZSEI-96 scores versus NZSEI-06 scores NZSCO95 and ANZSCO minor group 6 NZSEI-96 versus NZSEI-06 scores, NZSCO95 and ANZSCO minor group
Note: The diagonal line represents the point of equivalent value for NZSEI-96 and NZSEI-06 scores, and the size of the circles represents the number of individuals classified.
The overall correlation between the two scales was 0.79, indicating high but not perfect correspondence between the scales. Most data points are below the line in figure 6, indicating that for the most part NZSEI-06 scores were higher than NZSEI-96 scores for equivalent occupations. This can be largely attributed to the left-skew of NZSEI-96 scores in comparison to the more symmetrically distributed NZSEI-06 scores. The symmetric distribution of NZSEI-06 was by design, in that the square root of the original scores was taken in an attempt to produce a distribution that was centred and symmetric. The left skew of NZSEI-96 scores was acknowledged and the reasons were discussed in terms of outlier occupations, but no attempt was made to make this distribution less skewed (see Davis et al, 2003).
4.2 Comparison between NZSEI-06 and AUSEI06 The AUSEI06 scale was constructed using very similar methodology and exactly the same occupational classification (ANZSCO) as NZSEI-06 (McMillan et al, 2009). Thus a direct comparison of the scores assigned by NZSEI-06 and AUSEI06 for the same occupations could be undertaken. This is shown in figure 7. Note that because the range of scale scores differs for the two scales (NZSEI-06 ranges from 10–90 while AUSEI06
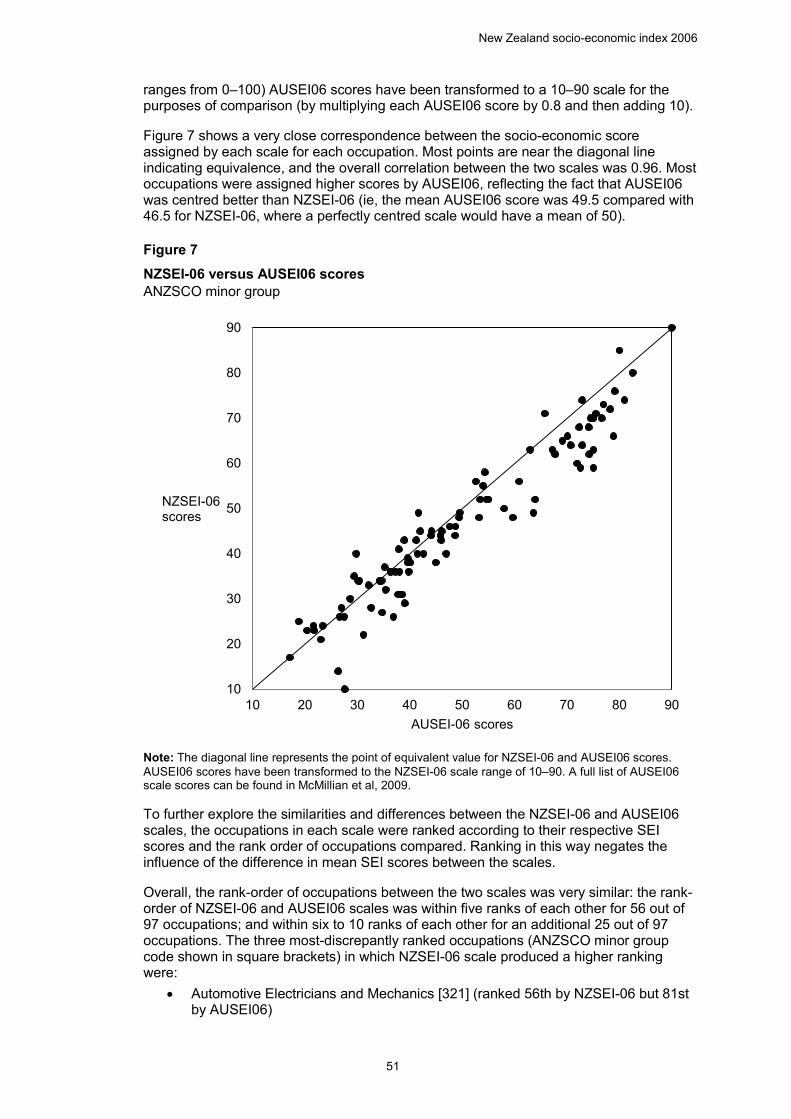
New Zealand socio-economic index 2006
51
ranges from 0–100) AUSEI06 scores have been transformed to a 10–90 scale for the purposes of comparison (by multiplying each AUSEI06 score by 0.8 and then adding 10).
Figure 7 shows a very close correspondence between the socio-economic score assigned by each scale for each occupation. Most points are near the diagonal line indicating equivalence, and the overall correlation between the two scales was 0.96. Most occupations were assigned higher scores by AUSEI06, reflecting the fact that AUSEI06 was centred better than NZSEI-06 (ie, the mean AUSEI06 score was 49.5 compared with 46.5 for NZSEI-06, where a perfectly centred scale would have a mean of 50).
Figure 7 NZSEI-06 versus AUSEI06 scores ANZSCO minor group 7 NZSEI-06 versus AUSEI06 scores, ANZSCO minor group
Note: The diagonal line represents the point of equivalent value for NZSEI-06 and AUSEI06 scores. AUSEI06 scores have been transformed to the NZSEI-06 scale range of 10–90. A full list of AUSEI06 scale scores can be found in McMillian et al, 2009.
To further explore the similarities and differences between the NZSEI-06 and AUSEI06 scales, the occupations in each scale were ranked according to their respective SEI scores and the rank order of occupations compared. Ranking in this way negates the influence of the difference in mean SEI scores between the scales.
Overall, the rank-order of occupations between the two scales was very similar: the rank-order of NZSEI-06 and AUSEI06 scales was within five ranks of each other for 56 out of 97 occupations; and within six to 10 ranks of each other for an additional 25 out of 97 occupations. The three most-discrepantly ranked occupations (ANZSCO minor group code shown in square brackets) in which NZSEI-06 scale produced a higher ranking were:
• Automotive Electricians and Mechanics [321] (ranked 56th by NZSEI-06 but 81st by AUSEI06)
10
20
30
40
50
60
70
80
90
10 20 30 40 50 60 70 80 90
NZSEI-06scores
AUSEI-06 scores
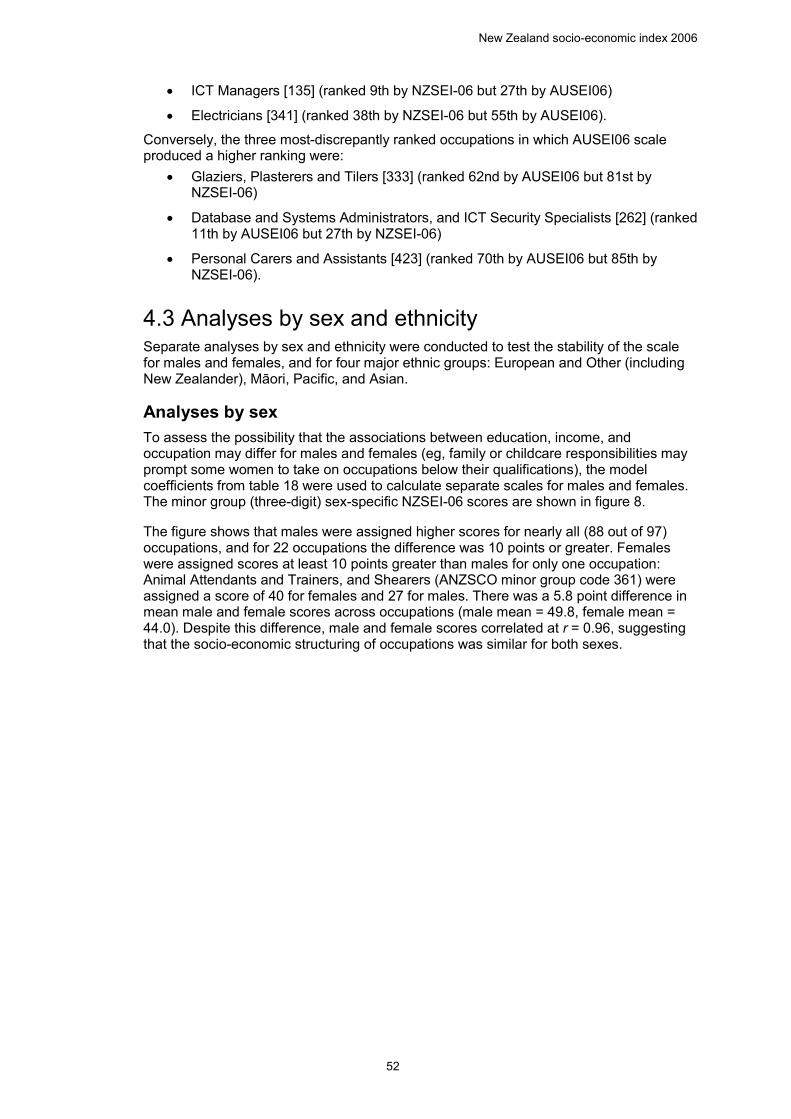
New Zealand socio-economic index 2006
52
• ICT Managers [135] (ranked 9th by NZSEI-06 but 27th by AUSEI06)
• Electricians [341] (ranked 38th by NZSEI-06 but 55th by AUSEI06).
Conversely, the three most-discrepantly ranked occupations in which AUSEI06 scale produced a higher ranking were:
• Glaziers, Plasterers and Tilers [333] (ranked 62nd by AUSEI06 but 81st by NZSEI-06)
• Database and Systems Administrators, and ICT Security Specialists [262] (ranked 11th by AUSEI06 but 27th by NZSEI-06)
• Personal Carers and Assistants [423] (ranked 70th by AUSEI06 but 85th by NZSEI-06).
4.3 Analyses by sex and ethnicity Separate analyses by sex and ethnicity were conducted to test the stability of the scale for males and females, and for four major ethnic groups: European and Other (including New Zealander), Māori, Pacific, and Asian.
Analyses by sex To assess the possibility that the associations between education, income, and occupation may differ for males and females (eg, family or childcare responsibilities may prompt some women to take on occupations below their qualifications), the model coefficients from table 18 were used to calculate separate scales for males and females. The minor group (three-digit) sex-specific NZSEI-06 scores are shown in figure 8.
The figure shows that males were assigned higher scores for nearly all (88 out of 97) occupations, and for 22 occupations the difference was 10 points or greater. Females were assigned scores at least 10 points greater than males for only one occupation: Animal Attendants and Trainers, and Shearers (ANZSCO minor group code 361) were assigned a score of 40 for females and 27 for males. There was a 5.8 point difference in mean male and female scores across occupations (male mean = 49.8, female mean = 44.0). Despite this difference, male and female scores correlated at r = 0.96, suggesting that the socio-economic structuring of occupations was similar for both sexes.
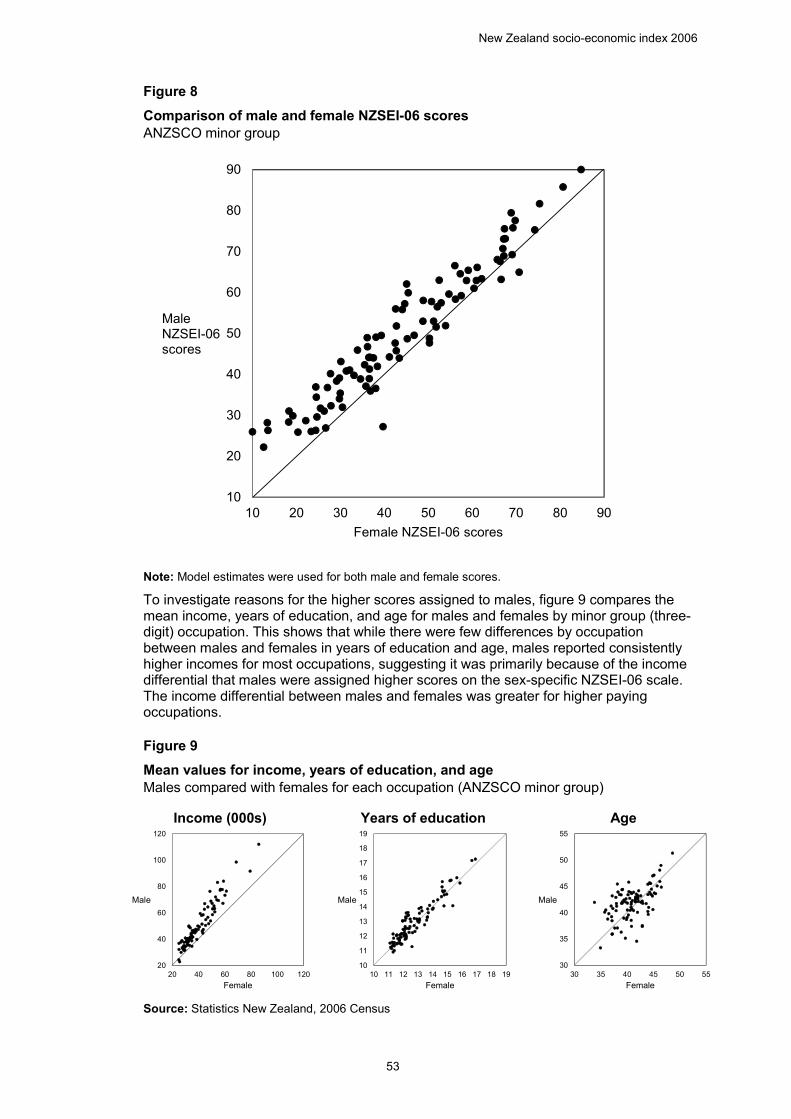
New Zealand socio-economic index 2006
53
Figure 8
Comparison of male and female NZSEI-06 scores
ANZSCO minor group 8 Comparison of male and female NZSEI-06 scores, ANZSO minor group
Note: Model estimates were used for both male and female scores.
To investigate reasons for the higher scores assigned to males, figure 9 compares the mean income, years of education, and age for males and females by minor group (three-digit) occupation. This shows that while there were few differences by occupation between males and females in years of education and age, males reported consistently higher incomes for most occupations, suggesting it was primarily because of the income differential that males were assigned higher scores on the sex-specific NZSEI-06 scale. The income differential between males and females was greater for higher paying occupations.
Figure 9
Mean values for income, years of education, and age
Males compared with females for each occupation (ANZSCO minor group) 9 Mean values for income, years of education, and age, males compared with females for each occupation (ANZSCO minor group)
Income (000s) Years of education Age
Source: Statistics New Zealand, 2006 Census
10
20
30
40
50
60
70
80
90
10 20 30 40 50 60 70 80 90
Male NZSEI-06 scores
Female NZSEI-06 scores
20
40
60
80
100
120
20 40 60 80 100 120
Male
Female
10
11
12
13
14
15
16
17
18
19
10 11 12 13 14 15 16 17 18 19
Male
Female
30
35
40
45
50
55
30 35 40 45 50 55
Male
Female
New Zealand socio-economic index 2006
54
As the validation sections to follow (sections 4.4 and 4.5) will use the six socio-economic groups described in table 19, the absolute and percentage differences between males and females in education and income by socio-economic group is shown in table 20. The average income was substantially greater for males (compared with females) for all socio-economic groups. This difference was larger – both in absolute and percentage terms – for higher socio-economic groups. For example, while the income difference between male and females was $8,600 (31 percent) for workers in SES group 6, it was $23,600 (45 percent) for workers in SES group 1. There were very few differences in the average education levels between males and females across socio-economic groups.
Table 20 Differences in mean income and education Males compared with females 20 Differences in mean income and education, males compared with females
SES Group
Mean income ($)
Difference in income between
sexes (M-F) Mean education
(years)
Difference in education
between sexes (M-F)
Males Females Percent (M-F)/F
$ (M-F) Males Females Percent
(M-F)/F Years (M-F)
1 75,800 52,200 45 23,600 15.8 15.2 4 0.6 2 67,100 50,600 33 16,500 14.1 14.3 -1 -0.2 3 58,600 43,900 33 14,700 12.8 12.8 0 0 4 42,600 35,000 22 7,600 12.1 12.1 0 0 5 35,400 28,200 26 7,200 11.6 11.8 -2 -0.2 6 36,700 28,100 31 8,600 11.2 11.2 0 0
Analyses by ethnicity In order to determine the applicability of NZSEI-06 to different ethnic groups in New Zealand, the model coefficients from table 18 were used to calculate separate scales for each of the four major ethnic groups: European and Other (including New Zealander), Māori, Pacific, and Asian. Figure 10 shows ethnic-specific NZSEI-06 scores for each ethnic group by minor group (three-digit) occupation (shown as a series of two-way cross-tabulations).
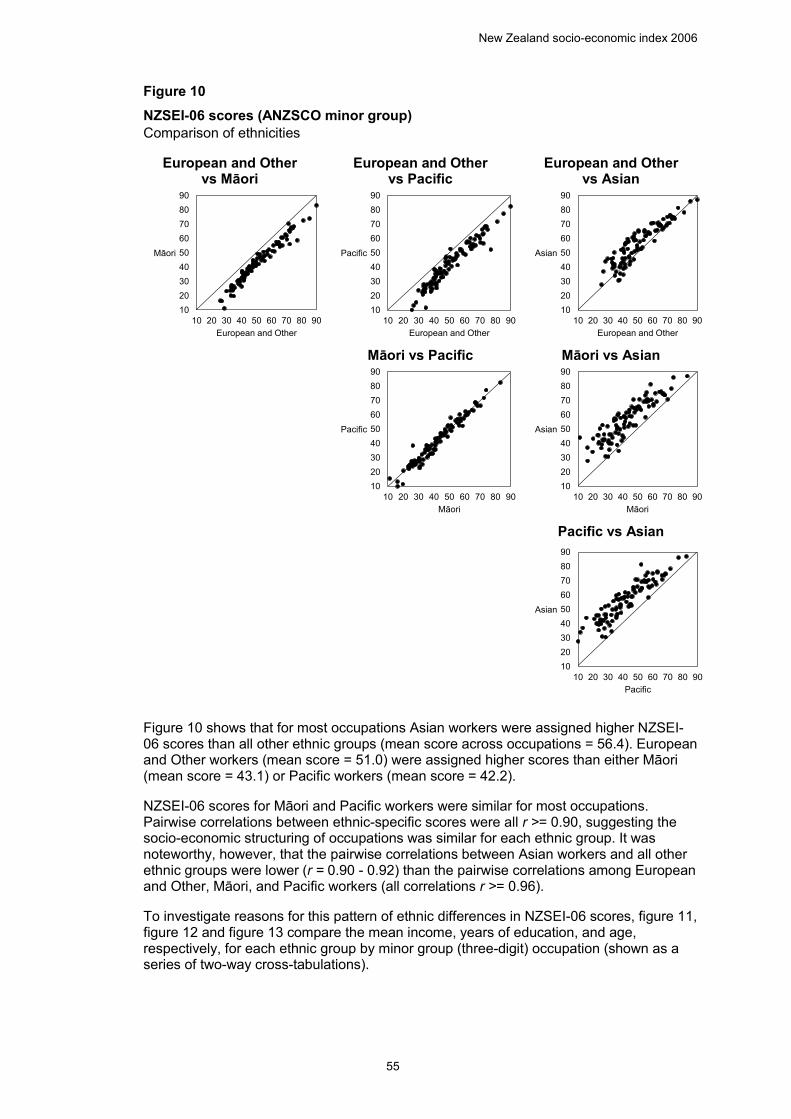
New Zealand socio-economic index 2006
55
Figure 10 NZSEI-06 scores (ANZSCO minor group) Comparison of ethnicities 10 NZSEI-06 scores (ANZSCO minor group), comparison of ethnicities
European and Other vs Māori
European and Other vs Pacific
European and Other vs Asian
Māori vs Pacific Māori vs Asian
Pacific vs Asian
Figure 10 shows that for most occupations Asian workers were assigned higher NZSEI-06 scores than all other ethnic groups (mean score across occupations = 56.4). European and Other workers (mean score = 51.0) were assigned higher scores than either Māori (mean score = 43.1) or Pacific workers (mean score = 42.2).
NZSEI-06 scores for Māori and Pacific workers were similar for most occupations. Pairwise correlations between ethnic-specific scores were all r >= 0.90, suggesting the socio-economic structuring of occupations was similar for each ethnic group. It was noteworthy, however, that the pairwise correlations between Asian workers and all other ethnic groups were lower (r = 0.90 - 0.92) than the pairwise correlations among European and Other, Māori, and Pacific workers (all correlations r >= 0.96).
To investigate reasons for this pattern of ethnic differences in NZSEI-06 scores, figure 11, figure 12 and figure 13 compare the mean income, years of education, and age, respectively, for each ethnic group by minor group (three-digit) occupation (shown as a series of two-way cross-tabulations).
102030405060708090
10 20 30 40 50 60 70 80 90
Māori
European and Other
102030405060708090
10 20 30 40 50 60 70 80 90
Pacific
European and Other
102030405060708090
10 20 30 40 50 60 70 80 90
Asian
European and Other
102030405060708090
10 20 30 40 50 60 70 80 90
Pacific
Māori
102030405060708090
10 20 30 40 50 60 70 80 90
Asian
Māori
102030405060708090
10 20 30 40 50 60 70 80 90
Asian
Pacific
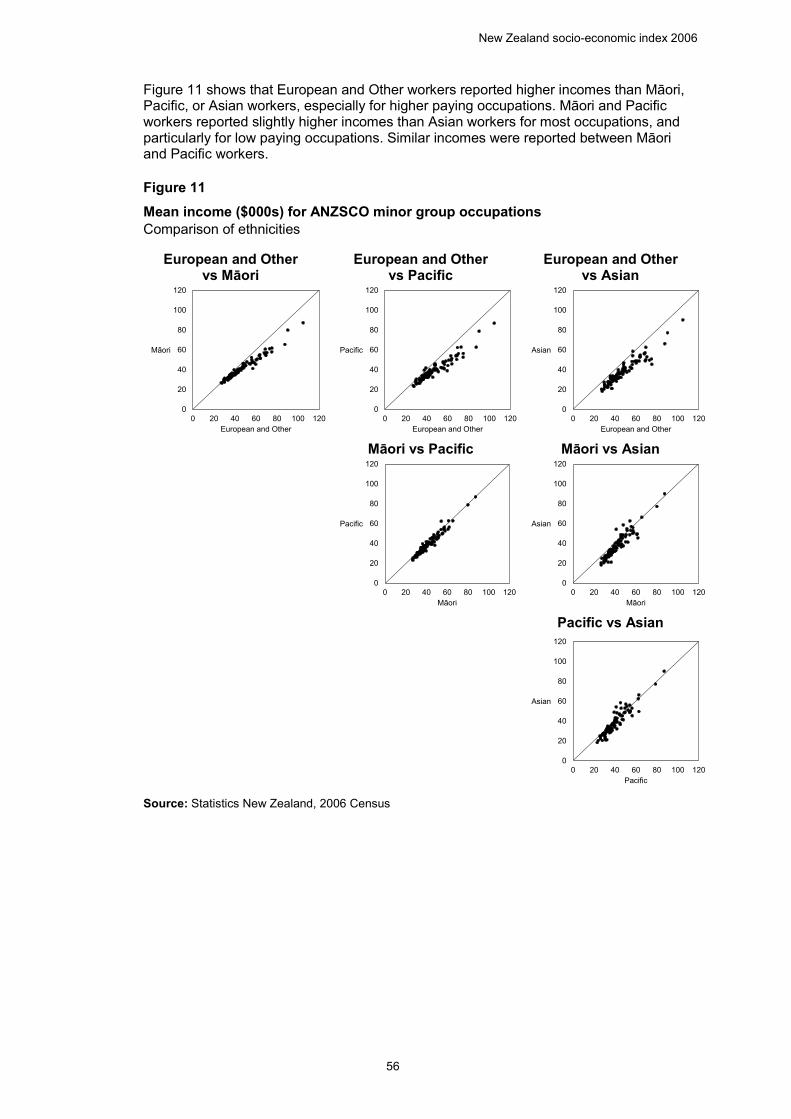
New Zealand socio-economic index 2006
56
Figure 11 shows that European and Other workers reported higher incomes than Māori, Pacific, or Asian workers, especially for higher paying occupations. Māori and Pacific workers reported slightly higher incomes than Asian workers for most occupations, and particularly for low paying occupations. Similar incomes were reported between Māori and Pacific workers.
Figure 11 Mean income ($000s) for ANZSCO minor group occupations Comparison of ethnicities 11 Mean income ($000s) for ANZSCO minor group occupations, comparison of ethnicities
European and Other vs Māori
European and Other vs Pacific
European and Other vs Asian
Māori vs Pacific Māori vs Asian
Pacific vs Asian
Source: Statistics New Zealand, 2006 Census
0
20
40
60
80
100
120
0 20 40 60 80 100 120
Māori
European and Other
0
20
40
60
80
100
120
0 20 40 60 80 100 120
Pacific
European and Other
0
20
40
60
80
100
120
0 20 40 60 80 100 120
Asian
European and Other
0
20
40
60
80
100
120
0 20 40 60 80 100 120
Pacific
Māori
0
20
40
60
80
100
120
0 20 40 60 80 100 120
Asian
Māori
0
20
40
60
80
100
120
0 20 40 60 80 100 120
Asian
Pacific
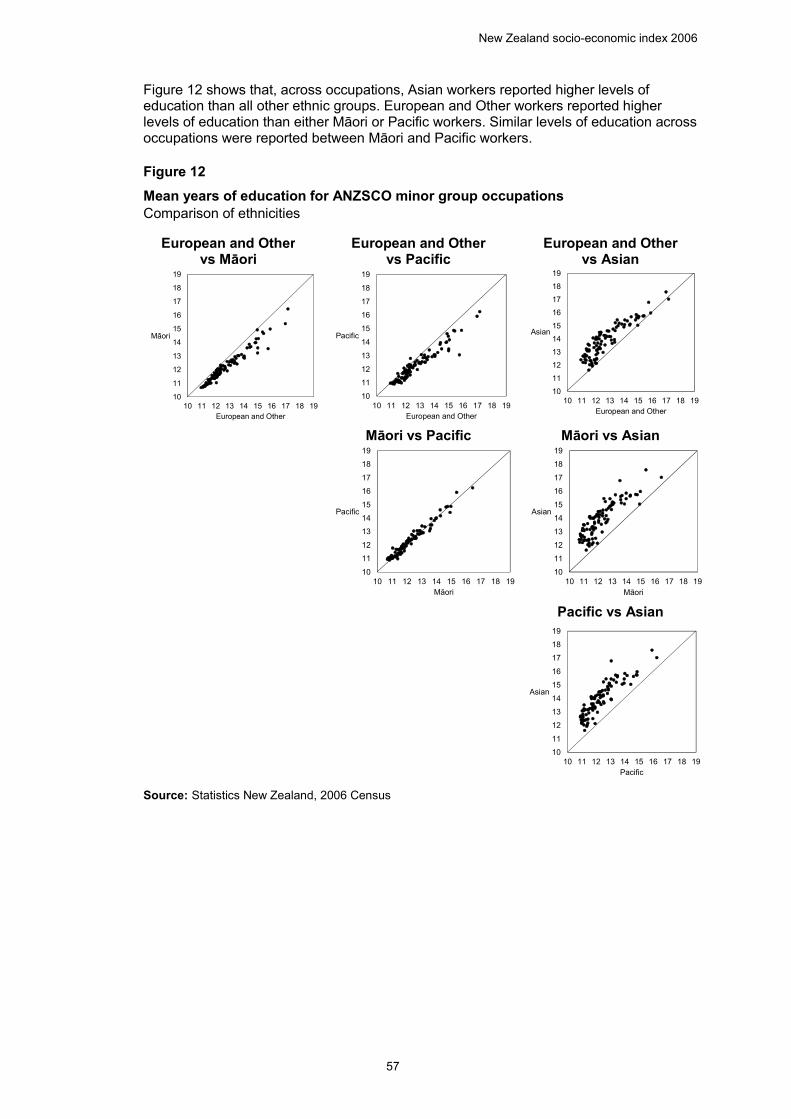
New Zealand socio-economic index 2006
57
Figure 12 shows that, across occupations, Asian workers reported higher levels of education than all other ethnic groups. European and Other workers reported higher levels of education than either Māori or Pacific workers. Similar levels of education across occupations were reported between Māori and Pacific workers.
Figure 12
Mean years of education for ANZSCO minor group occupations
Comparison of ethnicities 12 Mean years of education for ANZSCO minor group occupations, comparison of ethnicities
European and Other vs Māori
European and Other vs Pacific
European and Other vs Asian
Māori vs Pacific Māori vs Asian
Pacific vs Asian
Source: Statistics New Zealand, 2006 Census
10
11
12
13
14
15
16
17
18
19
10 11 12 13 14 15 16 17 18 19
Māori
European and Other
10
11
12
13
14
15
16
17
18
19
10 11 12 13 14 15 16 17 18 19
Pacific
European and Other
10
11
12
13
14
15
16
17
18
19
10 11 12 13 14 15 16 17 18 19
Asian
European and Other
10
11
12
13
14
15
16
17
18
19
10 11 12 13 14 15 16 17 18 19
Pacific
Māori
10
11
12
13
14
15
16
17
18
19
10 11 12 13 14 15 16 17 18 19
Asian
Māori
10
11
12
13
14
15
16
17
18
19
10 11 12 13 14 15 16 17 18 19
Asian
Pacific
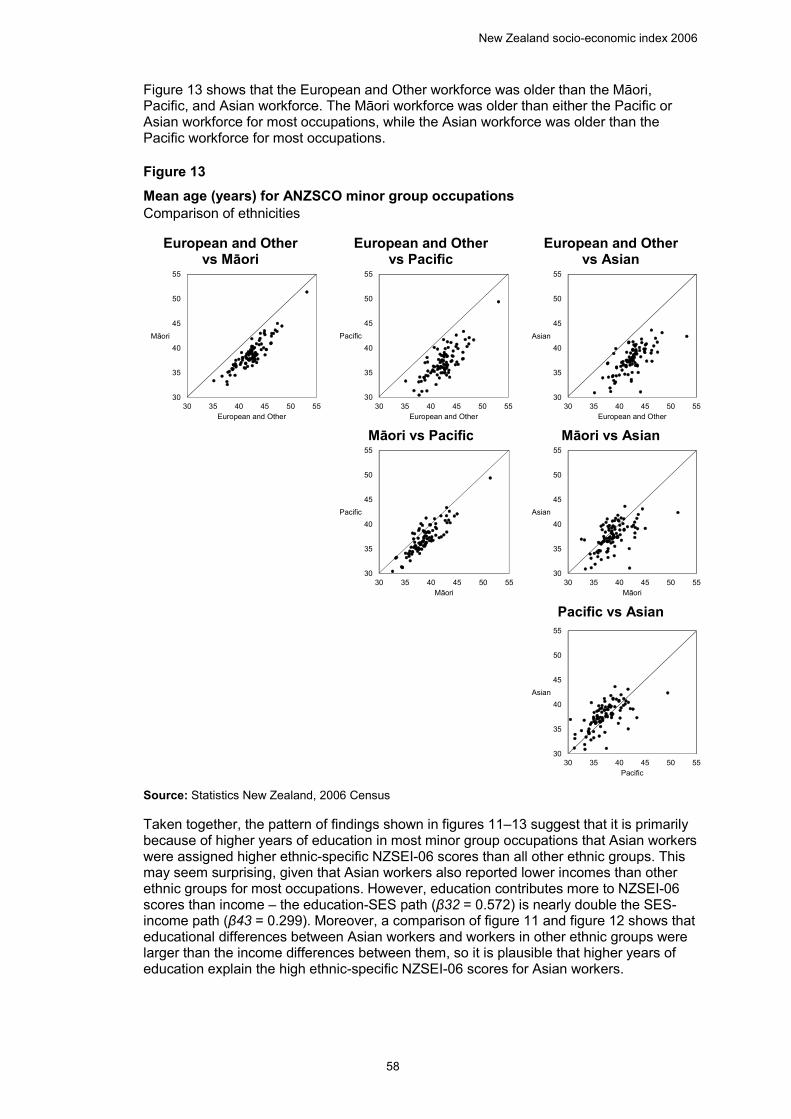
New Zealand socio-economic index 2006
58
Figure 13 shows that the European and Other workforce was older than the Māori, Pacific, and Asian workforce. The Māori workforce was older than either the Pacific or Asian workforce for most occupations, while the Asian workforce was older than the Pacific workforce for most occupations.
Figure 13
Mean age (years) for ANZSCO minor group occupations
Comparison of ethnicities 13 Mean age (years) for ANZSCO minor group occupations, comparison of ethnicities
European and Other vs Māori
European and Other vs Pacific
European and Other vs Asian
Māori vs Pacific Māori vs Asian
Pacific vs Asian
Source: Statistics New Zealand, 2006 Census
Taken together, the pattern of findings shown in figures 11–13 suggest that it is primarily because of higher years of education in most minor group occupations that Asian workers were assigned higher ethnic-specific NZSEI-06 scores than all other ethnic groups. This may seem surprising, given that Asian workers also reported lower incomes than other ethnic groups for most occupations. However, education contributes more to NZSEI-06 scores than income – the education-SES path (β32 = 0.572) is nearly double the SES-income path (β43 = 0.299). Moreover, a comparison of figure 11 and figure 12 shows that educational differences between Asian workers and workers in other ethnic groups were larger than the income differences between them, so it is plausible that higher years of education explain the high ethnic-specific NZSEI-06 scores for Asian workers.
30
35
40
45
50
55
30 35 40 45 50 55
Māori
European and Other
30
35
40
45
50
55
30 35 40 45 50 55
Pacific
European and Other
30
35
40
45
50
55
30 35 40 45 50 55
Asian
European and Other
30
35
40
45
50
55
30 35 40 45 50 55
Pacific
Māori
30
35
40
45
50
55
30 35 40 45 50 55
Asian
Māori
30
35
40
45
50
55
30 35 40 45 50 55
Asian
Pacific
New Zealand socio-economic index 2006
59
Lower years of education for most occupations and lower incomes for most occupations were the likely reason for the low ethnic-specific NZSEI-06 scores assigned to Māori and Pacific workers.
To aid interpretation of the validation sections to follow (sections 4.4 and 4.5), which use the six socio-economic groups, table 21 shows the absolute and percentage differences in income by sex, ethnicity, and socio-economic group, for full- and part-time workers aged 21–69 years from the 2006 Census.
Within each socio-economic group, European and Other (including New Zealander) workers reported higher incomes on average than every other ethnic group, mirroring the pattern shown in figure 11. Differences between European and Other workers and Māori, Pacific, and Asian workers tended to be larger for males (median difference = 22 percent, range = 9–31 percent) than females (median = 12 percent, range = 2–26 percent).
Differences between European and Other workers and Māori workers were larger for higher socio-economic groups. For example, the difference between European and Other and Māori males was 23 percent for SES group 1 but only 9 percent for SES group 6; the equivalent differences for females were 12 percent and 2 percent, respectively.
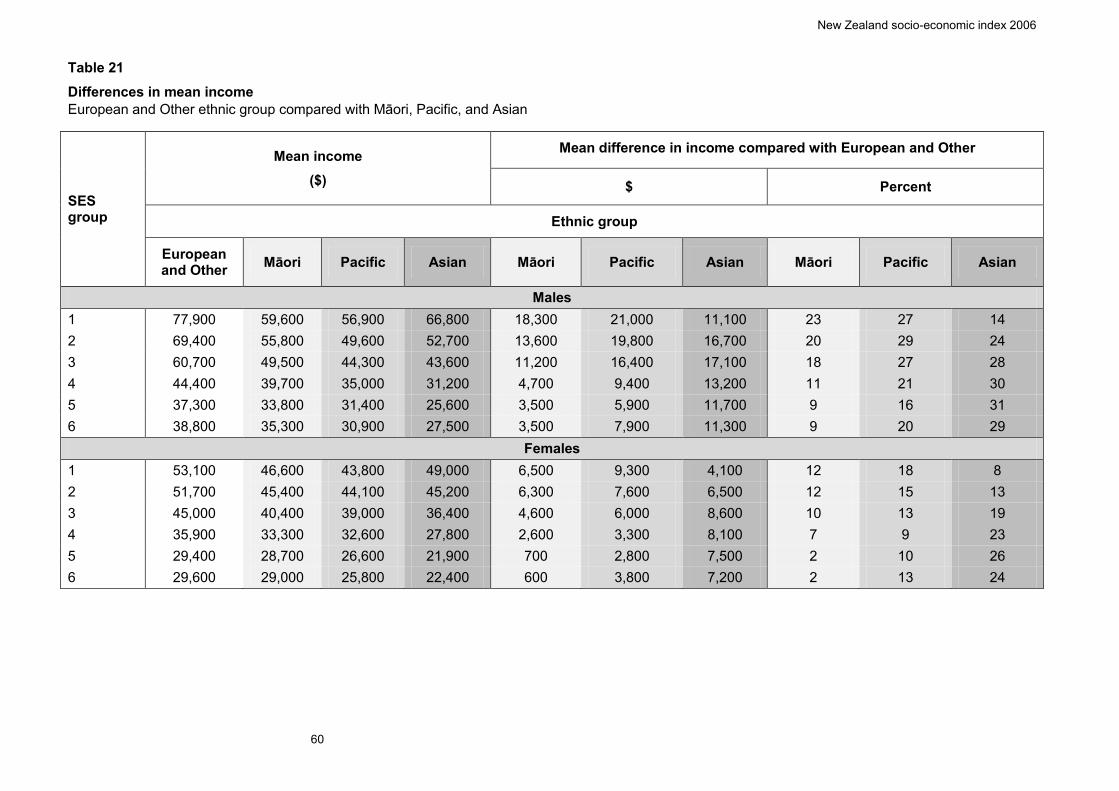
New Zealand socio-economic index 2006
60
Table 21 Differences in mean income European and Other ethnic group compared with Māori, Pacific, and Asian 21 Differences in mean income, European and Other ethnic group compared with Māori, Pacific, and Asian
SES group
Mean income ($)
Mean difference in income compared with European and Other
$ Percent
Ethnic group
European and Other Māori Pacific Asian Māori Pacific Asian Māori Pacific Asian
Males 1 77,900 59,600 56,900 66,800 18,300 21,000 11,100 23 27 14 2 69,400 55,800 49,600 52,700 13,600 19,800 16,700 20 29 24 3 60,700 49,500 44,300 43,600 11,200 16,400 17,100 18 27 28 4 44,400 39,700 35,000 31,200 4,700 9,400 13,200 11 21 30 5 37,300 33,800 31,400 25,600 3,500 5,900 11,700 9 16 31 6 38,800 35,300 30,900 27,500 3,500 7,900 11,300 9 20 29
Females 1 53,100 46,600 43,800 49,000 6,500 9,300 4,100 12 18 8 2 51,700 45,400 44,100 45,200 6,300 7,600 6,500 12 15 13 3 45,000 40,400 39,000 36,400 4,600 6,000 8,600 10 13 19 4 35,900 33,300 32,600 27,800 2,600 3,300 8,100 7 9 23 5 29,400 28,700 26,600 21,900 700 2,800 7,500 2 10 26 6 29,600 29,000 25,800 22,400 600 3,800 7,200 2 13 24
New Zealand socio-economic index 2006
61
Differences between European and Other workers and Pacific workers were also slightly larger for higher socio-economic groups, but in general large across all socio-economic groups. For males, the difference was 27–29 percent for SES groups 1–3 compared with 16–21 percent for SES groups 4–6. For females, the difference was 18 percent for SES group 1 compared with 9–13 percent for SES groups 4–6.
In contrast, differences between European and Other workers and Asian workers were larger for lower socio-economic groups. For males, the difference was 14 percent for SES group 1 compared with 29–31 percent for SES groups 4–6. For females the difference was 8 percent for SES group 1 compared with 23–26 percent for SES groups 4–6.
Table 22 shows the absolute and percentage differences in education (in years) by sex, ethnicity, and socio-economic group. Differences in education between ethnic groups were typically less marked than the differences in income shown in table 21. However, as with income, European and Other (including New Zealander) workers reported higher education than both Māori and Pacific workers for all socio-economic groups. These differences were similar for males and females, but typically larger for higher socio-economic groups (eg, 4–6 percent for SES groups 1–2, and 1–4 percent for SES groups 5–6).
In contrast, European and Other workers reported lower education than Asian workers for all socio-economic groups. These differences were similar for males and females, but typically larger for lower socio-economic groups (eg, 4–9 percent for SES groups 1–2, and 10–14 percent for SES group 6).
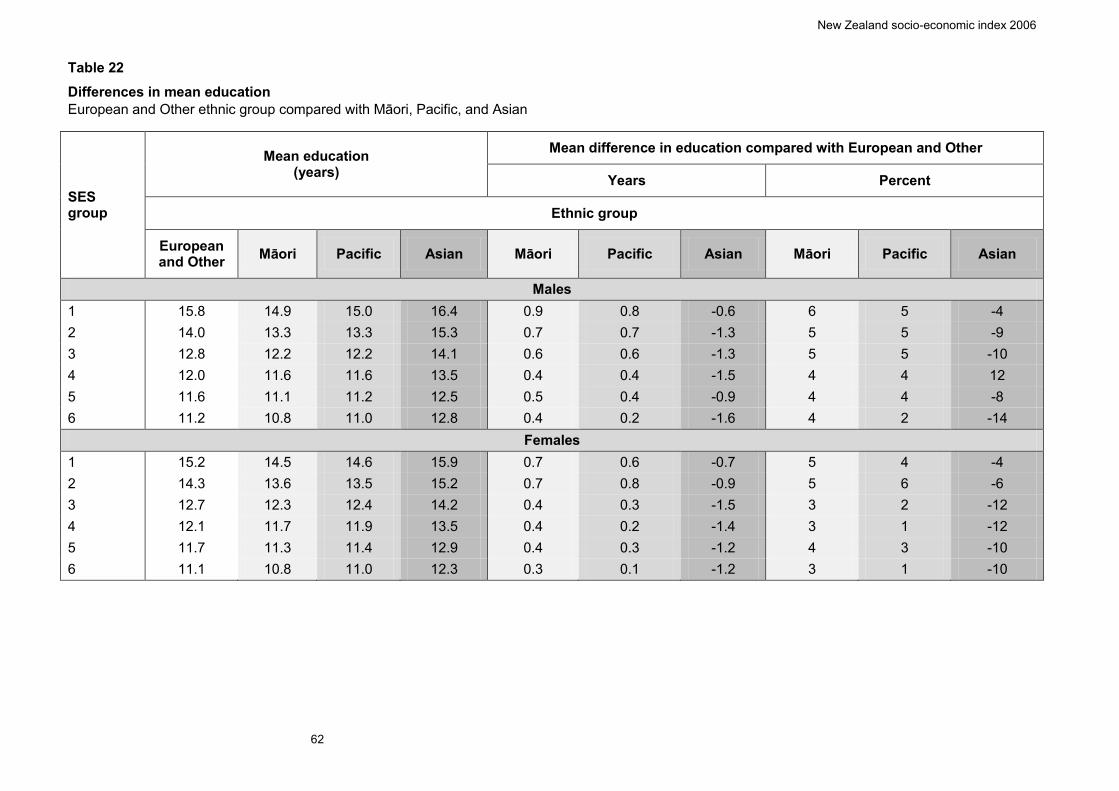
New Zealand socio-economic index 2006
62
Table 22 Differences in mean education European and Other ethnic group compared with Māori, Pacific, and Asian 22 Differences in mean education, European and Other ethnic group compared with Māori, Pacific, and Asian
SES group
Mean education (years)
Mean difference in education compared with European and Other
Years Percent
Ethnic group
European and Other Māori Pacific Asian Māori Pacific Asian Māori Pacific Asian
Males 1 15.8 14.9 15.0 16.4 0.9 0.8 -0.6 6 5 -4 2 14.0 13.3 13.3 15.3 0.7 0.7 -1.3 5 5 -9 3 12.8 12.2 12.2 14.1 0.6 0.6 -1.3 5 5 -10 4 12.0 11.6 11.6 13.5 0.4 0.4 -1.5 4 4 12 5 11.6 11.1 11.2 12.5 0.5 0.4 -0.9 4 4 -8 6 11.2 10.8 11.0 12.8 0.4 0.2 -1.6 4 2 -14
Females 1 15.2 14.5 14.6 15.9 0.7 0.6 -0.7 5 4 -4 2 14.3 13.6 13.5 15.2 0.7 0.8 -0.9 5 6 -6 3 12.7 12.3 12.4 14.2 0.4 0.3 -1.5 3 2 -12 4 12.1 11.7 11.9 13.5 0.4 0.2 -1.4 3 1 -12 5 11.7 11.3 11.4 12.9 0.4 0.3 -1.2 4 3 -10 6 11.1 10.8 11.0 12.3 0.3 0.1 -1.2 3 1 -10
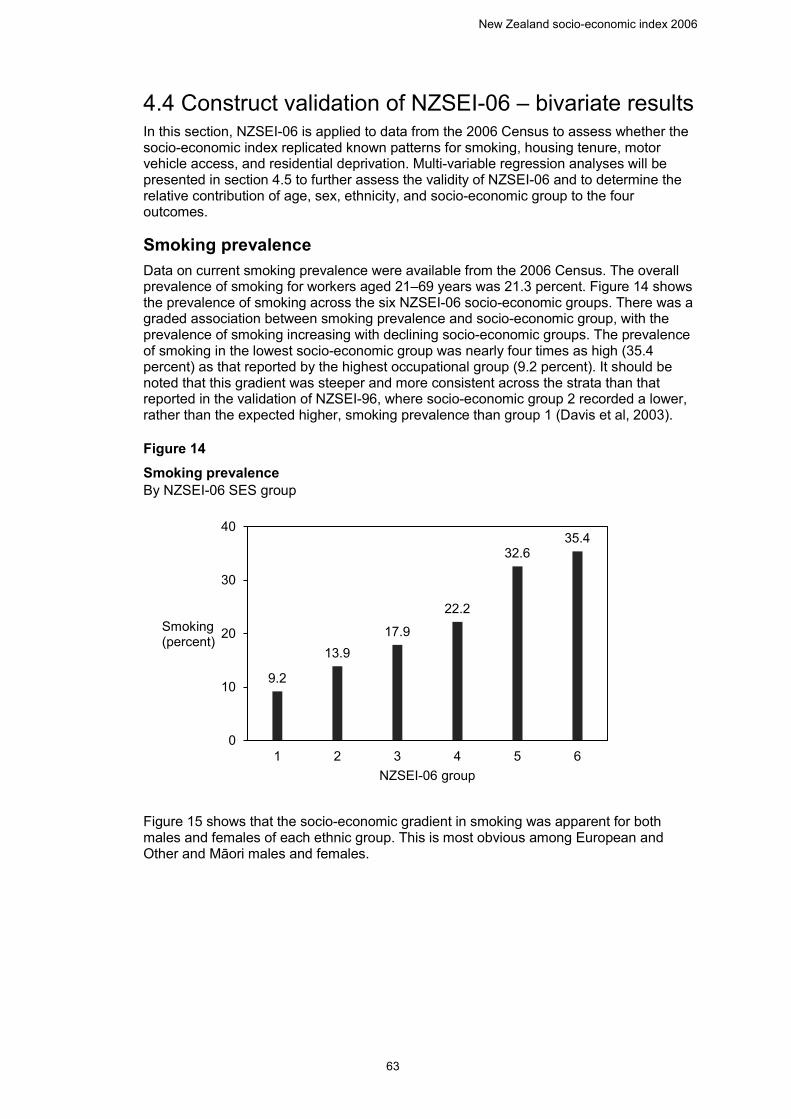
New Zealand socio-economic index 2006
63
4.4 Construct validation of NZSEI-06 – bivariate results In this section, NZSEI-06 is applied to data from the 2006 Census to assess whether the socio-economic index replicated known patterns for smoking, housing tenure, motor vehicle access, and residential deprivation. Multi-variable regression analyses will be presented in section 4.5 to further assess the validity of NZSEI-06 and to determine the relative contribution of age, sex, ethnicity, and socio-economic group to the four outcomes.
Smoking prevalence Data on current smoking prevalence were available from the 2006 Census. The overall prevalence of smoking for workers aged 21–69 years was 21.3 percent. Figure 14 shows the prevalence of smoking across the six NZSEI-06 socio-economic groups. There was a graded association between smoking prevalence and socio-economic group, with the prevalence of smoking increasing with declining socio-economic groups. The prevalence of smoking in the lowest socio-economic group was nearly four times as high (35.4 percent) as that reported by the highest occupational group (9.2 percent). It should be noted that this gradient was steeper and more consistent across the strata than that reported in the validation of NZSEI-96, where socio-economic group 2 recorded a lower, rather than the expected higher, smoking prevalence than group 1 (Davis et al, 2003).
Figure 14 Smoking prevalence By NZSEI-06 SES group 14 Smoking prevalence, by NZSEI-06 SES group
Figure 15 shows that the socio-economic gradient in smoking was apparent for both males and females of each ethnic group. This is most obvious among European and Other and Māori males and females.
9.2
13.917.9
22.2
32.635.4
0
10
20
30
40
1 2 3 4 5 6
Smoking (percent)
NZSEI-06 group
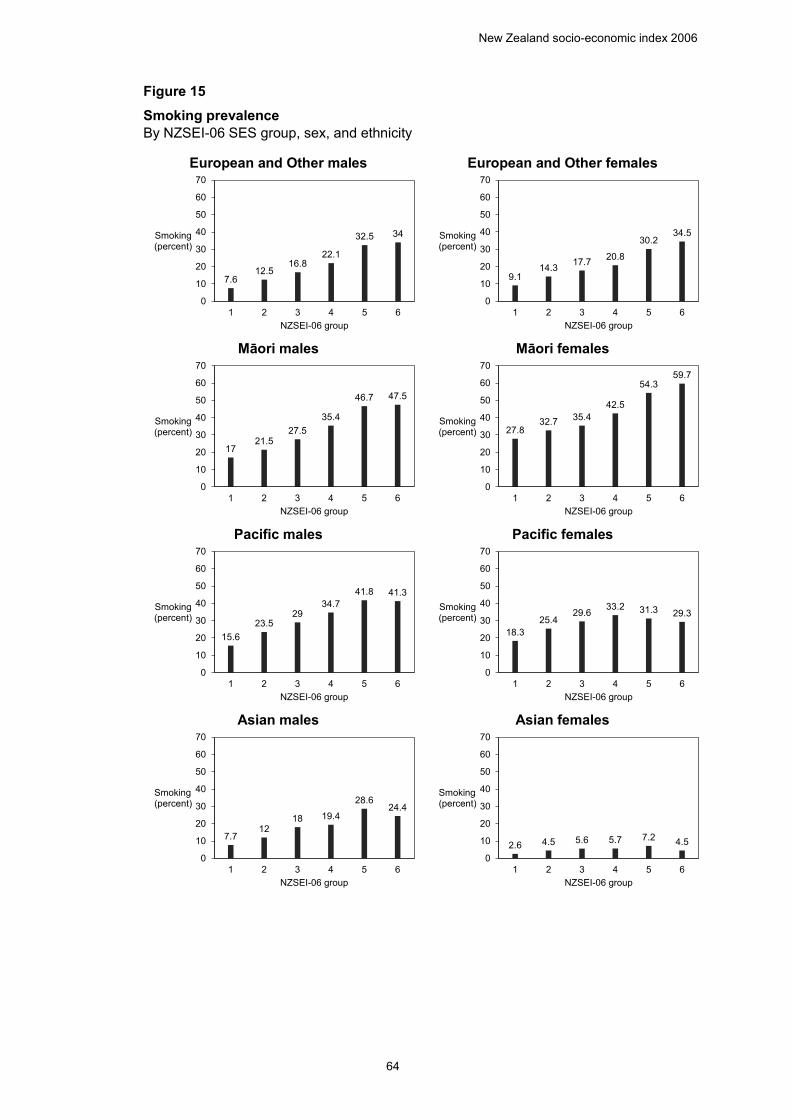
New Zealand socio-economic index 2006
64
Figure 15 Smoking prevalence By NZSEI-06 SES group, sex, and ethnicity 15 Smoking prevalence, by NZSEI-06 SES group, sex, and ethnicity
European and Other males European and Other females
Māori males Māori females
Pacific males Pacific females
Asian males Asian females
7.612.5
16.822.1
32.5 34
0
10
20
30
40
50
60
70
1 2 3 4 5 6
Smoking (percent)
NZSEI-06 group
9.114.3 17.7 20.8
30.234.5
0
10
20
30
40
50
60
70
1 2 3 4 5 6
Smoking (percent)
NZSEI-06 group
1721.5
27.535.4
46.7 47.5
0
10
20
30
40
50
60
70
1 2 3 4 5 6
Smoking (percent)
NZSEI-06 group
27.832.7 35.4
42.5
54.359.7
0
10
20
30
40
50
60
70
1 2 3 4 5 6
Smoking (percent)
NZSEI-06 group
15.623.5
2934.7
41.8 41.3
0
10
20
30
40
50
60
70
1 2 3 4 5 6
Smoking (percent)
NZSEI-06 group
18.325.4
29.6 33.2 31.3 29.3
0
10
20
30
40
50
60
70
1 2 3 4 5 6
Smoking (percent)
NZSEI-06 group
7.712
18 19.4
28.624.4
0
10
20
30
40
50
60
70
1 2 3 4 5 6
Smoking (percent)
NZSEI-06 group
2.6 4.5 5.6 5.7 7.2 4.5
0
10
20
30
40
50
60
70
1 2 3 4 5 6
Smoking (percent)
NZSEI-06 group
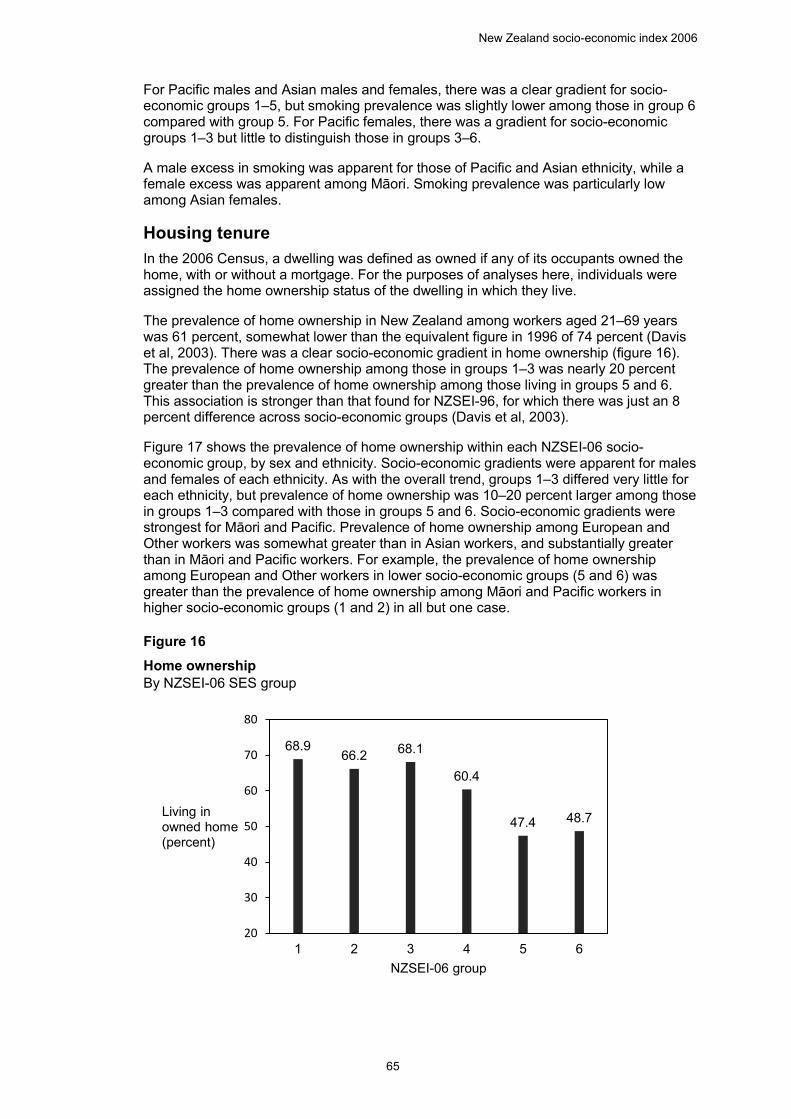
New Zealand socio-economic index 2006
65
For Pacific males and Asian males and females, there was a clear gradient for socio-economic groups 1–5, but smoking prevalence was slightly lower among those in group 6 compared with group 5. For Pacific females, there was a gradient for socio-economic groups 1–3 but little to distinguish those in groups 3–6.
A male excess in smoking was apparent for those of Pacific and Asian ethnicity, while a female excess was apparent among Māori. Smoking prevalence was particularly low among Asian females.
Housing tenure In the 2006 Census, a dwelling was defined as owned if any of its occupants owned the home, with or without a mortgage. For the purposes of analyses here, individuals were assigned the home ownership status of the dwelling in which they live.
The prevalence of home ownership in New Zealand among workers aged 21–69 years was 61 percent, somewhat lower than the equivalent figure in 1996 of 74 percent (Davis et al, 2003). There was a clear socio-economic gradient in home ownership (figure 16). The prevalence of home ownership among those in groups 1–3 was nearly 20 percent greater than the prevalence of home ownership among those living in groups 5 and 6. This association is stronger than that found for NZSEI-96, for which there was just an 8 percent difference across socio-economic groups (Davis et al, 2003).
Figure 17 shows the prevalence of home ownership within each NZSEI-06 socio-economic group, by sex and ethnicity. Socio-economic gradients were apparent for males and females of each ethnicity. As with the overall trend, groups 1–3 differed very little for each ethnicity, but prevalence of home ownership was 10–20 percent larger among those in groups 1–3 compared with those in groups 5 and 6. Socio-economic gradients were strongest for Māori and Pacific. Prevalence of home ownership among European and Other workers was somewhat greater than in Asian workers, and substantially greater than in Māori and Pacific workers. For example, the prevalence of home ownership among European and Other workers in lower socio-economic groups (5 and 6) was greater than the prevalence of home ownership among Māori and Pacific workers in higher socio-economic groups (1 and 2) in all but one case.
Figure 16 Home ownership By NZSEI-06 SES group 16 Home ownership, by NZSEI-06 SES group
68.966.2 68.1
60.4
47.4 48.7
20
30
40
50
60
70
80
1 2 3 4 5 6
Living in owned home (percent)
NZSEI-06 group
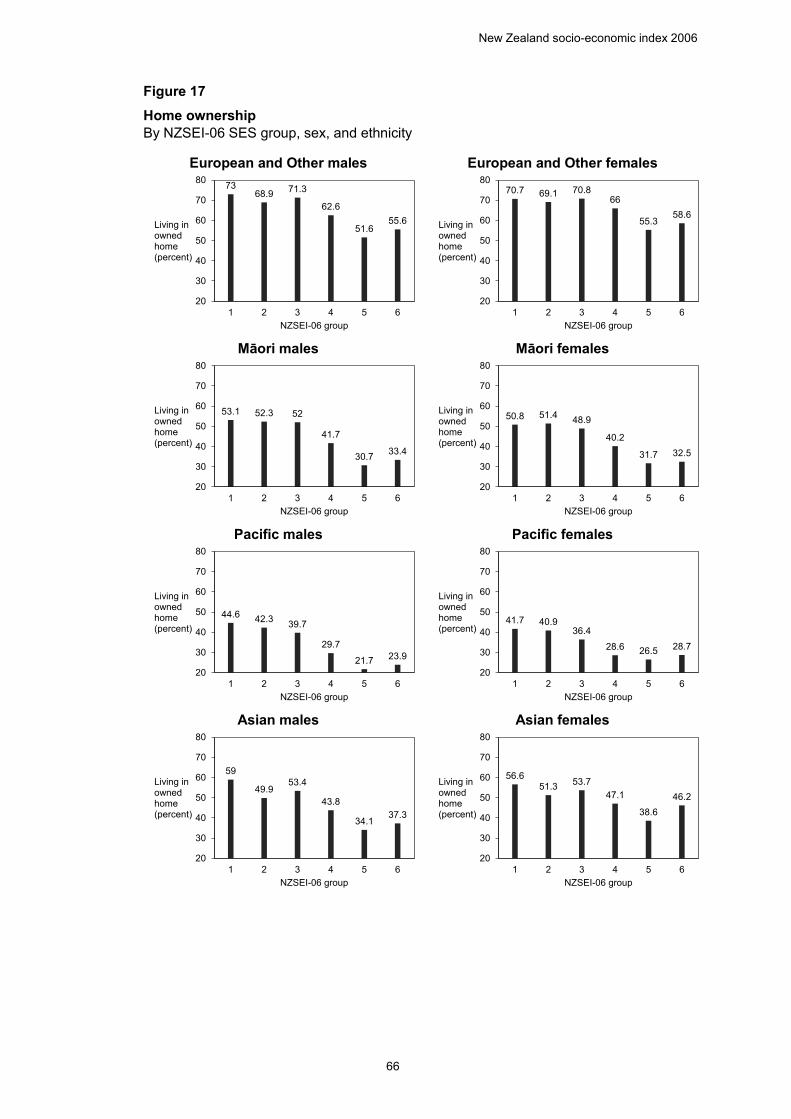
New Zealand socio-economic index 2006
66
Figure 17 Home ownership By NZSEI-06 SES group, sex, and ethnicity 17 Home ownership, by NZSEI-06 SES group, sex, and ethnicity
European and Other males European and Other females
Māori males Māori females
Pacific males Pacific females
Asian males Asian females
7368.9 71.3
62.6
51.655.6
20
30
40
50
60
70
80
1 2 3 4 5 6
Living in owned home (percent)
NZSEI-06 group
70.7 69.1 70.866
55.358.6
20
30
40
50
60
70
80
1 2 3 4 5 6
Living in owned home (percent)
NZSEI-06 group
53.1 52.3 52
41.7
30.7 33.4
20
30
40
50
60
70
80
1 2 3 4 5 6
Living in owned home (percent)
NZSEI-06 group
50.8 51.4 48.9
40.2
31.7 32.5
20
30
40
50
60
70
80
1 2 3 4 5 6
Living in owned home (percent)
NZSEI-06 group
44.6 42.3 39.7
29.7
21.7 23.9
20
30
40
50
60
70
80
1 2 3 4 5 6
Living in owned home (percent)
NZSEI-06 group
41.7 40.936.4
28.6 26.5 28.7
20
30
40
50
60
70
80
1 2 3 4 5 6
Living in owned home (percent)
NZSEI-06 group
59
49.953.4
43.8
34.137.3
20
30
40
50
60
70
80
1 2 3 4 5 6
Living in owned home (percent)
NZSEI-06 group
56.651.3 53.7
47.1
38.646.2
20
30
40
50
60
70
80
1 2 3 4 5 6
Living in owned home (percent)
NZSEI-06 group
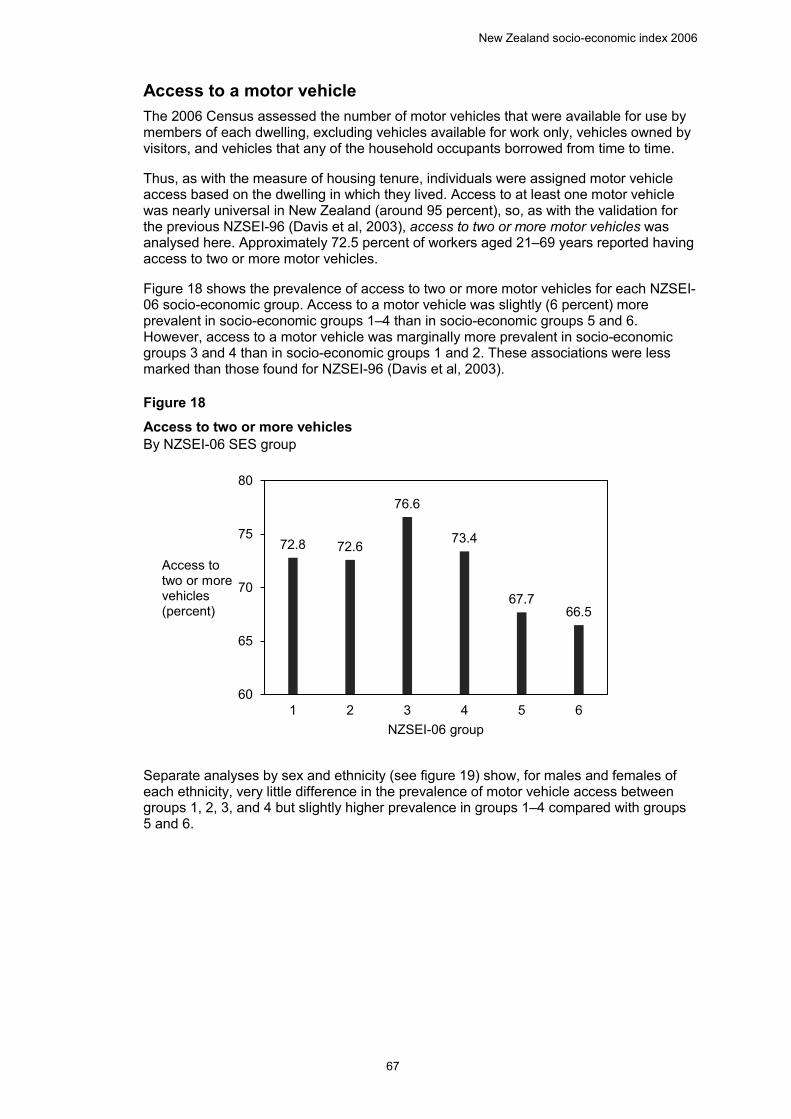
New Zealand socio-economic index 2006
67
Access to a motor vehicle The 2006 Census assessed the number of motor vehicles that were available for use by members of each dwelling, excluding vehicles available for work only, vehicles owned by visitors, and vehicles that any of the household occupants borrowed from time to time.
Thus, as with the measure of housing tenure, individuals were assigned motor vehicle access based on the dwelling in which they lived. Access to at least one motor vehicle was nearly universal in New Zealand (around 95 percent), so, as with the validation for the previous NZSEI-96 (Davis et al, 2003), access to two or more motor vehicles was analysed here. Approximately 72.5 percent of workers aged 21–69 years reported having access to two or more motor vehicles.
Figure 18 shows the prevalence of access to two or more motor vehicles for each NZSEI-06 socio-economic group. Access to a motor vehicle was slightly (6 percent) more prevalent in socio-economic groups 1–4 than in socio-economic groups 5 and 6. However, access to a motor vehicle was marginally more prevalent in socio-economic groups 3 and 4 than in socio-economic groups 1 and 2. These associations were less marked than those found for NZSEI-96 (Davis et al, 2003).
Figure 18 Access to two or more vehicles By NZSEI-06 SES group 18 Access to two or more vehicles, by NZSEI-06 SES group
Separate analyses by sex and ethnicity (see figure 19) show, for males and females of each ethnicity, very little difference in the prevalence of motor vehicle access between groups 1, 2, 3, and 4 but slightly higher prevalence in groups 1–4 compared with groups 5 and 6.
72.8 72.6
76.6
73.4
67.766.5
60
65
70
75
80
1 2 3 4 5 6
Access to two or more vehicles (percent)
NZSEI-06 group
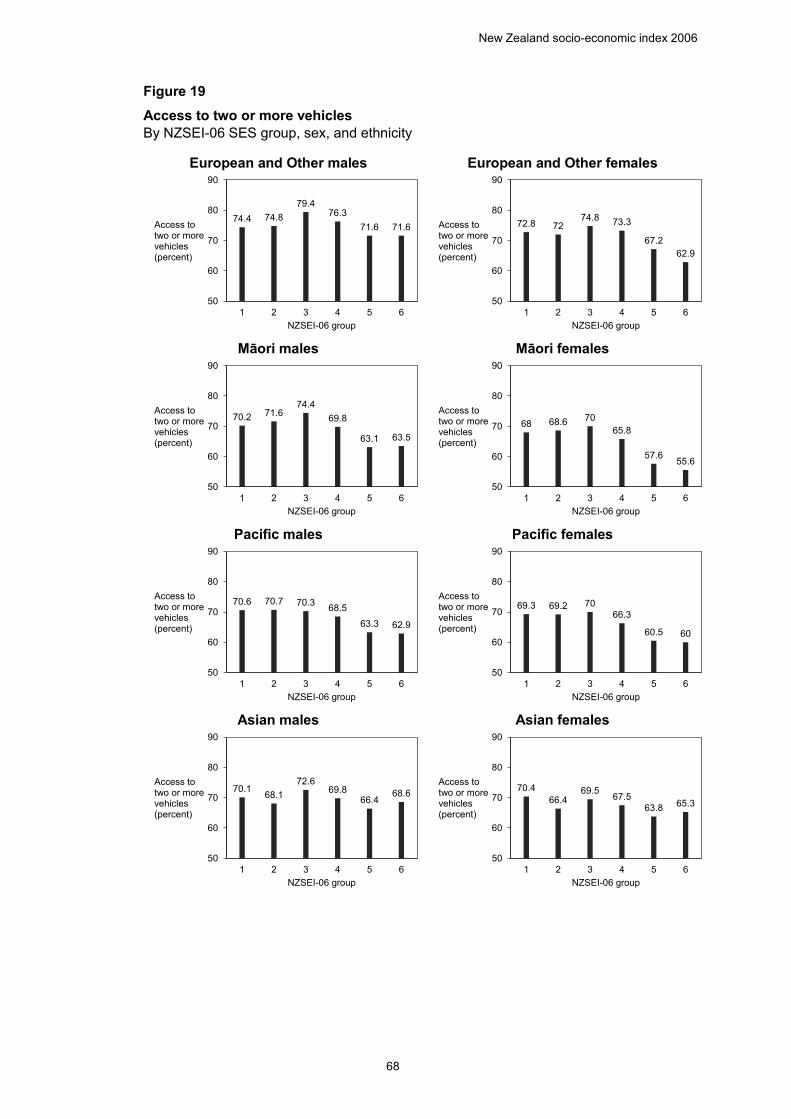
New Zealand socio-economic index 2006
68
Figure 19 Access to two or more vehicles By NZSEI-06 SES group, sex, and ethnicity 19 Access to two or more vehicles, by NZSEI-06 SES group, sex, and ethnicity
European and Other males European and Other females
Māori males Māori females
Pacific males Pacific females
Asian males Asian females
74.4 74.879.4
76.371.6 71.6
50
60
70
80
90
1 2 3 4 5 6
Access to two or more vehicles (percent)
NZSEI-06 group
72.8 7274.8 73.3
67.262.9
50
60
70
80
90
1 2 3 4 5 6
Access to two or more vehicles (percent)
NZSEI-06 group
70.2 71.674.4
69.8
63.1 63.5
50
60
70
80
90
1 2 3 4 5 6
Access to two or more vehicles (percent)
NZSEI-06 group
68 68.6 7065.8
57.6 55.6
50
60
70
80
90
1 2 3 4 5 6
Access to two or more vehicles (percent)
NZSEI-06 group
70.6 70.7 70.3 68.5
63.3 62.9
50
60
70
80
90
1 2 3 4 5 6
Access to two or more vehicles (percent)
NZSEI-06 group
69.3 69.2 7066.3
60.5 60
50
60
70
80
90
1 2 3 4 5 6
Access to two or more vehicles (percent)
NZSEI-06 group
70.1 68.172.6
69.866.4
68.6
50
60
70
80
90
1 2 3 4 5 6
Access to two or more vehicles (percent)
NZSEI-06 group
70.466.4
69.5 67.563.8 65.3
50
60
70
80
90
1 2 3 4 5 6
Access to two or more vehicles (percent)
NZSEI-06 group
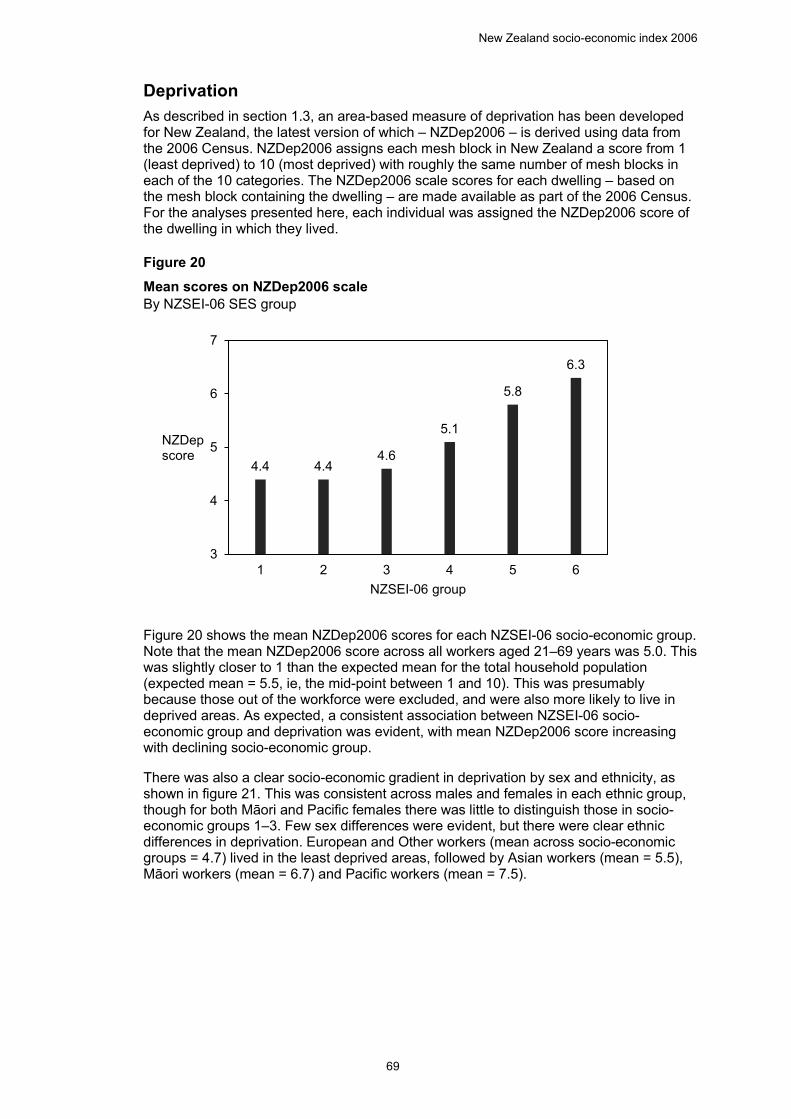
New Zealand socio-economic index 2006
69
Deprivation As described in section 1.3, an area-based measure of deprivation has been developed for New Zealand, the latest version of which – NZDep2006 – is derived using data from the 2006 Census. NZDep2006 assigns each mesh block in New Zealand a score from 1 (least deprived) to 10 (most deprived) with roughly the same number of mesh blocks in each of the 10 categories. The NZDep2006 scale scores for each dwelling – based on the mesh block containing the dwelling – are made available as part of the 2006 Census. For the analyses presented here, each individual was assigned the NZDep2006 score of the dwelling in which they lived.
Figure 20 Mean scores on NZDep2006 scale By NZSEI-06 SES group 20 Mean scores on NZDep2006 scale, by NZSEI-06 SES group
Figure 20 shows the mean NZDep2006 scores for each NZSEI-06 socio-economic group. Note that the mean NZDep2006 score across all workers aged 21–69 years was 5.0. This was slightly closer to 1 than the expected mean for the total household population (expected mean = 5.5, ie, the mid-point between 1 and 10). This was presumably because those out of the workforce were excluded, and were also more likely to live in deprived areas. As expected, a consistent association between NZSEI-06 socio-economic group and deprivation was evident, with mean NZDep2006 score increasing with declining socio-economic group.
There was also a clear socio-economic gradient in deprivation by sex and ethnicity, as shown in figure 21. This was consistent across males and females in each ethnic group, though for both Māori and Pacific females there was little to distinguish those in socio-economic groups 1–3. Few sex differences were evident, but there were clear ethnic differences in deprivation. European and Other workers (mean across socio-economic groups = 4.7) lived in the least deprived areas, followed by Asian workers (mean = 5.5), Māori workers (mean = 6.7) and Pacific workers (mean = 7.5).
4.4 4.44.6
5.1
5.8
6.3
3
4
5
6
7
1 2 3 4 5 6
NZDepscore
NZSEI-06 group
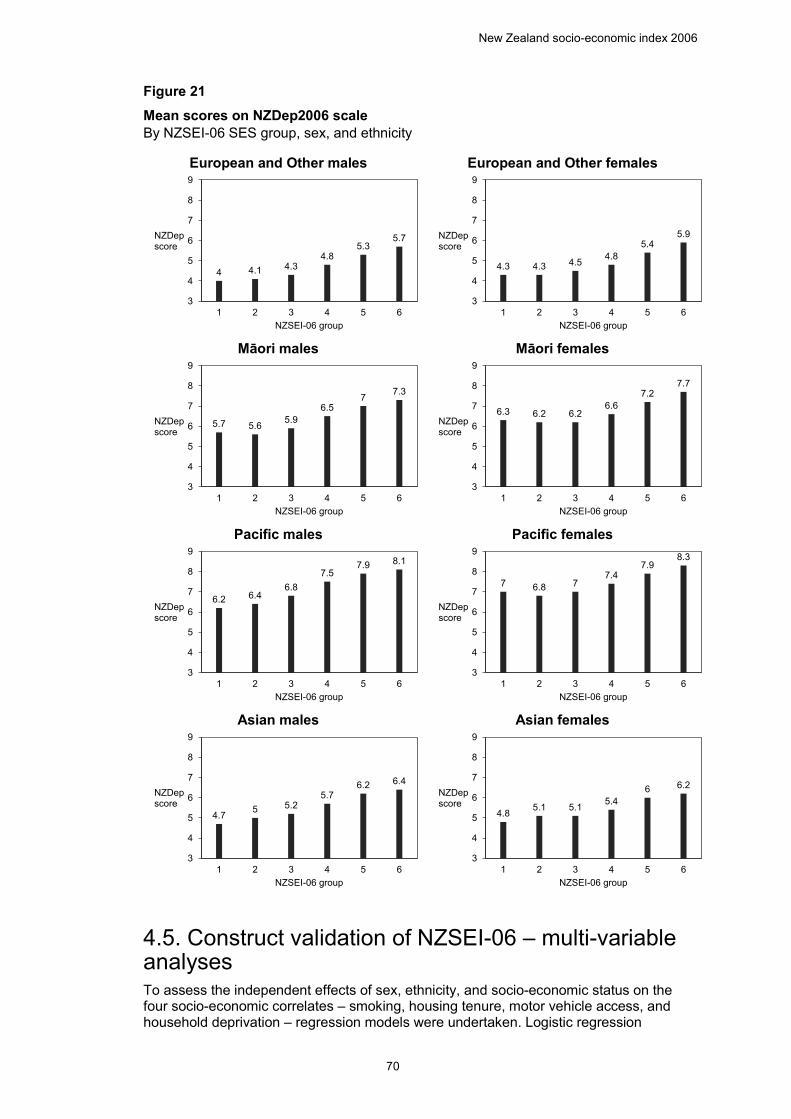
New Zealand socio-economic index 2006
70
Figure 21 Mean scores on NZDep2006 scale By NZSEI-06 SES group, sex, and ethnicity 21 Mean scores on NZDep2006 scale, by NZSEI-06 SES group, sex, and ethnicity
European and Other males European and Other females
Māori males Māori females
Pacific males Pacific females
Asian males Asian females
4.5. Construct validation of NZSEI-06 – multi-variable analyses To assess the independent effects of sex, ethnicity, and socio-economic status on the four socio-economic correlates – smoking, housing tenure, motor vehicle access, and household deprivation – regression models were undertaken. Logistic regression
4 4.1 4.34.8
5.35.7
3
4
5
6
7
8
9
1 2 3 4 5 6
NZDep score
NZSEI-06 group
4.3 4.3 4.5 4.85.4
5.9
3
4
5
6
7
8
9
1 2 3 4 5 6
NZDep score
NZSEI-06 group
5.7 5.6 5.96.5
7 7.3
3
4
5
6
7
8
9
1 2 3 4 5 6
NZDep score
NZSEI-06 group
6.3 6.2 6.26.6
7.27.7
3
4
5
6
7
8
9
1 2 3 4 5 6
NZDep score
NZSEI-06 group
6.2 6.46.8
7.57.9 8.1
3
4
5
6
7
8
9
1 2 3 4 5 6
NZDep score
NZSEI-06 group
7 6.8 77.4
7.98.3
3
4
5
6
7
8
9
1 2 3 4 5 6
NZDep score
NZSEI-06 group
4.7 5 5.25.7
6.2 6.4
3
4
5
6
7
8
9
1 2 3 4 5 6
NZDep score
NZSEI-06 group
4.8 5.1 5.1 5.46 6.2
3
4
5
6
7
8
9
1 2 3 4 5 6
NZDep score
NZSEI-06 group
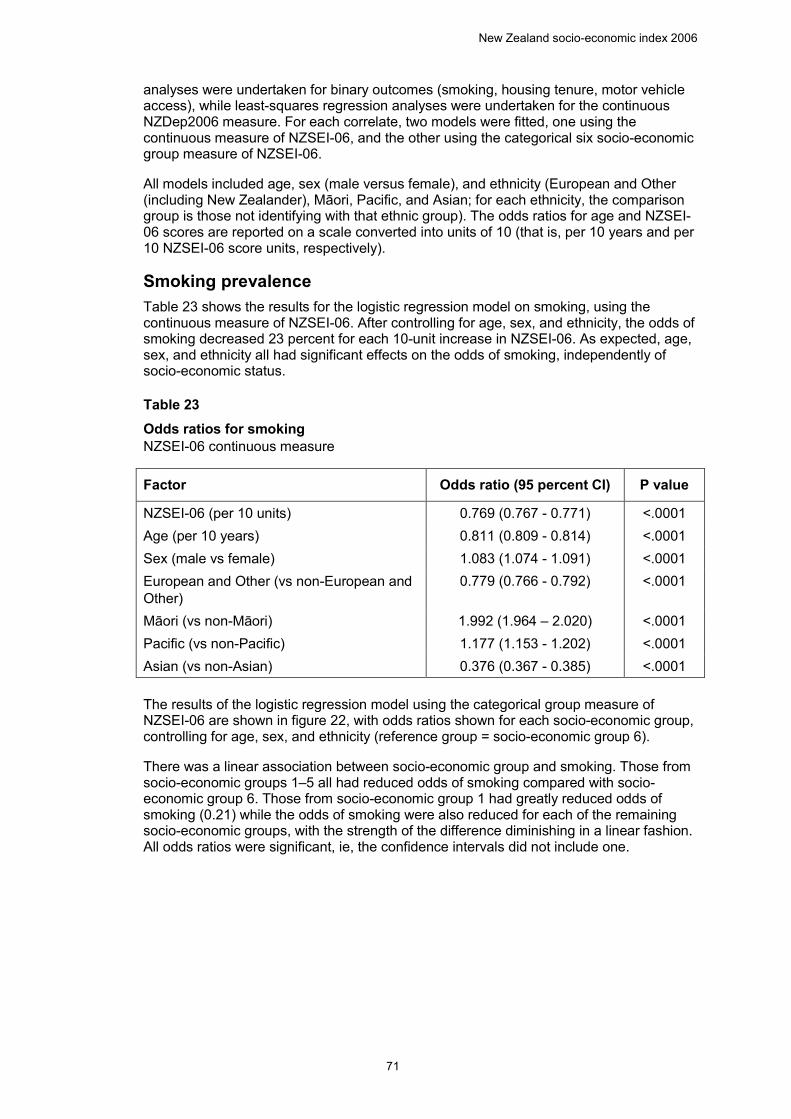
New Zealand socio-economic index 2006
71
analyses were undertaken for binary outcomes (smoking, housing tenure, motor vehicle access), while least-squares regression analyses were undertaken for the continuous NZDep2006 measure. For each correlate, two models were fitted, one using the continuous measure of NZSEI-06, and the other using the categorical six socio-economic group measure of NZSEI-06.
All models included age, sex (male versus female), and ethnicity (European and Other (including New Zealander), Māori, Pacific, and Asian; for each ethnicity, the comparison group is those not identifying with that ethnic group). The odds ratios for age and NZSEI-06 scores are reported on a scale converted into units of 10 (that is, per 10 years and per 10 NZSEI-06 score units, respectively).
Smoking prevalence Table 23 shows the results for the logistic regression model on smoking, using the continuous measure of NZSEI-06. After controlling for age, sex, and ethnicity, the odds of smoking decreased 23 percent for each 10-unit increase in NZSEI-06. As expected, age, sex, and ethnicity all had significant effects on the odds of smoking, independently of socio-economic status.
Table 23 Odds ratios for smoking NZSEI-06 continuous measure 23 Odds ratios for smoking, NZSEI-06 continuous measure
Factor Odds ratio (95 percent CI) P value
NZSEI-06 (per 10 units) 0.769 (0.767 - 0.771) <.0001 Age (per 10 years) 0.811 (0.809 - 0.814) <.0001 Sex (male vs female) 1.083 (1.074 - 1.091) <.0001 European and Other (vs non-European and Other)
0.779 (0.766 - 0.792) <.0001
Māori (vs non-Māori) 1.992 (1.964 – 2.020) <.0001 Pacific (vs non-Pacific) 1.177 (1.153 - 1.202) <.0001 Asian (vs non-Asian) 0.376 (0.367 - 0.385) <.0001
The results of the logistic regression model using the categorical group measure of NZSEI-06 are shown in figure 22, with odds ratios shown for each socio-economic group, controlling for age, sex, and ethnicity (reference group = socio-economic group 6).
There was a linear association between socio-economic group and smoking. Those from socio-economic groups 1–5 all had reduced odds of smoking compared with socio-economic group 6. Those from socio-economic group 1 had greatly reduced odds of smoking (0.21) while the odds of smoking were also reduced for each of the remaining socio-economic groups, with the strength of the difference diminishing in a linear fashion. All odds ratios were significant, ie, the confidence intervals did not include one.
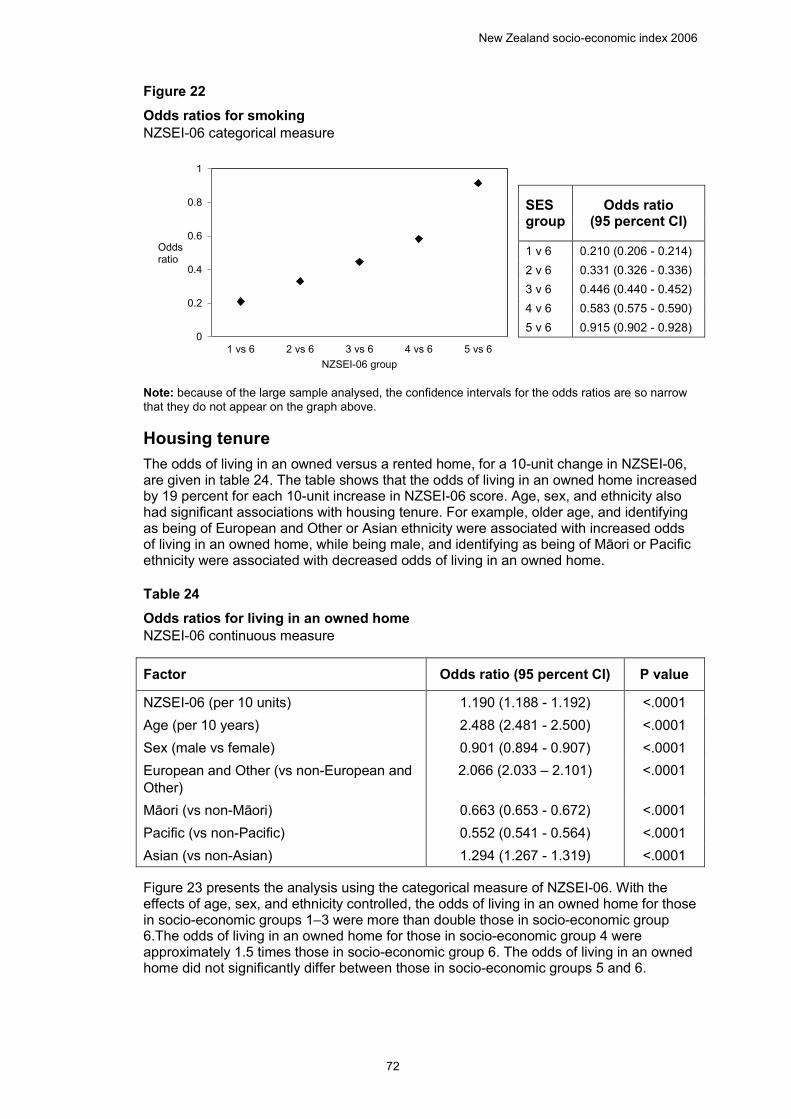
New Zealand socio-economic index 2006
72
Figure 22 Odds ratios for smoking NZSEI-06 categorical measure 22 Odds ratios for smoking, NZSEI-06 categorical measure
Note: because of the large sample analysed, the confidence intervals for the odds ratios are so narrow that they do not appear on the graph above.
Housing tenure The odds of living in an owned versus a rented home, for a 10-unit change in NZSEI-06, are given in table 24. The table shows that the odds of living in an owned home increased by 19 percent for each 10-unit increase in NZSEI-06 score. Age, sex, and ethnicity also had significant associations with housing tenure. For example, older age, and identifying as being of European and Other or Asian ethnicity were associated with increased odds of living in an owned home, while being male, and identifying as being of Māori or Pacific ethnicity were associated with decreased odds of living in an owned home.
Table 24 Odds ratios for living in an owned home NZSEI-06 continuous measure 24 Odds ratios for living in an owned home, NZSEI-06 continuous measure
Factor Odds ratio (95 percent CI) P value
NZSEI-06 (per 10 units) 1.190 (1.188 - 1.192) <.0001 Age (per 10 years) 2.488 (2.481 - 2.500) <.0001 Sex (male vs female) 0.901 (0.894 - 0.907) <.0001 European and Other (vs non-European and Other)
2.066 (2.033 – 2.101) <.0001
Māori (vs non-Māori) 0.663 (0.653 - 0.672) <.0001 Pacific (vs non-Pacific) 0.552 (0.541 - 0.564) <.0001 Asian (vs non-Asian) 1.294 (1.267 - 1.319) <.0001
Figure 23 presents the analysis using the categorical measure of NZSEI-06. With the effects of age, sex, and ethnicity controlled, the odds of living in an owned home for those in socio-economic groups 1–3 were more than double those in socio-economic group 6.The odds of living in an owned home for those in socio-economic group 4 were approximately 1.5 times those in socio-economic group 6. The odds of living in an owned home did not significantly differ between those in socio-economic groups 5 and 6.
0
0.2
0.4
0.6
0.8
1
1 vs 6 2 vs 6 3 vs 6 4 vs 6 5 vs 6
Oddsratio
NZSEI-06 group
SES group
Odds ratio (95 percent CI)
1 v 6 0.210 (0.206 - 0.214) 2 v 6 0.331 (0.326 - 0.336) 3 v 6 0.446 (0.440 - 0.452) 4 v 6 0.583 (0.575 - 0.590) 5 v 6 0.915 (0.902 - 0.928)
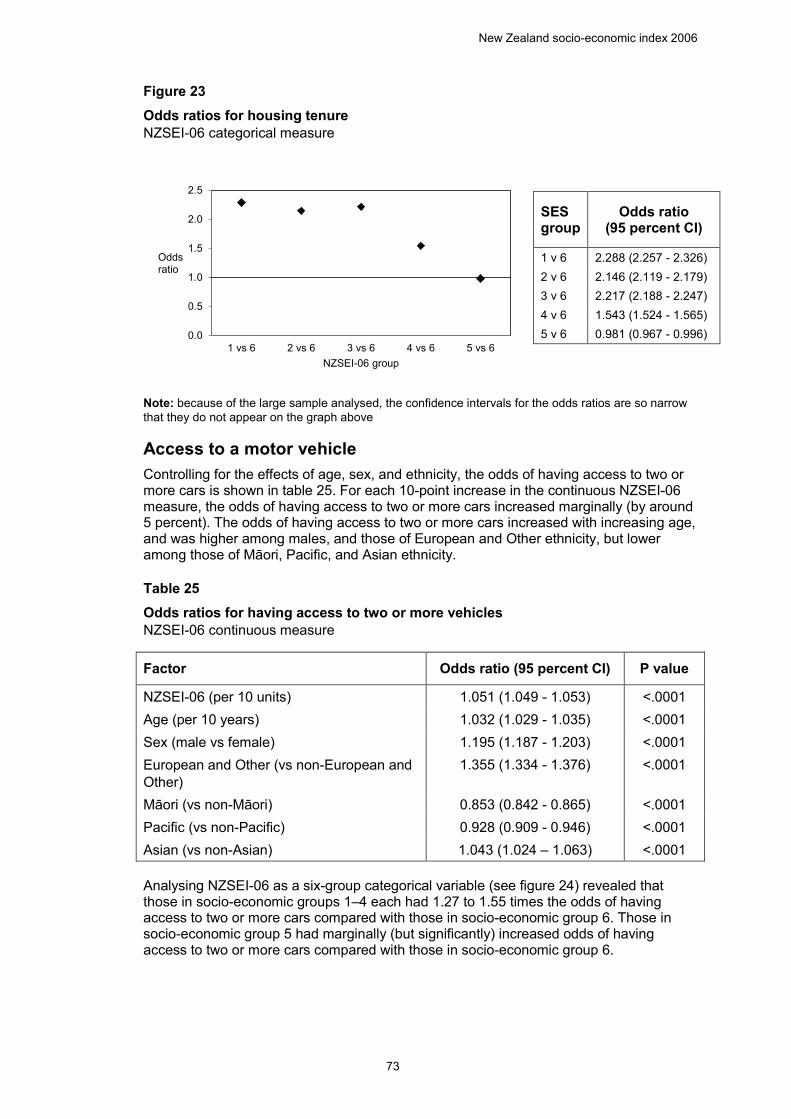
New Zealand socio-economic index 2006
73
Figure 23 Odds ratios for housing tenure NZSEI-06 categorical measure 23 Odds ratios for housing tenure, NZSEI-06 categorical measure
Note: because of the large sample analysed, the confidence intervals for the odds ratios are so narrow that they do not appear on the graph above
Access to a motor vehicle Controlling for the effects of age, sex, and ethnicity, the odds of having access to two or more cars is shown in table 25. For each 10-point increase in the continuous NZSEI-06 measure, the odds of having access to two or more cars increased marginally (by around 5 percent). The odds of having access to two or more cars increased with increasing age, and was higher among males, and those of European and Other ethnicity, but lower among those of Māori, Pacific, and Asian ethnicity.
Table 25 Odds ratios for having access to two or more vehicles NZSEI-06 continuous measure 25 Odds ratios for having access to two or more vehicles, NZSEI-06 continuous measure
Factor Odds ratio (95 percent CI) P value
NZSEI-06 (per 10 units) 1.051 (1.049 - 1.053) <.0001 Age (per 10 years) 1.032 (1.029 - 1.035) <.0001 Sex (male vs female) 1.195 (1.187 - 1.203) <.0001 European and Other (vs non-European and Other)
1.355 (1.334 - 1.376) <.0001
Māori (vs non-Māori) 0.853 (0.842 - 0.865) <.0001 Pacific (vs non-Pacific) 0.928 (0.909 - 0.946) <.0001 Asian (vs non-Asian) 1.043 (1.024 – 1.063) <.0001 Analysing NZSEI-06 as a six-group categorical variable (see figure 24) revealed that those in socio-economic groups 1–4 each had 1.27 to 1.55 times the odds of having access to two or more cars compared with those in socio-economic group 6. Those in socio-economic group 5 had marginally (but significantly) increased odds of having access to two or more cars compared with those in socio-economic group 6.
0.0
0.5
1.0
1.5
2.0
2.5
1 vs 6 2 vs 6 3 vs 6 4 vs 6 5 vs 6
Oddsratio
NZSEI-06 group
SES group
Odds ratio (95 percent CI)
1 v 6 2.288 (2.257 - 2.326) 2 v 6 2.146 (2.119 - 2.179) 3 v 6 2.217 (2.188 - 2.247) 4 v 6 1.543 (1.524 - 1.565) 5 v 6 0.981 (0.967 - 0.996)
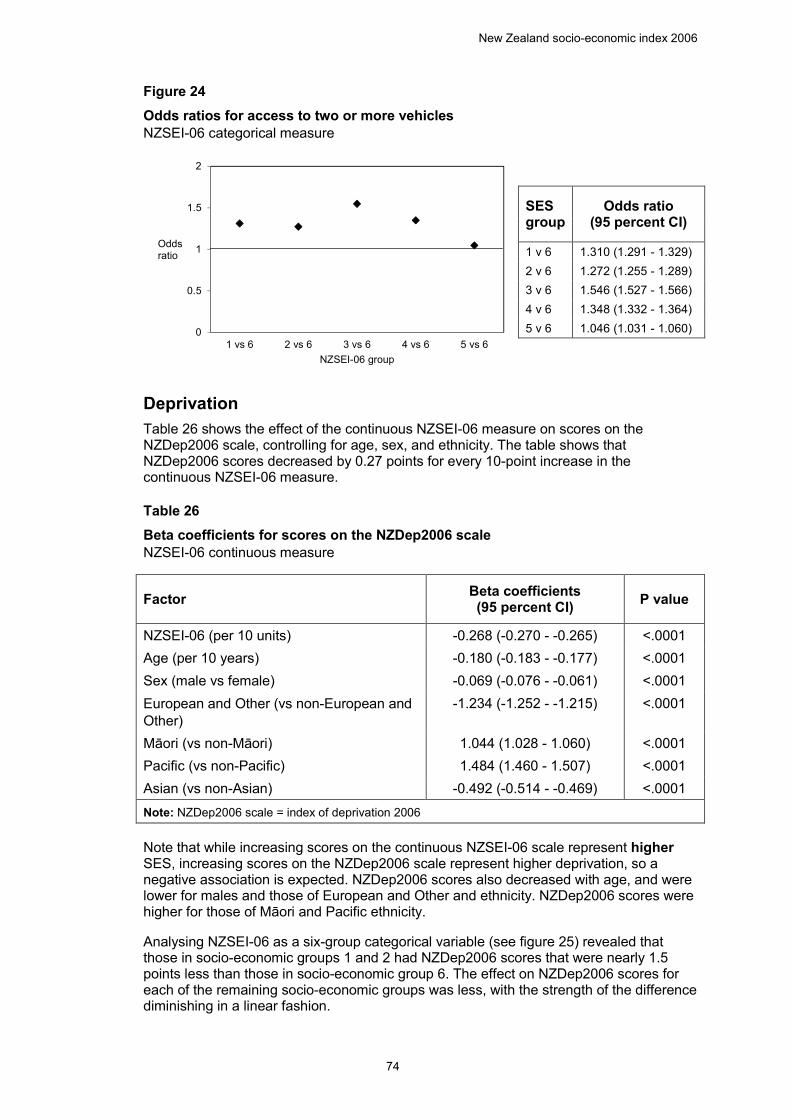
New Zealand socio-economic index 2006
74
Figure 24
Odds ratios for access to two or more vehicles
NZSEI-06 categorical measure 24 Odds ratios for access to two or more vehicles, NZSEI-06 categorical measure
Deprivation
Table 26 shows the effect of the continuous NZSEI-06 measure on scores on the NZDep2006 scale, controlling for age, sex, and ethnicity. The table shows that NZDep2006 scores decreased by 0.27 points for every 10-point increase in the continuous NZSEI-06 measure.
Table 26
Beta coefficients for scores on the NZDep2006 scale
NZSEI-06 continuous measure 26 Beta coefficients for scores on the NZDep2006 scale, NZSEI-06 continuous measure
Factor Beta coefficients (95 percent CI)
P value
NZSEI-06 (per 10 units) -0.268 (-0.270 - -0.265) <.0001
Age (per 10 years) -0.180 (-0.183 - -0.177) <.0001
Sex (male vs female) -0.069 (-0.076 - -0.061) <.0001
European and Other (vs non-European and
Other)
-1.234 (-1.252 - -1.215) <.0001
Māori (vs non-Māori) 1.044 (1.028 - 1.060) <.0001
Pacific (vs non-Pacific) 1.484 (1.460 - 1.507) <.0001
Asian (vs non-Asian) -0.492 (-0.514 - -0.469) <.0001
Note: NZDep2006 scale = index of deprivation 2006
Note that while increasing scores on the continuous NZSEI-06 scale represent higher SES, increasing scores on the NZDep2006 scale represent higher deprivation, so a negative association is expected. NZDep2006 scores also decreased with age, and were lower for males and those of European and Other and ethnicity. NZDep2006 scores were higher for those of Māori and Pacific ethnicity.
Analysing NZSEI-06 as a six-group categorical variable (see figure 25) revealed that those in socio-economic groups 1 and 2 had NZDep2006 scores that were nearly 1.5 points less than those in socio-economic group 6. The effect on NZDep2006 scores for each of the remaining socio-economic groups was less, with the strength of the difference diminishing in a linear fashion.
0
0.5
1
1.5
2
1 vs 6 2 vs 6 3 vs 6 4 vs 6 5 vs 6
Oddsratio
NZSEI-06 group
SES group
Odds ratio (95 percent CI)
1 v 6 1.310 (1.291 - 1.329)
2 v 6 1.272 (1.255 - 1.289)
3 v 6 1.546 (1.527 - 1.566)
4 v 6 1.348 (1.332 - 1.364)
5 v 6 1.046 (1.031 - 1.060)
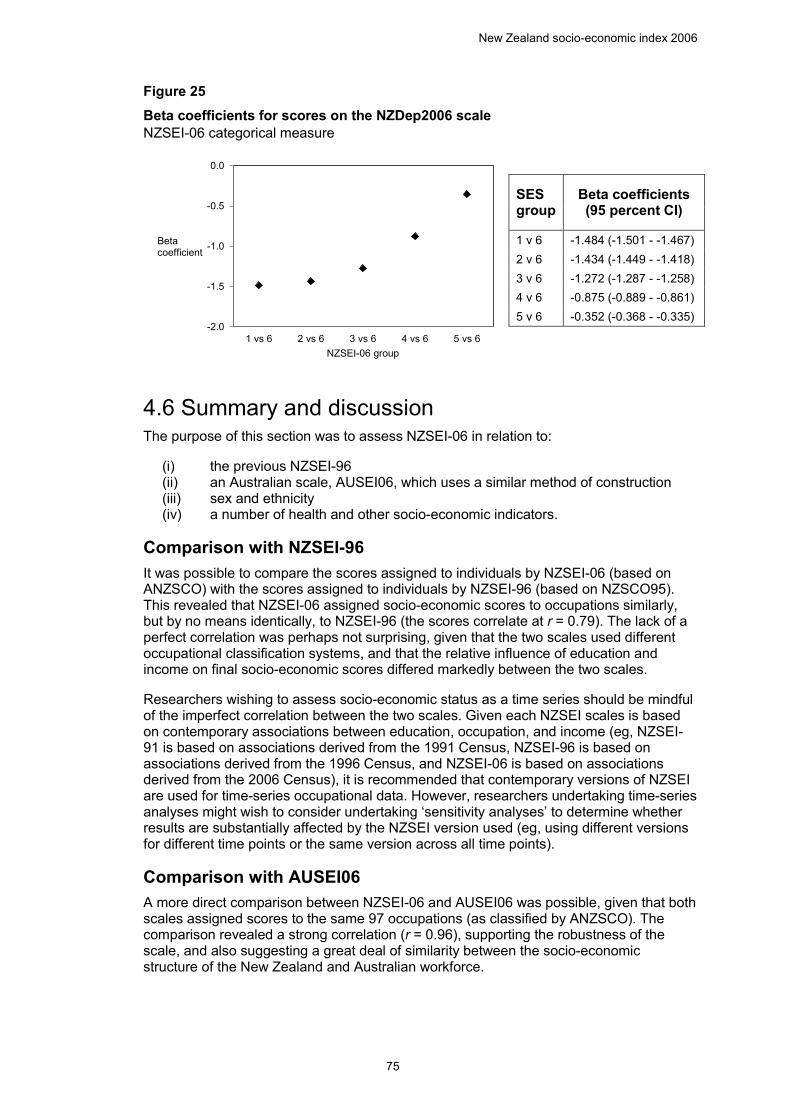
New Zealand socio-economic index 2006
75
Figure 25 Beta coefficients for scores on the NZDep2006 scale NZSEI-06 categorical measure 25 Beta coefficients for scores on the NZDep2006 scale, NZSEI-06 categorical measure
4.6 Summary and discussion The purpose of this section was to assess NZSEI-06 in relation to:
(i) the previous NZSEI-96 (ii) an Australian scale, AUSEI06, which uses a similar method of construction (iii) sex and ethnicity (iv) a number of health and other socio-economic indicators.
Comparison with NZSEI-96 It was possible to compare the scores assigned to individuals by NZSEI-06 (based on ANZSCO) with the scores assigned to individuals by NZSEI-96 (based on NZSCO95). This revealed that NZSEI-06 assigned socio-economic scores to occupations similarly, but by no means identically, to NZSEI-96 (the scores correlate at r = 0.79). The lack of a perfect correlation was perhaps not surprising, given that the two scales used different occupational classification systems, and that the relative influence of education and income on final socio-economic scores differed markedly between the two scales.
Researchers wishing to assess socio-economic status as a time series should be mindful of the imperfect correlation between the two scales. Given each NZSEI scales is based on contemporary associations between education, occupation, and income (eg, NZSEI-91 is based on associations derived from the 1991 Census, NZSEI-96 is based on associations derived from the 1996 Census, and NZSEI-06 is based on associations derived from the 2006 Census), it is recommended that contemporary versions of NZSEI are used for time-series occupational data. However, researchers undertaking time-series analyses might wish to consider undertaking ‘sensitivity analyses’ to determine whether results are substantially affected by the NZSEI version used (eg, using different versions for different time points or the same version across all time points).
Comparison with AUSEI06 A more direct comparison between NZSEI-06 and AUSEI06 was possible, given that both scales assigned scores to the same 97 occupations (as classified by ANZSCO). The comparison revealed a strong correlation (r = 0.96), supporting the robustness of the scale, and also suggesting a great deal of similarity between the socio-economic structure of the New Zealand and Australian workforce.
-2.0
-1.5
-1.0
-0.5
0.0
1 vs 6 2 vs 6 3 vs 6 4 vs 6 5 vs 6
Beta coefficient
NZSEI-06 group
SES group
Beta coefficients (95 percent CI)
1 v 6 -1.484 (-1.501 - -1.467) 2 v 6 -1.434 (-1.449 - -1.418) 3 v 6 -1.272 (-1.287 - -1.258) 4 v 6 -0.875 (-0.889 - -0.861) 5 v 6 -0.352 (-0.368 - -0.335)
New Zealand socio-economic index 2006
76
Sex and ethnic comparisons Using the path coefficients determined for the sample as a whole, NZSEI-06 scores were constructed separately for males and females and then compared. Comparisons between males and females showed that males were assigned higher scores for the vast majority of occupations (mean difference across occupations was 5.8 points). Comparing males and females on mean income, years of education, and age for each minor group occupation revealed that it was the lower mean income reported by females that likely resulted in lower sex-specific NZSEI-06 scores. However, male and female scores correlated strongly (r = 0.96), suggesting that the socio-economic structure of occupations is similar for the two sexes. This also suggests that NZSEI-06 scale is applicable to both males and females.
NZSEI-06 scores were also constructed separately and compared for four ethnic groups – European and Other (including New Zealander), Māori, Pacific, and Asian. Asian workers had ethnic-specific NZSEI-06 scores that were, on average, approximately 5 points higher than European and Other workers, and 13–14 points higher than either Māori or Pacific workers.
Comparing ethnicities on mean income, years of education, and age for each minor group occupation revealed that the higher mean years of education for Asian workers relative to other ethnic groups was the likely reason for their higher ethnic-specific NZSEI-06 scores. These differences notwithstanding, the ethnic-specific NZSEI-06 scores of each ethnic group correlated strongly with every other group (all pairwise r >= 0.90). This suggests that the socio-economic structure of occupations is similar across ethnic groups, and that NZSEI-06 can be applied to these ethnic groups.
Validation with health and socio-economic correlates Assessing NZSEI-06 against 2006 Census data on smoking, housing tenure, motor vehicle access, and residential deprivation revealed socio-economic patterning for each of these outcomes. Moreover, these patterns were apparent for both males and females of each major ethnic group.
Results were clearest for smoking and residential deprivation. NZSEI-06 exhibited a ‘dose-response’ relationship with both of these indicators: the higher the NZSEI-06 score (or socio-economic group), the lower the likelihood of smoking, and the lower the score on the NZDep2006 index of deprivation.
77
5 Imputing NZSEI-06 scores in the absence of occupational data
This section describes and evaluates two methods for imputing NZSEI-06 scores for those with no occupational data. Both methods are based on the notion of ‘occupational potential’ (Jones and McMillan, 2001), whereby, in the absence of information on occupation, scores can be assigned using available data on age and education. These two methods were trialled for NZSEI-96 and were found to correspond well with actual NZSEI-96 scores and to have reasonable construct validity. A third method was also trialled for NZSEI-96 but found to have poorer correspondence and construct validity, so it will not be tested for NZSEI-06.
The two methods are compared as suitable methods for the classification of those without occupational data. This is done by assessing their correspondence with actual NZSEI-06 scores, and their ability to predict socio-economic patterns in smoking prevalence, housing tenure, motor vehicle access, and deprivation (NZDep2006 index).
5.1 Imputing NZSEI-06 scores: results of two alternative methods For the earlier NZSEI-96, imputations were based on a simplified measure of educational qualifications containing just six levels: none, school certificate, higher school qualifications, vocational qualifications, bachelor’s degree, and higher degree. The rationale for this approach was that some qualification levels – specifically those relating to vocational qualifications – are often difficult to classify to the detail required of, for example, the 15-level educational qualification measure used in the 2006 Census and in the construction of NZSEI-06.
However, for the imputation for NZSEI-06 described here, the approach taken will be to classify educational qualifications at the greatest (15-group) level of detail. The reasons for this are that, first, simplifying educational qualification levels risks grouping together individuals with quite different socio-economic standing. Second, with the standardisation of New Zealand qualifications to a ‘levels’ system through the New Zealand Qualifications Authority (NZQA), classification of qualifications has become easier – though it should not be assumed that no difficulties remain. Third, by showing the results of imputations with educational qualifications classified to the greatest level of detail, it is possible to determine where misclassifications might make large differences to an imputed score and where they have little impact. This will help those charged with classification of qualification data to determine the distinctions that are important for the accurate classification of socio-economic status.
For the purposes of imputing NZSEI-06 scores, 10-year age bands were used. Table 27 shows a classification of highest qualification by 10-year age band for those reporting an occupation as part of the 2006 Census. As the years of education corresponding to each qualification level are used in one of the imputation methods, these are also shown in the table (note, these are repeated from table 5).
For the two methods compared, the impact of sex will be investigated. Given the known differences between the occupational roles held by men and women (see section 2.1 and appendix I), it may be that sex-modified or sex-specific imputed scores may differ substantially from unmodified/unadjusted scores. This will be tested here. Where sex-modified or sex-specific scores do differ from unmodified/unadjusted scores, both sets of imputed scores will be assessed and compared in their correspondence with actual NZSEI-06 scores and in their ability to replicate known patterns for the health and socio-
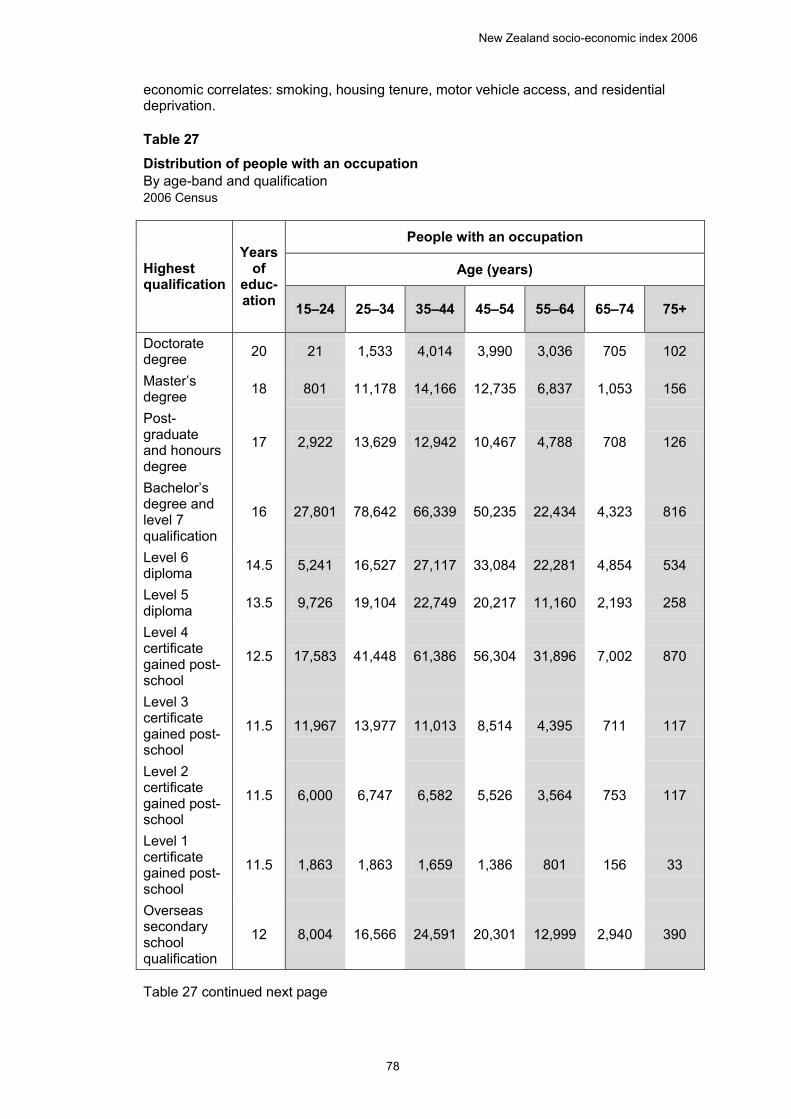
New Zealand socio-economic index 2006
78
economic correlates: smoking, housing tenure, motor vehicle access, and residential deprivation.
Table 27 Distribution of people with an occupation By age-band and qualification 2006 Census 27 Distribution of people with an occupation, by age-band and qualification, 2006 Census
Highest qualification
Years of
educ-ation
People with an occupation
Age (years)
15–24 25–34 35–44 45–54 55–64 65–74 75+
Doctorate degree 20 21 1,533 4,014 3,990 3,036 705 102
Master’s degree 18 801 11,178 14,166 12,735 6,837 1,053 156
Post-graduate and honours degree
17 2,922 13,629 12,942 10,467 4,788 708 126
Bachelor’s degree and level 7 qualification
16 27,801 78,642 66,339 50,235 22,434 4,323 816
Level 6 diploma 14.5 5,241 16,527 27,117 33,084 22,281 4,854 534
Level 5 diploma 13.5 9,726 19,104 22,749 20,217 11,160 2,193 258
Level 4 certificate gained post-school
12.5 17,583 41,448 61,386 56,304 31,896 7,002 870
Level 3 certificate gained post-school
11.5 11,967 13,977 11,013 8,514 4,395 711 117
Level 2 certificate gained post-school
11.5 6,000 6,747 6,582 5,526 3,564 753 117
Level 1 certificate gained post-school
11.5 1,863 1,863 1,659 1,386 801 156 33
Overseas secondary school qualification
12 8,004 16,566 24,591 20,301 12,999 2,940 390
Table 27 continued next page
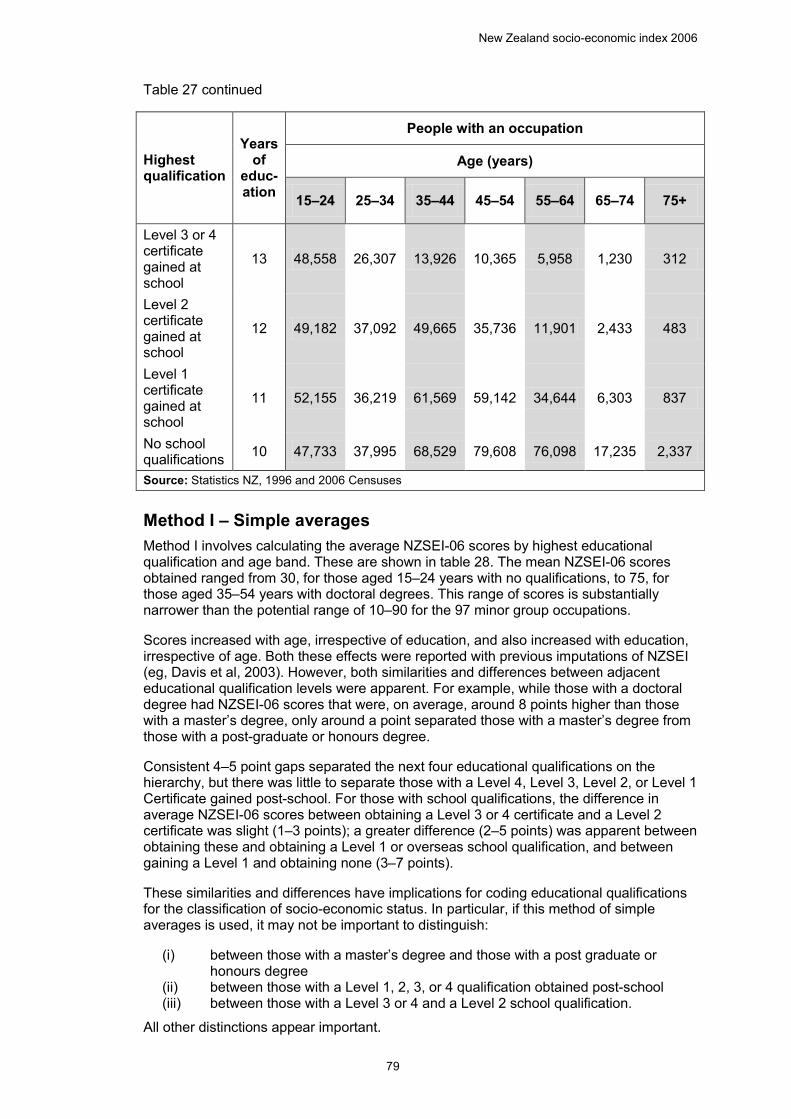
New Zealand socio-economic index 2006
79
Table 27 continued
Highest qualification
Years of
educ-ation
People with an occupation
Age (years)
15–24 25–34 35–44 45–54 55–64 65–74 75+
Level 3 or 4 certificate gained at school
13 48,558 26,307 13,926 10,365 5,958 1,230 312
Level 2 certificate gained at school
12 49,182 37,092 49,665 35,736 11,901 2,433 483
Level 1 certificate gained at school
11 52,155 36,219 61,569 59,142 34,644 6,303 837
No school qualifications 10 47,733 37,995 68,529 79,608 76,098 17,235 2,337
Source: Statistics NZ, 1996 and 2006 Censuses
Method I – Simple averages Method I involves calculating the average NZSEI-06 scores by highest educational qualification and age band. These are shown in table 28. The mean NZSEI-06 scores obtained ranged from 30, for those aged 15–24 years with no qualifications, to 75, for those aged 35–54 years with doctoral degrees. This range of scores is substantially narrower than the potential range of 10–90 for the 97 minor group occupations.
Scores increased with age, irrespective of education, and also increased with education, irrespective of age. Both these effects were reported with previous imputations of NZSEI (eg, Davis et al, 2003). However, both similarities and differences between adjacent educational qualification levels were apparent. For example, while those with a doctoral degree had NZSEI-06 scores that were, on average, around 8 points higher than those with a master’s degree, only around a point separated those with a master’s degree from those with a post-graduate or honours degree.
Consistent 4–5 point gaps separated the next four educational qualifications on the hierarchy, but there was little to separate those with a Level 4, Level 3, Level 2, or Level 1 Certificate gained post-school. For those with school qualifications, the difference in average NZSEI-06 scores between obtaining a Level 3 or 4 certificate and a Level 2 certificate was slight (1–3 points); a greater difference (2–5 points) was apparent between obtaining these and obtaining a Level 1 or overseas school qualification, and between gaining a Level 1 and obtaining none (3–7 points).
These similarities and differences have implications for coding educational qualifications for the classification of socio-economic status. In particular, if this method of simple averages is used, it may not be important to distinguish:
(i) between those with a master’s degree and those with a post graduate or honours degree
(ii) between those with a Level 1, 2, 3, or 4 qualification obtained post-school (iii) between those with a Level 3 or 4 and a Level 2 school qualification.
All other distinctions appear important.
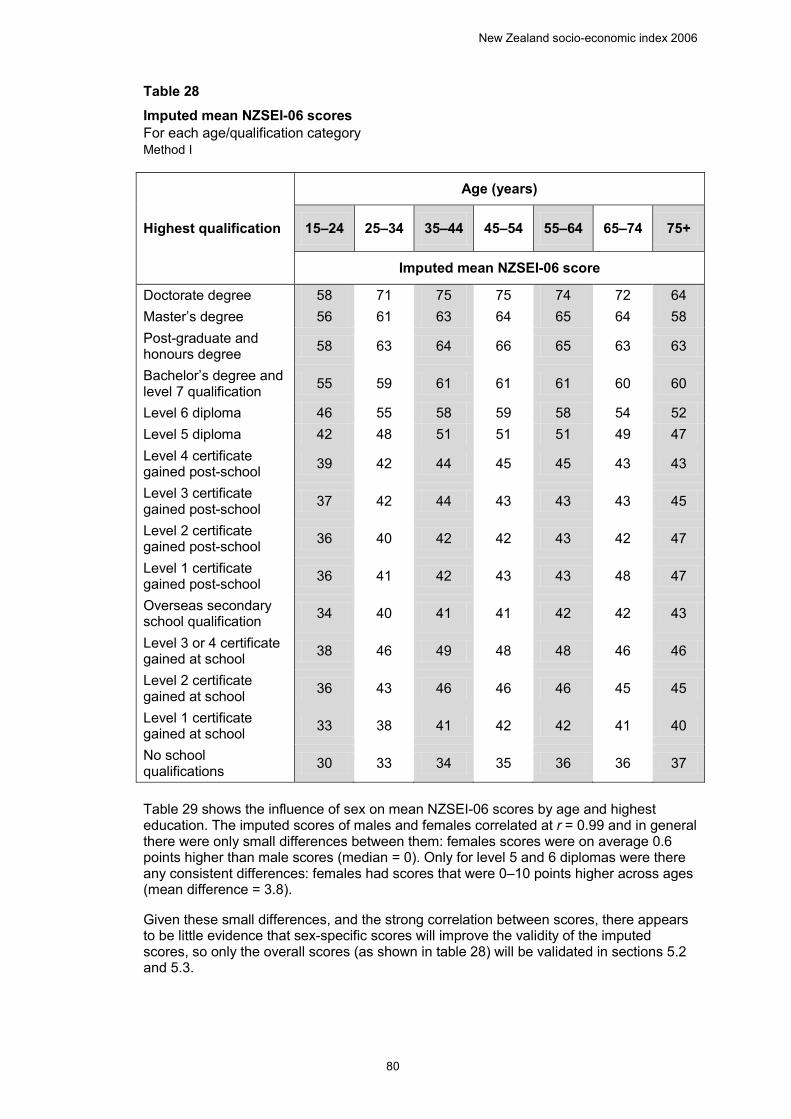
New Zealand socio-economic index 2006
80
Table 28 Imputed mean NZSEI-06 scores For each age/qualification category Method I 28 Imputed mean NZSEI-06 scores, for each age/qualification category, method 1
Highest qualification
Age (years)
15–24 25–34 35–44 45–54 55–64 65–74 75+
Imputed mean NZSEI-06 score
Doctorate degree 58 71 75 75 74 72 64 Master’s degree 56 61 63 64 65 64 58 Post-graduate and honours degree 58 63 64 66 65 63 63
Bachelor’s degree and level 7 qualification 55 59 61 61 61 60 60
Level 6 diploma 46 55 58 59 58 54 52 Level 5 diploma 42 48 51 51 51 49 47 Level 4 certificate gained post-school 39 42 44 45 45 43 43
Level 3 certificate gained post-school 37 42 44 43 43 43 45
Level 2 certificate gained post-school 36 40 42 42 43 42 47
Level 1 certificate gained post-school 36 41 42 43 43 48 47
Overseas secondary school qualification 34 40 41 41 42 42 43
Level 3 or 4 certificate gained at school 38 46 49 48 48 46 46
Level 2 certificate gained at school 36 43 46 46 46 45 45
Level 1 certificate gained at school 33 38 41 42 42 41 40
No school qualifications 30 33 34 35 36 36 37
Table 29 shows the influence of sex on mean NZSEI-06 scores by age and highest education. The imputed scores of males and females correlated at r = 0.99 and in general there were only small differences between them: females scores were on average 0.6 points higher than male scores (median = 0). Only for level 5 and 6 diplomas were there any consistent differences: females had scores that were 0–10 points higher across ages (mean difference = 3.8).
Given these small differences, and the strong correlation between scores, there appears to be little evidence that sex-specific scores will improve the validity of the imputed scores, so only the overall scores (as shown in table 28) will be validated in sections 5.2 and 5.3.
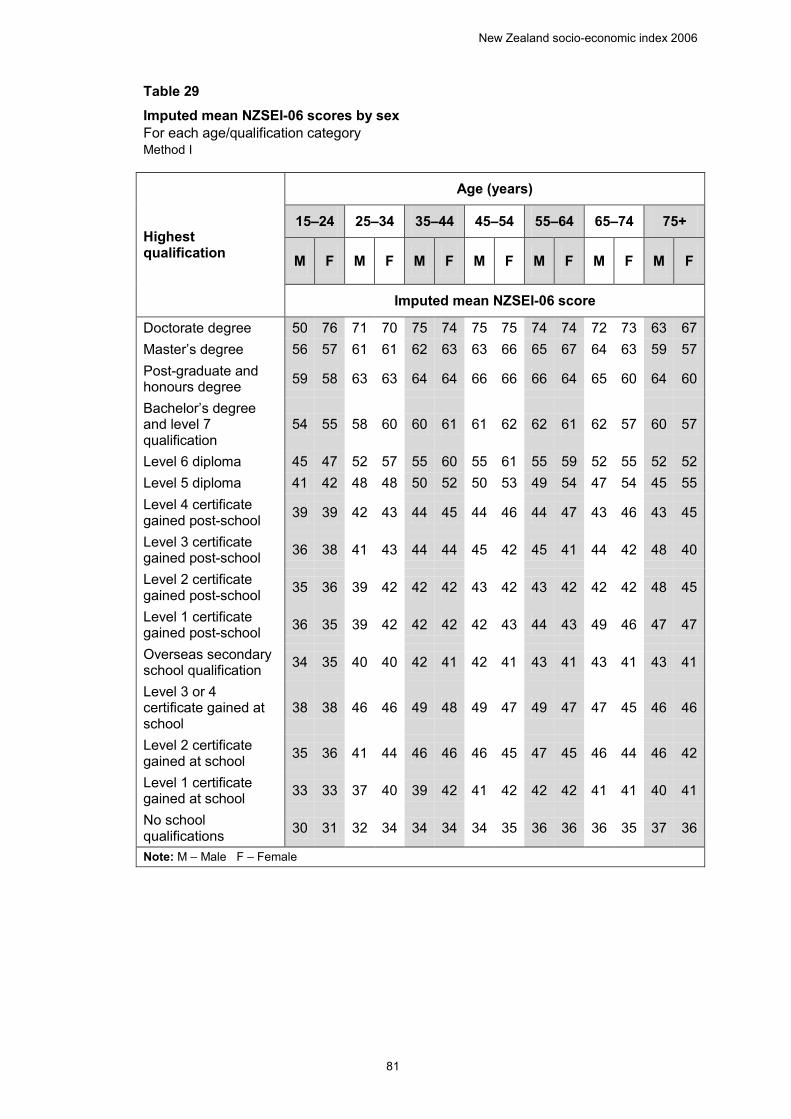
New Zealand socio-economic index 2006
81
Table 29 Imputed mean NZSEI-06 scores by sex For each age/qualification category Method I 29 Imputed mean NZSEI-06 scores by sex, for each age/qualification category, method I
Highest qualification
Age (years)
15–24 25–34 35–44 45–54 55–64 65–74 75+
M F M F M F M F M F M F M F
Imputed mean NZSEI-06 score
Doctorate degree 50 76 71 70 75 74 75 75 74 74 72 73 63 67 Master’s degree 56 57 61 61 62 63 63 66 65 67 64 63 59 57 Post-graduate and honours degree 59 58 63 63 64 64 66 66 66 64 65 60 64 60
Bachelor’s degree and level 7 qualification
54 55 58 60 60 61 61 62 62 61 62 57 60 57
Level 6 diploma 45 47 52 57 55 60 55 61 55 59 52 55 52 52 Level 5 diploma 41 42 48 48 50 52 50 53 49 54 47 54 45 55 Level 4 certificate gained post-school 39 39 42 43 44 45 44 46 44 47 43 46 43 45
Level 3 certificate gained post-school 36 38 41 43 44 44 45 42 45 41 44 42 48 40
Level 2 certificate gained post-school 35 36 39 42 42 42 43 42 43 42 42 42 48 45
Level 1 certificate gained post-school 36 35 39 42 42 42 42 43 44 43 49 46 47 47
Overseas secondary school qualification 34 35 40 40 42 41 42 41 43 41 43 41 43 41
Level 3 or 4 certificate gained at school
38 38 46 46 49 48 49 47 49 47 47 45 46 46
Level 2 certificate gained at school 35 36 41 44 46 46 46 45 47 45 46 44 46 42
Level 1 certificate gained at school 33 33 37 40 39 42 41 42 42 42 41 41 40 41
No school qualifications 30 31 32 34 34 34 34 35 36 36 36 35 37 36
Note: M – Male F – Female
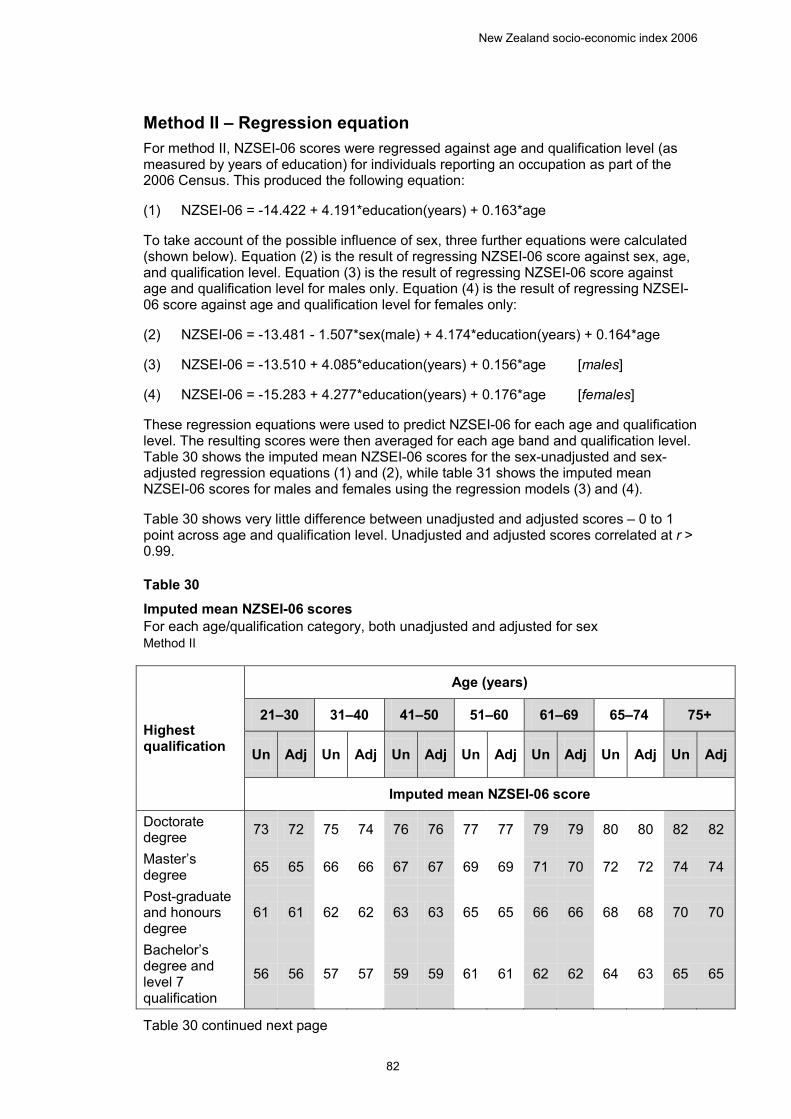
New Zealand socio-economic index 2006
82
Method II – Regression equation For method II, NZSEI-06 scores were regressed against age and qualification level (as measured by years of education) for individuals reporting an occupation as part of the 2006 Census. This produced the following equation:
(1) NZSEI-06 = -14.422 + 4.191*education(years) + 0.163*age
To take account of the possible influence of sex, three further equations were calculated (shown below). Equation (2) is the result of regressing NZSEI-06 score against sex, age, and qualification level. Equation (3) is the result of regressing NZSEI-06 score against age and qualification level for males only. Equation (4) is the result of regressing NZSEI-06 score against age and qualification level for females only:
(2) NZSEI-06 = -13.481 - 1.507*sex(male) + 4.174*education(years) + 0.164*age
(3) NZSEI-06 = -13.510 + 4.085*education(years) + 0.156*age [males]
(4) NZSEI-06 = -15.283 + 4.277*education(years) + 0.176*age [females]
These regression equations were used to predict NZSEI-06 for each age and qualification level. The resulting scores were then averaged for each age band and qualification level. Table 30 shows the imputed mean NZSEI-06 scores for the sex-unadjusted and sex-adjusted regression equations (1) and (2), while table 31 shows the imputed mean NZSEI-06 scores for males and females using the regression models (3) and (4).
Table 30 shows very little difference between unadjusted and adjusted scores – 0 to 1 point across age and qualification level. Unadjusted and adjusted scores correlated at r > 0.99.
Table 30 Imputed mean NZSEI-06 scores For each age/qualification category, both unadjusted and adjusted for sex Method II 30 Imputed mean NZSEI-06 scores, for each age/qualification category, both unadjusted and adjusted for sex, method II
Highest qualification
Age (years)
21–30 31–40 41–50 51–60 61–69 65–74 75+
Un Adj Un Adj Un Adj Un Adj Un Adj Un Adj Un Adj
Imputed mean NZSEI-06 score
Doctorate degree 73 72 75 74 76 76 77 77 79 79 80 80 82 82
Master’s degree 65 65 66 66 67 67 69 69 71 70 72 72 74 74
Post-graduate and honours degree
61 61 62 62 63 63 65 65 66 66 68 68 70 70
Bachelor’s degree and level 7 qualification
56 56 57 57 59 59 61 61 62 62 64 63 65 65
Table 30 continued next page
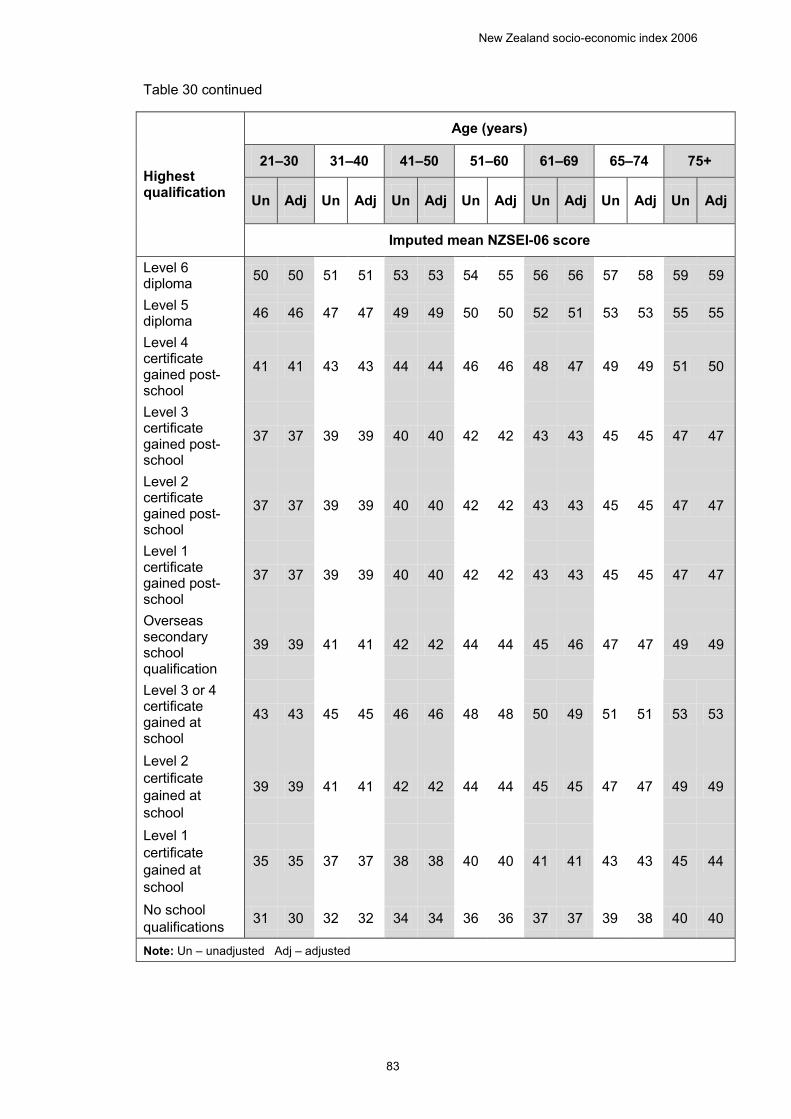
New Zealand socio-economic index 2006
83
Table 30 continued
Highest qualification
Age (years)
21–30 31–40 41–50 51–60 61–69 65–74 75+
Un Adj Un Adj Un Adj Un Adj Un Adj Un Adj Un Adj
Imputed mean NZSEI-06 score
Level 6 diploma 50 50 51 51 53 53 54 55 56 56 57 58 59 59
Level 5 diploma 46 46 47 47 49 49 50 50 52 51 53 53 55 55
Level 4 certificate gained post-school
41 41 43 43 44 44 46 46 48 47 49 49 51 50
Level 3 certificate gained post-school
37 37 39 39 40 40 42 42 43 43 45 45 47 47
Level 2 certificate gained post-school
37 37 39 39 40 40 42 42 43 43 45 45 47 47
Level 1 certificate gained post-school
37 37 39 39 40 40 42 42 43 43 45 45 47 47
Overseas secondary school qualification
39 39 41 41 42 42 44 44 45 46 47 47 49 49
Level 3 or 4 certificate gained at school
43 43 45 45 46 46 48 48 50 49 51 51 53 53
Level 2 certificate gained at school
39 39 41 41 42 42 44 44 45 45 47 47 49 49
Level 1 certificate gained at school
35 35 37 37 38 38 40 40 41 41 43 43 45 44
No school qualifications 31 30 32 32 34 34 36 36 37 37 39 38 40 40
Note: Un – unadjusted Adj – adjusted
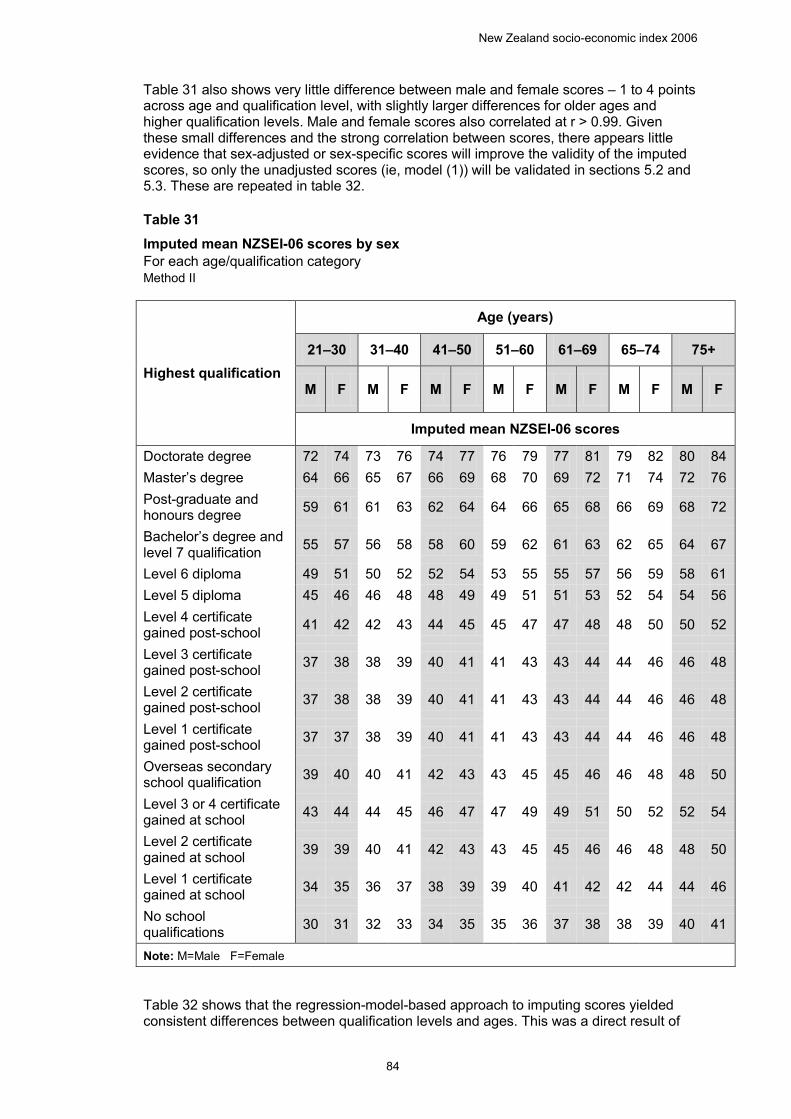
New Zealand socio-economic index 2006
84
Table 31 also shows very little difference between male and female scores – 1 to 4 points across age and qualification level, with slightly larger differences for older ages and higher qualification levels. Male and female scores also correlated at r > 0.99. Given these small differences and the strong correlation between scores, there appears little evidence that sex-adjusted or sex-specific scores will improve the validity of the imputed scores, so only the unadjusted scores (ie, model (1)) will be validated in sections 5.2 and 5.3. These are repeated in table 32.
Table 31 Imputed mean NZSEI-06 scores by sex For each age/qualification category Method II 31 Imputed mean NZSEI-06 scores by sex, for each age/qualification category, method II
Highest qualification
Age (years)
21–30 31–40 41–50 51–60 61–69 65–74 75+
M F M F M F M F M F M F M F
Imputed mean NZSEI-06 scores
Doctorate degree 72 74 73 76 74 77 76 79 77 81 79 82 80 84 Master’s degree 64 66 65 67 66 69 68 70 69 72 71 74 72 76 Post-graduate and honours degree 59 61 61 63 62 64 64 66 65 68 66 69 68 72
Bachelor’s degree and level 7 qualification 55 57 56 58 58 60 59 62 61 63 62 65 64 67
Level 6 diploma 49 51 50 52 52 54 53 55 55 57 56 59 58 61 Level 5 diploma 45 46 46 48 48 49 49 51 51 53 52 54 54 56 Level 4 certificate gained post-school 41 42 42 43 44 45 45 47 47 48 48 50 50 52
Level 3 certificate gained post-school 37 38 38 39 40 41 41 43 43 44 44 46 46 48
Level 2 certificate gained post-school 37 38 38 39 40 41 41 43 43 44 44 46 46 48
Level 1 certificate gained post-school 37 37 38 39 40 41 41 43 43 44 44 46 46 48
Overseas secondary school qualification 39 40 40 41 42 43 43 45 45 46 46 48 48 50
Level 3 or 4 certificate gained at school 43 44 44 45 46 47 47 49 49 51 50 52 52 54
Level 2 certificate gained at school 39 39 40 41 42 43 43 45 45 46 46 48 48 50
Level 1 certificate gained at school 34 35 36 37 38 39 39 40 41 42 42 44 44 46
No school qualifications 30 31 32 33 34 35 35 36 37 38 38 39 40 41
Note: M=Male F=Female
Table 32 shows that the regression-model-based approach to imputing scores yielded consistent differences between qualification levels and ages. This was a direct result of
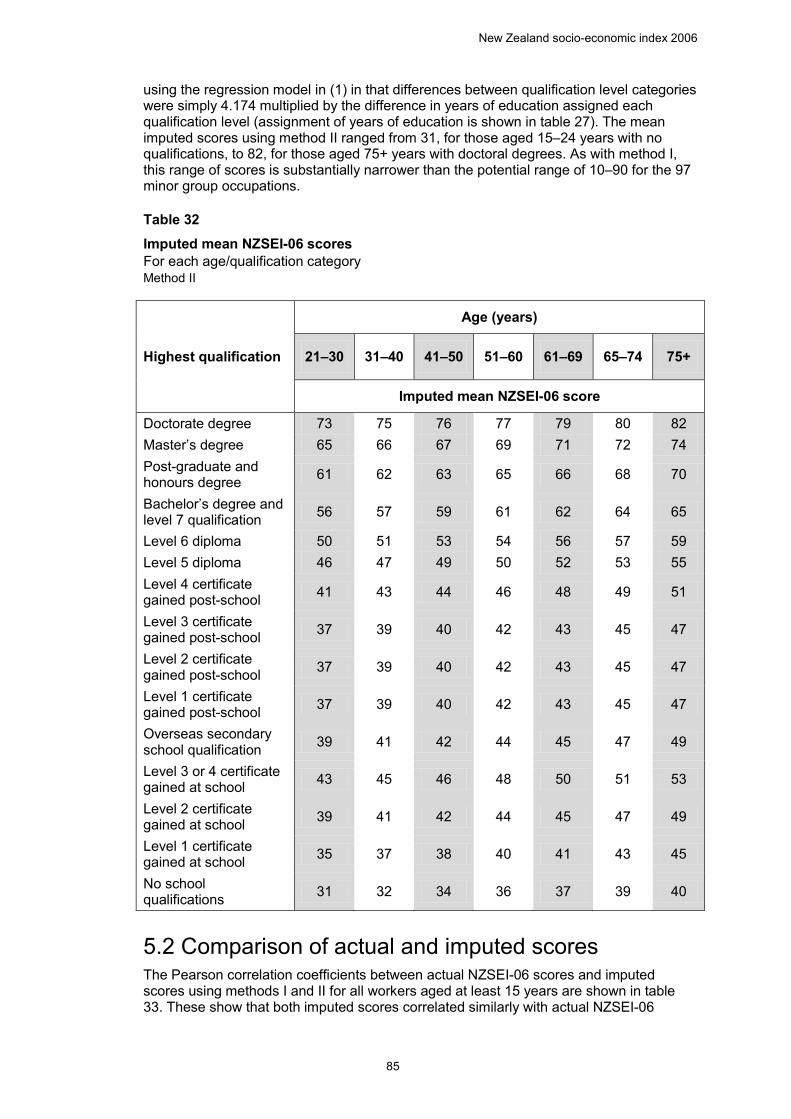
New Zealand socio-economic index 2006
85
using the regression model in (1) in that differences between qualification level categories were simply 4.174 multiplied by the difference in years of education assigned each qualification level (assignment of years of education is shown in table 27). The mean imputed scores using method II ranged from 31, for those aged 15–24 years with no qualifications, to 82, for those aged 75+ years with doctoral degrees. As with method I, this range of scores is substantially narrower than the potential range of 10–90 for the 97 minor group occupations.
Table 32 Imputed mean NZSEI-06 scores For each age/qualification category Method II 32 Imputed mean NZSEI-06 score, for each age/qualification category, method II
Highest qualification
Age (years)
21–30 31–40 41–50 51–60 61–69 65–74 75+
Imputed mean NZSEI-06 score
Doctorate degree 73 75 76 77 79 80 82 Master’s degree 65 66 67 69 71 72 74 Post-graduate and honours degree 61 62 63 65 66 68 70
Bachelor’s degree and level 7 qualification 56 57 59 61 62 64 65
Level 6 diploma 50 51 53 54 56 57 59 Level 5 diploma 46 47 49 50 52 53 55 Level 4 certificate gained post-school 41 43 44 46 48 49 51
Level 3 certificate gained post-school 37 39 40 42 43 45 47
Level 2 certificate gained post-school 37 39 40 42 43 45 47
Level 1 certificate gained post-school 37 39 40 42 43 45 47
Overseas secondary school qualification 39 41 42 44 45 47 49
Level 3 or 4 certificate gained at school 43 45 46 48 50 51 53
Level 2 certificate gained at school 39 41 42 44 45 47 49
Level 1 certificate gained at school 35 37 38 40 41 43 45
No school qualifications 31 32 34 36 37 39 40
5.2 Comparison of actual and imputed scores The Pearson correlation coefficients between actual NZSEI-06 scores and imputed scores using methods I and II for all workers aged at least 15 years are shown in table 33. These show that both imputed scores correlated similarly with actual NZSEI-06
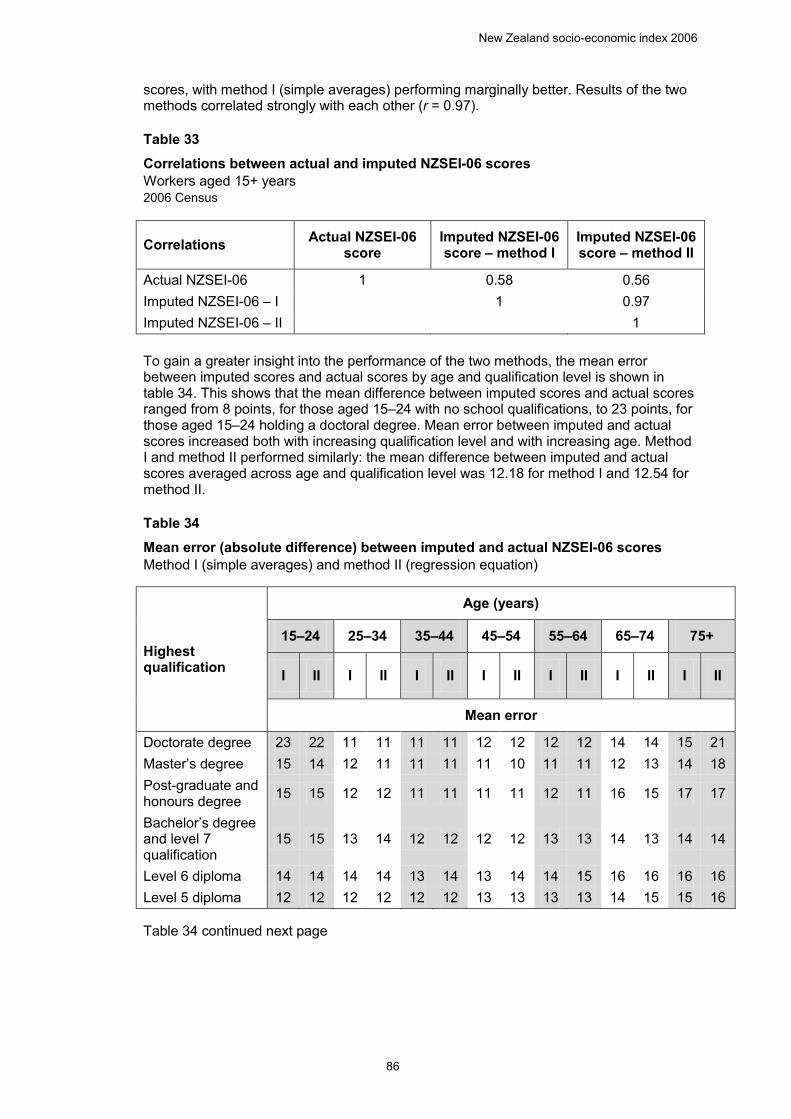
New Zealand socio-economic index 2006
86
scores, with method I (simple averages) performing marginally better. Results of the two methods correlated strongly with each other (r = 0.97).
Table 33 Correlations between actual and imputed NZSEI-06 scores Workers aged 15+ years 2006 Census 33 Correlations between actual and imputed NZSEI-06 scores, workers ages 15+ years, 2006 Census
Correlations Actual NZSEI-06 score
Imputed NZSEI-06 score – method I
Imputed NZSEI-06 score – method II
Actual NZSEI-06 1 0.58 0.56 Imputed NZSEI-06 – I 1 0.97 Imputed NZSEI-06 – II 1
To gain a greater insight into the performance of the two methods, the mean error between imputed scores and actual scores by age and qualification level is shown in table 34. This shows that the mean difference between imputed scores and actual scores ranged from 8 points, for those aged 15–24 with no school qualifications, to 23 points, for those aged 15–24 holding a doctoral degree. Mean error between imputed and actual scores increased both with increasing qualification level and with increasing age. Method I and method II performed similarly: the mean difference between imputed and actual scores averaged across age and qualification level was 12.18 for method I and 12.54 for method II.
Table 34 Mean error (absolute difference) between imputed and actual NZSEI-06 scores Method I (simple averages) and method II (regression equation) 34 Mean error (absolute difference) between imputed and actual NZSEI-06 scores, method I (simple averages) and method II (regression equation)
Highest qualification
Age (years)
15–24 25–34 35–44 45–54 55–64 65–74 75+
I II I II I II I II I II I II I II
Mean error
Doctorate degree 23 22 11 11 11 11 12 12 12 12 14 14 15 21 Master’s degree 15 14 12 11 11 11 11 10 11 11 12 13 14 18 Post-graduate and honours degree 15 15 12 12 11 11 11 11 12 11 16 15 17 17
Bachelor’s degree and level 7 qualification
15 15 13 14 12 12 12 12 13 13 14 13 14 14
Level 6 diploma 14 14 14 14 13 14 13 14 14 15 16 16 16 16 Level 5 diploma 12 12 12 12 12 12 13 13 13 13 14 15 15 16
Table 34 continued next page
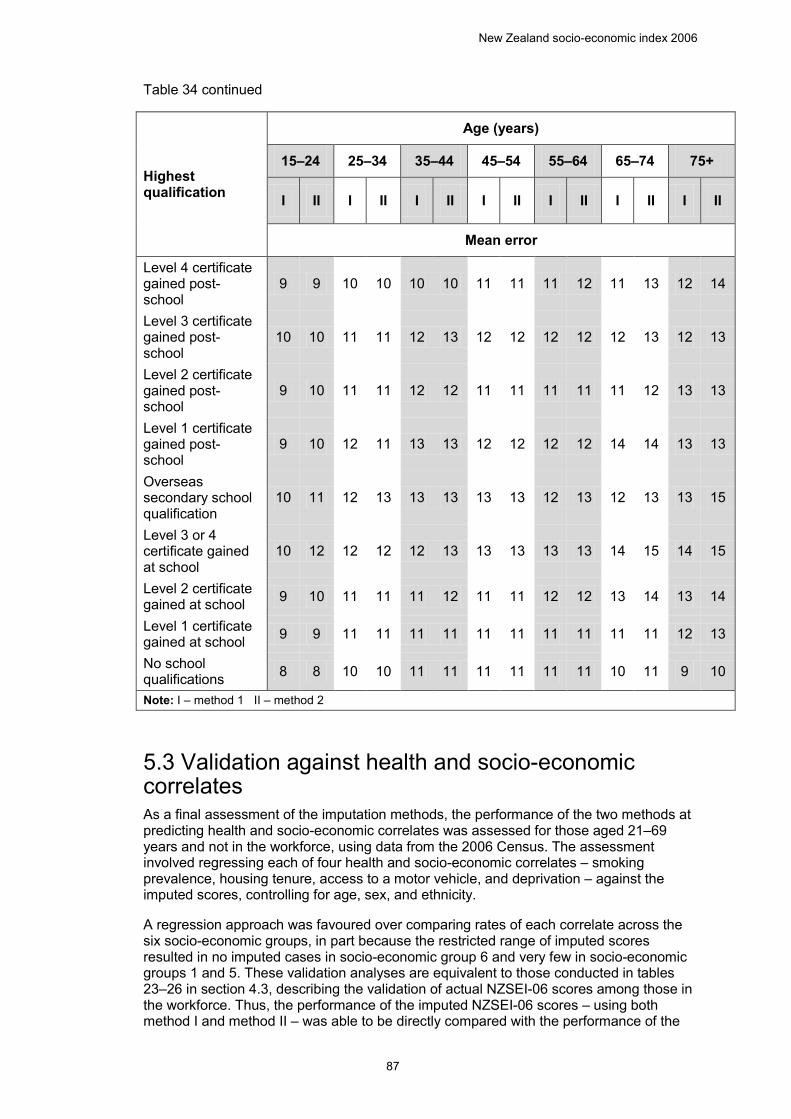
New Zealand socio-economic index 2006
87
Table 34 continued
Highest qualification
Age (years)
15–24 25–34 35–44 45–54 55–64 65–74 75+
I II I II I II I II I II I II I II
Mean error
Level 4 certificate gained post-school
9 9 10 10 10 10 11 11 11 12 11 13 12 14
Level 3 certificate gained post-school
10 10 11 11 12 13 12 12 12 12 12 13 12 13
Level 2 certificate gained post-school
9 10 11 11 12 12 11 11 11 11 11 12 13 13
Level 1 certificate gained post-school
9 10 12 11 13 13 12 12 12 12 14 14 13 13
Overseas secondary school qualification
10 11 12 13 13 13 13 13 12 13 12 13 13 15
Level 3 or 4 certificate gained at school
10 12 12 12 12 13 13 13 13 13 14 15 14 15
Level 2 certificate gained at school 9 10 11 11 11 12 11 11 12 12 13 14 13 14
Level 1 certificate gained at school 9 9 11 11 11 11 11 11 11 11 11 11 12 13
No school qualifications 8 8 10 10 11 11 11 11 11 11 10 11 9 10
Note: I – method 1 II – method 2
5.3 Validation against health and socio-economic correlates As a final assessment of the imputation methods, the performance of the two methods at predicting health and socio-economic correlates was assessed for those aged 21–69 years and not in the workforce, using data from the 2006 Census. The assessment involved regressing each of four health and socio-economic correlates – smoking prevalence, housing tenure, access to a motor vehicle, and deprivation – against the imputed scores, controlling for age, sex, and ethnicity.
A regression approach was favoured over comparing rates of each correlate across the six socio-economic groups, in part because the restricted range of imputed scores resulted in no imputed cases in socio-economic group 6 and very few in socio-economic groups 1 and 5. These validation analyses are equivalent to those conducted in tables 23–26 in section 4.3, describing the validation of actual NZSEI-06 scores among those in the workforce. Thus, the performance of the imputed NZSEI-06 scores – using both method I and method II – was able to be directly compared with the performance of the
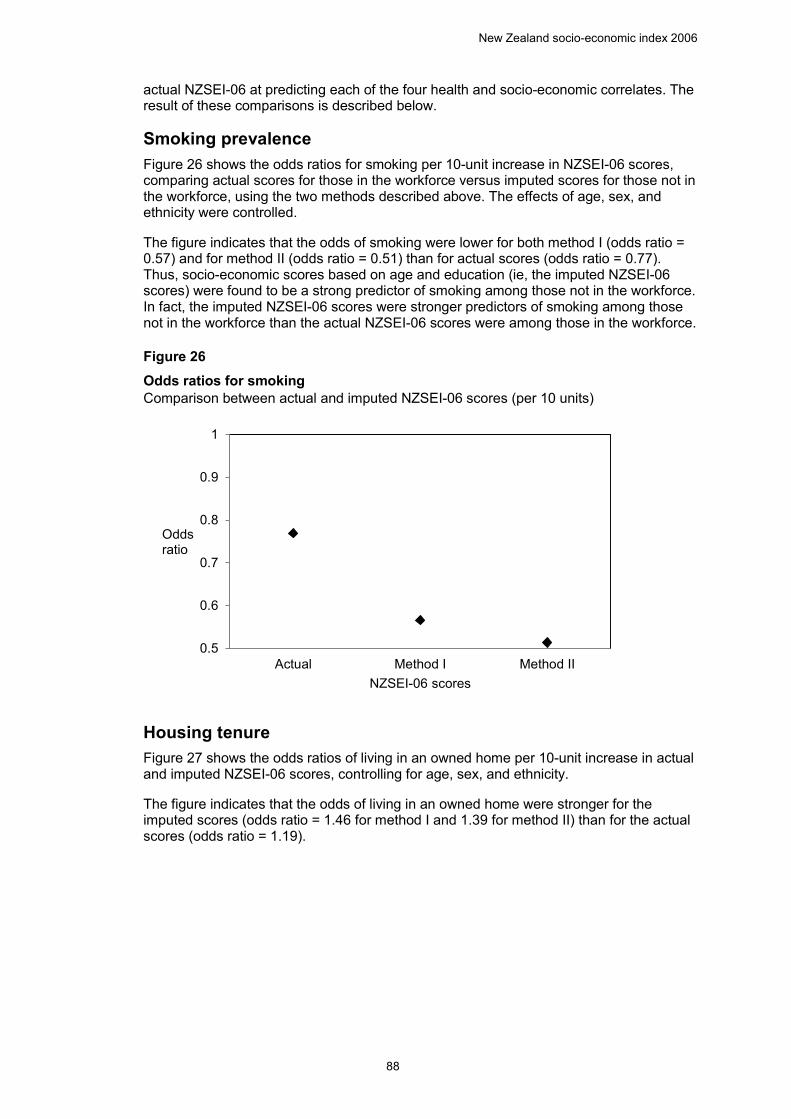
New Zealand socio-economic index 2006
88
actual NZSEI-06 at predicting each of the four health and socio-economic correlates. The result of these comparisons is described below.
Smoking prevalence Figure 26 shows the odds ratios for smoking per 10-unit increase in NZSEI-06 scores, comparing actual scores for those in the workforce versus imputed scores for those not in the workforce, using the two methods described above. The effects of age, sex, and ethnicity were controlled.
The figure indicates that the odds of smoking were lower for both method I (odds ratio = 0.57) and for method II (odds ratio = 0.51) than for actual scores (odds ratio = 0.77). Thus, socio-economic scores based on age and education (ie, the imputed NZSEI-06 scores) were found to be a strong predictor of smoking among those not in the workforce. In fact, the imputed NZSEI-06 scores were stronger predictors of smoking among those not in the workforce than the actual NZSEI-06 scores were among those in the workforce.
Figure 26 Odds ratios for smoking Comparison between actual and imputed NZSEI-06 scores (per 10 units) 26 Odds ratios for smoking, comparison between actual and imputed NZSEI-06 scores (per 10 units)
Housing tenure Figure 27 shows the odds ratios of living in an owned home per 10-unit increase in actual and imputed NZSEI-06 scores, controlling for age, sex, and ethnicity.
The figure indicates that the odds of living in an owned home were stronger for the imputed scores (odds ratio = 1.46 for method I and 1.39 for method II) than for the actual scores (odds ratio = 1.19).
0.5
0.6
0.7
0.8
0.9
1
Actual Method I Method II
Oddsratio
NZSEI-06 scores
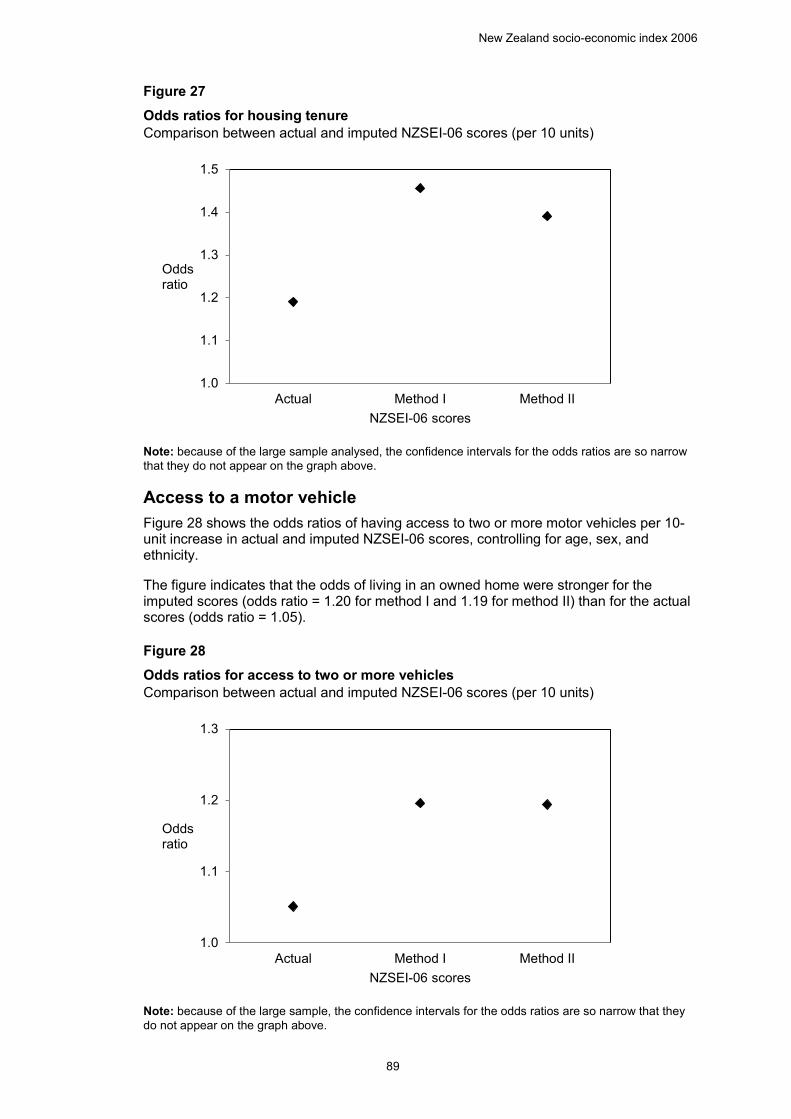
New Zealand socio-economic index 2006
89
Figure 27 Odds ratios for housing tenure Comparison between actual and imputed NZSEI-06 scores (per 10 units) 27 Odds ratio for housing tenure, comparison between actual and imputed NZSEI-06 scores (per 10 units)
Note: because of the large sample analysed, the confidence intervals for the odds ratios are so narrow that they do not appear on the graph above.
Access to a motor vehicle Figure 28 shows the odds ratios of having access to two or more motor vehicles per 10-unit increase in actual and imputed NZSEI-06 scores, controlling for age, sex, and ethnicity.
The figure indicates that the odds of living in an owned home were stronger for the imputed scores (odds ratio = 1.20 for method I and 1.19 for method II) than for the actual scores (odds ratio = 1.05).
Figure 28 Odds ratios for access to two or more vehicles Comparison between actual and imputed NZSEI-06 scores (per 10 units) 28 Odds ratio for access to two or more vehicles, comparison between actual and imputed NZSEI-06 scores (per 10 units)
Note: because of the large sample, the confidence intervals for the odds ratios are so narrow that they do not appear on the graph above.
1.0
1.1
1.2
1.3
1.4
1.5
Actual Method I Method II
Oddsratio
NZSEI-06 scores
1.0
1.1
1.2
1.3
Actual Method I Method II
Oddsratio
NZSEI-06 scores
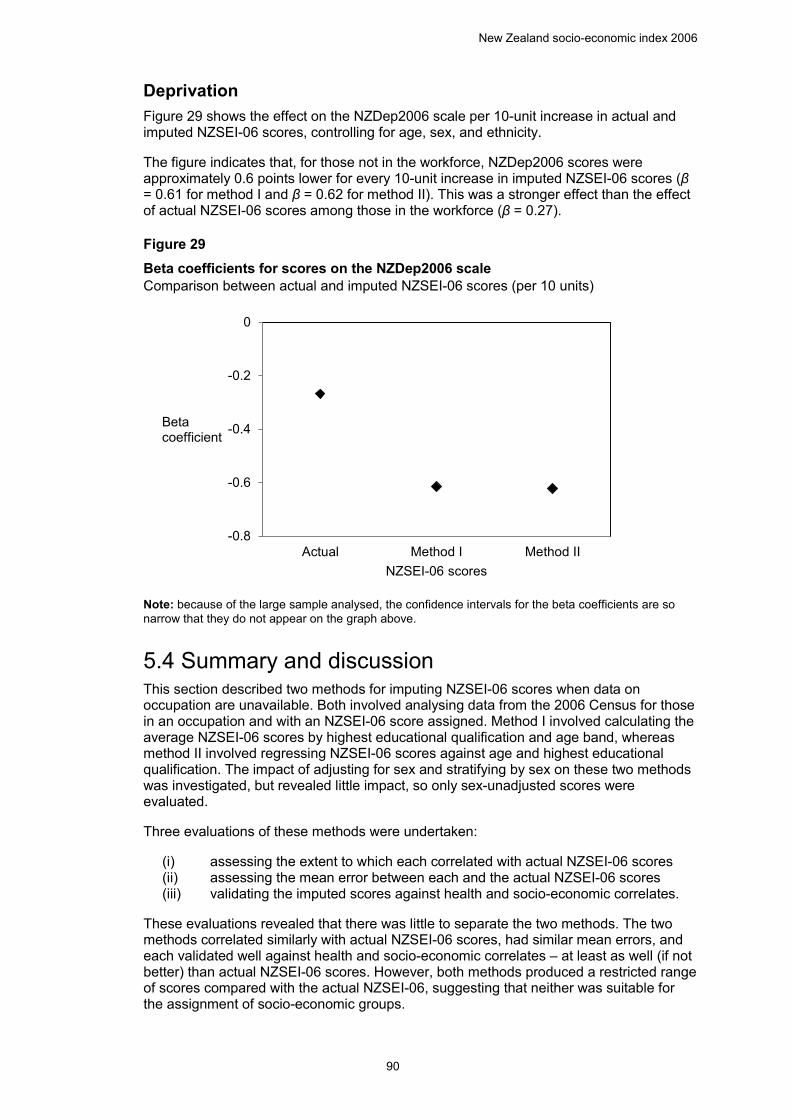
New Zealand socio-economic index 2006
90
Deprivation Figure 29 shows the effect on the NZDep2006 scale per 10-unit increase in actual and imputed NZSEI-06 scores, controlling for age, sex, and ethnicity.
The figure indicates that, for those not in the workforce, NZDep2006 scores were approximately 0.6 points lower for every 10-unit increase in imputed NZSEI-06 scores (β = 0.61 for method I and β = 0.62 for method II). This was a stronger effect than the effect of actual NZSEI-06 scores among those in the workforce (β = 0.27).
Figure 29 Beta coefficients for scores on the NZDep2006 scale Comparison between actual and imputed NZSEI-06 scores (per 10 units) 29 Beta coefficients for scores on the NZDep2006 scale, comparison between actual and imputed NZSEI-06 scores (per 10 units)
Note: because of the large sample analysed, the confidence intervals for the beta coefficients are so narrow that they do not appear on the graph above.
5.4 Summary and discussion This section described two methods for imputing NZSEI-06 scores when data on occupation are unavailable. Both involved analysing data from the 2006 Census for those in an occupation and with an NZSEI-06 score assigned. Method I involved calculating the average NZSEI-06 scores by highest educational qualification and age band, whereas method II involved regressing NZSEI-06 scores against age and highest educational qualification. The impact of adjusting for sex and stratifying by sex on these two methods was investigated, but revealed little impact, so only sex-unadjusted scores were evaluated.
Three evaluations of these methods were undertaken:
(i) assessing the extent to which each correlated with actual NZSEI-06 scores (ii) assessing the mean error between each and the actual NZSEI-06 scores (iii) validating the imputed scores against health and socio-economic correlates.
These evaluations revealed that there was little to separate the two methods. The two methods correlated similarly with actual NZSEI-06 scores, had similar mean errors, and each validated well against health and socio-economic correlates – at least as well (if not better) than actual NZSEI-06 scores. However, both methods produced a restricted range of scores compared with the actual NZSEI-06, suggesting that neither was suitable for the assignment of socio-economic groups.
-0.8
-0.6
-0.4
-0.2
0
Actual Method I Method II
Beta coefficient
NZSEI-06 scores

New Zealand socio-economic index 2006
91
In the absence of other evidence to choose between them, and in the absence of other ‘proxy’-information, such as previous occupation, the simplicity of method I (simple averages) makes it the preferred approach.
92
6 Conclusion
This report detailed the construction of NZSEI-06, an occupation-based measure of socio-economic status, derived using data from the 2006 Census. NZSEI-06 assigned scores from 10 (lowest) to 90 (highest) for each minor group (three-digit) occupation in New Zealand according to ANZSCO.
The algorithm used to derive NZSEI-06 scores was based on a path-analytic representation of the ‘returns to human capital’ model of stratification, in which occupation is viewed as the means by which human capital (education) is converted into material rewards (income).
NZSEI-06 produced similar scores to the previous NZSEI-96. NZSEI-06 also produced very similar scores to AUSEI06, a socio-economic scale for the Australian workforce which was derived in a similar way to NZSEI-06 and classified occupations using the same classification system (ANZSCO) as New Zealand. NZSEI-06 validated well against a number of health and socio-economic correlates for both sexes and also for four major ethnic groups: European and Other (including New Zealander), Māori, Pacific, and Asian.
Like previous versions of NZSEI (eg, NZSEI-96), the scale was first developed for the full-time workforce, and part-time workers were added after ‘equivalising’ their income to a full-time equivalent. The full scale (including part-time workers) was very similar to the scale including the full-time workforce only, with no large rank-order changes among occupations.
Also like previous versions, a method was suggested for imputing NZSEI-06 scores for those not in the workforce. The favoured method involved assigning scores based on the mean NZSEI-06 scores for each age and educational qualification group. Factoring sex into the imputation was found to have little impact on imputed scores, so the imputed scores suggested for use were unadjusted for sex. It was also suggested that categorisation should not be used for imputed scores (eg for those not in the workforce) because the restricted range of the imputed scores results in some categories having few or no cases.
A number of differences between NZSEI-06 and its predecessors should be noted. First, unlike previous versions of NZSEI (eg, NZSEI-96), an attempt was made to ‘centre’ the scale, so that the mean of scores was around 50 (ie half-way between 10 and 90). This was achieved with some degree of success by applying a square-root transformation of the original scores (mean of the final NZSEI-06 scale = 46.5).
Second, unlike previous versions of NZSEI (eg, NZSEI-96) and similar international scales (eg AUSEI06), the incomes of self-employed workers were not adjusted to account for under-estimation, as there was little evidence for any under-estimation. In fact, self-employed workers reported higher incomes for the majority of occupation groups.
Third, the path coefficients relating education to occupational socio-economic status (SES) and occupational SES to income were quite different for NZSEI-06 compared with the previous NZSEI-96 and NZSEI-91. Indeed, while for NZSEI-96 and NZSEI-91 the path coefficient relating education to occupational SES was about one third the magnitude of the path coefficient relating occupational SES to income, for NZSEI-06 the magnitudes were reversed: the path coefficient relating education to occupational SES was nearly double the magnitude of the path coefficient relating occupational SES to income. While the reason for the differences in path coefficients between NZSEI-06 and the previous scales is unclear, it is notable that the relative magnitude of the path coefficients for NZSEI-06 are more in line with international scales (eg, AUSEI06 and the ISEI-88, see McMillan et al, 2009).
New Zealand socio-economic index 2006
93
Fourth, NZSEI-06 was validated for a wider range of ethnic groups than the Māori versus non-Māori comparison that previous NZSEI versions had undertaken. In general, NZSEI-06 validated well for each of the four ethnic groups studied: European and Other (including New Zealander), Māori, Pacific, and Asian.
An interesting finding from part of this validation was the anomalous association between education and income for those identifying as Asian. That is, while Asian workers were twice as likely to hold a degree compared with every other ethnic group, nearly two-thirds reported incomes less than the median. This warrants further investigation, perhaps testing the extent to which this is a migrant effect (many of the qualifications attained by Asian workers may have been attained outside of New Zealand) or to what extent language and cultural barriers have a role to play. It would also be interesting to see whether this pattern persists in 2013, when the next census was held.
A more detailed breakdown of ethnicity might also be warranted in 2013, particularly if numbers are sufficient to analyse the ‘Middle Eastern, Latin American and African’ category, and if there are sufficient numbers in the ‘Other’ category who do not identify ‘New Zealander’ as their ethnicity. Note that the ‘New Zealander’ ethnic group formed the vast majority (>95 percent) of the ‘Other’ ethnic category among 21–69-year-old workers in the 2006 Census, which was the primary reason for combining this ethnic group with the ‘New Zealand European’ ethnic group to form the ‘European and Other (including New Zealander)’ ethnic group.
Fifth, cluster and discriminant function analysis were not used to determine cut-points for dividing the continuous NZSEI-06 scale into categories, as had been used in the previous NZSEI-96. Instead, ‘convenience’ cut-points were chosen so that a reasonable proportion of the population was in each category. This approach was taken because NZSEI-06 was constructed to be a uni-dimensional scale (from 10–90), so there was no good reason to suspect that there would be discreet groupings of occupations. Three groupings were suggested:
• a six-group classification, in line with the historic Elley and Irving scale (eg, Elley and Irving, 1972; 1976; 1985; 2003; Irving and Elley, 1977)
• a four-group classification representing quartiles
• a 10-group classification representing deciles, to enable direct comparisons with the NZDep deciles.
6.1 Advantages of NZSEI-06 as a measure of socio-economic status There are several advantages of NZSEI-06. First, occupation is readily and accurately recalled. It is not subject to stigma with reporting, or a tendency to misreport (as, for example, income may be in some instances (Davis and Smith, 1994)).
Second, occupation can be retrospectively recalled with some accuracy (Hauser and Warren, 1997). Thus, it may be possible (and preferable) to assess the socio-economic status of individuals in late-aged or retired samples by asking about their main occupation during their working years.
Third, occupation is often recorded in survey datasets, especially in the socio-economic and sociological fields, and also on administrative datasets (eg, birth and death records). Against this, recent health surveys in New Zealand have tended to neglect the collection of occupation data.
Fourth, as the validation exercise showed, NZSEI-06 is a robust measure of socio-economic status in that it produces expected stratification patterns across smoking prevalence and across three socio-economic correlates.
New Zealand socio-economic index 2006
94
Fifth, NZSEI-06 has a sound theoretical basis – the ‘returns to human capital model’ – that has been used and validated previously in New Zealand and elsewhere (Davis et al, 1997; 2003; Ganzeboom et al, 1992; McMillan et al, 2009).
Sixth, because NZSEI-06 uses a similar methodology to other scales developed internationally, this provides opportunities for international comparisons.
Seventh, New Zealand has a long history of occupation-based socio-economic measures that have been frequently updated, and an even longer history of collecting information on occupation. This enables socio-economic comparisons over time to be undertaken, and for cohort samples to have socio-economic status to be assessed at different life-stages using the ‘current’ occupation-based socio-economic measure.
6.2 Limitations of NZSEI-06 NZSEI-06 has its limitations. First, it requires occupational information. A significant proportion of the population is not currently employed, and unless further steps are taken to collect such information – for example, previous occupation – NZSEI-06 cannot be directly estimated. An ‘imputed’ score, based on the age and education of respondents, has been suggested as a way to assign scores to those without any information on occupation, but previous occupation or ‘main’ occupation during working life may be preferable for some individuals (eg, retirees). Note that in some cases it may be justified to use the occupation of a proxy person to assess socio-economic status (eg, for children).
Second, even if occupational information is available, it is often difficult to classify with accuracy to the minor group (three-digit) level of ANZSCO, which is required for NZSEI-06. Steps can be taken to help with the collection and classification of occupations (see appendix V), but if insufficient detail is provided to the coder there is little that can be done. Where there is insufficient detail to code to the minor group level, it may sometimes be possible to classify to the major (one-digit) or sub-major (two-digit) group level, and NZSEI-06 scores can be assigned for these classifications (see appendix III).
Third, NZSEI-06 only classifies occupations to the minor group level of ANZSCO, and it is likely that there is a great deal of socio-economic heterogeneity among occupations grouped at this level. Thus, while it would make the task of occupational coding more difficult, it is possible that more accurate socio-economic scores could be obtained if NZSEI-06 was developed for occupations coded at the unit group (four-digit) or group (six-digit) level.
Fourth, there is likely to be socio-economic heterogeneity among individuals who have the same occupation, regardless of the level of categorisation. Unfortunately, this cannot be captured by NZSEI-06, which groups individuals according to their occupation.
6.3 Future work Further work still remains to be done with NZSEI-06. First, the validation work, while promising, only encompasses one health indicator and three socio-economic indicators. An assessment of NZSEI-06 against a wider range of indicators is required, though a different data source – other than the census – would be needed.
Second, given the interest in the socio-economic patterning of children’s outcomes – particularly in the area of health (eg, Mortensen, Helweg-Larsen, & Andersen, 2011) – the validity of NZSEI-06 as it applies to children also needs to be explored. As suggested above, the scores assigned to children will necessarily have to be derived from a proxy (eg, a parent, or perhaps the combined scores of two parents or the household).
New Zealand socio-economic index 2006
95
Third, since the basic unit of socio-economic structure is often the household rather than the individual, a framework for placing the household at the centre of socio-economic index construction needs to be developed.
Finally, given that researchers have a number of different options for assessing socio-economic status in New Zealand (eg, New Zealand deprivation index (NZDep), New Zealand index of socio-economic deprivation for individuals (NZiDep), education, income, living standards, as well as NZSEI-06) it would be worthwhile to assess the extent to which these different measures have independent, as opposed to shared, influences on outcomes of interest.
96
7 References
Australian Bureau of Statistics & Statistics NZ (2006). ANZSCO – Australian and New Zealand Standard Classification of Occupations, first edition. Canberra: Australian Bureau of Statistics. Available from www.abs.gov.au.
Baker, PS (1993). Taxpayer compliance of the self-employed: estimates from household spending data. Working Paper 93/14 London: Institute for Fiscal Studies.
Bradbury, B (1997). The living standards of the low income self-employed. Australian Economic Review 30(4), 374–389.
Crampton, P, Salmond, C, & Sutton, F (1997). Research report no 5: NZDep91 index of deprivation. Wellington: Health Services Research Centre.
Davis, JA, & Smith, TW (1994). General Social Surveys 1972–1994; cumulative codebook. Chicago: National Opinion Research Centre.
Davis, P, McLeod, K, Ransom, M, & Ongley, P (1997). The New Zealand socio-economic index of occupational status (NZSEI). (Research report no. 2). Wellington: Statistics NZ.
Davis, P, Jenkin, G, & Coope, P (2003). The New Zealand socio-economic index 1996. An update and revision of the New Zealand socio-economic index of occupational status. Wellington: Statistics NZ.
De-Leeuw, J (1989). Multivariate analysis with linearizable regressions. Psychometrika 53(4), 437–454.
Department of Statistics (1992). New Zealand Standard Classification of Occupations 1990. Wellington: Department of Statistics.
Elley, WB, & Irving, JC (1972). A socio-economic index for New Zealand based on levels of education and income from the 1966 Census. New Zealand Journal of Educational Studies 2(2), 153–157.
Elley, WB, & Irving, JC (1976). Revised socio-economic index for New Zealand. New Zealand Journal of Educational Studies 11(1), 25–36.
Elley, WB, & Irving, JC (1985). The Elley-Irving socio-economic index 1981 Census revision. New Zealand Journal of Educational Studies 20(2), 115–128.
Elley, WB, & Irving, JC (2003). The Elley-Irving socio-economic index: 2001 Census revision. New Zealand Journal of Educational Studies 38(1), 3–17.
Galbraith, C, Jenkin, G, Davis, P, & Coope, P (2003). New Zealand socio-economic index 1996 users’ guide. Wellington: Statistics NZ.
Ganzeboom, H, De-Graaf, P, Treiman, D, & De-Leeuw, J (1992). A standard international socioeconomic index of occupational status. Social Science Research 21(1), 1–56.
Ganzeboom, H, & Treiman, D (1996). Internationally comparable measures of occupational status for the 1988 International Standard Classification of Occupations. Social Science Research 25(3), 201–239.
Hauser, RM, & Warren, JR (1997). Socioeconomic indices for occupation: A review, update, and critique. Sociological Methodology 27, 177–298.
Irving, JC, & Elley, WB (1977). A socioeconomic index for the female labour force in New Zealand. New Zealand Journal of Educational Studies 34, 86–98.
New Zealand socio-economic index 2006
97
Jones, F & McMillan, J (2001). Scoring occupational categories for social research: A review of current practice, with Australian examples. Work, Employment and Society 15(3): 539–564.
McMillan, J, Beavis, A, & Jones, FL (2009). The AUSEI06. A new socioeconomic index for Australia. Journal of Sociology 45, 123–49.
Metcalf, PA, Scragg, RRK, Schaaf, D, Dyall, L, Black, PN, & Jackson, RT (2008). Comparison of different markers of socioeconomic status with cardiovascular disease and diabetes risk factors in the Diabetes, Heart and Health Survey. New Zealand Medical Journal, 121(1269), 45–56.
Ministry of Health. (2008). A portrait of health: Key results of the 2006/07 New Zealand Health Survey. Wellington: Ministry of Health.
Mortensen, LH, Helweg-Larsen, K, & Andersen, AM (2011). Socioeconomic differences in perinatal health and disease. Scandinavian Journal of Public Health 39(7 Suppl),110–4.
Parker, SC (1997). The distribution of self-employment income in the United Kingdom, 1976–1991. The Economic Journal 107(441), 455–466.
Pissarides, CA, & Weber, G (1989). An expenditure-based estimate of Britain's black economy. Journal of Public Economics 39(1), 17–32.
Salmond, C, Crampton, P, & Sutton, F (1998). Research report No 8, NZDep96 index of deprivation. Wellington: Health Services Research Centre.
Salmond, C, & Crampton, P (2002). NZDep2001 index of deprivation. Wellington: Department of Public Health: School of Medicine and Health Sciences.
Salmond, C, Crampton, P, & Atkinson, J (2007). NZDep2006 index of deprivation. Wellington: Ministry of Health.
Statistics NZ (1995). New Zealand Standard Classification of Occupations 1995. Wellington: Statistics NZ.
Statistics NZ (2007). Guidelines for using ethnicity data: 2006 Census. Wellington: Statistics NZ.
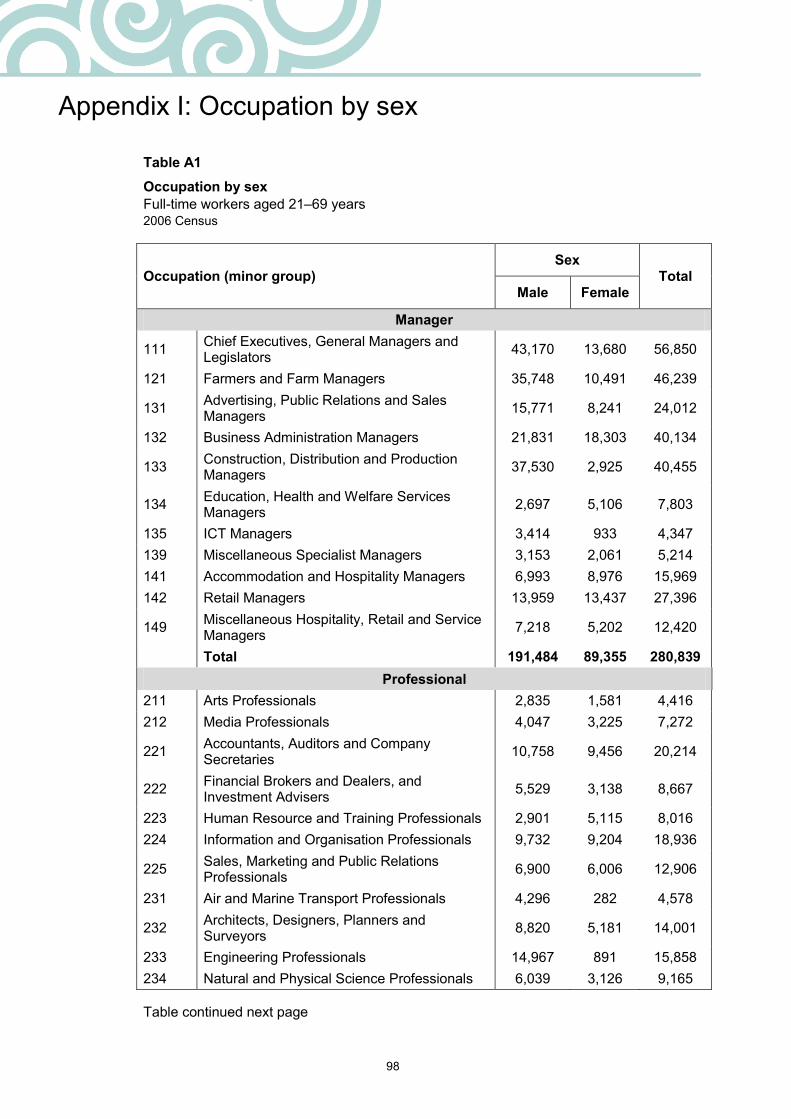
98
Appendix I: Occupation by sex
Table A1 Occupation by sex Full-time workers aged 21–69 years 2006 Census A1 Occupation by sex, full-time workers aged 21–69 years, 2006 Census
Occupation (minor group) Sex
Total Male Female
Manager
111 Chief Executives, General Managers and Legislators 43,170 13,680 56,850
121 Farmers and Farm Managers 35,748 10,491 46,239
131 Advertising, Public Relations and Sales Managers 15,771 8,241 24,012
132 Business Administration Managers 21,831 18,303 40,134
133 Construction, Distribution and Production Managers 37,530 2,925 40,455
134 Education, Health and Welfare Services Managers 2,697 5,106 7,803
135 ICT Managers 3,414 933 4,347 139 Miscellaneous Specialist Managers 3,153 2,061 5,214 141 Accommodation and Hospitality Managers 6,993 8,976 15,969 142 Retail Managers 13,959 13,437 27,396
149 Miscellaneous Hospitality, Retail and Service Managers 7,218 5,202 12,420
Total 191,484 89,355 280,839
Professional 211 Arts Professionals 2,835 1,581 4,416 212 Media Professionals 4,047 3,225 7,272
221 Accountants, Auditors and Company Secretaries 10,758 9,456 20,214
222 Financial Brokers and Dealers, and Investment Advisers 5,529 3,138 8,667
223 Human Resource and Training Professionals 2,901 5,115 8,016 224 Information and Organisation Professionals 9,732 9,204 18,936
225 Sales, Marketing and Public Relations Professionals 6,900 6,006 12,906
231 Air and Marine Transport Professionals 4,296 282 4,578
232 Architects, Designers, Planners and Surveyors 8,820 5,181 14,001
233 Engineering Professionals 14,967 891 15,858 234 Natural and Physical Science Professionals 6,039 3,126 9,165
Table continued next page
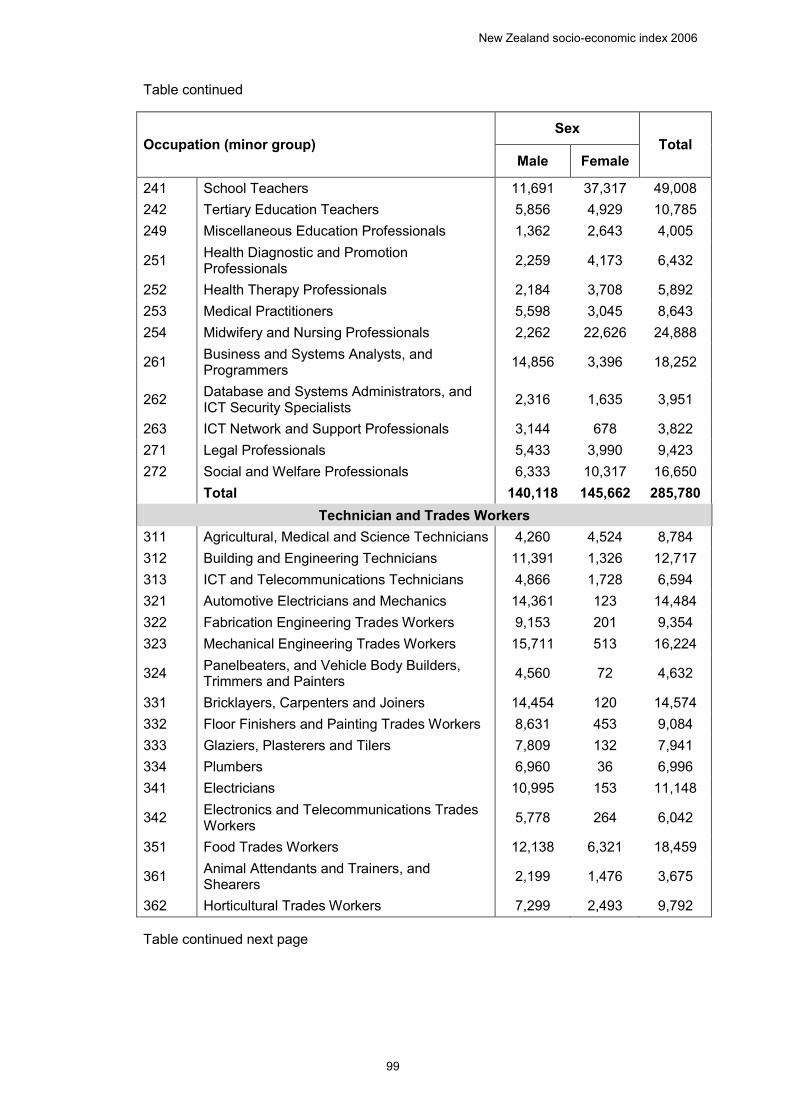
New Zealand socio-economic index 2006
99
Table continued
Occupation (minor group) Sex
Total Male Female
241 School Teachers 11,691 37,317 49,008 242 Tertiary Education Teachers 5,856 4,929 10,785 249 Miscellaneous Education Professionals 1,362 2,643 4,005
251 Health Diagnostic and Promotion Professionals 2,259 4,173 6,432
252 Health Therapy Professionals 2,184 3,708 5,892 253 Medical Practitioners 5,598 3,045 8,643 254 Midwifery and Nursing Professionals 2,262 22,626 24,888
261 Business and Systems Analysts, and Programmers 14,856 3,396 18,252
262 Database and Systems Administrators, and ICT Security Specialists 2,316 1,635 3,951
263 ICT Network and Support Professionals 3,144 678 3,822 271 Legal Professionals 5,433 3,990 9,423 272 Social and Welfare Professionals 6,333 10,317 16,650
Total 140,118 145,662 285,780
Technician and Trades Workers 311 Agricultural, Medical and Science Technicians 4,260 4,524 8,784 312 Building and Engineering Technicians 11,391 1,326 12,717 313 ICT and Telecommunications Technicians 4,866 1,728 6,594 321 Automotive Electricians and Mechanics 14,361 123 14,484 322 Fabrication Engineering Trades Workers 9,153 201 9,354 323 Mechanical Engineering Trades Workers 15,711 513 16,224
324 Panelbeaters, and Vehicle Body Builders, Trimmers and Painters 4,560 72 4,632
331 Bricklayers, Carpenters and Joiners 14,454 120 14,574 332 Floor Finishers and Painting Trades Workers 8,631 453 9,084 333 Glaziers, Plasterers and Tilers 7,809 132 7,941 334 Plumbers 6,960 36 6,996 341 Electricians 10,995 153 11,148
342 Electronics and Telecommunications Trades Workers 5,778 264 6,042
351 Food Trades Workers 12,138 6,321 18,459
361 Animal Attendants and Trainers, and Shearers 2,199 1,476 3,675
362 Horticultural Trades Workers 7,299 2,493 9,792
Table continued next page
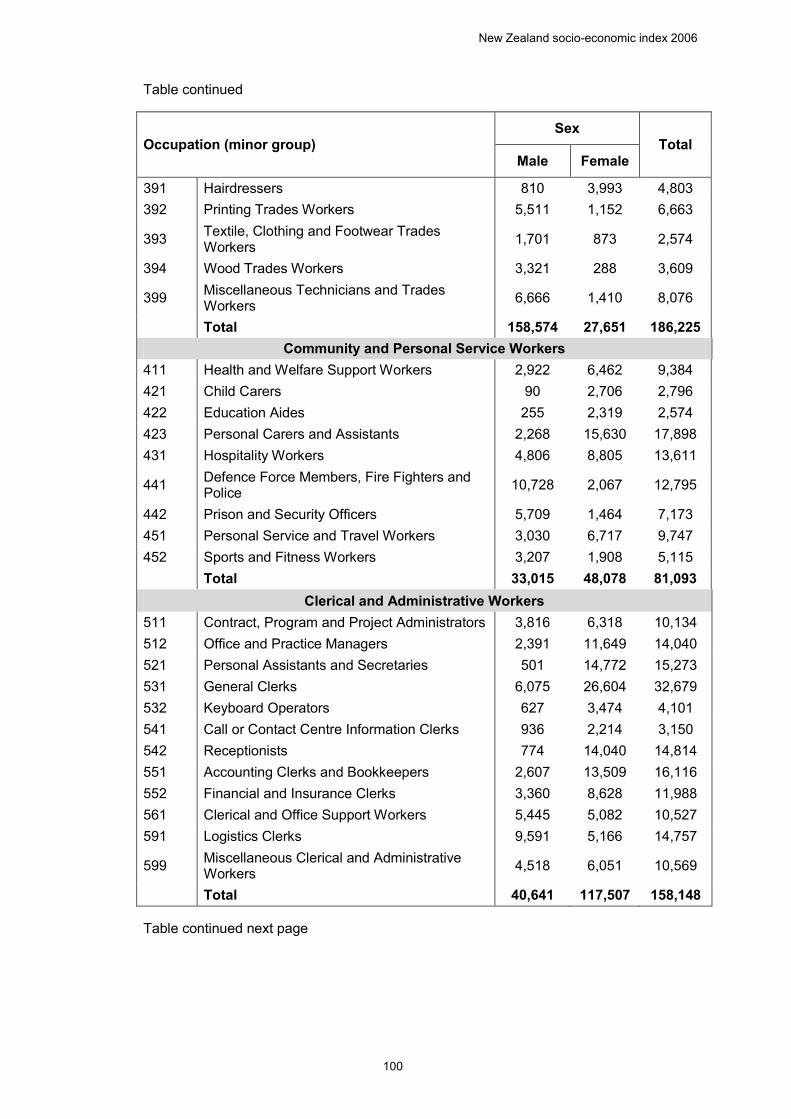
New Zealand socio-economic index 2006
100
Table continued
Occupation (minor group) Sex
Total Male Female
391 Hairdressers 810 3,993 4,803 392 Printing Trades Workers 5,511 1,152 6,663
393 Textile, Clothing and Footwear Trades Workers 1,701 873 2,574
394 Wood Trades Workers 3,321 288 3,609
399 Miscellaneous Technicians and Trades Workers 6,666 1,410 8,076
Total 158,574 27,651 186,225
Community and Personal Service Workers 411 Health and Welfare Support Workers 2,922 6,462 9,384 421 Child Carers 90 2,706 2,796 422 Education Aides 255 2,319 2,574 423 Personal Carers and Assistants 2,268 15,630 17,898 431 Hospitality Workers 4,806 8,805 13,611
441 Defence Force Members, Fire Fighters and Police 10,728 2,067 12,795
442 Prison and Security Officers 5,709 1,464 7,173 451 Personal Service and Travel Workers 3,030 6,717 9,747 452 Sports and Fitness Workers 3,207 1,908 5,115
Total 33,015 48,078 81,093
Clerical and Administrative Workers 511 Contract, Program and Project Administrators 3,816 6,318 10,134 512 Office and Practice Managers 2,391 11,649 14,040 521 Personal Assistants and Secretaries 501 14,772 15,273 531 General Clerks 6,075 26,604 32,679 532 Keyboard Operators 627 3,474 4,101 541 Call or Contact Centre Information Clerks 936 2,214 3,150 542 Receptionists 774 14,040 14,814 551 Accounting Clerks and Bookkeepers 2,607 13,509 16,116 552 Financial and Insurance Clerks 3,360 8,628 11,988 561 Clerical and Office Support Workers 5,445 5,082 10,527 591 Logistics Clerks 9,591 5,166 14,757
599 Miscellaneous Clerical and Administrative Workers 4,518 6,051 10,569
Total 40,641 117,507 158,148
Table continued next page
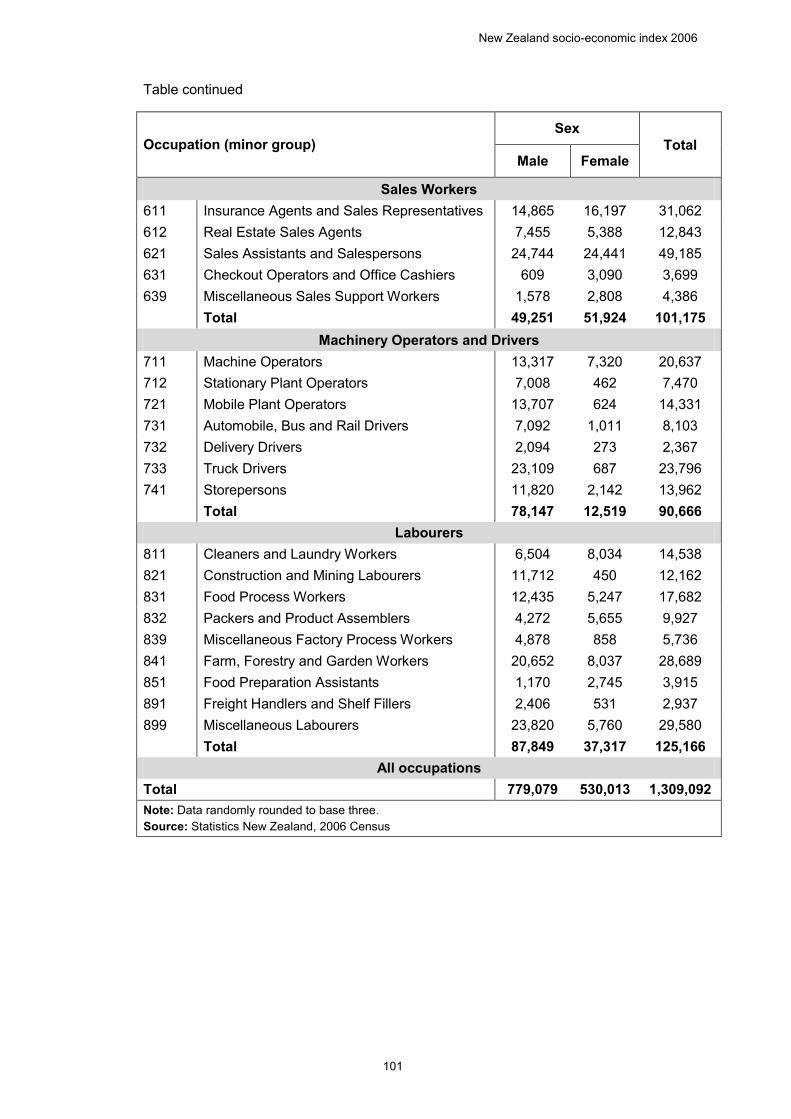
New Zealand socio-economic index 2006
101
Table continued
Occupation (minor group) Sex
Total Male Female
Sales Workers 611 Insurance Agents and Sales Representatives 14,865 16,197 31,062 612 Real Estate Sales Agents 7,455 5,388 12,843 621 Sales Assistants and Salespersons 24,744 24,441 49,185 631 Checkout Operators and Office Cashiers 609 3,090 3,699 639 Miscellaneous Sales Support Workers 1,578 2,808 4,386
Total 49,251 51,924 101,175
Machinery Operators and Drivers 711 Machine Operators 13,317 7,320 20,637 712 Stationary Plant Operators 7,008 462 7,470 721 Mobile Plant Operators 13,707 624 14,331 731 Automobile, Bus and Rail Drivers 7,092 1,011 8,103 732 Delivery Drivers 2,094 273 2,367 733 Truck Drivers 23,109 687 23,796 741 Storepersons 11,820 2,142 13,962
Total 78,147 12,519 90,666
Labourers 811 Cleaners and Laundry Workers 6,504 8,034 14,538 821 Construction and Mining Labourers 11,712 450 12,162 831 Food Process Workers 12,435 5,247 17,682 832 Packers and Product Assemblers 4,272 5,655 9,927 839 Miscellaneous Factory Process Workers 4,878 858 5,736 841 Farm, Forestry and Garden Workers 20,652 8,037 28,689 851 Food Preparation Assistants 1,170 2,745 3,915 891 Freight Handlers and Shelf Fillers 2,406 531 2,937 899 Miscellaneous Labourers 23,820 5,760 29,580
Total 87,849 37,317 125,166
All occupations Total 779,079 530,013 1,309,092 Note: Data randomly rounded to base three. Source: Statistics New Zealand, 2006 Census
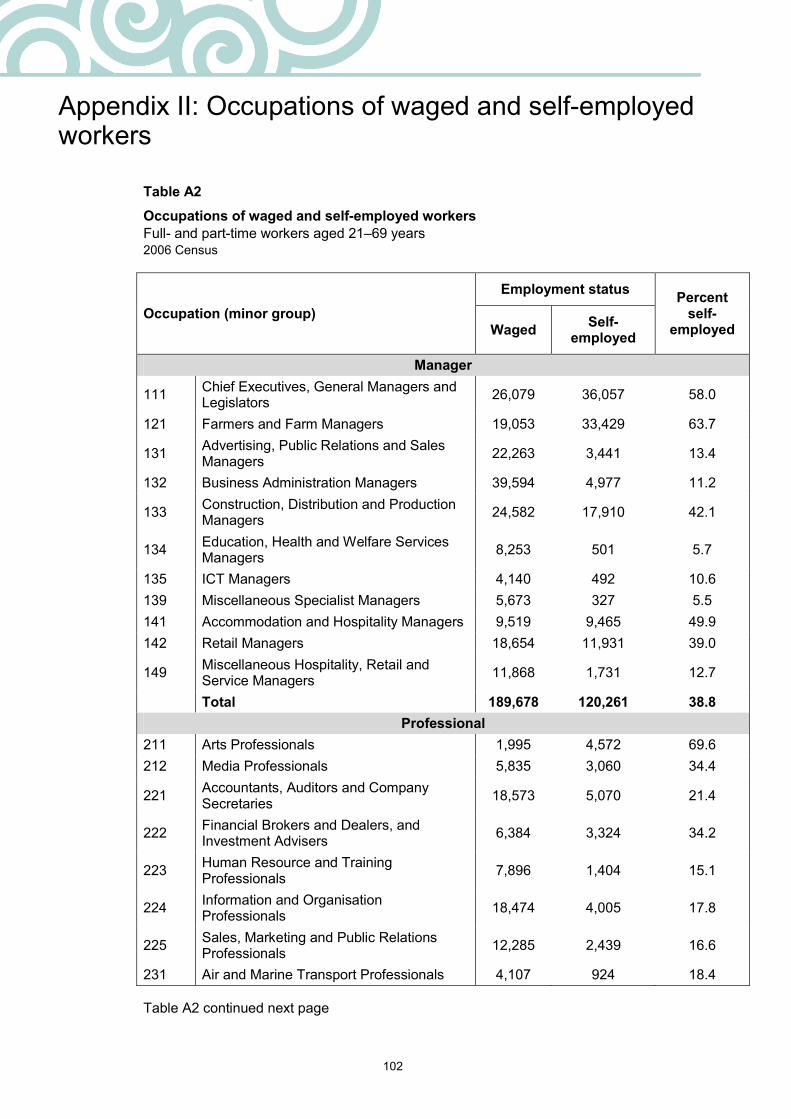
102
Appendix II: Occupations of waged and self-employed workers
Table A2 Occupations of waged and self-employed workers Full- and part-time workers aged 21–69 years 2006 Census A2 Occupations of waged and self-employed workers, full- and part-time workers aged 21–69 years, 2006 Census
Occupation (minor group) Employment status Percent
self-employed Waged Self-
employed
Manager
111 Chief Executives, General Managers and Legislators 26,079 36,057 58.0
121 Farmers and Farm Managers 19,053 33,429 63.7
131 Advertising, Public Relations and Sales Managers 22,263 3,441 13.4
132 Business Administration Managers 39,594 4,977 11.2
133 Construction, Distribution and Production Managers 24,582 17,910 42.1
134 Education, Health and Welfare Services Managers 8,253 501 5.7
135 ICT Managers 4,140 492 10.6 139 Miscellaneous Specialist Managers 5,673 327 5.5 141 Accommodation and Hospitality Managers 9,519 9,465 49.9 142 Retail Managers 18,654 11,931 39.0
149 Miscellaneous Hospitality, Retail and Service Managers 11,868 1,731 12.7
Total 189,678 120,261 38.8
Professional 211 Arts Professionals 1,995 4,572 69.6 212 Media Professionals 5,835 3,060 34.4
221 Accountants, Auditors and Company Secretaries 18,573 5,070 21.4
222 Financial Brokers and Dealers, and Investment Advisers 6,384 3,324 34.2
223 Human Resource and Training Professionals 7,896 1,404 15.1
224 Information and Organisation Professionals 18,474 4,005 17.8
225 Sales, Marketing and Public Relations Professionals 12,285 2,439 16.6
231 Air and Marine Transport Professionals 4,107 924 18.4
Table A2 continued next page
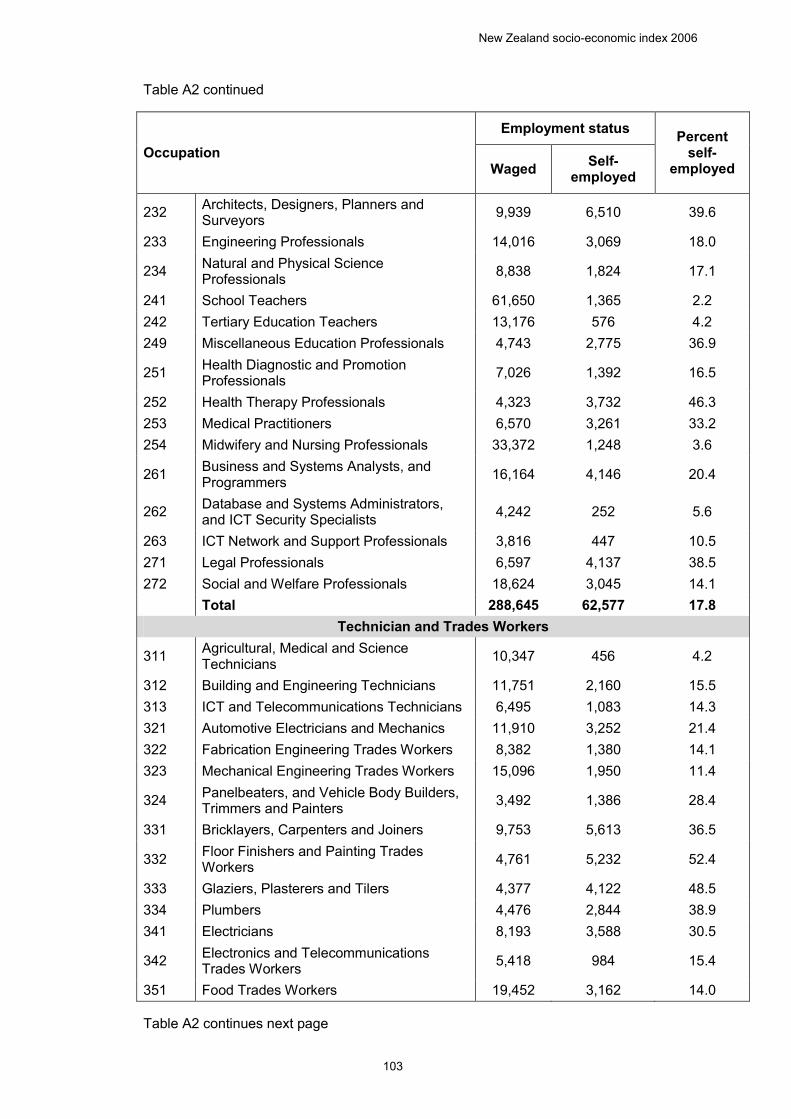
New Zealand socio-economic index 2006
103
Table A2 continued
Occupation Employment status Percent
self-employed Waged Self-
employed
232 Architects, Designers, Planners and Surveyors 9,939 6,510 39.6
233 Engineering Professionals 14,016 3,069 18.0
234 Natural and Physical Science Professionals 8,838 1,824 17.1
241 School Teachers 61,650 1,365 2.2 242 Tertiary Education Teachers 13,176 576 4.2 249 Miscellaneous Education Professionals 4,743 2,775 36.9
251 Health Diagnostic and Promotion Professionals 7,026 1,392 16.5
252 Health Therapy Professionals 4,323 3,732 46.3 253 Medical Practitioners 6,570 3,261 33.2 254 Midwifery and Nursing Professionals 33,372 1,248 3.6
261 Business and Systems Analysts, and Programmers 16,164 4,146 20.4
262 Database and Systems Administrators, and ICT Security Specialists 4,242 252 5.6
263 ICT Network and Support Professionals 3,816 447 10.5 271 Legal Professionals 6,597 4,137 38.5 272 Social and Welfare Professionals 18,624 3,045 14.1
Total 288,645 62,577 17.8
Technician and Trades Workers
311 Agricultural, Medical and Science Technicians 10,347 456 4.2
312 Building and Engineering Technicians 11,751 2,160 15.5 313 ICT and Telecommunications Technicians 6,495 1,083 14.3 321 Automotive Electricians and Mechanics 11,910 3,252 21.4 322 Fabrication Engineering Trades Workers 8,382 1,380 14.1 323 Mechanical Engineering Trades Workers 15,096 1,950 11.4
324 Panelbeaters, and Vehicle Body Builders, Trimmers and Painters 3,492 1,386 28.4
331 Bricklayers, Carpenters and Joiners 9,753 5,613 36.5
332 Floor Finishers and Painting Trades Workers 4,761 5,232 52.4
333 Glaziers, Plasterers and Tilers 4,377 4,122 48.5 334 Plumbers 4,476 2,844 38.9 341 Electricians 8,193 3,588 30.5
342 Electronics and Telecommunications Trades Workers 5,418 984 15.4
351 Food Trades Workers 19,452 3,162 14.0
Table A2 continues next page
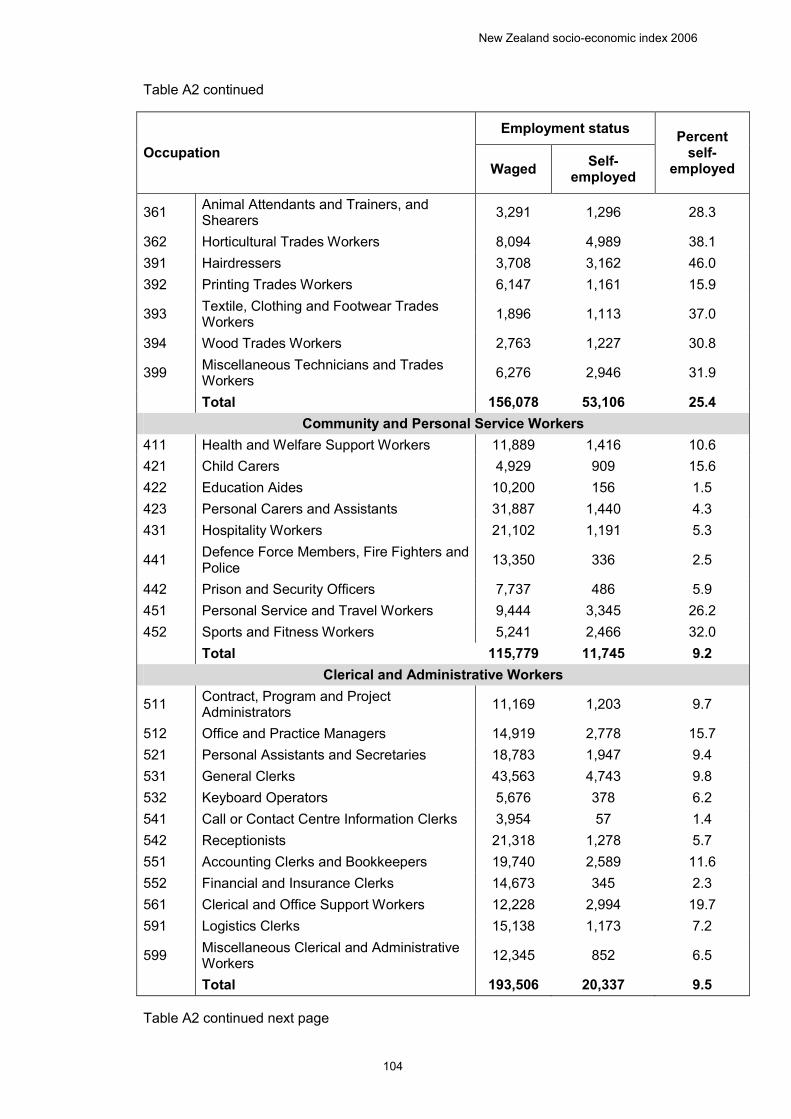
New Zealand socio-economic index 2006
104
Table A2 continued
Occupation Employment status Percent
self-employed Waged Self-
employed
361 Animal Attendants and Trainers, and Shearers 3,291 1,296 28.3
362 Horticultural Trades Workers 8,094 4,989 38.1 391 Hairdressers 3,708 3,162 46.0 392 Printing Trades Workers 6,147 1,161 15.9
393 Textile, Clothing and Footwear Trades Workers 1,896 1,113 37.0
394 Wood Trades Workers 2,763 1,227 30.8
399 Miscellaneous Technicians and Trades Workers 6,276 2,946 31.9
Total 156,078 53,106 25.4
Community and Personal Service Workers 411 Health and Welfare Support Workers 11,889 1,416 10.6 421 Child Carers 4,929 909 15.6 422 Education Aides 10,200 156 1.5 423 Personal Carers and Assistants 31,887 1,440 4.3 431 Hospitality Workers 21,102 1,191 5.3
441 Defence Force Members, Fire Fighters and Police 13,350 336 2.5
442 Prison and Security Officers 7,737 486 5.9 451 Personal Service and Travel Workers 9,444 3,345 26.2 452 Sports and Fitness Workers 5,241 2,466 32.0
Total 115,779 11,745 9.2
Clerical and Administrative Workers
511 Contract, Program and Project Administrators 11,169 1,203 9.7
512 Office and Practice Managers 14,919 2,778 15.7 521 Personal Assistants and Secretaries 18,783 1,947 9.4 531 General Clerks 43,563 4,743 9.8 532 Keyboard Operators 5,676 378 6.2 541 Call or Contact Centre Information Clerks 3,954 57 1.4 542 Receptionists 21,318 1,278 5.7 551 Accounting Clerks and Bookkeepers 19,740 2,589 11.6 552 Financial and Insurance Clerks 14,673 345 2.3 561 Clerical and Office Support Workers 12,228 2,994 19.7 591 Logistics Clerks 15,138 1,173 7.2
599 Miscellaneous Clerical and Administrative Workers 12,345 852 6.5
Total 193,506 20,337 9.5
Table A2 continued next page
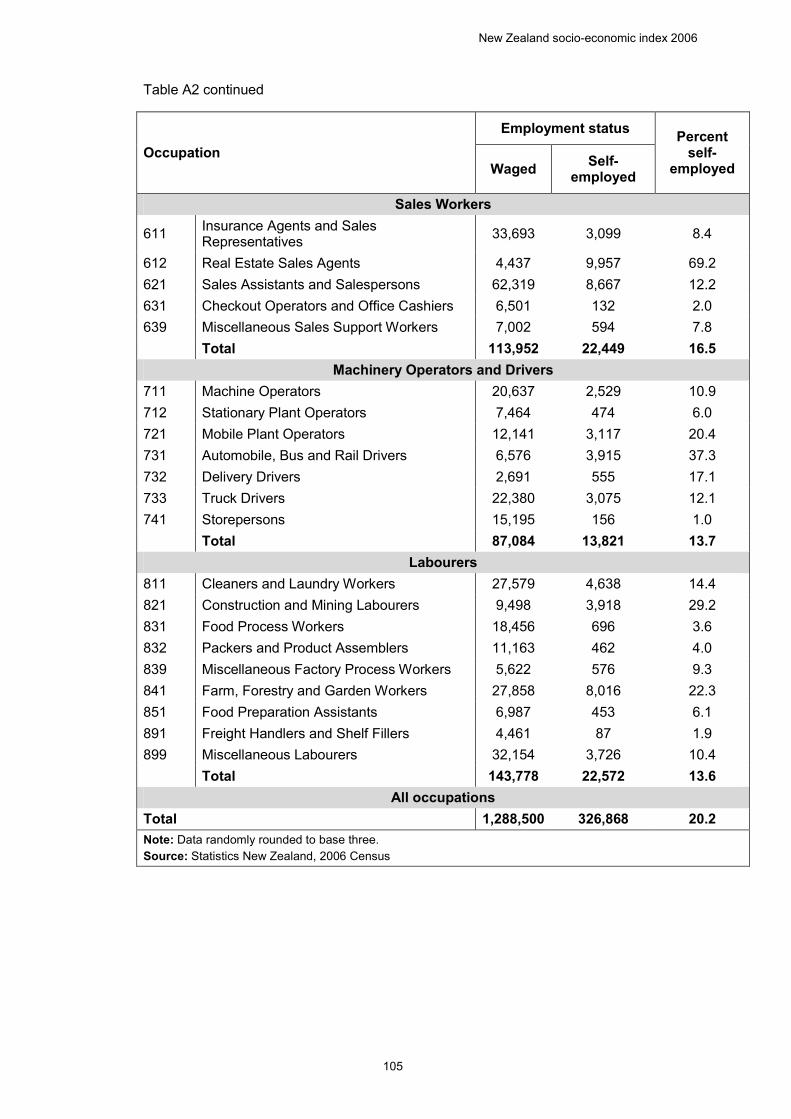
New Zealand socio-economic index 2006
105
Table A2 continued
Occupation Employment status Percent
self-employed Waged Self-
employed
Sales Workers
611 Insurance Agents and Sales Representatives 33,693 3,099 8.4
612 Real Estate Sales Agents 4,437 9,957 69.2 621 Sales Assistants and Salespersons 62,319 8,667 12.2 631 Checkout Operators and Office Cashiers 6,501 132 2.0 639 Miscellaneous Sales Support Workers 7,002 594 7.8
Total 113,952 22,449 16.5
Machinery Operators and Drivers 711 Machine Operators 20,637 2,529 10.9 712 Stationary Plant Operators 7,464 474 6.0 721 Mobile Plant Operators 12,141 3,117 20.4 731 Automobile, Bus and Rail Drivers 6,576 3,915 37.3 732 Delivery Drivers 2,691 555 17.1 733 Truck Drivers 22,380 3,075 12.1 741 Storepersons 15,195 156 1.0
Total 87,084 13,821 13.7
Labourers 811 Cleaners and Laundry Workers 27,579 4,638 14.4 821 Construction and Mining Labourers 9,498 3,918 29.2 831 Food Process Workers 18,456 696 3.6 832 Packers and Product Assemblers 11,163 462 4.0 839 Miscellaneous Factory Process Workers 5,622 576 9.3 841 Farm, Forestry and Garden Workers 27,858 8,016 22.3 851 Food Preparation Assistants 6,987 453 6.1 891 Freight Handlers and Shelf Fillers 4,461 87 1.9 899 Miscellaneous Labourers 32,154 3,726 10.4
Total 143,778 22,572 13.6
All occupations Total 1,288,500 326,868 20.2 Note: Data randomly rounded to base three. Source: Statistics New Zealand, 2006 Census
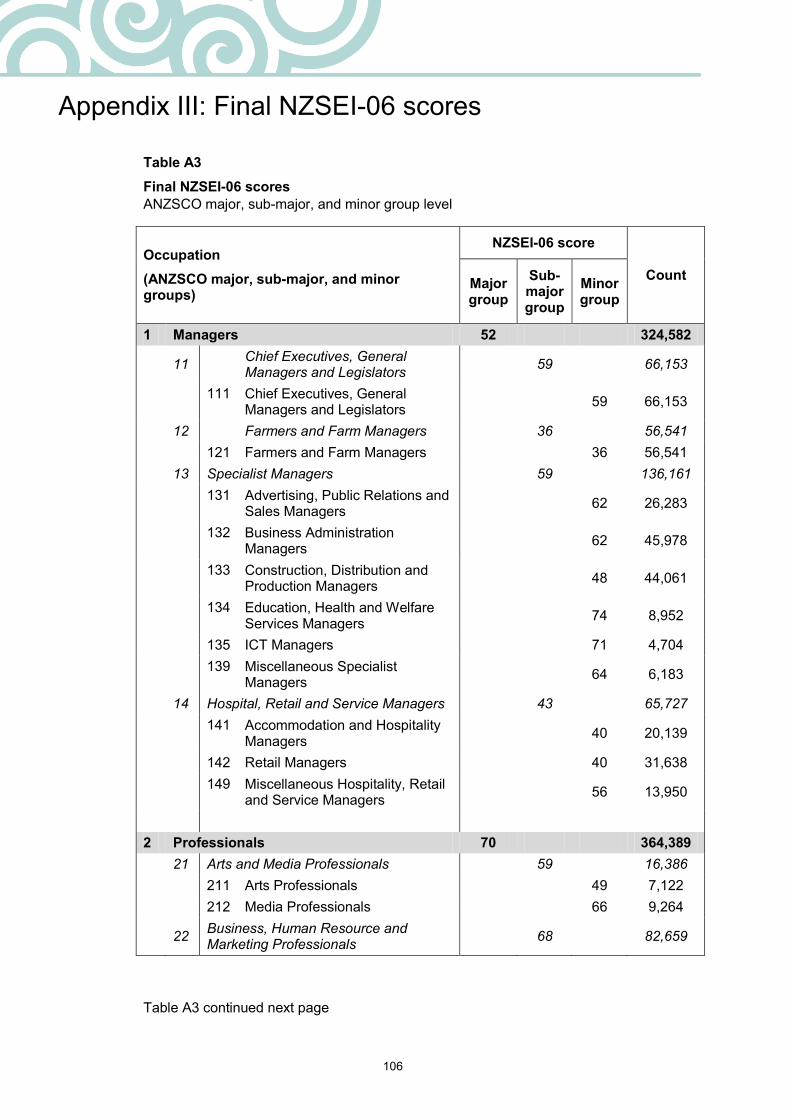
106
Appendix III: Final NZSEI-06 scores
Table A3 Final NZSEI-06 scores ANZSCO major, sub-major, and minor group level A3 Final NZSEI-06 scores, ANZSCO major, sub-major, and minor group level
Occupation (ANZSCO major, sub-major, and minor groups)
NZSEI-06 score
Count Major group
Sub-major group
Minor group
1 Managers 52 324,582
11 Chief Executives, General Managers and Legislators 59 66,153
111 Chief Executives, General Managers and Legislators 59 66,153
12 Farmers and Farm Managers 36 56,541 121 Farmers and Farm Managers 36 56,541 13 Specialist Managers 59 136,161
131 Advertising, Public Relations and Sales Managers 62 26,283
132 Business Administration Managers 62 45,978
133 Construction, Distribution and Production Managers 48 44,061
134 Education, Health and Welfare Services Managers 74 8,952
135 ICT Managers 71 4,704
139 Miscellaneous Specialist Managers 64 6,183
14 Hospital, Retail and Service Managers 43 65,727
141 Accommodation and Hospitality Managers 40 20,139
142 Retail Managers 40 31,638
149 Miscellaneous Hospitality, Retail and Service Managers 56 13,950
2 Professionals 70 364,389 21 Arts and Media Professionals 59 16,386 211 Arts Professionals 49 7,122 212 Media Professionals 66 9,264
22 Business, Human Resource and Marketing Professionals 68 82,659
Table A3 continued next page
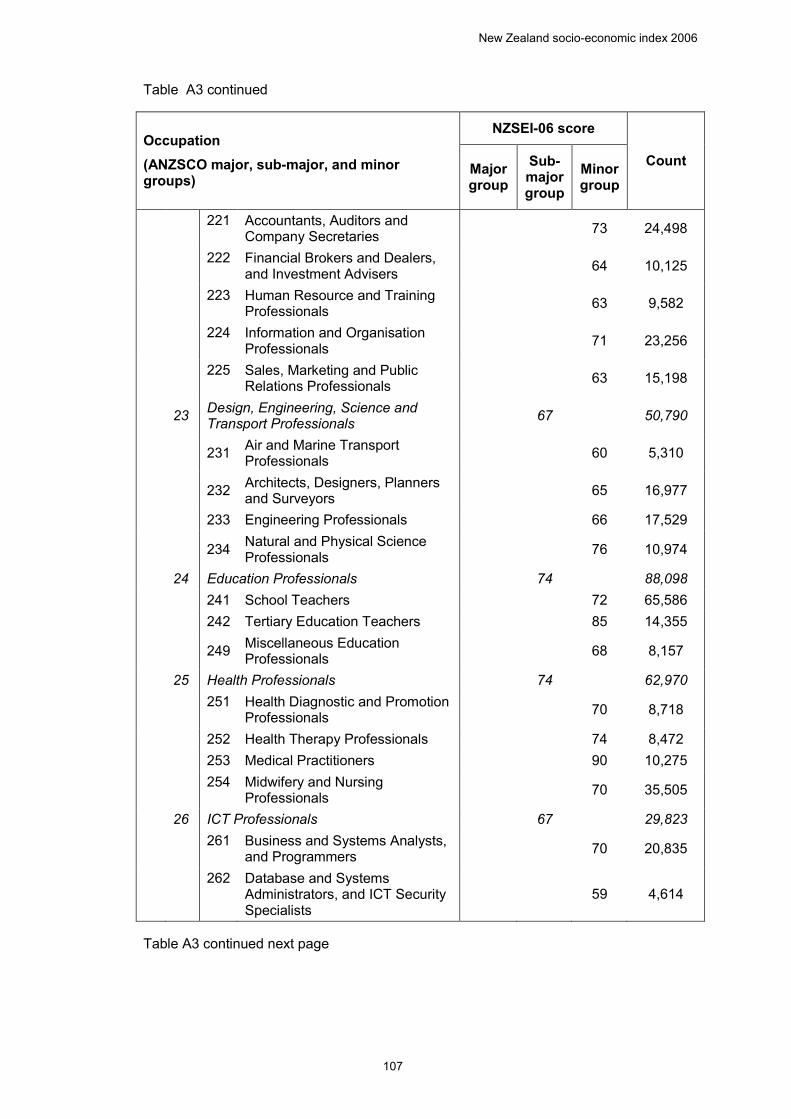
New Zealand socio-economic index 2006
107
Table A3 continued
Occupation (ANZSCO major, sub-major, and minor groups)
NZSEI-06 score
Count Major group
Sub-major group
Minor group
221 Accountants, Auditors and Company Secretaries 73 24,498
222 Financial Brokers and Dealers, and Investment Advisers 64 10,125
223 Human Resource and Training Professionals 63 9,582
224 Information and Organisation Professionals 71 23,256
225 Sales, Marketing and Public Relations Professionals 63 15,198
23 Design, Engineering, Science and Transport Professionals 67 50,790
231 Air and Marine Transport Professionals 60 5,310
232 Architects, Designers, Planners and Surveyors 65 16,977
233 Engineering Professionals 66 17,529
234 Natural and Physical Science Professionals 76 10,974
24 Education Professionals 74 88,098 241 School Teachers 72 65,586 242 Tertiary Education Teachers 85 14,355
249 Miscellaneous Education Professionals 68 8,157
25 Health Professionals 74 62,970
251 Health Diagnostic and Promotion Professionals 70 8,718
252 Health Therapy Professionals 74 8,472 253 Medical Practitioners 90 10,275
254 Midwifery and Nursing Professionals 70 35,505
26 ICT Professionals 67 29,823
261 Business and Systems Analysts, and Programmers 70 20,835
262 Database and Systems
Administrators, and ICT Security Specialists
59 4,614
Table A3 continued next page
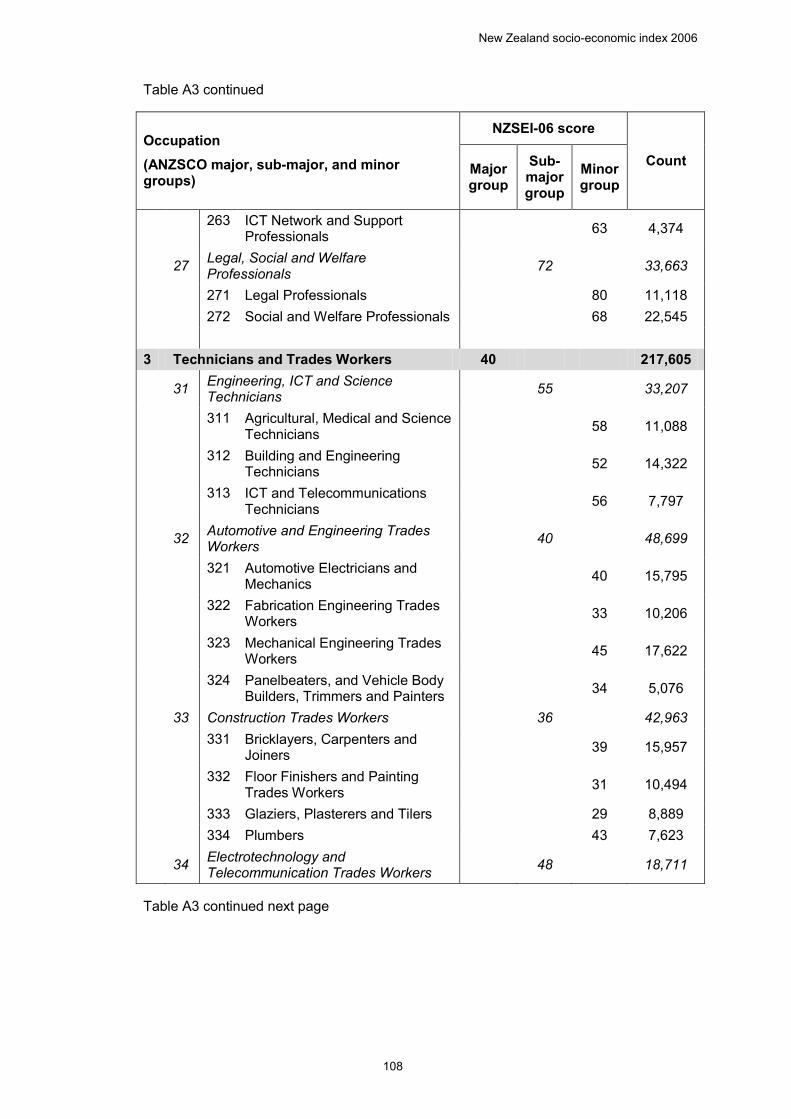
New Zealand socio-economic index 2006
108
Table A3 continued
Occupation (ANZSCO major, sub-major, and minor groups)
NZSEI-06 score
Count Major group
Sub-major group
Minor group
263 ICT Network and Support Professionals 63 4,374
27 Legal, Social and Welfare Professionals 72 33,663
271 Legal Professionals 80 11,118 272 Social and Welfare Professionals 68 22,545 3 Technicians and Trades Workers 40 217,605
31 Engineering, ICT and Science Technicians 55 33,207
311 Agricultural, Medical and Science Technicians 58 11,088
312 Building and Engineering Technicians 52 14,322
313 ICT and Telecommunications Technicians 56 7,797
32 Automotive and Engineering Trades Workers 40 48,699
321 Automotive Electricians and Mechanics 40 15,795
322 Fabrication Engineering Trades Workers 33 10,206
323 Mechanical Engineering Trades Workers 45 17,622
324 Panelbeaters, and Vehicle Body Builders, Trimmers and Painters 34 5,076
33 Construction Trades Workers 36 42,963
331 Bricklayers, Carpenters and Joiners 39 15,957
332 Floor Finishers and Painting Trades Workers 31 10,494
333 Glaziers, Plasterers and Tilers 29 8,889 334 Plumbers 43 7,623
34 Electrotechnology and Telecommunication Trades Workers 48 18,711
Table A3 continued next page
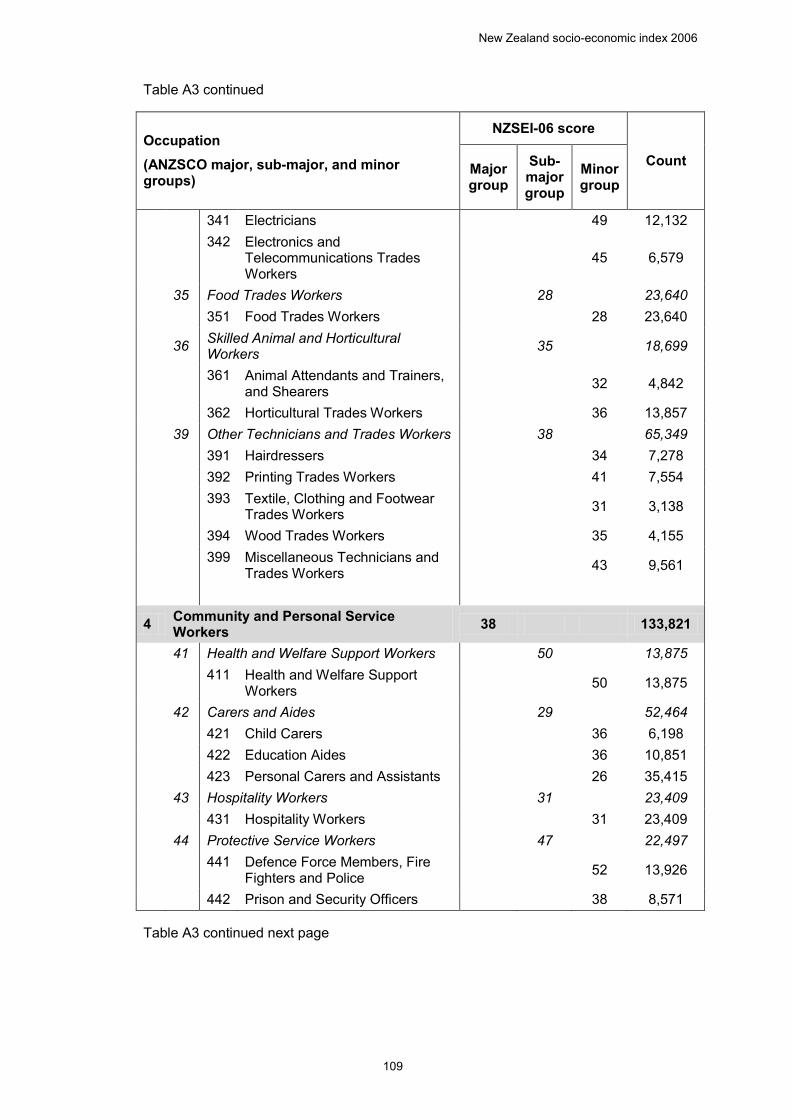
New Zealand socio-economic index 2006
109
Table A3 continued
Occupation (ANZSCO major, sub-major, and minor groups)
NZSEI-06 score
Count Major group
Sub-major group
Minor group
341 Electricians 49 12,132
342 Electronics and
Telecommunications Trades Workers
45 6,579
35 Food Trades Workers 28 23,640 351 Food Trades Workers 28 23,640
36 Skilled Animal and Horticultural Workers 35 18,699
361 Animal Attendants and Trainers, and Shearers 32 4,842
362 Horticultural Trades Workers 36 13,857 39 Other Technicians and Trades Workers 38 65,349 391 Hairdressers 34 7,278 392 Printing Trades Workers 41 7,554
393 Textile, Clothing and Footwear Trades Workers 31 3,138
394 Wood Trades Workers 35 4,155
399 Miscellaneous Technicians and Trades Workers 43 9,561
4 Community and Personal Service Workers 38 133,821
41 Health and Welfare Support Workers 50 13,875
411 Health and Welfare Support Workers 50 13,875
42 Carers and Aides 29 52,464 421 Child Carers 36 6,198 422 Education Aides 36 10,851 423 Personal Carers and Assistants 26 35,415 43 Hospitality Workers 31 23,409 431 Hospitality Workers 31 23,409 44 Protective Service Workers 47 22,497
441 Defence Force Members, Fire Fighters and Police 52 13,926
442 Prison and Security Officers 38 8,571
Table A3 continued next page
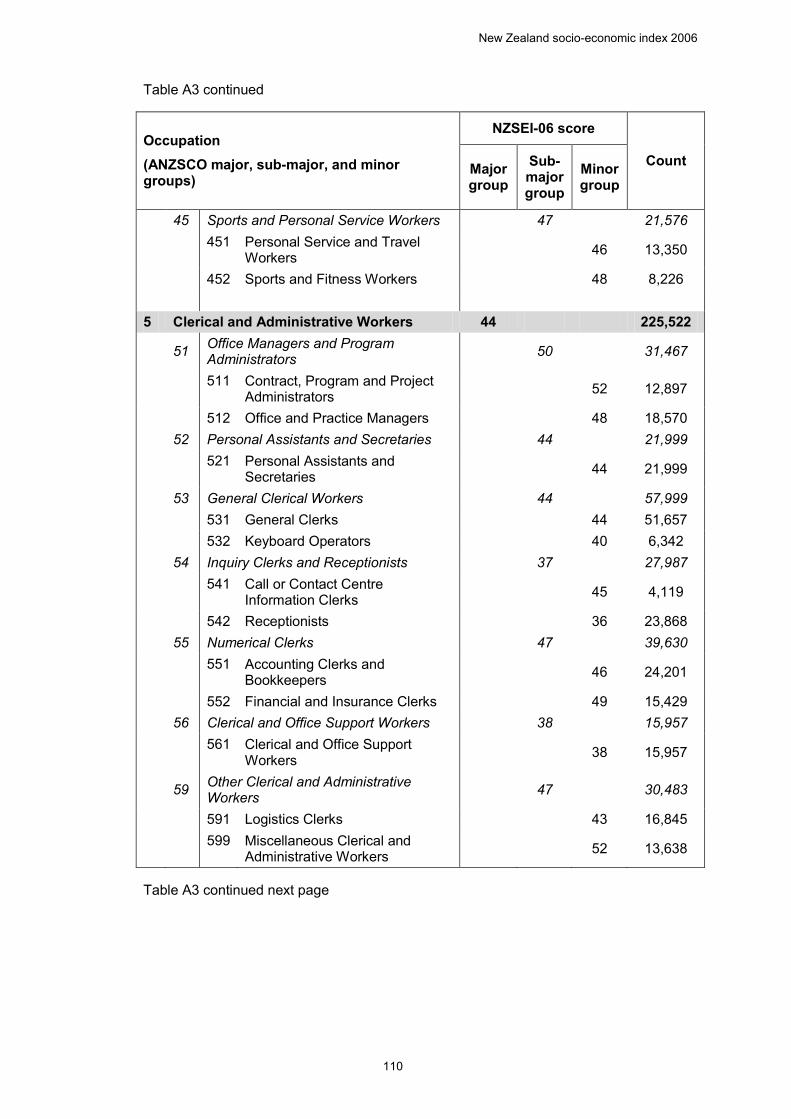
New Zealand socio-economic index 2006
110
Table A3 continued
Occupation (ANZSCO major, sub-major, and minor groups)
NZSEI-06 score
Count Major group
Sub-major group
Minor group
45 Sports and Personal Service Workers 47 21,576
451 Personal Service and Travel Workers 46 13,350
452 Sports and Fitness Workers 48 8,226 5 Clerical and Administrative Workers 44 225,522
51 Office Managers and Program Administrators 50 31,467
511 Contract, Program and Project Administrators 52 12,897
512 Office and Practice Managers 48 18,570 52 Personal Assistants and Secretaries 44 21,999
521 Personal Assistants and Secretaries 44 21,999
53 General Clerical Workers 44 57,999 531 General Clerks 44 51,657 532 Keyboard Operators 40 6,342 54 Inquiry Clerks and Receptionists 37 27,987
541 Call or Contact Centre Information Clerks 45 4,119
542 Receptionists 36 23,868 55 Numerical Clerks 47 39,630
551 Accounting Clerks and Bookkeepers 46 24,201
552 Financial and Insurance Clerks 49 15,429 56 Clerical and Office Support Workers 38 15,957
561 Clerical and Office Support Workers 38 15,957
59 Other Clerical and Administrative Workers 47 30,483
591 Logistics Clerks 43 16,845
599 Miscellaneous Clerical and Administrative Workers 52 13,638
Table A3 continued next page
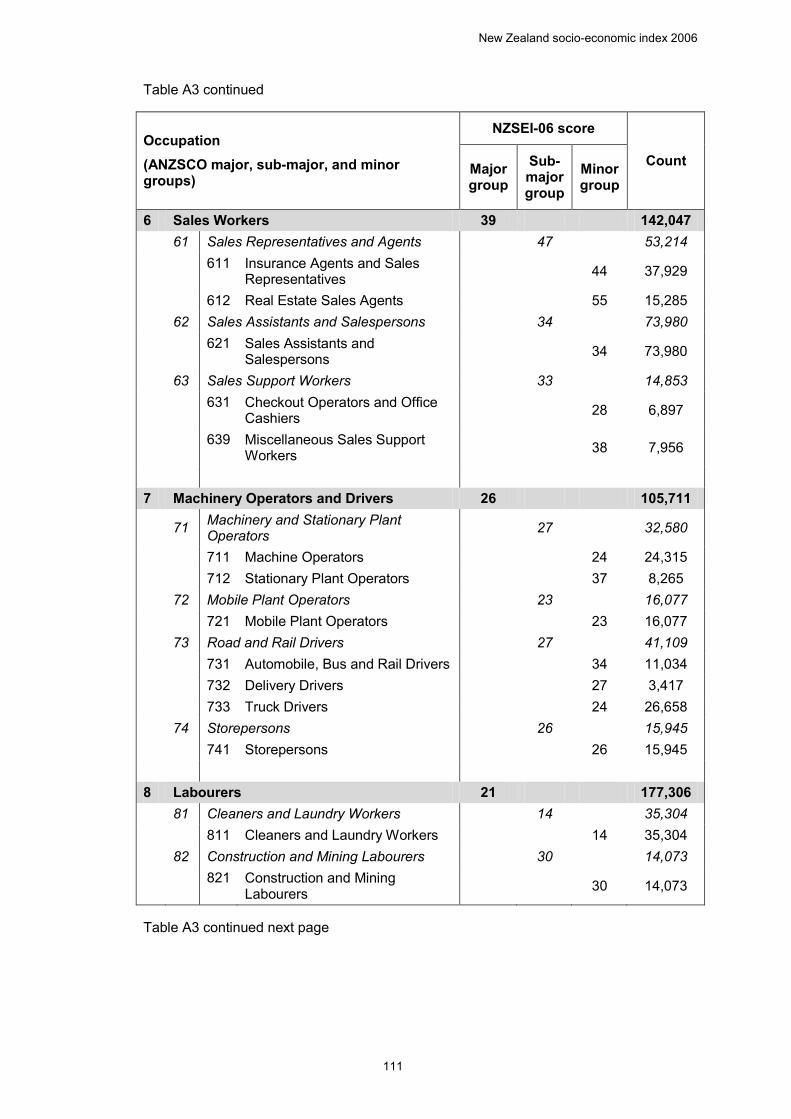
New Zealand socio-economic index 2006
111
Table A3 continued
Occupation (ANZSCO major, sub-major, and minor groups)
NZSEI-06 score
Count Major group
Sub-major group
Minor group
6 Sales Workers 39 142,047 61 Sales Representatives and Agents 47 53,214
611 Insurance Agents and Sales Representatives 44 37,929
612 Real Estate Sales Agents 55 15,285 62 Sales Assistants and Salespersons 34 73,980
621 Sales Assistants and Salespersons 34 73,980
63 Sales Support Workers 33 14,853
631 Checkout Operators and Office Cashiers 28 6,897
639 Miscellaneous Sales Support Workers 38 7,956
7 Machinery Operators and Drivers 26 105,711
71 Machinery and Stationary Plant Operators 27 32,580
711 Machine Operators 24 24,315 712 Stationary Plant Operators 37 8,265 72 Mobile Plant Operators 23 16,077 721 Mobile Plant Operators 23 16,077 73 Road and Rail Drivers 27 41,109 731 Automobile, Bus and Rail Drivers 34 11,034 732 Delivery Drivers 27 3,417 733 Truck Drivers 24 26,658 74 Storepersons 26 15,945 741 Storepersons 26 15,945 8 Labourers 21 177,306 81 Cleaners and Laundry Workers 14 35,304 811 Cleaners and Laundry Workers 14 35,304 82 Construction and Mining Labourers 30 14,073
821 Construction and Mining Labourers 30 14,073
Table A3 continued next page
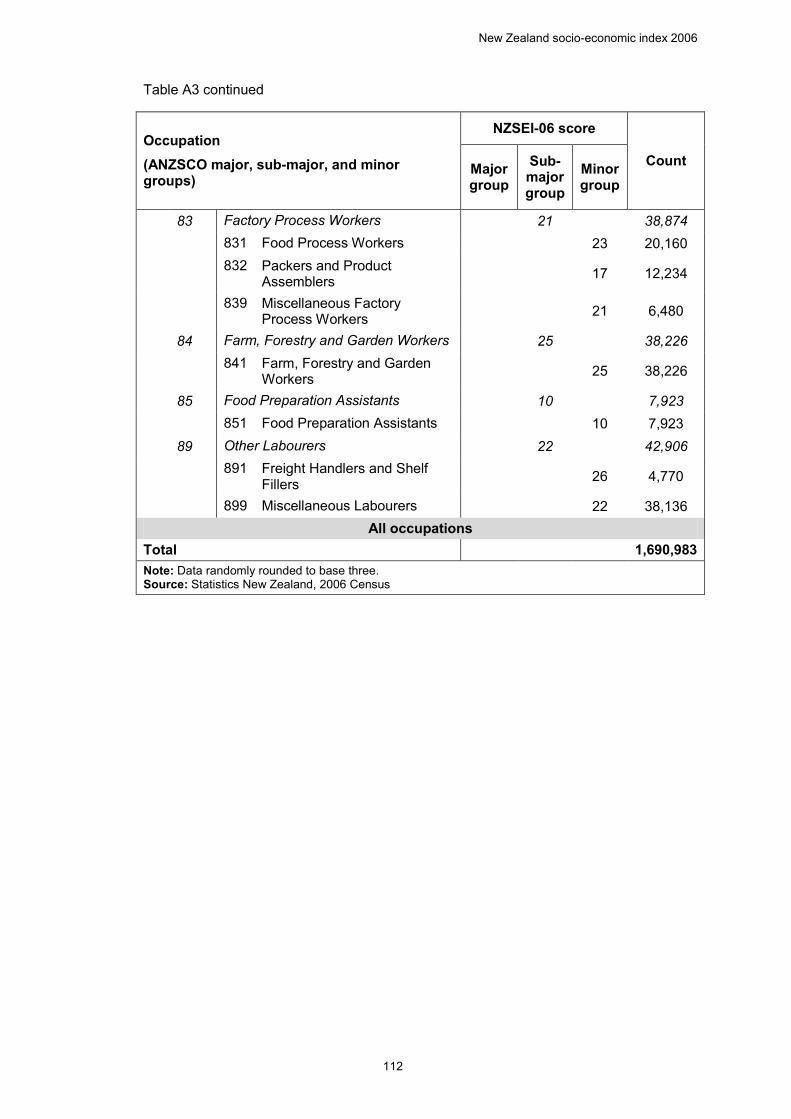
New Zealand socio-economic index 2006
112
Table A3 continued
Occupation (ANZSCO major, sub-major, and minor groups)
NZSEI-06 score
Count Major group
Sub-major group
Minor group
83 Factory Process Workers 21 38,874 831 Food Process Workers 23 20,160
832 Packers and Product Assemblers 17 12,234
839 Miscellaneous Factory Process Workers 21 6,480
84 Farm, Forestry and Garden Workers 25 38,226
841 Farm, Forestry and Garden Workers 25 38,226
85 Food Preparation Assistants 10 7,923 851 Food Preparation Assistants 10 7,923 89 Other Labourers 22 42,906
891 Freight Handlers and Shelf Fillers 26 4,770
899 Miscellaneous Labourers 22 38,136 All occupations
Total 1,690,983 Note: Data randomly rounded to base three. Source: Statistics New Zealand, 2006 Census
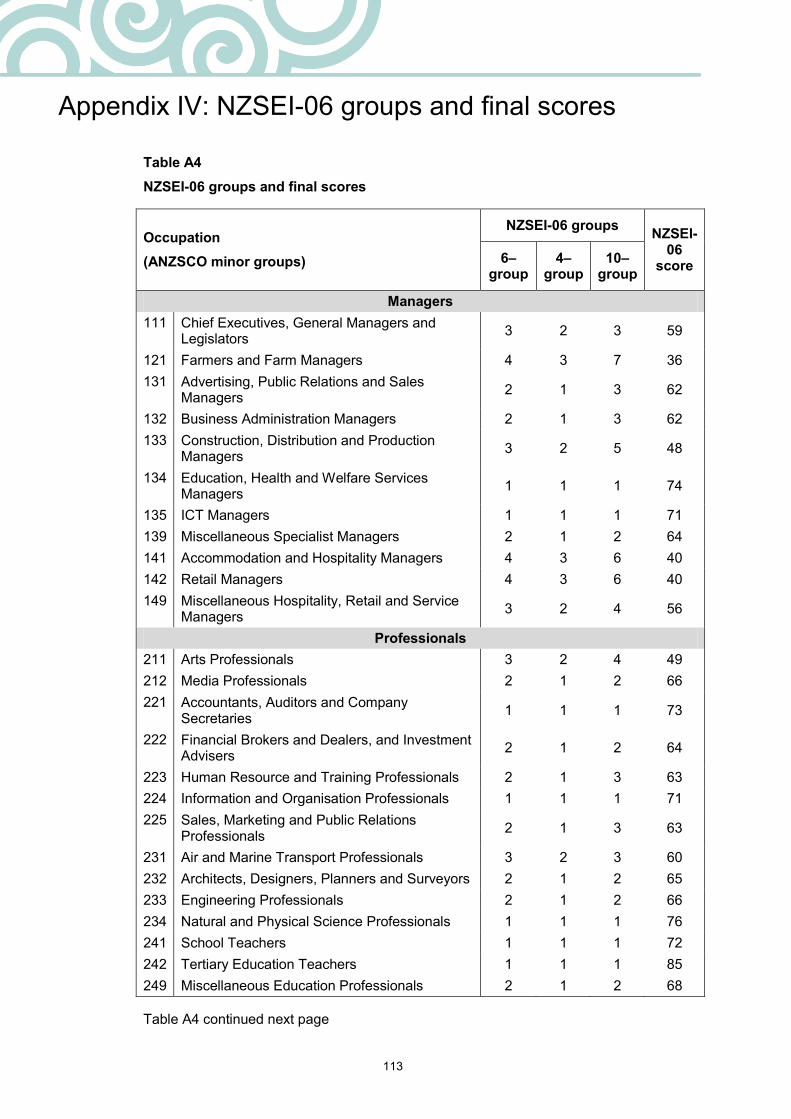
113
Appendix IV: NZSEI-06 groups and final scores
Table A4 NZSEI-06 groups and final scores A4 NZSEI-06 groups and final scores
Occupation (ANZSCO minor groups)
NZSEI-06 groups NZSEI-06
score 6– group
4– group
10– group
Managers 111 Chief Executives, General Managers and
Legislators 3 2 3 59
121 Farmers and Farm Managers 4 3 7 36 131 Advertising, Public Relations and Sales
Managers 2 1 3 62
132 Business Administration Managers 2 1 3 62 133 Construction, Distribution and Production
Managers 3 2 5 48
134 Education, Health and Welfare Services Managers 1 1 1 74
135 ICT Managers 1 1 1 71 139 Miscellaneous Specialist Managers 2 1 2 64 141 Accommodation and Hospitality Managers 4 3 6 40 142 Retail Managers 4 3 6 40 149 Miscellaneous Hospitality, Retail and Service
Managers 3 2 4 56
Professionals 211 Arts Professionals 3 2 4 49 212 Media Professionals 2 1 2 66 221 Accountants, Auditors and Company
Secretaries 1 1 1 73
222 Financial Brokers and Dealers, and Investment Advisers 2 1 2 64
223 Human Resource and Training Professionals 2 1 3 63 224 Information and Organisation Professionals 1 1 1 71 225 Sales, Marketing and Public Relations
Professionals 2 1 3 63
231 Air and Marine Transport Professionals 3 2 3 60 232 Architects, Designers, Planners and Surveyors 2 1 2 65 233 Engineering Professionals 2 1 2 66 234 Natural and Physical Science Professionals 1 1 1 76 241 School Teachers 1 1 1 72 242 Tertiary Education Teachers 1 1 1 85 249 Miscellaneous Education Professionals 2 1 2 68
Table A4 continued next page
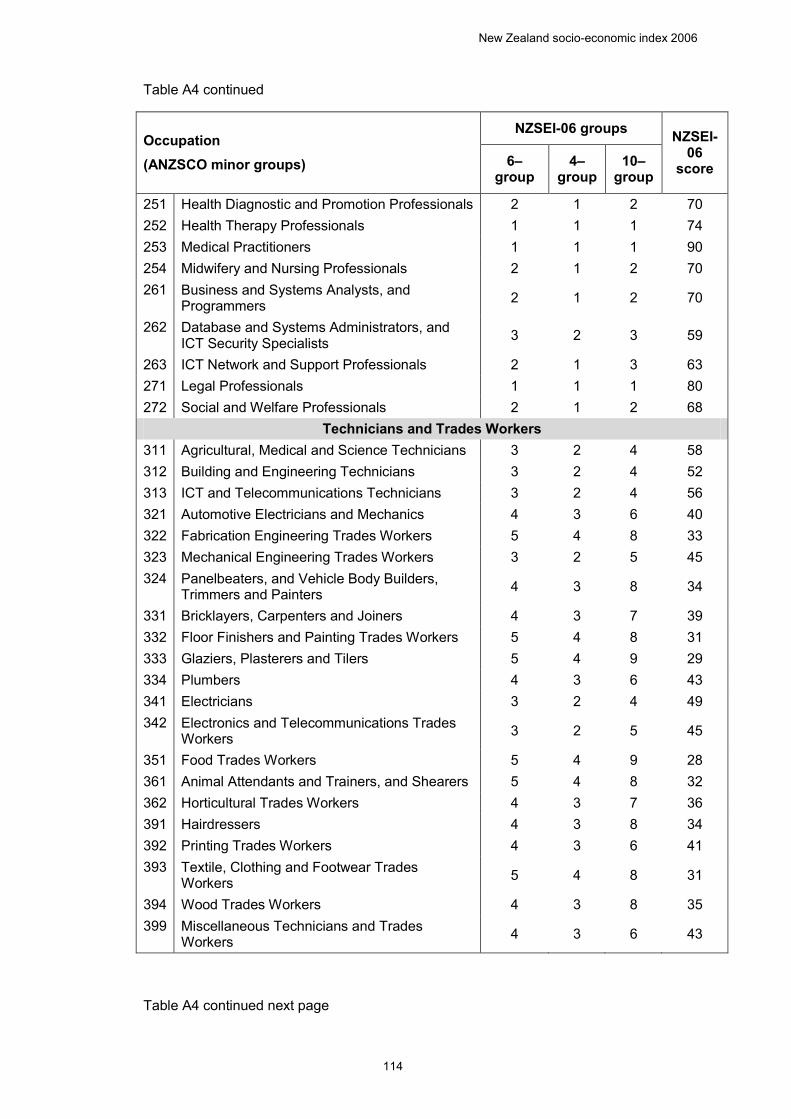
New Zealand socio-economic index 2006
114
Table A4 continued
Occupation (ANZSCO minor groups)
NZSEI-06 groups NZSEI-06
score 6– group
4– group
10– group
251 Health Diagnostic and Promotion Professionals 2 1 2 70 252 Health Therapy Professionals 1 1 1 74 253 Medical Practitioners 1 1 1 90 254 Midwifery and Nursing Professionals 2 1 2 70 261 Business and Systems Analysts, and
Programmers 2 1 2 70
262 Database and Systems Administrators, and ICT Security Specialists 3 2 3 59
263 ICT Network and Support Professionals 2 1 3 63 271 Legal Professionals 1 1 1 80 272 Social and Welfare Professionals 2 1 2 68
Technicians and Trades Workers 311 Agricultural, Medical and Science Technicians 3 2 4 58 312 Building and Engineering Technicians 3 2 4 52 313 ICT and Telecommunications Technicians 3 2 4 56 321 Automotive Electricians and Mechanics 4 3 6 40 322 Fabrication Engineering Trades Workers 5 4 8 33 323 Mechanical Engineering Trades Workers 3 2 5 45 324 Panelbeaters, and Vehicle Body Builders,
Trimmers and Painters 4 3 8 34
331 Bricklayers, Carpenters and Joiners 4 3 7 39 332 Floor Finishers and Painting Trades Workers 5 4 8 31 333 Glaziers, Plasterers and Tilers 5 4 9 29 334 Plumbers 4 3 6 43 341 Electricians 3 2 4 49 342 Electronics and Telecommunications Trades
Workers 3 2 5 45
351 Food Trades Workers 5 4 9 28 361 Animal Attendants and Trainers, and Shearers 5 4 8 32 362 Horticultural Trades Workers 4 3 7 36 391 Hairdressers 4 3 8 34 392 Printing Trades Workers 4 3 6 41 393 Textile, Clothing and Footwear Trades
Workers 5 4 8 31
394 Wood Trades Workers 4 3 8 35 399 Miscellaneous Technicians and Trades
Workers 4 3 6 43
Table A4 continued next page
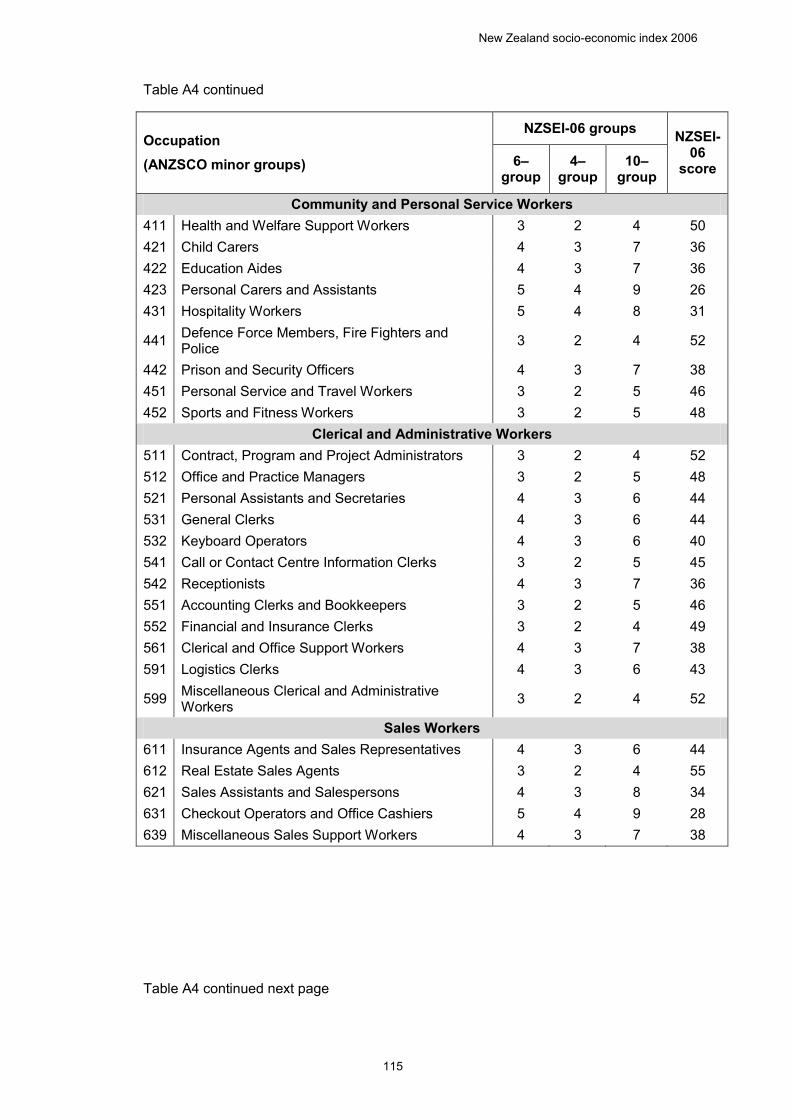
New Zealand socio-economic index 2006
115
Table A4 continued
Occupation (ANZSCO minor groups)
NZSEI-06 groups NZSEI-06
score 6– group
4– group
10– group
Community and Personal Service Workers 411 Health and Welfare Support Workers 3 2 4 50 421 Child Carers 4 3 7 36 422 Education Aides 4 3 7 36 423 Personal Carers and Assistants 5 4 9 26 431 Hospitality Workers 5 4 8 31
441 Defence Force Members, Fire Fighters and Police 3 2 4 52
442 Prison and Security Officers 4 3 7 38 451 Personal Service and Travel Workers 3 2 5 46 452 Sports and Fitness Workers 3 2 5 48
Clerical and Administrative Workers 511 Contract, Program and Project Administrators 3 2 4 52 512 Office and Practice Managers 3 2 5 48 521 Personal Assistants and Secretaries 4 3 6 44 531 General Clerks 4 3 6 44 532 Keyboard Operators 4 3 6 40 541 Call or Contact Centre Information Clerks 3 2 5 45 542 Receptionists 4 3 7 36 551 Accounting Clerks and Bookkeepers 3 2 5 46 552 Financial and Insurance Clerks 3 2 4 49 561 Clerical and Office Support Workers 4 3 7 38 591 Logistics Clerks 4 3 6 43
599 Miscellaneous Clerical and Administrative Workers 3 2 4 52
Sales Workers 611 Insurance Agents and Sales Representatives 4 3 6 44 612 Real Estate Sales Agents 3 2 4 55 621 Sales Assistants and Salespersons 4 3 8 34 631 Checkout Operators and Office Cashiers 5 4 9 28 639 Miscellaneous Sales Support Workers 4 3 7 38
Table A4 continued next page
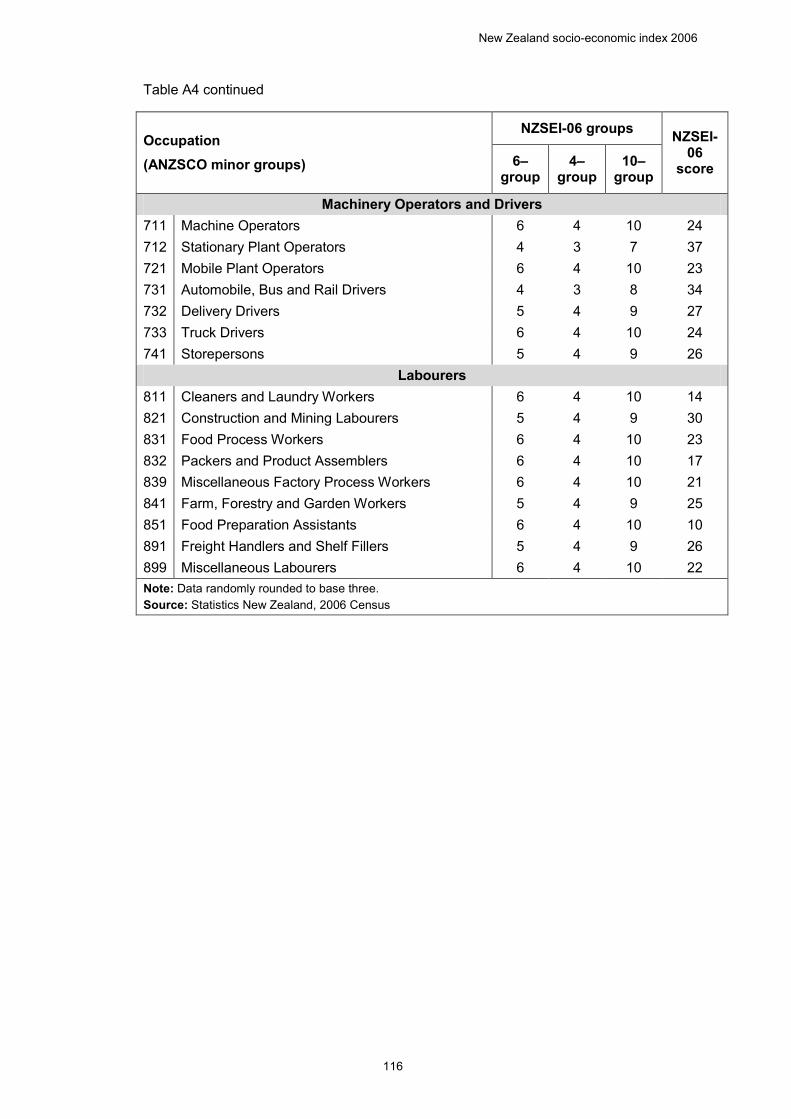
New Zealand socio-economic index 2006
116
Table A4 continued
Occupation (ANZSCO minor groups)
NZSEI-06 groups NZSEI-06
score 6– group
4– group
10– group
Machinery Operators and Drivers 711 Machine Operators 6 4 10 24 712 Stationary Plant Operators 4 3 7 37 721 Mobile Plant Operators 6 4 10 23 731 Automobile, Bus and Rail Drivers 4 3 8 34 732 Delivery Drivers 5 4 9 27 733 Truck Drivers 6 4 10 24 741 Storepersons 5 4 9 26
Labourers 811 Cleaners and Laundry Workers 6 4 10 14 821 Construction and Mining Labourers 5 4 9 30 831 Food Process Workers 6 4 10 23 832 Packers and Product Assemblers 6 4 10 17 839 Miscellaneous Factory Process Workers 6 4 10 21 841 Farm, Forestry and Garden Workers 5 4 9 25 851 Food Preparation Assistants 6 4 10 10 891 Freight Handlers and Shelf Fillers 5 4 9 26 899 Miscellaneous Labourers 6 4 10 22 Note: Data randomly rounded to base three. Source: Statistics New Zealand, 2006 Census
117
Appendix V: Using NZSEI-06
This appendix is intended to provide brief notes on using NZSEI-06. For a fuller discussion of the issues discussed in this appendix, see the New Zealand socio-economic index 1996 users’ guide (Galbraith, Jenkin, Davis, & Coope, 2003). Various websites mentioned in this section may also be a useful resource for those requiring more information.
Coding occupation In order to assign NZSEI-06 scores or groups, occupation must first be coded using the Australian and New Zealand Standard Classification of Occupations (ANZSCO). At the time of writing, ANZSCO is the classification system suggested for occupational classification in New Zealand, and since 2006 it has been used in Statistics NZ censuses and surveys where occupation data are collected.
For the coding of NZSEI-06, coding to the minor group (three-digit) level of ANZSCO is required. This has 97 categories. However, if coding to the minor group level is not possible (eg, it is unavailable or if data on occupation lack the detail required), NZSEI-06 scores can be assigned to the sub-major group (two-digit, 43 categories) or major group (one-digit, 8 categories) level of ANZSCO. Coding to any greater detail than the minor group level is unnecessary.
Researchers with occupational data already pre-coded to the minor group level of ANZSCO can move to coding NZSEI-06 scores (see below).
For researchers with un-coded data on occupation in text form, a list of ANZSCO codes as well as guides for coding occupational data to ANZSCO can be found at Occupation. A classification code finder has also been developed.
Coders may find it useful to alphabetise their occupational data so that individuals with the same occupation can be coded at the same time (and with the same code). This is particularly useful if a large number of individuals need to be coded. If necessary, the reliability of coding can be checked by two or more coders coding a subset (or all) of the occupational data and comparing results, eg, by assessing the correlation or computing a kappa statistic.
Researchers who wish to collect occupational data to code to ANZSCO should take the following steps.
First, to enable accurate coding, it is helpful to obtain: • the occupation title
• the main tasks or duties of that occupation
• the industry to which the occupation belongs.
Second, data collected face-to-face or via telephone are likely to be more accurate, as this allows for the researcher to probe for more information where insufficient detail has been supplied. In this regard, it is helpful for interviewers to be trained with the ANZSCO system or with occupational coding, to gain an understanding of the level of detail required to code occupations accurately.
Coding NZSEI-06 If ANZSCO-classified occupational data are available to the minor group (three-digit) level, researchers can assign NZSEI-06 scores and groups by referring to the ‘Minor group’ column in appendix III. If ANZSCO-classified occupational data are only available
New Zealand socio-economic index 2006
118
to the sub-major (two-digit) or major (one-digit) group level, then NZSEI-06 scores can still be assigned by referring to the appropriate columns in appendix III. Note that NZSEI-06 scores are presented for sub-major group occupations in italics and for major group occupations in bold. Note also that if ANZSCO-classified occupational data are only available to the major or sub-major level, NZSEI-06 SES groups cannot be assigned.
Whether to assign individuals NZSEI-06 scores or assign them to NZSEI-06 SES groups is entirely up to the researcher. Greater sensitivity should be obtained by assigning scores, and scores may also be preferred for analytic reasons – eg, continuous data allow analyses such as linear regression to be undertaken.
However, there are circumstances under which one or other of the SES group classifications would be preferred. For example, for researchers wanting equal-sized groups representing different levels of socio-economic status, NZSEI-06 four-group or 10-group classification would be appropriate. NZSEI-06 10-group classification also allows for direct comparisons with NZDep scales (eg, NZDep2006, Salmond et al, 2007). Similarly, for comparisons with, or assessing continuity with, the previous Elley-Irving scales (eg, Elley and Irving, 1972; 1976; 1985; 2003; Irving and Elley, 1977), NZSEI-06 six-group classification may be preferred.
Coding those not in the workforce One of the major disadvantages of an occupational-based measure of SES such as NZSEI-06 is that those without an occupation – or for whom occupational data are unavailable – cannot be coded. There are at least three alternatives to assigning NZSEI-06 scores in this situation.
First, NZSEI-06 scores can be assigned based on previous occupation, if such data are available. Moreover, those wishing to estimate the SES of those who have left the workforce (eg, retirees) might wish to consider collecting information on the main occupation held by respondents in their lifetime.
Second, in some cases it may be justifiable to use the occupation of a proxy person to assess socio-economic status (eg, for children or homemakers). Researchers using this method should carefully consider whether an individual’s SES is best captured by the SES of their proxy.
Third, individuals can be assigned SES scores based on their ‘occupational potential’ (Jones and McMillan, 2001), whereby in the absence of information on occupation, scores are imputed using available data on age and education. Methods for imputing NZSEI-06 scores based on age and education were described in chapter 5, and were shown to provide reasonably robust measures of SES that validated well against health and socio-economic correlates.
The suggested imputed NZSEI-06 scores are shown in table A5, and are based on the mean NZSEI-06 scores by age and education for those with a current occupation. Scores are given for seven age bands (10-year blocks from 15–24 years to 75+ years) and 15 different highest qualification levels (from no qualification to doctoral degree). While no problem should be encountered classifying the age of individuals, in some cases there may be difficulties classifying the highest education of individuals to the level displayed in the table. Researchers are advised to classify individuals as accurately as possible, but should note that similar scores are often assigned to adjacent groups. Thus, some distinctions are more important than others. For example, similar scores are assigned to:
(i) those with a master’s degree and those with a post-graduate or honours degree
(ii) those with either a Level 4, Level 3, Level 2, or Level 1 Certificate gained post-school
(iii) those with a Level 3 or 4 certificate gained at school and those with a Level 2 certificate gained at school.
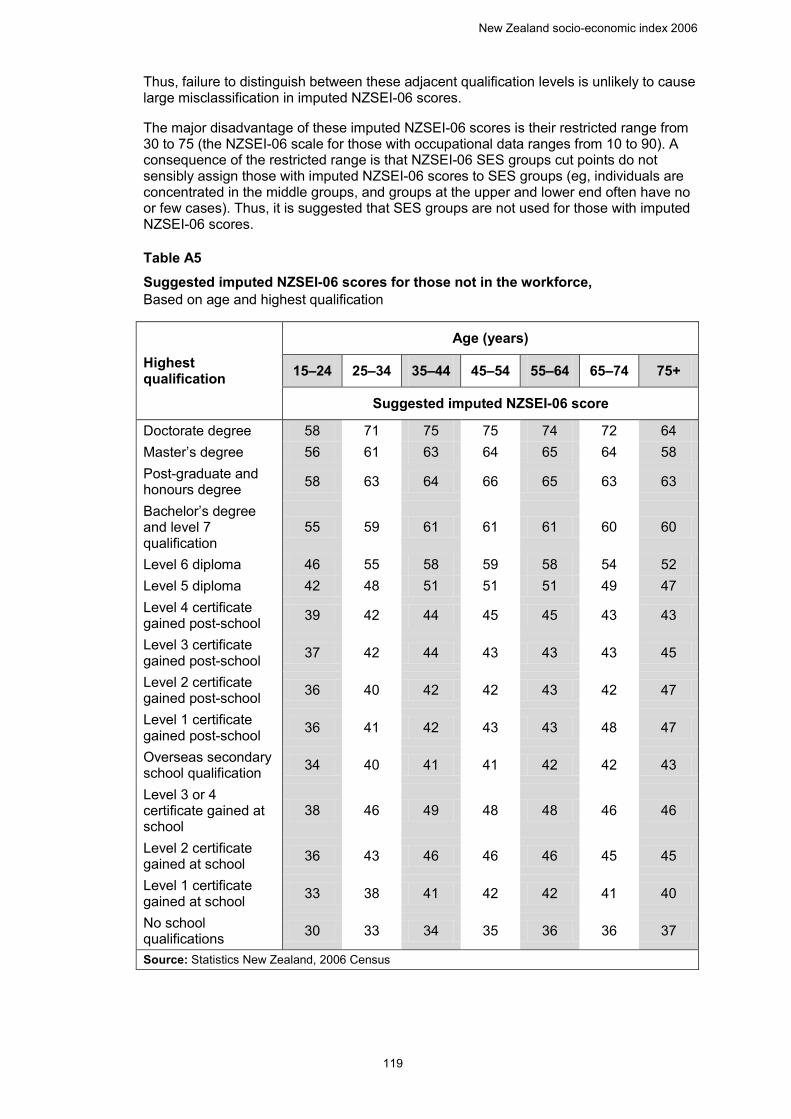
New Zealand socio-economic index 2006
119
Thus, failure to distinguish between these adjacent qualification levels is unlikely to cause large misclassification in imputed NZSEI-06 scores.
The major disadvantage of these imputed NZSEI-06 scores is their restricted range from 30 to 75 (the NZSEI-06 scale for those with occupational data ranges from 10 to 90). A consequence of the restricted range is that NZSEI-06 SES groups cut points do not sensibly assign those with imputed NZSEI-06 scores to SES groups (eg, individuals are concentrated in the middle groups, and groups at the upper and lower end often have no or few cases). Thus, it is suggested that SES groups are not used for those with imputed NZSEI-06 scores.
Table A5 Suggested imputed NZSEI-06 scores for those not in the workforce, Based on age and highest qualification A5 Suggested imputed NZSEI-06 scores for those not in the workforce, based on age and highest qualification
Highest qualification
Age (years)
15–24 25–34 35–44 45–54 55–64 65–74 75+
Suggested imputed NZSEI-06 score
Doctorate degree 58 71 75 75 74 72 64 Master’s degree 56 61 63 64 65 64 58 Post-graduate and honours degree 58 63 64 66 65 63 63
Bachelor’s degree and level 7 qualification
55 59 61 61 61 60 60
Level 6 diploma 46 55 58 59 58 54 52 Level 5 diploma 42 48 51 51 51 49 47 Level 4 certificate gained post-school 39 42 44 45 45 43 43
Level 3 certificate gained post-school 37 42 44 43 43 43 45
Level 2 certificate gained post-school 36 40 42 42 43 42 47
Level 1 certificate gained post-school 36 41 42 43 43 48 47
Overseas secondary school qualification 34 40 41 41 42 42 43
Level 3 or 4 certificate gained at school
38 46 49 48 48 46 46
Level 2 certificate gained at school 36 43 46 46 46 45 45
Level 1 certificate gained at school 33 38 41 42 42 41 40
No school qualifications 30 33 34 35 36 36 37
Source: Statistics New Zealand, 2006 Census