Embed Size (px)
Citation preview

ANZ Research July 2021
New Zealand
Property Focus
Headwinds gathering
At a glance
ANZ New Zealand Property Focus | July 2021 2
Anti-gravity house prices But annual inflation looks peaky
Hikes from August Should cool the market
A multi-decade tailwind Is set to change direction
Affordability has deteriorated
And it could take decades to improve
Higher wholesale (swap) rates Pricing in hikes
Mortgage rates likely to rise As OCR hikes flow into retail rates
Source: RBNZ, REINZ, Stats NZ, Macrobond, Bloomberg, ICAP, RealEstate.co.nz, ANZ Research
This is not personal advice nor financial advice about any product or service. The opinions and research contained in this document are provided for information only, are intended to be general in nature and do not take into account your financial situation or goals. Please refer to the Important Notice.
-15
-10
-5
0
5
10
15
20
25
30
35
93 95 97 99 01 03 05 07 09 11 13 15 17 19 21
Annual %
change (
3-m
th a
vg)
Auckland Rest of New Zealand New Zealand
0.00%
0.25%
0.50%
0.75%
1.00%
1.25%
1.50%
1.75%
2.00%
ANZ (Qtr end) RBNZ (Qtr avg) Market Pricing (Qtr end)
4
6
8
10
12
14
16
18
20
22
71 76 81 86 91 96 01 06 11 16 21
%
Floating first mortgage new customer housing rate
Tailwind for
house prices
5
6
7
8
9
10
11
12
07 10 13 16 19 22 25 28 31 34 37 40 43 46 49 52 55 58
Ratio
House price inflation 0%; Income growth 5%
House price inflation 2%; Income growth 5%
House price inflation 2%; Income growth 4%
House price inflation 3%; Income growth 4%
6 yrs to
pre-COVID
9 yrs
to pre-COVID
15 yrs to
pre-COVID
37 yrs to
pre-COVID
2
3
4
5
6
7
8
9
10
11
12
05 06 07 08 09 10 11 12 13 14 15 16 17 18 19 20 21 22 23
%
Floating 1 year 2 years 3 years 4 years 5 years
Projections
ANZ New Zealand Property Focus | July 2021 3
Contact
Sharon Zollner, David
Croy or Miles Workman for more details.
See page 9.
INSIDE
At a glance 2
Housing Market Overview 4
Regional Housing Market Indicators 6
Feature Article: A pictorial essay on New Zealand interest rates and debt 7
Mortgage Borrowing Strategy 13
Weekly Mortgage Repayment Table 14
Mortgage Rate Forecasts 14
Economic Forecasts 14
Important Notice 16
ISSN 2624-0629
Publication date: 28 July 2021
Summary
Our monthly Property Focus publication provides an independent appraisal of
recent developments in the residential property market.
Housing market overview
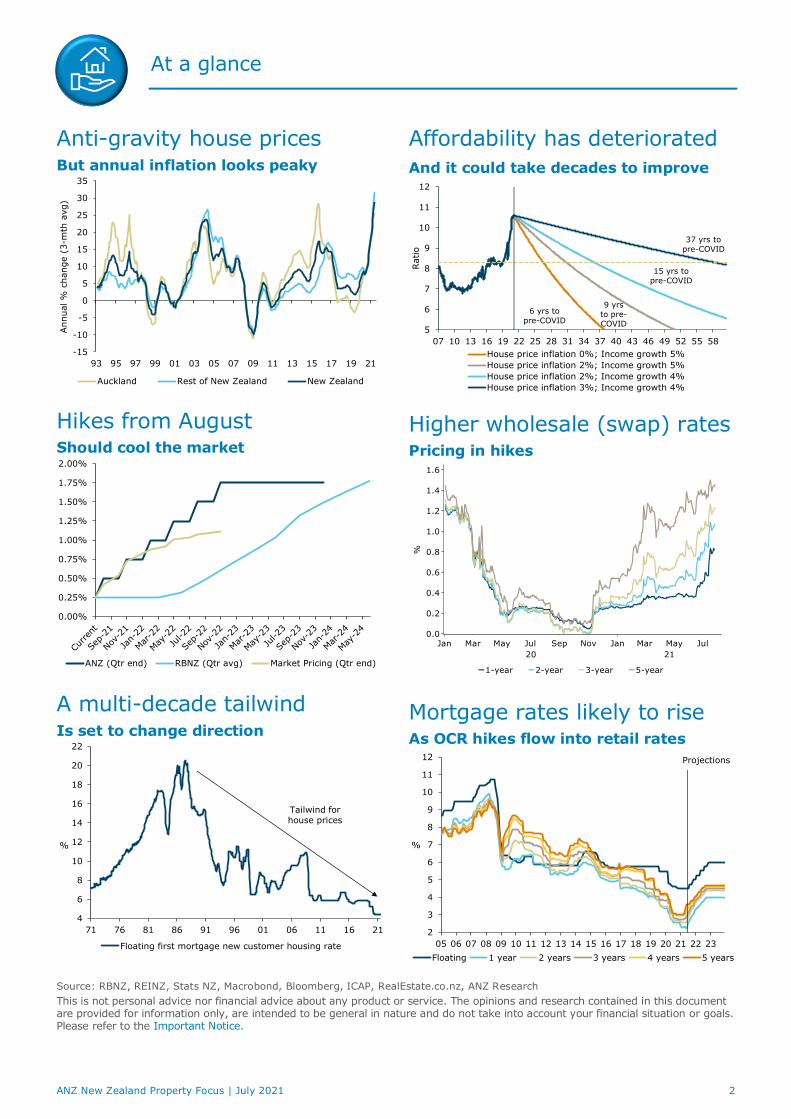
A few months have now passed since the Government announced its suite of
housing policy changes, and as the dust settles, a rather robust market is being
revealed. It’s still early days of course, but the experience to date suggests
policy changes so far are not on their own going to bring about different, and
more equitable, housing outcomes. House price inflation is still running at an
elevated monthly pace, and while we think the annual profile is very close to its
peak, the ratio of house prices to incomes is simply off the chart. Properties
available for sale remain very low, and the only real solution to this madness in
the longer run is to build more houses. For now, the market remains tight, but a
higher OCR from August should help take some of the heat out.
See our Market Overview.
Feature Article: A pictorial essay on New Zealand interest rates
and debt
As 2021 has progressed, it has become increasingly clear that the economy has
recovered well and is steaming ahead so quickly that it’s high time for the
Reserve Bank (RBNZ) to start unwinding the emergency stimulus delivered in
response to the crisis. The RBNZ has already scaled back and then formally
ended quantitative easing (“money printing”) and the next logical step is to
start lifting the OCR, with the first hike expected next month. While on the one
hand that’s an endorsement of the strength of the economic rebound and the
lift in confidence (and house prices), it also means borrowers will face higher
interest costs in the months and years ahead. This month we discuss what
markets are telling us about how high interest rates might go, compare that to
past cycles, and discuss some of the factors that will determine how high
interest rates can go over coming years. See this month’s Feature Article.
Mortgage borrowing strategy
Average fixed mortgage rates offered by the four major banks all rose over the
past month, with the biggest lifts seen in 1 and 2-year rates, and lesser rises
seen in 4 and 5-year rates. The 1-year rate remains the cheapest rate, and at
around 2½% it is still relatively low by historical standards. However, the
average 5-year rate is now a shade above 4%, a level not seen since before the
COVID crisis struck. The current term structure of mortgage rates poses a real
challenge to borrowers. That’s because longer-term rates are now much higher,
but equally, if you fix for 1 year, it’s very likely going to cost more to re-fix in
the future. Our breakeven analysis shows that it might be marginally cheaper to
fix for 2-3 years but it’s a close call. The choice will depend on whether you
prefer certainty or else think there’s a good chance the RBNZ won’t need to hike
by as much as markets are expecting. See our Mortgage Borrowing Strategy.
Housing market overview
ANZ New Zealand Property Focus | July 2021 4
Summary
A few months have now passed since the Government
announced its suite of housing policy changes, and as
the dust settles, a rather robust market is being
revealed. It’s still early days of course, but the
experience to date suggests policy changes so far are
not, on their own, going to bring about different and
more equitable housing outcomes. House price inflation
is still running at an elevated monthly pace. While we
think the annual profile is very close to its peak, the
ratio of house prices to incomes is simply off the chart.
Properties available for sale remain very low, and the
only real solution to this madness is to build more
houses. For now, the market remains tight, but a
higher OCR from August should help take some of the
heat out.
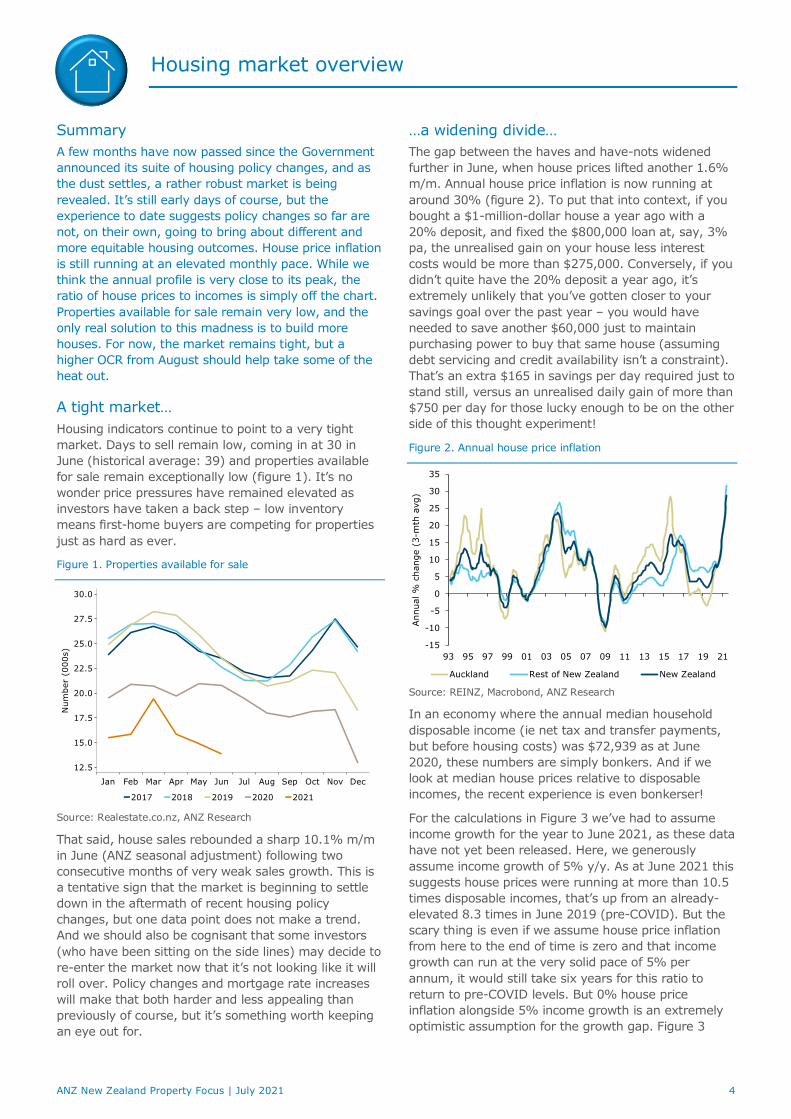
A tight market…
Housing indicators continue to point to a very tight
market. Days to sell remain low, coming in at 30 in
June (historical average: 39) and properties available
for sale remain exceptionally low (figure 1). It’s no
wonder price pressures have remained elevated as
investors have taken a back step – low inventory
means first-home buyers are competing for properties
just as hard as ever.
Figure 1. Properties available for sale
Source: Realestate.co.nz, ANZ Research
That said, house sales rebounded a sharp 10.1% m/m
in June (ANZ seasonal adjustment) following two
consecutive months of very weak sales growth. This is
a tentative sign that the market is beginning to settle
down in the aftermath of recent housing policy
changes, but one data point does not make a trend.
And we should also be cognisant that some investors
(who have been sitting on the side lines) may decide to
re-enter the market now that it’s not looking like it will
roll over. Policy changes and mortgage rate increases
will make that both harder and less appealing than
previously of course, but it’s something worth keeping
an eye out for.
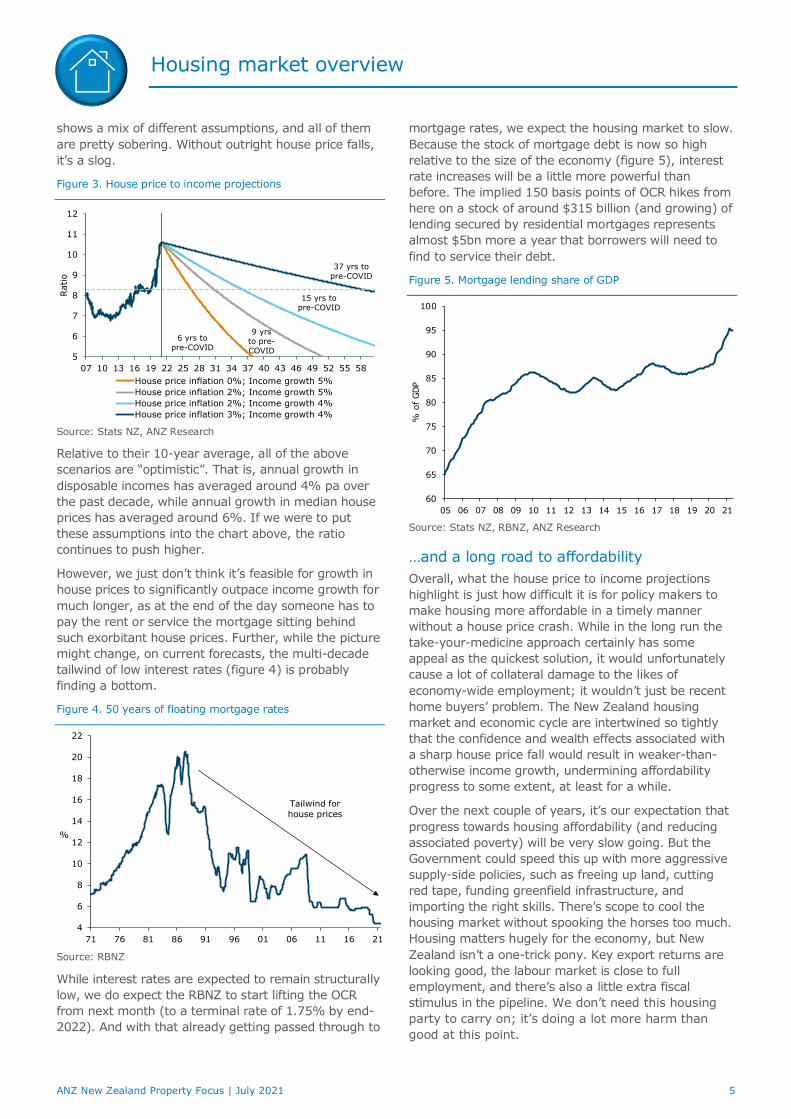
…a widening divide…
The gap between the haves and have-nots widened
further in June, when house prices lifted another 1.6%
m/m. Annual house price inflation is now running at
around 30% (figure 2). To put that into context, if you
bought a $1-million-dollar house a year ago with a
20% deposit, and fixed the $800,000 loan at, say, 3%
pa, the unrealised gain on your house less interest
costs would be more than $275,000. Conversely, if you
didn’t quite have the 20% deposit a year ago, it’s
extremely unlikely that you’ve gotten closer to your
savings goal over the past year – you would have
needed to save another $60,000 just to maintain
purchasing power to buy that same house (assuming
debt servicing and credit availability isn’t a constraint).
That’s an extra $165 in savings per day required just to
stand still, versus an unrealised daily gain of more than
$750 per day for those lucky enough to be on the other
side of this thought experiment!
Figure 2. Annual house price inflation
Source: REINZ, Macrobond, ANZ Research
In an economy where the annual median household
disposable income (ie net tax and transfer payments,
but before housing costs) was $72,939 as at June
2020, these numbers are simply bonkers. And if we
look at median house prices relative to disposable
incomes, the recent experience is even bonkerser!
For the calculations in Figure 3 we’ve had to assume
income growth for the year to June 2021, as these data
have not yet been released. Here, we generously
assume income growth of 5% y/y. As at June 2021 this
suggests house prices were running at more than 10.5
times disposable incomes, that’s up from an already-
elevated 8.3 times in June 2019 (pre-COVID). But the
scary thing is even if we assume house price inflation
from here to the end of time is zero and that income
growth can run at the very solid pace of 5% per
annum, it would still take six years for this ratio to
return to pre-COVID levels. But 0% house price
inflation alongside 5% income growth is an extremely
optimistic assumption for the growth gap. Figure 3
-15
-10
-5
0
5
10
15
20
25
30
35
93 95 97 99 01 03 05 07 09 11 13 15 17 19 21
Annual %
change (
3-m
th a
vg)
Auckland Rest of New Zealand New Zealand
Housing market overview
ANZ New Zealand Property Focus | July 2021 5
shows a mix of different assumptions, and all of them
are pretty sobering. Without outright house price falls,
it’s a slog.
Figure 3. House price to income projections
Source: Stats NZ, ANZ Research
Relative to their 10-year average, all of the above
scenarios are “optimistic”. That is, annual growth in
disposable incomes has averaged around 4% pa over
the past decade, while annual growth in median house
prices has averaged around 6%. If we were to put
these assumptions into the chart above, the ratio
continues to push higher.
However, we just don’t think it’s feasible for growth in
house prices to significantly outpace income growth for
much longer, as at the end of the day someone has to
pay the rent or service the mortgage sitting behind
such exorbitant house prices. Further, while the picture
might change, on current forecasts, the multi-decade
tailwind of low interest rates (figure 4) is probably
finding a bottom.
Figure 4. 50 years of floating mortgage rates
Source: RBNZ
While interest rates are expected to remain structurally
low, we do expect the RBNZ to start lifting the OCR
from next month (to a terminal rate of 1.75% by end-
2022). And with that already getting passed through to
mortgage rates, we expect the housing market to slow.
Because the stock of mortgage debt is now so high
relative to the size of the economy (figure 5), interest
rate increases will be a little more powerful than
before. The implied 150 basis points of OCR hikes from
here on a stock of around $315 billion (and growing) of
lending secured by residential mortgages represents
almost $5bn more a year that borrowers will need to
find to service their debt.
Figure 5. Mortgage lending share of GDP
Source: Stats NZ, RBNZ, ANZ Research
…and a long road to affordability
Overall, what the house price to income projections
highlight is just how difficult it is for policy makers to
make housing more affordable in a timely manner
without a house price crash. While in the long run the
take-your-medicine approach certainly has some
appeal as the quickest solution, it would unfortunately
cause a lot of collateral damage to the likes of
economy-wide employment; it wouldn’t just be recent
home buyers’ problem. The New Zealand housing
market and economic cycle are intertwined so tightly
that the confidence and wealth effects associated with
a sharp house price fall would result in weaker-than-
otherwise income growth, undermining affordability
progress to some extent, at least for a while.
Over the next couple of years, it’s our expectation that
progress towards housing affordability (and reducing
associated poverty) will be very slow going. But the
Government could speed this up with more aggressive
supply-side policies, such as freeing up land, cutting
red tape, funding greenfield infrastructure, and
importing the right skills. There’s scope to cool the
housing market without spooking the horses too much.
Housing matters hugely for the economy, but New
Zealand isn’t a one-trick pony. Key export returns are
looking good, the labour market is close to full
employment, and there’s also a little extra fiscal
stimulus in the pipeline. We don’t need this housing
party to carry on; it’s doing a lot more harm than
good at this point.
5
6
7
8
9
10
11
12
07 10 13 16 19 22 25 28 31 34 37 40 43 46 49 52 55 58
Ratio
House price inflation 0%; Income growth 5%
House price inflation 2%; Income growth 5%
House price inflation 2%; Income growth 4%
House price inflation 3%; Income growth 4%
6 yrs to
pre-COVID
9 yrs
to pre-COVID
15 yrs to
pre-COVID
37 yrs to
pre-COVID
4
6
8
10
12
14
16
18
20
22
71 76 81 86 91 96 01 06 11 16 21
%
Tailwind for
house prices
60
65
70
75
80
85
90
95
100
05 06 07 08 09 10 11 12 13 14 15 16 17 18 19 20 21
% o
f GDP
Housing market overview
ANZ New Zealand Property Focus | July 2021 6
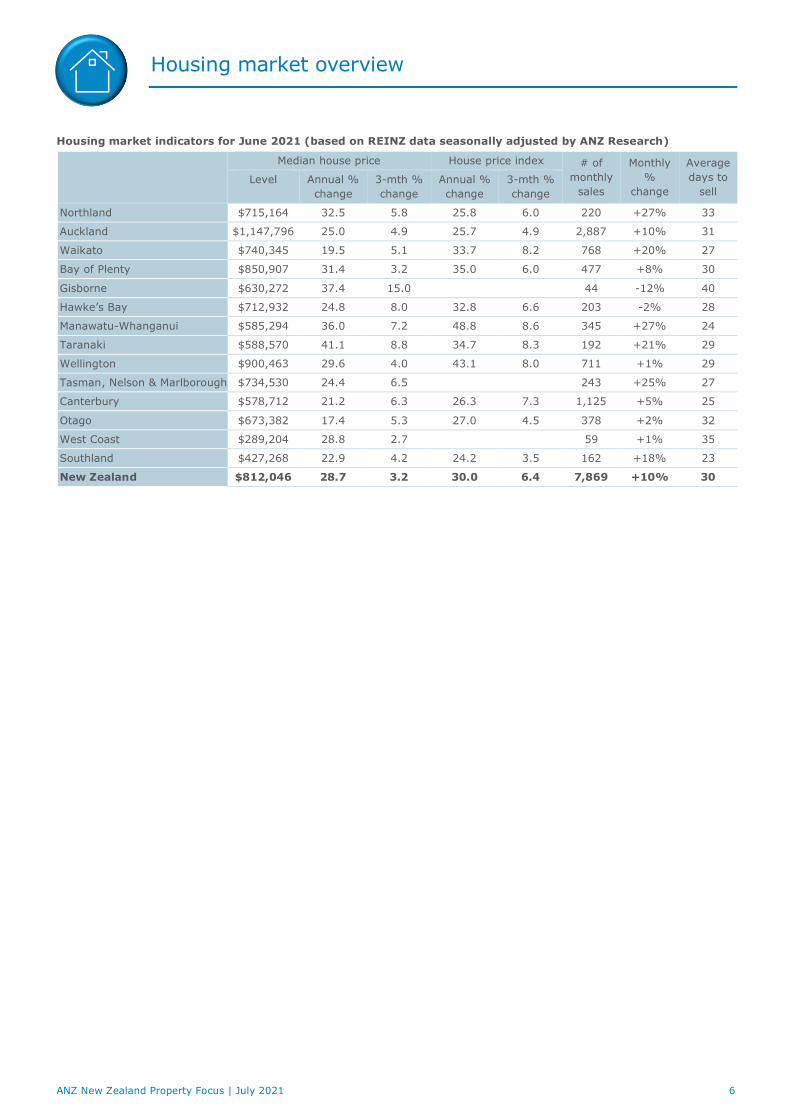
Housing market indicators for June 2021 (based on REINZ data seasonally adjusted by ANZ Research)
Median house price House price index # of
monthly
sales
Monthly
%
change
Average
days to
sell Level Annual %
change
3-mth %
change
Annual %
change
3-mth %
change
Northland $715,164 32.5 5.8 25.8 6.0 220 +27% 33
Auckland $1,147,796 25.0 4.9 25.7 4.9 2,887 +10% 31
Waikato $740,345 19.5 5.1 33.7 8.2 768 +20% 27
Bay of Plenty $850,907 31.4 3.2 35.0 6.0 477 +8% 30
Gisborne $630,272 37.4 15.0 44 -12% 40
Hawke’s Bay $712,932 24.8 8.0 32.8 6.6 203 -2% 28
Manawatu-Whanganui $585,294 36.0 7.2 48.8 8.6 345 +27% 24
Taranaki $588,570 41.1 8.8 34.7 8.3 192 +21% 29
Wellington $900,463 29.6 4.0 43.1 8.0 711 +1% 29
Tasman, Nelson & Marlborough $734,530 24.4 6.5 243 +25% 27
Canterbury $578,712 21.2 6.3 26.3 7.3 1,125 +5% 25
Otago $673,382 17.4 5.3 27.0 4.5 378 +2% 32
West Coast $289,204 28.8 2.7 59 +1% 35
Southland $427,268 22.9 4.2 24.2 3.5 162 +18% 23
New Zealand $812,046 28.7 3.2 30.0 6.4 7,869 +10% 30
Feature Article: A pictorial essay on New Zealand interest
rates and debt
ANZ New Zealand Property Focus | July 2021 7
Summary
As 2021 has progressed, it has become increasingly
clear that the economy has recovered well and is
steaming ahead so quickly that it’s high time for the
Reserve Bank (RBNZ) to start unwinding the
emergency stimulus delivered in response to the crisis.
The RBNZ has already scaled back and then formally
ended quantitative easing (“money printing”) and the
next logical step is to start lifting the OCR, with the
first hike expected next month.
While on the one hand that’s an endorsement of the
strength of the economic rebound and the lift in
confidence (and house prices), it also means
borrowers will face higher interest costs in the months
and years ahead. In this Feature, we discuss what
markets are telling us about how high interest rates
might go, compare that to past cycles, and discuss
some of the factors that will determine how high
interest rates can go over coming years.
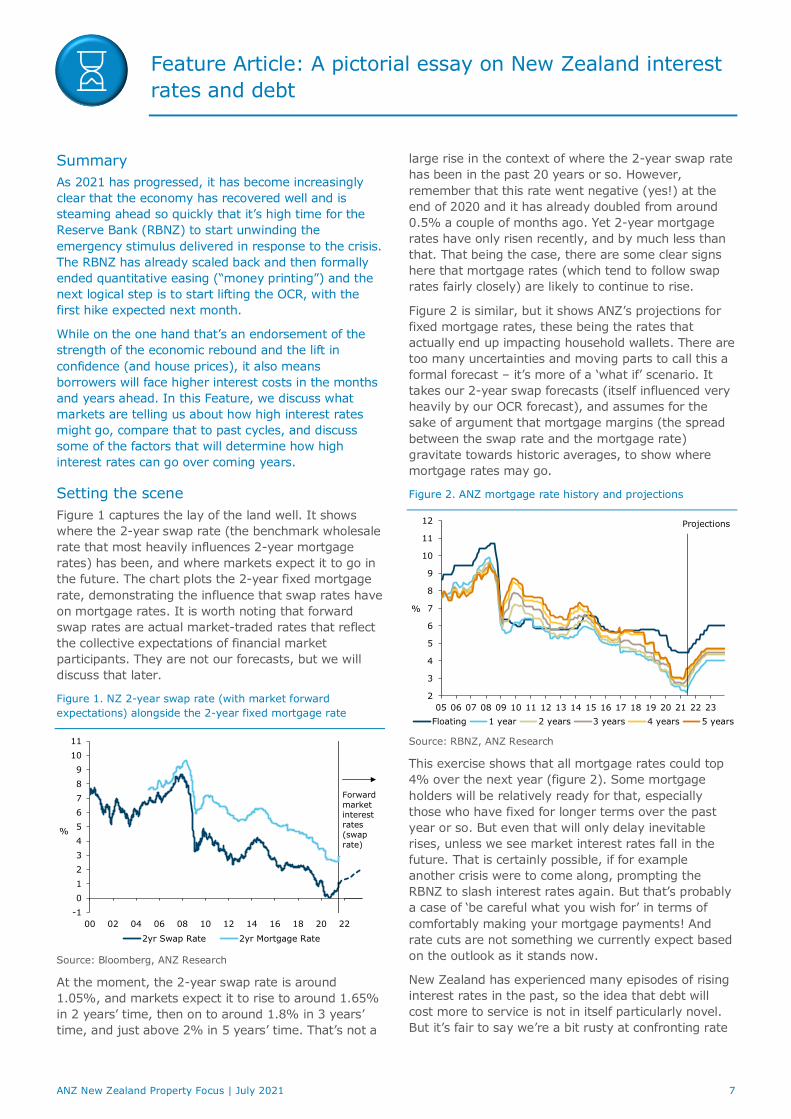
Setting the scene
Figure 1 captures the lay of the land well. It shows
where the 2-year swap rate (the benchmark wholesale
rate that most heavily influences 2-year mortgage
rates) has been, and where markets expect it to go in
the future. The chart plots the 2-year fixed mortgage
rate, demonstrating the influence that swap rates have
on mortgage rates. It is worth noting that forward
swap rates are actual market-traded rates that reflect
the collective expectations of financial market
participants. They are not our forecasts, but we will
discuss that later.
Figure 1. NZ 2-year swap rate (with market forward
expectations) alongside the 2-year fixed mortgage rate
Source: Bloomberg, ANZ Research
At the moment, the 2-year swap rate is around
1.05%, and markets expect it to rise to around 1.65%
in 2 years’ time, then on to around 1.8% in 3 years’
time, and just above 2% in 5 years’ time. That’s not a
large rise in the context of where the 2-year swap rate
has been in the past 20 years or so. However,
remember that this rate went negative (yes!) at the
end of 2020 and it has already doubled from around
0.5% a couple of months ago. Yet 2-year mortgage
rates have only risen recently, and by much less than
that. That being the case, there are some clear signs
here that mortgage rates (which tend to follow swap
rates fairly closely) are likely to continue to rise.
Figure 2 is similar, but it shows ANZ’s projections for
fixed mortgage rates, these being the rates that
actually end up impacting household wallets. There are
too many uncertainties and moving parts to call this a
formal forecast – it’s more of a ‘what if’ scenario. It
takes our 2-year swap forecasts (itself influenced very
heavily by our OCR forecast), and assumes for the
sake of argument that mortgage margins (the spread
between the swap rate and the mortgage rate)
gravitate towards historic averages, to show where
mortgage rates may go.
Figure 2. ANZ mortgage rate history and projections
Source: RBNZ, ANZ Research
This exercise shows that all mortgage rates could top
4% over the next year (figure 2). Some mortgage
holders will be relatively ready for that, especially
those who have fixed for longer terms over the past
year or so. But even that will only delay inevitable
rises, unless we see market interest rates fall in the
future. That is certainly possible, if for example
another crisis were to come along, prompting the
RBNZ to slash interest rates again. But that’s probably
a case of ‘be careful what you wish for’ in terms of
comfortably making your mortgage payments! And
rate cuts are not something we currently expect based
on the outlook as it stands now.
New Zealand has experienced many episodes of rising
interest rates in the past, so the idea that debt will
cost more to service is not in itself particularly novel.
But it’s fair to say we’re a bit rusty at confronting rate
-1
0
1
2
3
4
5
6
7
8
9
10
11
00 02 04 06 08 10 12 14 16 18 20 22
%
2yr Swap Rate 2yr Mortgage Rate
Forward
market
interest
rates
(swap
rate)
2
3
4
5
6
7
8
9
10
11
12
05 06 07 08 09 10 11 12 13 14 15 16 17 18 19 20 21 22 23
%
Floating 1 year 2 years 3 years 4 years 5 years
Projections
Feature Article: A pictorial essay on New Zealand interest
rates and debt
ANZ New Zealand Property Focus | July 2021 8
rises. And what will make the upcoming increase in
interest rates unique is that household debt levels
have never been as high they are now, nor grown as
quickly as they have over the preceding 12 months.
And on top of that, households have minimal levels of
time-certainty, having understandably opted for
shorter rather than longer-term fixed mortgage terms
for cost reasons. The Government has gone in the
other direction, having extended the term of its
borrowing to beyond 20 years.
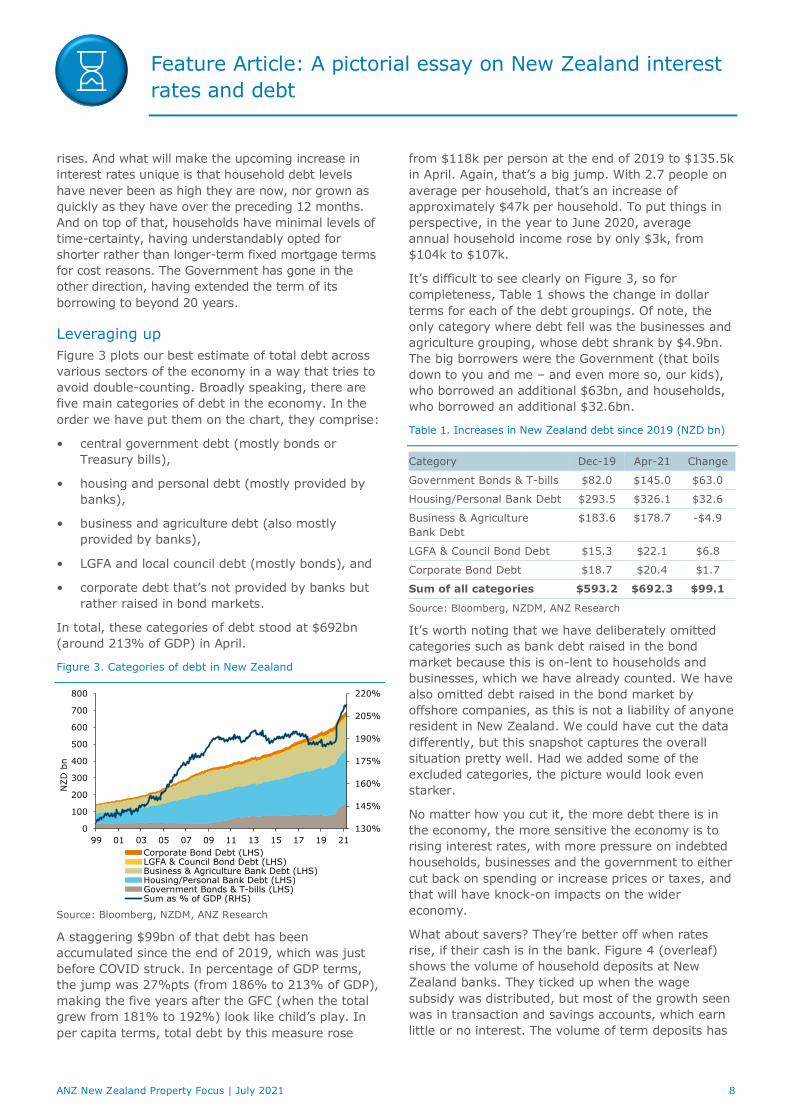
Leveraging up
Figure 3 plots our best estimate of total debt across
various sectors of the economy in a way that tries to
avoid double-counting. Broadly speaking, there are
five main categories of debt in the economy. In the
order we have put them on the chart, they comprise:
• central government debt (mostly bonds or
Treasury bills),
• housing and personal debt (mostly provided by
banks),
• business and agriculture debt (also mostly
provided by banks),
• LGFA and local council debt (mostly bonds), and
• corporate debt that’s not provided by banks but
rather raised in bond markets.
In total, these categories of debt stood at $692bn
(around 213% of GDP) in April.
Figure 3. Categories of debt in New Zealand
Source: Bloomberg, NZDM, ANZ Research
A staggering $99bn of that debt has been
accumulated since the end of 2019, which was just
before COVID struck. In percentage of GDP terms,
the jump was 27%pts (from 186% to 213% of GDP),
making the five years after the GFC (when the total
grew from 181% to 192%) look like child’s play. In
per capita terms, total debt by this measure rose
from $118k per person at the end of 2019 to $135.5k
in April. Again, that’s a big jump. With 2.7 people on
average per household, that’s an increase of
approximately $47k per household. To put things in
perspective, in the year to June 2020, average
annual household income rose by only $3k, from
$104k to $107k.
It’s difficult to see clearly on Figure 3, so for
completeness, Table 1 shows the change in dollar
terms for each of the debt groupings. Of note, the
only category where debt fell was the businesses and
agriculture grouping, whose debt shrank by $4.9bn.
The big borrowers were the Government (that boils
down to you and me – and even more so, our kids),
who borrowed an additional $63bn, and households,
who borrowed an additional $32.6bn.
Table 1. Increases in New Zealand debt since 2019 (NZD bn)
Category Dec-19 Apr-21 Change
Government Bonds & T-bills $82.0 $145.0 $63.0
Housing/Personal Bank Debt $293.5 $326.1 $32.6
Business & Agriculture
Bank Debt
$183.6 $178.7 -$4.9
LGFA & Council Bond Debt $15.3 $22.1 $6.8
Corporate Bond Debt $18.7 $20.4 $1.7
Sum of all categories $593.2 $692.3 $99.1
Source: Bloomberg, NZDM, ANZ Research
It’s worth noting that we have deliberately omitted
categories such as bank debt raised in the bond
market because this is on-lent to households and
businesses, which we have already counted. We have
also omitted debt raised in the bond market by
offshore companies, as this is not a liability of anyone
resident in New Zealand. We could have cut the data
differently, but this snapshot captures the overall
situation pretty well. Had we added some of the
excluded categories, the picture would look even
starker.
No matter how you cut it, the more debt there is in
the economy, the more sensitive the economy is to
rising interest rates, with more pressure on indebted
households, businesses and the government to either
cut back on spending or increase prices or taxes, and
that will have knock-on impacts on the wider
economy.
What about savers? They’re better off when rates
rise, if their cash is in the bank. Figure 4 (overleaf)
shows the volume of household deposits at New
Zealand banks. They ticked up when the wage
subsidy was distributed, but most of the growth seen
was in transaction and savings accounts, which earn
little or no interest. The volume of term deposits has
130%
145%
160%
175%
190%
205%
220%
0
100
200
300
400
500
600
700
800
99 01 03 05 07 09 11 13 15 17 19 21
NZD
bn
Corporate Bond Debt (LHS)LGFA & Council Bond Debt (LHS)Business & Agriculture Bank Debt (LHS)Housing/Personal Bank Debt (LHS)Government Bonds & T-bills (LHS)Sum as % of GDP (RHS)
Feature Article: A pictorial essay on New Zealand interest
rates and debt
ANZ New Zealand Property Focus | July 2021 9
actually shrunk since last year, thanks mainly to less-
attractive term deposit rates recently. Since the GFC,
term deposits have generally paid interest at a rate
that significantly exceeds the OCR. However, with the
OCR at 0.25%, even with a wide margin, term
deposit rates have been low, and the lack of take-up
at the household level will dilute the positive impact
of rising interest rates.
Figure 4. Household deposits
Source: RBNZ, ANZ Research
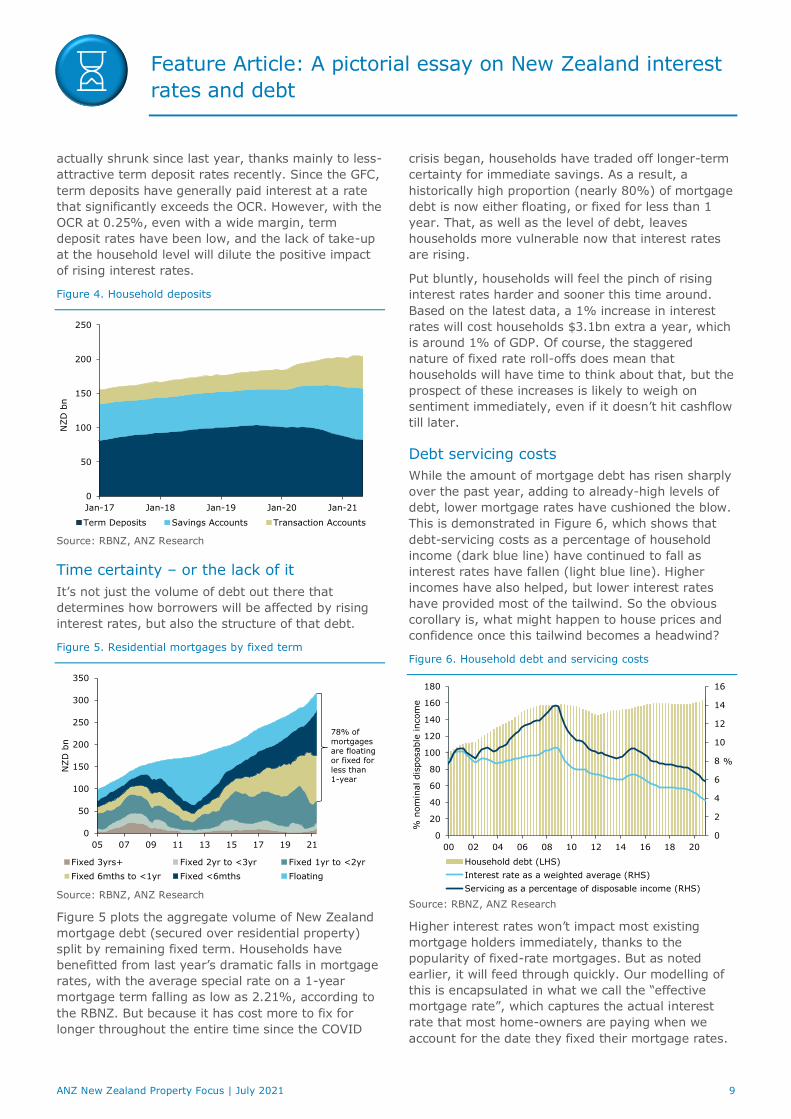
Time certainty – or the lack of it
It’s not just the volume of debt out there that
determines how borrowers will be affected by rising
interest rates, but also the structure of that debt.
Figure 5. Residential mortgages by fixed term
Source: RBNZ, ANZ Research
Figure 5 plots the aggregate volume of New Zealand
mortgage debt (secured over residential property)
split by remaining fixed term. Households have
benefitted from last year’s dramatic falls in mortgage
rates, with the average special rate on a 1-year
mortgage term falling as low as 2.21%, according to
the RBNZ. But because it has cost more to fix for
longer throughout the entire time since the COVID
crisis began, households have traded off longer-term
certainty for immediate savings. As a result, a
historically high proportion (nearly 80%) of mortgage
debt is now either floating, or fixed for less than 1
year. That, as well as the level of debt, leaves
households more vulnerable now that interest rates
are rising.
Put bluntly, households will feel the pinch of rising
interest rates harder and sooner this time around.
Based on the latest data, a 1% increase in interest
rates will cost households $3.1bn extra a year, which
is around 1% of GDP. Of course, the staggered
nature of fixed rate roll-offs does mean that
households will have time to think about that, but the
prospect of these increases is likely to weigh on
sentiment immediately, even if it doesn’t hit cashflow
till later.
Debt servicing costs
While the amount of mortgage debt has risen sharply
over the past year, adding to already-high levels of
debt, lower mortgage rates have cushioned the blow.
This is demonstrated in Figure 6, which shows that
debt-servicing costs as a percentage of household
income (dark blue line) have continued to fall as
interest rates have fallen (light blue line). Higher
incomes have also helped, but lower interest rates
have provided most of the tailwind. So the obvious
corollary is, what might happen to house prices and
confidence once this tailwind becomes a headwind?
Figure 6. Household debt and servicing costs
Source: RBNZ, ANZ Research
Higher interest rates won’t impact most existing
mortgage holders immediately, thanks to the
popularity of fixed-rate mortgages. But as noted
earlier, it will feed through quickly. Our modelling of
this is encapsulated in what we call the “effective
mortgage rate”, which captures the actual interest
rate that most home-owners are paying when we
account for the date they fixed their mortgage rates.
0
50
100
150
200
250
Jan-17 Jan-18 Jan-19 Jan-20 Jan-21
NZD
bn
Term Deposits Savings Accounts Transaction Accounts
0
50
100
150
200
250
300
350
05 07 09 11 13 15 17 19 21
NZD
bn
Fixed 3yrs+ Fixed 2yr to <3yr Fixed 1yr to <2yr
Fixed 6mths to <1yr Fixed <6mths Floating
78% of
mortgages are floating or fixed for
less than 1-year
0
2
4
6
8
10
12
14
16
0
20
40
60
80
100
120
140
160
180
00 02 04 06 08 10 12 14 16 18 20
%
% n
om
inal dis
posable
incom
e
Household debt (LHS)
Interest rate as a weighted average (RHS)
Servicing as a percentage of disposable income (RHS)
Feature Article: A pictorial essay on New Zealand interest
rates and debt
ANZ New Zealand Property Focus | July 2021 10
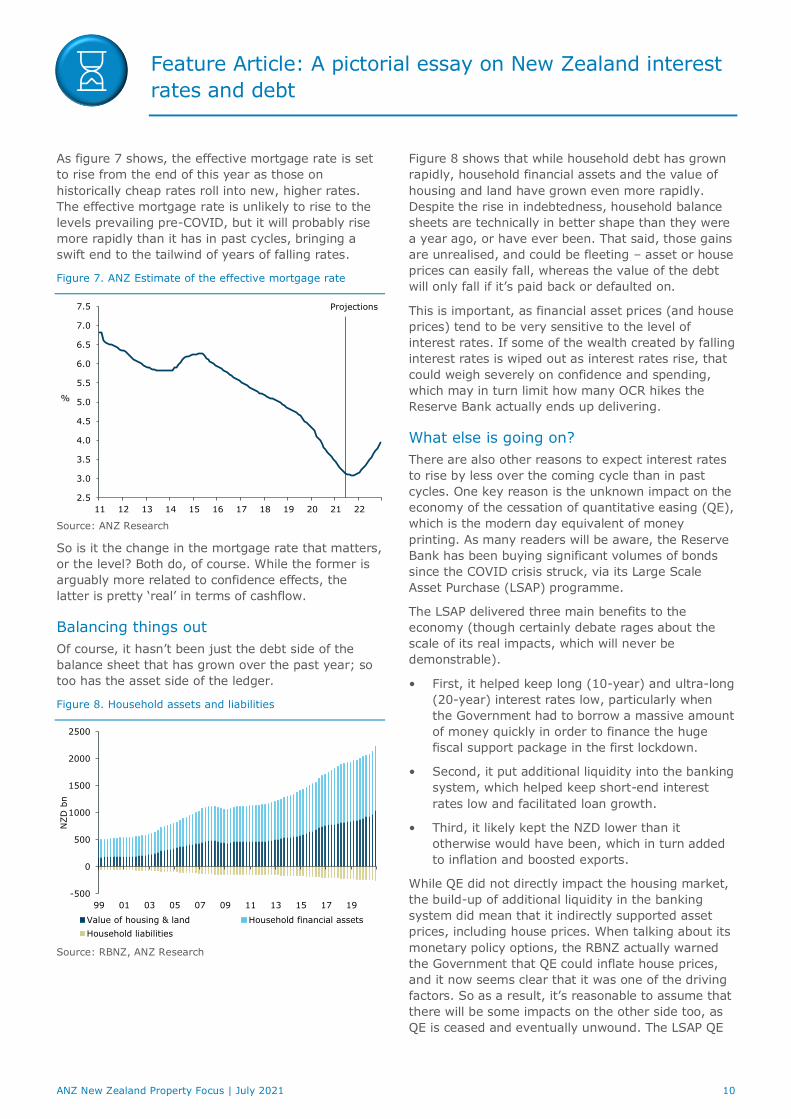
As figure 7 shows, the effective mortgage rate is set
to rise from the end of this year as those on
historically cheap rates roll into new, higher rates.
The effective mortgage rate is unlikely to rise to the
levels prevailing pre-COVID, but it will probably rise
more rapidly than it has in past cycles, bringing a
swift end to the tailwind of years of falling rates.
Figure 7. ANZ Estimate of the effective mortgage rate
Source: ANZ Research
So is it the change in the mortgage rate that matters,
or the level? Both do, of course. While the former is
arguably more related to confidence effects, the
latter is pretty ‘real’ in terms of cashflow.
Balancing things out
Of course, it hasn’t been just the debt side of the
balance sheet that has grown over the past year; so
too has the asset side of the ledger.
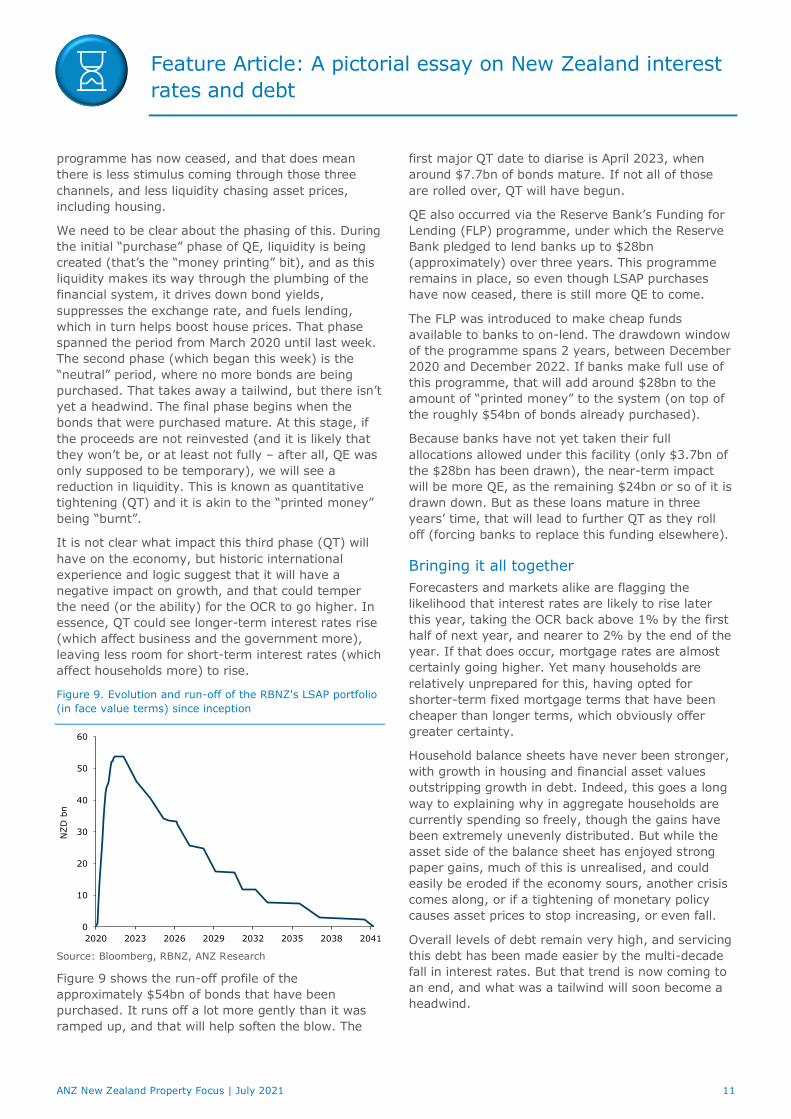
Figure 8. Household assets and liabilities
Source: RBNZ, ANZ Research
Figure 8 shows that while household debt has grown
rapidly, household financial assets and the value of
housing and land have grown even more rapidly.
Despite the rise in indebtedness, household balance
sheets are technically in better shape than they were
a year ago, or have ever been. That said, those gains
are unrealised, and could be fleeting – asset or house
prices can easily fall, whereas the value of the debt
will only fall if it’s paid back or defaulted on.
This is important, as financial asset prices (and house
prices) tend to be very sensitive to the level of
interest rates. If some of the wealth created by falling
interest rates is wiped out as interest rates rise, that
could weigh severely on confidence and spending,
which may in turn limit how many OCR hikes the
Reserve Bank actually ends up delivering.
What else is going on?
There are also other reasons to expect interest rates
to rise by less over the coming cycle than in past
cycles. One key reason is the unknown impact on the
economy of the cessation of quantitative easing (QE),
which is the modern day equivalent of money
printing. As many readers will be aware, the Reserve
Bank has been buying significant volumes of bonds
since the COVID crisis struck, via its Large Scale
Asset Purchase (LSAP) programme.
The LSAP delivered three main benefits to the
economy (though certainly debate rages about the
scale of its real impacts, which will never be
demonstrable).
• First, it helped keep long (10-year) and ultra-long
(20-year) interest rates low, particularly when
the Government had to borrow a massive amount
of money quickly in order to finance the huge
fiscal support package in the first lockdown.
• Second, it put additional liquidity into the banking
system, which helped keep short-end interest
rates low and facilitated loan growth.
• Third, it likely kept the NZD lower than it
otherwise would have been, which in turn added
to inflation and boosted exports.
While QE did not directly impact the housing market,
the build-up of additional liquidity in the banking
system did mean that it indirectly supported asset
prices, including house prices. When talking about its
monetary policy options, the RBNZ actually warned
the Government that QE could inflate house prices,
and it now seems clear that it was one of the driving
factors. So as a result, it’s reasonable to assume that
there will be some impacts on the other side too, as
QE is ceased and eventually unwound. The LSAP QE
2.5
3.0
3.5
4.0
4.5
5.0
5.5
6.0
6.5
7.0
7.5
11 12 13 14 15 16 17 18 19 20 21 22
%
Projections
-500
0
500
1000
1500
2000
2500
99 01 03 05 07 09 11 13 15 17 19
NZD
bn
Value of housing & land Household financial assets
Household liabilities
Feature Article: A pictorial essay on New Zealand interest
rates and debt
ANZ New Zealand Property Focus | July 2021 11
programme has now ceased, and that does mean
there is less stimulus coming through those three
channels, and less liquidity chasing asset prices,
including housing.
We need to be clear about the phasing of this. During
the initial “purchase” phase of QE, liquidity is being
created (that’s the “money printing” bit), and as this
liquidity makes its way through the plumbing of the
financial system, it drives down bond yields,
suppresses the exchange rate, and fuels lending,
which in turn helps boost house prices. That phase
spanned the period from March 2020 until last week.
The second phase (which began this week) is the
“neutral” period, where no more bonds are being
purchased. That takes away a tailwind, but there isn’t
yet a headwind. The final phase begins when the
bonds that were purchased mature. At this stage, if
the proceeds are not reinvested (and it is likely that
they won’t be, or at least not fully – after all, QE was
only supposed to be temporary), we will see a
reduction in liquidity. This is known as quantitative
tightening (QT) and it is akin to the “printed money”
being “burnt”.
It is not clear what impact this third phase (QT) will
have on the economy, but historic international
experience and logic suggest that it will have a
negative impact on growth, and that could temper
the need (or the ability) for the OCR to go higher. In
essence, QT could see longer-term interest rates rise
(which affect business and the government more),
leaving less room for short-term interest rates (which
affect households more) to rise.
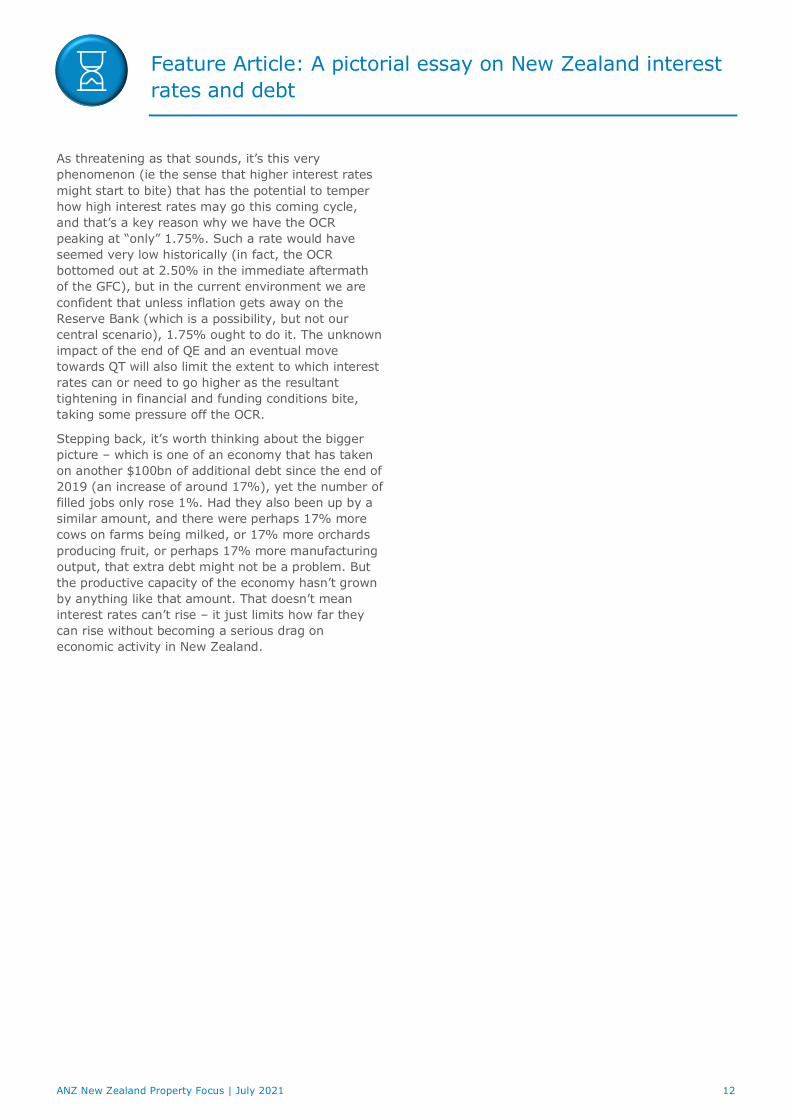
Figure 9. Evolution and run-off of the RBNZ's LSAP portfolio
(in face value terms) since inception
Source: Bloomberg, RBNZ, ANZ Research
Figure 9 shows the run-off profile of the
approximately $54bn of bonds that have been
purchased. It runs off a lot more gently than it was
ramped up, and that will help soften the blow. The
first major QT date to diarise is April 2023, when
around $7.7bn of bonds mature. If not all of those
are rolled over, QT will have begun.
QE also occurred via the Reserve Bank’s Funding for
Lending (FLP) programme, under which the Reserve
Bank pledged to lend banks up to $28bn
(approximately) over three years. This programme
remains in place, so even though LSAP purchases
have now ceased, there is still more QE to come.
The FLP was introduced to make cheap funds
available to banks to on-lend. The drawdown window
of the programme spans 2 years, between December
2020 and December 2022. If banks make full use of
this programme, that will add around $28bn to the
amount of “printed money” to the system (on top of
the roughly $54bn of bonds already purchased).
Because banks have not yet taken their full
allocations allowed under this facility (only $3.7bn of
the $28bn has been drawn), the near-term impact
will be more QE, as the remaining $24bn or so of it is
drawn down. But as these loans mature in three
years’ time, that will lead to further QT as they roll
off (forcing banks to replace this funding elsewhere).
Bringing it all together
Forecasters and markets alike are flagging the
likelihood that interest rates are likely to rise later
this year, taking the OCR back above 1% by the first
half of next year, and nearer to 2% by the end of the
year. If that does occur, mortgage rates are almost
certainly going higher. Yet many households are
relatively unprepared for this, having opted for
shorter-term fixed mortgage terms that have been
cheaper than longer terms, which obviously offer
greater certainty.
Household balance sheets have never been stronger,
with growth in housing and financial asset values
outstripping growth in debt. Indeed, this goes a long
way to explaining why in aggregate households are
currently spending so freely, though the gains have
been extremely unevenly distributed. But while the
asset side of the balance sheet has enjoyed strong
paper gains, much of this is unrealised, and could
easily be eroded if the economy sours, another crisis
comes along, or if a tightening of monetary policy
causes asset prices to stop increasing, or even fall.
Overall levels of debt remain very high, and servicing
this debt has been made easier by the multi-decade
fall in interest rates. But that trend is now coming to
an end, and what was a tailwind will soon become a
headwind.
0
10
20
30
40
50
60
2020 2023 2026 2029 2032 2035 2038 2041
NZD
bn
Feature Article: A pictorial essay on New Zealand interest
rates and debt
ANZ New Zealand Property Focus | July 2021 12
As threatening as that sounds, it’s this very
phenomenon (ie the sense that higher interest rates
might start to bite) that has the potential to temper
how high interest rates may go this coming cycle,
and that’s a key reason why we have the OCR
peaking at “only” 1.75%. Such a rate would have
seemed very low historically (in fact, the OCR
bottomed out at 2.50% in the immediate aftermath
of the GFC), but in the current environment we are
confident that unless inflation gets away on the
Reserve Bank (which is a possibility, but not our
central scenario), 1.75% ought to do it. The unknown
impact of the end of QE and an eventual move
towards QT will also limit the extent to which interest
rates can or need to go higher as the resultant
tightening in financial and funding conditions bite,
taking some pressure off the OCR.
Stepping back, it’s worth thinking about the bigger
picture – which is one of an economy that has taken
on another $100bn of additional debt since the end of
2019 (an increase of around 17%), yet the number of
filled jobs only rose 1%. Had they also been up by a
similar amount, and there were perhaps 17% more
cows on farms being milked, or 17% more orchards
producing fruit, or perhaps 17% more manufacturing
output, that extra debt might not be a problem. But
the productive capacity of the economy hasn’t grown
by anything like that amount. That doesn’t mean
interest rates can’t rise – it just limits how far they
can rise without becoming a serious drag on
economic activity in New Zealand.
Mortgage borrowing strategy
ANZ New Zealand Property Focus | July 2021 13
This is not personal advice nor financial advice about
any product or service. The opinions and research
contained in this document are provided for information
only, are intended to be general in nature and do not
take into account your financial situation or goals.
Please refer to the Important Notice.
Summary
Average fixed mortgage rates offered by the four major
banks all rose over the past month, with the biggest
lifts seen in 1 and 2-year rates, and lesser rises seen in
4 and 5-year rates. The 1-year rate remains the
cheapest rate, and at around 2½% it is still relatively
low by historical standards. However, the average 5-
year rate is now a shade above 4%, a level not seen
since before the COVID crisis struck. The current term
structure of mortgage rates poses a real challenge to
borrowers. That’s because longer-term rates are now
much higher, but equally, if you fix for 1 year, it’s very
likely going to cost more to re-fix in the future. Our
breakeven analysis shows that it might be marginally
cheaper to fix for 2-3 years but it’s a close call. The
choice will depend on whether you prefer certainty or
else think there’s a good chance the RBNZ won’t need
to hike by as much as markets are expecting.
Our view
July was the first month since the COVID crisis hit that
mortgage rates rose across the board (on average
across the four major banks). Until now, we have only
seen rises in longer terms, which has happened while
the 1-year has continued to decline. But all fixed rates
are now higher, leaving the floating rate as the only
unchanged offering.
These changes – and the way things have evolved over
the past few months – present borrowers with a real
challenge. That’s because the lower the 1-year rate has
gone, the more attractive it has become, especially as
longer-term rates have risen. But as pleasant as it may
have been to fix at ever-lower rates, opting for a 1-
year fix offers very little time certainty, and now that
the consensus is that the OCR is headed up, all of a
sudden time certainty is what people want.
Unfortunately, the situation remains just as challenging
after this month’s changes for new borrowers (or those
on floating, or rolling off an historic fixed rate).
Shorter-term rates have risen by more (that in itself
won’t be welcome news to borrowers), but the yawning
gap between 1-year rates and longer-term rates means
that it takes some conviction to pay up for certainty.
Most borrowers will be aware that the RBNZ is now
expected to steadily raise the OCR. With inflation rising
and the economy well and truly back on its feet, we
expect the first hike to be delivered next month,
followed by five further hikes, taking the OCR from its
current level of 0.25% to 1.75%. That in turn speaks to
fixed mortgage rates all heading towards, and likely
above, 4% over the next 18 months.
That picture could change, of course, but against this
backdrop, for borrowers there are really only two
choices: pay up now and fix for longer, or fix for a
shorter period knowing that it is probably going to cost
more – potentially a lot more – later. At the moment,
we think the former is likely the better choice, but only
just. Indeed, our breakeven analysis shows that
interest rates will need to rise by a little less than we
expect for fixing for longer to be worth it. If borrowers
place any value on certainty, and it might cost less
over the long run to fix for longer (even if only just),
then it is still probably worth it. The main risk would be
if the RBNZ end up hiking by less (or more slowly) than
we currently expect.
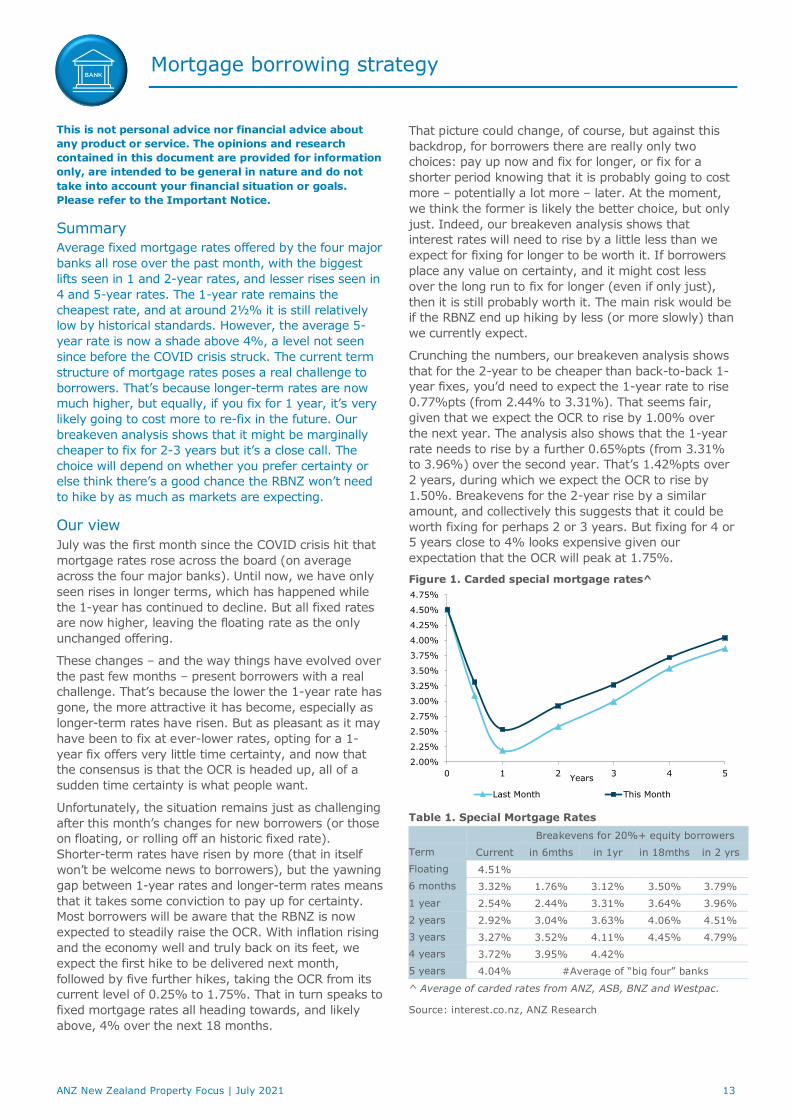
Crunching the numbers, our breakeven analysis shows
that for the 2-year to be cheaper than back-to-back 1-
year fixes, you’d need to expect the 1-year rate to rise
0.77%pts (from 2.44% to 3.31%). That seems fair,
given that we expect the OCR to rise by 1.00% over
the next year. The analysis also shows that the 1-year
rate needs to rise by a further 0.65%pts (from 3.31%
to 3.96%) over the second year. That’s 1.42%pts over
2 years, during which we expect the OCR to rise by
1.50%. Breakevens for the 2-year rise by a similar
amount, and collectively this suggests that it could be
worth fixing for perhaps 2 or 3 years. But fixing for 4 or
5 years close to 4% looks expensive given our
expectation that the OCR will peak at 1.75%.
Figure 1. Carded special mortgage rates^
Table 1. Special Mortgage Rates
Breakevens for 20%+ equity borrowers
Term Current in 6mths in 1yr in 18mths in 2 yrs
Floating 4.51%
6 months 3.32% 1.76% 3.12% 3.50% 3.79%
1 year 2.54% 2.44% 3.31% 3.64% 3.96%
2 years 2.92% 3.04% 3.63% 4.06% 4.51%
3 years 3.27% 3.52% 4.11% 4.45% 4.79%
4 years 3.72% 3.95% 4.42%
5 years 4.04% #Average of “big four” banks
^ Average of carded rates from ANZ, ASB, BNZ and Westpac.
Source: interest.co.nz, ANZ Research
2.00%
2.25%
2.50%
2.75%
3.00%
3.25%
3.50%
3.75%
4.00%
4.25%
4.50%
4.75%
0 1 2 3 4 5
Last Month This Month
Years
Key forecasts
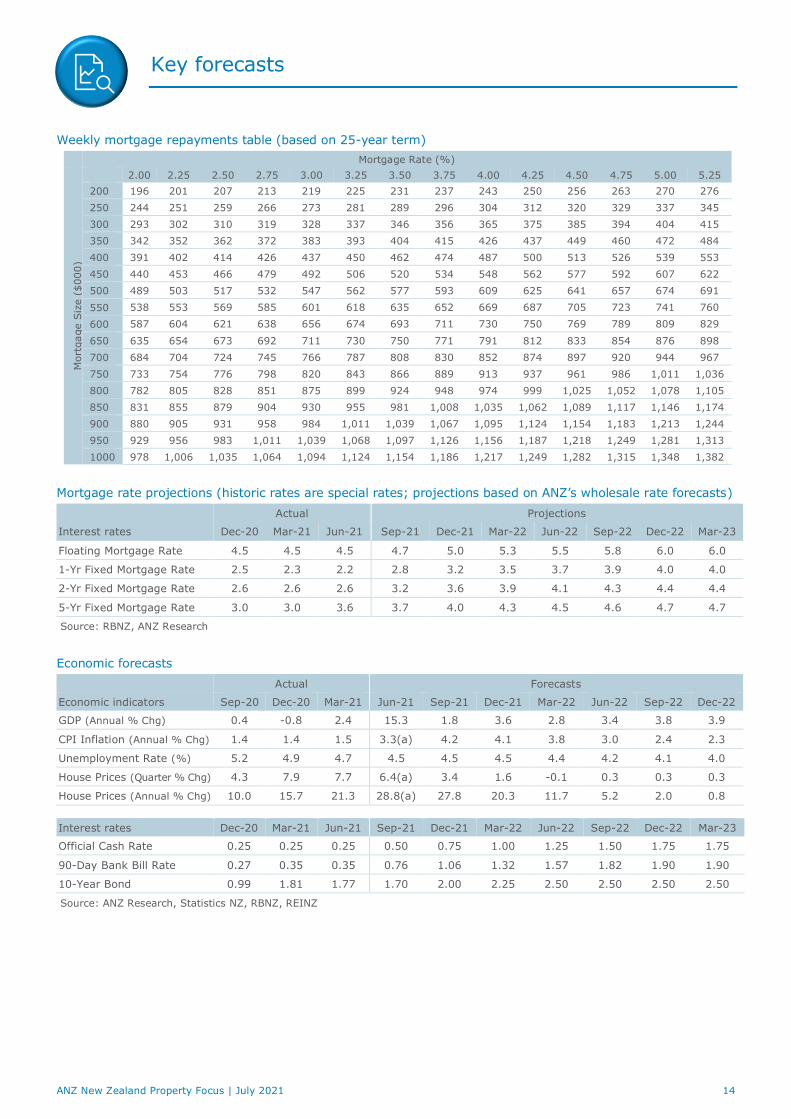
ANZ New Zealand Property Focus | July 2021 14
Weekly mortgage repayments table (based on 25-year term)
Mortgage Rate (%)
Mort
gage S
ize (
$000)
2.00 2.25 2.50 2.75 3.00 3.25 3.50 3.75 4.00 4.25 4.50 4.75 5.00 5.25
200 196 201 207 213 219 225 231 237 243 250 256 263 270 276
250 244 251 259 266 273 281 289 296 304 312 320 329 337 345
300 293 302 310 319 328 337 346 356 365 375 385 394 404 415
350 342 352 362 372 383 393 404 415 426 437 449 460 472 484
400 391 402 414 426 437 450 462 474 487 500 513 526 539 553
450 440 453 466 479 492 506 520 534 548 562 577 592 607 622
500 489 503 517 532 547 562 577 593 609 625 641 657 674 691
550 538 553 569 585 601 618 635 652 669 687 705 723 741 760
600 587 604 621 638 656 674 693 711 730 750 769 789 809 829
650 635 654 673 692 711 730 750 771 791 812 833 854 876 898
700 684 704 724 745 766 787 808 830 852 874 897 920 944 967
750 733 754 776 798 820 843 866 889 913 937 961 986 1,011 1,036
800 782 805 828 851 875 899 924 948 974 999 1,025 1,052 1,078 1,105
850 831 855 879 904 930 955 981 1,008 1,035 1,062 1,089 1,117 1,146 1,174
900 880 905 931 958 984 1,011 1,039 1,067 1,095 1,124 1,154 1,183 1,213 1,244
950 929 956 983 1,011 1,039 1,068 1,097 1,126 1,156 1,187 1,218 1,249 1,281 1,313
1000 978 1,006 1,035 1,064 1,094 1,124 1,154 1,186 1,217 1,249 1,282 1,315 1,348 1,382
Mortgage rate projections (historic rates are special rates; projections based on ANZ’s wholesale rate forecasts)
Actual Projections
Interest rates Dec-20 Mar-21 Jun-21 Sep-21 Dec-21 Mar-22 Jun-22 Sep-22 Dec-22 Mar-23
Floating Mortgage Rate 4.5 4.5 4.5 4.7 5.0 5.3 5.5 5.8 6.0 6.0
1-Yr Fixed Mortgage Rate 2.5 2.3 2.2 2.8 3.2 3.5 3.7 3.9 4.0 4.0
2-Yr Fixed Mortgage Rate 2.6 2.6 2.6 3.2 3.6 3.9 4.1 4.3 4.4 4.4
5-Yr Fixed Mortgage Rate 3.0 3.0 3.6 3.7 4.0 4.3 4.5 4.6 4.7 4.7
Source: RBNZ, ANZ Research
Economic forecasts
Actual Forecasts
Economic indicators Sep-20 Dec-20 Mar-21 Jun-21 Sep-21 Dec-21 Mar-22 Jun-22 Sep-22 Dec-22
GDP (Annual % Chg) 0.4 -0.8 2.4 15.3 1.8 3.6 2.8 3.4 3.8 3.9
CPI Inflation (Annual % Chg) 1.4 1.4 1.5 3.3(a) 4.2 4.1 3.8 3.0 2.4 2.3
Unemployment Rate (%) 5.2 4.9 4.7 4.5 4.5 4.5 4.4 4.2 4.1 4.0
House Prices (Quarter % Chg) 4.3 7.9 7.7 6.4(a) 3.4 1.6 -0.1 0.3 0.3 0.3
House Prices (Annual % Chg) 10.0 15.7 21.3 28.8(a) 27.8 20.3 11.7 5.2 2.0 0.8
Interest rates Dec-20 Mar-21 Jun-21 Sep-21 Dec-21 Mar-22 Jun-22 Sep-22 Dec-22 Mar-23
Official Cash Rate 0.25 0.25 0.25 0.50 0.75 1.00 1.25 1.50 1.75 1.75
90-Day Bank Bill Rate 0.27 0.35 0.35 0.76 1.06 1.32 1.57 1.82 1.90 1.90
10-Year Bond 0.99 1.81 1.77 1.70 2.00 2.25 2.50 2.50 2.50 2.50
Source: ANZ Research, Statistics NZ, RBNZ, REINZ

Contact us
ANZ New Zealand Property Focus | July 2021 15
Meet the team
We welcome your questions and feedback. Click here for more information about our team.
Sharon Zollner
Chief Economist
Follow Sharon on Twitter
@sharon_zollner
Telephone: +64 27 664 3554 Email: [email protected]
General enquiries:
Follow ANZ Research
@ANZ_Research (global)
David Croy
Senior Strategist
Market developments, interest
rates, FX, unconventional
monetary policy, liaison with
market participants.
Telephone: +64 4 576 1022 Email: [email protected]
Susan Kilsby
Agricultural Economist
Primary industry developments
and outlook, structural change
and regulation, liaison with
industry.
Telephone: +64 21 633 469 Email: [email protected]
Liz Kendall (maternity leave)
Senior Economist
Research co-ordinator, publication
strategy, property market
analysis, monetary and prudential
policy.
Telephone: +64 27 240 9969 Email: [email protected]
Miles Workman
Senior Economist
Macroeconomic forecast co-
ordinator, fiscal policy, economic
risk assessment and credit
developments.
Telephone: +64 21 661 792 Email: [email protected]
Finn Robinson
Economist
Macroeconomic forecasting,
economic developments, labour
market dynamics, inflation and
monetary policy.
Telephone: +64 21 629 553 Email: [email protected]
Kyle Uerata
Economic Statistician
Economic statistics, ANZ
proprietary data (including ANZ
Business Outlook), data capability
and infrastructure.
Telephone: +64 21 633 894 Email: [email protected]
Natalie Denne
PA / Desktop Publisher
Business management, general
enquiries, mailing lists,
publications, chief economist’s
diary.
Telephone: +64 21 253 6808 Email: [email protected]
Important notice
ANZ NZ CPI Review | March Quarter 2021 16
Last updated: 9 April 2021
This document is intended for ANZ’s Institutional, Markets and Private Banking clients. It should not be forwarded, copied or distributed. The opinions and research contained in this document are (a) not personal advice nor financial advice about any product or service; (b) provided for information only; and (c) intended to be general in nature and does not take into
account your financial situation or goals.
This document may be restricted by law in certain jurisdictions. Persons who receive this document must inform themselves about and observe all relevant restrictions.
Disclaimer for all jurisdictions: This document is prepared and distributed in your country/region by either: Australia and New Zealand Banking Group Limited (ABN11 005 357 522) (ANZ); or its relevant subsidiary or branch (each, an Affiliate), as appropriate or as set out below.
This document is distributed on the basis that it is only for the information of the specified recipient or permitted user of the relevant website (recipients).
This document is solely for informational purposes and nothing contained within is intended to be an invitation, solicitation or offer by ANZ to sell, or buy, receive or provide any product or service, or to participate in a particular trading strategy.
Distribution of this document to you is only as may be permissible by the laws of your jurisdiction, and is not directed to or intended for distribution or use by recipients resident or located in jurisdictions where its use or distribution would be contrary to those laws or regulations, or in jurisdictions where ANZ would be subject to additional licensing or registration requirements. Further, the products and services mentioned in this document may not be available in all countries.
ANZ in no way provides any financial, legal, taxation or investment advice to you in connection with any product or service discussed in this document. Before making any investment decision, recipients should seek independent financial, legal, tax and other relevant advice having regard to their particular circumstances.
Whilst care has been taken in the preparation of this document and the information contained within is believed to be accurate, ANZ does not represent or warrant the accuracy or completeness of the information Further, ANZ does not accept any responsibility to inform you of any matter that subsequently comes to its notice, which may affect the accuracy of the information in this document.
Preparation of this document and the opinions expressed in it may involve material elements of subjective judgement and analysis. Unless specifically stated otherwise: they are current on the date of this document and are subject to change without notice; and, all price information is indicative only. Any opinions expressed in this document are subject to change at any time without notice.
ANZ does not guarantee the performance of any product mentioned in this document. All investments entail a risk and may result in both profits and losses. Past performance is not necessarily an indicator of future performance. The products and services described in this document may not be suitable for all investors, and transacting in these products or services may be considered risky.
ANZ expressly disclaims any responsibility and shall not be liable for any loss, damage, claim, liability, proceedings, cost or expense (Liability) arising directly or indirectly and whether in tort (including negligence), contract, equity or otherwise out of or in connection with this document to the extent permissible under relevant law. Please note, the contents of this document have not been reviewed by any regulatory body or authority in any jurisdiction.
ANZ and its Affiliates may have an interest in the subject matter of this document. They may receive fees from customers for dealing in the products or services described in this document, and their staff and introducers of business may share in such fees or remuneration that may be influenced by total sales, at all times received and/or apportioned in accordance with local regulatory requirements. Further, they or their customers may have or have had interests or long or short positions in the products or services described in this document, and
may at any time make purchases and/or sales in them as principal or agent, as well as act (or have acted) as a market maker in such products. This document is published in accordance with ANZ’s policies on conflicts of interest and ANZ maintains appropriate information barriers to control the flow of information between businesses within it and its Affiliates.
Your ANZ point of contact can assist with any questions about this document including for further information on these disclosures of interest.
Country/region specific information: Unless stated otherwise, this document is distributed by Australia and New Zealand Banking Group Limited (ANZ).
Australia. ANZ holds an Australian Financial Services licence no. 234527. For a copy of ANZ's Financial Services Guide please or request
from your ANZ point of contact.
Brazil, Brunei, India, Japan, Kuwait, Malaysia, Switzerland, Taiwan. This document is distributed in each of these jurisdictions by ANZ on a cross-border basis.
Cambodia. The information contained in this document is confidential and is provided solely for your use upon your request. This does not constitute or form part of an offer or solicitation of any offer to engage services, nor should it or any part of it form the basis of, or be relied in any connection with, any contract or commitment whatsoever. ANZ does not have a licence to undertake banking operations or securities business or similar business, in Cambodia. By requesting financial services from ANZ, you agree, represent and warrant that you
are engaging our services wholly outside of Cambodia and subject to the laws of the contract governing the terms of our engagement.
European Economic Area (EEA): United Kingdom. ANZ is authorised in the United Kingdom by the Prudential Regulation Authority (PRA) and is subject to regulation by the Financial Conduct Authority (FCA) and limited regulation by the PRA. Details about the extent of our regulation by the PRA are available from us on request. This document is distributed in the United Kingdom by Australia and New
Zealand Banking Group Limited ANZ solely for the information of persons who would come within the FCA definition of “eligible counterparty” or “professional client”. It is not intended for and must not be distributed to any person who would come within the FCA definition of “retail client”. Nothing here excludes or restricts any duty or liability to a customer which ANZ may have under the UK Financial Services and Markets Act 2000 or under the regulatory system as defined in the Rules of the Prudential Regulation Authority (PRA) and the FCA. ANZ is authorised in the United Kingdom by the PRA and is subject to regulation by the FCA and limited regulation by the PRA. Details about the extent of our regulation by the PRA are available from us on request.
Fiji. For Fiji regulatory purposes, this document and any views and recommendations are not to be deemed as investment advice. Fiji investors must seek licensed professional advice should they wish to make any investment in relation to this document.
Hong Kong. This publication is issued or distributed in Hong Kong by the Hong Kong branch of ANZ, which is registered at the Hong Kong
Monetary Authority to conduct Type 1 (dealing in securities), Type 4 (advising on securities) and Type 6 (advising on corporate finance) regulated activities. The contents of this publication have not been reviewed by any regulatory authority in Hong Kong.
India. If this document is received in India, only you (the specified recipient) may print it provided that before doing so, you specify on it
your name and place of printing.
Important notice
ANZ New Zealand Property Focus | July 2021 17
Myanmar. This publication is intended to be general and part of ANZ’s customer service and marketing activities when implementing its functions as a licensed bank. This publication is not Securities Investment Advice (as that term is defined in the Myanmar Securities Transaction Law 2013).
New Zealand. This material is for information purposes only and is not financial advice about any product or service. We recommend
seeking financial advice about your financial situation and goals before acquiring or disposing of (or not acquiring or disposing of) a financial product.
Oman. ANZ neither has a registered business presence nor a representative office in Oman and does not undertake banking business or
provide financial services in Oman. Consequently ANZ is not regulated by either the Central Bank of Oman or Oman’s Capital Market Authority. The information contained in this document is for discussion purposes only and neither constitutes an offer of securities in Oman as contemplated by the Commercial Companies Law of Oman (Royal Decree 4/74) or the Capital Market Law of Oman (Royal Decree 80/98), nor does it constitute an offer to sell, or the solicitation of any offer to buy non-Omani securities in Oman as contemplated by Article 139 of the Executive Regulations to the Capital Market Law (issued vide CMA Decision 1/2009). ANZ does not solicit business in Oman and the only circumstances in which ANZ sends information or material describing financial products or financial services to
recipients in Oman, is where such information or material has been requested from ANZ and the recipient understands, acknowledges and agrees that this document has not been approved by the CBO, the CMA or any other regulatory body or authority in Oman. ANZ does not market, offer, sell or distribute any financial or investment products or services in Oman and no subscription to any securities, products or financial services may or will be consummated within Oman. Nothing contained in this document is intended to constitute Omani investment, legal, tax, accounting or other professional advice.
People’s Republic of China (PRC). This document may be distributed by either ANZ or Australia and New Zealand Bank (China) Company Limited (ANZ China). Recipients must comply with all applicable laws and regulations of PRC, including any prohibitions on speculative transactions and CNY/CNH arbitrage trading. If this document is distributed by ANZ or an Affiliate (other than ANZ China), the following statement and the text below is applicable: No action has been taken by ANZ or any affiliate which would permit a public offering
of any products or services of such an entity or distribution or re-distribution of this document in the PRC. Accordingly, the products and services of such entities are not being offered or sold within the PRC by means of this document or any other document. This document may not be distributed, re-distributed or published in the PRC, except under circumstances that will result in compliance with any applicable laws and regulations. If and when the material accompanying this document relates to the products and/or services of ANZ China, the following statement and the text below is applicable: This document is distributed by ANZ China in the Mainland of the PRC.
Qatar. This document has not been, and will not be:
• lodged or registered with, or reviewed or approved by, the Qatar Central Bank (QCB), the Qatar Financial Centre (QFC) Authority, QFC Regulatory Authority or any other authority in the State of Qatar (Qatar); or
• authorised or licensed for distribution in Qatar,
and the information contained in this document does not, and is not intended to, constitute a public offer or other invitation in respect of securities in Qatar or the QFC. The financial products or services described in this document have not been, and will not be:
• registered with the QCB, QFC Authority, QFC Regulatory Authority or any other governmental authority in Qatar; or
• authorised or licensed for offering, marketing, issue or sale, directly or indirectly, in Qatar.
Accordingly, the financial products or services described in this document are not being, and will not be, offered, issued or sold in Qatar, and this document is not being, and will not be, distributed in Qatar. The offering, marketing, issue and sale of the financial products or
services described in this document and distribution of this document is being made in, and is subject to the laws, regulations and rules of, jurisdictions outside of Qatar and the QFC. Recipients of this document must abide by this restriction and not distribute this document in breach of this restriction. This document is being sent/issued to a limited number of institutional and/or sophisticated investors (i) upon their request and confirmation that they understand the statements above; and (ii) on the condition that it will not be provided to any person other than the original recipient, and is not for general circulation and may not be reproduced or used for any other purpose.
Singapore. This document is distributed in Singapore by the Singapore branch of ANZ solely for the information of “accredited investors”, “expert investors” or (as the case may be) “institutional investors” (each term as defined in the Securities and Futures Act Cap. 289 of Singapore). ANZ is licensed in Singapore under the Banking Act Cap. 19 of Singapore and is exempted from holding a financial adviser’s licence under Section 23(1)(a) of the Financial Advisers Act Cap. 100 of Singapore.
United Arab Emirates (UAE). This document is distributed in the UAE or the Dubai International Financial Centre (DIFC) (as applicable) by ANZ. This document does not, and is not intended to constitute: (a) an offer of securities anywhere in the UAE; (b) the carrying on or engagement in banking, financial and/or investment consultation business in the UAE under the rules and regulations made by the Central Bank of the UAE, the Emirates Securities and Commodities Authority or the UAE Ministry of Economy; (c) an offer of securities within the
meaning of the Dubai International Financial Centre Markets Law (DIFCML) No. 12 of 2004; and (d) a financial promotion, as defined under the DIFCML No. 1 of 200. ANZ DIFC Branch is regulated by the Dubai Financial Services Authority (DFSA) ANZ DIFC Branch is regulated by the Dubai Financial Services Authority (DFSA). The financial products or services described in this document are only available to persons who qualify as “Professional Clients” or “Market Counterparty” in accordance with the provisions of the DFSA rules.
United States. Except where this is a FX- related document, this document is distributed in the United States by ANZ Securities, Inc. (ANZ SI) which is a member of the Financial Regulatory Authority (FINRA) (www.finra.org) and registered with the SEC. ANZSI’s address is 277 Park Avenue, 31st Floor, New York, NY 10172, USA (Tel: +1 212 801 9160 Fax: +1 212 801 9163). ANZSI accepts responsibility for its content. Information on any securities referred to in this document may be obtained from ANZSI upon request. This document or material is intended for institutional use only – not retail. If you are an institutional customer wishing to effect transactions in any securities
referred to in this document you must contact ANZSI, not its affiliates. ANZSI is authorised as a broker-dealer only for institutional customers, not for US Persons (as “US person” is defined in Regulation S under the US Securities Act of 1933, as amended) who are individuals. If you have registered to use this website or have otherwise received this document and are a US Person who is an individual: to avoid loss, you should cease to use this website by unsubscribing or should notify the sender and you should not act on the contents of this document in any way. Non-U.S. analysts: Non-U.S. analysts may not be associated persons of ANZSI and therefore may not be subject
to FINRA Rule 2242 restrictions on communications with the subject company, public appearances and trading securities held by the analysts. Where this is an FX-related document, it is distributed in the United States by ANZ's New York Branch, which is also located at 277 Park Avenue, 31st Floor, New York, NY 10172, USA (Tel: +1 212 801 916 0 Fax: +1 212 801 9163).
Vietnam. This document is distributed in Vietnam by ANZ or ANZ Bank (Vietnam) Limited, a subsidiary of ANZ.
This document has been prepared by ANZ Bank New Zealand Limited, Level 26, 23-29 Albert Street, Auckland 1010, New Zealand, Ph 64 9 357 4094, e-mail [email protected], http://www.anz.co.nz