Embed Size (px)
Citation preview
NEW ZEALAND ECONOMICSANZ AGRI FOCUS
ANZ RESEARCH
SNAKES AND LADDERSFEATURE ARTICLE: AGRICULTURAL PRICE PREVIEW 2014/15
The outlook for farm-gate prices for the majority of primary sectors looks solid as we head into the 2014/15 season, with further incremental gains in prospect. This follows decent lifts in 2013/14 for many. The notable exceptions are forestry and dairy, where international prices have fallen further than initially expected, prompting recent downgrades to our forecasts for 2014/15. The NZD looks to have passed cycle highs and is an additional factor that could be supportive of farm-gate prices as the season progresses (i.e. NZD/USD is forecast to remain strong in the near term, but soften in the second half of the season).
THE MONTH IN REVIEW
After a warm and wet start to winter it turned cooler in July. Until the second half of July pasture and crop utilisation had been good due to favourable conditions. Dairy and viticulture have hit record production levels in 2014. Meat production forecasts have been pushed higher for 2013/14, but this could make for a larger drop-off in 2014/15.
RURAL PROPERTY MARKET
Rural property sales fi nished 2013/14 strongly, with fi nishing and arable prices hitting new records. Average livestock and arable property prices for 2013/14 appear to have risen by 10-15% y/y. Horticulture prices bounced back (+25% y/y). The year ahead could prove to be more challenging, with a materially lower milk payout and higher interest rates starting to fl ow through. This is likely to lead to softer activity – and eventually, prices – in 2014/15. Better farm-gate prices for the other sectors are likely to make it “steady as she goes”.
KEY COMMODITIES AND FINANCIAL MARKET VARIABLES
Dairy and forestry prices continue to be under pressure, but for most other sectors the outlook is stable. The high NZD remains a bug bear for all, but recent softening will help out, even if it still needs to go further.
BORROWING STRATEGY
Indicative rural lending rates have increased in the past two months, with the largest impact seen at the front of the curve. In contrast, longer-term rates are little changed, with global bond yields remaining anchored at low levels. However, that looks set to change. We favour further reducing exposure to fl oating rates, while increasing the proportion of exposure across several fi xed-rate terms.
ECONOMIC BACKDROP
Economic momentum has slowed from the break-neck pace of recent quarters as tight fi nancial conditions weigh on the outlook. Annual GDP growth looks set to slow from around 4% in mid-2014 to 3% in 2015.
EDUCATION CORNER: INDIA IN FOCUS
While there might be some new niche opportunities emerging in India, it ranked down our list as a longer-term opportunity compared with many other Asian markets. Two key impediments that need to be overcome are limited market access and a fragmented, underdeveloped cool chain. Indians also have strong food preferences, which limits opportunities for some products (i.e. beef), but creates them for others (i.e. dairy, and fruit & vegetables). Some of these dynamics are changing, but it is off a low base.
AUGUST 2014
INSIDE
Feature Article 2The Month in Review 28Rural Property Market 29Economic Indicators 31Key Commodities 33Borrowing Strategy 35Economic Backdrop 36Education Corner 37Key Tables and Forecasts 41
CONTRIBUTORS
Cameron BagrieChief EconomistTelephone: +64 4 802 2212E-mail: [email protected]
Con WilliamsRural EconomistTelephone: +64 4 802 2361E-mail: [email protected]
Carrick LucasStrategistTelephone: +64 4 802 2357E-mail: [email protected]
ANZ Agri Focus / August 2014 / 2 of 44
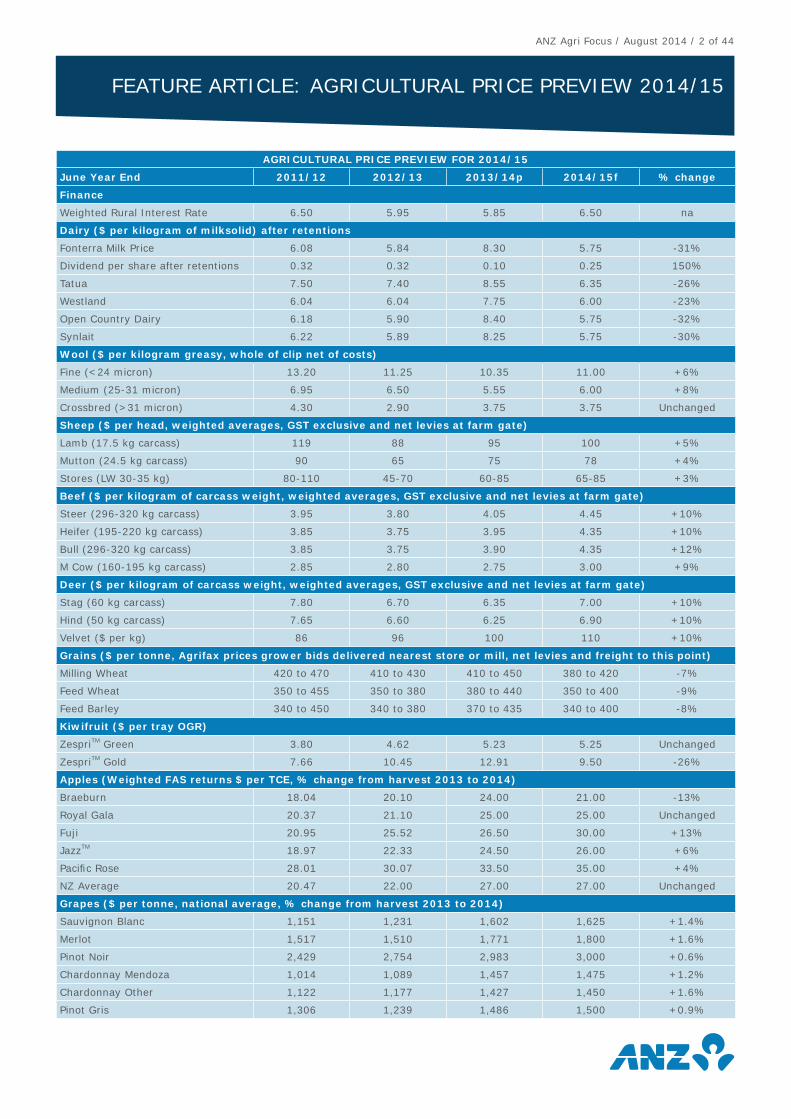
AGRICULTURAL PRICE PREVIEW FOR 2014/15
June Year End 2011/12 2012/13 2013/14p 2014/15f % change
Finance
Weighted Rural Interest Rate 6.50 5.95 5.85 6.50 na
Dairy ($ per kilogram of milksolid) after retentions
Fonterra Milk Price 6.08 5.84 8.30 5.75 -31%
Dividend per share after retentions 0.32 0.32 0.10 0.25 150%
Tatua 7.50 7.40 8.55 6.35 -26%
Westland 6.04 6.04 7.75 6.00 -23%
Open Country Dairy 6.18 5.90 8.40 5.75 -32%
Synlait 6.22 5.89 8.25 5.75 -30%
Wool ($ per kilogram greasy, whole of clip net of costs)
Fine (<24 micron) 13.20 11.25 10.35 11.00 +6%
Medium (25-31 micron) 6.95 6.50 5.55 6.00 +8%
Crossbred (>31 micron) 4.30 2.90 3.75 3.75 Unchanged
Sheep ($ per head, weighted averages, GST exclusive and net levies at farm gate)
Lamb (17.5 kg carcass) 119 88 95 100 +5%
Mutton (24.5 kg carcass) 90 65 75 78 +4%
Stores (LW 30-35 kg) 80-110 45-70 60-85 65-85 +3%
Beef ($ per kilogram of carcass weight, weighted averages, GST exclusive and net levies at farm gate)
Steer (296-320 kg carcass) 3.95 3.80 4.05 4.45 +10%
Heifer (195-220 kg carcass) 3.85 3.75 3.95 4.35 +10%
Bull (296-320 kg carcass) 3.85 3.75 3.90 4.35 +12%
M Cow (160-195 kg carcass) 2.85 2.80 2.75 3.00 +9%
Deer ($ per kilogram of carcass weight, weighted averages, GST exclusive and net levies at farm gate)
Stag (60 kg carcass) 7.80 6.70 6.35 7.00 +10%
Hind (50 kg carcass) 7.65 6.60 6.25 6.90 +10%
Velvet ($ per kg) 86 96 100 110 +10%
Grains ($ per tonne, Agrifax prices grower bids delivered nearest store or mill, net levies and freight to this point)
Milling Wheat 420 to 470 410 to 430 410 to 450 380 to 420 -7%
Feed Wheat 350 to 455 350 to 380 380 to 440 350 to 400 -9%
Feed Barley 340 to 450 340 to 380 370 to 435 340 to 400 -8%
Kiwifruit ($ per tray OGR)
ZespriTM Green 3.80 4.62 5.23 5.25 Unchanged
ZespriTM Gold 7.66 10.45 12.91 9.50 -26%
Apples (Weighted FAS returns $ per TCE, % change from harvest 2013 to 2014)
Braeburn 18.04 20.10 24.00 21.00 -13%
Royal Gala 20.37 21.10 25.00 25.00 Unchanged
Fuji 20.95 25.52 26.50 30.00 +13%
JazzTM 18.97 22.33 24.50 26.00 +6%
Pacifi c Rose 28.01 30.07 33.50 35.00 +4%
NZ Average 20.47 22.00 27.00 27.00 Unchanged
Grapes ($ per tonne, national average, % change from harvest 2013 to 2014)
Sauvignon Blanc 1,151 1,231 1,602 1,625 +1.4%
Merlot 1,517 1,510 1,771 1,800 +1.6%
Pinot Noir 2,429 2,754 2,983 3,000 +0.6%
Chardonnay Mendoza 1,014 1,089 1,457 1,475 +1.2%
Chardonnay Other 1,122 1,177 1,427 1,450 +1.6%
Pinot Gris 1,306 1,239 1,486 1,500 +0.9%
FEATURE ARTICLE: AGRICULTURAL PRICE PREVIEW 2014/15
ANZ Agri Focus / August 2014 / 3 of 44
SUMMARY
The outlook for farm-gate prices for the majority of primary sectors looks solid, with further incremental gains in prospect. This follows decent lifts in 2013/14 for many. The notable exceptions are forestry and dairy, where international prices have fallen further than initially expected, prompting recent downgrades to our forecasts for 2014/15. The NZD is buoyant at present but looks to have passed cycle highs and is set to soften in the second half of the season. The most signifi cant risk centres around the unwind of US quantitative easing and how prospective lifts in US interest rates impact on various emerging market economies (notably China) that leveraged heavily during 2009-2014.
Two important themes that emerged over the course of 2013/14 seem set to continue. First, NZ’s main soft commodities – and global commodities more generally – have begun to trade much more on their own fundamentals, as opposed to generalised macroeconomic and fi nancial market movements. Second, more inter-market competition for our exports is working in New Zealand’s favour.
The FAO index fi nished 2013 back 1.6% on the previous year. On an annual basis this was the smallest movement seen in global soft commodity markets in nearly 20 years. Since 2006 it hasn’t been uncharacteristic to see swings of plus or minus 20-30% in the FAO index. However, while overall it looked like a less volatile year for prices there were still large price movements in the sub-sectors, which offset one another.
This differentiation between sectors is completely different to the 2006-2012 period, when most of the sub-sector groups moved in tandem on the prospects for global growth, fi nancial market volatility, and policy-makers’ responses post-GFC. But as we have moved further away from the events of 2008, this relationship seems to be fading somewhat: the individual sectors have begun trading much more on their own fundamentals and less on broader macro-economic drivers. For New Zealand producers this gives a much clearer price signal and picture of the fundamentals for their products, which should help shape investment decisions.
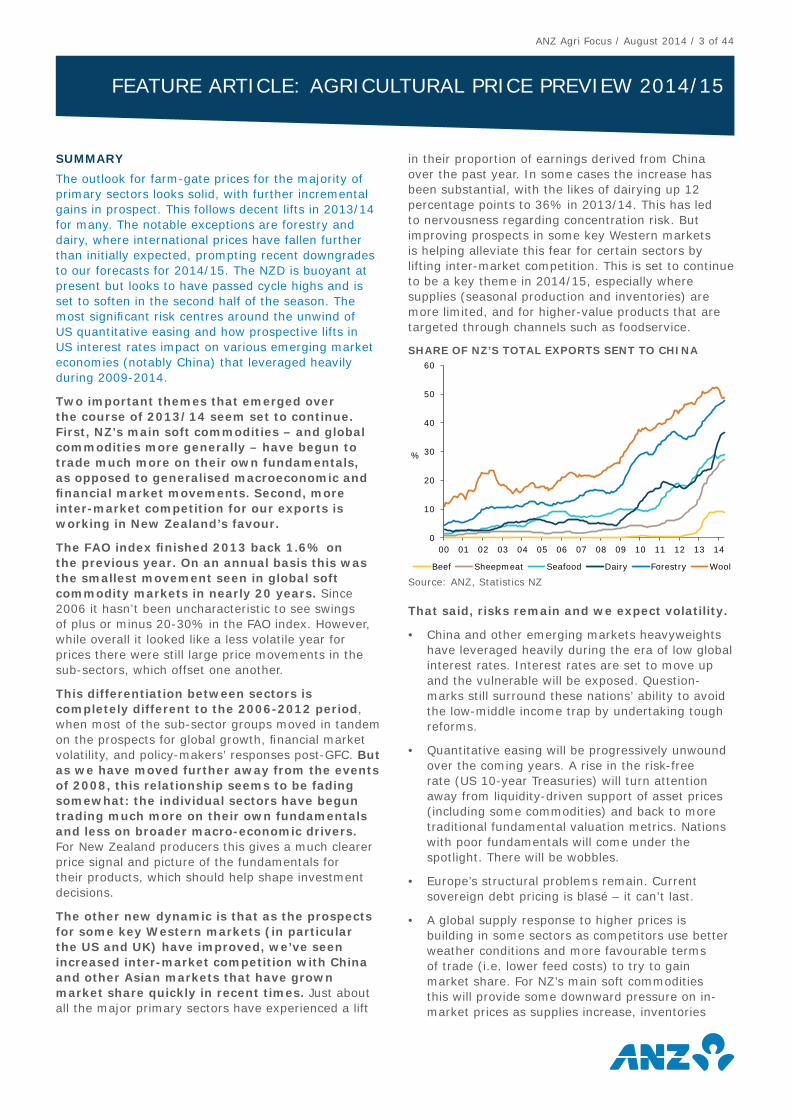
The other new dynamic is that as the prospects for some key Western markets (in particular the US and UK) have improved, we’ve seen increased inter-market competition with China and other Asian markets that have grown market share quickly in recent times. Just about all the major primary sectors have experienced a lift
in their proportion of earnings derived from China over the past year. In some cases the increase has been substantial, with the likes of dairying up 12 percentage points to 36% in 2013/14. This has led to nervousness regarding concentration risk. But improving prospects in some key Western markets is helping alleviate this fear for certain sectors by lifting inter-market competition. This is set to continue to be a key theme in 2014/15, especially where supplies (seasonal production and inventories) are more limited, and for higher-value products that are targeted through channels such as foodservice.
That said, risks remain and we expect volatility.
• China and other emerging markets heavyweights have leveraged heavily during the era of low global interest rates. Interest rates are set to move up and the vulnerable will be exposed. Question-marks still surround these nations’ ability to avoid the low-middle income trap by undertaking tough reforms.
• Quantitative easing will be progressively unwound over the coming years. A rise in the risk-free rate (US 10-year Treasuries) will turn attention away from liquidity-driven support of asset prices (including some commodities) and back to more traditional fundamental valuation metrics. Nations with poor fundamentals will come under the spotlight. There will be wobbles.
• Europe’s structural problems remain. Current sovereign debt pricing is blasé – it can’t last.
• A global supply response to higher prices is building in some sectors as competitors use better weather conditions and more favourable terms of trade (i.e. lower feed costs) to try to gain market share. For NZ’s main soft commodities this will provide some downward pressure on in-market prices as supplies increase, inventories
0
10
20
30
40
50
60
00 01 02 03 04 05 06 07 08 09 10 11 12 13 14
%
Beef Sheepmeat Seafood Dairy Forestry Wool
SHARE OF NZ’S TOTAL EXPORTS SENT TO CHINA
Source: ANZ, Statistics NZ
FEATURE ARTICLE: AGRICULTURAL PRICE PREVIEW 2014/15
ANZ Agri Focus / August 2014 / 4 of 44
are replenished, and the price competitiveness of substitute products improves. This seems likely to be more of a 2015/16 story for most.
New Zealand still looks well placed, with NZD set to act as an appropriate release valve.
DAIRY
We have revised our 2014/15 milk price range lower again to mid-to-high $5/kg MS, given stability in milk powder prices is yet to occur. We are currently at the middle of this range (i.e. $5.75/kg MS). Year-to-date prices are in the low $6/kg MS, but recent auctions have been in the low $5/kg MS range.
We continue to look for signs of stabilisation in international prices, but this could still be a little way off. The absence of Chinese demand (China took 55-60% of NZ’s milk powder exports at the peak earlier in the year) has been the main catalyst for the substantial fall at recent auctions. Recent reports suggest it could be 2-5 months before China re-enters the market, so softness looks set to continue. Other recent notable developments have been weaker demand from the Middle East, geopolitical tensions between Russia (second-largest global importer) and the West, as well as higher exportable production from key Northern Hemisphere markets.
We remain bullish on China’s medium-term import requirements, but think the bounce-back in prices once inventories have been run down will be more modest this cycle, with a more stable domestic production scene having emerged and softer end demand in 2014.
Most of the independent milk companies have been benchmarked off Fonterra, but there has been a widening in performance at the farm-gate in recent times. This seems to be linked to foreign exchange hedging performance, different product mixes, and expansion plans (infl uencing retentions).
All three factors seem likely to continue to contribute toward some divergence in performance during 2014/15, especially for Westland and Tatua who should receive better pricing for their product mix compared to Fonterra (based on our softer WMP view).
We’re more constructive on the 2015/16 season. Dairy prices have been notoriously volatile since 2006 and often the bigger the plunge, the larger the bounce-back. We expect a softer NZD and improvement in international prices will support a lift in the milk price back toward $6.50/kg MS in 2015/16.
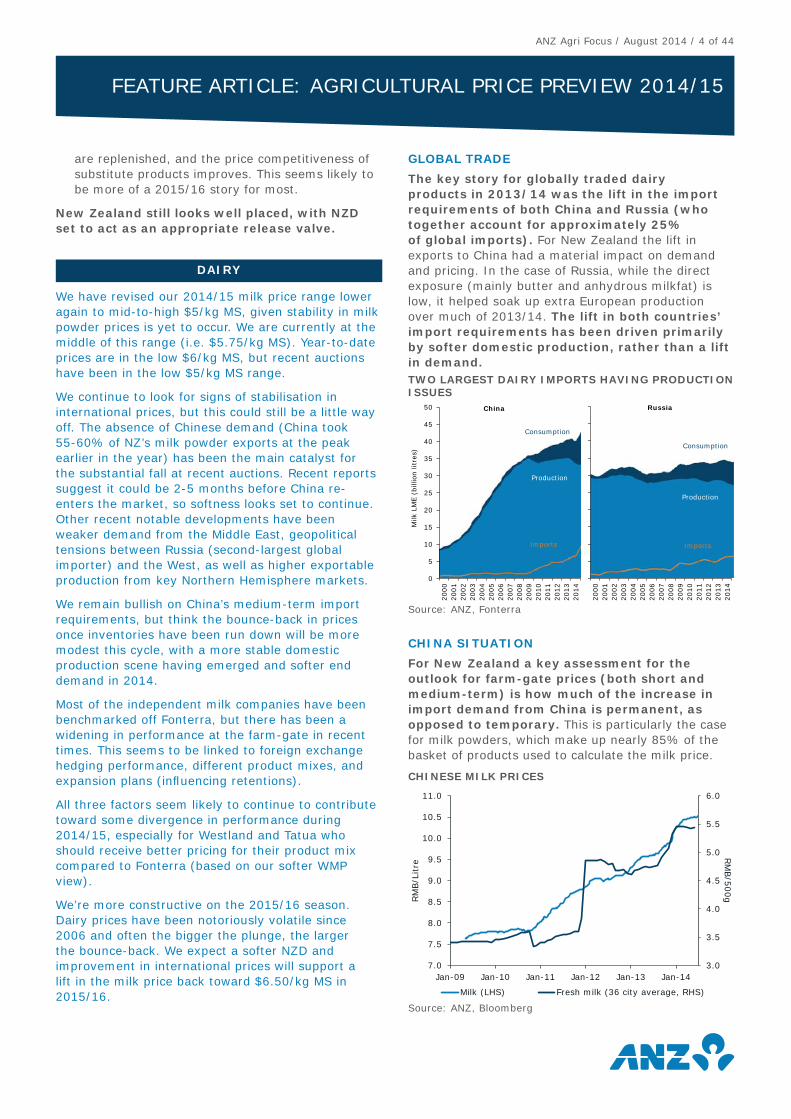
GLOBAL TRADE
The key story for globally traded dairy products in 2013/14 was the lift in the import requirements of both China and Russia (who together account for approximately 25% of global imports). For New Zealand the lift in exports to China had a material impact on demand and pricing. In the case of Russia, while the direct exposure (mainly butter and anhydrous milkfat) is low, it helped soak up extra European production over much of 2013/14. The lift in both countries’ import requirements has been driven primarily by softer domestic production, rather than a lift in demand.
CHINA SITUATION
For New Zealand a key assessment for the outlook for farm-gate prices (both short and medium-term) is how much of the increase in import demand from China is permanent, as opposed to temporary. This is particularly the case for milk powders, which make up nearly 85% of the basket of products used to calculate the milk price.
FEATURE ARTICLE: AGRICULTURAL PRICE PREVIEW 2014/15
0
5
10
15
20
25
30
35
40
45
50
2000
2001
2002
2003
2004
2005
2006
2007
2008
2009
2010
2011
2012
2013
2014
Milk
LM
E (
bill
ion litre
s)
Consumption
Production
Imports
China
2000
2001
2002
2003
2004
2005
2006
2007
2008
2009
2010
2011
2012
2013
2014
Consumption
Production
Imports
Russia
TWO LARGEST DAIRY IMPORTS HAVING PRODUCTION ISSUES
Source: ANZ, Fonterra
3.0
3.5
4.0
4.5
5.0
5.5
6.0
7.0
7.5
8.0
8.5
9.0
9.5
10.0
10.5
11.0
Jan-09 Jan-10 Jan-11 Jan-12 Jan-13 Jan-14
RM
B/5
00gR
MB/L
itre
Milk (LHS) Fresh milk (36 city average, RHS)
CHINESE MILK PRICES
Source: ANZ, Bloomberg
ANZ Agri Focus / August 2014 / 5 of 44
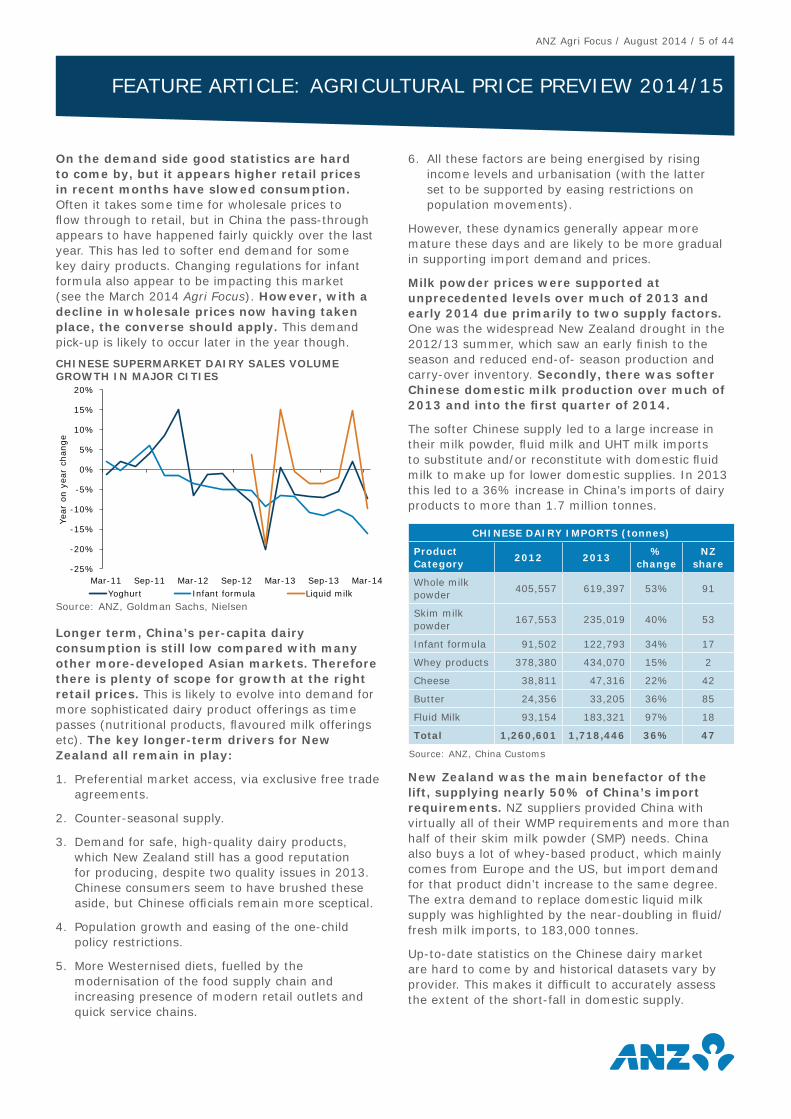
On the demand side good statistics are hard to come by, but it appears higher retail prices in recent months have slowed consumption. Often it takes some time for wholesale prices to fl ow through to retail, but in China the pass-through appears to have happened fairly quickly over the last year. This has led to softer end demand for some key dairy products. Changing regulations for infant formula also appear to be impacting this market (see the March 2014 Agri Focus). However, with a decline in wholesale prices now having taken place, the converse should apply. This demand pick-up is likely to occur later in the year though.
Longer term, China’s per-capita dairy consumption is still low compared with many other more-developed Asian markets. Therefore there is plenty of scope for growth at the right retail prices. This is likely to evolve into demand for more sophisticated dairy product offerings as time passes (nutritional products, fl avoured milk offerings etc). The key longer-term drivers for New Zealand all remain in play:
1. Preferential market access, via exclusive free trade agreements.
2. Counter-seasonal supply.
3. Demand for safe, high-quality dairy products, which New Zealand still has a good reputation for producing, despite two quality issues in 2013. Chinese consumers seem to have brushed these aside, but Chinese offi cials remain more sceptical.
4. Population growth and easing of the one-child policy restrictions.
5. More Westernised diets, fuelled by the modernisation of the food supply chain and increasing presence of modern retail outlets and quick service chains.
6. All these factors are being energised by rising income levels and urbanisation (with the latter set to be supported by easing restrictions on population movements).
However, these dynamics generally appear more mature these days and are likely to be more gradual in supporting import demand and prices.
Milk powder prices were supported at unprecedented levels over much of 2013 and early 2014 due primarily to two supply factors. One was the widespread New Zealand drought in the 2012/13 summer, which saw an early fi nish to the season and reduced end-of- season production and carry-over inventory. Secondly, there was softer Chinese domestic milk production over much of 2013 and into the fi rst quarter of 2014.
The softer Chinese supply led to a large increase in their milk powder, fl uid milk and UHT milk imports to substitute and/or reconstitute with domestic fl uid milk to make up for lower domestic supplies. In 2013 this led to a 36% increase in China’s imports of dairy products to more than 1.7 million tonnes.
CHINESE DAIRY IMPORTS (tonnes)
Product Category
2012 2013%
changeNZ
share
Whole milk powder
405,557 619,397 53% 91
Skim milk powder
167,553 235,019 40% 53
Infant formula 91,502 122,793 34% 17
Whey products 378,380 434,070 15% 2
Cheese 38,811 47,316 22% 42
Butter 24,356 33,205 36% 85
Fluid Milk 93,154 183,321 97% 18
Total 1,260,601 1,718,446 36% 47
Source: ANZ, China Customs
New Zealand was the main benefactor of the lift, supplying nearly 50% of China’s import requirements. NZ suppliers provided China with virtually all of their WMP requirements and more than half of their skim milk powder (SMP) needs. China also buys a lot of whey-based product, which mainly comes from Europe and the US, but import demand for that product didn’t increase to the same degree. The extra demand to replace domestic liquid milk supply was highlighted by the near-doubling in fl uid/fresh milk imports, to 183,000 tonnes.
Up-to-date statistics on the Chinese dairy market are hard to come by and historical datasets vary by provider. This makes it diffi cult to accurately assess the extent of the short-fall in domestic supply.
FEATURE ARTICLE: AGRICULTURAL PRICE PREVIEW 2014/15
-25%
-20%
-15%
-10%
-5%
0%
5%
10%
15%
20%
Mar-11 Sep-11 Mar-12 Sep-12 Mar-13 Sep-13 Mar-14
Yea
r on
yea
r ch
ange
Yoghurt Infant formula Liquid milk
CHINESE SUPERMARKET DAIRY SALES VOLUME GROWTH IN MAJOR CITIES
Source: ANZ, Goldman Sachs, Nielsen
ANZ Agri Focus / August 2014 / 6 of 44
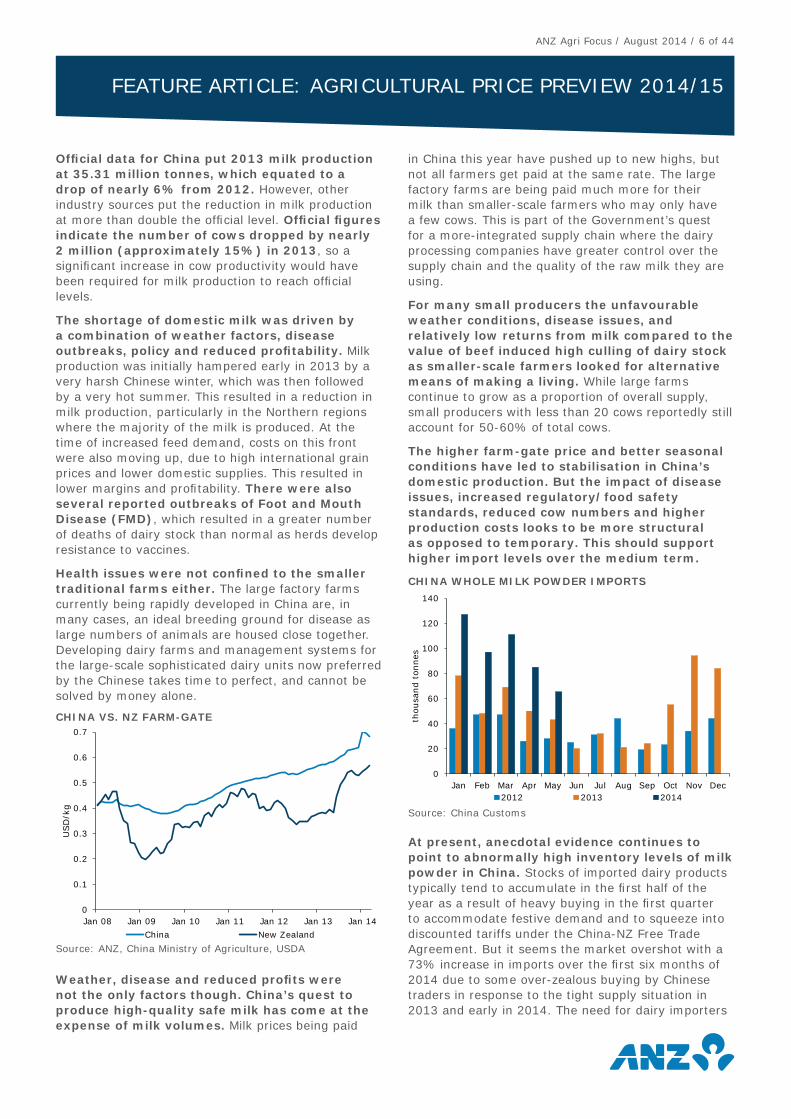
Offi cial data for China put 2013 milk production at 35.31 million tonnes, which equated to a drop of nearly 6% from 2012. However, other industry sources put the reduction in milk production at more than double the offi cial level. Offi cial fi gures indicate the number of cows dropped by nearly 2 million (approximately 15%) in 2013, so a signifi cant increase in cow productivity would have been required for milk production to reach offi cial levels.
The shortage of domestic milk was driven by a combination of weather factors, disease outbreaks, policy and reduced profi tability. Milk production was initially hampered early in 2013 by a very harsh Chinese winter, which was then followed by a very hot summer. This resulted in a reduction in milk production, particularly in the Northern regions where the majority of the milk is produced. At the time of increased feed demand, costs on this front were also moving up, due to high international grain prices and lower domestic supplies. This resulted in lower margins and profi tability. There were also several reported outbreaks of Foot and Mouth Disease (FMD), which resulted in a greater number of deaths of dairy stock than normal as herds develop resistance to vaccines.
Health issues were not confi ned to the smaller traditional farms either. The large factory farms currently being rapidly developed in China are, in many cases, an ideal breeding ground for disease as large numbers of animals are housed close together. Developing dairy farms and management systems for the large-scale sophisticated dairy units now preferred by the Chinese takes time to perfect, and cannot be solved by money alone.
Weather, disease and reduced profi ts were not the only factors though. China’s quest to produce high-quality safe milk has come at the expense of milk volumes. Milk prices being paid
in China this year have pushed up to new highs, but not all farmers get paid at the same rate. The large factory farms are being paid much more for their milk than smaller-scale farmers who may only have a few cows. This is part of the Government’s quest for a more-integrated supply chain where the dairy processing companies have greater control over the supply chain and the quality of the raw milk they are using.
For many small producers the unfavourable weather conditions, disease issues, and relatively low returns from milk compared to the value of beef induced high culling of dairy stock as smaller-scale farmers looked for alternative means of making a living. While large farms continue to grow as a proportion of overall supply, small producers with less than 20 cows reportedly still account for 50-60% of total cows.
The higher farm-gate price and better seasonal conditions have led to stabilisation in China’s domestic production. But the impact of disease issues, increased regulatory/food safety standards, reduced cow numbers and higher production costs looks to be more structural as opposed to temporary. This should support higher import levels over the medium term.
At present, anecdotal evidence continues to point to abnormally high inventory levels of milk powder in China. Stocks of imported dairy products typically tend to accumulate in the fi rst half of the year as a result of heavy buying in the fi rst quarter to accommodate festive demand and to squeeze into discounted tariffs under the China-NZ Free Trade Agreement. But it seems the market overshot with a 73% increase in imports over the fi rst six months of 2014 due to some over-zealous buying by Chinese traders in response to the tight supply situation in 2013 and early in 2014. The need for dairy importers
FEATURE ARTICLE: AGRICULTURAL PRICE PREVIEW 2014/15
0
0.1
0.2
0.3
0.4
0.5
0.6
0.7
Jan 08 Jan 09 Jan 10 Jan 11 Jan 12 Jan 13 Jan 14
USD
/kg
China New Zealand
CHINA VS. NZ FARM-GATE
Source: ANZ, China Ministry of Agriculture, USDA
0
20
40
60
80
100
120
140
Jan Feb Mar Apr May Jun Jul Aug Sep Oct Nov Dec
thou
sand t
onnes
2012 2013 2014
CHINA WHOLE MILK POWDER IMPORTS
Source: China Customs
ANZ Agri Focus / August 2014 / 7 of 44
to be registered to import infant formula from 1 May into China may have also led to some over-stocking due to uncertainty surrounding the change in regulations.
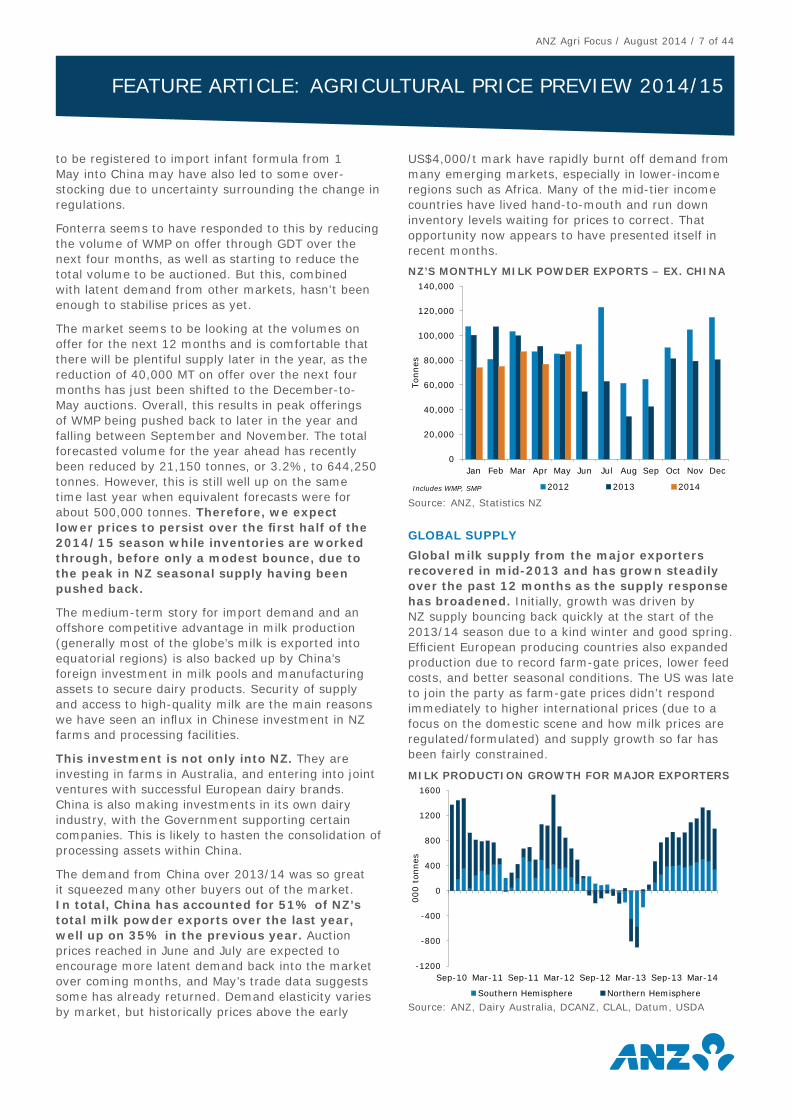
Fonterra seems to have responded to this by reducing the volume of WMP on offer through GDT over the next four months, as well as starting to reduce the total volume to be auctioned. But this, combined with latent demand from other markets, hasn’t been enough to stabilise prices as yet.
The market seems to be looking at the volumes on offer for the next 12 months and is comfortable that there will be plentiful supply later in the year, as the reduction of 40,000 MT on offer over the next four months has just been shifted to the December-to-May auctions. Overall, this results in peak offerings of WMP being pushed back to later in the year and falling between September and November. The total forecasted volume for the year ahead has recently been reduced by 21,150 tonnes, or 3.2%, to 644,250 tonnes. However, this is still well up on the same time last year when equivalent forecasts were for about 500,000 tonnes. Therefore, we expect lower prices to persist over the fi rst half of the 2014/15 season while inventories are worked through, before only a modest bounce, due to the peak in NZ seasonal supply having been pushed back.
The medium-term story for import demand and an offshore competitive advantage in milk production (generally most of the globe’s milk is exported into equatorial regions) is also backed up by China’s foreign investment in milk pools and manufacturing assets to secure dairy products. Security of supply and access to high-quality milk are the main reasons we have seen an infl ux in Chinese investment in NZ farms and processing facilities.
This investment is not only into NZ. They are investing in farms in Australia, and entering into joint ventures with successful European dairy brands. China is also making investments in its own dairy industry, with the Government supporting certain companies. This is likely to hasten the consolidation of processing assets within China.
The demand from China over 2013/14 was so great it squeezed many other buyers out of the market. In total, China has accounted for 51% of NZ’s total milk powder exports over the last year, well up on 35% in the previous year. Auction prices reached in June and July are expected to encourage more latent demand back into the market over coming months, and May’s trade data suggests some has already returned. Demand elasticity varies by market, but historically prices above the early
US$4,000/t mark have rapidly burnt off demand from many emerging markets, especially in lower-income regions such as Africa. Many of the mid-tier income countries have lived hand-to-mouth and run down inventory levels waiting for prices to correct. That opportunity now appears to have presented itself in recent months.
GLOBAL SUPPLY
Global milk supply from the major exporters recovered in mid-2013 and has grown steadily over the past 12 months as the supply response has broadened. Initially, growth was driven by NZ supply bouncing back quickly at the start of the 2013/14 season due to a kind winter and good spring. Effi cient European producing countries also expanded production due to record farm-gate prices, lower feed costs, and better seasonal conditions. The US was late to join the party as farm-gate prices didn’t respond immediately to higher international prices (due to a focus on the domestic scene and how milk prices are regulated/formulated) and supply growth so far has been fairly constrained.
FEATURE ARTICLE: AGRICULTURAL PRICE PREVIEW 2014/15
-1200
-800
-400
0
400
800
1200
1600
Sep-10 Mar-11 Sep-11 Mar-12 Sep-12 Mar-13 Sep-13 Mar-14
000 t
onnes
Southern Hemisphere Northern Hemisphere
MILK PRODUCTION GROWTH FOR MAJOR EXPORTERS
Source: ANZ, Dairy Australia, DCANZ, CLAL, Datum, USDA
0
20,000
40,000
60,000
80,000
100,000
120,000
140,000
Jan Feb Mar Apr May Jun Jul Aug Sep Oct Nov Dec
Ton
nes
2012 2013 2014Includes WMP, SMP
NZ’S MONTHLY MILK POWDER EXPORTS – EX. CHINA
Source: ANZ, Statistics NZ
ANZ Agri Focus / August 2014 / 8 of 44
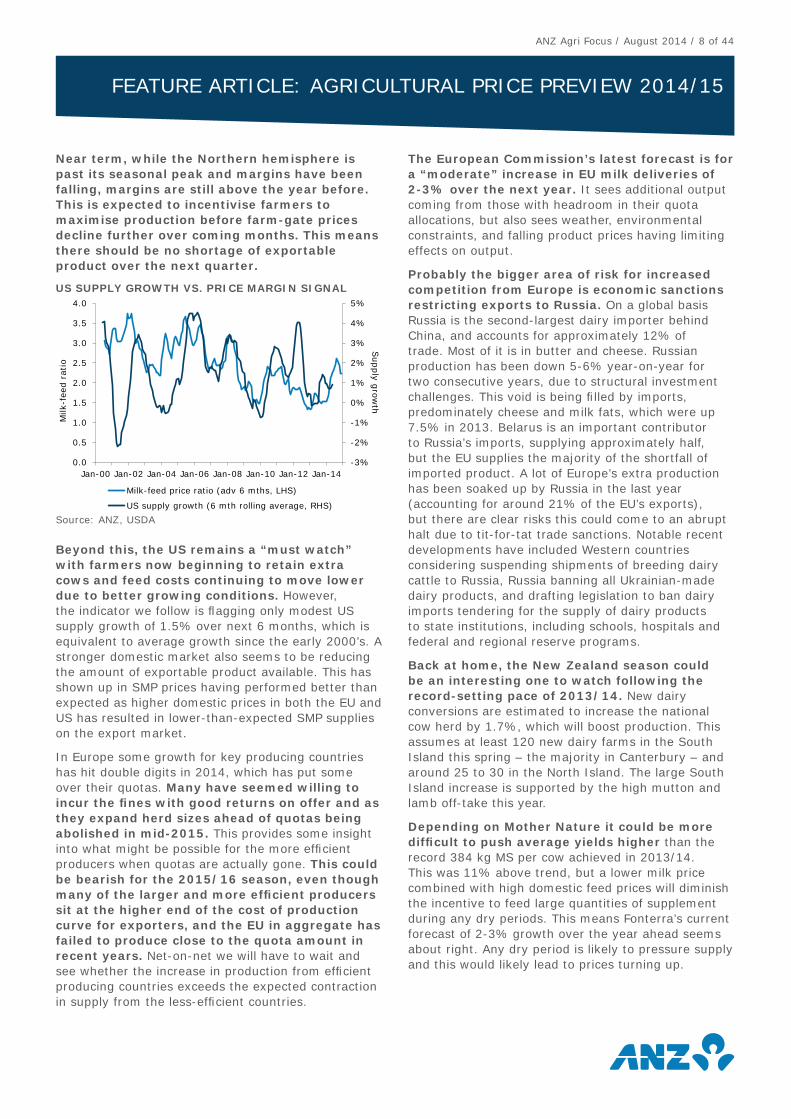
Near term, while the Northern hemisphere is past its seasonal peak and margins have been falling, margins are still above the year before. This is expected to incentivise farmers to maximise production before farm-gate prices decline further over coming months. This means there should be no shortage of exportable product over the next quarter.
Beyond this, the US remains a “must watch” with farmers now beginning to retain extra cows and feed costs continuing to move lower due to better growing conditions. However, the indicator we follow is fl agging only modest US supply growth of 1.5% over next 6 months, which is equivalent to average growth since the early 2000’s. A stronger domestic market also seems to be reducing the amount of exportable product available. This has shown up in SMP prices having performed better than expected as higher domestic prices in both the EU and US has resulted in lower-than-expected SMP supplies on the export market.
In Europe some growth for key producing countries has hit double digits in 2014, which has put some over their quotas. Many have seemed willing to incur the fi nes with good returns on offer and as they expand herd sizes ahead of quotas being abolished in mid-2015. This provides some insight into what might be possible for the more effi cient producers when quotas are actually gone. This could be bearish for the 2015/16 season, even though many of the larger and more effi cient producers sit at the higher end of the cost of production curve for exporters, and the EU in aggregate has failed to produce close to the quota amount in recent years. Net-on-net we will have to wait and see whether the increase in production from effi cient producing countries exceeds the expected contraction in supply from the less-effi cient countries.
The European Commission’s latest forecast is for a “moderate” increase in EU milk deliveries of 2-3% over the next year. It sees additional output coming from those with headroom in their quota allocations, but also sees weather, environmental constraints, and falling product prices having limiting effects on output.
Probably the bigger area of risk for increased competition from Europe is economic sanctions restricting exports to Russia. On a global basis Russia is the second-largest dairy importer behind China, and accounts for approximately 12% of trade. Most of it is in butter and cheese. Russian production has been down 5-6% year-on-year for two consecutive years, due to structural investment challenges. This void is being fi lled by imports, predominately cheese and milk fats, which were up 7.5% in 2013. Belarus is an important contributor to Russia’s imports, supplying approximately half, but the EU supplies the majority of the shortfall of imported product. A lot of Europe’s extra production has been soaked up by Russia in the last year (accounting for around 21% of the EU’s exports), but there are clear risks this could come to an abrupt halt due to tit-for-tat trade sanctions. Notable recent developments have included Western countries considering suspending shipments of breeding dairy cattle to Russia, Russia banning all Ukrainian-made dairy products, and drafting legislation to ban dairy imports tendering for the supply of dairy products to state institutions, including schools, hospitals and federal and regional reserve programs.
Back at home, the New Zealand season could be an interesting one to watch following the record-setting pace of 2013/14. New dairy conversions are estimated to increase the national cow herd by 1.7%, which will boost production. This assumes at least 120 new dairy farms in the South Island this spring – the majority in Canterbury – and around 25 to 30 in the North Island. The large South Island increase is supported by the high mutton and lamb off-take this year.
Depending on Mother Nature it could be more diffi cult to push average yields higher than the record 384 kg MS per cow achieved in 2013/14. This was 11% above trend, but a lower milk price combined with high domestic feed prices will diminish the incentive to feed large quantities of supplement during any dry periods. This means Fonterra’s current forecast of 2-3% growth over the year ahead seems about right. Any dry period is likely to pressure supply and this would likely lead to prices turning up.
FEATURE ARTICLE: AGRICULTURAL PRICE PREVIEW 2014/15
-3%
-2%
-1%
0%
1%
2%
3%
4%
5%
0.0
0.5
1.0
1.5
2.0
2.5
3.0
3.5
4.0
Jan-00 Jan-02 Jan-04 Jan-06 Jan-08 Jan-10 Jan-12 Jan-14
Supply g
rowth
Milk
-fee
d r
atio
Milk-feed price ratio (adv 6 mths, LHS)
US supply growth (6 mth rolling average, RHS)
US SUPPLY GROWTH VS. PRICE MARGIN SIGNAL
Source: ANZ, USDA
ANZ Agri Focus / August 2014 / 9 of 44
GLOBAL PRICES
Where the milk powder price bottoms out and the degree to which it recovers throughout the 2014/15 year will largely be governed by how much of the lift in China’s import demand proves permanent as opposed to temporary. Domestic production in China is reported to have stabilised and seasonally improved during the spring, leading to farm-gate prices coming off. However, a sudden turnaround in milk production throughout the course of the next 12 months seems unlikely, given disease issues, the culling of 15% of the herd in 2013, increasing food safety regulations, and the high cost of production. This means once imported inventories and those from the spring fl ush have been worked through, an improvement in milk powder prices (specifi cally WMP) is expected. This seems likely to be in early 2015, but near-term latent demand from other markets is expected to start to kick in to help stabilise pricing.
The second aspect will be the available exportable product from Northern hemisphere exporters. Near term this is expected to increase, but at this stage volumes appear to be manageable. This argument is supported by the fact that SMP prices have held in at better levels until recently despite an increase in production. Strength in key Northern hemisphere producers’ own domestic markets could mean some of the increased supply doesn’t fi nd its way onto export markets. Known inventory levels for the likes of SMP in the US, while up on last year, are not excessive. Stocks of milkfat products are below year-ago levels also, and US domestic prices for milkfat products have increased signifi cantly in the past year, while falling less in the ongoing downturn in global prices, compared to Oceania and EU prices.
In the WMP space, while there is some idle capacity in Europe and new investment in manufacturing in the US, much of it is on a smaller scale than in NZ. This is likely to limit the ability to offer large increases in the near term, or to divert more milk from cheese, skim milk and other products into WMP manufacture, which is what the Chinese have until recently been demanding to replace/supplement fresh milk supply.
Beyond the next 6 months the growth in global milk supply is set to moderate as farm-gate prices adjust lower. This, combined with China re-entering the market, should provide a modest boost to prices.
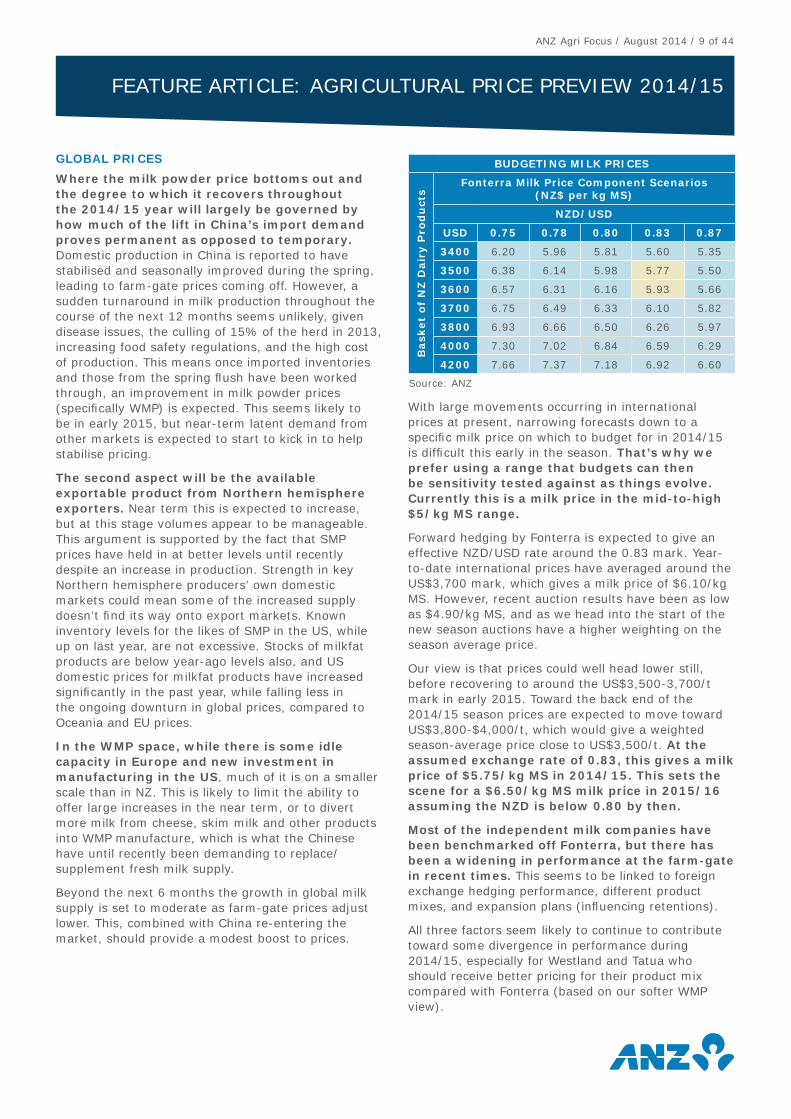
BUDGETING MILK PRICES
Bask
et
of
NZ
Dair
y P
rod
uct
s
Fonterra Milk Price Component Scenarios (NZ$ per kg MS)
NZD/USD
USD 0.75 0.78 0.80 0.83 0.87
3400 6.20 5.96 5.81 5.60 5.35
3500 6.38 6.14 5.98 5.77 5.50
3600 6.57 6.31 6.16 5.93 5.66
3700 6.75 6.49 6.33 6.10 5.82
3800 6.93 6.66 6.50 6.26 5.97
4000 7.30 7.02 6.84 6.59 6.29
4200 7.66 7.37 7.18 6.92 6.60
Source: ANZ
With large movements occurring in international prices at present, narrowing forecasts down to a specifi c milk price on which to budget for in 2014/15 is diffi cult this early in the season. That’s why we prefer using a range that budgets can then be sensitivity tested against as things evolve. Currently this is a milk price in the mid-to-high $5/kg MS range.
Forward hedging by Fonterra is expected to give an effective NZD/USD rate around the 0.83 mark. Year-to-date international prices have averaged around the US$3,700 mark, which gives a milk price of $6.10/kg MS. However, recent auction results have been as low as $4.90/kg MS, and as we head into the start of the new season auctions have a higher weighting on the season average price.
Our view is that prices could well head lower still, before recovering to around the US$3,500-3,700/t mark in early 2015. Toward the back end of the 2014/15 season prices are expected to move toward US$3,800-$4,000/t, which would give a weighted season-average price close to US$3,500/t. At the assumed exchange rate of 0.83, this gives a milk price of $5.75/kg MS in 2014/15. This sets the scene for a $6.50/kg MS milk price in 2015/16 assuming the NZD is below 0.80 by then.
Most of the independent milk companies have been benchmarked off Fonterra, but there has been a widening in performance at the farm-gate in recent times. This seems to be linked to foreign exchange hedging performance, different product mixes, and expansion plans (infl uencing retentions).
All three factors seem likely to continue to contribute toward some divergence in performance during 2014/15, especially for Westland and Tatua who should receive better pricing for their product mix compared with Fonterra (based on our softer WMP view).
FEATURE ARTICLE: AGRICULTURAL PRICE PREVIEW 2014/15
ANZ Agri Focus / August 2014 / 10 of 44
SHEEPMEAT
Lamb prices have recovered by 8% in 2013/14 and will average around $95 per head for a 17.5 kg carcase. In 2014/15 these gains are expected to be held onto, and indeed show incremental improvement toward $100 per head (+5.3%). The seasonal price profi le is expected to be slightly fl atter than the season just completed. The shoulders of the season are forecast to achieve similar prices, with mid-season prices being stronger (driven by the currency and lower slaughter). Given the variation in farm-gate prices throughout New Zealand (due to timing of sales), farmers should apply a 5% lift to the average price they achieved in 2013/14 for budgeting purposes.
The lift in 2014/15 farm-gate prices is driven by an assumed softening in the NZD and tighter tradable supply out of both Australia and New Zealand. On the demand side, continued growth for lower-to-mid value cuts and co-products from China and Middle East markets, a pick-up in foodservice in the US, as well as stability in the UK, are expected to be supportive. The offset is weaker demand from some European markets due to soft economic conditions.
The main risk is that retail prices are starting to look a bit toppy in some major markets again and could overshoot, causing a drop in demand similar to 2011/12. The main mitigating factor at present is the retail prices for other meat proteins have moved higher in tandem with lamb this time round, reducing the ability of consumers to switch to alternatives to save money.
TIGHTER TRADABLE SUPPLY IN 2014/15
In New Zealand the 2013/14 season has seen better production than fi rst thought, following the 2013 drought. Current industry forecasts are for export production of 20.2m head, which is 4.7% above early-year estimates of 19.3m head. The continued creep of dairying and support activities has been infl uential (lower hogget retentions), especially in the South Island, as well as less lamb wastage during the spring leading to a larger than initially expected lamb crop. Combined with a slightly higher average carcass weight of 18.1 kilograms this equates to production of 365,000 carcass weight tonnes (-3% y/y).
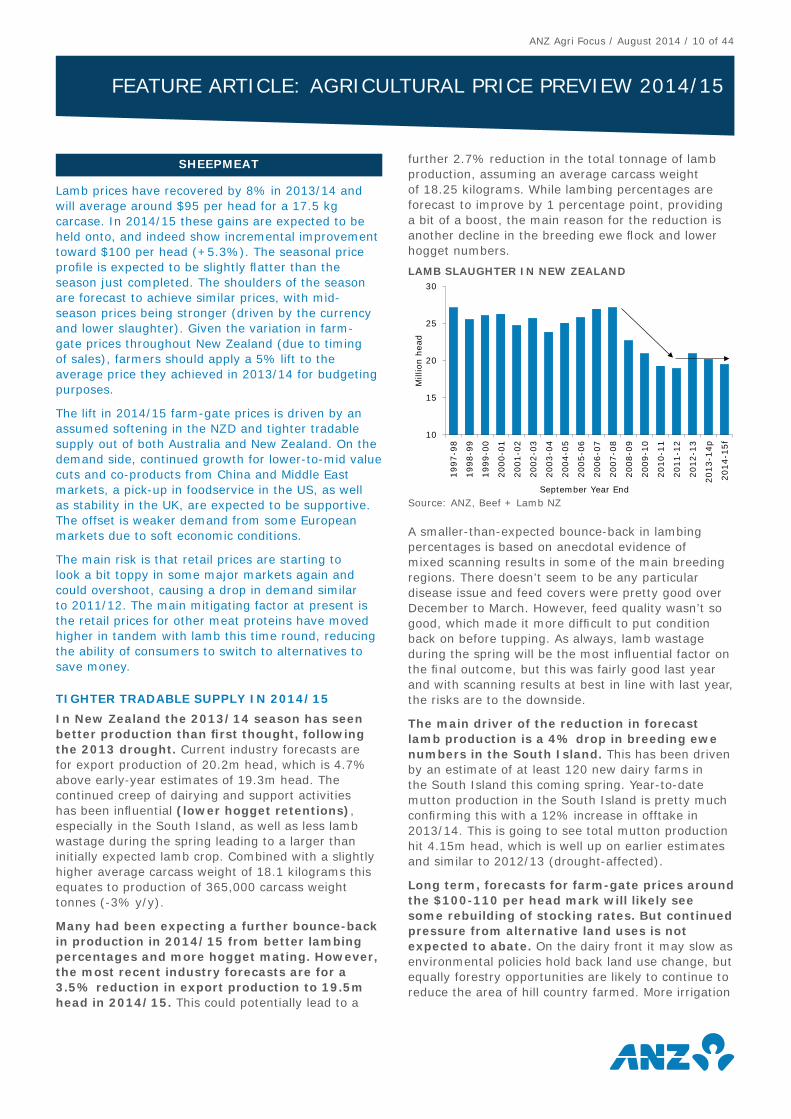
Many had been expecting a further bounce-back in production in 2014/15 from better lambing percentages and more hogget mating. However, the most recent industry forecasts are for a 3.5% reduction in export production to 19.5m head in 2014/15. This could potentially lead to a
further 2.7% reduction in the total tonnage of lamb production, assuming an average carcass weight of 18.25 kilograms. While lambing percentages are forecast to improve by 1 percentage point, providing a bit of a boost, the main reason for the reduction is another decline in the breeding ewe fl ock and lower hogget numbers.
A smaller-than-expected bounce-back in lambing percentages is based on anecdotal evidence of mixed scanning results in some of the main breeding regions. There doesn’t seem to be any particular disease issue and feed covers were pretty good over December to March. However, feed quality wasn’t so good, which made it more diffi cult to put condition back on before tupping. As always, lamb wastage during the spring will be the most infl uential factor on the fi nal outcome, but this was fairly good last year and with scanning results at best in line with last year, the risks are to the downside.
The main driver of the reduction in forecast lamb production is a 4% drop in breeding ewe numbers in the South Island. This has been driven by an estimate of at least 120 new dairy farms in the South Island this coming spring. Year-to-date mutton production in the South Island is pretty much confi rming this with a 12% increase in offtake in 2013/14. This is going to see total mutton production hit 4.15m head, which is well up on earlier estimates and similar to 2012/13 (drought-affected).
Long term, forecasts for farm-gate prices around the $100-110 per head mark will likely see some rebuilding of stocking rates. But continued pressure from alternative land uses is not expected to abate. On the dairy front it may slow as environmental policies hold back land use change, but equally forestry opportunities are likely to continue to reduce the area of hill country farmed. More irrigation
FEATURE ARTICLE: AGRICULTURAL PRICE PREVIEW 2014/15
10
15
20
25
30
1997-9
8
1998-9
9
1999-0
0
2000-0
1
2001-0
2
2002-0
3
2003-0
4
2004-0
5
2005-0
6
2006-0
7
2007-0
8
2008-0
9
2009-1
0
2010-1
1
2011-1
2
2012-1
3
2013-1
4p
2014-1
5f
Mill
ion h
ead
September Year End
LAMB SLAUGHTER IN NEW ZEALAND
Source: ANZ, Beef + Lamb NZ
ANZ Agri Focus / August 2014 / 11 of 44
schemes around the country will support alternative land uses and dairy support opportunities continue to grow as farm systems become more intensive.
Adding it all together it seems likely the lamb crop will stay around the 25-26 million mark, with land use change offset by continued productivity gains. This means export production is likely to be between 19-20m head. Combined with lambs continuing to get heavier, this translates into export production of 355,000-375,000 tonnes. Of course year-to-year seasonal variation (i.e. weather conditions during lambing) will be important, but it seems production is beginning to stabilise after the reductions in 2006 to 2009 period.
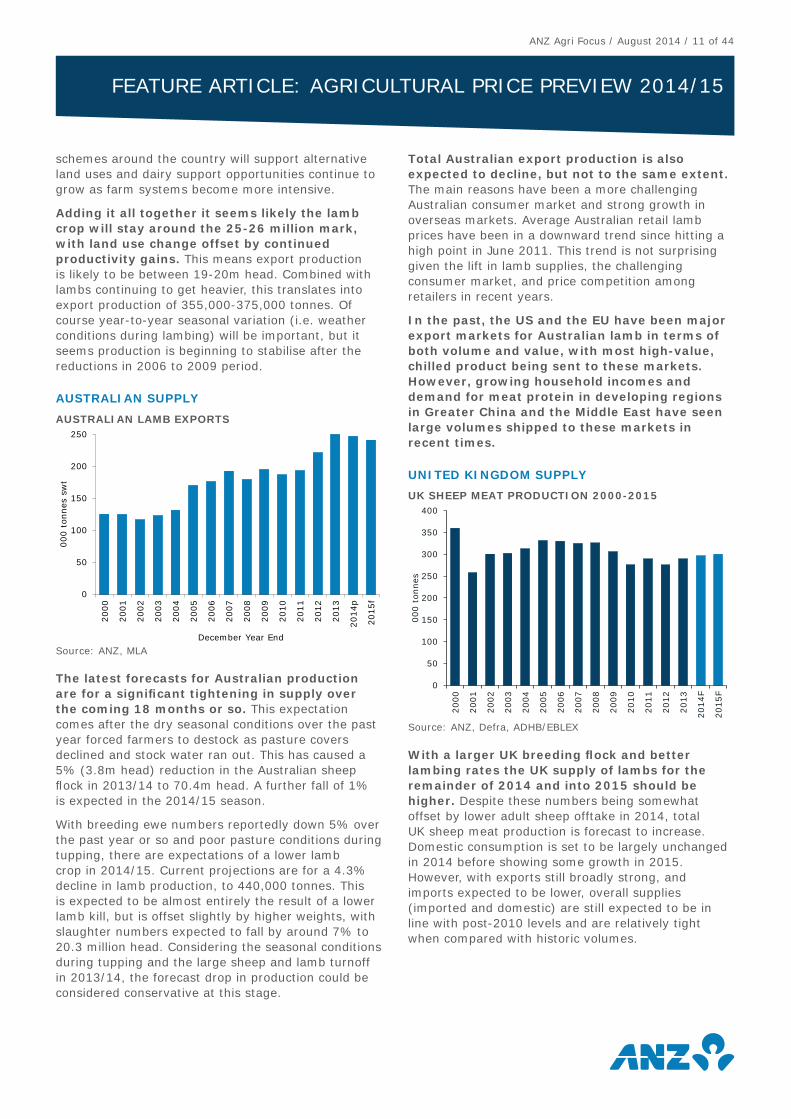
AUSTRALIAN SUPPLY
The latest forecasts for Australian production are for a signifi cant tightening in supply over the coming 18 months or so. This expectation comes after the dry seasonal conditions over the past year forced farmers to destock as pasture covers declined and stock water ran out. This has caused a 5% (3.8m head) reduction in the Australian sheep fl ock in 2013/14 to 70.4m head. A further fall of 1% is expected in the 2014/15 season.
With breeding ewe numbers reportedly down 5% over the past year or so and poor pasture conditions during tupping, there are expectations of a lower lamb crop in 2014/15. Current projections are for a 4.3% decline in lamb production, to 440,000 tonnes. This is expected to be almost entirely the result of a lower lamb kill, but is offset slightly by higher weights, with slaughter numbers expected to fall by around 7% to 20.3 million head. Considering the seasonal conditions during tupping and the large sheep and lamb turnoff in 2013/14, the forecast drop in production could be considered conservative at this stage.
Total Australian export production is also expected to decline, but not to the same extent. The main reasons have been a more challenging Australian consumer market and strong growth in overseas markets. Average Australian retail lamb prices have been in a downward trend since hitting a high point in June 2011. This trend is not surprising given the lift in lamb supplies, the challenging consumer market, and price competition among retailers in recent years.
In the past, the US and the EU have been major export markets for Australian lamb in terms of both volume and value, with most high-value, chilled product being sent to these markets. However, growing household incomes and demand for meat protein in developing regions in Greater China and the Middle East have seen large volumes shipped to these markets in recent times.
UNITED KINGDOM SUPPLY
With a larger UK breeding fl ock and better lambing rates the UK supply of lambs for the remainder of 2014 and into 2015 should be higher. Despite these numbers being somewhat offset by lower adult sheep offtake in 2014, total UK sheep meat production is forecast to increase. Domestic consumption is set to be largely unchanged in 2014 before showing some growth in 2015. However, with exports still broadly strong, and imports expected to be lower, overall supplies (imported and domestic) are still expected to be in line with post-2010 levels and are relatively tight when compared with historic volumes.
FEATURE ARTICLE: AGRICULTURAL PRICE PREVIEW 2014/15
0
50
100
150
200
250
300
350
400
2000
2001
2002
2003
2004
2005
2006
2007
2008
2009
2010
2011
2012
2013
2014F
2015F
000 t
onnes
UK SHEEP MEAT PRODUCTION 2000-2015
Source: ANZ, Defra, ADHB/EBLEX
0
50
100
150
200
250
2000
2001
2002
2003
2004
2005
2006
2007
2008
2009
2010
2011
2012
2013
2014p
2015f
000 t
onnes
sw
t
December Year End
AUSTRALIAN LAMB EXPORTS
Source: ANZ, MLA
ANZ Agri Focus / August 2014 / 12 of 44
IN-MARKET DYNAMICS
Currently, the more traditional markets in Europe and North America are seemingly showing some recovery, and there is continued growth in demand from developing regions, notably China and the Middle East.
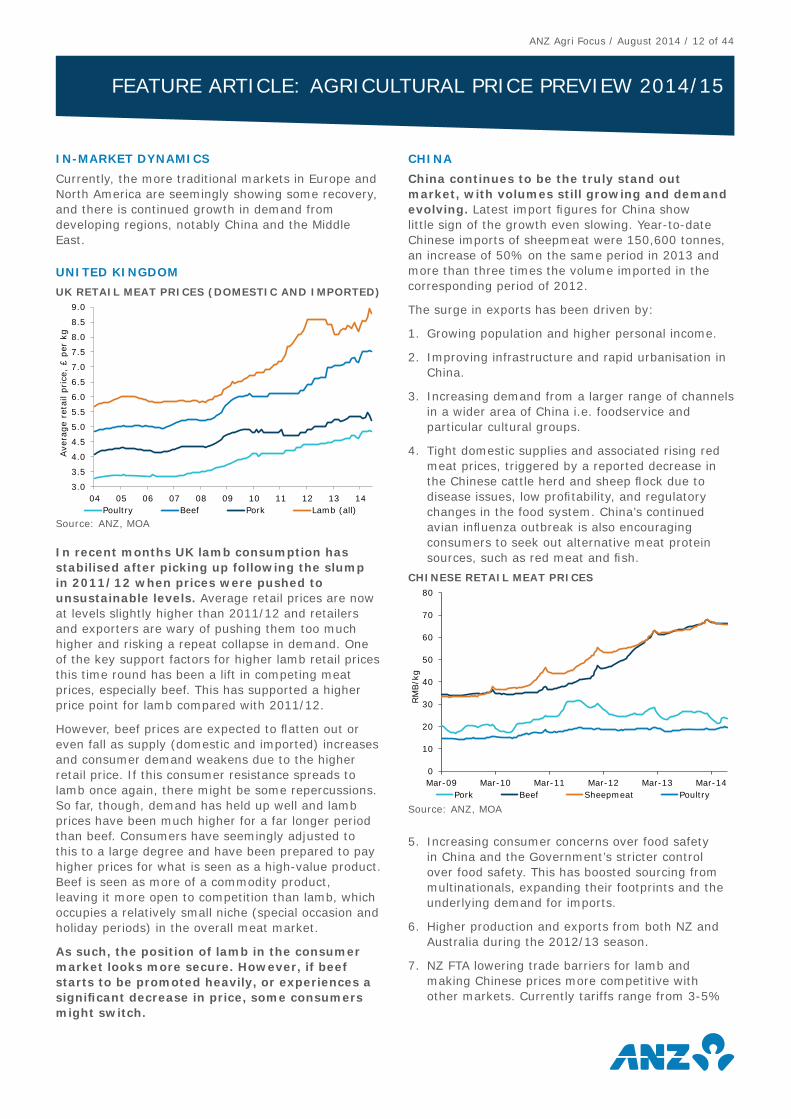
UNITED KINGDOM
In recent months UK lamb consumption has stabilised after picking up following the slump in 2011/12 when prices were pushed to unsustainable levels. Average retail prices are now at levels slightly higher than 2011/12 and retailers and exporters are wary of pushing them too much higher and risking a repeat collapse in demand. One of the key support factors for higher lamb retail prices this time round has been a lift in competing meat prices, especially beef. This has supported a higher price point for lamb compared with 2011/12.
However, beef prices are expected to fl atten out or even fall as supply (domestic and imported) increases and consumer demand weakens due to the higher retail price. If this consumer resistance spreads to lamb once again, there might be some repercussions. So far, though, demand has held up well and lamb prices have been much higher for a far longer period than beef. Consumers have seemingly adjusted to this to a large degree and have been prepared to pay higher prices for what is seen as a high-value product. Beef is seen as more of a commodity product, leaving it more open to competition than lamb, which occupies a relatively small niche (special occasion and holiday periods) in the overall meat market.
As such, the position of lamb in the consumer market looks more secure. However, if beef starts to be promoted heavily, or experiences a signifi cant decrease in price, some consumers might switch.
CHINA
China continues to be the truly stand out market, with volumes still growing and demand evolving. Latest import fi gures for China show little sign of the growth even slowing. Year-to-date Chinese imports of sheepmeat were 150,600 tonnes, an increase of 50% on the same period in 2013 and more than three times the volume imported in the corresponding period of 2012.
The surge in exports has been driven by:
1. Growing population and higher personal income.
2. Improving infrastructure and rapid urbanisation in China.
3. Increasing demand from a larger range of channels in a wider area of China i.e. foodservice and particular cultural groups.
4. Tight domestic supplies and associated rising red meat prices, triggered by a reported decrease in the Chinese cattle herd and sheep fl ock due to disease issues, low profi tability, and regulatory changes in the food system. China’s continued avian infl uenza outbreak is also encouraging consumers to seek out alternative meat protein sources, such as red meat and fi sh.
5. Increasing consumer concerns over food safety in China and the Government’s stricter control over food safety. This has boosted sourcing from multinationals, expanding their footprints and the underlying demand for imports.
6. Higher production and exports from both NZ and Australia during the 2012/13 season.
7. NZ FTA lowering trade barriers for lamb and making Chinese prices more competitive with other markets. Currently tariffs range from 3-5%
FEATURE ARTICLE: AGRICULTURAL PRICE PREVIEW 2014/15
0
10
20
30
40
50
60
70
80
Mar-09 Mar-10 Mar-11 Mar-12 Mar-13 Mar-14
RM
B/k
g
Pork Beef Sheepmeat Poultry
CHINESE RETAIL MEAT PRICES
Source: ANZ, MOA
3.0
3.5
4.0
4.5
5.0
5.5
6.0
6.5
7.0
7.5
8.0
8.5
9.0
04 05 06 07 08 09 10 11 12 13 14
Ave
rage
reta
il pri
ce,
£ p
er k
g
Poultry Beef Pork Lamb (all)
UK RETAIL MEAT PRICES (DOMESTIC AND IMPORTED)
Source: ANZ, MOA
ANZ Agri Focus / August 2014 / 13 of 44
depending on cuts, and by 2016 will be non-existent. Competitors are paying the base tariff rates, which range from 12-23% depending on cut.
In recent years most exports to China have been in the form of fl aps or breast, which is popular for Chinese hot pots. As market penetration continues to increase, a broader range of cuts is being consumed. This has seen increasing demand for legs and other secondary cuts. Such dynamics have increased inter-market competition with traditional markets, such as the UK who used to take all our legs. In a tighter supply situation as is expected in 2014/15 this should help create added inter-market competition and push pricing higher.
BEEF
Confi dence remains high that we’ll see decent farm-gate returns for prime cattle in 2014/15. The better outlook is driven by both supply and demand factors.
On the supply side there is constrained beef production in our main market, the US, as well as a forecast moderation in Australian supply as seasonal conditions improve. Combined with industry forecasts of lower New Zealand supplies this should create price tension across the US and traditional and emerging Asian markets.
The demand side looks supportive with a pick-up in foodservice activity in the US driven by improving economic conditions, as well as more limited supply growth for competing meat proteins: pork and poultry. Demand continues to grow from non-traditional markets, particularly China and Indonesia. This is due to their own tight domestic supplies, high retail prices, and increased food safety standards. This is expected to provide more competition for limited Oceania supply, especially for manufacturing beef as foodservice demand expands. This should benefi t NZ farmers especially with better market access to both markets compared with many other countries.
Farm-gate beef prices are expected to take a step up in 2014/15 and this leads to a forecast 10% increase in farm-gate returns. After this, competition from South American beef, higher retail prices and stabilisation in US beef production are expected to see gains slow. A forecast lower NZD during 2014/15 provides an additional boost. If this doesn’t occur, then farm-gate prices are more likely to increase by only 5%.
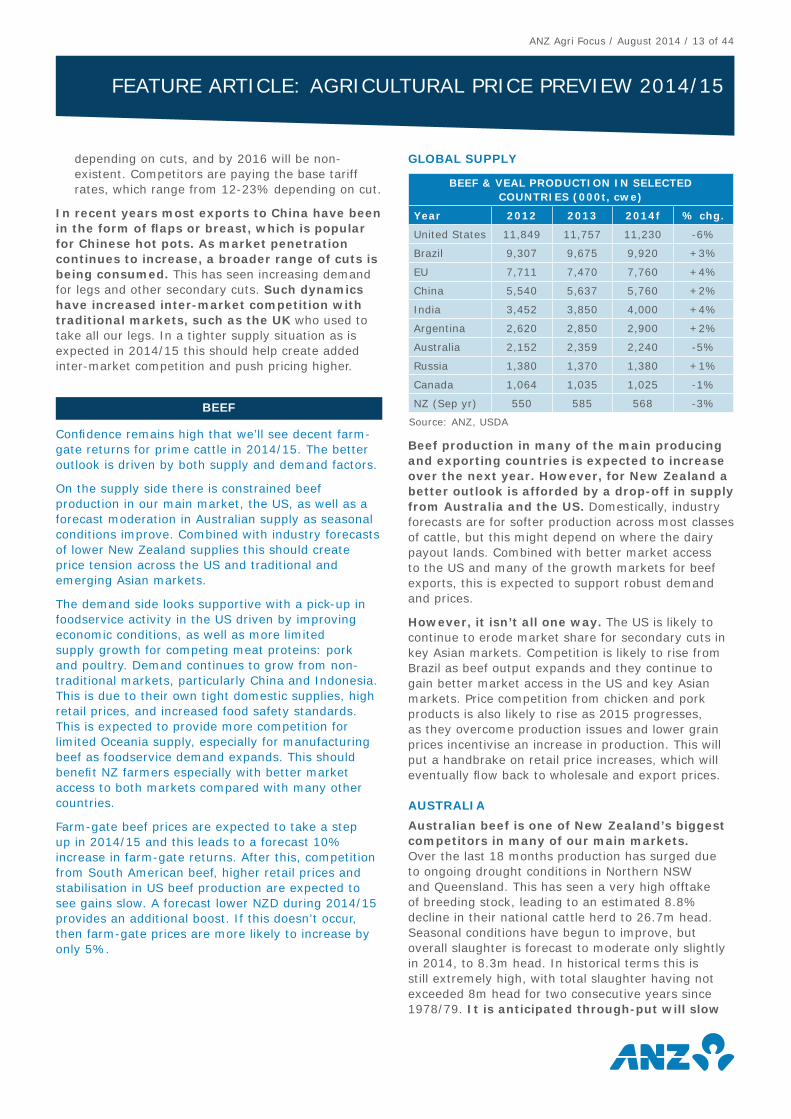
GLOBAL SUPPLY
BEEF & VEAL PRODUCTION IN SELECTED COUNTRIES (000t, cwe)
Year 2012 2013 2014f % chg.
United States 11,849 11,757 11,230 -6%
Brazil 9,307 9,675 9,920 +3%
EU 7,711 7,470 7,760 +4%
China 5,540 5,637 5,760 +2%
India 3,452 3,850 4,000 +4%
Argentina 2,620 2,850 2,900 +2%
Australia 2,152 2,359 2,240 -5%
Russia 1,380 1,370 1,380 +1%
Canada 1,064 1,035 1,025 -1%
NZ (Sep yr) 550 585 568 -3%
Source: ANZ, USDA
Beef production in many of the main producing and exporting countries is expected to increase over the next year. However, for New Zealand a better outlook is afforded by a drop-off in supply from Australia and the US. Domestically, industry forecasts are for softer production across most classes of cattle, but this might depend on where the dairy payout lands. Combined with better market access to the US and many of the growth markets for beef exports, this is expected to support robust demand and prices.
However, it isn’t all one way. The US is likely to continue to erode market share for secondary cuts in key Asian markets. Competition is likely to rise from Brazil as beef output expands and they continue to gain better market access in the US and key Asian markets. Price competition from chicken and pork products is also likely to rise as 2015 progresses, as they overcome production issues and lower grain prices incentivise an increase in production. This will put a handbrake on retail price increases, which will eventually fl ow back to wholesale and export prices.
AUSTRALIA
Australian beef is one of New Zealand’s biggest competitors in many of our main markets. Over the last 18 months production has surged due to ongoing drought conditions in Northern NSW and Queensland. This has seen a very high offtake of breeding stock, leading to an estimated 8.8% decline in their national cattle herd to 26.7m head. Seasonal conditions have begun to improve, but overall slaughter is forecast to moderate only slightly in 2014, to 8.3m head. In historical terms this is still extremely high, with total slaughter having not exceeded 8m head for two consecutive years since 1978/79. It is anticipated through-put will slow
FEATURE ARTICLE: AGRICULTURAL PRICE PREVIEW 2014/15
ANZ Agri Focus / August 2014 / 14 of 44
in the fi nal quarter of 2014, but no doubt it will take a little longer to clear inventory. In 2015 slaughter is expected to continue easing and decline by 9%.
US
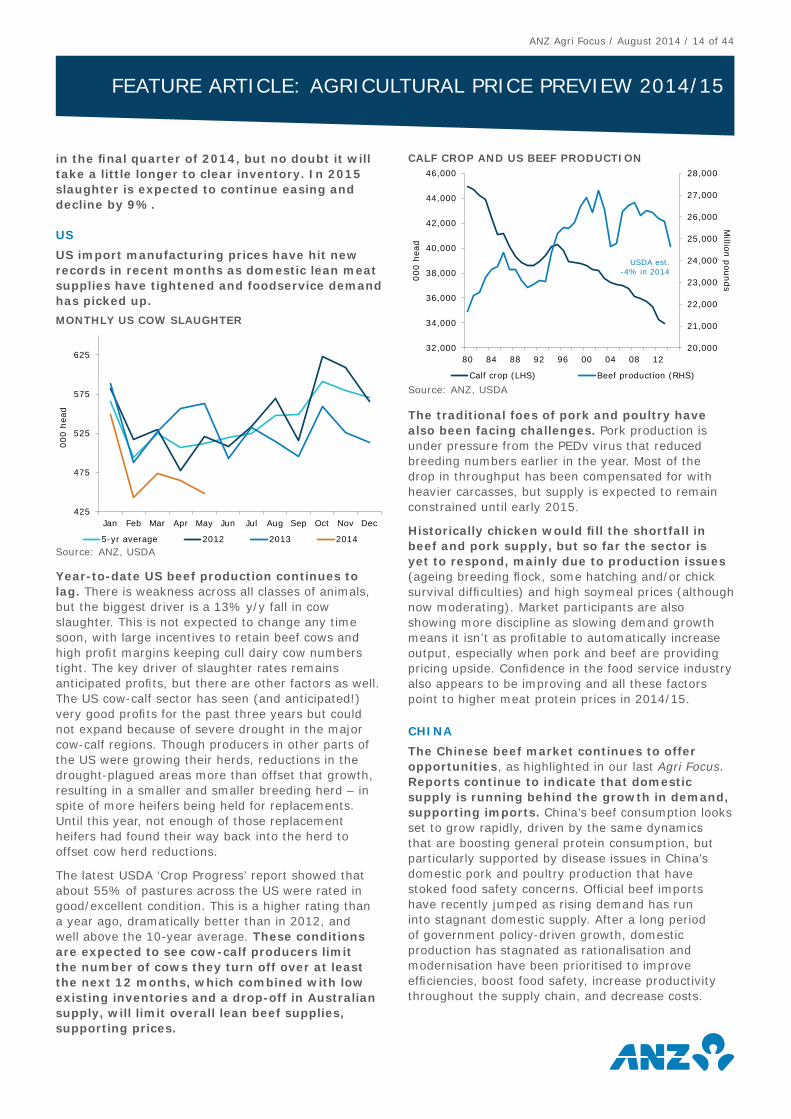
US import manufacturing prices have hit new records in recent months as domestic lean meat supplies have tightened and foodservice demand has picked up.
Year-to-date US beef production continues to lag. There is weakness across all classes of animals, but the biggest driver is a 13% y/y fall in cow slaughter. This is not expected to change any time soon, with large incentives to retain beef cows and high profi t margins keeping cull dairy cow numbers tight. The key driver of slaughter rates remains anticipated profi ts, but there are other factors as well. The US cow-calf sector has seen (and anticipated!) very good profi ts for the past three years but could not expand because of severe drought in the major cow-calf regions. Though producers in other parts of the US were growing their herds, reductions in the drought-plagued areas more than offset that growth, resulting in a smaller and smaller breeding herd – in spite of more heifers being held for replacements. Until this year, not enough of those replacement heifers had found their way back into the herd to offset cow herd reductions.
The latest USDA ‘Crop Progress’ report showed that about 55% of pastures across the US were rated in good/excellent condition. This is a higher rating than a year ago, dramatically better than in 2012, and well above the 10-year average. These conditions are expected to see cow-calf producers limit the number of cows they turn off over at least the next 12 months, which combined with low existing inventories and a drop-off in Australian supply, will limit overall lean beef supplies, supporting prices.
The traditional foes of pork and poultry have also been facing challenges. Pork production is under pressure from the PEDv virus that reduced breeding numbers earlier in the year. Most of the drop in throughput has been compensated for with heavier carcasses, but supply is expected to remain constrained until early 2015.
Historically chicken would fi ll the shortfall in beef and pork supply, but so far the sector is yet to respond, mainly due to production issues (ageing breeding fl ock, some hatching and/or chick survival diffi culties) and high soymeal prices (although now moderating). Market participants are also showing more discipline as slowing demand growth means it isn’t as profi table to automatically increase output, especially when pork and beef are providing pricing upside. Confi dence in the food service industry also appears to be improving and all these factors point to higher meat protein prices in 2014/15.
CHINA
The Chinese beef market continues to offer opportunities, as highlighted in our last Agri Focus. Reports continue to indicate that domestic supply is running behind the growth in demand, supporting imports. China’s beef consumption looks set to grow rapidly, driven by the same dynamics that are boosting general protein consumption, but particularly supported by disease issues in China’s domestic pork and poultry production that have stoked food safety concerns. Offi cial beef imports have recently jumped as rising demand has run into stagnant domestic supply. After a long period of government policy-driven growth, domestic production has stagnated as rationalisation and modernisation have been prioritised to improve effi ciencies, boost food safety, increase productivity throughout the supply chain, and decrease costs.
FEATURE ARTICLE: AGRICULTURAL PRICE PREVIEW 2014/15
20,000
21,000
22,000
23,000
24,000
25,000
26,000
27,000
28,000
32,000
34,000
36,000
38,000
40,000
42,000
44,000
46,000
80 84 88 92 96 00 04 08 12
Million
pou
nds
000 h
ead
Calf crop (LHS) Beef production (RHS)
USDA est.-4% in 2014
CALF CROP AND US BEEF PRODUCTION
Source: ANZ, USDA
425
475
525
575
625
Jan Feb Mar Apr May Jun Jul Aug Sep Oct Nov Dec
000 h
ead
5-yr average 2012 2013 2014
MONTHLY US COW SLAUGHTER
Source: ANZ, USDA
ANZ Agri Focus / August 2014 / 15 of 44
The rapid emergence of China as a major destination for Australian beef in 2013 was very well timed, helping to accommodate the large increase in available supplies out of Australia. However, it must be acknowledged that the growth for New Zealand, Australia and Uruguay has been facilitated by restrictions placed upon trade for other large beef exporting nations, most notably Brazil and the US. The Chinese government is currently looking to expand the number of beef trading partners. Both India (October 2013) and Canada (June 2014) have signed Memorandums of Understanding (MOU) to boost agricultural trade and investment. Expectations around the re-entry of Brazilian beef into China have been postponed as Brazil detected another atypical case of Bovine Spongiform Encephalopathy (BSE) in April 2014. New Zealand’s Free Trade Agreement provides a major tariff advantage over other competitors, but market access arrangements between China and other major beef suppliers need to be closely watched for increased competition.
OTHER ASIAN MARKETS
The forecast drop in US and Australian beef supply should help relieve many Asian markets in 2014/15.
However, the counter in the medium term is better market access for the US into Korea and Japan, which has already started to erode New Zealand’s market share for secondary cuts. Australia has also signed an FTA with Japan, which reduces beef tariffs from 38.5% to 30.5% for frozen beef and 32.5% for chilled beef in 2015. However, the slow and gradual economic recovery and likelihood of Japanese domestic beef production remaining subdued should continue to support import demand.
The Korean market looks favourable due to better economic conditions, lower supply from competitors, and less domestic beef and pork production. The Korean cattle herd (including dairy cattle) has been gradually decreasing in recent years due to higher slaughter, but this looks set to reverse over the next few years. Korean domestic pork production has also been lower (there are expectations of a recovery starting next year), causing a price rise. Additionally, consumers have lingering concerns over the safety of poultry due to an outbreak of Avian Infl uenza in January. These issues have shifted consumer preference from pork and chicken to beef.
Outside the traditional Asian markets, NZ exporters are cautiously optimistic on Indonesia after import quotas were removed in August 2013.
Import demand is expected to remain strong due to tight domestic supplies and high retail prices. This is expected to provide more competition for limited Oceania supply, especially for manufacturing beef as modern retail and high-end foodservice demand expands.
BRAZIL AND OTHERS
Beef output in the major beef-producing South American countries is on track to break all records in 2014. Beef production in Brazil could reach 10 million tonnes for the fi rst time, the major risk to global beef prices in 2014/15. Brazil has grown its cattle herd consistently by 5 million head per annum for a number of years, making Brazil one of the few countries that can temper the likely gains in global beef prices. On a 2-3 year view, future growth from Brazil looks sustainable, as the forecast 2014 production record is not being achieved through a liquidation phase of the herd. Year-to-date exports are up 15% due to increased production, but also an easing in domestic demand and lower exchange rate making it more attractive to export. That said, Brazil’s export volumes are forecast to remain below the peak in 2007 despite these factors, with domestic demand outstripping production due to population growth over this period. Combined population growth has exceeded 15 million people in Brazil, Argentina, and Uruguay since 2007, adding 500,000 tonnes to domestic beef demand over this period.
WOOL
Crossbreed auction wool prices look like they will track sideways over 2014/15 with competing factors making for a mixed outlook. Lower supply, better carpet demand from the US, and a lower NZD should be supportive, but lower competing fi bre prices and slower end demand growth in China could weigh. Combined, these factors make for a mixed outlook, with support likely to be found during periods of lower auction supply, but no real catalyst for a trend either higher or lower in prices.
New Zealand fi ne wool prices tend to follow Australia. Australian prices have been weaker since February, but are forecast to improve in 2014/15 largely due to a decline in Australian wool production, with Australia still the world’s largest wool exporter. Slower apparel demand growth from China and the ongoing shift toward synthetic fi bre apparel consumption will constrain the extent of price increases though.
FEATURE ARTICLE: AGRICULTURAL PRICE PREVIEW 2014/15
ANZ Agri Focus / August 2014 / 16 of 44
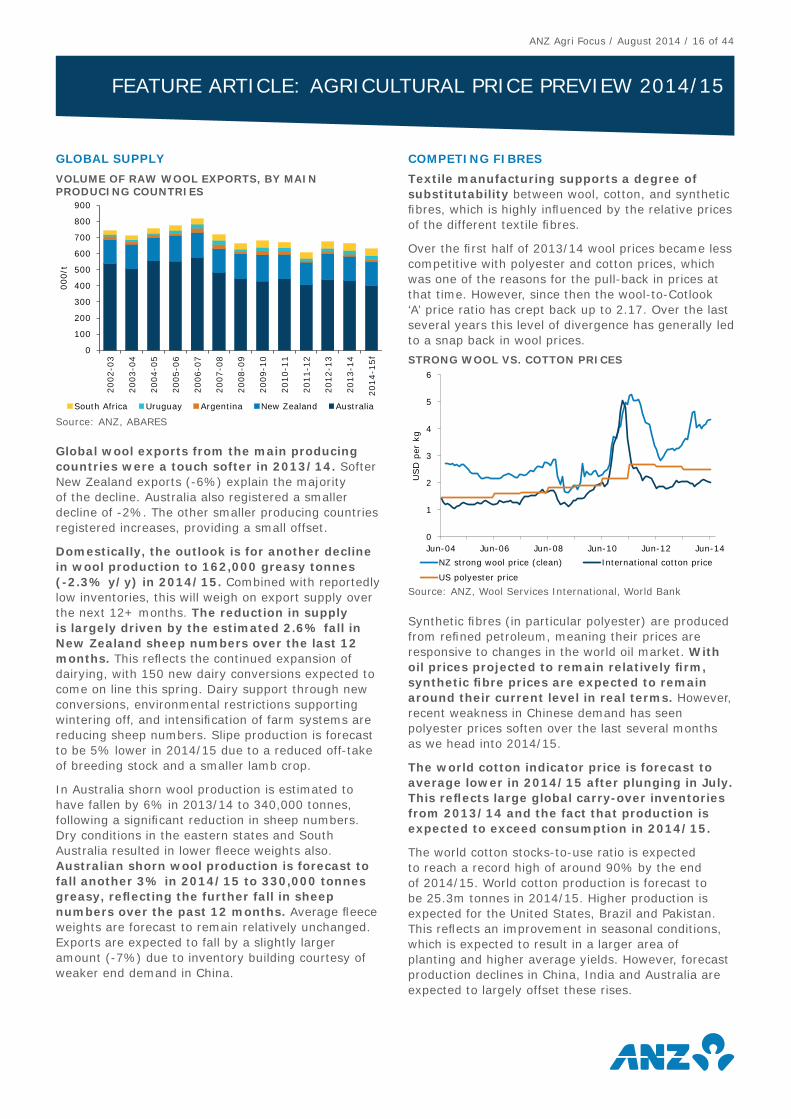
GLOBAL SUPPLY
Global wool exports from the main producing countries were a touch softer in 2013/14. Softer New Zealand exports (-6%) explain the majority of the decline. Australia also registered a smaller decline of -2%. The other smaller producing countries registered increases, providing a small offset.
Domestically, the outlook is for another decline in wool production to 162,000 greasy tonnes (-2.3% y/y) in 2014/15. Combined with reportedly low inventories, this will weigh on export supply over the next 12+ months. The reduction in supply is largely driven by the estimated 2.6% fall in New Zealand sheep numbers over the last 12 months. This refl ects the continued expansion of dairying, with 150 new dairy conversions expected to come on line this spring. Dairy support through new conversions, environmental restrictions supporting wintering off, and intensifi cation of farm systems are reducing sheep numbers. Slipe production is forecast to be 5% lower in 2014/15 due to a reduced off-take of breeding stock and a smaller lamb crop.
In Australia shorn wool production is estimated to have fallen by 6% in 2013/14 to 340,000 tonnes, following a signifi cant reduction in sheep numbers. Dry conditions in the eastern states and South Australia resulted in lower fl eece weights also. Australian shorn wool production is forecast to fall another 3% in 2014/15 to 330,000 tonnes greasy, refl ecting the further fall in sheep numbers over the past 12 months. Average fl eece weights are forecast to remain relatively unchanged. Exports are expected to fall by a slightly larger amount (-7%) due to inventory building courtesy of weaker end demand in China.
COMPETING FIBRES
Textile manufacturing supports a degree of substitutability between wool, cotton, and synthetic fi bres, which is highly infl uenced by the relative prices of the different textile fi bres.
Over the fi rst half of 2013/14 wool prices became less competitive with polyester and cotton prices, which was one of the reasons for the pull-back in prices at that time. However, since then the wool-to-Cotlook ‘A’ price ratio has crept back up to 2.17. Over the last several years this level of divergence has generally led to a snap back in wool prices.
Synthetic fi bres (in particular polyester) are produced from refi ned petroleum, meaning their prices are responsive to changes in the world oil market. With oil prices projected to remain relatively fi rm, synthetic fi bre prices are expected to remain around their current level in real terms. However, recent weakness in Chinese demand has seen polyester prices soften over the last several months as we head into 2014/15.
The world cotton indicator price is forecast to average lower in 2014/15 after plunging in July. This refl ects large global carry-over inventories from 2013/14 and the fact that production is expected to exceed consumption in 2014/15.
The world cotton stocks-to-use ratio is expected to reach a record high of around 90% by the end of 2014/15. World cotton production is forecast to be 25.3m tonnes in 2014/15. Higher production is expected for the United States, Brazil and Pakistan. This refl ects an improvement in seasonal conditions, which is expected to result in a larger area of planting and higher average yields. However, forecast production declines in China, India and Australia are expected to largely offset these rises.
FEATURE ARTICLE: AGRICULTURAL PRICE PREVIEW 2014/15
0
1
2
3
4
5
6
Jun-04 Jun-06 Jun-08 Jun-10 Jun-12 Jun-14
USD
per
kg
NZ strong wool price (clean) International cotton price
US polyester price
STRONG WOOL VS. COTTON PRICES
Source: ANZ, Wool Services International, World Bank
0
100
200
300
400
500
600
700
800
900
2002-0
3
2003-0
4
2004-0
5
2005-0
6
2006-0
7
2007-0
8
2008-0
9
2009-1
0
2010-1
1
2011-1
2
2012-1
3
2013-1
4
2014-1
5f
000/t
South Africa Uruguay Argentina New Zealand Australia
VOLUME OF RAW WOOL EXPORTS, BY MAIN PRODUCING COUNTRIES
Source: ANZ, ABARES
ANZ Agri Focus / August 2014 / 17 of 44
The danger though for is that China sells down its high inventories and reduces government purchases as it changes farmer support policies. Since 2011/12 China’s stockpiling policy has supported domestic and international cotton prices, despite world cotton production exceeding consumption during much of this period. As a result China now accounts for around 61% of the world’s cotton inventory.
For the 2014/15 season, the Chinese government has announced it will replace its current stockpiling policy with direct income support to producers. Such a policy change is likely to result in cotton production declining in China, but it will also reduce government purchases of cotton. Furthermore, if the Chinese government were to offl oad its stockpile on the world market this would lead to signifi cantly lower prices.
With wool prices already looking stretched compared other fi bre prices, and with these forecast to average lower throughout 2014/15, it looks a tough ask to push too much higher.
END DEMAND
At the fi ner end of the clip demand has weakened, largely due to tighter access to credit for Chinese textile manufacturers and weaker domestic and export demand for Chinese woollen apparel. As a result, excess stocks of raw and semi-processed wool built up within China’s wool textile industry during the back end of 2013. This has resulted in a sharp pull-back in raw wool purchases during 2014.
Demand for wool apparel in the US and the EU – two of China’s biggest export markets – has been declining since 2010, refl ecting slow economic growth and an ongoing shift toward synthetic fi bres. The assumed economic recovery in the US is expected to help lift apparel demand in 2014/15, but elsewhere things are set to remain sluggish.
Although China is a major consumer of apparel these days, growth in Chinese garment sales has also slowed in recent years. Retail sales of garments have grown by “only” 10% y/y so far in 2014. This is down from 11.5% in 2013 and 17.7% in 2012.
New Zealand fi ne wool prices tend to follow Australia’s. Australian prices have been weaker since February, but are forecast to improve in 2014/15 largely due to a decline in Australian wool production, given Australia is still the world’s largest wool exporter. Slower apparel demand growth from China and the ongoing shift toward synthetic fi bre apparel consumption will constrain the extent of price increases.
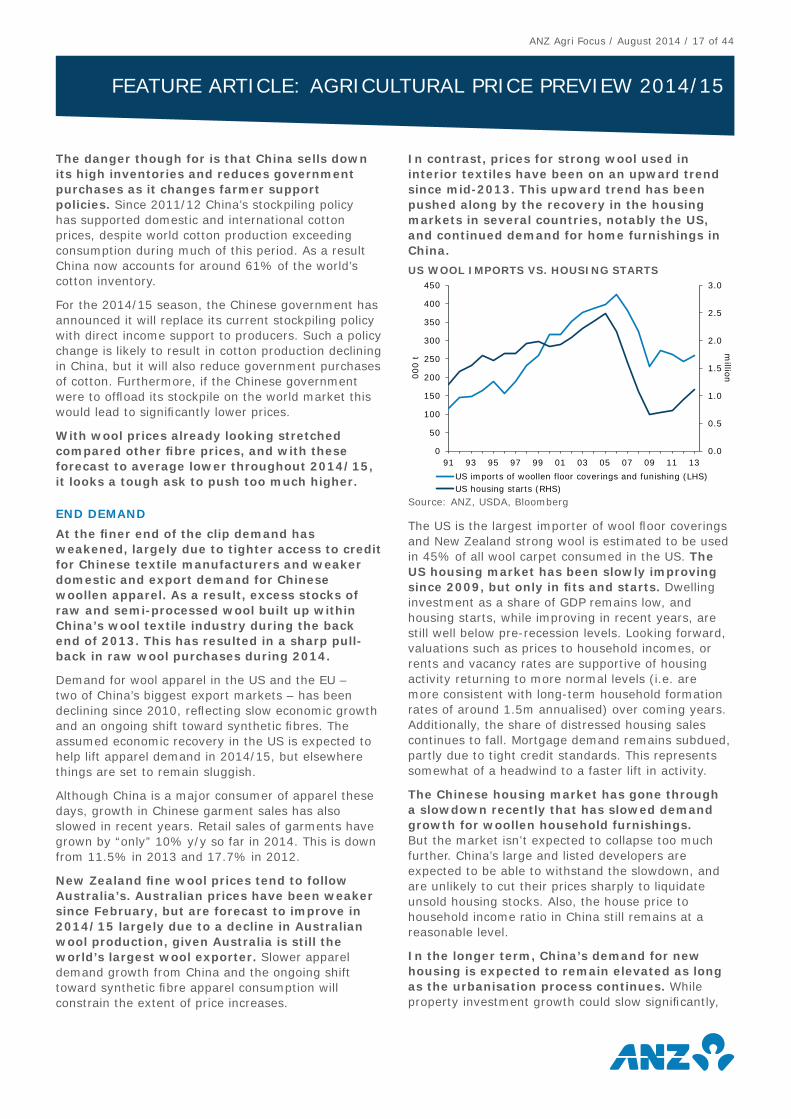
In contrast, prices for strong wool used in interior textiles have been on an upward trend since mid-2013. This upward trend has been pushed along by the recovery in the housing markets in several countries, notably the US, and continued demand for home furnishings in China.
The US is the largest importer of wool fl oor coverings and New Zealand strong wool is estimated to be used in 45% of all wool carpet consumed in the US. The US housing market has been slowly improving since 2009, but only in fi ts and starts. Dwelling investment as a share of GDP remains low, and housing starts, while improving in recent years, are still well below pre-recession levels. Looking forward, valuations such as prices to household incomes, or rents and vacancy rates are supportive of housing activity returning to more normal levels (i.e. are more consistent with long-term household formation rates of around 1.5m annualised) over coming years. Additionally, the share of distressed housing sales continues to fall. Mortgage demand remains subdued, partly due to tight credit standards. This represents somewhat of a headwind to a faster lift in activity.
The Chinese housing market has gone through a slowdown recently that has slowed demand growth for woollen household furnishings. But the market isn’t expected to collapse too much further. China’s large and listed developers are expected to be able to withstand the slowdown, and are unlikely to cut their prices sharply to liquidate unsold housing stocks. Also, the house price to household income ratio in China still remains at a reasonable level.
In the longer term, China’s demand for new housing is expected to remain elevated as long as the urbanisation process continues. While property investment growth could slow signifi cantly,
FEATURE ARTICLE: AGRICULTURAL PRICE PREVIEW 2014/15
0.0
0.5
1.0
1.5
2.0
2.5
3.0
0
50
100
150
200
250
300
350
400
450
91 93 95 97 99 01 03 05 07 09 11 13
million0
00 t
US imports of woollen floor coverings and funishing (LHS)US housing starts (RHS)
US WOOL IMPORTS VS. HOUSING STARTS
Source: ANZ, USDA, Bloomberg
ANZ Agri Focus / August 2014 / 18 of 44
total fl oor space under construction is expected to pick up in the next few years and peak around 2020. This supports continued growth in household furnishings such as woollen carpets.
Near-term crossbreed wool prices are expected to track sideways in this environment, though they may deviate up and down at each auction depending on buyer sentiment and the need to fi ll a specifi c order. Certain wool types, such as the good quality colour wools, have slightly higher demand. This means that pass-in rates and average sale prices will shift between auctions depending on the variety of wool types on offer.
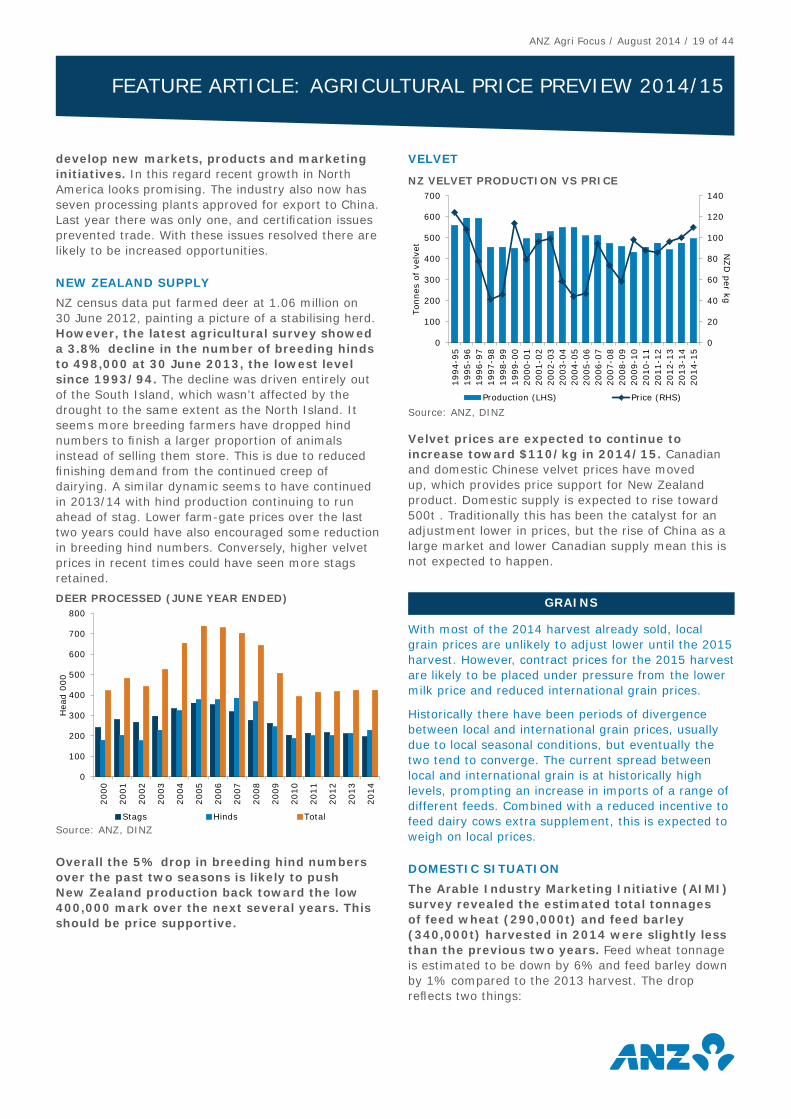
DEER
In-market venison prices have begun to gradually improve as buyer enquiry from the European market improves. It appears lower prices have encouraged an increase in consumption and lowered inventories. Improvement in retail prices for alternate meat proteins and alternative game meats in Europe is expected to provide some support.
With approximately 85% of returns for venison still coming from Europe, the industry’s long-term success depends on the ability to develop new markets and marketing initiatives. In the near term the direction of the NZD/EUR will have a large bearing on farm-gate prices over 2014/15. Every 1 cent movement in the NZD/EUR is worth about $0.20/kg on the farm-gate schedule. We have forecast a lower NZD/EUR, which combined with lower supply and improving in-market prices amounts to a forecast 10% lift in farm-gate returns.
IN-MARKET DYNAMICS
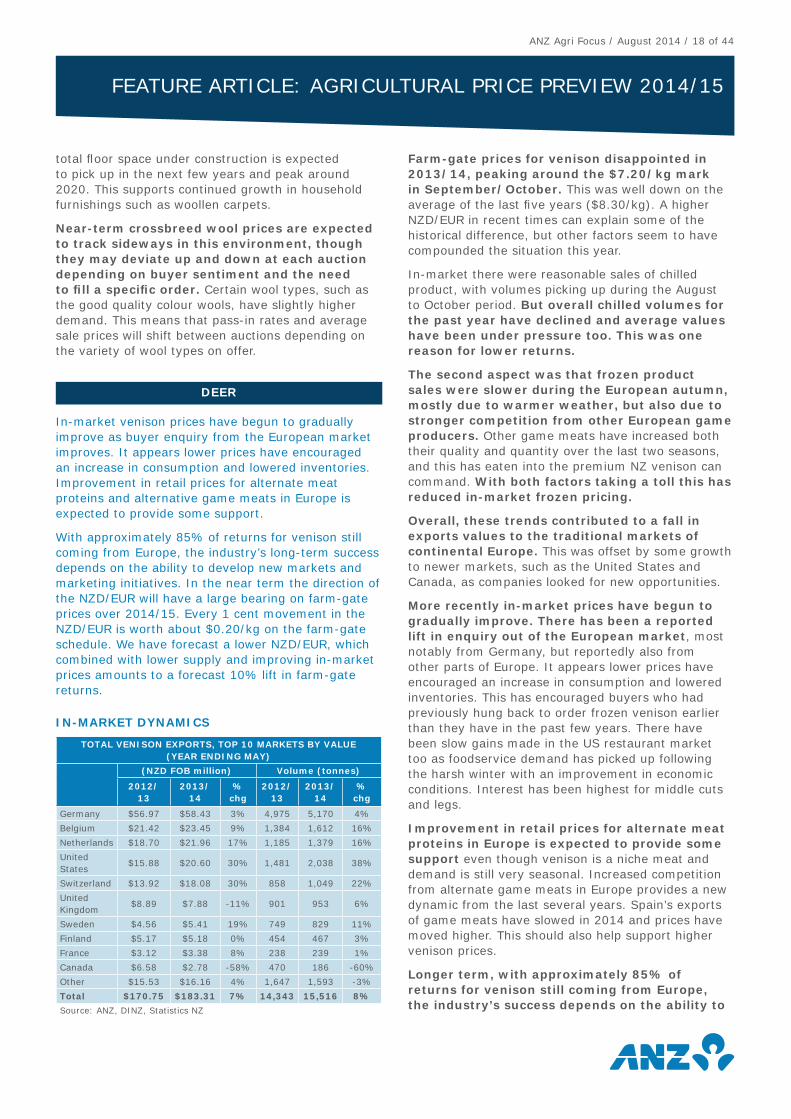
TOTAL VENISON EXPORTS, TOP 10 MARKETS BY VALUE (YEAR ENDING MAY)
(NZD FOB million) Volume (tonnes)
2012/13
2013/14
% chg
2012/13
2013/14
% chg
Germany $56.97 $58.43 3% 4,975 5,170 4%
Belgium $21.42 $23.45 9% 1,384 1,612 16%
Netherlands $18.70 $21.96 17% 1,185 1,379 16%
United States
$15.88 $20.60 30% 1,481 2,038 38%
Switzerland $13.92 $18.08 30% 858 1,049 22%
United Kingdom
$8.89 $7.88 -11% 901 953 6%
Sweden $4.56 $5.41 19% 749 829 11%
Finland $5.17 $5.18 0% 454 467 3%
France $3.12 $3.38 8% 238 239 1%
Canada $6.58 $2.78 -58% 470 186 -60%
Other $15.53 $16.16 4% 1,647 1,593 -3%
Total $170.75 $183.31 7% 14,343 15,516 8%
Source: ANZ, DINZ, Statistics NZ
Farm-gate prices for venison disappointed in 2013/14, peaking around the $7.20/kg mark in September/October. This was well down on the average of the last fi ve years ($8.30/kg). A higher NZD/EUR in recent times can explain some of the historical difference, but other factors seem to have compounded the situation this year.
In-market there were reasonable sales of chilled product, with volumes picking up during the August to October period. But overall chilled volumes for the past year have declined and average values have been under pressure too. This was one reason for lower returns.
The second aspect was that frozen product sales were slower during the European autumn, mostly due to warmer weather, but also due to stronger competition from other European game producers. Other game meats have increased both their quality and quantity over the last two seasons, and this has eaten into the premium NZ venison can command. With both factors taking a toll this has reduced in-market frozen pricing.
Overall, these trends contributed to a fall in exports values to the traditional markets of continental Europe. This was offset by some growth to newer markets, such as the United States and Canada, as companies looked for new opportunities.
More recently in-market prices have begun to gradually improve. There has been a reported lift in enquiry out of the European market, most notably from Germany, but reportedly also from other parts of Europe. It appears lower prices have encouraged an increase in consumption and lowered inventories. This has encouraged buyers who had previously hung back to order frozen venison earlier than they have in the past few years. There have been slow gains made in the US restaurant market too as foodservice demand has picked up following the harsh winter with an improvement in economic conditions. Interest has been highest for middle cuts and legs.
Improvement in retail prices for alternate meat proteins in Europe is expected to provide some support even though venison is a niche meat and demand is still very seasonal. Increased competition from alternate game meats in Europe provides a new dynamic from the last several years. Spain’s exports of game meats have slowed in 2014 and prices have moved higher. This should also help support higher venison prices.
Longer term, with approximately 85% of returns for venison still coming from Europe, the industry’s success depends on the ability to
FEATURE ARTICLE: AGRICULTURAL PRICE PREVIEW 2014/15
ANZ Agri Focus / August 2014 / 19 of 44
develop new markets, products and marketing initiatives. In this regard recent growth in North America looks promising. The industry also now has seven processing plants approved for export to China. Last year there was only one, and certifi cation issues prevented trade. With these issues resolved there are likely to be increased opportunities.
NEW ZEALAND SUPPLY
NZ census data put farmed deer at 1.06 million on 30 June 2012, painting a picture of a stabilising herd. However, the latest agricultural survey showed a 3.8% decline in the number of breeding hinds to 498,000 at 30 June 2013, the lowest level since 1993/94. The decline was driven entirely out of the South Island, which wasn’t affected by the drought to the same extent as the North Island. It seems more breeding farmers have dropped hind numbers to fi nish a larger proportion of animals instead of selling them store. This is due to reduced fi nishing demand from the continued creep of dairying. A similar dynamic seems to have continued in 2013/14 with hind production continuing to run ahead of stag. Lower farm-gate prices over the last two years could have also encouraged some reduction in breeding hind numbers. Conversely, higher velvet prices in recent times could have seen more stags retained.
Overall the 5% drop in breeding hind numbers over the past two seasons is likely to push New Zealand production back toward the low 400,000 mark over the next several years. This should be price supportive.
VELVET
Velvet prices are expected to continue to increase toward $110/kg in 2014/15. Canadian and domestic Chinese velvet prices have moved up, which provides price support for New Zealand product. Domestic supply is expected to rise toward 500t . Traditionally this has been the catalyst for an adjustment lower in prices, but the rise of China as a large market and lower Canadian supply mean this is not expected to happen.
GRAINS
With most of the 2014 harvest already sold, local grain prices are unlikely to adjust lower until the 2015 harvest. However, contract prices for the 2015 harvest are likely to be placed under pressure from the lower milk price and reduced international grain prices.
Historically there have been periods of divergence between local and international grain prices, usually due to local seasonal conditions, but eventually the two tend to converge. The current spread between local and international grain is at historically high levels, prompting an increase in imports of a range of different feeds. Combined with a reduced incentive to feed dairy cows extra supplement, this is expected to weigh on local prices.
DOMESTIC SITUATION
The Arable Industry Marketing Initiative (AIMI) survey revealed the estimated total tonnages of feed wheat (290,000t) and feed barley (340,000t) harvested in 2014 were slightly less than the previous two years. Feed wheat tonnage is estimated to be down by 6% and feed barley down by 1% compared to the 2013 harvest. The drop refl ects two things:
FEATURE ARTICLE: AGRICULTURAL PRICE PREVIEW 2014/15
0
100
200
300
400
500
600
700
800
2000
2001
2002
2003
2004
2005
2006
2007
2008
2009
2010
2011
2012
2013
2014
Hea
d 0
00
Stags Hinds Total
DEER PROCESSED (JUNE YEAR ENDED)
Source: ANZ, DINZ
0
20
40
60
80
100
120
140
0
100
200
300
400
500
600
700
1994-9
51995-9
61996-9
71997-9
81998-9
91999-0
02000-0
12001-0
22002-0
32003-0
42004-0
52005-0
62006-0
72007-0
82008-0
92009-1
02010-1
12011-1
22012-1
32013-1
42014-1
5
NZD
per kg
Tonnes
of
velv
et
Production (LHS) Price (RHS)
NZ VELVET PRODUCTION VS PRICE
Source: ANZ, DINZ
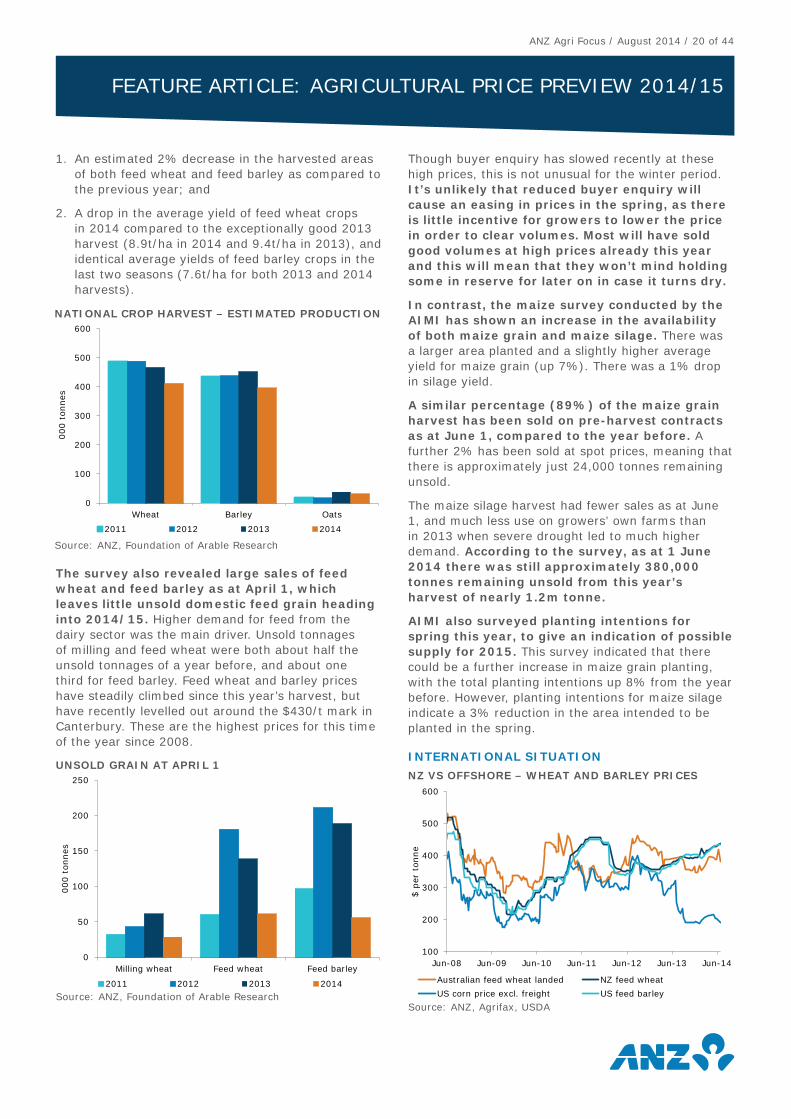
ANZ Agri Focus / August 2014 / 20 of 44
1. An estimated 2% decrease in the harvested areas of both feed wheat and feed barley as compared to the previous year; and
2. A drop in the average yield of feed wheat crops in 2014 compared to the exceptionally good 2013 harvest (8.9t/ha in 2014 and 9.4t/ha in 2013), and identical average yields of feed barley crops in the last two seasons (7.6t/ha for both 2013 and 2014 harvests).
The survey also revealed large sales of feed wheat and feed barley as at April 1, which leaves little unsold domestic feed grain heading into 2014/15. Higher demand for feed from the dairy sector was the main driver. Unsold tonnages of milling and feed wheat were both about half the unsold tonnages of a year before, and about one third for feed barley. Feed wheat and barley prices have steadily climbed since this year’s harvest, but have recently levelled out around the $430/t mark in Canterbury. These are the highest prices for this time of the year since 2008.
Though buyer enquiry has slowed recently at these high prices, this is not unusual for the winter period. It’s unlikely that reduced buyer enquiry will cause an easing in prices in the spring, as there is little incentive for growers to lower the price in order to clear volumes. Most will have sold good volumes at high prices already this year and this will mean that they won’t mind holding some in reserve for later on in case it turns dry.
In contrast, the maize survey conducted by the AIMI has shown an increase in the availability of both maize grain and maize silage. There was a larger area planted and a slightly higher average yield for maize grain (up 7%). There was a 1% drop in silage yield.
A similar percentage (89%) of the maize grain harvest has been sold on pre-harvest contracts as at June 1, compared to the year before. A further 2% has been sold at spot prices, meaning that there is approximately just 24,000 tonnes remaining unsold.
The maize silage harvest had fewer sales as at June 1, and much less use on growers’ own farms than in 2013 when severe drought led to much higher demand. According to the survey, as at 1 June 2014 there was still approximately 380,000 tonnes remaining unsold from this year’s harvest of nearly 1.2m tonne.
AIMI also surveyed planting intentions for spring this year, to give an indication of possible supply for 2015. This survey indicated that there could be a further increase in maize grain planting, with the total planting intentions up 8% from the year before. However, planting intentions for maize silage indicate a 3% reduction in the area intended to be planted in the spring.
INTERNATIONAL SITUATION
FEATURE ARTICLE: AGRICULTURAL PRICE PREVIEW 2014/15
0
50
100
150
200
250
Milling wheat Feed wheat Feed barley
000 t
onnes
2011 2012 2013 2014
UNSOLD GRAIN AT APRIL 1
Source: ANZ, Foundation of Arable Research
100
200
300
400
500
600
Jun-08 Jun-09 Jun-10 Jun-11 Jun-12 Jun-13 Jun-14
$ p
er t
onne
Australian feed wheat landed NZ feed wheat
US corn price excl. freight US feed barley
NZ VS OFFSHORE – WHEAT AND BARLEY PRICES
Source: ANZ, Agrifax, USDA
0
100
200
300
400
500
600
Wheat Barley Oats
000 t
onnes
2011 2012 2013 2014
NATIONAL CROP HARVEST – ESTIMATED PRODUCTION
Source: ANZ, Foundation of Arable Research
ANZ Agri Focus / August 2014 / 21 of 44
Two factors that will weigh on domestic prices are lower global grain prices, which have shifted down recently, and a sharply lower milk price. Lower global grain prices combined with the high NZD is making a wide range of alternate feed sources viable to import.
Barley imports were already close to a full-year record at April, with imports of over 13,000 tonne for the year. Wheat imports have been running nearly 50% ahead of the fi ve-year average. There have also been imports of maize from the US. Year-to-date palm kernel imports have increased substantially and are on track to hit over 2m tonnes for the 2014 year. This is well up from 1.6m tonnes last year and 1.3m tonnes for the 2010 to 2012 period.
With Australian grain prices easing further as they are pulled down by US prices, this supports further imports into NZ, and in particular into the South Island. The larger Australian price drops have been in the forward prices for this year’s harvest. The new season prices had been factoring in the threat of El Niño in Australia, but for now, planting has progressed well and for the most part moisture levels have been viewed as good for the current crop.
Australian grain prices have also been pulled down by the recent dramatic decline in US grain prices. US crop prices have dropped on reports showing the best corn and soybean growing conditions in 10 years. Wheat condition is much worse, but this was priced in long ago, and with high expectations for wheat crops in the Black Sea region and Australia, prices have been dragged down too.
Carry-over stock from the likes of corn has been higher than expected also. Use of corn for feed has been well down this year due to lower numbers of cattle on feed and lower pig numbers. Ethanol demand appears to have plateaued and it accounts for a smaller percentage of the total available supply than it did a couple of years ago. Lower corn prices will certainly encourage ethanol production, with more product going to export markets. The challenge for ethanol demand is the trend towards more effi cient fuel usage. This implies less ethanol is needed to blend with fuel at a 10% blend. More corn will be exported, but that again is a function of price, as well as grain supplies in other markets. At this stage US domestic corn stockpiles are 3.854 billion bushels, which is 39% higher than a year ago.
Soybean prices have dropped due to record planting in the US this year. The latest USDA outlook beat analysts’ expectations by nearly 3 million acres, 3.5% above expectations. Planting of soybeans is largely complete now and has run ahead of last
year, which bodes well for yields. Many growers have opted to switch into soybeans rather than corn this season due to the better margins available.
Historically there have been periods of divergence between local and international grain prices, usually due to local seasonal conditions, but eventually the two tend to converge. The current spread between local and international grain is at historically high levels, prompting an increase in imports of a range of feeds. Combined with a reduced incentive to feed dairy cows extra supplement, this is expected to weigh on local prices.
KIWIFRUIT
The supply of different varieties of kiwifruit and the NZD will continue to be the biggest determinants of orchard-gate pricing over the next four harvests. Supply will infl uence the marketing mix, in-market price tension, and the volume for which increased costs (i.e. marketing of new Gold variety) can be spread. Gains from lower fruit losses and packaging costs have probably run their course over the last two harvests.
Overall, this is expected to see orchard-gate returns for Green around the $5.25/tray mark in 2014. Longer term with smaller volumes of Green to be produced it will be about optimising returns. This is expected to see returns lift to around the mid-$5/tray mark in 2015.
Expectations for Gold orchard-gate returns are more diffi cult to forecast. An increase in supply will infl uence the market mix at the margin, and, combined with more marketing activity, will reduce revenue. Stabilisation in costs is expected, but an increase in fruit loss and the higher NZD, especially against the JPY as long-term currency hedging rolls off, provide the main downside. This is expected to see 2014 Gold3 orchard-gate returns pull back toward the $9-$10/tray mark. Longer-term Zespri still believe Gold3 returns will move back to the $7.50/tray mark as supply increases back toward 50-60 million trays.
DOMESTIC SUPPLYThe 2014 crop is expected to be around 88.5m trays. This would be slightly larger (+3%) than the 86m trays harvested in 2013, but still well down on 101m trays in 2012. Within this, total Gold production is expected to increase 70% to 18.5m trays, which is slightly better than earlier estimates. This increase is due to better yields and some earlier grafted Gold3 beginning to produce fruit. Green production is forecast to decrease 5% to 65.8m trays. This is
FEATURE ARTICLE: AGRICULTURAL PRICE PREVIEW 2014/15
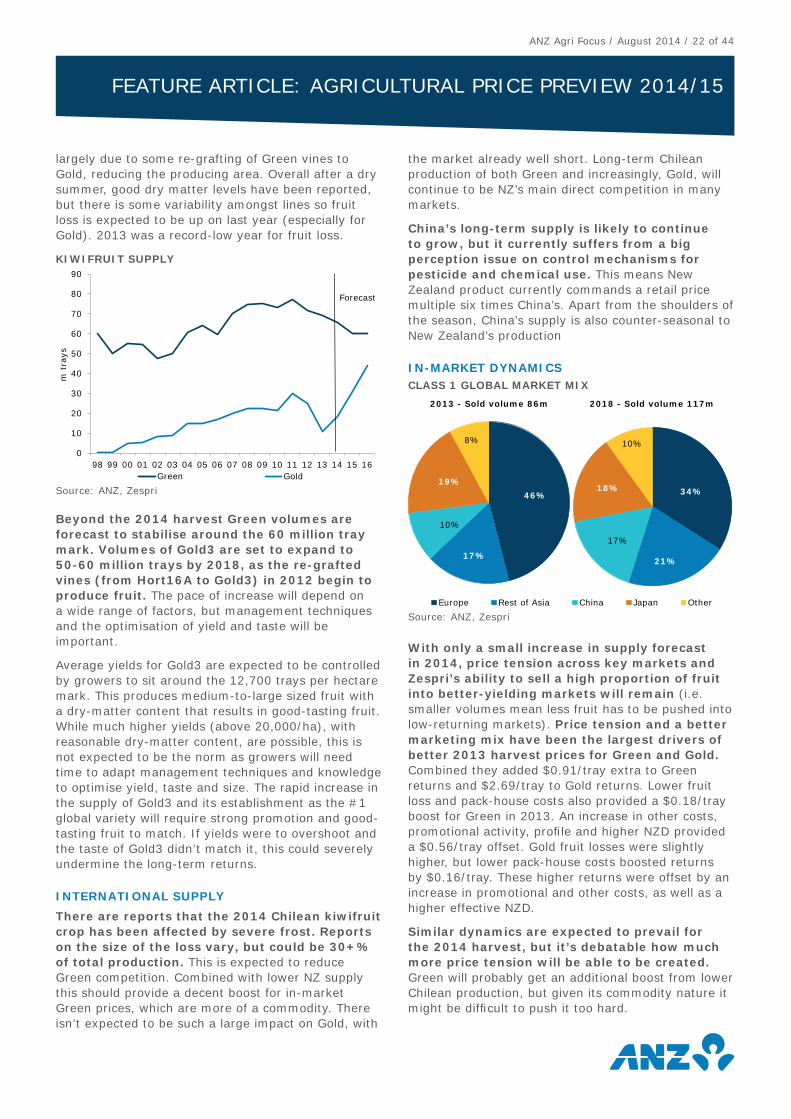
ANZ Agri Focus / August 2014 / 22 of 44
largely due to some re-grafting of Green vines to Gold, reducing the producing area. Overall after a dry summer, good dry matter levels have been reported, but there is some variability amongst lines so fruit loss is expected to be up on last year (especially for Gold). 2013 was a record-low year for fruit loss.
Beyond the 2014 harvest Green volumes are forecast to stabilise around the 60 million tray mark. Volumes of Gold3 are set to expand to 50-60 million trays by 2018, as the re-grafted vines (from Hort16A to Gold3) in 2012 begin to produce fruit. The pace of increase will depend on a wide range of factors, but management techniques and the optimisation of yield and taste will be important.
Average yields for Gold3 are expected to be controlled by growers to sit around the 12,700 trays per hectare mark. This produces medium-to-large sized fruit with a dry-matter content that results in good-tasting fruit. While much higher yields (above 20,000/ha), with reasonable dry-matter content, are possible, this is not expected to be the norm as growers will need time to adapt management techniques and knowledge to optimise yield, taste and size. The rapid increase in the supply of Gold3 and its establishment as the #1 global variety will require strong promotion and good-tasting fruit to match. If yields were to overshoot and the taste of Gold3 didn’t match it, this could severely undermine the long-term returns.
INTERNATIONAL SUPPLY
There are reports that the 2014 Chilean kiwifruit crop has been affected by severe frost. Reports on the size of the loss vary, but could be 30+% of total production. This is expected to reduce Green competition. Combined with lower NZ supply this should provide a decent boost for in-market Green prices, which are more of a commodity. There isn’t expected to be such a large impact on Gold, with
the market already well short. Long-term Chilean production of both Green and increasingly, Gold, will continue to be NZ’s main direct competition in many markets.
China’s long-term supply is likely to continue to grow, but it currently suffers from a big perception issue on control mechanisms for pesticide and chemical use. This means New Zealand product currently commands a retail price multiple six times China’s. Apart from the shoulders of the season, China’s supply is also counter-seasonal to New Zealand’s production
IN-MARKET DYNAMICS
With only a small increase in supply forecast in 2014, price tension across key markets and Zespri’s ability to sell a high proportion of fruit into better-yielding markets will remain (i.e. smaller volumes mean less fruit has to be pushed into low-returning markets). Price tension and a better marketing mix have been the largest drivers of better 2013 harvest prices for Green and Gold. Combined they added $0.91/tray extra to Green returns and $2.69/tray to Gold returns. Lower fruit loss and pack-house costs also provided a $0.18/tray boost for Green in 2013. An increase in other costs, promotional activity, profi le and higher NZD provided a $0.56/tray offset. Gold fruit losses were slightly higher, but lower pack-house costs boosted returns by $0.16/tray. These higher returns were offset by an increase in promotional and other costs, as well as a higher effective NZD.
Similar dynamics are expected to prevail for the 2014 harvest, but it’s debatable how much more price tension will be able to be created. Green will probably get an additional boost from lower Chilean production, but given its commodity nature it might be diffi cult to push it too hard.
46%
17%
10%
19%
8%
Europe Rest of Asia China Japan Other
2013 - Sold volume 86m 2018 - Sold volume 117m
34%
21%
17%
18%
10%
CLASS 1 GLOBAL MARKET MIX
Source: ANZ, Zespri
FEATURE ARTICLE: AGRICULTURAL PRICE PREVIEW 2014/15
0
10
20
30
40
50
60
70
80
90
98 99 00 01 02 03 04 05 06 07 08 09 10 11 12 13 14 15 16
m t
rays
Green Gold
Forecast
KIWIFRUIT SUPPLY
Source: ANZ, Zespri
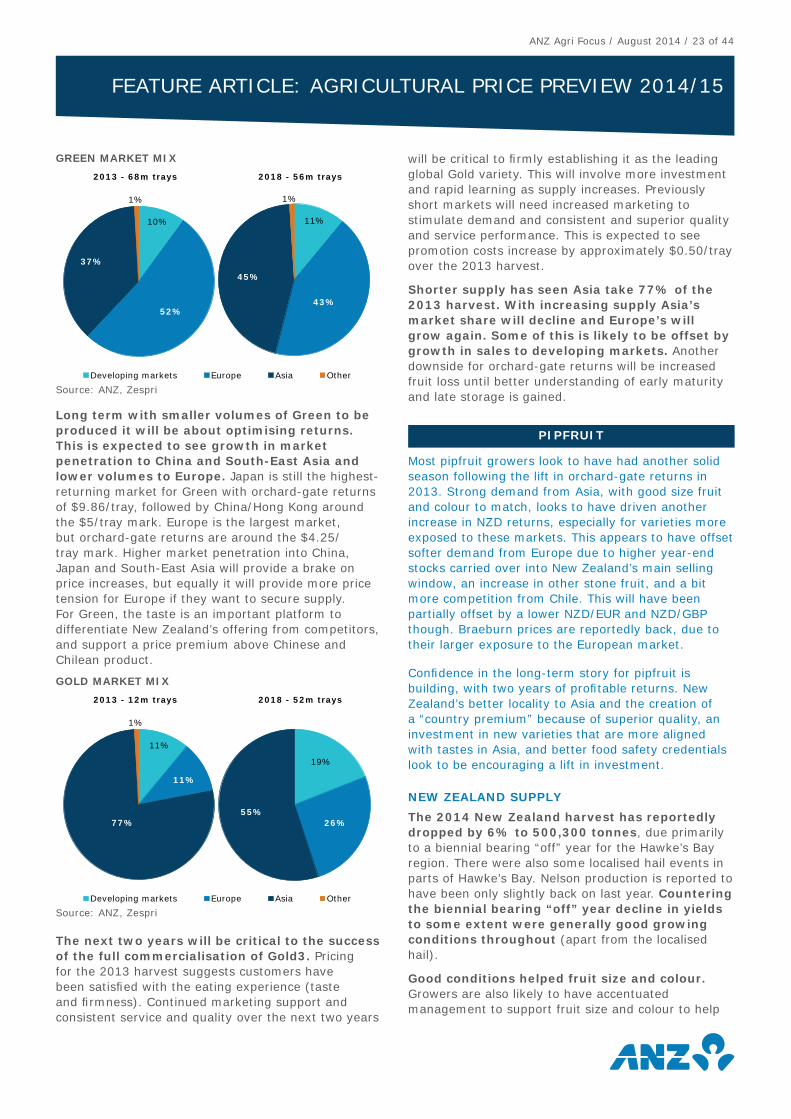
ANZ Agri Focus / August 2014 / 23 of 44
Long term with smaller volumes of Green to be produced it will be about optimising returns. This is expected to see growth in market penetration to China and South-East Asia and lower volumes to Europe. Japan is still the highest-returning market for Green with orchard-gate returns of $9.86/tray, followed by China/Hong Kong around the $5/tray mark. Europe is the largest market, but orchard-gate returns are around the $4.25/tray mark. Higher market penetration into China, Japan and South-East Asia will provide a brake on price increases, but equally it will provide more price tension for Europe if they want to secure supply. For Green, the taste is an important platform to differentiate New Zealand’s offering from competitors, and support a price premium above Chinese and Chilean product.
The next two years will be critical to the success of the full commercialisation of Gold3. Pricing for the 2013 harvest suggests customers have been satisfi ed with the eating experience (taste and fi rmness). Continued marketing support and consistent service and quality over the next two years
will be critical to fi rmly establishing it as the leading global Gold variety. This will involve more investment and rapid learning as supply increases. Previously short markets will need increased marketing to stimulate demand and consistent and superior quality and service performance. This is expected to see promotion costs increase by approximately $0.50/tray over the 2013 harvest.
Shorter supply has seen Asia take 77% of the 2013 harvest. With increasing supply Asia’s market share will decline and Europe’s will grow again. Some of this is likely to be offset by growth in sales to developing markets. Another downside for orchard-gate returns will be increased fruit loss until better understanding of early maturity and late storage is gained.
PIPFRUIT
Most pipfruit growers look to have had another solid season following the lift in orchard-gate returns in 2013. Strong demand from Asia, with good size fruit and colour to match, looks to have driven another increase in NZD returns, especially for varieties more exposed to these markets. This appears to have offset softer demand from Europe due to higher year-end stocks carried over into New Zealand’s main selling window, an increase in other stone fruit, and a bit more competition from Chile. This will have been partially offset by a lower NZD/EUR and NZD/GBP though. Braeburn prices are reportedly back, due to their larger exposure to the European market.
Confi dence in the long-term story for pipfruit is building, with two years of profi table returns. New Zealand’s better locality to Asia and the creation of a “country premium” because of superior quality, an investment in new varieties that are more aligned with tastes in Asia, and better food safety credentials look to be encouraging a lift in investment.
NEW ZEALAND SUPPLY
The 2014 New Zealand harvest has reportedly dropped by 6% to 500,300 tonnes, due primarily to a biennial bearing “off” year for the Hawke’s Bay region. There were also some localised hail events in parts of Hawke’s Bay. Nelson production is reported to have been only slightly back on last year. Countering the biennial bearing “off” year decline in yields to some extent were generally good growing conditions throughout (apart from the localised hail).
Good conditions helped fruit size and colour. Growers are also likely to have accentuated management to support fruit size and colour to help
11%
11%
77%
1%
Developing markets Europe Asia Other
2013 - 12m trays 2018 - 52m trays
19%
26%55%
GOLD MARKET MIX
Source: ANZ, Zespri
FEATURE ARTICLE: AGRICULTURAL PRICE PREVIEW 2014/15
10%
52%
37%
1%
Developing markets Europe Asia Other
2013 - 68m trays 2018 - 56m trays
11%
43%
45%
1%
GREEN MARKET MIX
Source: ANZ, Zespri
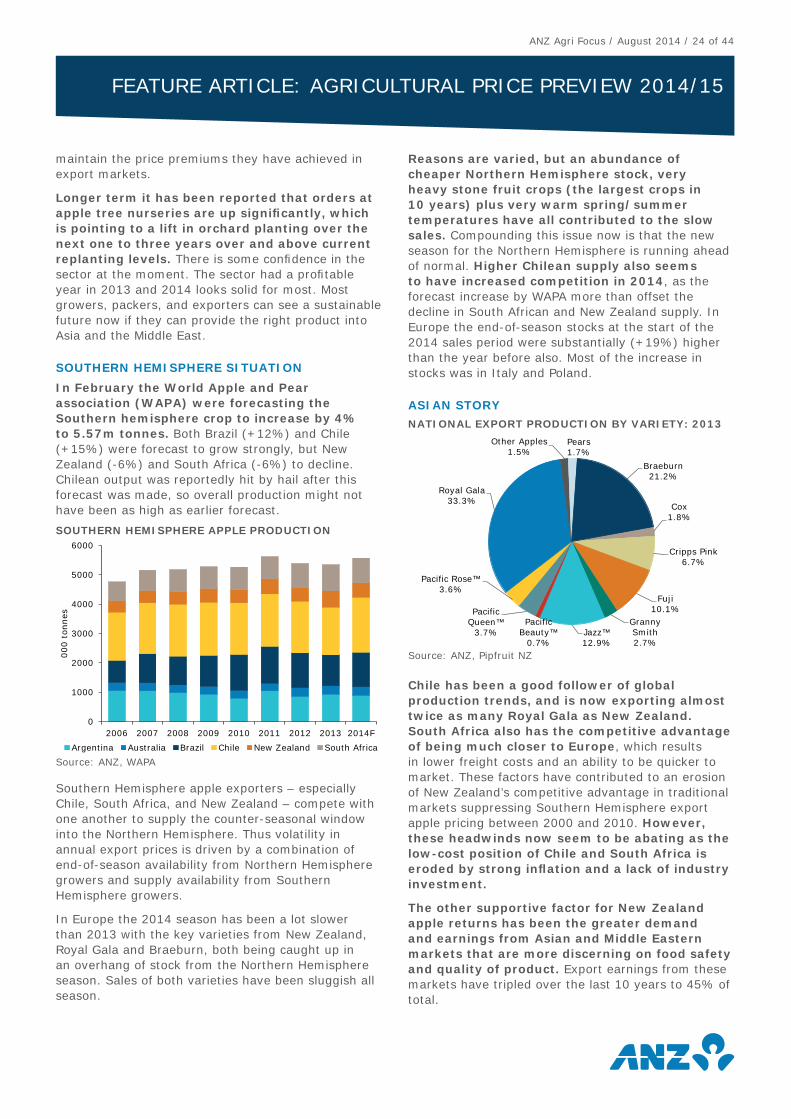
ANZ Agri Focus / August 2014 / 24 of 44
maintain the price premiums they have achieved in export markets.
Longer term it has been reported that orders at apple tree nurseries are up signifi cantly, which is pointing to a lift in orchard planting over the next one to three years over and above current replanting levels. There is some confi dence in the sector at the moment. The sector had a profi table year in 2013 and 2014 looks solid for most. Most growers, packers, and exporters can see a sustainable future now if they can provide the right product into Asia and the Middle East.
SOUTHERN HEMISPHERE SITUATION
In February the World Apple and Pear association (WAPA) were forecasting the Southern hemisphere crop to increase by 4% to 5.57m tonnes. Both Brazil (+12%) and Chile (+15%) were forecast to grow strongly, but New Zealand (-6%) and South Africa (-6%) to decline. Chilean output was reportedly hit by hail after this forecast was made, so overall production might not have been as high as earlier forecast.
Southern Hemisphere apple exporters – especially Chile, South Africa, and New Zealand – compete with one another to supply the counter-seasonal window into the Northern Hemisphere. Thus volatility in annual export prices is driven by a combination of end-of-season availability from Northern Hemisphere growers and supply availability from Southern Hemisphere growers.
In Europe the 2014 season has been a lot slower than 2013 with the key varieties from New Zealand, Royal Gala and Braeburn, both being caught up in an overhang of stock from the Northern Hemisphere season. Sales of both varieties have been sluggish all season.
Reasons are varied, but an abundance of cheaper Northern Hemisphere stock, very heavy stone fruit crops (the largest crops in 10 years) plus very warm spring/summer temperatures have all contributed to the slow sales. Compounding this issue now is that the new season for the Northern Hemisphere is running ahead of normal. Higher Chilean supply also seems to have increased competition in 2014, as the forecast increase by WAPA more than offset the decline in South African and New Zealand supply. In Europe the end-of-season stocks at the start of the 2014 sales period were substantially (+19%) higher than the year before also. Most of the increase in stocks was in Italy and Poland.
ASIAN STORY
Chile has been a good follower of global production trends, and is now exporting almost twice as many Royal Gala as New Zealand. South Africa also has the competitive advantage of being much closer to Europe, which results in lower freight costs and an ability to be quicker to market. These factors have contributed to an erosion of New Zealand’s competitive advantage in traditional markets suppressing Southern Hemisphere export apple pricing between 2000 and 2010. However, these headwinds now seem to be abating as the low-cost position of Chile and South Africa is eroded by strong infl ation and a lack of industry investment.
The other supportive factor for New Zealand apple returns has been the greater demand and earnings from Asian and Middle Eastern markets that are more discerning on food safety and quality of product. Export earnings from these markets have tripled over the last 10 years to 45% of total.
Cox1.8%
Cripps Pink6.7%
Fuji10.1%
Granny Smith2.7%
Jazz™12.9%
Pacific Beauty™
0.7%
Pacific Queen™
3.7%
Pacific Rose™3.6%
Royal Gala33.3%
Other Apples1.5%
Pears1.7%
Braeburn21.2%
NATIONAL EXPORT PRODUCTION BY VARIETY: 2013
Source: ANZ, Pipfruit NZ
0
1000
2000
3000
4000
5000
6000
2006 2007 2008 2009 2010 2011 2012 2013 2014F
000 t
onnes
Argentina Australia Brazil Chile New Zealand South Africa
SOUTHERN HEMISPHERE APPLE PRODUCTION
Source: ANZ, WAPA
FEATURE ARTICLE: AGRICULTURAL PRICE PREVIEW 2014/15
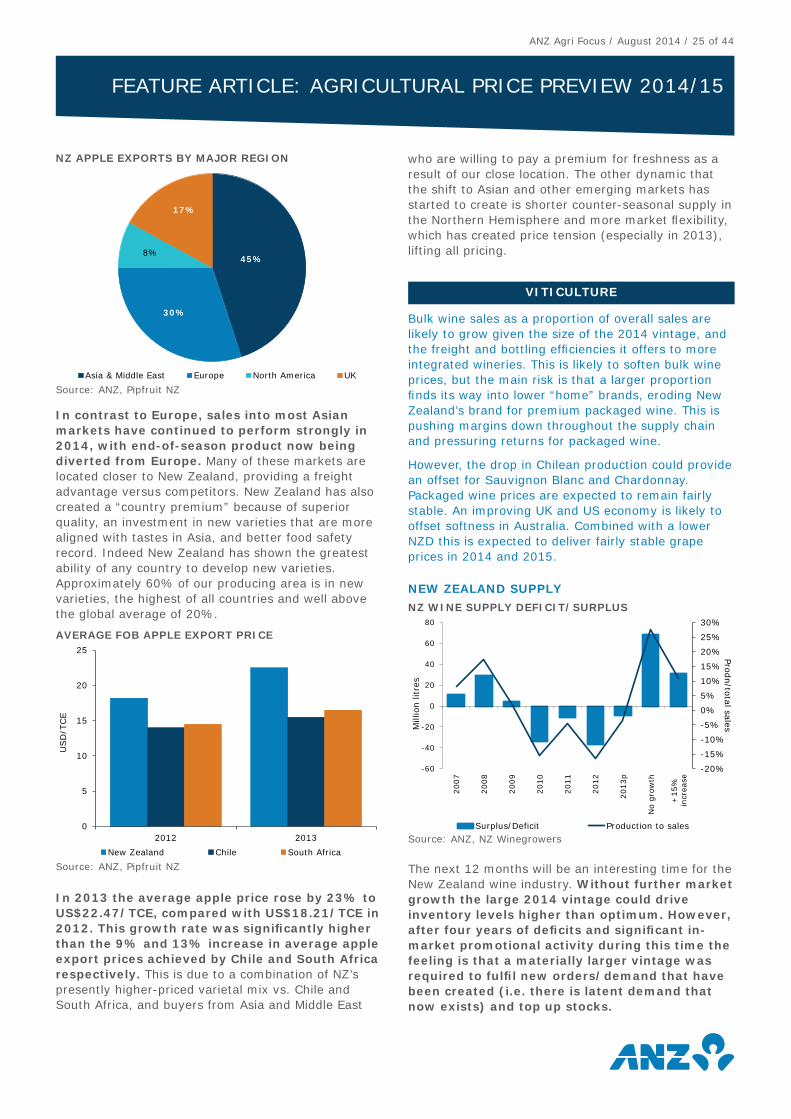
ANZ Agri Focus / August 2014 / 25 of 44
In contrast to Europe, sales into most Asian markets have continued to perform strongly in 2014, with end-of-season product now being diverted from Europe. Many of these markets are located closer to New Zealand, providing a freight advantage versus competitors. New Zealand has also created a “country premium” because of superior quality, an investment in new varieties that are more aligned with tastes in Asia, and better food safety record. Indeed New Zealand has shown the greatest ability of any country to develop new varieties. Approximately 60% of our producing area is in new varieties, the highest of all countries and well above the global average of 20%.
In 2013 the average apple price rose by 23% to US$22.47/TCE, compared with US$18.21/TCE in 2012. This growth rate was signifi cantly higher than the 9% and 13% increase in average apple export prices achieved by Chile and South Africa respectively. This is due to a combination of NZ’s presently higher-priced varietal mix vs. Chile and South Africa, and buyers from Asia and Middle East
who are willing to pay a premium for freshness as a result of our close location. The other dynamic that the shift to Asian and other emerging markets has started to create is shorter counter-seasonal supply in the Northern Hemisphere and more market fl exibility, which has created price tension (especially in 2013), lifting all pricing.
VITICULTURE
Bulk wine sales as a proportion of overall sales are likely to grow given the size of the 2014 vintage, and the freight and bottling effi ciencies it offers to more integrated wineries. This is likely to soften bulk wine prices, but the main risk is that a larger proportion fi nds its way into lower “home” brands, eroding New Zealand’s brand for premium packaged wine. This is pushing margins down throughout the supply chain and pressuring returns for packaged wine.
However, the drop in Chilean production could provide an offset for Sauvignon Blanc and Chardonnay. Packaged wine prices are expected to remain fairly stable. An improving UK and US economy is likely to offset softness in Australia. Combined with a lower NZD this is expected to deliver fairly stable grape prices in 2014 and 2015.
NEW ZEALAND SUPPLY
The next 12 months will be an interesting time for the New Zealand wine industry. Without further market growth the large 2014 vintage could drive inventory levels higher than optimum. However, after four years of defi cits and signifi cant in-market promotional activity during this time the feeling is that a materially larger vintage was required to fulfi l new orders/demand that have been created (i.e. there is latent demand that now exists) and top up stocks.
0
5
10
15
20
25
2012 2013
USD
/TCE
New Zealand Chile South Africa
AVERAGE FOB APPLE EXPORT PRICE
Source: ANZ, Pipfruit NZ
-20%
-15%
-10%
-5%
0%
5%
10%
15%
20%
25%
30%
-60
-40
-20
0
20
40
60
80
2007
2008
2009
2010
2011
2012
2013p
No g
row
th
+15%
incr
ease
Prod
n/total salesM
illio
n li
tres
Surplus/Deficit Production to sales
NZ WINE SUPPLY DEFICIT/SURPLUS
Source: ANZ, NZ Winegrowers
FEATURE ARTICLE: AGRICULTURAL PRICE PREVIEW 2014/15
45%
30%
8%
17%
Asia & Middle East Europe North America UK
NZ APPLE EXPORTS BY MAJOR REGION
Source: ANZ, Pipfruit NZ
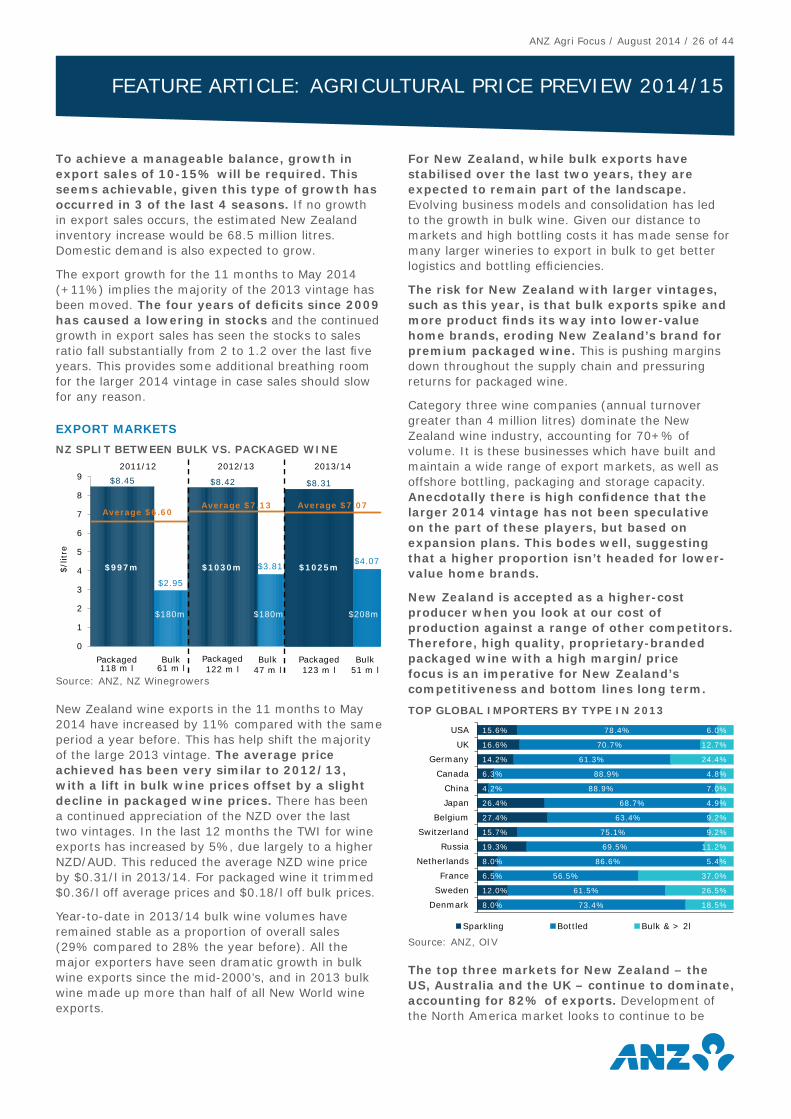
ANZ Agri Focus / August 2014 / 26 of 44
To achieve a manageable balance, growth in export sales of 10-15% will be required. This seems achievable, given this type of growth has occurred in 3 of the last 4 seasons. If no growth in export sales occurs, the estimated New Zealand inventory increase would be 68.5 million litres. Domestic demand is also expected to grow.
The export growth for the 11 months to May 2014 (+11%) implies the majority of the 2013 vintage has been moved. The four years of defi cits since 2009 has caused a lowering in stocks and the continued growth in export sales has seen the stocks to sales ratio fall substantially from 2 to 1.2 over the last fi ve years. This provides some additional breathing room for the larger 2014 vintage in case sales should slow for any reason.
EXPORT MARKETS
New Zealand wine exports in the 11 months to May 2014 have increased by 11% compared with the same period a year before. This has help shift the majority of the large 2013 vintage. The average price achieved has been very similar to 2012/13, with a lift in bulk wine prices offset by a slight decline in packaged wine prices. There has been a continued appreciation of the NZD over the last two vintages. In the last 12 months the TWI for wine exports has increased by 5%, due largely to a higher NZD/AUD. This reduced the average NZD wine price by $0.31/l in 2013/14. For packaged wine it trimmed $0.36/l off average prices and $0.18/l off bulk prices.
Year-to-date in 2013/14 bulk wine volumes have remained stable as a proportion of overall sales (29% compared to 28% the year before). All the major exporters have seen dramatic growth in bulk wine exports since the mid-2000’s, and in 2013 bulk wine made up more than half of all New World wine exports.
For New Zealand, while bulk exports have stabilised over the last two years, they are expected to remain part of the landscape. Evolving business models and consolidation has led to the growth in bulk wine. Given our distance to markets and high bottling costs it has made sense for many larger wineries to export in bulk to get better logistics and bottling effi ciencies.
The risk for New Zealand with larger vintages, such as this year, is that bulk exports spike and more product fi nds its way into lower-value home brands, eroding New Zealand’s brand for premium packaged wine. This is pushing margins down throughout the supply chain and pressuring returns for packaged wine.
Category three wine companies (annual turnover greater than 4 million litres) dominate the New Zealand wine industry, accounting for 70+% of volume. It is these businesses which have built and maintain a wide range of export markets, as well as offshore bottling, packaging and storage capacity. Anecdotally there is high confi dence that the larger 2014 vintage has not been speculative on the part of these players, but based on expansion plans. This bodes well, suggesting that a higher proportion isn’t headed for lower-value home brands.
New Zealand is accepted as a higher-cost producer when you look at our cost of production against a range of other competitors. Therefore, high quality, proprietary-branded packaged wine with a high margin/price focus is an imperative for New Zealand’s competitiveness and bottom lines long term.
The top three markets for New Zealand – the US, Australia and the UK – continue to dominate, accounting for 82% of exports. Development of the North America market looks to continue to be
8.0%
12.0%
6.5%
8.0%
19.3%
15.7%
27.4%
26.4%
4.2%
6.3%
14.2%
16.6%
15.6%
73.4%
61.5%
56.5%
86.6%
69.5%
75.1%
63.4%
68.7%
88.9%
88.9%
61.3%
70.7%
78.4%
18.5%
26.5%
37.0%
5.4%
11.2%
9.2%
9.2%
4.9%
7.0%
4.8%
24.4%
12.7%
6.0%
Denmark
Sweden
France
Netherlands
Russia
Switzerland
Belgium
Japan
China
Canada
Germany
UK
USA
Sparkling Bottled Bulk & > 2l
TOP GLOBAL IMPORTERS BY TYPE IN 2013
Source: ANZ, OIV
0
1
2
3
4
5
6
7
8
9
$/l
itre
Packaged118 m l
Bulk61 m l
2011/12 2012/13
$997m
$180m
$2.95
$8.42
$3.81
$180m
$1030m
Packaged122 m l
Bulk47 m l
Average $6.60Average $7.13
$8.45
2013/14
Average $7.07
$1025m
$208m
$4.07
$8.31
Packaged123 m l
Bulk51 m l
NZ SPLIT BETWEEN BULK VS. PACKAGED WINE
Source: ANZ, NZ Winegrowers
FEATURE ARTICLE: AGRICULTURAL PRICE PREVIEW 2014/15
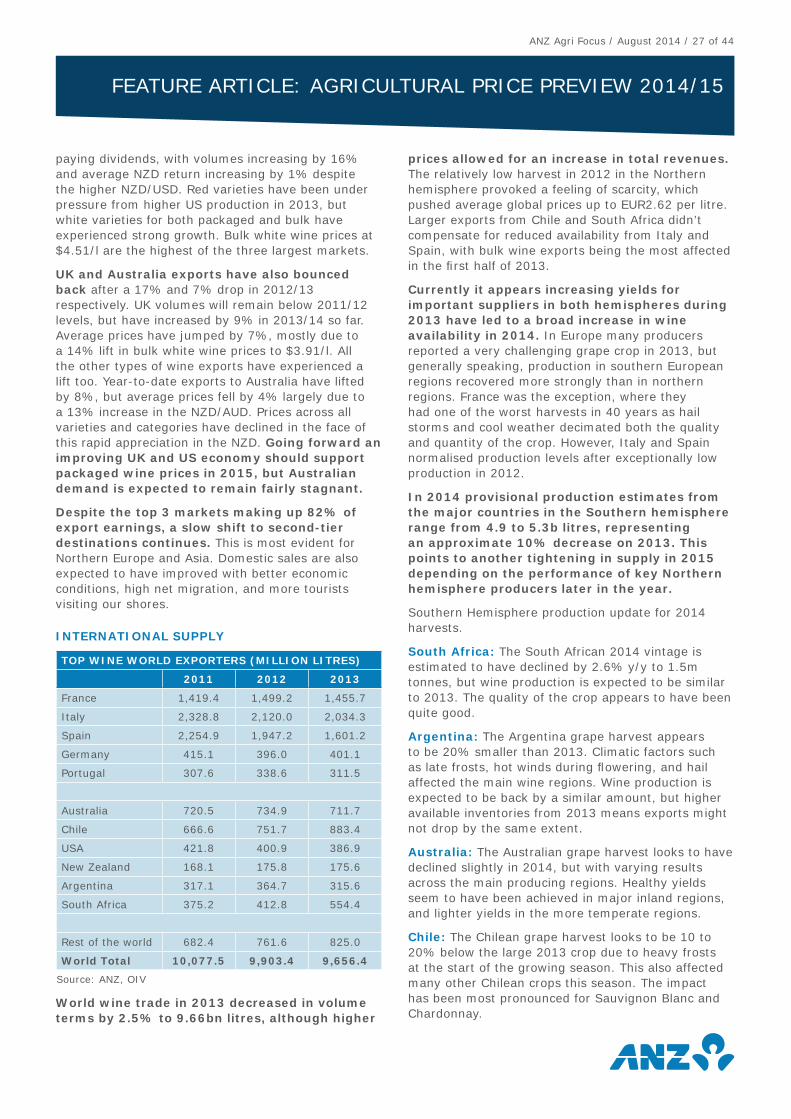
ANZ Agri Focus / August 2014 / 27 of 44
paying dividends, with volumes increasing by 16% and average NZD return increasing by 1% despite the higher NZD/USD. Red varieties have been under pressure from higher US production in 2013, but white varieties for both packaged and bulk have experienced strong growth. Bulk white wine prices at $4.51/l are the highest of the three largest markets.
UK and Australia exports have also bounced back after a 17% and 7% drop in 2012/13 respectively. UK volumes will remain below 2011/12 levels, but have increased by 9% in 2013/14 so far. Average prices have jumped by 7%, mostly due to a 14% lift in bulk white wine prices to $3.91/l. All the other types of wine exports have experienced a lift too. Year-to-date exports to Australia have lifted by 8%, but average prices fell by 4% largely due to a 13% increase in the NZD/AUD. Prices across all varieties and categories have declined in the face of this rapid appreciation in the NZD. Going forward an improving UK and US economy should support packaged wine prices in 2015, but Australian demand is expected to remain fairly stagnant.
Despite the top 3 markets making up 82% of export earnings, a slow shift to second-tier destinations continues. This is most evident for Northern Europe and Asia. Domestic sales are also expected to have improved with better economic conditions, high net migration, and more tourists visiting our shores.
INTERNATIONAL SUPPLY
TOP WINE WORLD EXPORTERS (MILLION LITRES)
2011 2012 2013
France 1,419.4 1,499.2 1,455.7
Italy 2,328.8 2,120.0 2,034.3
Spain 2,254.9 1,947.2 1,601.2
Germany 415.1 396.0 401.1
Portugal 307.6 338.6 311.5
Australia 720.5 734.9 711.7
Chile 666.6 751.7 883.4
USA 421.8 400.9 386.9
New Zealand 168.1 175.8 175.6
Argentina 317.1 364.7 315.6
South Africa 375.2 412.8 554.4
Rest of the world 682.4 761.6 825.0
World Total 10,077.5 9,903.4 9,656.4
Source: ANZ, OIV
World wine trade in 2013 decreased in volume terms by 2.5% to 9.66bn litres, although higher
prices allowed for an increase in total revenues. The relatively low harvest in 2012 in the Northern hemisphere provoked a feeling of scarcity, which pushed average global prices up to EUR2.62 per litre. Larger exports from Chile and South Africa didn’t compensate for reduced availability from Italy and Spain, with bulk wine exports being the most affected in the fi rst half of 2013.
Currently it appears increasing yields for important suppliers in both hemispheres during 2013 have led to a broad increase in wine availability in 2014. In Europe many producers reported a very challenging grape crop in 2013, but generally speaking, production in southern European regions recovered more strongly than in northern regions. France was the exception, where they had one of the worst harvests in 40 years as hail storms and cool weather decimated both the quality and quantity of the crop. However, Italy and Spain normalised production levels after exceptionally low production in 2012.
In 2014 provisional production estimates from the major countries in the Southern hemisphere range from 4.9 to 5.3b litres, representing an approximate 10% decrease on 2013. This points to another tightening in supply in 2015 depending on the performance of key Northern hemisphere producers later in the year.
Southern Hemisphere production update for 2014 harvests.
South Africa: The South African 2014 vintage is estimated to have declined by 2.6% y/y to 1.5m tonnes, but wine production is expected to be similar to 2013. The quality of the crop appears to have been quite good.
Argentina: The Argentina grape harvest appears to be 20% smaller than 2013. Climatic factors such as late frosts, hot winds during fl owering, and hail affected the main wine regions. Wine production is expected to be back by a similar amount, but higher available inventories from 2013 means exports might not drop by the same extent.
Australia: The Australian grape harvest looks to have declined slightly in 2014, but with varying results across the main producing regions. Healthy yields seem to have been achieved in major inland regions, and lighter yields in the more temperate regions.
Chile: The Chilean grape harvest looks to be 10 to 20% below the large 2013 crop due to heavy frosts at the start of the growing season. This also affected many other Chilean crops this season. The impact has been most pronounced for Sauvignon Blanc and Chardonnay.
FEATURE ARTICLE: AGRICULTURAL PRICE PREVIEW 2014/15
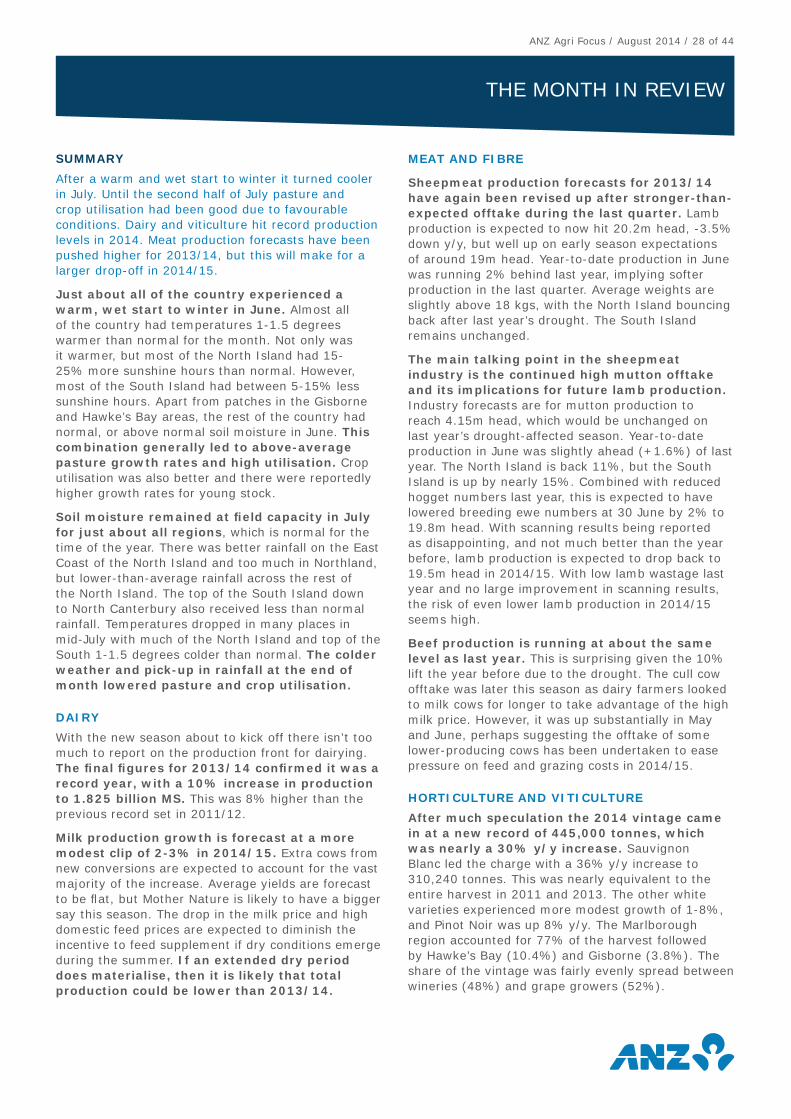
ANZ Agri Focus / August 2014 / 28 of 44
SUMMARY
After a warm and wet start to winter it turned cooler in July. Until the second half of July pasture and crop utilisation had been good due to favourable conditions. Dairy and viticulture hit record production levels in 2014. Meat production forecasts have been pushed higher for 2013/14, but this will make for a larger drop-off in 2014/15.
Just about all of the country experienced a warm, wet start to winter in June. Almost all of the country had temperatures 1-1.5 degrees warmer than normal for the month. Not only was it warmer, but most of the North Island had 15-25% more sunshine hours than normal. However, most of the South Island had between 5-15% less sunshine hours. Apart from patches in the Gisborne and Hawke’s Bay areas, the rest of the country had normal, or above normal soil moisture in June. This combination generally led to above-average pasture growth rates and high utilisation. Crop utilisation was also better and there were reportedly higher growth rates for young stock.
Soil moisture remained at fi eld capacity in July for just about all regions, which is normal for the time of the year. There was better rainfall on the East Coast of the North Island and too much in Northland, but lower-than-average rainfall across the rest of the North Island. The top of the South Island down to North Canterbury also received less than normal rainfall. Temperatures dropped in many places in mid-July with much of the North Island and top of the South 1-1.5 degrees colder than normal. The colder weather and pick-up in rainfall at the end of month lowered pasture and crop utilisation.
DAIRY
With the new season about to kick off there isn’t too much to report on the production front for dairying. The fi nal fi gures for 2013/14 confi rmed it was a record year, with a 10% increase in production to 1.825 billion MS. This was 8% higher than the previous record set in 2011/12.
Milk production growth is forecast at a more modest clip of 2-3% in 2014/15. Extra cows from new conversions are expected to account for the vast majority of the increase. Average yields are forecast to be fl at, but Mother Nature is likely to have a bigger say this season. The drop in the milk price and high domestic feed prices are expected to diminish the incentive to feed supplement if dry conditions emerge during the summer. If an extended dry period does materialise, then it is likely that total production could be lower than 2013/14.
MEAT AND FIBRE
Sheepmeat production forecasts for 2013/14 have again been revised up after stronger-than-expected offtake during the last quarter. Lamb production is expected to now hit 20.2m head, -3.5% down y/y, but well up on early season expectations of around 19m head. Year-to-date production in June was running 2% behind last year, implying softer production in the last quarter. Average weights are slightly above 18 kgs, with the North Island bouncing back after last year’s drought. The South Island remains unchanged.
The main talking point in the sheepmeat industry is the continued high mutton offtake and its implications for future lamb production. Industry forecasts are for mutton production to reach 4.15m head, which would be unchanged on last year’s drought-affected season. Year-to-date production in June was slightly ahead (+1.6%) of last year. The North Island is back 11%, but the South Island is up by nearly 15%. Combined with reduced hogget numbers last year, this is expected to have lowered breeding ewe numbers at 30 June by 2% to 19.8m head. With scanning results being reported as disappointing, and not much better than the year before, lamb production is expected to drop back to 19.5m head in 2014/15. With low lamb wastage last year and no large improvement in scanning results, the risk of even lower lamb production in 2014/15 seems high.
Beef production is running at about the same level as last year. This is surprising given the 10% lift the year before due to the drought. The cull cow offtake was later this season as dairy farmers looked to milk cows for longer to take advantage of the high milk price. However, it was up substantially in May and June, perhaps suggesting the offtake of some lower-producing cows has been undertaken to ease pressure on feed and grazing costs in 2014/15.
HORTICULTURE AND VITICULTURE
After much speculation the 2014 vintage came in at a new record of 445,000 tonnes, which was nearly a 30% y/y increase. Sauvignon Blanc led the charge with a 36% y/y increase to 310,240 tonnes. This was nearly equivalent to the entire harvest in 2011 and 2013. The other white varieties experienced more modest growth of 1-8%, and Pinot Noir was up 8% y/y. The Marlborough region accounted for 77% of the harvest followed by Hawke’s Bay (10.4%) and Gisborne (3.8%). The share of the vintage was fairly evenly spread between wineries (48%) and grape growers (52%).
THE MONTH IN REVIEW
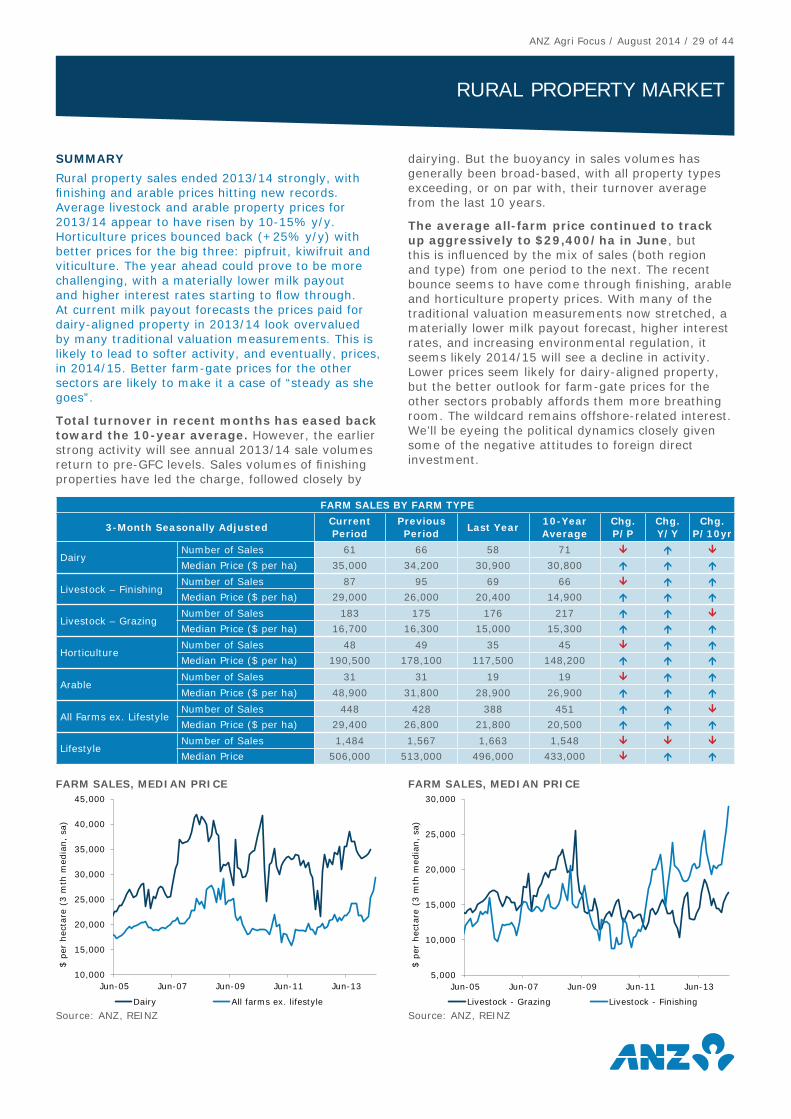
ANZ Agri Focus / August 2014 / 29 of 44
SUMMARY
Rural property sales ended 2013/14 strongly, with fi nishing and arable prices hitting new records. Average livestock and arable property prices for 2013/14 appear to have risen by 10-15% y/y. Horticulture prices bounced back (+25% y/y) with better prices for the big three: pipfruit, kiwifruit and viticulture. The year ahead could prove to be more challenging, with a materially lower milk payout and higher interest rates starting to fl ow through. At current milk payout forecasts the prices paid for dairy-aligned property in 2013/14 look overvalued by many traditional valuation measurements. This is likely to lead to softer activity, and eventually, prices, in 2014/15. Better farm-gate prices for the other sectors are likely to make it a case of “steady as she goes”.
Total turnover in recent months has eased back toward the 10-year average. However, the earlier strong activity will see annual 2013/14 sale volumes return to pre-GFC levels. Sales volumes of fi nishing properties have led the charge, followed closely by
dairying. But the buoyancy in sales volumes has generally been broad-based, with all property types exceeding, or on par with, their turnover average from the last 10 years.
The average all-farm price continued to track up aggressively to $29,400/ha in June, but this is infl uenced by the mix of sales (both region and type) from one period to the next. The recent bounce seems to have come through fi nishing, arable and horticulture property prices. With many of the traditional valuation measurements now stretched, a materially lower milk payout forecast, higher interest rates, and increasing environmental regulation, it seems likely 2014/15 will see a decline in activity. Lower prices seem likely for dairy-aligned property, but the better outlook for farm-gate prices for the other sectors probably affords them more breathing room. The wildcard remains offshore-related interest. We’ll be eyeing the political dynamics closely given some of the negative attitudes to foreign direct investment.
RURAL PROPERTY MARKET
FARM SALES BY FARM TYPE
3-Month Seasonally AdjustedCurrent Period
Previous Period
Last Year10-Year Average
Chg. P/P
Chg. Y/Y
Chg. P/10yr
DairyNumber of Sales 61 66 58 71
Median Price ($ per ha) 35,000 34,200 30,900 30,800
Livestock – FinishingNumber of Sales 87 95 69 66
Median Price ($ per ha) 29,000 26,000 20,400 14,900
Livestock – GrazingNumber of Sales 183 175 176 217
Median Price ($ per ha) 16,700 16,300 15,000 15,300
HorticultureNumber of Sales 48 49 35 45
Median Price ($ per ha) 190,500 178,100 117,500 148,200
ArableNumber of Sales 31 31 19 19
Median Price ($ per ha) 48,900 31,800 28,900 26,900
All Farms ex. LifestyleNumber of Sales 448 428 388 451
Median Price ($ per ha) 29,400 26,800 21,800 20,500
LifestyleNumber of Sales 1,484 1,567 1,663 1,548
Median Price 506,000 513,000 496,000 433,000
10,000
15,000
20,000
25,000
30,000
35,000
40,000
45,000
Jun-05 Jun-07 Jun-09 Jun-11 Jun-13
$ p
er h
ecta
re (
3 m
th m
edia
n,
sa)
Dairy All farms ex. lifestyle
FARM SALES, MEDIAN PRICE
Source: ANZ, REINZ
5,000
10,000
15,000
20,000
25,000
30,000
Jun-05 Jun-07 Jun-09 Jun-11 Jun-13
$ p
er h
ecta
re (
3 m
th m
edia
n,
sa)
Livestock - Grazing Livestock - Finishing
FARM SALES, MEDIAN PRICE
Source: ANZ, REINZ
ANZ Agri Focus / August 2014 / 30 of 44
RURAL PROPERTY MARKET
The upcoming spring period will be an interesting time to see how the rural property market digests a materially lower milk payout and higher interest rates. Buyers of dairy-aligned property will no doubt be sharpening their pencils on any deals and applying more conservative assumptions in budgets. Given excitement from 2013/14 will still linger for many vendors, it will be interesting to see how they react. Whether there is a reduction in listings, or a ‘list and see’ approach, could have a material effect on activity levels and how prices respond.
For the sheep and beef sector it is quite curious that the likes of grazing property prices rose by 15% y/y in 2013/14. Some of it might have been spillover from dairying, but this is still a material increase given cash rates of return are still very low (even when compared against historical norms). Confi dence has improved and further increases in farm-gate prices provide support. However, it feels like something more signifi cant is occurring. One possible explanation is the exiting of some of the lower-performing businesses as higher performers buy them out. This is starting to lead to sector consolidation. Of course, higher property prices imply the capitalisation of some of the future improvement that might be made by those higher performers.
Examining the backward-looking indicators for the rural property market on page 29 shows total turnover has come off its peak in early 2014 to sit around the 10-year average in recent months. This is not unusual for the time of year and we will have to wait for the spring period to get a better feeling for how the change in confi dence in dairying and high interest rates impact the market. Average prices in the three month period to June have ticked up to $29,400/ha. But this seems to have been driven by the mix of sales: during this period there were a higher number of horticulture and arable businesses sold, as well as a lower number of dairy properties.
The turnover of dairy farms has slowed in recent months, falling back below the 10-year average. Average prices have ticked up to $35,000/ha, but this seems to have been due to a higher proportion of sales occurring in the more expensive regions of Waikato, Canterbury and Southland. In the month of May, 26 dairy farms were sold at an average sale value of $33,100/ha, or $34 per kg MS. The average farm size was 147 hectares and the average production/ha was 964 kg MS. In the month of June, 15 dairy farms were sold with an average sale price of $45,000/ha, or $40 per kg MS. The average farm size was 111 hectares and production/ha was 1,130 kg MS.
Turnover for fi nishing properties has come off earlier highs, but is still hovering around 50% above the 10-year average. Average prices kicked up to $29,000/ha in June. This is the highest price we have on record and well outside the range of $18,000-$21,000/ha that has been the norm over the last 3 years or so. Most of the recent activity has been centered around dairying hot-spots in the South Island. The shift to more intensive farm systems has lifted the demand for good arable and fi nishing property to internalise feed and grazing costs. This has been further supported by environmental regulations, where one of the easiest ways to lower nutrient leaching is standing/grazing cows off the milking platform during certain conditions and periods of the year (winter).
Arable property prices hit $48,900/ha in June, which is also the highest we have on record. They have been buoyed by the same dynamics and high domestic feed grain prices. Grazing property prices have ticked up to $16,000-$17,000/ha in recent months. The season average price for 2013/14 is $16,000/ha, which is 15% above the year before. This is still 20% below the height of the GFC period when prices hit +$20,000/ha. Grazing property cash returns have averaged around 1% over the last 10 years. These have improved recently toward the high 1%s, but given the low level of cash returns it is diffi cult to see property prices moving much higher.
In the horticultural sector confi dence continues to rise. Turnover has remained robust and is now tracking in line with the 10-year average. The average sale price has continued to gravitate upwards.
Kiwifruit orchards are in hot demand. Confi dence has been boosted by solid 2013 orchard-gate returns, new investors entering the sector, Psa being less prevalent in many of the main growing regions, and confi dence building in the fi nancial performance of the new Gold variety G3. Properties have reportedly sold quickly and some at prices double the year before. For a well-situated quality gold kiwifruit orchard the going rate is $350,000 per canopy hectare. Green kiwifruit orchards are more diffi cult to come by, but recent sales at the premium end have ranged from $200,000-$250,000 per canopy hectare. In the viticulture space large wine companies have been looking to secure supply and make strategic purchases of brands that complement their existing business. This has seen a number of land sales transacted between $150,000-$200,000/ha in the last 18 months. This is $50,000/ha up on the post-GFC range of $100,000-$150,000/ha.
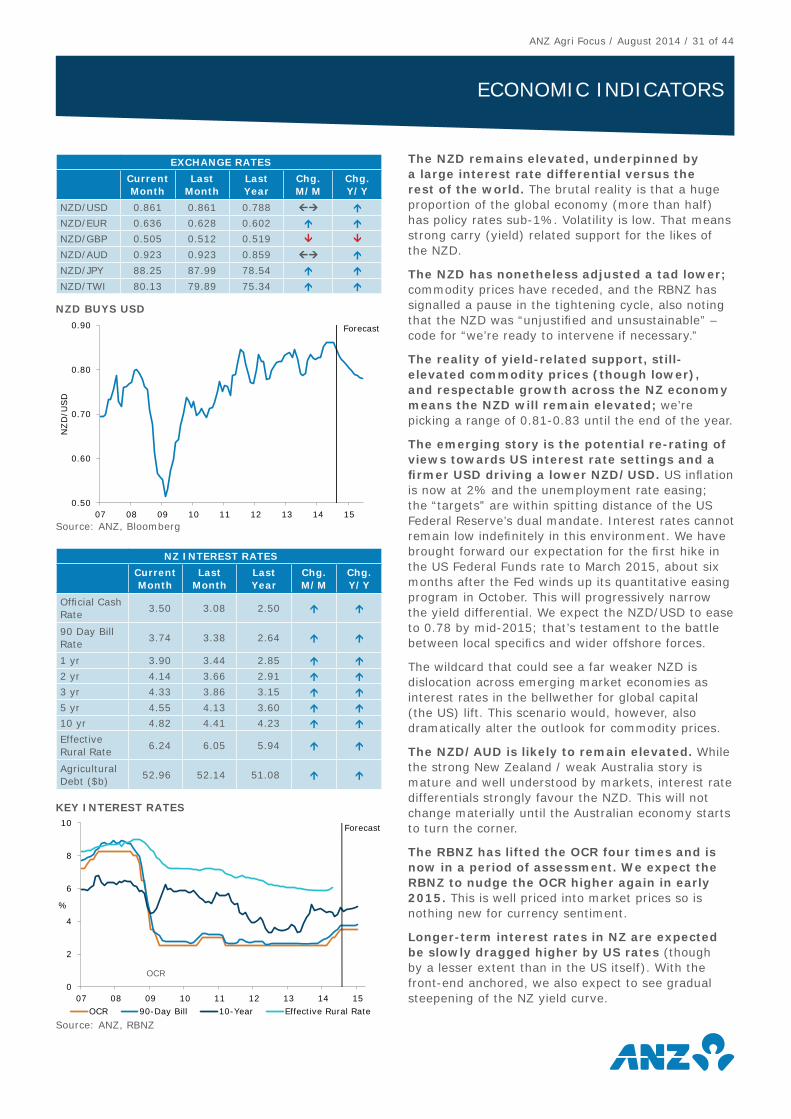
ANZ Agri Focus / August 2014 / 31 of 44
ECONOMIC INDICATORS
The NZD remains elevated, underpinned by a large interest rate differential versus the rest of the world. The brutal reality is that a huge proportion of the global economy (more than half) has policy rates sub-1%. Volatility is low. That means strong carry (yield) related support for the likes of the NZD.
The NZD has nonetheless adjusted a tad lower; commodity prices have receded, and the RBNZ has signalled a pause in the tightening cycle, also noting that the NZD was “unjustifi ed and unsustainable” – code for “we’re ready to intervene if necessary.”
The reality of yield-related support, still-elevated commodity prices (though lower), and respectable growth across the NZ economy means the NZD will remain elevated; we’re picking a range of 0.81-0.83 until the end of the year.
The emerging story is the potential re-rating of views towards US interest rate settings and a fi rmer USD driving a lower NZD/USD. US infl ation is now at 2% and the unemployment rate easing; the “targets” are within spitting distance of the US Federal Reserve’s dual mandate. Interest rates cannot remain low indefi nitely in this environment. We have brought forward our expectation for the fi rst hike in the US Federal Funds rate to March 2015, about six months after the Fed winds up its quantitative easing program in October. This will progressively narrow the yield differential. We expect the NZD/USD to ease to 0.78 by mid-2015; that’s testament to the battle between local specifi cs and wider offshore forces.
The wildcard that could see a far weaker NZD is dislocation across emerging market economies as interest rates in the bellwether for global capital (the US) lift. This scenario would, however, also dramatically alter the outlook for commodity prices.
The NZD/AUD is likely to remain elevated. While the strong New Zealand / weak Australia story is mature and well understood by markets, interest rate differentials strongly favour the NZD. This will not change materially until the Australian economy starts to turn the corner.
The RBNZ has lifted the OCR four times and is now in a period of assessment. We expect the RBNZ to nudge the OCR higher again in early 2015. This is well priced into market prices so is nothing new for currency sentiment.
Longer-term interest rates in NZ are expected be slowly dragged higher by US rates (though by a lesser extent than in the US itself). With the front-end anchored, we also expect to see gradual steepening of the NZ yield curve.
EXCHANGE RATES
Current Month
Last Month
Last Year
Chg. M/M
Chg. Y/Y
NZD/USD 0.861 0.861 0.788
NZD/EUR 0.636 0.628 0.602
NZD/GBP 0.505 0.512 0.519
NZD/AUD 0.923 0.923 0.859
NZD/JPY 88.25 87.99 78.54
NZD/TWI 80.13 79.89 75.34
NZ INTEREST RATES
Current Month
Last Month
Last Year
Chg. M/M
Chg. Y/Y
Offi cial Cash Rate
3.50 3.08 2.50
90 Day Bill Rate
3.74 3.38 2.64
1 yr 3.90 3.44 2.85
2 yr 4.14 3.66 2.91
3 yr 4.33 3.86 3.15
5 yr 4.55 4.13 3.60
10 yr 4.82 4.41 4.23
Effective Rural Rate
6.24 6.05 5.94
Agricultural Debt ($b)
52.96 52.14 51.08
0.50
0.60
0.70
0.80
0.90
07 08 09 10 11 12 13 14 15
NZD
/USD
Forecast
NZD BUYS USD
Source: ANZ, Bloomberg
0
2
4
6
8
10
07 08 09 10 11 12 13 14 15
%
OCR 90-Day Bill 10-Year Effective Rural Rate
Forecast
OCR
KEY INTEREST RATES
Source: ANZ, RBNZ
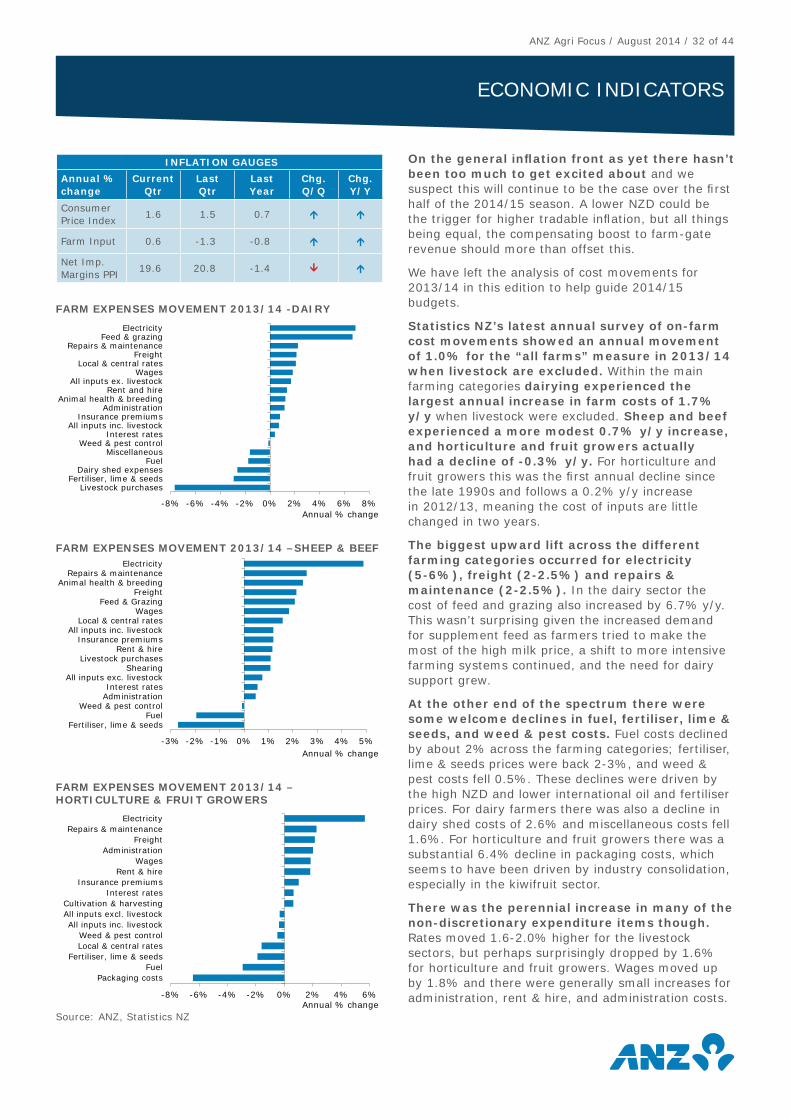
ANZ Agri Focus / August 2014 / 32 of 44
ECONOMIC INDICATORS
On the general infl ation front as yet there hasn’t been too much to get excited about and we suspect this will continue to be the case over the fi rst half of the 2014/15 season. A lower NZD could be the trigger for higher tradable infl ation, but all things being equal, the compensating boost to farm-gate revenue should more than offset this.
We have left the analysis of cost movements for 2013/14 in this edition to help guide 2014/15 budgets.
Statistics NZ’s latest annual survey of on-farm cost movements showed an annual movement of 1.0% for the “all farms” measure in 2013/14 when livestock are excluded. Within the main farming categories dairying experienced the largest annual increase in farm costs of 1.7% y/y when livestock were excluded. Sheep and beef experienced a more modest 0.7% y/y increase, and horticulture and fruit growers actually had a decline of -0.3% y/y. For horticulture and fruit growers this was the fi rst annual decline since the late 1990s and follows a 0.2% y/y increase in 2012/13, meaning the cost of inputs are little changed in two years.
The biggest upward lift across the different farming categories occurred for electricity (5-6%), freight (2-2.5%) and repairs & maintenance (2-2.5%). In the dairy sector the cost of feed and grazing also increased by 6.7% y/y. This wasn’t surprising given the increased demand for supplement feed as farmers tried to make the most of the high milk price, a shift to more intensive farming systems continued, and the need for dairy support grew.
At the other end of the spectrum there were some welcome declines in fuel, fertiliser, lime & seeds, and weed & pest costs. Fuel costs declined by about 2% across the farming categories; fertiliser, lime & seeds prices were back 2-3%, and weed & pest costs fell 0.5%. These declines were driven by the high NZD and lower international oil and fertiliser prices. For dairy farmers there was also a decline in dairy shed costs of 2.6% and miscellaneous costs fell 1.6%. For horticulture and fruit growers there was a substantial 6.4% decline in packaging costs, which seems to have been driven by industry consolidation, especially in the kiwifruit sector.
There was the perennial increase in many of the non-discretionary expenditure items though. Rates moved 1.6-2.0% higher for the livestock sectors, but perhaps surprisingly dropped by 1.6% for horticulture and fruit growers. Wages moved up by 1.8% and there were generally small increases for administration, rent & hire, and administration costs.
INFLATION GAUGES
Annual % change
Current Qtr
Last Qtr
Last Year
Chg. Q/Q
Chg. Y/Y
Consumer Price Index
1.6 1.5 0.7
Farm Input 0.6 -1.3 -0.8
Net Imp. Margins PPI
19.6 20.8 -1.4
-8% -6% -4% -2% 0% 2% 4% 6% 8%
Livestock purchasesFertiliser, lime & seeds
Dairy shed expensesFuel
MiscellaneousWeed & pest control
Interest ratesAll inputs inc. livestock
Insurance premiumsAdministration
Animal health & breedingRent and hire
All inputs ex. livestockWages
Local & central ratesFreight
Repairs & maintenanceFeed & grazing
Electricity
Annual % change
FARM EXPENSES MOVEMENT 2013/14 -DAIRY
-3% -2% -1% 0% 1% 2% 3% 4% 5%
Fertiliser, lime & seedsFuel
Weed & pest controlAdministrationInterest rates
All inputs exc. livestockShearing
Livestock purchasesRent & hire
Insurance premiumsAll inputs inc. livestock
Local & central ratesWages
Feed & GrazingFreight
Animal health & breedingRepairs & maintenance
Electricity
Annual % change
FARM EXPENSES MOVEMENT 2013/14 –SHEEP & BEEF
-8% -6% -4% -2% 0% 2% 4% 6%
Packaging costsFuel
Fertiliser, lime & seedsLocal & central ratesWeed & pest control
All inputs inc. livestockAll inputs excl. livestockCultivation & harvesting
Interest ratesInsurance premiums
Rent & hireWages
AdministrationFreight
Repairs & maintenanceElectricity
Annual % change
FARM EXPENSES MOVEMENT 2013/14 –HORTICULTURE & FRUIT GROWERS
Source: ANZ, Statistics NZ
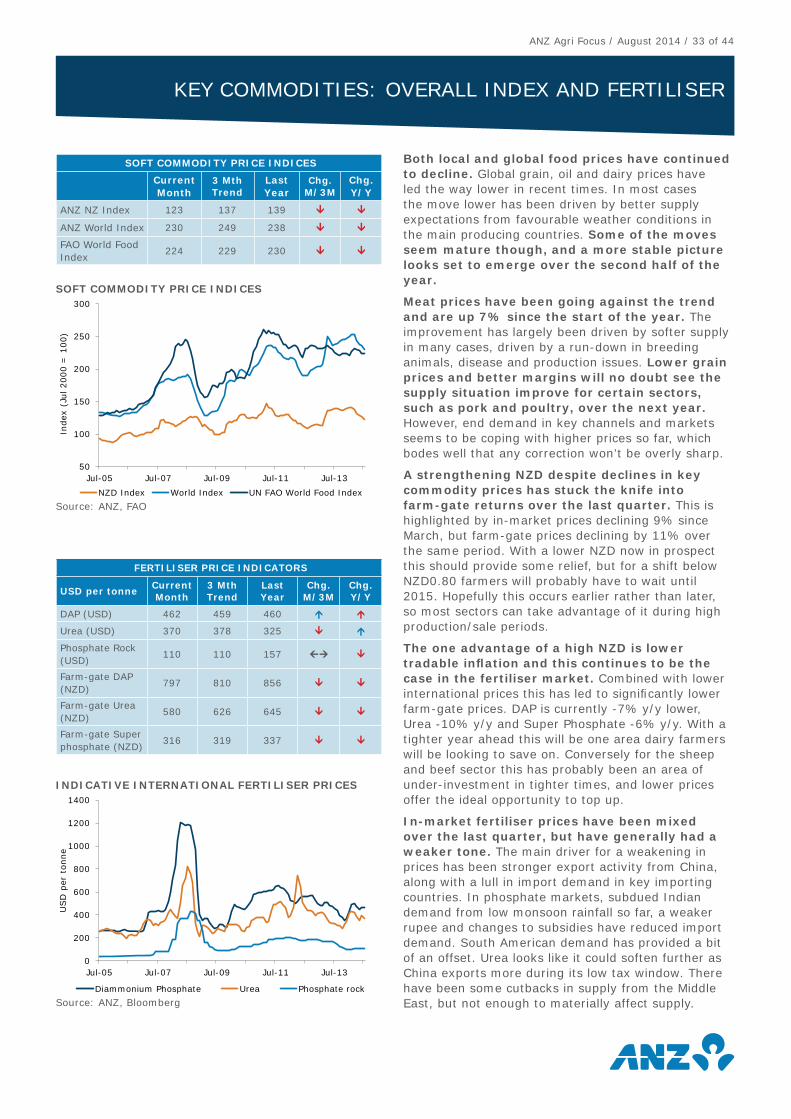
ANZ Agri Focus / August 2014 / 33 of 44
KEY COMMODITIES: OVERALL INDEX AND FERTILISER
Both local and global food prices have continued to decline. Global grain, oil and dairy prices have led the way lower in recent times. In most cases the move lower has been driven by better supply expectations from favourable weather conditions in the main producing countries. Some of the moves seem mature though, and a more stable picture looks set to emerge over the second half of the year.
Meat prices have been going against the trend and are up 7% since the start of the year. The improvement has largely been driven by softer supply in many cases, driven by a run-down in breeding animals, disease and production issues. Lower grain prices and better margins will no doubt see the supply situation improve for certain sectors, such as pork and poultry, over the next year. However, end demand in key channels and markets seems to be coping with higher prices so far, which bodes well that any correction won’t be overly sharp.
A strengthening NZD despite declines in key commodity prices has stuck the knife into farm-gate returns over the last quarter. This is highlighted by in-market prices declining 9% since March, but farm-gate prices declining by 11% over the same period. With a lower NZD now in prospect this should provide some relief, but for a shift below NZD0.80 farmers will probably have to wait until 2015. Hopefully this occurs earlier rather than later, so most sectors can take advantage of it during high production/sale periods.
The one advantage of a high NZD is lower tradable infl ation and this continues to be the case in the fertiliser market. Combined with lower international prices this has led to signifi cantly lower farm-gate prices. DAP is currently -7% y/y lower, Urea -10% y/y and Super Phosphate -6% y/y. With a tighter year ahead this will be one area dairy farmers will be looking to save on. Conversely for the sheep and beef sector this has probably been an area of under-investment in tighter times, and lower prices offer the ideal opportunity to top up.
In-market fertiliser prices have been mixed over the last quarter, but have generally had a weaker tone. The main driver for a weakening in prices has been stronger export activity from China, along with a lull in import demand in key importing countries. In phosphate markets, subdued Indian demand from low monsoon rainfall so far, a weaker rupee and changes to subsidies have reduced import demand. South American demand has provided a bit of an offset. Urea looks like it could soften further as China exports more during its low tax window. There have been some cutbacks in supply from the Middle East, but not enough to materially affect supply.
SOFT COMMODITY PRICE INDICES
Current Month
3 Mth Trend
Last Year
Chg. M/3M
Chg. Y/Y
ANZ NZ Index 123 137 139
ANZ World Index 230 249 238
FAO World Food Index
224 229 230
FERTILISER PRICE INDICATORS
USD per tonneCurrent Month
3 Mth Trend
Last Year
Chg. M/3M
Chg. Y/Y
DAP (USD) 462 459 460
Urea (USD) 370 378 325
Phosphate Rock (USD)
110 110 157
Farm-gate DAP (NZD)
797 810 856
Farm-gate Urea (NZD)
580 626 645
Farm-gate Super phosphate (NZD)
316 319 337
50
100
150
200
250
300
Jul-05 Jul-07 Jul-09 Jul-11 Jul-13
Index
(Ju
l 2000 =
100)
NZD Index World Index UN FAO World Food Index
SOFT COMMODITY PRICE INDICES
Source: ANZ, FAO
0
200
400
600
800
1000
1200
1400
Jul-05 Jul-07 Jul-09 Jul-11 Jul-13
USD
per
ton
ne
Diammonium Phosphate Urea Phosphate rock
INDICATIVE INTERNATIONAL FERTILISER PRICES
Source: ANZ, Bloomberg
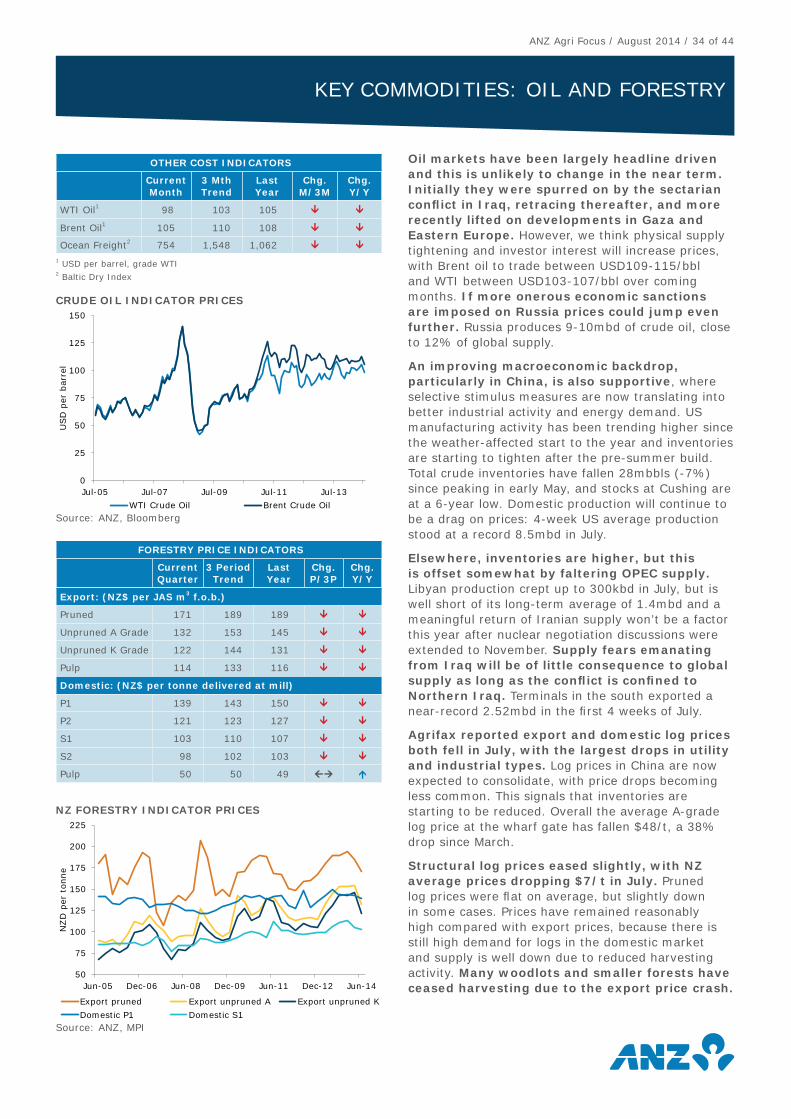
ANZ Agri Focus / August 2014 / 34 of 44
KEY COMMODITIES: OIL AND FORESTRY
Oil markets have been largely headline driven and this is unlikely to change in the near term. Initially they were spurred on by the sectarian confl ict in Iraq, retracing thereafter, and more recently lifted on developments in Gaza and Eastern Europe. However, we think physical supply tightening and investor interest will increase prices, with Brent oil to trade between USD109-115/bbl and WTI between USD103-107/bbl over coming months. If more onerous economic sanctions are imposed on Russia prices could jump even further. Russia produces 9-10mbd of crude oil, close to 12% of global supply.
An improving macroeconomic backdrop, particularly in China, is also supportive, where selective stimulus measures are now translating into better industrial activity and energy demand. US manufacturing activity has been trending higher since the weather-affected start to the year and inventories are starting to tighten after the pre-summer build. Total crude inventories have fallen 28mbbls (-7%) since peaking in early May, and stocks at Cushing are at a 6-year low. Domestic production will continue to be a drag on prices: 4-week US average production stood at a record 8.5mbd in July.
Elsewhere, inventories are higher, but this is offset somewhat by faltering OPEC supply. Libyan production crept up to 300kbd in July, but is well short of its long-term average of 1.4mbd and a meaningful return of Iranian supply won’t be a factor this year after nuclear negotiation discussions were extended to November. Supply fears emanating from Iraq will be of little consequence to global supply as long as the confl ict is confi ned to Northern Iraq. Terminals in the south exported a near-record 2.52mbd in the fi rst 4 weeks of July.
Agrifax reported export and domestic log prices both fell in July, with the largest drops in utility and industrial types. Log prices in China are now expected to consolidate, with price drops becoming less common. This signals that inventories are starting to be reduced. Overall the average A-grade log price at the wharf gate has fallen $48/t, a 38% drop since March.
Structural log prices eased slightly, with NZ average prices dropping $7/t in July. Pruned log prices were fl at on average, but slightly down in some cases. Prices have remained reasonably high compared with export prices, because there is still high demand for logs in the domestic market and supply is well down due to reduced harvesting activity. Many woodlots and smaller forests have ceased harvesting due to the export price crash.
OTHER COST INDICATORS
Current Month
3 Mth Trend
Last Year
Chg. M/3M
Chg. Y/Y
WTI Oil1 98 103 105
Brent Oil1 105 110 108
Ocean Freight2 754 1,548 1,062 1 USD per barrel, grade WTI2 Baltic Dry Index
FORESTRY PRICE INDICATORS
Current Quarter
3 Period Trend
Last Year
Chg. P/3P
Chg. Y/Y
Export: (NZ$ per JAS m3 f.o.b.)
Pruned 171 189 189
Unpruned A Grade 132 153 145
Unpruned K Grade 122 144 131
Pulp 114 133 116
Domestic: (NZ$ per tonne delivered at mill)
P1 139 143 150
P2 121 123 127
S1 103 110 107
S2 98 102 103
Pulp 50 50 49
0
25
50
75
100
125
150
Jul-05 Jul-07 Jul-09 Jul-11 Jul-13
USD
per
bar
rel
WTI Crude Oil Brent Crude Oil
CRUDE OIL INDICATOR PRICES
Source: ANZ, Bloomberg
50
75
100
125
150
175
200
225
Jun-05 Dec-06 Jun-08 Dec-09 Jun-11 Dec-12 Jun-14
NZD
per
ton
ne
Export pruned Export unpruned A Export unpruned K
Domestic P1 Domestic S1
NZ FORESTRY INDICATOR PRICES
Source: ANZ, MPI
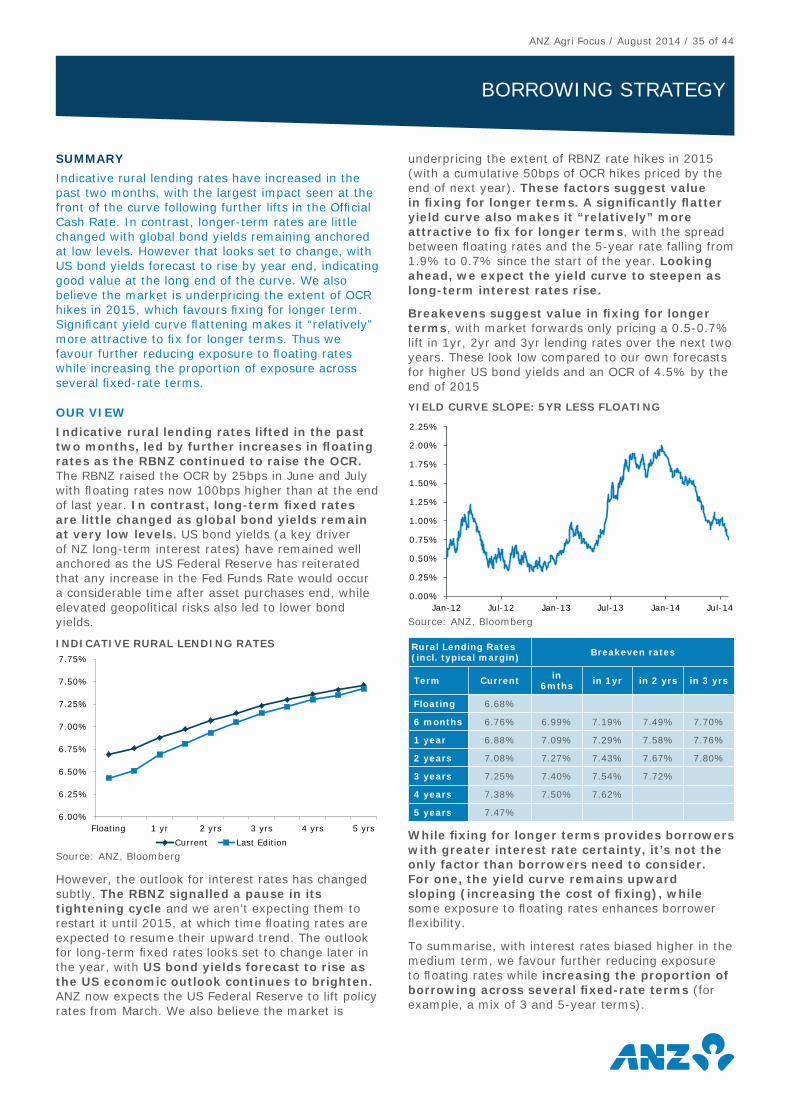
ANZ Agri Focus / August 2014 / 35 of 44
SUMMARY
Indicative rural lending rates have increased in the past two months, with the largest impact seen at the front of the curve following further lifts in the Offi cial Cash Rate. In contrast, longer-term rates are little changed with global bond yields remaining anchored at low levels. However that looks set to change, with US bond yields forecast to rise by year end, indicating good value at the long end of the curve. We also believe the market is underpricing the extent of OCR hikes in 2015, which favours fi xing for longer term. Signifi cant yield curve fl attening makes it “relatively” more attractive to fi x for longer terms. Thus we favour further reducing exposure to fl oating rates while increasing the proportion of exposure across several fi xed-rate terms.
OUR VIEW
Indicative rural lending rates lifted in the past two months, led by further increases in fl oating rates as the RBNZ continued to raise the OCR. The RBNZ raised the OCR by 25bps in June and July with fl oating rates now 100bps higher than at the end of last year. In contrast, long-term fi xed rates are little changed as global bond yields remain at very low levels. US bond yields (a key driver of NZ long-term interest rates) have remained well anchored as the US Federal Reserve has reiterated that any increase in the Fed Funds Rate would occur a considerable time after asset purchases end, while elevated geopolitical risks also led to lower bond yields.
However, the outlook for interest rates has changed subtly. The RBNZ signalled a pause in its tightening cycle and we aren’t expecting them to restart it until 2015, at which time fl oating rates are expected to resume their upward trend. The outlook for long-term fi xed rates looks set to change later in the year, with US bond yields forecast to rise as the US economic outlook continues to brighten. ANZ now expects the US Federal Reserve to lift policy rates from March. We also believe the market is
underpricing the extent of RBNZ rate hikes in 2015 (with a cumulative 50bps of OCR hikes priced by the end of next year). These factors suggest value in fi xing for longer terms. A signifi cantly fl atter yield curve also makes it “relatively” more attractive to fi x for longer terms, with the spread between fl oating rates and the 5-year rate falling from 1.9% to 0.7% since the start of the year. Looking ahead, we expect the yield curve to steepen as long-term interest rates rise.
Breakevens suggest value in fi xing for longer terms, with market forwards only pricing a 0.5-0.7% lift in 1yr, 2yr and 3yr lending rates over the next two years. These look low compared to our own forecasts for higher US bond yields and an OCR of 4.5% by the end of 2015
Rural Lending Rates (incl. typical margin) Breakeven rates
Term Current in 6mths in 1yr in 2 yrs in 3 yrs
Floating 6.68%
6 months 6.76% 6.99% 7.19% 7.49% 7.70%
1 year 6.88% 7.09% 7.29% 7.58% 7.76%
2 years 7.08% 7.27% 7.43% 7.67% 7.80%
3 years 7.25% 7.40% 7.54% 7.72%
4 years 7.38% 7.50% 7.62%
5 years 7.47%
While fi xing for longer terms provides borrowers with greater interest rate certainty, it’s not the only factor than borrowers need to consider. For one, the yield curve remains upward sloping (increasing the cost of fi xing), while some exposure to fl oating rates enhances borrower fl exibility.
To summarise, with interest rates biased higher in the medium term, we favour further reducing exposure to fl oating rates while increasing the proportion of borrowing across several fi xed-rate terms (for example, a mix of 3 and 5-year terms).
BORROWING STRATEGY
6.00%
6.25%
6.50%
6.75%
7.00%
7.25%
7.50%
7.75%
Floating 1 yr 2 yrs 3 yrs 4 yrs 5 yrs
Current Last Edition
INDICATIVE RURAL LENDING RATES
Source: ANZ, Bloomberg
0.00%
0.25%
0.50%
0.75%
1.00%
1.25%
1.50%
1.75%
2.00%
2.25%
Jan-12 Jul-12 Jan-13 Jul-13 Jan-14 Jul-14
YIELD CURVE SLOPE: 5YR LESS FLOATING
Source: ANZ, Bloomberg
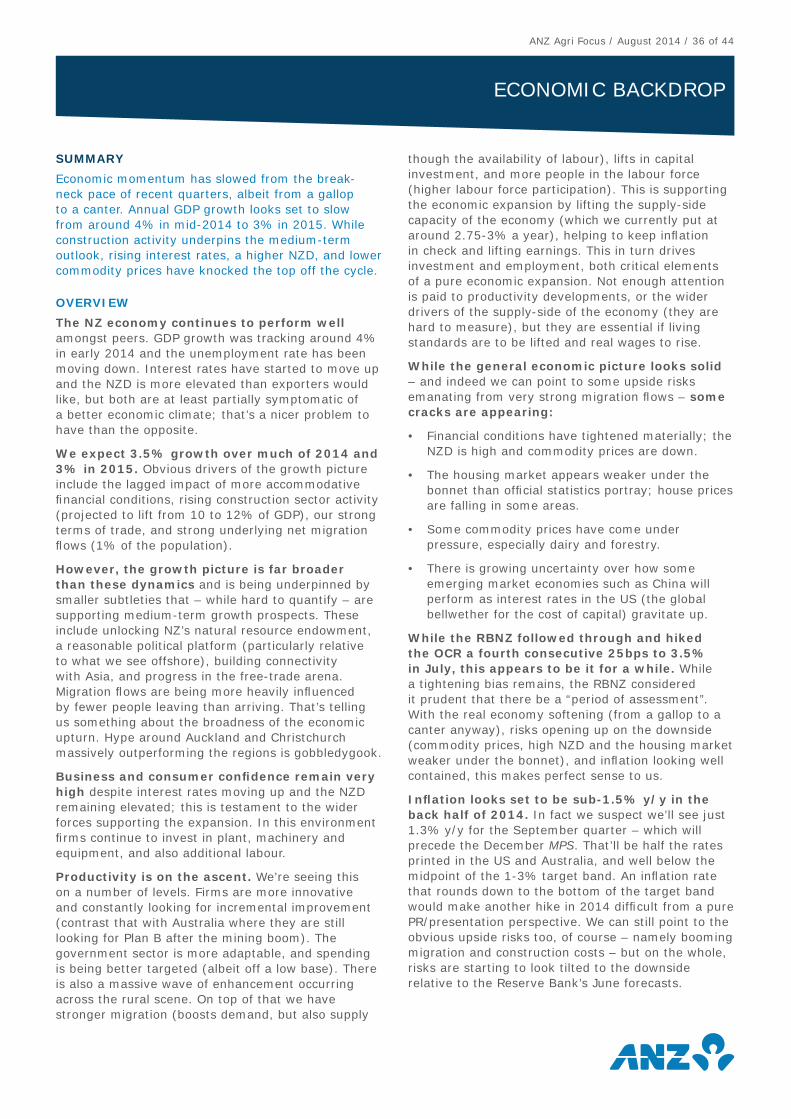
ANZ Agri Focus / August 2014 / 36 of 44
SUMMARY
Economic momentum has slowed from the break-neck pace of recent quarters, albeit from a gallop to a canter. Annual GDP growth looks set to slow from around 4% in mid-2014 to 3% in 2015. While construction activity underpins the medium-term outlook, rising interest rates, a higher NZD, and lower commodity prices have knocked the top off the cycle.
OVERVIEW
The NZ economy continues to perform well amongst peers. GDP growth was tracking around 4% in early 2014 and the unemployment rate has been moving down. Interest rates have started to move up and the NZD is more elevated than exporters would like, but both are at least partially symptomatic of a better economic climate; that’s a nicer problem to have than the opposite.
We expect 3.5% growth over much of 2014 and 3% in 2015. Obvious drivers of the growth picture include the lagged impact of more accommodative fi nancial conditions, rising construction sector activity (projected to lift from 10 to 12% of GDP), our strong terms of trade, and strong underlying net migration fl ows (1% of the population).
However, the growth picture is far broader than these dynamics and is being underpinned by smaller subtleties that – while hard to quantify – are supporting medium-term growth prospects. These include unlocking NZ’s natural resource endowment, a reasonable political platform (particularly relative to what we see offshore), building connectivity with Asia, and progress in the free-trade arena. Migration fl ows are being more heavily infl uenced by fewer people leaving than arriving. That’s telling us something about the broadness of the economic upturn. Hype around Auckland and Christchurch massively outperforming the regions is gobbledygook.
Business and consumer confi dence remain very high despite interest rates moving up and the NZD remaining elevated; this is testament to the wider forces supporting the expansion. In this environment fi rms continue to invest in plant, machinery and equipment, and also additional labour.
Productivity is on the ascent. We’re seeing this on a number of levels. Firms are more innovative and constantly looking for incremental improvement (contrast that with Australia where they are still looking for Plan B after the mining boom). The government sector is more adaptable, and spending is being better targeted (albeit off a low base). There is also a massive wave of enhancement occurring across the rural scene. On top of that we have stronger migration (boosts demand, but also supply
though the availability of labour), lifts in capital investment, and more people in the labour force (higher labour force participation). This is supporting the economic expansion by lifting the supply-side capacity of the economy (which we currently put at around 2.75-3% a year), helping to keep infl ation in check and lifting earnings. This in turn drives investment and employment, both critical elements of a pure economic expansion. Not enough attention is paid to productivity developments, or the wider drivers of the supply-side of the economy (they are hard to measure), but they are essential if living standards are to be lifted and real wages to rise.
While the general economic picture looks solid – and indeed we can point to some upside risks emanating from very strong migration fl ows – some cracks are appearing:
• Financial conditions have tightened materially; the NZD is high and commodity prices are down.
• The housing market appears weaker under the bonnet than offi cial statistics portray; house prices are falling in some areas.
• Some commodity prices have come under pressure, especially dairy and forestry.
• There is growing uncertainty over how some emerging market economies such as China will perform as interest rates in the US (the global bellwether for the cost of capital) gravitate up.
While the RBNZ followed through and hiked the OCR a fourth consecutive 25bps to 3.5% in July, this appears to be it for a while. While a tightening bias remains, the RBNZ considered it prudent that there be a “period of assessment”. With the real economy softening (from a gallop to a canter anyway), risks opening up on the downside (commodity prices, high NZD and the housing market weaker under the bonnet), and infl ation looking well contained, this makes perfect sense to us.
Infl ation looks set to be sub-1.5% y/y in the back half of 2014. In fact we suspect we’ll see just 1.3% y/y for the September quarter – which will precede the December MPS. That’ll be half the rates printed in the US and Australia, and well below the midpoint of the 1-3% target band. An infl ation rate that rounds down to the bottom of the target band would make another hike in 2014 diffi cult from a pure PR/presentation perspective. We can still point to the obvious upside risks too, of course – namely booming migration and construction costs – but on the whole, risks are starting to look tilted to the downside relative to the Reserve Bank’s June forecasts.
ECONOMIC BACKDROP
ANZ Agri Focus / August 2014 / 37 of 44
SUMMARY
Bull Rush – our feature article last edition, highlighted broader opportunities across Asia. India ranked down our list as a longer-term opportunity compared with many other Asian markets. People naturally ask why.
Two key impediments that need to be overcome are limited market access, and an underdeveloped cool chain. At present tariffs range from 25-75% on food products, many livestock products are prohibited, and there are a number of non-tariff barriers to navigate. The cool chain is still fragmented and linked to a largely informal retail network. Combined with limited experience in handling perishable, or temperature-sensitive products, this limits the potential for many New Zealand food products.
Indians also have strong food preferences, which limits opportunities for some products (i.e. beef), but creates them for others (i.e. dairy, or fruit & vegetables). Furthermore while consumers may be familiar with foreign foods in an “eating out” setting, many do not know how to prepare foreign foods at home, which still accounts for the majority of food expenditure.
Some of these dynamics are changing, but it is off a low base. Modern retail formats and other channels to market are growing. Foreign investment rules have changed, which is expected to speed up the development of the organised retail sector and cool chain. Lifestyle changes, such as more women working, dietary changes, urbanisation, rising income and glocalisation (where foreign food is adapted to suit Indian food preferences) are changing food preferences in the young and wealthier urban dwellers.
Anything in the Free Trade Agreement arena could literally be game-changing, and there have been some recent positive indications from the new government.
Collectively, India has some desirable properties as an export market. However, as with any market you need to understand the broader nuances, and take analysis beyond size and scale in terms of determining attractiveness.
INTRODUCTION
In our previous edition of the Agri Focus: Bull rush we profi led alternative Asian markets in the feature article. In essence we assessed the attractiveness of the opportunities across the wider Asian region using a range of indicators (29 in total) including proxies for food market size and development, consumer purchasing power and affl uence, alignment with NZ-orientated trade,
market access, and infrastructure. We intentionally used a wide variety of indicators, as such variety and depth is critical to understanding the opportunities and risks in specifi c markets.
Our motivation was three-fold.
• Asia is far broader than China alone – the population across the region, for instance, is 185% larger than China.
• We see some risks in being over-exposed to the Chinese market, with just about every major New Zealand primary sector having experienced a signifi cant lift in earnings exposure over the last 2 years.
• Reality check; NZ is a unique / boutique producer with limited scale – we need to drive the ability to splash and dash in high-value markets.
The top 5 (of 28) ranked countries were Singapore, Hong Kong, Japan, Korea and China. Not surprisingly, these are already well-established export markets for many sectors. The up-and-comers threw up a mix of a few less well-known nations and some more familiar names. They included Malaysia, Brunei Darussalam, Kazakhstan, Azerbaijan, Thailand, Armenia, Indonesia and Vietnam.
India ranked down the list and we placed it in the category of longer-term propositions. India is often talked about as the ‘Sleeping Giant’. With 1.26 billion people it is the second-most populous country in the world, the third-largest global economy in terms of purchasing power parity (5.8% of world GDP), and the 10th largest in terms of nominal GDP (2.5% of nominal world GDP in USD terms). The attraction seems obvious.
India has very favourable demographics to boot, with one of the youngest populations: in 2013 about 28% of the Indian population was aged under 15 and two-thirds under 35. This means India’s working age population and associated income generation is set to rise until at least 2030. So the question is – why did India rank only as a longer-term proposition for primary exports compared with other opportunities in Asia? Running through each of the main categories we analysed shows why.
FOOD MARKET SIZE AND DEVELOPMENT
With a large population there is no doubt that India has a very large food market. Overall, it ranked third for the estimated size of its food market – behind China and Japan. But in terms of indicators that measured growth in the food
EDUCATION CORNER: INDIA IN FOCUS
ANZ Agri Focus / August 2014 / 38 of 44
market and stage of development it only ranked middle of the pack.
According to the USDA’s report on the Indian food retail sector1 it is dominated by thousands of small “kirana” stores and government-run food distribution outlets supplying essential commodities. During the mid-1990s, there were an estimated 200 modern grocery stores operating in India. A few cities also had co-operative stores that were owned by consumer societies. The emergence of larger chains and stores only began around 2005 and the sector has since grown to over 3,000 modern retail outlets.
This is still a very small organised retail footprint for the overall size of the food market when compared to China and many other Asian markets. This limits the opportunities for New Zealand’s product mix, which tends to be more suited to foodservice and/or organised retail channel formats due to its perishable nature and traditional product confi guration. While many retailers are expanding and opening new stores, profi tability continues to be an issue for many, as factors such as high real estate costs, high capital borrowing costs, shrinkage, high debt levels, training of qualifi ed staff, and a costly supply chain add signifi cantly to operating costs.
The USDA report noted several other channels to market that are worthy of mention. These were the growth in India’s high-end hotel/restaurant sector and the launch of several internet grocery retailers over the past few years, including one specifi cally dedicated to imported foods. Both channels offer alternative avenues to wealthier consumers.
Traditional kirana stores can be unpleasant due to the lack of parking, air conditioning and occasionally less-than-hygienic conditions outside the stores. As a result, many wealthier consumers are accustomed to having their groceries delivered from their local kirana store, or having their household help do the shopping. The ability to order online could enable modern retailers and foreign foods to better compete with the services that kirana stores have provided.
Traditionally, Indians have tended to eat at home, with those who eat out usually heading for inexpensive street stalls and informal eateries. Eating out at a restaurant is usually reserved for special occasions. It is estimated that Indians spend 11% of their food expenditure outside the home in restaurants, cafeterias and other food establishments. This ranked near the bottom of the countries we analysed for which we had data.
One area of potential growth is India’s hotel and restaurant sector, which continues to expand and modernise as the number of domestic, foreign, and business travellers increases. While traditional lower-quality hotels/restaurants still dominate the market, the upper end is beginning to grow. This offers another potential avenue to wealthier consumers who will be in a setting where they are willing to try new foods and cuisines.
CONSUMER PURCHASING POWER AND AFFLUENCE
Incomes in India have been rising steadily over the last seven years, with average GDP/capita growth of 6% y/y. However, this only ranked India in 20th place in the growth stakes. It was also off a low base, with GDP/capita in real terms just US$1,584 per person (ranking 21st across the countries we ranked). There are many countries in Asia that have grown individual purchasing power at a faster clip than India in recent times, and have higher incomes to boot.
Conversely, India is a big place and income distribution is uneven between a wealthy urban population (that makes up approximately a third of the population), and a low-income rural population, which makes up the remainder. While measures of income inequality place India about middle of the pack, almost a third of the population is still living on less than US$1.25 per day. The income split essentially means that India has two separate consumer segments, which are further split by strong regional differences.
Throughout India there are 20 offi cial languages, 3 main religions and 14 main cuisine styles. As the USDA report notes an estimated 20-30% of the Indian population is strictly vegetarian due to the beliefs associated with Hinduism. The Hindus who eat meat tend to do so sparingly and beef consumption is taboo among Hindus, Jains, and Sikhs who comprise over 80% of the population. Furthermore, non-vegetarian food is not consumed during special days, or religious observances. India’s large Muslim population (estimated at 160 million) does not consume pork and only eats Halal products.
Food preferences also change dramatically from region to region due to a very parochial sense of pride in the many regional and varied foods that comprise Indian cuisine. In general, Indians have a strong preference for fresh products, traditional spices and ingredients, which has generally slowed the penetration of foreign foods.
EDUCATION CORNER: INDIA IN FOCUS
1 USDA GAIN Report on India Retail Foods 2013.
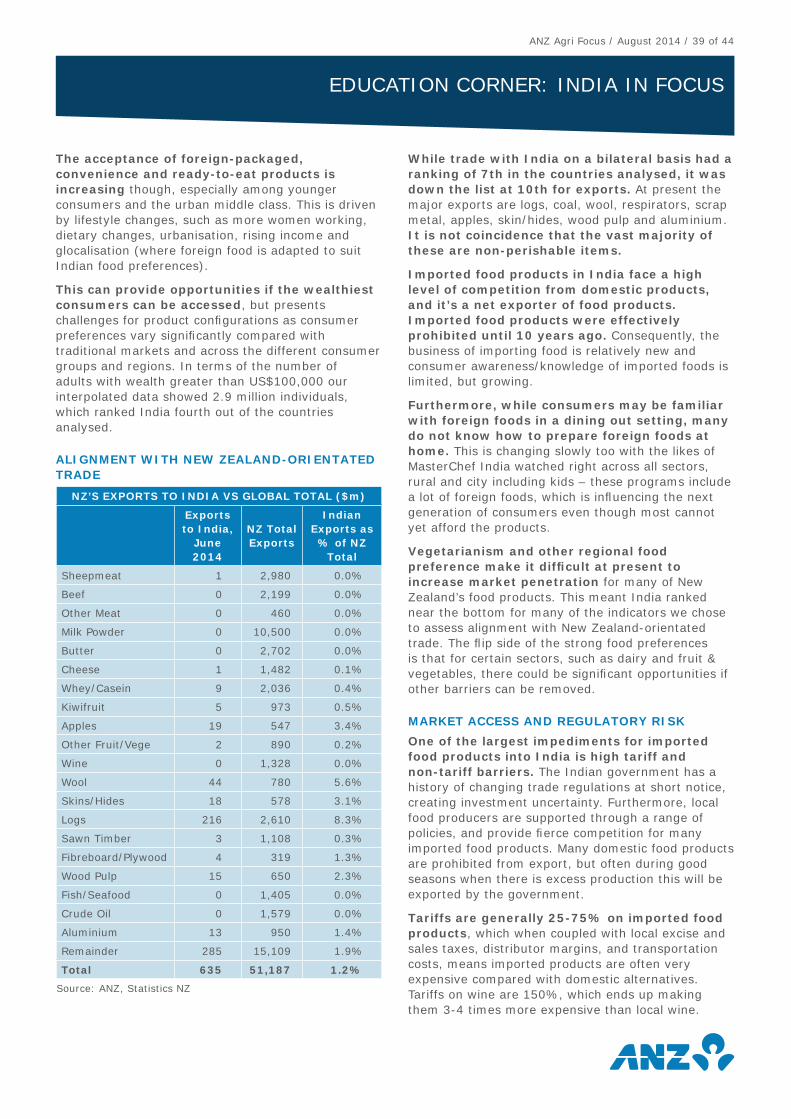
ANZ Agri Focus / August 2014 / 39 of 44
The acceptance of foreign-packaged, convenience and ready-to-eat products is increasing though, especially among younger consumers and the urban middle class. This is driven by lifestyle changes, such as more women working, dietary changes, urbanisation, rising income and glocalisation (where foreign food is adapted to suit Indian food preferences).
This can provide opportunities if the wealthiest consumers can be accessed, but presents challenges for product confi gurations as consumer preferences vary signifi cantly compared with traditional markets and across the different consumer groups and regions. In terms of the number of adults with wealth greater than US$100,000 our interpolated data showed 2.9 million individuals, which ranked India fourth out of the countries analysed.
ALIGNMENT WITH NEW ZEALAND-ORIENTATED TRADE
NZ’S EXPORTS TO INDIA VS GLOBAL TOTAL ($m)
Exports to India,
June 2014
NZ Total Exports
Indian Exports as % of NZ
Total
Sheepmeat 1 2,980 0.0%
Beef 0 2,199 0.0%
Other Meat 0 460 0.0%
Milk Powder 0 10,500 0.0%
Butter 0 2,702 0.0%
Cheese 1 1,482 0.1%
Whey/Casein 9 2,036 0.4%
Kiwifruit 5 973 0.5%
Apples 19 547 3.4%
Other Fruit/Vege 2 890 0.2%
Wine 0 1,328 0.0%
Wool 44 780 5.6%
Skins/Hides 18 578 3.1%
Logs 216 2,610 8.3%
Sawn Timber 3 1,108 0.3%
Fibreboard/Plywood 4 319 1.3%
Wood Pulp 15 650 2.3%
Fish/Seafood 0 1,405 0.0%
Crude Oil 0 1,579 0.0%
Aluminium 13 950 1.4%
Remainder 285 15,109 1.9%
Total 635 51,187 1.2%
Source: ANZ, Statistics NZ
While trade with India on a bilateral basis had a ranking of 7th in the countries analysed, it was down the list at 10th for exports. At present the major exports are logs, coal, wool, respirators, scrap metal, apples, skin/hides, wood pulp and aluminium. It is not coincidence that the vast majority of these are non-perishable items.
Imported food products in India face a high level of competition from domestic products, and it’s a net exporter of food products. Imported food products were effectively prohibited until 10 years ago. Consequently, the business of importing food is relatively new and consumer awareness/knowledge of imported foods is limited, but growing.
Furthermore, while consumers may be familiar with foreign foods in a dining out setting, many do not know how to prepare foreign foods at home. This is changing slowly too with the likes of MasterChef India watched right across all sectors, rural and city including kids – these programs include a lot of foreign foods, which is infl uencing the next generation of consumers even though most cannot yet afford the products.
Vegetarianism and other regional food preference make it diffi cult at present to increase market penetration for many of New Zealand’s food products. This meant India ranked near the bottom for many of the indicators we chose to assess alignment with New Zealand-orientated trade. The fl ip side of the strong food preferences is that for certain sectors, such as dairy and fruit & vegetables, there could be signifi cant opportunities if other barriers can be removed.
MARKET ACCESS AND REGULATORY RISK
One of the largest impediments for imported food products into India is high tariff and non-tariff barriers. The Indian government has a history of changing trade regulations at short notice, creating investment uncertainty. Furthermore, local food producers are supported through a range of policies, and provide fi erce competition for many imported food products. Many domestic food products are prohibited from export, but often during good seasons when there is excess production this will be exported by the government.
Tariffs are generally 25-75% on imported food products, which when coupled with local excise and sales taxes, distributor margins, and transportation costs, means imported products are often very expensive compared with domestic alternatives. Tariffs on wine are 150%, which ends up making them 3-4 times more expensive than local wine.
EDUCATION CORNER: INDIA IN FOCUS
ANZ Agri Focus / August 2014 / 40 of 44
In the non-tariff space there are strict food laws that cover a range of things such as the use of additives, labelling requirements, packaging, weights and measurements, and shelf life. Combined with the complex tariff system these can create a mine fi eld for importers.
On an individual sector basis, imports of many animal and livestock-derived food products (including dairy) are effectively banned. Small quantities of certain products such as lamb seem to be making their way through, but most of the rules are prohibitive. This counts out a number of New Zealand products. Importation of beef is banned for religious reasons. Imports of alcoholic beverages (wine) are further constrained by a complex licensing system for distribution and sales.
These dynamics meant India ranked third-to-last in the countries we analysed for market access. This is one of the major impediments that need to be removed to make it more attractive.
A Free-Trade-Agreement with India could be a game changer to eliminate these trade barriers. Negotiations started in 2009, but lost momentum after several rounds when the previous government backtracked on broader reforms to open up retail and supply chain competition in India. More recently there has been a change of government with a landslide victory for the Bharatiya Janata Party in May. Recent comments from NZ’s Trade Minister Tim Groser suggest there are cautious signs from the new administration that stalled negotiations could come back onto the agenda, but clarity isn’t expected any time soon.
SUPPLY AND COOL CHAIN DEVELOPMENT/ INFRASTRUCTURE
India ranked 9th on the indicators we used to assess the effectiveness of the supply chain. The burden of customs procedures was middle of the pack, but on overall port infrastructure and logistics its ranking was higher.
However, at present the cool chain in India is long and fragmented. As an example, 30 to 40% of fruit and vegetable production is estimated to be wasted each year. This equates to approximately enough product to feed a country with a population similar to Brazil. Many of New Zealand’s primary products require a robust cool chain to ensure high standards of food safety and adequate shelf life when they arrive in market. Presently there are large limitations on skilled expertise in the handling of perishable and temperature-sensitive products. This is due to under-investment and the
fact that domestic fresh food dominates consumption. Refrigerated warehousing and transportation facilities are limited and costly, but are reportedly starting to improve. In some cases, high electricity costs and/or erratic power supplies have constrained cold chain development.
This could change, but again will take time. Infrastructure projects were previously reserved for the public sector, with many states trying to protect traditional “kirana” stores, and in doing so, buying votes. Private investors are now being encouraged to participate in developing roads, warehouses and transportation links. A recent decision to allow foreign investment into the retail sector could also speed up the development of an organised retail sector and cool chain.
SUMMARY
In short, there is a world of opportunity in Asia, which means only the best opportunities need to be cherry-picked to act on. India ranks down the list as a longer-term proposition for many of New Zealand’s main primary sectors because of specifi c food preferences, limited market access, and underdeveloped retail and cool chains.
India still represents a sound opportunity. We note some of the challenges are gradually receding, though progress is slow and off a low base compared with many other markets. That said, any progress in the Free Trade Agreement arena could literally be game-changing.
As with any market you need to understand the broader nuances, and take analysis beyond size and scale into account when determining market attractiveness.
EDUCATION CORNER: INDIA IN FOCUS
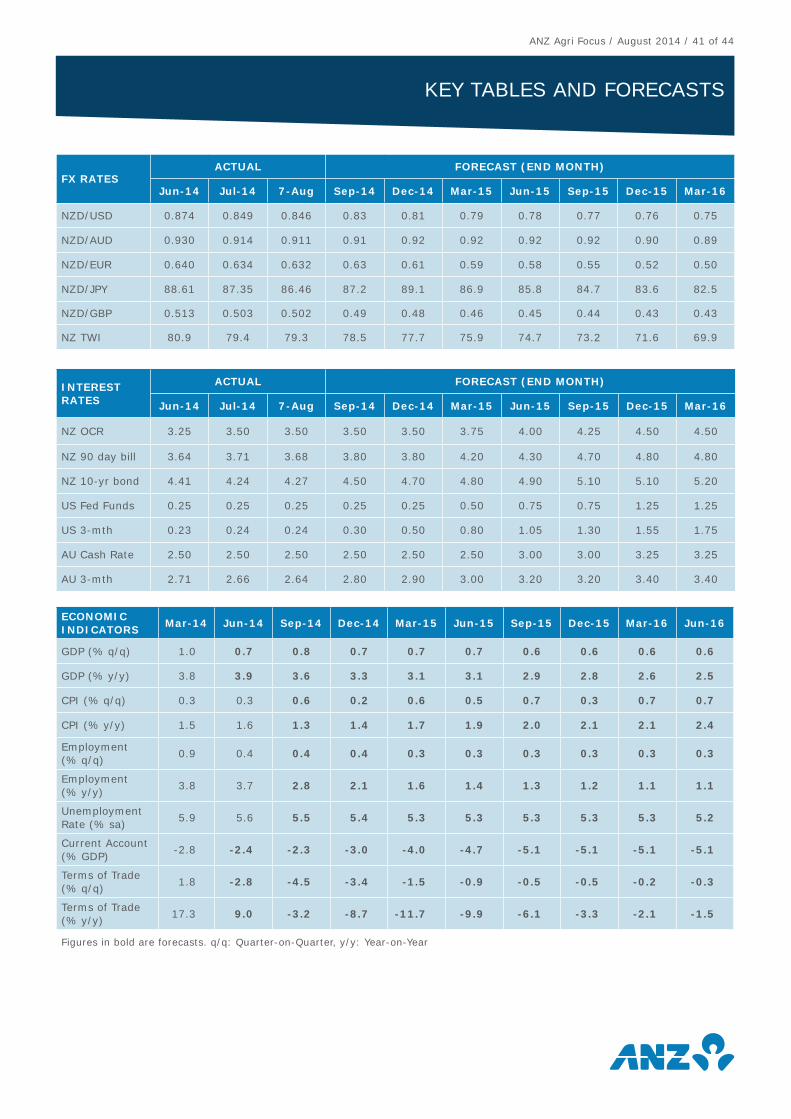
ANZ Agri Focus / August 2014 / 41 of 44
KEY TABLES AND FORECASTS
FX RATESACTUAL FORECAST (END MONTH)
Jun-14 Jul-14 7-Aug Sep-14 Dec-14 Mar-15 Jun-15 Sep-15 Dec-15 Mar-16
NZD/USD 0.874 0.849 0.846 0.83 0.81 0.79 0.78 0.77 0.76 0.75
NZD/AUD 0.930 0.914 0.911 0.91 0.92 0.92 0.92 0.92 0.90 0.89
NZD/EUR 0.640 0.634 0.632 0.63 0.61 0.59 0.58 0.55 0.52 0.50
NZD/JPY 88.61 87.35 86.46 87.2 89.1 86.9 85.8 84.7 83.6 82.5
NZD/GBP 0.513 0.503 0.502 0.49 0.48 0.46 0.45 0.44 0.43 0.43
NZ TWI 80.9 79.4 79.3 78.5 77.7 75.9 74.7 73.2 71.6 69.9
INTEREST RATES
ACTUAL FORECAST (END MONTH)
Jun-14 Jul-14 7-Aug Sep-14 Dec-14 Mar-15 Jun-15 Sep-15 Dec-15 Mar-16
NZ OCR 3.25 3.50 3.50 3.50 3.50 3.75 4.00 4.25 4.50 4.50
NZ 90 day bill 3.64 3.71 3.68 3.80 3.80 4.20 4.30 4.70 4.80 4.80
NZ 10-yr bond 4.41 4.24 4.27 4.50 4.70 4.80 4.90 5.10 5.10 5.20
US Fed Funds 0.25 0.25 0.25 0.25 0.25 0.50 0.75 0.75 1.25 1.25
US 3-mth 0.23 0.24 0.24 0.30 0.50 0.80 1.05 1.30 1.55 1.75
AU Cash Rate 2.50 2.50 2.50 2.50 2.50 2.50 3.00 3.00 3.25 3.25
AU 3-mth 2.71 2.66 2.64 2.80 2.90 3.00 3.20 3.20 3.40 3.40
ECONOMIC INDICATORS
Mar-14 Jun-14 Sep-14 Dec-14 Mar-15 Jun-15 Sep-15 Dec-15 Mar-16 Jun-16
GDP (% q/q) 1.0 0.7 0.8 0.7 0.7 0.7 0.6 0.6 0.6 0.6
GDP (% y/y) 3.8 3.9 3.6 3.3 3.1 3.1 2.9 2.8 2.6 2.5
CPI (% q/q) 0.3 0.3 0.6 0.2 0.6 0.5 0.7 0.3 0.7 0.7
CPI (% y/y) 1.5 1.6 1.3 1.4 1.7 1.9 2.0 2.1 2.1 2.4
Employment (% q/q)
0.9 0.4 0.4 0.4 0.3 0.3 0.3 0.3 0.3 0.3
Employment (% y/y)
3.8 3.7 2.8 2.1 1.6 1.4 1.3 1.2 1.1 1.1
Unemployment Rate (% sa)
5.9 5.6 5.5 5.4 5.3 5.3 5.3 5.3 5.3 5.2
Current Account (% GDP)
-2.8 -2.4 -2.3 -3.0 -4.0 -4.7 -5.1 -5.1 -5.1 -5.1
Terms of Trade (% q/q)
1.8 -2.8 -4.5 -3.4 -1.5 -0.9 -0.5 -0.5 -0.2 -0.3
Terms of Trade (% y/y)
17.3 9.0 -3.2 -8.7 -11.7 -9.9 -6.1 -3.3 -2.1 -1.5
Figures in bold are forecasts. q/q: Quarter-on-Quarter, y/y: Year-on-Year
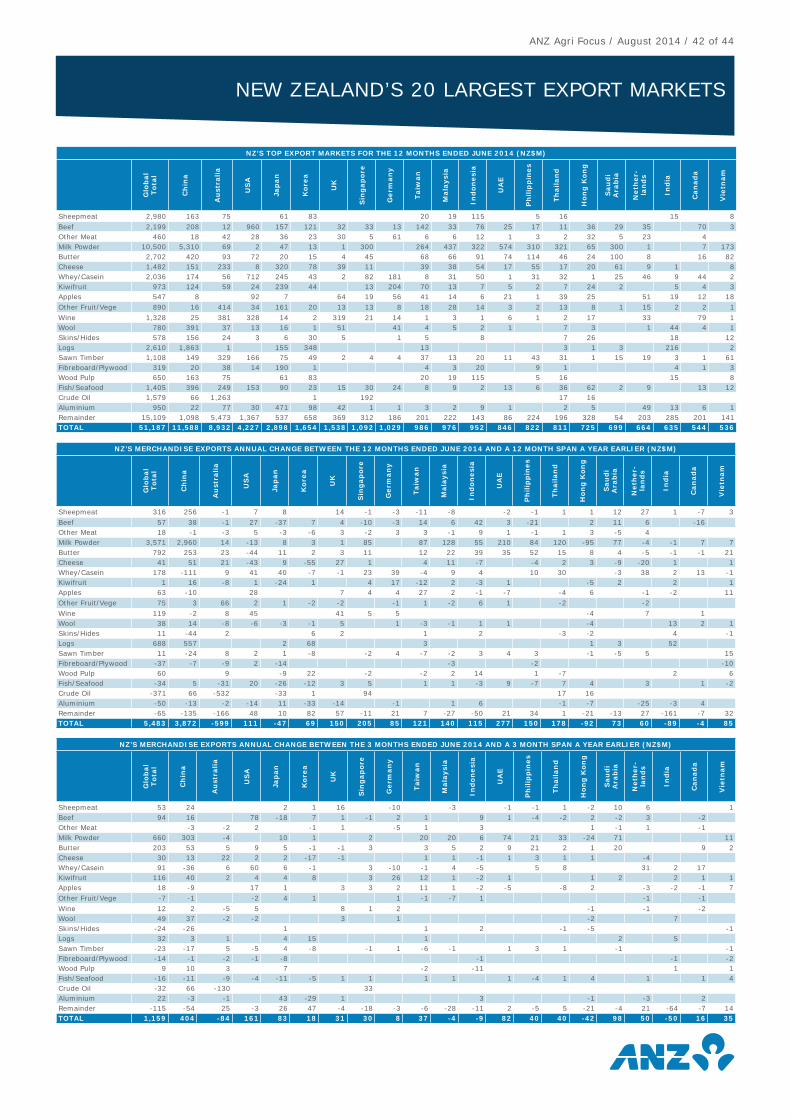
ANZ Agri Focus / August 2014 / 42 of 44
NZ’S TOP EXPORT MARKETS FOR THE 12 MONTHS ENDED JUNE 2014 (NZ$M)G
lob
al
Tota
l
Ch
ina
Au
stra
lia
US
A
Jap
an
Kore
a
UK
Sin
gap
ore
Germ
an
y
Taiw
an
Mala
ysi
a
Ind
on
esi
a
UA
E
Ph
ilip
pin
es
Th
ailan
d
Hon
g K
on
g
Sau
di
Ara
bia
Neth
er-
lan
ds
Ind
ia
Can
ad
a
Vie
tnam
Sheepmeat 2,980 163 75 61 83 20 19 115 5 16 15 8Beef 2,199 208 12 960 157 121 32 33 13 142 33 76 25 17 11 36 29 35 70 3Other Meat 460 18 42 28 36 23 30 5 61 6 6 12 1 3 2 32 5 23 4Milk Powder 10,500 5,310 69 2 47 13 1 300 264 437 322 574 310 321 65 300 1 7 173Butter 2,702 420 93 72 20 15 4 45 68 66 91 74 114 46 24 100 8 16 82Cheese 1,482 151 233 8 320 78 39 11 39 38 54 17 55 17 20 61 9 1 8Whey/Casein 2,036 174 56 712 245 43 2 82 181 8 31 50 1 31 32 1 25 46 9 44 2Kiwifruit 973 124 59 24 239 44 13 204 70 13 7 5 2 7 24 2 5 4 3Apples 547 8 92 7 64 19 56 41 14 6 21 1 39 25 51 19 12 18Other Fruit/Vege 890 16 414 34 161 20 13 13 8 18 28 14 3 2 13 8 1 15 2 2 1Wine 1,328 25 381 328 14 2 319 21 14 1 3 1 6 1 2 17 33 79 1Wool 780 391 37 13 16 1 51 41 4 5 2 1 7 3 1 44 4 1Skins/Hides 578 156 24 3 6 30 5 1 5 8 7 26 18 12Logs 2,610 1,863 1 155 348 13 3 1 3 216 2Sawn Timber 1,108 149 329 166 75 49 2 4 4 37 13 20 11 43 31 1 15 19 3 1 61Fibreboard/Plywood 319 20 38 14 190 1 4 3 20 9 1 4 1 3Wood Pulp 650 163 75 61 83 20 19 115 5 16 15 8Fish/Seafood 1,405 396 249 153 90 23 15 30 24 8 9 2 13 6 36 62 2 9 13 12Crude Oil 1,579 66 1,263 1 192 17 16Aluminium 950 22 77 30 471 98 42 1 1 3 2 9 1 2 5 49 13 6 1Remainder 15,109 1,098 5,473 1,367 537 658 369 312 186 201 222 143 86 224 196 328 54 203 285 201 141TOTAL 51,187 11,588 8,932 4,227 2,898 1,654 1,538 1,092 1,029 986 976 952 846 822 811 725 699 664 635 544 536
NZ’S MERCHANDISE EXPORTS ANNUAL CHANGE BETWEEN THE 12 MONTHS ENDED JUNE 2014 AND A 12 MONTH SPAN A YEAR EARLIER (NZ$M)
Glo
bal
Tota
l
Ch
ina
Au
stra
lia
US
A
Jap
an
Kore
a
UK
Sin
gap
ore
Germ
an
y
Taiw
an
Mala
ysi
a
Ind
on
esi
a
UA
E
Ph
ilip
pin
es
Th
ailan
d
Hon
g K
on
g
Sau
di
Ara
bia
Neth
er-
lan
ds
Ind
ia
Can
ad
a
Vie
tnam
Sheepmeat 316 256 -1 7 8 14 -1 -3 -11 -8 -2 -1 1 1 12 27 1 -7 3Beef 57 38 -1 27 -37 7 4 -10 -3 14 6 42 3 -21 2 11 6 -16Other Meat 18 -1 -3 5 -3 -6 3 -2 3 3 -1 9 1 -1 1 3 -5 4Milk Powder 3,571 2,960 14 -13 8 3 1 85 87 128 55 210 84 120 -95 77 -4 -1 7 7Butter 792 253 23 -44 11 2 3 11 12 22 39 35 52 15 8 4 -5 -1 -1 21Cheese 41 51 21 -43 9 -55 27 1 4 11 -7 -4 2 3 -9 -20 1 1Whey/Casein 178 -111 9 41 40 -7 -1 23 39 -4 9 4 10 30 -3 38 2 13 -1Kiwifruit 1 16 -8 1 -24 1 4 17 -12 2 -3 1 -5 2 2 1Apples 63 -10 28 7 4 4 27 2 -1 -7 -4 6 -1 -2 11Other Fruit/Vege 75 3 66 2 1 -2 -2 -1 1 -2 6 1 -2 -2Wine 119 -2 8 45 41 5 5 -4 7 1Wool 38 14 -8 -6 -3 -1 5 1 -3 -1 1 1 -4 13 2 1Skins/Hides 11 -44 2 6 2 1 2 -3 -2 4 -1Logs 688 557 2 68 3 1 3 52Sawn Timber 11 -24 8 2 1 -8 -2 4 -7 -2 3 4 3 -1 -5 5 15Fibreboard/Plywood -37 -7 -9 2 -14 -3 -2 -10Wood Pulp 60 9 -9 22 -2 -2 2 14 1 -7 2 6Fish/Seafood -34 5 -31 20 -26 -12 3 5 1 1 -3 9 -7 7 4 3 1 -2Crude Oil -371 66 -532 -33 1 94 17 16Aluminium -50 -13 -2 -14 11 -33 -14 -1 1 6 -1 -7 -25 -3 4Remainder -65 -135 -166 48 10 82 57 -11 21 7 -27 -50 21 34 1 -21 -13 27 -161 -7 32TOTAL 5,483 3,872 -599 111 -47 69 150 205 85 121 140 115 277 150 178 -92 73 60 -89 -4 85
NZ’S MERCHANDISE EXPORTS ANNUAL CHANGE BETWEEN THE 3 MONTHS ENDED JUNE 2014 AND A 3 MONTH SPAN A YEAR EARLIER (NZ$M)
Glo
bal
Tota
l
Ch
ina
Au
stra
lia
US
A
Jap
an
Kore
a
UK
Sin
gap
ore
Germ
an
y
Taiw
an
Mala
ysi
a
Ind
on
esi
a
UA
E
Ph
ilip
pin
es
Th
ailan
d
Hon
g K
on
g
Sau
di
Ara
bia
Neth
er-
lan
ds
Ind
ia
Can
ad
a
Vie
tnam
Sheepmeat 53 24 2 1 16 -10 -3 -1 -1 1 -2 10 6 1Beef 94 16 78 -18 7 1 -1 2 1 9 1 -4 -2 2 -2 3 -2Other Meat -3 -2 2 -1 1 -5 1 3 1 -1 1 -1Milk Powder 660 303 -4 10 1 2 20 20 6 74 21 33 -24 71 11Butter 203 53 5 9 5 -1 -1 3 3 5 2 9 21 2 1 20 9 2Cheese 30 13 22 2 2 -17 -1 1 1 -1 1 3 1 1 -4Whey/Casein 91 -36 6 60 6 -1 3 -10 -1 4 -5 5 8 31 2 17Kiwifruit 116 40 2 4 4 8 3 26 12 1 -2 1 1 2 2 1 1Apples 18 -9 17 1 3 3 2 11 1 -2 -5 -8 2 -3 -2 -1 7Other Fruit/Vege -7 -1 -2 4 1 1 -1 -7 1 -1 -1Wine 12 2 -5 5 8 1 2 -1 -1 -2Wool 49 37 -2 -2 3 1 -2 7Skins/Hides -24 -26 1 1 2 -1 -5 -1Logs 32 3 1 4 15 1 2 5Sawn Timber -23 -17 5 -5 4 -8 -1 1 -6 -1 1 3 1 -1 -1Fibreboard/Plywood -14 -1 -2 -1 -8 -1 -1 -2Wood Pulp 9 10 3 7 -2 -11 1 1Fish/Seafood -16 -11 -9 -4 -11 -5 1 1 1 1 1 -4 1 4 1 1 4Crude Oil -32 66 -130 33Aluminium 22 -3 -1 43 -29 1 3 -1 -3 2Remainder -115 -54 25 -3 26 47 -4 -18 -3 -6 -28 -11 2 -5 5 -21 -4 21 -64 -7 14TOTAL 1,159 404 -84 161 83 18 31 30 8 37 -4 -9 82 40 40 -42 98 50 -50 16 35
NEW ZEALAND’S 20 LARGEST EXPORT MARKETS
IMPORTANT INFORMATION
The distribution of this document or streaming of this video broadcast (as applicable, “publication”) may be restricted by law in certain jurisdictions. Persons who receive this publication must inform themselves about and observe all relevant restrictions.
1. Disclaimer for all jurisdictions, where content is authored by ANZ Research:Except if otherwise specifi ed in section 2 below, this publication is issued and distributed in your country/region by Australia and New Zealand Banking Group Limited (ABN 11 005 357 522) (“ANZ”), on the basis that it is only for the information of the specifi ed recipient or permitted user of the relevant website (collectively, “recipient”). This publication may not be reproduced, distributed or published by any recipient for any purpose. It is general information and has been prepared without taking into account the objectives, fi nancial situation or needs of any person. Nothing in this publication is intended to be an offer to sell, or a solicitation of an offer to buy, any product, instrument or investment, to effect any transaction or to conclude any legal act of any kind. If, despite the foregoing, any services or products referred to in this publication are deemed to be offered in the jurisdiction in which this publication is received or accessed, no such service or product is intended for nor available to persons resident in that jurisdiction if it would be contradictory to local law or regulation. Such local laws, regulations and other limitations always apply with non-exclusive jurisdiction of local courts. Certain fi nancial products may be subject to mandatory clearing, regulatory reporting and/or other related obligations. These obligations may vary by jurisdiction and be subject to frequent amendment. Before making an investment decision, recipients should seek independent fi nancial, legal, tax and other relevant advice having regard to their particular circumstances. The views and recommendations expressed in this publication are the author’s. They are based on information known by the author and on sources which the author believes to be reliable, but may involve material elements of subjective judgement and analysis. Unless specifi cally stated otherwise: they are current on the date of this publication and are subject to change without notice; and, all price information is indicative only. Any of the views and recommendations which comprise estimates, forecasts or other projections, are subject to signifi cant uncertainties and contingencies that cannot reasonably be anticipated. On this basis, such views and recommendations may not always be achieved or prove to be correct. Indications of past performance in this publication will not necessarily be repeated in the future. No representation is being made that any investment will or is likely to achieve profi ts or losses similar to those achieved in the past, or that signifi cant losses will be avoided. Additionally, this publication may contain ‘forward looking statements’. Actual events or results or actual performance may differ materially from those refl ected or contemplated in such forward looking statements. All investments entail a risk and may result in both profi ts and losses. Foreign currency rates of exchange may adversely affect the value, price or income of any products or services described in this publication. The products and services described in this publication are not suitable for all investors, and transacting in these products or services may be considered risky. ANZ and its related bodies corporate and affi liates, and the offi cers, employees, contractors and agents of each of them (including the author) (“Affi liates”), do not make any representation as to the accuracy, completeness or currency of the views or recommendations expressed in this publication. Neither ANZ nor its Affi liates accept any responsibility to inform you of any matter that subsequently comes to their notice, which may affect the accuracy, completeness or currency of the information in this publication.Except as required by law, and only to the extent so required: neither ANZ nor its Affi liates warrant or guarantee the performance of any of the products or services described in this publication or any return on any associated investment; and, ANZ and its Affi liates expressly disclaim any responsibility and shall not be liable for any loss, damage, claim, liability, proceedings, cost or expense (“Liability”) arising directly or indirectly and whether in tort (including negligence), contract, equity or otherwise out of or in connection with this publication. If this publication has been distributed by electronic transmission, such as e-mail, then such transmission cannot be guaranteed to be secure or error-free as information could be intercepted, corrupted, lost, destroyed, arrive late or incomplete, or contain viruses. ANZ and its Affi liates do not accept any Liability as a result of electronic transmission of this publication.ANZ and its Affi liates may have an interest in the subject matter of this publication as follows: • They may receive fees from customers for dealing in the products or services described in this publication, and their staff and introducers
of business may share in such fees or receive a bonus that may be infl uenced by total sales.• They or their customers may have or have had interests or long or short positions in the products or services described in this publication,
and may at any time make purchases and/or sales in them as principal or agent. • They may act or have acted as market-maker in products described in this publication. ANZ and its Affi liates may rely on information barriers and other arrangements to control the fl ow of information contained in one or more business areas within ANZ or within its Affi liates into other business areas of ANZ or of its Affi liates. Please contact your ANZ point of contact with any questions about this publication including for further information on these disclosures of interest.
2. Country/region specifi c information:Australia. This publication is distributed in Australia by ANZ. ANZ holds an Australian Financial Services licence no. 234527. A copy of ANZ’s Financial Services Guide is available at http://www.anz.com/documents/AU/aboutANZ/FinancialServicesGuide.pdf and is available upon request from your ANZ point of contact. If trading strategies or recommendations are included in this publication, they are solely for the information of ‘wholesale clients’ (as defi ned in section 761G of the Corporations Act 2001 Cth). Persons who receive this publication must inform themselves about and observe all relevant restrictions.Brazil. This publication is distributed in Brazil by ANZ on a cross border basis and only following request by the recipient. No securities are being offered or sold in Brazil under this publication, and no securities have been and will not be registered with the Securities Commission – CVM.Brunei. Japan. Kuwait. Malaysia. Switzerland. Taiwan. This publication is distributed in each of Brunei, Japan, Kuwait, Malaysia, Switzerland and Taiwan by ANZ on a cross-border basis.European Economic Area (“EEA”): United Kingdom. ANZ in the United Kingdom is authorised by the Prudential Regulation Authority (“PRA”). Subject to regulation by the Financial Conduct Authority (“FCA”) and limited regulation by the PRA. Details about the extent of our regulation by the PRA are available from us on request. This publication is distributed in the United Kingdom by ANZ solely for the information of persons who would come within the FCA defi nition of “eligible counterparty” or “professional client”. It is not intended for and must not be distributed to any person who would come within the FCA defi nition of “retail client”. Nothing here excludes or restricts any duty or liability to a customer which ANZ may have under the UK Financial Services and Markets Act 2000 or under the regulatory system as defi ned in the Rules of the PRA and the FCA. Germany. This publication is distributed in Germany by the Frankfurt Branch of ANZ solely for the information of its clients. Other EEA countries. This publication is distributed in the EEA by ANZ Bank (Europe) Limited (“ANZBEL”) which is authorised by the PRA and regulated by the FCA and the PRA in the United Kingdom, to persons who would come within the FCA defi nition of “eligible counterparty” or “professional client” in other countries in the EEA. This publication is distributed in those countries solely for the information of such persons upon their request. It is not intended for, and must not be distributed to, any person in those countries who would come within the FCA defi nition of “retail client”.Fiji. For Fiji regulatory purposes, this publication and any views and recommendations are not to be deemed as investment advice. Fiji investors must seek licensed professional advice should they wish to make any investment in relation to this publication.Hong Kong. This publication is distributed in Hong Kong by the Hong Kong branch of ANZ, which is registered at the Hong Kong Monetary Authority to conduct Type 1 (dealing in securities), Type 4 (advising on securities) and Type 6 (advising on corporate fi nance) regulated
ANZ Agri Focus / August 2014 / 43 of 44
IMPORTANT INFORMATION
ANZ Agri Focus / August 2014 / 44 of 44
activities. The contents of this publication have not been reviewed by any regulatory authority in Hong Kong. If in doubt about the contents of this publication, you should obtain independent professional advice. India. This publication is distributed in India by ANZ on a cross-border basis. If this publication is received in India, only you (the specifi ed recipient) may print it provided that before doing so, you specify on it your name and place of printing. Further copying or duplication of this publication is strictly prohibited.New Zealand. This publication is intended to be of a general nature, does not take into account your fi nancial situation or goals, and is not a personalised adviser service under the Financial Advisers Act 2008.Oman. This publication has been prepared by ANZ. ANZ neither has a registered business presence nor a representative offi ce in Oman and does not undertake banking business or provide fi nancial services in Oman. Consequently ANZ is not regulated by either the Central Bank of Oman or Oman’s Capital Market Authority. The information contained in this publication is for discussion purposes only and neither constitutes an offer of securities in Oman as contemplated by the Commercial Companies Law of Oman (Royal Decree 4/74) or the Capital Market Law of Oman (Royal Decree 80/98), nor does it constitute an offer to sell, or the solicitation of any offer to buy non-Omani securities in Oman as contemplated by Article 139 of the Executive Regulations to the Capital Market Law (issued vide CMA Decision 1/2009). ANZ does not solicit business in Oman and the only circumstances in which ANZ sends information or material describing fi nancial products or fi nancial services to recipients in Oman, is where such information or material has been requested from ANZ and by receiving this publication, the person or entity to whom it has been dispatched by ANZ understands, acknowledges and agrees that this publication has not been approved by the CBO, the CMA or any other regulatory body or authority in Oman. ANZ does not market, offer, sell or distribute any fi nancial or investment products or services in Oman and no subscription to any securities, products or fi nancial services may or will be consummated within Oman. Nothing contained in this publication is intended to constitute Omani investment, legal, tax, accounting or other professional advice. People’s Republic of China. If and when the material accompanying this publication does not only relate to the products and/or services of Australia and New Zealand Bank (China) Company Limited (“ANZ China”), it is noted that: This publication is distributed by ANZ or an affi liate. No action has been taken by ANZ or any affi liate which would permit a public offering of any products or services of such an entity or distribution or re-distribution of this publication in the People’s Republic of China (“PRC”). Accordingly, the products and services of such entities are not being offered or sold within the PRC by means of this publication or any other method. This publication may not be distributed, re-distributed or published in the PRC, except under circumstances that will result in compliance with any applicable laws and regulations. If and when the material accompanying this publication relates to the products and/or services of ANZ China only, it is noted that: This publication is distributed by ANZ China in the Mainland of the PRC.Qatar. This publication has not been, and will not be lodged or registered with, or reviewed or approved by, the Qatar Central Bank (“QCB”), the Qatar Financial Centre (“QFC”) Authority, QFC Regulatory Authority or any other authority in the State of Qatar (“Qatar”); or authorised or licensed for distribution in Qatar; and the information contained in this publication does not, and is not intended to, constitute a public offer or other invitation in respect of securities in Qatar or the QFC. The fi nancial products or services described in this publication have not been, and will not be registered with the QCB, QFC Authority, QFC Regulatory Authority or any other governmental authority in Qatar; or authorised or licensed for offering, marketing, issue or sale, directly or indirectly, in Qatar. Accordingly, the fi nancial products or services described in this publication are not being, and will not be, offered, issued or sold in Qatar, and this publication is not being, and will not be, distributed in Qatar. The offering, marketing, issue and sale of the fi nancial products or services described in this publication and distribution of this publication is being made in, and is subject to the laws, regulations and rules of, jurisdictions outside of Qatar and the QFC. Recipients of this publication must abide by this restriction and not distribute this publication in breach of this restriction. This publication is being sent/issued to a limited number of institutional and/or sophisticated investors (i) upon their request and confi rmation that they understand the statements above; and (ii) on the condition that it will not be provided to any person other than the original recipient, and is not for general circulation and may not be reproduced or used for any other purpose.Singapore. This publication is distributed in Singapore by the Singapore branch of ANZ solely for the information of “accredited investors”, “expert investors” or (as the case may be) “institutional investors” (each term as defi ned in the Securities and Futures Act Cap. 289 of Singapore). ANZ is licensed in Singapore under the Banking Act Cap. 19 of Singapore and is exempted from holding a fi nancial adviser’s licence under Section 23(1)(a) of the Financial Advisers Act Cap. 100 of Singapore. In respect of any matters arising from, or in connection with the distribution of this publication in Singapore, contact your ANZ point of contact.United Arab Emirates. This publication is distributed in the United Arab Emirates (“UAE”) or the Dubai International Financial Centre (as applicable) by ANZ. This publication: does not, and is not intended to constitute an offer of securities anywhere in the UAE; does not constitute, and is not intended to constitute the carrying on or engagement in banking, fi nancial and/or investment consultation business in the UAE under the rules and regulations made by the Central Bank of the United Arab Emirates, the Emirates Securities and Commodities Authority or the United Arab Emirates Ministry of Economy; does not, and is not intended to constitute an offer of securities within the meaning of the Dubai International Financial Centre Markets Law No. 12 of 2004; and, does not constitute, and is not intended to constitute, a fi nancial promotion, as defi ned under the Dubai International Financial Centre Regulatory Law No. 1 of 200. ANZ DIFC Branch is regulated by the Dubai Financial Services Authority (“DFSA”). The fi nancial products or services described in this publication are only available to persons who qualify as “Professional Clients” or “Market Counterparty” in accordance with the provisions of the DFSA rules. In addition, ANZ has a representative offi ce (“ANZ Representative Offi ce”) in Abu Dhabi regulated by the Central Bank of the United Arab Emirates. ANZ Representative Offi ce is not permitted by the Central Bank of the United Arab Emirates to provide any banking services to clients in the UAE.United States. If and when this publication is received by any person in the United States or a “U.S. person” (as defi ned in Regulation S under the US Securities Act of 1933, as amended) (“US Person”) or any person acting for the account or benefi t of a US Person, it is noted that ANZ Securities, Inc. (“ANZ S”) is a member of FINRA (www.fi nra.org) and registered with the SEC. ANZ S’ address is 277 Park Avenue, 31st Floor, New York, NY 10172, USA (Tel: +1 212 801 9160 Fax: +1 212 801 9163). Except where this is a FX- related or commodity-related publication, this publication is distributed in the United States by ANZ S (a wholly owned subsidiary of ANZ), which accepts responsibility for its content. Information on any securities referred to in this publication may be obtained from ANZ S upon request. Any US Person receiving this publication and wishing to effect transactions in any securities referred to in this publication must contact ANZ S, not its affi liates. Where this is an FX- related or commodity-related publication, it is distributed in the United States by ANZ’s New York Branch, which is also located at 277 Park Avenue, 31st Floor, New York, NY 10172, USA (Tel: +1 212 801 9160 Fax: +1 212 801 9163). Commodity-related products are not insured by any U.S. governmental agency, and are not guaranteed by ANZ or any of its affi liates. Transacting in these products may involve substantial risks and could result in a signifi cant loss. You should carefully consider whether transacting in commodity-related products is suitable for you in light of your fi nancial condition and investment objectives. ANZ S is authorised as a broker-dealer only for US Persons who are institutions, not for US Persons who are individuals. If you have registered to use this website or have otherwise received this publication and are a US Person who is an individual: to avoid loss, you should cease to use this website by unsubscribing or should notify the sender and you should not act on the contents of this publication in any way.
This document has been prepared by ANZ Bank New Zealand Limited, Level 7, 1 Victoria Street, Wellington 6011, New Zealand, Ph 64-4-802 2361, e-mail [email protected], http://www.anz.co.nz