Embed Size (px)
Citation preview
Business and Economic
Research Limited
Report to:
The New Zealand Police
NEW ZEALAND DRUG HARM INDEX
Prepared by
Adrian Slack Des O’Dea
Dr Ian Sheerin David Norman
Jiani Wu Dr Ganesh Nana
April 2008
Copyright© BERL
BERL ref #4616
BERL House, 108 The TerracePO Box 10-277, Wellington 6011, New ZealandTelephone: 04 931 9200, Fax No: 04 931 9202E-mail: [email protected], Web: www.berl.co.nz
ACKNOWLEDGEMENTS BERL gratefully acknowledges the Cross Departmental Research Pool and New Zealand
Police for sponsoring this major research project, and Police staff for their time and input.
BERL also received generous assistance, information and feedback from many individuals
and organisations. We particularly wish to recognise the input received from:
The DHI Project Steering Group
Department of Corrections – Peter Johnston and Brian Williams
Health Outcomes International Ltd – Jim Hales and Jane Manser
Institute of Environmental Science and Research Limited – Helen Poulsen and Keith Bedford
Ministry of Health – Chris Lewis (NZHIS) and Barry Borman (PHI)
Ministry of Justice – Clifford Slade (Coronial Services Unit)
Ministry of Transport – Wayne Jones
National Drug Intelligence Bureau – Les Maxwell and Michael Alexander
New Zealand Customs Service
SHORE –Chris Wilkins and Paul Sweetsur
South Health Limited – Susan Dovey
St Johns Ambulance – Andrew Cratchley
The Treasury – Tim Roper
We are grateful to both the internal and external reviewers for comments received during the
course of the project and on the draft report. All suggestions were carefully considered and
were incorporated as appropriate.
The views expressed in this report are not necessarily those of the New Zealand Police.
i New Zealand Drug Harm Index The New Zealand Police
April 2008
New Zealand Drug Harm Index
............................................................................................ 1 1 Summary
....................................................................................... 5 2 Introduction .......................................................................................6 2.1 Research scope .......................................................................................6 2.2 Report structure
............................................................................................... 7 3 Method .............................7 3.1 Background and differences from the Australian DHI .............................................................................8 3.2 Conceptual framework .........................................................................................10 3.3 Types of cost
.......................................................................................... 12 4 Drug Use .........................................................................12 4.1 Prevalence of drug use ................................................13 4.2 Illicit drug consumption in New Zealand .................................................................................16 4.3 Illicit drug seizures ..............................................................18 4.4 Illicit drug-attributable mortality
................................................................. 22 5 Drug Harm Calculations .....................................................................................................22 5.1 Crime .............................................................................................28 5.2 Lost output ..............................................................................32 5.3 Illicit drug production ............................................................................................33 5.4 Health care ......................................................................................40 5.5 Road accidents .........................41 5.6 Intangible costs from loss of life and lost quality of life
............................................................................................. 43 6 Results ................................................43 6.1 Harm from drugs consumed in 2005/06 ...............................................................45 6.2 Harm by drug type in 2005/06 .............................................................46 6.3 New Zealand Drug Harm Index .....................................................50 6.4 Comparison with the Australian DHI ..........................................................53 6.5 Applications, issues and updates
........................................................................................... 56 7 Glossary
....................................................................................... 57 8 References
........................................................ 61 9 Appendix – Additional Tables
.................................................... 79 10 Appendix – Sensitivity Analysis
.................................. 84 11 Appendix – New Zealand Crime Multipliers
ii New Zealand Drug Harm Index The New Zealand Police
April 2008
Tables
............................................................................................................... 5 Table 2.1 Illicit drug categories
........................................................ 13 Table 4.1 Illicit drug users by drug type in New Zealand, 2005/06
................................................................................. 14 Table 4.2 Patterns of illicit drug use by drug type
............................ 16 Table 4.3 Number of illicit drug users excluding double counting of poly-drug users
........................................................................... 17 Table 4.4 Illicit drug seizures (kilograms), 2000-2006
...................... 18 Table 4.5 Distribution of drug-attributable premature mortality by drug type, 2001-2005
............................................................................. 23 Table 5.1 Customs’ resource priorities by drug type
......................................................................... 24 Table 5.2 Police activity by offence category, 2005/06
........................................ 25 Table 5.3 Drug-related apprehensions by offence category – all drug types
........................................... 26 Table 5.4 Drug-related apprehensions by offence category and drug type
............................................................. 26 Table 5.5 Police activity related to drug offences by drug type
........................... 29 Table 5.6 Work force status of the additional population in the absence of drug use
...................................................... 29 Table 5.7 Work force status of drug users in 2005/06 by drug type
......................................................................... 37 Table 5.8 Case-weight multipliers, 1998/99 – 2007/08
....................................................... 37 Table 5.9 Hospital costs of illicit drug-caused cases 2001 to 2006
............................................................... 38 Table 5.10 Hospital costs by drug category ($m), 2001-2006
........................................................................... 39 Table 5.11 Distribution of hospital costs by drug type
......................................................................... 43 Table 6.1 Social costs of illicit drug use ($m), 2005/06
...................................... 43 Table 6.2 Tangible social costs of illicit drug use by drug type ($m), 2005/06
.................................... 44 Table 6.3 Intangible social costs of illicit drug use by drug type ($m), 2005/06
........................................................ 45 Table 6.4 Harm per kilogram and per user by drug type, 2005/06
................................................................ 45 Table 6.5 Harm per user by drug type ($ per user), 2005/06
................................................... 46 Table 6.6 Tangible cost per user by drug type ($ per user), 2005/06
.............................. 46 Table 6.7 Potential harm avoided by drug seizures by drug type ($m), 2000-2006
.................................. 50 Table 6.8 New Zealand and Australian illicit drug use prevalence by age group
............................ 52 Table 6.9 New Zealand and Australian social costs of illicit drug use ($m), 2005/06
iii New Zealand Drug Harm Index The New Zealand Police
April 2008
Figures
............................................................................... 15 Figure 4.1 Example of sub-sets of cannabis users
........................... 44 Figure 6.1 Tangible social costs of illicit drug use by cost component ($m), 2005/06
....................................................... 47 Figure 6.2 New Zealand Drug Harm Index (base year = 2005/06)
................................................................................................ 48 Figure 6.3 Drug Harm Index - cannabis
.................................................................................... 48 Figure 6.4 Drug Harm Index – other illicit drugs
Appendix Tables
............................................ 61 Appendix Table 1 Tangible costs of illicit drug use ($m), 2005/06 - detail
.......................................... 62 Appendix Table 2 Intangible costs of illicit drug use ($m), 2005/06 – detail
................................................. 62 Appendix Table 3 Crime costs of illicit drug use ($m), 2005/06 - detail
....................................................... 63 Appendix Table 4 Drug use prevalence 13-45 year olds, 2005/06
.............................................................. 63 Appendix Table 5 Illicit drug seizures (kilograms), 2000-2006
................................................................................ 64 Appendix Table 6 Metric conversion assumptions
........................................ 64 Appendix Table 7 Illicit drug caused deaths by nature of cause, 2001-2005
..................... 65 Appendix Table 8 Illicit drug caused deaths and age-gender mortality rates, 2001-2005
............................................ 66 Appendix Table 9 Counterfactual population estimates – males, 2005/06
....................................... 67 Appendix Table 10 Counterfactual population estimates – females, 2005/06
............................................ 68 Appendix Table 11 Counterfactual population estimates – total, 2005/06
........................ 69 Appendix Table 12 NZ-ADAM distribution of crime by offence category and drug type
............................. 69 Appendix Table 13 Crime multipliers to estimate actual crime from recorded crime
................................................................................ 69 Appendix Table 14 NZ-ADAM offence categories
................................. 70 Appendix Table 15 Hospital costs due to illicit drug use by category, 2001-2006
.................... 71 Appendix Table 16 Adjusted New Zealand costs of illicit drug use ($m), 2005/06 - detail
............................................. 71 Appendix Table 17 Australian costs of illicit drug use ($m), 1998 - detail
..................... 72 Appendix Table 18 Conditions associated with drug-attributable morbidity and mortality
........................................................... 80 Appendix Table 19 Sensitivity analysis of general assumptions
iv New Zealand Drug Harm Index The New Zealand Police
April 2008
.............................................................. 81 Appendix Table 20 Sensitivity analysis of crime assumptions
.............................................. 82 Appendix Table 21 Sensitivity analysis of drug production assumptions
...................................................... 83 Appendix Table 22 Sensitivity analysis of lost output assumptions
............................................................. 83 Appendix Table 23 Sensitivity analysis of health assumptions
..................... 84 Appendix Table 24 Costs of illicit drug use – limited NZ crime multipliers ($m), 2005/06
.................................. 85 Appendix Table 25 Costs of crime – limited NZ crime multipliers ($m), 2005/06
v New Zealand Drug Harm Index The New Zealand Police
April 2008
1 Summary
The New Zealand Police engaged BERL to develop a metric of the social harm caused by
illicit drug consumption in New Zealand. Harms related to drug use include a wide range of
crime, lost output, health service use and other diverted resources. Interrupting supply and
reducing consumption of illicit drugs contributes to reducing drug harm.
This report provides three broad answers. First, it estimates the total harm from illicit drug
consumption in the base year of 2005/06. Second, it uses these estimates to determine the
harm per kilogram of particular illicit drug types. The harm per kilogram estimates indicate
the gross economic benefit of drug seizures. Third, it develops a metric called the New
Zealand Drug Harm Index based on illicit drug seizures between 2000 and 2006.
The social costs resulting from harmful drug use are referred to as drug harm. The Index
shows the potential harm in dollar terms that illicit drug seizures could avoid by reducing
harmful consumption. These impacts are measured in consistent, real value terms.
The Index can be updated annually as new data become available. As such, the Index can
assist with monitoring the impact of interdiction and harm reduction strategies. In addition,
while the Index is not a stand-alone economic evaluation tool, the underlying model provides
information to evaluate drug enforcement and harm reduction interventions.
This research broadly reflects a similar exercise done by the Australian Federal Police in
Australia in 2004. Our study, however, built estimates from the bottom up, where possible,
rather than working from aggregate estimates or data from other countries. It uses data on
specific drugs and drug users’ behaviour in New Zealand. The New Zealand Drug Harm
Index also measures a more comprehensive range of impacts. In particular, it includes a
wider range of crime, work and health service consequences due to drug use.
The study shows the harm from drugs consumed in 2005/06 is substantial and that illicit drug
seizures may have prevented approximately another third again of drug harm.
• Illicit drug use in 2005/06 caused an estimated $1.31 billion of social costs. This was
made up of $1.09 billion of tangible resource costs (0.70 percent of GDP in 2005/06) and
$217 million of intangible psychological costs. Appendix Table 1 and Appendix Table 2
break down tangible and intangible costs in detail by drug type and cost component.
• Illicit drug seizures potentially avoided $458 million of drug harm in 2006, and $3.67
billion in total over the seven years between 2000 and 2006.
1 New Zealand Drug Harm Index The New Zealand Police
April 2008
The effects of illicit drug use in 2005/06 vary significantly by drug type.
• Stimulants account for over two fifths of social costs (41.7 percent, $546 million) and
stand out as the second largest source of tangible costs per user at $2,670.
• Cannabis is responsible for almost one third of the social costs of illicit drug use (32.9
percent, $431 million), but it causes relatively little harm per kg ($11,790) and per user
($1,680).
• Opioids generate almost one quarter of the drug harm (24.9 percent, $326 million) and
have the highest tangible and quality of life costs, with a harm per user of $22,190.
• LSD is the most damaging drug per kilogram, at $1.05 billion per kilogram, but due to the
small amount used it causes little harm (0.5 percent of total harm, or $265 per user).
• Limiting the scope to similar cost categories, total drug harm in New Zealand is
comparable, if slightly lower, than that in Australia after adjusting for New Zealand’s
smaller population and lower overall drug use prevalence. However, the pattern of harm
differs significantly across the drug types and cost categories. As a proportion of total
harm, stimulants in New Zealand cause almost three times as much harm while opioids
and cannabis cause just over one half to three quarters of the harm in Australia.
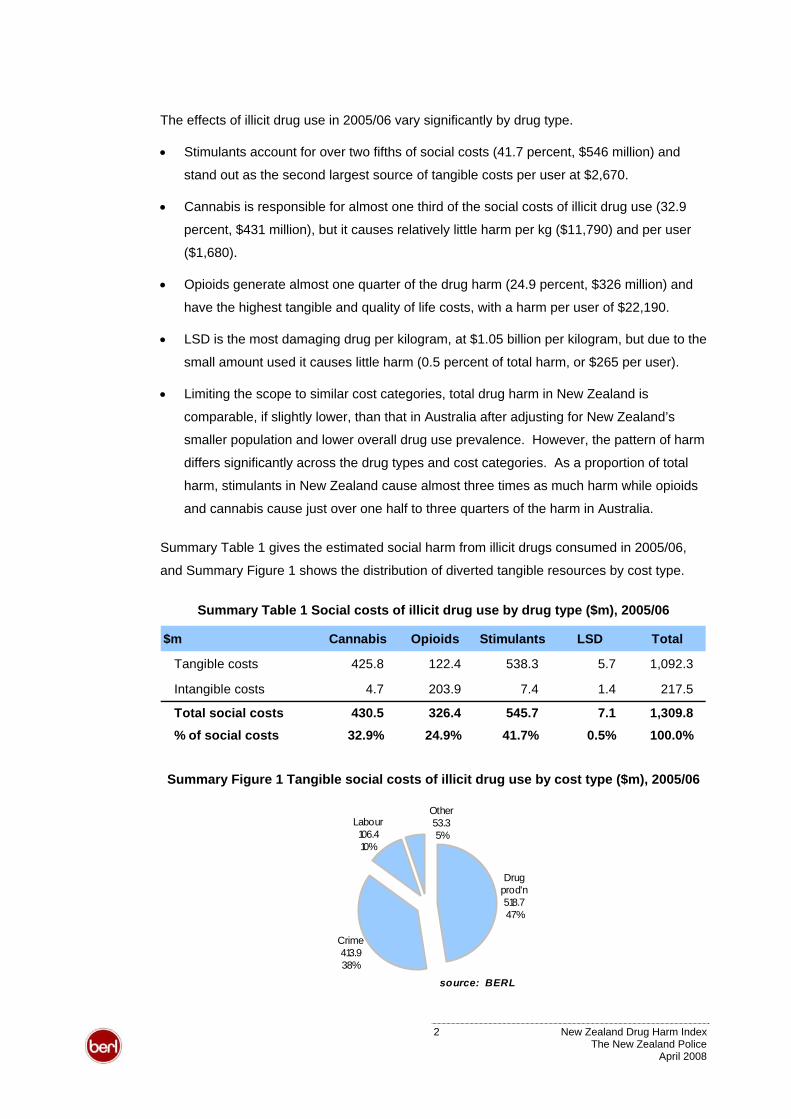
Summary Table 1 gives the estimated social harm from illicit drugs consumed in 2005/06,
and Summary Figure 1 shows the distribution of diverted tangible resources by cost type.
Summary Table 1 Social costs of illicit drug use by drug type ($m), 2005/06
$m Cannabis Opioids Stimulants LSD Total
Tangible costs 425.8 122.4 538.3 5.7 1,092.3
Intangible costs 4.7 203.9 7.4 1.4 217.5
Total social costs 430.5 326.4 545.7 7.1 1,309.8
% of social costs 32.9% 24.9% 41.7% 0.5% 100.0%
Summary Figure 1 Tangible social costs of illicit drug use by cost type ($m), 2005/06
Drug prod'n518.747%
Crime413.938%
Other53.35%
Labour 106.410%
source: BERL
2 New Zealand Drug Harm Index The New Zealand Police
April 2008
Tangible costs reflect productive resources diverted due to drug use and totalled $1.09
billion in 2005/06. This was equivalent to 0.70 percent of GDP in 2005/06. Drug production
($519 million), crime ($414 million) and lost output ($106 million) were the largest resource
drains. Drug-attributable health care and road accidents caused a further $53.3 million of
harm. Drug users and crime victims suffered $217 million of intangible psychological costs.
Summary Table 2 shows estimated illicit drug consumption and the harm per kilogram and
per user of the specified drug categories, based on the total harm recorded in Summary
Table 1. The per user estimates broadly allow for differences in the quantity of drugs
consumed per occasion. For example, a joint may contain 0.5 grams of cannabis but a tab
of LSD contains 50 micrograms of LSD, which is one million times less drug per unit.
Summary Table 2 Harm per kilogram and per user by drug type, 2005/06
$ drug harm Cannabis Opioids Stimulants LSDPer kilogram 11,790 1,074,130 403,470 1,054,900,000
Per user 1,694 22,186 2,671 265
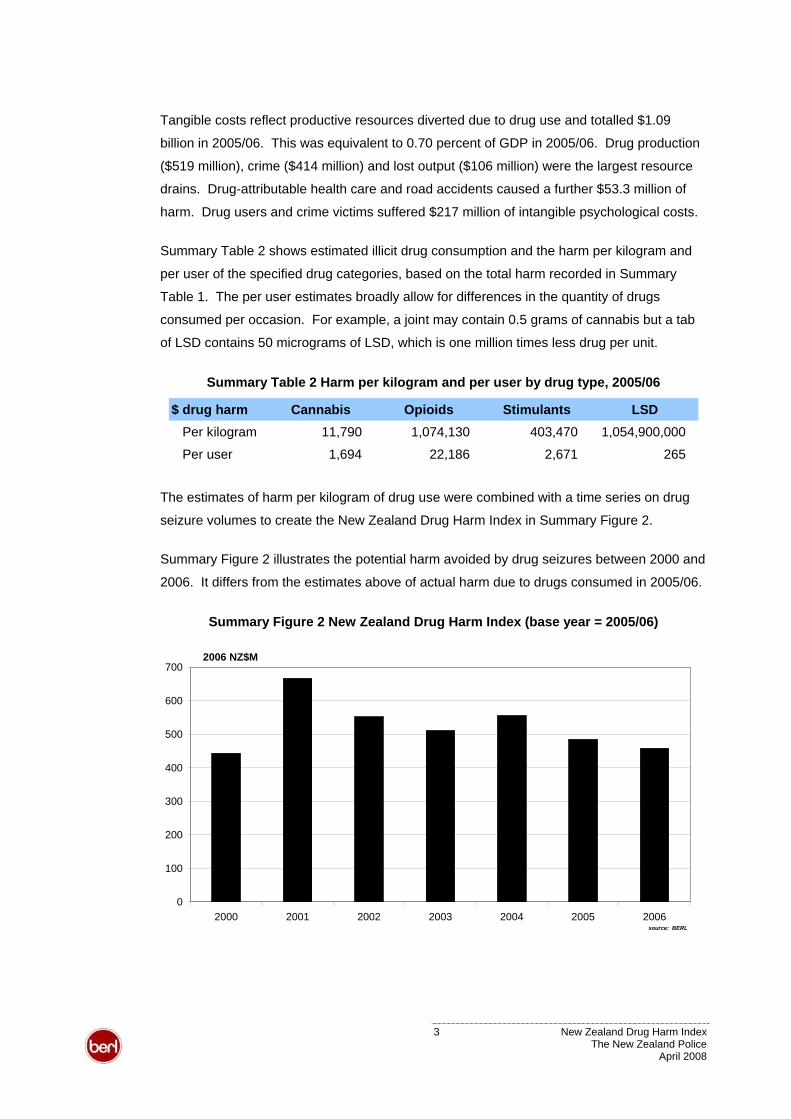
The estimates of harm per kilogram of drug use were combined with a time series on drug
seizure volumes to create the New Zealand Drug Harm Index in Summary Figure 2.
Summary Figure 2 illustrates the potential harm avoided by drug seizures between 2000 and
2006. It differs from the estimates above of actual harm due to drugs consumed in 2005/06.
Summary Figure 2 New Zealand Drug Harm Index (base year = 2005/06)
0
100
200
300
400
500
600
700
2000 2001 2002 2003 2004 2005 2006
2006 NZ$M
source: BERL
3 New Zealand Drug Harm Index The New Zealand Police
April 2008
Summary Figure 2 shows that by reducing illicit drug consumption and its associated costs,
illicit drug seizures potentially reduced drug harm in 2006 by $458 million. Over the seven
years between 2000 and 2006, potential harm avoided exceeded $3.67 billion.
Overall, the Index is driven by cannabis seizures due to the sheer volume of cannabis
seized. The Police and Customs collectively seized just over 33,480 kilograms in 2006 and
just less than 295,590 kilograms over the seven year period of 2000 to 2006. However, illicit
drug consumption in 2005/06 still resulted in substantial harm (see Summary Table 1).
Potential harm avoided by seizures of non-cannabis illicit drugs composed 13.7 percent of
the Index in 2006. But a large quantity of these types of drugs reached the market and their
use caused 67.1 percent of actual drug harm in 2005/06.
This indicates that there is substantial scope for supply, demand and harm reduction in the
future. Successful interventions would, initially, appear as an increase in the Index, as harm
avoided by drug seizures rose and actual costs from harmful drug use fell.
The Index provides a tool for measuring potential harm avoided over time. Changes in the
Index between years are driven by changes in drug seizure volumes rather than changes in
the pattern of harm. That is, the Index is based on a constant set of drug harm estimates
(per kilogram) that are applied to seizures in different years. Changes should be interpreted
with care: the Index does not show actual harm in a given year. Actual harm depends on
consumption not seizures. The base estimates will best reflect the harmful impact of drug
use in the near term, but should be re-evaluated as time passes and behaviours change.
How drug seizures reduce harm depends on factors such as the resources expended in
interrupting supply and the net effect of the interruption on consumption. The model
provides a resource to assess these effects. It is the task of future work to carry out such
applied analyses, and to assess the net social impact of shrinking the illicit drug industry and
reducing the harm to society resulting from continued illicit drug use.
4 New Zealand Drug Harm Index The New Zealand Police
April 2008
2 Introduction
The New Zealand Police (NZP) commissioned BERL to develop a metric to quantify the
social harm caused by illicit drug consumption in New Zealand. The New Zealand Drug
Harm Index (NZDHI) will assist the NZP to determine the potential socio-economic costs
from particular drug seizures and to track the value of disrupting illicit drug trade in New
Zealand over time. It can also provide input to evaluating alternative drug control initiatives.
This report presents estimates of the social costs to New Zealand of illicit drugs used in
2005/06. Social costs are borne by an individual or the rest of society for which there is no
compensating benefit.1 Harmful drug use imposes, for example, criminal costs stemming
from drug offences and drug-attributable violence or property offences. It also diverts
resources away from licit production and draws on scarce health resources due to the
resulting poor health, self harm or harm to others. Other tangible costs include the reduction
in society’s productive capacity.
The consequences of drug use extend beyond the tangible resource impacts on society.
Intangible costs include the pain and suffering caused to drug users and those affected by
them, as well as the value of life lost from premature mortality, homicide or road deaths.
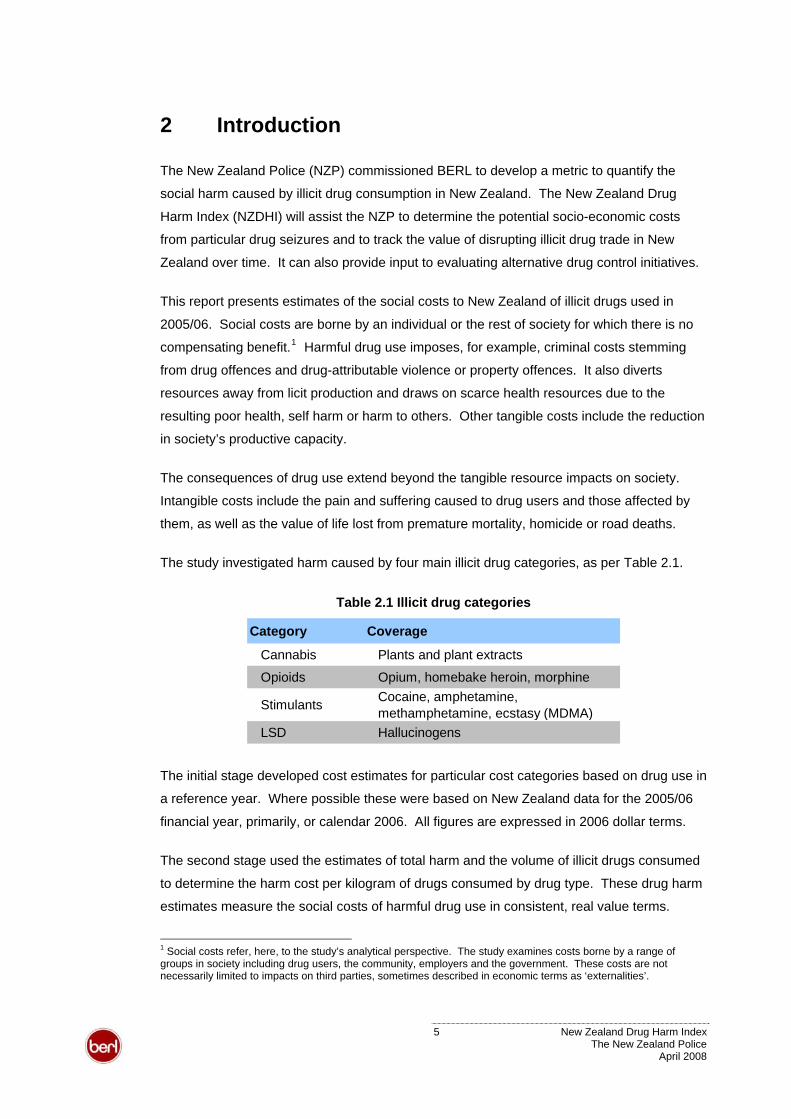
Table 2.1. The study investigated harm caused by four main illicit drug categories, as per
Table 2.1 Illicit drug categories
Category Coverage
Cannabis Plants and plant extracts
Opioids Opium, homebake heroin, morphine
Stimulants Cocaine, amphetamine, methamphetamine, ecstasy (MDMA)
LSD Hallucinogens
The initial stage developed cost estimates for particular cost categories based on drug use in
a reference year. Where possible these were based on New Zealand data for the 2005/06
financial year, primarily, or calendar 2006. All figures are expressed in 2006 dollar terms.
The second stage used the estimates of total harm and the volume of illicit drugs consumed
to determine the harm cost per kilogram of drugs consumed by drug type. These drug harm
estimates measure the social costs of harmful drug use in consistent, real value terms.
1 Social costs refer, here, to the study’s analytical perspective. The study examines costs borne by a range of groups in society including drug users, the community, employers and the government. These costs are not necessarily limited to impacts on third parties, sometimes described in economic terms as ‘externalities’.
5 New Zealand Drug Harm Index The New Zealand Police
April 2008
The third stage built the New Zealand Drug Harm Index. This shows the total harm per
annum that was potentially avoided due to drug interdiction. This involved applying the base
year harm per kilogram estimates based on drug use to the quantity of drugs seized by the
Customs Service and the NZP between 2000 and 2006. In addition to the main NZDHI, an
index was generated for each of the four drug categories.
2.1 Research scope
The study focused on estimating actual harm from drug use in 2005/06 and the potential
harm avoided by drug seizures using these base year estimates of harmful drug
consumption. The research does not extend to estimating avoidable costs of drug abuse or
the cost-effectiveness of current or alternative drug interventions.
The study estimates the impacts due to drug use using Australian research and New
Zealand data. This background work does not analyse consumption benefits of illicit drugs.
Nor does this study aim to include any potential benefits of illicit drug consumption.
This research does not examine the net social impact of shrinking the illicit drug industry.
The illicit drug industry provides employment, income and output. It is beyond the scope of
this report to examine the alternatives to which these resources could be put. Such an
evaluation would require industry (microeconomic) and countrywide (macroeconomic)
analyses of the relative productivity of these resources in their current and alternative uses.2
2.2 Report structure
The remainder of the report is divided into three main parts. Section 3 sets out the broad
methods and definitions BERL used for this study. Sections 4 and 5 detail drug use in New
Zealand and calculate drug harm in 2005/06.
Section 6 presents the study’s main results, provides analysis of the impacts by drug and
cost type, and compares the New Zealand estimates to Australian drug harm estimates.
New Zealand Drug Harm Index The New Zealand Police
April 2008
Sections 7 and 8 contain a glossary and literature references. Additional tables and
materials are appended in section 9. Sections 10 and 11 provide sensitivity analyses.
2 The size of the illicit drug industry poses a social and economic policy issue in New Zealand, particularly as some drug production has a strong regional concentration. Drug laws and enforcement lead to high prices for illicit drugs. While these prices may encourage some drug production, the prices give a distorted signal about the social value of that activity. That is, drug production may be profitable but producers fail to (fully) account for the harmful impact of their output. The harmful impacts that drug use imposes on that and other regions should be set against drug profits. Furthermore, the drug industry may trap resources and stop them from moving to better alternatives, such as innovation or education. Reforming the drug industry and moving resources to other industries may cut income in the short term but strengthen a region’s economic base and deliver higher, sustainable growth in the future.
6
3 Method
This section sets out the general framework that BERL used for the research.
The NZDHI study draws on a similar methodology to that used in Australian estimates of
drug harm. Both studies draw on an internationally recognised standard for measuring the
harm of substance abuse set out in Single et al (2001).3 These sources, and their
background documents, detail the general methodology used in this study. As such, this
report briefly outlines the method but concentrates on departures from that general method
and the use of New Zealand data.
3.1 Background and differences from the Australian DHI
The NZDHI was broadly based on a similar exercise completed by the Australian Federal
Police in Australia in 2004 and updated in 2006. McFadden and Mwesigye (2004; updated
by McFadden 2006) began with aggregate illicit drug harm estimated by health economists
David Collins and Helen Lapsley (2002).4
Collins and Lapsley (2002) estimated the social cost of illicit drug use in Australia over the
financial year of 1998/99. The estimates covered a wide range of individual and social
impacts. The impacts were calculated as net costs, that is, diverted resources less
resources saved.
McFadden (2006) used publicly available information to distribute the total costs estimated in
Collins and Lapsley across specific drug types. The disaggregated estimates were then
divided by consumption volumes to give an economic cost per kilogram of drug consumed.
The NZDHI models a wider range of impacts than the Australian DHI. Where possible, it
develops estimates from data on specific drugs and drug use behaviour rather than taking a
top-down approach that begins with aggregate estimates. Extensions include:
• drug interdiction expenditure at the border by Customs as a crime cost
• community sentences expenditure by Corrections as a crime cost
• private expenditure related to the prevention of crime as a crime cost
3 Single et al's (2001) guidelines are based on an international collaboration of substance abuse experts, epidemiologists and economists, and have been widely reviewed. As Collins and Lapsley (2002) note, the guidelines facilitate the development of valid and credible estimates of the economic costs of substance abuse. The guidelines treat methodological and data issues in detail. 4 A newer edition in the series was released as this report went to press, Collins D and Lapsley H (2008). The costs of tobacco, alcohol and illicit drug abuse to Australian society in 2004/05. Australia: CDHA.
7 New Zealand Drug Harm Index The New Zealand Police
April 2008
• lost output of crime victims as a labour cost
• homicide as an intangible cost
• crime related pain and suffering as an intangible cost.
One further extension is that the crime costs use crime multipliers to estimate total criminal
offences rather than using recorded crime only.
This study excludes illicit drug-related nursing home expenditure, which is included in the
Australian DHI. It was a small source of drug harm in the Australian estimates, and robust
data on this component or the distribution by drug type were not identified in New Zealand.
The intangible cost of a life year lost is based on the Land Transport New Zealand (LTNZ)’s
value of statistical life (VOSL). This is approximately 64 percent higher than that used in the
Australian DHI.
3.2 Conceptual framework
This study used a prevalence approach to calculate the current impact of illicit drug use. The
prevalence approach estimates resource diverted in a given year due to the impacts of past
and present illicit drug use. The costs estimated using the prevalence approach are then
compared to a counterfactual situation, in this case where no illicit drugs were ever used.
That is, in order to determine the harm avoided by reducing drug consumption we compare
the current situation with drug use to a hypothetical case where there is no harmful drug use.
The prevalence approach focuses on the impacts of both past and present, and is likely to
give an informative picture of the impacts of drug use in a given year. Collins and Lapsley
(2002:13) make the following observation with respect to tobacco use, but it is relevant for a
range of harms stemming from illicit drug use.
To examine [the effects of smoking in a given year (incidence)] would not be useful since
most abuse-related morbidity or mortality in a given year results from abuse in earlier
periods… we should be examining the impact of abuse over an extended period of time and
this implies comparison with the counterfactual situation in which there was no abuse over this
extended period.
The prevalence approach has the advantage of using currently available health data, such
as mortality and morbidity figures related to illicit drug use, to define what a counterfactual
population would have looked like today. This is likely to result in more robust estimates
8 New Zealand Drug Harm Index The New Zealand Police
April 2008
5than under the major alternative approach based on incidence. The current approach
provides estimates that are comparable with other New Zealand cost-of-harm studies, such
as Easton (1997) on tobacco and alcohol, O’Dea on suicide (2005) and tobacco (2007).
The study aimed to develop estimates from the bottom up based on the behaviour of
particular drug users. This approach focuses on the harm resulting from the consumption of
particular types of drug. These estimates can be aggregated to give total drug-related harm.
3.2.1 Methodological issues
One issue in this approach relates to the prevalence of drug use in the past as this
influences the consequences that manifest in the present. This study assumes prevalence
in the past is similar to prevalence in the present. Changing prevalence rates will affect the
relevance of the harm estimates as the impacts of past use that manifest in future years will
differ from those implicit in the estimates. Single et al (2001) argue that “the rates of abuse
and disease prevalence, the primary determinants of abuse costs, tend to change slowly” so
the harm estimates are likely to remain relevant over a time frame of three to five years.
A second issue raised by this approach is how to measure impacts that are jointly
attributable to the use of multiple drugs. That is, where a person uses more than one drug,
the impacts should be counted once per user. Separately attributing the impact to each drug
would have the effect of counting one impact more than once. Where this issue arose, poly-
drug users were allocated to a one drug sub-set defined by the mix of drugs used. In this
way, the consequences of drug use were appropriately counted once for a single, mutually
exclusive group. These impacts were then aggregated into the reported drug categories.
Accounting for poly-drug use also allows us to examine the impacts per user per year.
These figures put the scale of harm in terms of a person’s use rather than in a metric
measure of a drug. Such figures were not possible in the Australian DHI due to the risk of
double counting the impact of poly-drug users, for example, counting health care for one
person once as an opioid user and once as an ecstasy user. By employing exclusive drug
user sub-sets, the estimates attribute harm for one person to one drug type. Section 4.2.1
reviews the method used to determine the exclusive user sub-sets.
The per user estimates are tentative and should be interpreted carefully, however. First, the
poly-drug user estimates are based on patterns of drug use by frequent drug users not
population estimates. Second, the pattern of drug harm may differ from patterns of drug use.
5 The incidence approach requires projections into the future and the use of discount rates to estimate the potential loss in output incurred due to morbidity and mortality resulting from misuse. Both techniques, however, involve assumptions that affect the estimated cost.
9 New Zealand Drug Harm Index The New Zealand Police
April 2008
For example, people using both opioids and ecstasy have been included in the opioid
category rather than the stimulant category. This is based on the assumption that most
harm is likely to result from their opioid use rather than their ecstasy use.
3.3 Types of cost
The study looked at a range of social costs associated with illicit drugs, and quantified them
by drug category and in aggregate. We took a conventional approach of dividing substance
abuse costs into tangible and intangible costs.
3.3.1 Social costs
The study focuses on social costs, that is costs borne by the individual or wider society for
which there is no corresponding benefit. While there are arguments as to the legitimacy of,
and value to be placed on, the private benefits of illicit drug consumption (see Collins and
Lapsley (2002: 17:19), this study does not attempt to explicitly value net private benefits.
Consistent with New Zealand public policy, and the argument set out in Collins and Lapsley
(2002: 20-21), this study assumes that illicit drug consumption is abusive and imposes a
social cost. Therefore, all resources diverted by illicit drug consumption are regarded as
social costs.
The study aimed to estimate net social costs, rather than gross social costs of drug use.
That is, drug use may offset some costs as users reduce the burden on society’s scarce
resources. For example, premature death reduces the health care that users might
otherwise have required if they had lived longer.
3.3.2 Tangible costs
Tangible costs relate to resources used (or diverted) due to the presence of illicit drugs in
New Zealand. Tangible costs can be divided into direct costs and indirect costs.
Direct costs
Direct costs relate to resources directed away from an alternative use as a result of illicit
drugs. Direct costs relate to the immediate impacts of illicit drug use borne by the individual,
community and government.
The most important direct costs in dollar terms, according to Collins and Lapsley, are:
• crime costs caused by illicit drugs
• resources diverted to drug production from beneficial consumption or investment
10 New Zealand Drug Harm Index The New Zealand Police
April 2008
• road accidents
• health care costs.
At a conceptual level, direct costs also include the unpaid time given up by family and friends
to take care of those who are ill as a result of illicit drugs, as well as time spent seeking or
participating in treatment by persons affected by illicit drugs. Estimation of these costs would
require information on the quantum and value of time involved, for example, whether such
care displaces productive activities or leisure. This study does not estimate these impacts.
Indirect costs
Indirect costs are borne by the wider society. The primary indirect costs of illicit drugs are:
• production lost to the economy as a result of premature death of users of illicit drugs
• reduced production by those who fall ill as a result of illicit drug abuse
• reduced production by those who stay home to care for those who fall ill as a result of
illicit drug abuse.
These costs may be borne by the individuals or may be externalities, that is, costs borne by
third parties such as employers rather than the individual.
3.3.3 Intangible costs
Intangible cost can only be borne by individuals and do not have (productive) resource
implications for society. That is, reductions in intangible costs only benefit the individual.
In the case of illicit drugs, intangible costs include:
• premature death as a result of illicit drugs
• reductions in the quality of life due to pain, suffering and loss of life caused by illicit
drugs.
These costs are borne by individual drug abusers and other individuals who experience pain,
suffering and loss of life through their association with the drug abuser. A decrease in the
quality of life of one individual cannot be transferred to another individual; hence, intangible
benefits cannot be bought or sold.
11 New Zealand Drug Harm Index The New Zealand Police
April 2008
4 Drug Use
The study estimated drug use prevalence and consumption with data from two national drug
use surveys (Wilkins and Sweetsur 2003, 2007) and a frequent drug user survey (Wilkins et
al 2006).
4.1 Prevalence of drug use
The number of illicit drug users in New Zealand during 2005/06 was calculated from drug
use prevalence rates and population estimates. The prevalence rates by drug type were
calculated from summary data provided by Centre for Social and Health Outcomes Research
and Evaluation (SHORE), Massey University. Appendix Table 4 notes drug use prevalence
rates for 13-45 year olds in 2005/06. Prevalence in older age groups (46-65 year olds) was
based on 2003 data, where available, or the average rate across all ages.
The 2006 national drug use survey (Wilkins and Sweetsur 2007) interviewed more than
2,000 individuals in the 13 to 45 age group about their drug-use history.6 It reports the
percentages of adults who were current users of illicit drugs at the time of survey. The
survey breaks down illicit drug use in the last 12 months by age group and sex, for 13 to 45
year-olds. For example, the study found that 36.9 percent of males and 33.2 percent of
females in the 20 to 24 age group had used cannabis at least once in the last year.
Census data gave the number of males and females within each age group in New Zealand
aged 13-64. These totals were multiplied by the proportions within each age by sex by drug-
type category to produce New Zealand prevalence figures by age group by sex by drug-type.
For example, it was estimated that 49,800 males and 45,200 females in the 20 to 24 age
group used cannabis at least once during 2005/06. Some drug users fall outside the broad
13-64 age group. However, the majority are aged from 15 to 44 years and this method
would provide a conservative estimate of numbers of users.
Table 4.1 tabulates the estimated number of illicit drug users aged 13-64 in New Zealand
during 2005/06. A total is not included as the table includes poly-drug users, so a single
person may appear in more than one category. Table 4.3, on page 16, estimates the total
number of drug users by drug type, allocating each individual to one category only.
6 Wilkins and Sweetsur’s (2003, 2007) results were based on a randomised telephone survey. It is likely that some participants would not honestly report their own drug use, for example, experimental drug users who did not continue to use regularly. However, it is probably the best information currently available on illicit drug use in the New Zealand general population.
12 New Zealand Drug Harm Index The New Zealand Police
April 2008
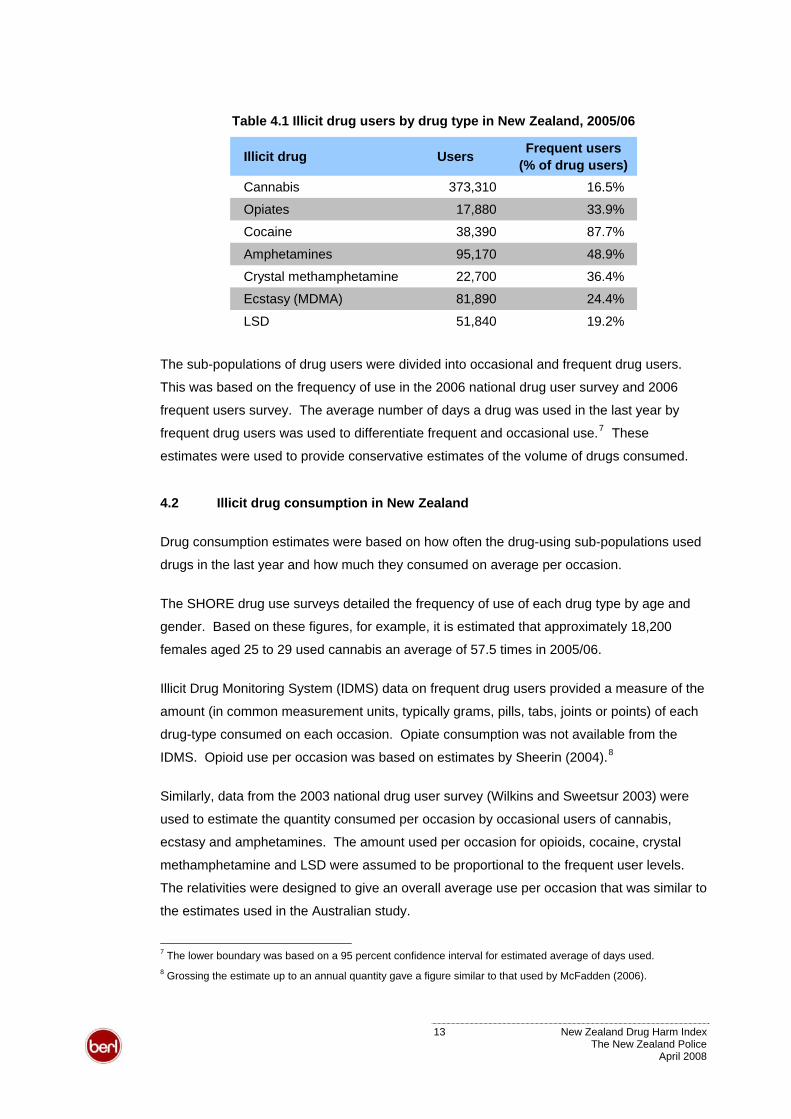
Table 4.1 Illicit drug users by drug type in New Zealand, 2005/06
Illicit drug Users Frequent users (% of drug users)
Cannabis 373,310 16.5%
Opiates 17,880 33.9%
Cocaine 38,390 87.7%
Amphetamines 95,170 48.9%
Crystal methamphetamine 22,700 36.4%
Ecstasy (MDMA) 81,890 24.4%
LSD 51,840 19.2%
The sub-populations of drug users were divided into occasional and frequent drug users.
This was based on the frequency of use in the 2006 national drug user survey and 2006
frequent users survey. The average number of days a drug was used in the last year by
frequent drug users was used to differentiate frequent and occasional use.7 These
estimates were used to provide conservative estimates of the volume of drugs consumed.
4.2 Illicit drug consumption in New Zealand
Drug consumption estimates were based on how often the drug-using sub-populations used
drugs in the last year and how much they consumed on average per occasion.
The SHORE drug use surveys detailed the frequency of use of each drug type by age and
gender. Based on these figures, for example, it is estimated that approximately 18,200
females aged 25 to 29 used cannabis an average of 57.5 times in 2005/06.
Illicit Drug Monitoring System (IDMS) data on frequent drug users provided a measure of the
amount (in common measurement units, typically grams, pills, tabs, joints or points) of each
drug-type consumed on each occasion. Opiate consumption was not available from the
IDMS. Opioid use per occasion was based on estimates by Sheerin (2004).8
Similarly, data from the 2003 national drug user survey (Wilkins and Sweetsur 2003) were
used to estimate the quantity consumed per occasion by occasional users of cannabis,
ecstasy and amphetamines. The amount used per occasion for opioids, cocaine, crystal
methamphetamine and LSD were assumed to be proportional to the frequent user levels.
The relativities were designed to give an overall average use per occasion that was similar to
the estimates used in the Australian study.
7 The lower boundary was based on a 95 percent confidence interval for estimated average of days used. 8 Grossing the estimate up to an annual quantity gave a figure similar to that used by McFadden (2006).
13 New Zealand Drug Harm Index The New Zealand Police
April 2008
The common unit measures were converted to a metric measure (grams). The data on the
amount used per occasion and number of users by age, gender and frequency were used to
estimate the total grams of each drug-type consumed by user category.
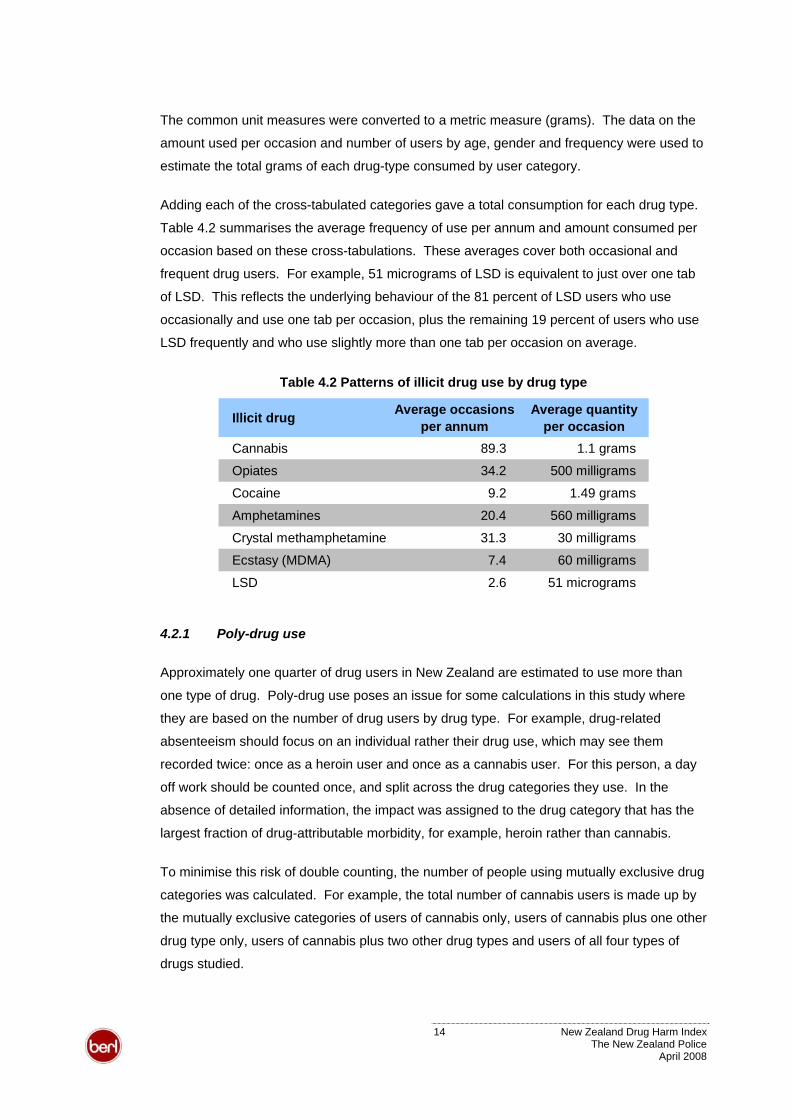
Adding each of the cross-tabulated categories gave a total consumption for each drug type.
Table 4.2 summarises the average frequency of use per annum and amount consumed per
occasion based on these cross-tabulations. These averages cover both occasional and
frequent drug users. For example, 51 micrograms of LSD is equivalent to just over one tab
of LSD. This reflects the underlying behaviour of the 81 percent of LSD users who use
occasionally and use one tab per occasion, plus the remaining 19 percent of users who use
LSD frequently and who use slightly more than one tab per occasion on average.
Table 4.2 Patterns of illicit drug use by drug type
Illicit drug Average occasions per annum
Average quantity per occasion
Cannabis 89.3 1.1 grams
Opiates 34.2 500 milligrams
Cocaine 9.2 1.49 grams
Amphetamines 20.4 560 milligrams
Crystal methamphetamine 31.3 30 milligrams
Ecstasy (MDMA) 7.4 60 milligrams
LSD 2.6 51 micrograms
4.2.1 Poly-drug use
Approximately one quarter of drug users in New Zealand are estimated to use more than
one type of drug. Poly-drug use poses an issue for some calculations in this study where
they are based on the number of drug users by drug type. For example, drug-related
absenteeism should focus on an individual rather their drug use, which may see them
recorded twice: once as a heroin user and once as a cannabis user. For this person, a day
off work should be counted once, and split across the drug categories they use. In the
absence of detailed information, the impact was assigned to the drug category that has the
largest fraction of drug-attributable morbidity, for example, heroin rather than cannabis.
To minimise this risk of double counting, the number of people using mutually exclusive drug
categories was calculated. For example, the total number of cannabis users is made up by
the mutually exclusive categories of users of cannabis only, users of cannabis plus one other
drug type only, users of cannabis plus two other drug types and users of all four types of
drugs studied.
14 New Zealand Drug Harm Index The New Zealand Police
April 2008
The IDMS report estimated the proportions of users of the four main drug-types who also
used one of the other main drug-types, plus any one or combination of cocaine, LSD or
crystal methamphetamines. The report indicated, for instance, that 59 percent of ecstasy-
users also used cannabis in 2005/06.
Having already calculated the total number of cannabis and ecstasy users, it was possible to
calculate how many ecstasy-users were also cannabis users. Similarly, it was possible to
calculate numbers for the other mutually exclusive poly-drug user categories.
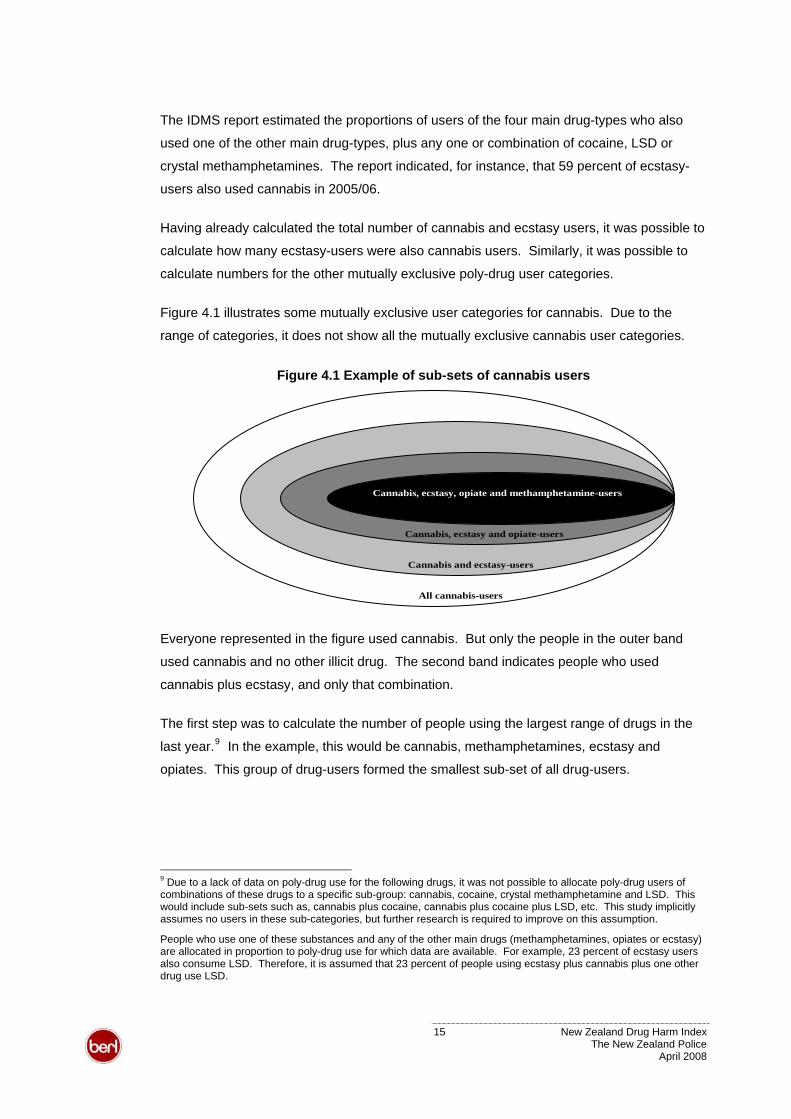
Figure 4.1 illustrates some mutually exclusive user categories for cannabis. Due to the
range of categories, it does not show all the mutually exclusive cannabis user categories.
Figure 4.1 Example of sub-sets of cannabis users
All cannabis-users
Cannabis and ecstasy-users
Cannabis, ecstasy, opiate and methamphetamine-users
Cannabis, ecstasy and opiate-users
Everyone represented in the figure used cannabis. But only the people in the outer band
used cannabis and no other illicit drug. The second band indicates people who used
cannabis plus ecstasy, and only that combination.
The first step was to calculate the number of people using the largest range of drugs in the
last year.9 In the example, this would be cannabis, methamphetamines, ecstasy and
opiates. This group of drug-users formed the smallest sub-set of all drug-users.
9 Due to a lack of data on poly-drug use for the following drugs, it was not possible to allocate poly-drug users of combinations of these drugs to a specific sub-group: cannabis, cocaine, crystal methamphetamine and LSD. This would include sub-sets such as, cannabis plus cocaine, cannabis plus cocaine plus LSD, etc. This study implicitly assumes no users in these sub-categories, but further research is required to improve on this assumption.
People who use one of these substances and any of the other main drugs (methamphetamines, opiates or ecstasy) are allocated in proportion to poly-drug use for which data are available. For example, 23 percent of ecstasy users also consume LSD. Therefore, it is assumed that 23 percent of people using ecstasy plus cannabis plus one other drug use LSD.
15 New Zealand Drug Harm Index The New Zealand Police
April 2008
The second step in the example would be to calculate the number of people using cannabis,
ecstasy and opiates. The number of users in the smallest sub-set would then be subtracted
from those using three drug-types to avoid double-counting.
A similar process was followed for all drug-types and combinations, in order to isolate the
number of users who exclusively used each particular drug-type or drug-type combination.
These exclusive user subs-sets were then aggregated into the four drug type categories.
For sub-sets involving several drug types, the figures were split across the sub-sets broadly
in line with the relative harm attributed to a given drug type. For example, a person using
both opioids and ecstasy was allocated to the opioid category rather than the stimulant
category as most drug harm for that individual is likely to stem from their opioid use. In the
case of opioids and amphetamines, users were allocated in proportion to the relative
prevalence of the two drugs.
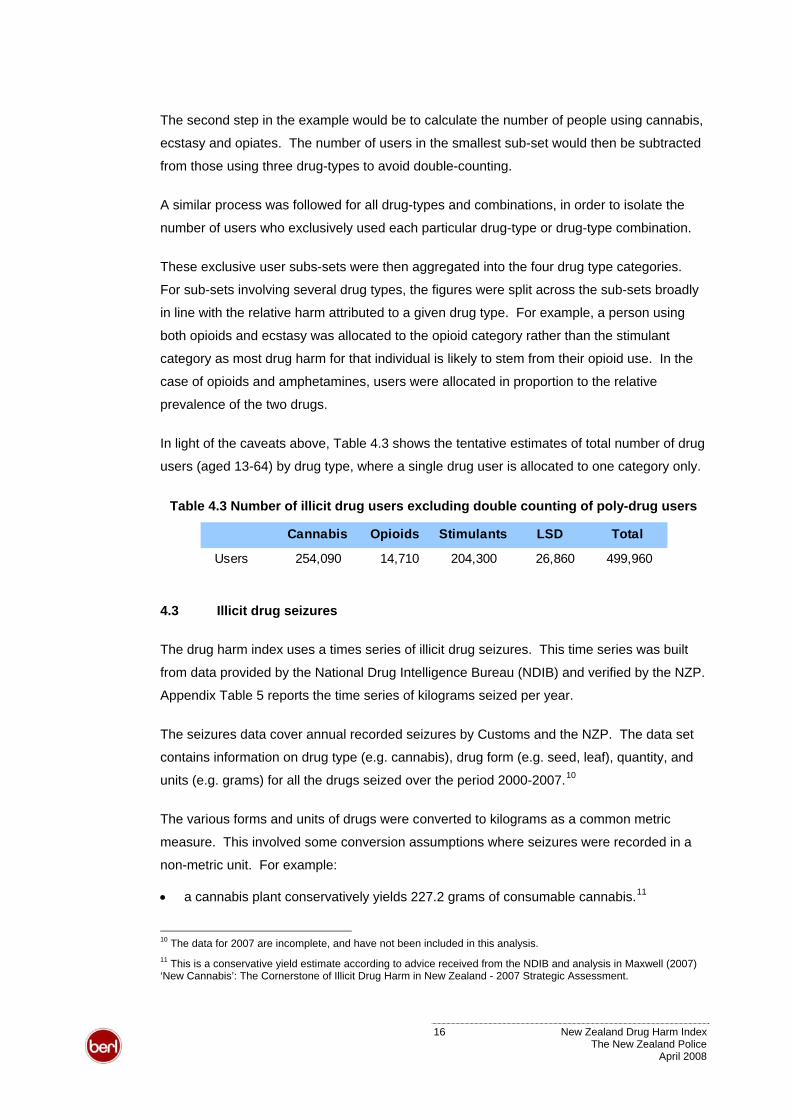
Table 4.3In light of the caveats above, shows the tentative estimates of total number of drug
users (aged 13-64) by drug type, where a single drug user is allocated to one category only.
Table 4.3 Number of illicit drug users excluding double counting of poly-drug users
Cannabis Opioids Stimulants LSD Total
Users 254,090 14,710 204,300 26,860 499,960
4.3 Illicit drug seizures
The drug harm index uses a times series of illicit drug seizures. This time series was built
from data provided by the National Drug Intelligence Bureau (NDIB) and verified by the NZP.
Appendix Table 5 reports the time series of kilograms seized per year.
The seizures data cover annual recorded seizures by Customs and the NZP. The data set
contains information on drug type (e.g. cannabis), drug form (e.g. seed, leaf), quantity, and
units (e.g. grams) for all the drugs seized over the period 2000-2007.10
The various forms and units of drugs were converted to kilograms as a common metric
measure. This involved some conversion assumptions where seizures were recorded in a
non-metric unit. For example:
11 • a cannabis plant conservatively yields 227.2 grams of consumable cannabis.
10 The data for 2007 are incomplete, and have not been included in this analysis. 11 This is a conservative yield estimate according to advice received from the NDIB and analysis in Maxwell (2007) ‘New Cannabis’: The Cornerstone of Illicit Drug Harm in New Zealand - 2007 Strategic Assessment.
16 New Zealand Drug Harm Index The New Zealand Police
April 2008
12• an LSD tab is assumed to contain 50 micrograms of pure lysergic acid diethylamide.
• an ecstasy (MDMA) tablet is assumed to contain 50 milligrams of methylenedioxy-
methamphetamine.13
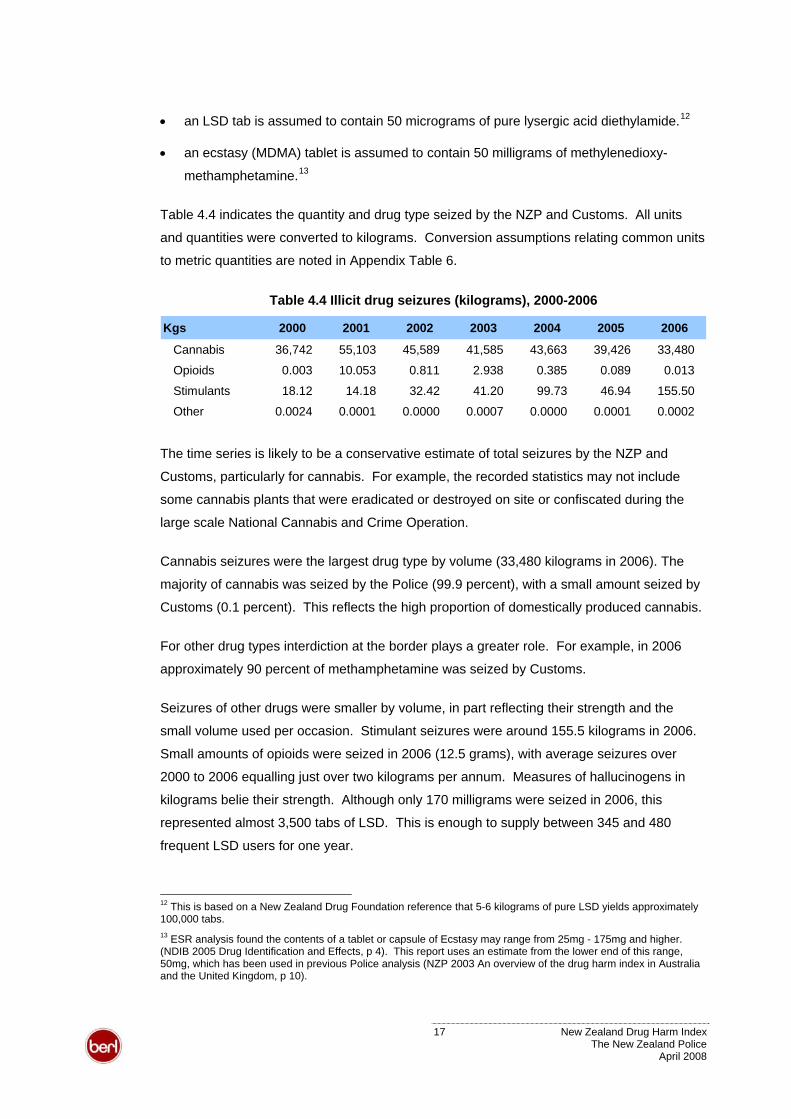
Table 4.4 indicates the quantity and drug type seized by the NZP and Customs. All units
and quantities were converted to kilograms. Conversion assumptions relating common units
to metric quantities are noted in Appendix Table 6.
Table 4.4 Illicit drug seizures (kilograms), 2000-2006
Kgs 2000 2001 2002 2003 2004 2005 2006
Cannabis 36,742 55,103 45,589 41,585 43,663 39,426 33,480
Opioids 0.003 10.053 0.811 2.938 0.385 0.089 0.013
Stimulants 18.12 14.18 32.42 41.20 99.73 46.94 155.50
Other 0.0024 0.0001 0.0000 0.0007 0.0000 0.0001 0.0002
The time series is likely to be a conservative estimate of total seizures by the NZP and
Customs, particularly for cannabis. For example, the recorded statistics may not include
some cannabis plants that were eradicated or destroyed on site or confiscated during the
large scale National Cannabis and Crime Operation.
Cannabis seizures were the largest drug type by volume (33,480 kilograms in 2006). The
majority of cannabis was seized by the Police (99.9 percent), with a small amount seized by
Customs (0.1 percent). This reflects the high proportion of domestically produced cannabis.
For other drug types interdiction at the border plays a greater role. For example, in 2006
approximately 90 percent of methamphetamine was seized by Customs.
Seizures of other drugs were smaller by volume, in part reflecting their strength and the
small volume used per occasion. Stimulant seizures were around 155.5 kilograms in 2006.
Small amounts of opioids were seized in 2006 (12.5 grams), with average seizures over
2000 to 2006 equalling just over two kilograms per annum. Measures of hallucinogens in
kilograms belie their strength. Although only 170 milligrams were seized in 2006, this
represented almost 3,500 tabs of LSD. This is enough to supply between 345 and 480
frequent LSD users for one year.
12 This is based on a New Zealand Drug Foundation reference that 5-6 kilograms of pure LSD yields approximately 100,000 tabs. 13 ESR analysis found the contents of a tablet or capsule of Ecstasy may range from 25mg - 175mg and higher. (NDIB 2005 Drug Identification and Effects, p 4). This report uses an estimate from the lower end of this range, 50mg, which has been used in previous Police analysis (NZP 2003 An overview of the drug harm index in Australia and the United Kingdom, p 10).
17 New Zealand Drug Harm Index The New Zealand Police
April 2008
4.4 Illicit drug-attributable mortality
Assessing the impacts of drug use on society involves comparing the current situation with
drug use (the factual) to a hypothetical New Zealand without drug use (the counterfactual).
The prevalence approach used in this study draws on available health data on mortality to
determine what the additional population would be in the absence of drug use.
Data were supplied by the New Zealand Health Information Service (NZHIS) on all deaths in
New Zealand over the five-year period from 2001 to 2005 that were either wholly attributable
(e.g. T40.1 Poisoning by Heroin) or partly attributable (e.g. B17.1 Acute Hepatitis C; some
cases would be caused by drug injection) to the use of illicit drugs. The list of ICD-10 AM
codes for which data were supplied is given in Appendix Table 18.
For those deaths only partly attributable to illicit drug use, ‘attributable fractions’ were taken
from the Australian work by Ridolfo and Stevenson (2001). It is possible that these
attributable fractions over-estimate the levels in New Zealand, Use of Class A or Class B
drugs, such as heroin and cocaine, appears relatively more prevalent in Australia.
The distribution of deaths by drug type was based on the recorded attribution where
possible. Where deaths were not attributed to a specific drug type, the distribution was
based on research by the NZHIS (2001) into drug attributable deaths between 1990 to 1996.
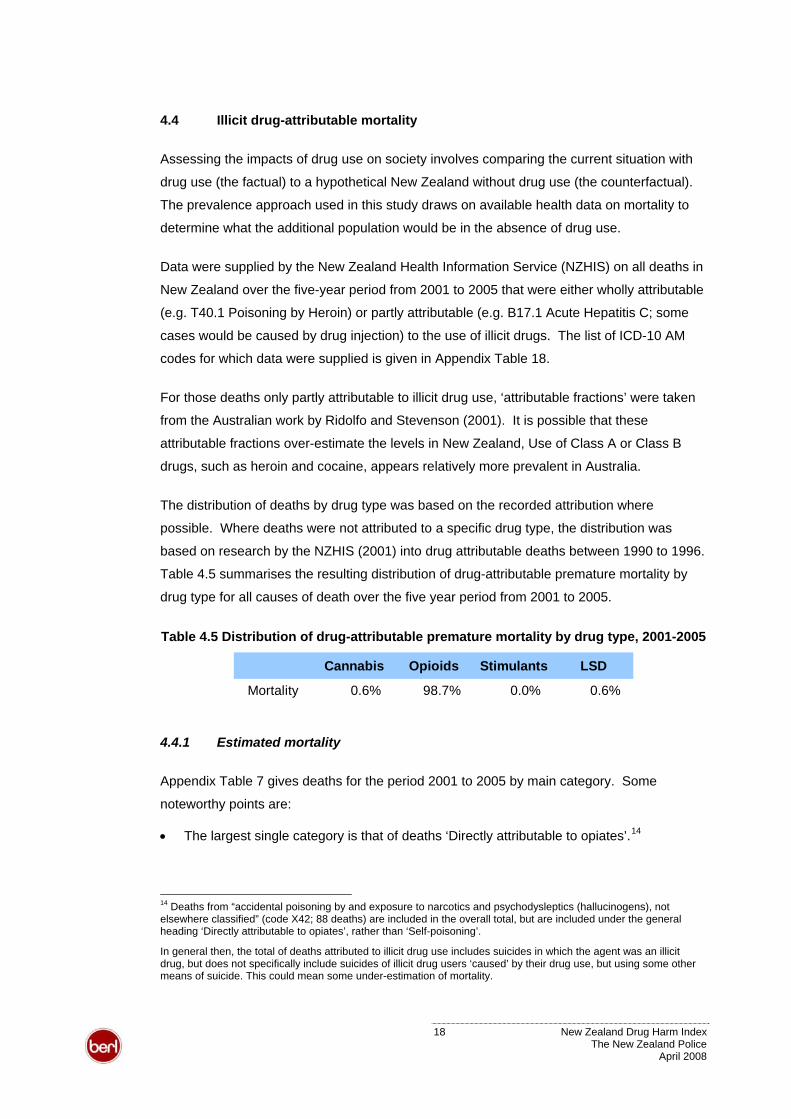
Table 4.5 summarises the resulting distribution of drug-attributable premature mortality by
drug type for all causes of death over the five year period from 2001 to 2005.
Table 4.5 Distribution of drug-attributable premature mortality by drug type, 2001-2005
Cannabis Opioids Stimulants LSD
Mortality 0.6% 98.7% 0.0% 0.6%
4.4.1 Estimated mortality
Appendix Table 7 gives deaths for the period 2001 to 2005 by main category. Some
noteworthy points are:
14 • The largest single category is that of deaths ‘Directly attributable to opiates’.
14 Deaths from “accidental poisoning by and exposure to narcotics and psychodysleptics (hallucinogens), not elsewhere classified” (code X42; 88 deaths) are included in the overall total, but are included under the general heading ‘Directly attributable to opiates’, rather than ‘Self-poisoning’.
In general then, the total of deaths attributed to illicit drug use includes suicides in which the agent was an illicit drug, but does not specifically include suicides of illicit drug users ‘caused’ by their drug use, but using some other means of suicide. This could mean some under-estimation of mortality.
18 New Zealand Drug Harm Index The New Zealand Police
April 2008
• This is followed by deaths by poisoning, whether intentional, or of ‘uncertain intent’
(codes X62 and Y12).15 This category appears to account for a significantly larger
proportion of deaths in New Zealand than in Australia.
• The greater number of hepatitis deaths attributable to the hepatitis B virus (HBV) rather
than other forms of hepatitis, in particular the hepatitis C virus (HCV).
As noted above, the method used here applies Australian attributable fractions to New
Zealand data. This method is likely to over-estimate deaths attributable to conditions such
as HBV or HIV/AIDS as the prevalence of these diseases have been found to be lower than
in Australia (Sheerin 2004). However, premature mortality associated with HCV is
understated because of the long-term progressive nature of this disease (Crofts et al 2001).
Appendix Table 8 gives estimated mortality and mortality rates (per 1,000 people) by age-
group and gender for the period 2001 to 2005. Total deaths in the five years amounted to
299; an average of 59.8 per year. Mortality is highest in the age range 20 to 49 years.
4.4.2 Estimates of the ‘Additional Population’
One input to the drug harm model is an estimate of the ‘additional’ or ‘missing’ population
who would currently be alive were it not for the deaths caused in the past by illicit drugs.
Essentially, this involves estimating the population that would have existed in 2005/06 based
on the modified mortality rates assuming no drug use in the past.
This estimation process involves the following steps.
• Apply current mortality rates for illicit drug use (as in table I above) to past populations to
estimate past deaths.
• Calculate the proportion of those past deaths that would subsequently have died anyway
from normal causes during the intervening period.
• Sum the remainder to get the estimated additional population who would currently be
alive. Following standard practice, no attempt is made to quantify the births which did
not take place because of lives lost through drug usage (Collins and Lapsley, 2002: 84).
For this report, past deaths have been calculated back to 1951, applying the mortality rates
derived for the 2001-2005 period. This has been done at 5-yearly intervals, from 1951 to
15 Deaths counted here include deaths from, in the words of the ICD-10 coding list, “narcotics and psychodysleptics (hallucinogens), not elsewhere classified” (codes X62 and Y12; 51 and 18 deaths respectively over the five-year period). They do not include “antiepileptic, sedative-hypnotic, antiparkinsonism and psychotropic drugs, not elsewhere classified” (codes X61 and Y11; 132 and 31 deaths respectively). They also exclude deaths from ‘sequelae of intentional self-harm’ (code Y870; 5 deaths).
19 New Zealand Drug Harm Index The New Zealand Police
April 2008
2001. Estimates for intervening years have been calculated by straight-line interpolation,
within each 5-year age-gender group. Finally, the proportion of those dying from illicit drug
use that would otherwise have died of normal causes is calculated using ‘survivorship
factors’ derived from the 2000-2002 New Zealand Life Tables published by Statistics New
Zealand (StatsNZ).16
The aggregated results of these calculations are reported by age and gender in Appendix
Table 9 to Appendix Table 11. The total additional population in 2005/06 would have been
1,919 (Appendix Table 11), if there had been no use of illicit drugs. Put another way, 1,919
life-years were lost in 2005/06 as a result of illicit drug use.
For comparison, Collins and Lapsley (2002: 85-87) had an Australian total of 15,545 males
plus 4,218 females for a total of 19,763. That was for June 1999, based on projecting
forward 50 years from 1947. Dividing by 5 gives an approximate NZ equivalent of 3,988. So
our New Zealand numbers are proportionately considerably lower than in Australia.
Assumptions underlying the additional population estimates
Some simplifying assumptions were required in deriving these estimates. These include:
• That the mortality experience of those dying as a result of illicit drug use would otherwise
have been identical to that of the rest of the population.
• That mortality rates summarised in the New Zealand Life tables for 2000-2002 are
applicable to earlier periods. In fact mortality rates were higher in earlier years, and the
numbers otherwise surviving to the current period will be somewhat overstated.
• That the mortality experience, and usage of illicit drugs, of emigrants and immigrants
was identical to that of the rest of the population.
• That the age-structure, by gender, of the population prior to 1991, back to 1951, was
identical to that observed in 1991. This was required by the lack of readily available
information on the age-structure in those earlier years. (Total populations prior to 1991
were scaled up by a factor of 2 percent, to make the earlier totals correspond to the
‘Estimated Resident’ population definition used by StatsNZ from 1991 onwards.)
• That illicit drug usage rates, and the consequences for premature mortality, were the
same in earlier years, prior to 2001-2005.
16 Note that only half the deaths are included for the ‘current’ year, 2006; assuming these die on average halfway through the year.
20 New Zealand Drug Harm Index The New Zealand Police
April 2008
Of these assumptions, that most likely to lead to significant error is the last. It seems likely
that illicit drug usage has increased since the 1950s and 1960s, and that therefore the
estimates given here are somewhat over-stated.
21 New Zealand Drug Harm Index The New Zealand Police
April 2008
5 Drug Harm Calculations
The sections below describe how the harms of illicit drugs used in 2005/06 were calculated.
The calculations primarily draw on cost data for the 2005/06 financial year.
The study focuses on total harm resulting from the following illegal drugs:
• cannabis, for example, marijuana and hashish (cannabis resin)
• opiates, for example heroin and homebake
• stimulants, for example, cocaine, amphetamine, methamphetamine and ecstasy
• hallucinogens, for example, LSD.
The study does not consider licit drugs such as legal party pills, such as benzylpiperazine
(BZPs).17 Nor does it include harm from other legally available substances such as alcohol
or tobacco.18
5.1 Crime
Crime related drug costs extend beyond specific drug offences. The analysis reported in this
section aims to capture a range of offences that result from drug use. It covers drug uses
and also people affected by, and agencies that deal with, drug crime.
Appendix Table 3 breaks down the crime cost estimates into the underlying components
described below.
5.1.1 Customs
The Customs Service provided information on its total budget ($118.9 million) and drug
enforcement expenditure ($28.7 million) in the 2006/07 financial year.19 Enforcement
expenditure was based on the Customs Service’s analysis of the proportion of its budget
dedicated to drug enforcement activity. It covered a range of cost centres, such as drug
detector dog teams and drug investigations units (100 percent drug-attributable), mail centre
operations (30 percent) and intelligence targeting (30 percent).
17 At the time this report was prepared, Parliament BZP reclassified BZP as a class C drug under the Misuse of Drugs (Classification of BZP) Amendment Act, effective from April 1 2008. 18 However, in the calculation of road accident costs, where both alcohol and illicit drug use contributed to an accident, only impacts primarily attributable to illicit drug use were included. 19 Total enforcement expenditure is composed of $16.4 million of operational expenditure plus $12.3 million of non-operational expenditure. This latter figure equals the fraction of total non-operational expenditure that is proportional to drug enforcement operational expenditure.
22 New Zealand Drug Harm Index The New Zealand Police
April 2008
The Customs figure was developed using estimates of drug-related activity under its various
costs centres. In practice, it is difficult to accurately separate out drug enforcement activities
from Customs’ other border roles. This is particularly an issue for screening and search
activity. For example, screening a passenger at the airport, searching a craft or examining a
cargo container all address a range of border related risks or commodities. This caveat also
applies to overhead expenditure, which was allocated in proportion to estimated drug
enforcement expenditure.
Given the study’s focus on net expenditure in the 2005/06 financial year, the supplied figures
were scaled down. Net expenditure in 2005/06 was 86.1 percent of the figure for total
appropriation in the 2006/07 year. This gave estimated drug enforcement expenditure of
$24.7 million. The distribution by drug type was based on Customs’ resource priorities.20
Table 5.1 Customs’ resource priorities by drug type
Cannabis Opioids Stimulants LSDDrug enforcement 5.0% 2.5% 90.0% 2.5%
5.1.2 Community costs: victims of crime
Drug-related costs borne by victims of crime were estimated using an approach similar to
that in Roper and Thompson (2006). This included preventative expenditure,21 property
losses, lost output, health service use and intangible costs.
Intangible costs result from the pain, suffering, and – in the case of homicide – loss of life of
crime victims in 2005/06.22 The loss of life values in the Treasury report (2006) were
calculated using a different method to the prevalence approach used in this research.
Where relevant, intangible costs of crime have been rebased from a human capital cost to
be consistent with the life year values used in this study. Section 5.6 discusses this process.
Community costs were calculated as the number of drug-attributable crimes multiplied by the
average cost per offence. These calculations were based on estimated actual crime rather
20 The proportion of resources allocated to stimulants includes resources to interdict stimulant precursors. 21 Preventative expenditure “comprises all those costs that individuals, households, businesses and institutions incur to prevent crime, e.g. security alarms, fencing and deadlocks… [and] insurance administration” (Roper and Thompson 2006: 13). It focuses on measures to protect property, and does not aim to include health prevention interventions or treatment, such as methadone programmes for opioid users. 22 Ideally, the study would have calculated the additional population that would have existed in 2005/06 in the absence of drug-attributable homicides. However, there were insufficient data on the pattern of homicides to robustly calculate this. As such, this component is likely to be very conservative. It measures drug-attributable homicides estimated from Police data in 2005/06 year rather than the people that would have survived to 2005/06.
23 New Zealand Drug Harm Index The New Zealand Police
April 2008
than recorded crime. This involved applying crime multipliers from the Treasury study to the
offences recorded in 2005/06 to estimate actual crime levels (see 23Appendix Table 13).
The fraction of total criminal offences related to drug use and the distribution by drug type
was based on information from the New Zealand Arrestee Drug Abuse Monitoring (NZ-
ADAM) programme and New Zealand data on drug crime, described in section 5.1.3 below.
5.1.3 Police
NZP resources diverted due to drug consumption were estimated from total Budget
appropriations for the 2005/06. Crown revenue and receipts were removed from the total
appropriations to get net expenditure of $943m.
First, NZP expenditure was allocated to eight offence categories. It was allocated using data
from the NZP’s Activity Monitoring System (AMS) on police hours spent dealing with different
offences in 2005/06.24 These proportions are shown in Table 5.2.
Table 5.2 Police activity by offence category, 2005/06
Offence category Violent Property Drugs Traffic Breaches Disorder Drink
Driving Other
% of hours 14.3% 47.4% 4.0% 15.9% 7.5% 3.1% 0.0% 7.7%
Research on the proportion of different offence types due to drug use were used to
determine drug-attributable police expenditure. The fraction of offences attributable to drugs
and the distribution by drug type was based on the NZ-ADAM research.25 The fractions are
based on participants who believed that their drug taking had contributed “Some” or “A lot” to
the commission of their offence.
To strengthen the statistical power of the NZ-ADAM sample, data from the 2005 and 2006
waves of NZ-ADAM were combined. The calculated rates, therefore, represent averages
over this two-year period.
23 Roper and Thompson (2006: 8) note that “multipliers derived from the New Zealand National Survey of Crime Victims 2001 are not readily convertible to the particular crime sub-categories covered in this study.” A similar caveat holds here with respect to the more recent 2006 New Zealand Crime and Safety Survey (Mayhew and Reilly 2007). The appendix in section 10 examines how the estimates might differ if selected multipliers imputed from the 2006 survey are used instead. 24 Traffic offence data did not separately identify drink driving offences. However, Collins and Lapsley (2002) reported that this category accounted for no significant percentage of Australian police resource time. Therefore we have assumed that little resource time in the traffic offence category was due to drink driving offences, and have listed drink driving as a separate category with zero percent of resource time. 25 Data were extracted for the NZDHI research by Health Outcomes International Ltd.
24 New Zealand Drug Harm Index The New Zealand Police
April 2008
Table 5.3 gives the fraction of reported crimes related to drug use for all drug types
examined in this study. In the case of drug offences, a 100 percent proportion was used in
this study, while a zero percent of drink driving was attributed to illicit drug use.26 The
offence categories are detailed in Appendix Table 14.
Table 5.3 Drug-related apprehensions by offence category – all drug types
Offence category Violent Property Drugs Traffic Breaches Disorder Drink
Driving Other
% drug related 4.4% 9.4% 100.0% 6.2% 9.0% 3.9% 0.0% 9.9%
NZ-ADAM data were also used to determine the distribution by drug type of drug-attributable
crime by offence type. Three adjustments were made to the raw fractions. The adjustments
do not alter the total harm estimated from illicit drug consumption in 2005/06, but alter the
distribution by drug type. The distribution used in this study is given in 27Table 5.4.
The first adjustment allowed for poly-drug use by cannabis users. The raw NZ-ADAM
fraction for a given offence category for cannabis users was reallocated in proportion to
number of cannabis users who used other drugs, as these other drug types tend to be more
strongly associated with the commission of crime. Approximately one third of cannabis
users are estimated to use cannabis and at least one other illicit drug type. Reflecting this
pattern, one third of cannabis related crime was reallocated to the other illicit drug categories
according to the combination of drugs used by poly-drug cannabis users.
Second, the proportion of recorded crime attributed to LSD use was extremely high relative
to LSD prevalence and time spent by police dealing with LSD related offences. The LSD
figures were scaled to reflect the distribution of the NZP’s activity by drug type, as per Table
5.5 . LSD related offences accounted for 0.24 percent of NZP time in 2005/06.
Third, due to the small number of opiate users recorded in the NZ-ADAM data, the
distribution of opiate-related crime was double checked against the relative prevalence of
opiate use and New Zealand research on opiate related crime (Adamson and Sellman 1998,
Sheerin 2004). The main effect of this adjustment was to re-weight property crime towards
opiates and away from other drug types. A first step was to assume crime related to opiate
and stimulant use was similar, and to scale the stimulant crime fractions in proportion to the
relative prevalence of opiate and stimulant use. For example, opiate use is approximately
7% as prevalent as stimulant use. This was used to scale down the fraction of stimulant
26 The fraction of drug offences NZ-ADAM participants attributed to drug use was 28.7 percent. Consistent with the conceptual framework of this study, we assume that, in the absence of drugs, there would be no drug offences. Conversely, all drug offences are due to the presence of illicit drugs, that is an attributable fraction of 100 percent. 27 Appendix Table 12 gives the raw NZ-ADAM fractions.
25 New Zealand Drug Harm Index The New Zealand Police
April 2008
crime to find the fraction of opiate crime. A second step was to use research on opiate
users’ average illegal income from property crime to calibrate the property crime figures.
Table 5.4 Drug-related apprehensions by offence category and drug type
Offence category Violent Property Drugs Traffic Breaches Disorder Drink
Driving Other
Cannabis 27.5% 21.9% 36.6% 48.2% 32.9% 26.5% 0.0% 29.1%
Opiates 4.8% 35.5% 5.4% 12.6% 5.1% 5.0% 0.0% 7.9%
Stimulants 66.6% 41.5% 57.7% 38.3% 61.2% 68.5% 0.0% 62.4%
LSD 1.0% 1.0% 0.2% 1.0% 0.7% 0.0% 0.0% 0.7%
In the case of drug offences, AMS data were used in preference to the NZ-ADAM data to
allocate police time by drug type, as shown in Table 5.5. The NZP spent approximately
598,000 hours dealing with drug offences in 2005/06.
Table 5.5 Police activity related to drug offences by drug type
Cannabis Opioids Stimulants LSD
Drug offences 55.8% 0.9% 43.0% 0.2%
5.1.4 Courts
Court related expenditure was based on the 2005/06 Budget appropriations for Vote: Courts
and the output classes of Custody of Remand Prisoners plus Escort and Custodial
Supervision from Vote: Corrections. After removing Crown revenue and receipts, net court
related expenditure was $353 million.
Total court related expenditure was allocated to the offence categories using the police time
proportions given in Table 5.2. The fraction of expenditure and distribution by drug type was
determined using the NZ-ADAM figures. An exception was made for drug offences. For this
specific offence category, the distribution by drug type was made according to Ministry of
Justice information on drug offence prosecutions. Approximately 72.6 percent of drug
offence prosecutions were related to cannabis. The remaining 27.4 percent of drug offences
were listed in a catchall ‘Other Drug’ category. This was split up across the three other drug
types using detailed NZP data on apprehensions for drug offences.
5.1.5 Prisons
Prison expenditure was based on the inmates incarcerated due to drug-related crime in the
2005/06 financial year times the average cost per prisoner in 2005/06.
26 New Zealand Drug Harm Index The New Zealand Police
April 2008
The Department of Corrections provided information on the prison muster in 2005/06 by
offence type, age and sex. Drug-attributable prisoner fractions were based on the Australian
Institute of Criminology’s Drug Use Careers of Offenders (DUCO) survey as New Zealand
data were unavailable.
Based on these figures, approximately 1,578 people (16.7 percent of the prison population)
were incarcerated as a result of drug-related crime.28 Using an average cost per prisoner of
$68,879, this generated a total of $108.7 million. As this estimate is based on Australian
attributable fractions, and in light of the high proportion of the New Zealand prison population
that have drug and alcohol problems, the actual cost of drug-related imprisonment in New
Zealand could be considerably higher than this conservative estimate.
Incarceration poses a further cost due to the lost output of inmates. Lost output estimates
were calculated on the basis of the age and gender profile of inmates jailed due to drug use,
and totalled $38.4 million. Section 5.2 describes the general process to calculate lost output.
The estimates of lost output are an exception to the general approach of estimating net
costs. That is, the estimates do not take into account prisoners’ earning while in prison. The
Department of Corrections, however, advises that working prisoners are paid a token
amount per day (approximately $1). Therefore, the gross and net figures are unlikely to
differ substantially. For example, if all 1,578 drug-attributable prisoners were paid for every
standard working day (5 days a week, 46 weeks a year), this would amount to just under
$363,000 or less than one percent of the estimated loss of prisoner output.
5.1.6 Community sentences and home detention
Drug-related community sentence expenditure was based on the number of people serving
community-based sentences and orders in 2005/06. Net appropriations for this output class
were $69.8m (Department of Corrections 2007). This equals total appropriations less a
small surplus.
The distribution of community sentences by offence type was available from Ministry of
Justice sentencing statistics. The drug-attributable conviction fractions used for the prison
estimates were applied to the community sentence figures. These figures were used to
estimate the part of net expenditure that related to drug use. This amounted to $20.9 million.
28 A Ministry of Health report (2007:16) suggests that a substantially larger proportion (almost 90 percent) of the prison population have an alcohol and/or drug problem. While it covers alcohol as well as illicit drugs and does not determine for what fraction of this group illicit drugs was a factor in their offending, it suggests the estimated proportion of drug-attributable incarceration is likely to be conservative.
27 New Zealand Drug Harm Index The New Zealand Police
April 2008
The total was distributed by drug type according to the proportion of people who committed
drug offences who were given a community sentence. Approximately 78.9 percent of drug
offence community sentences were related to cannabis. The remaining ‘Other Drug’
category was distributed across the three other drug types using NZP data on drug-related
apprehensions.
Home detention involves Corrections Services managing adult offenders within the precincts
of a specified residence during specified hours.29 Drug-related home detention numbers
were based on the proportion of corrective services population on home detention and the
overall proportion of crime leading to a criminal sentence (16.7 percent). This process gave
a figure of 20 drug-related home detainees.
The cost of a home detainee per year of $14,800 was based on the average length of time
on home detention multiplied by the capital and operational cost per person.30 In total, drug-
related home detentions amounted to approximately $300,000. To avoid double counting,
the home detention estimate was deducted from the estimate for community sentences.
All home detention expenditure was allocated to the cannabis category, as it is assumed that
few Class A or Class B offenders would be eligible for this type of sentence.
5.2 Lost output
A society’s capacity to produce output depends on its labour force as a factor of production
and the non-market resources in households. This study considers two forms of production
loss due to the effects of harmful drug use on the labour force and households.31
Premature death and illness of those not in paid employment reduce a country’s capacity to
support itself. That is, although unpaid, the non-market activities people do for their own
household and those around them are valuable. We note, however, that there is no agreed
substitute non-market valuation for the contribution of these people. Furthermore, non-
market contributions are not counted as part of a country’s Gross Domestic Product (GDP),
and it would be inconsistent to include this when expressing aggregate harm as a proportion
of GDP.
Table 5.6 and Table 5.7 show the distribution of working-age additional population and drug
users in 2005/06 by drug type and work force status. The work force structure and
29 Home detention was made a separate sentence type in 2007. 30 The underlying figures were based on two Ministry of Justice reports on home detention (Ministry of Justice 1997 and 2007). 31 Single et al (2001) note a third source of productivity loss where drug use reduces productivity.
28 New Zealand Drug Harm Index The New Zealand Police
April 2008
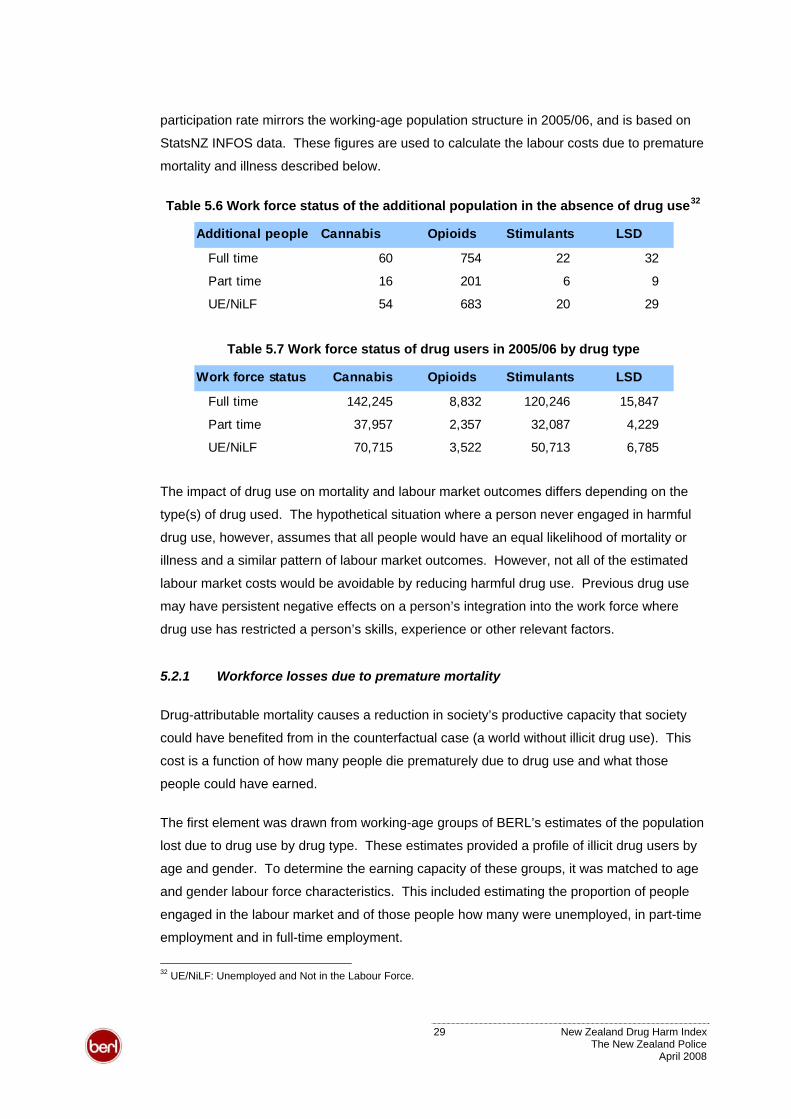
participation rate mirrors the working-age population structure in 2005/06, and is based on
StatsNZ INFOS data. These figures are used to calculate the labour costs due to premature
mortality and illness described below.
32Table 5.6 Work force status of the additional population in the absence of drug use
Additional people Cannabis Opioids Stimulants LSD
Full time 60 754 22 32
Part time 16 201 6 9
UE/NiLF 54 683 20 29
Table 5.7 Work force status of drug users in 2005/06 by drug type
Work force status Cannabis Opioids Stimulants LSD
Full time 142,245 8,832 120,246 15,847
Part time 37,957 2,357 32,087 4,229
UE/NiLF 70,715 3,522 50,713 6,785
The impact of drug use on mortality and labour market outcomes differs depending on the
type(s) of drug used. The hypothetical situation where a person never engaged in harmful
drug use, however, assumes that all people would have an equal likelihood of mortality or
illness and a similar pattern of labour market outcomes. However, not all of the estimated
labour market costs would be avoidable by reducing harmful drug use. Previous drug use
may have persistent negative effects on a person’s integration into the work force where
drug use has restricted a person’s skills, experience or other relevant factors.
5.2.1 Workforce losses due to premature mortality
Drug-attributable mortality causes a reduction in society’s productive capacity that society
could have benefited from in the counterfactual case (a world without illicit drug use). This
cost is a function of how many people die prematurely due to drug use and what those
people could have earned.
The first element was drawn from working-age groups of BERL’s estimates of the population
lost due to drug use by drug type. These estimates provided a profile of illicit drug users by
age and gender. To determine the earning capacity of these groups, it was matched to age
and gender labour force characteristics. This included estimating the proportion of people
engaged in the labour market and of those people how many were unemployed, in part-time
employment and in full-time employment.
32 UE/NiLF: Unemployed and Not in the Labour Force.
29 New Zealand Drug Harm Index The New Zealand Police
April 2008
Earnings were calculated using data on median earnings per hour and the average number
of hours worked per week by age, sex and employment status (part-time and full-time).
Earnings statistics were sourced from the StatsNZ New Zealand Income Survey for the June
2006 quarter. The Household Labour Force Survey (2004) provided hours worked per week.
The earnings profiles were then applied to the lost workforce profiles to give drug-attributable
production losses due to premature mortality. The losses by drug type were aggregated to
give gross mortality related production losses.
Premature mortality has an offsetting effect by reducing the demand on society’s scarce
resources through reduced consumption. Consumption resources released by the lost
population were based on average private and public consumption expenditure per person.
Private expenditure was derived from Household Economic Survey figures on average
household expenditure and the average number of persons per household. Public
expenditure per capita (excluding transfers such as benefits) was based on a study of
population-related expenditure completed by BERL for the Department of Labour (BERL
project reference #4497).
5.2.2 Workplace losses due to absenteeism
This study estimates drug-attributable absenteeism in a similar fashion to Collins and
Lapsley (2002). It begins by drawing on probability estimates from Bush and Wooden (1994)
on the impact of substance smoking and alcohol on absences from the workplace. As in
Collins and Lapsley (2002) we assume that the probability of absenteeism is the same for
tobacco use and illicit drug use. Overall, male drug users are assumed to be absent 70
percent more days and females 20 percent more days a year than abstainers.
The probability of excess absenteeism by gender was distributed by drug type according to
health service use. This had the effect of making absenteeism differ by the type of drug
used. For example, male cannabis users were estimated to take 8 percent more sick days
than the average (abstinent) male worker, while opioid users took off 40 percent more days.
Australian Bureau of Statistics (2003) survey data on employee absences were used in the
absence of robust New Zealand data. The survey provided information on how many hours
a person taking sick leave took per week and the proportion of workers taking sick leave.
These weekly figures used to estimate the number of hours of sick leave per worker per
annum.
Estimates of the illicit drug-using population by age and gender were used to develop a
workforce profile using a process similar to that in section 5.2.1. To ensure poly-drug users
were not counted twice, the estimates were based on mutually exclusive drug user
30 New Zealand Drug Harm Index The New Zealand Police
April 2008
categories. As absenteeism varies by drug type, it seems plausible that excess absenteeism
is determined by the more harmful drug. As such, a poly-drug user was allocated to the
more harmful drug category. For example, where a person uses both cannabis and
methamphetamine, the person was allocated to the stimulant category but not counted in the
cannabis category.
Combining the estimates of hours of sick leave, hourly wages and the number of workers
affected generated the value of drug-related absenteeism by drug type and the total cost of
absenteeism.
5.2.3 Household losses due to premature mortality
This section focuses on the lost population, by gender, who were unemployed or not
engaged in the labour market. It was calculated as the complement to the lost working
population in section 5.2.1.
The second element required to calculate lost household output is the amount and value of
time spent on unpaid activity. The number of hours per person spent on unpaid activities in
the home were based on StatsNZ’s Time Use Survey (2001). This survey found that women
spent an average of 4.8 hours per day on unpaid work and men 2.8 hours per day. Grossed
up to an annual figure, this equates to a woman spending approximately 1,750 hours on
unpaid work and men 1,020 hours. The Time Use Survey is based on a sample of people
inside and outside the labour force. If non-employed people do more unpaid work than
employed people, then these annual estimates would tend to under-estimate household
losses due to premature mortality.
Ratcliffe et al (1996) have examined the value placed on activities in the household. Based
on this research, we conservatively assume that lost output in households was valued at half
the median hourly wage for elementary occupations. The value of an hour of unpaid activity
was assumed to be the same for men and women.
5.2.4 Household losses due to sickness
Household losses due to sickness were calculated in a similar fashion to that in section
5.2.3. This involved determining the number of hours of unpaid work per year lost to
sickness by people using drugs multiplied by the hourly value of these activities.
Inability to do unpaid work due to sickness was assumed to be proportional to inability to do
paid work due to sickness. That is, a worker who is absent due to illness is, on average, off
work for approximately 40.7 percent of their working week. Equivalently, unpaid hours lost
due to sickness were based on 40.7 percent of the time that would usually be spent on
31 New Zealand Drug Harm Index The New Zealand Police
April 2008
unpaid work per week. The calculations also assumed that a similar fraction of
householders and workers were sick per week.
5.2.3The hourly values described in section were applied to the estimated number of unpaid
hours lost to drug-attributable illness.
5.3 Illicit drug production
Single et al (2001) discuss the value that should be placed on inputs diverted from legitimate
uses to illicit drug production. This study takes the view that resources used in drug
production have alternative uses. While drug production arguably delivers benefits to some
communities in New Zealand, this study assumes that resources freed up by lower drug
production would flow to another, equally productive use. It is possible that some resources
are better suited to illicit drug production than to their best alternative. However, this seems
unlikely given the wide range of industries these resources could alternatively be employed
in. Therefore illicit drug production imposes an opportunity cost on society.
Estimating the resource cost of illicit drugs is complicated by limited data on production
levels and inputs. Collins and Lapsley (2002:21) argue “[t]he correct measure of these
resources is the value of consumption rather than the value of production since the latter
fails to take into account imports or exports of the abused substances.” We agree that a
domestic production measure fails to count the resources used to produce imported drugs.
A consumption measure, however, fails to account for domestic production that does not
reach the market. Illicit drugs seized by the authorities are not counted in a consumption
measure but impose a cost by diverting inputs from legitimate purposes. This study
considers consumption plus seized drugs.
In the absence of data on the production cost of illicit drugs in New Zealand, we follow the
approach used by Collins and Lapsley (2002). They value the production cost of a drug as a
fraction of its street price. This assumes that there is a significant risk premium factored into
the price of illicit drugs and that the resource cost of the inputs would be lower in their best
alternative legitimate use. The value of resources diverted is assumed to be five percent of
the street price for all illicit drugs except for cannabis, opioids and methamphetamine
produced from domestically sourced inputs. Cannabis is assumed to have a lower risk
premium so the resource cost is equal to 25 percent of the street value. This approach is
likely to yield a conservative estimate of the value of diverted inputs.
The value of pharmaceuticals diverted for opioid production from domestic inputs was based
on work by Sheerin (2004). Sheerin estimates the cost of diverted morphine sulphate tablets
32 New Zealand Drug Harm Index The New Zealand Police
April 2008
(MSTs) in New Zealand is approximately 6 percent of the street price in the illicit drug
market.33 These figures suggest diverted inputs of $59.99 per gram of opioids on average.
Resources diverted for methamphetamine production allowed for differences in the
production cost of imported and domestically produced methamphetamine. Using the
approach in Collins and Lapsley, the resources diverted to produce one gram of
methamphetamine is $50. This level may be appropriate for imported methamphetamine
given that the cost of precursors and other factors of production in source countries may be
lower than in New Zealand. Therefore, we follow the approach set by Collins and Lapsley
for imported methamphetamine.
Domestically produced methamphetamine is likely to cost much more given the price and
quantity of over-the-counter precursors in New Zealand that are required to produce one
gram of methamphetamine.34,35 Therefore, domestically produced methamphetamine is
valued at the higher cost of $845 per gram.36
Based on Customs seizures data for 2005/06 and advice from the NDIB (personal
communication, 17 March 2008), just under three fifths (57.4 percent) of methamphetamine
consumed in New Zealand is assumed to be imported. Just over a further fifth (22.2
percent) is manufactured domestically from imported inputs and the remainder is
manufactured from diverted domestic inputs (20.4 percent). This gives a weighted average
cost of diverted inputs of $212 per gram of methamphetamine.
5.4 Health care
Health care costs are compiled from several components. The components are:
pharmaceuticals, hospitals and other medical costs such as primary care, ambulances, and,
accident and emergency services. These costs are calculated as gross costs net of
reductions in health care services stemming from drug-related premature mortality.
33 The proportion of imported opioids was calculated from opioid consumption levels and Customs interdictions. The calculations assumed that Customs caught approximately one in five units imported into New Zealand (NDIB personal communication). These calculations suggested about 0.06 percent of consumed opioids are imported. 34 The over-the-counter price for Coldrex was used to estimate the cost to New Zealand. This was $16.90 for a box of 24 tablets containing 30mg of pseudoephedrine. Assuming a yield of two-thirds of methamphetamine can be obtained from one kilo of pseudoephedrine (ESR 2008), this gives a cost of $845 per gram of methamphetamine. 35 This price is slightly higher than the cost that P users report that they normally pay (Wilkins et al 2007). 36 There is considerable uncertainty about what proportion of methamphetamine is manufactured in New Zealand and what proportion is imported. Of the methamphetamine manufactured within New Zealand, it is also unknown what proportion is made using “legal” medicines containing ephedrine and pseudoephedrine. (A range of different processes and inputs are possible for manufacturing methamphetamine.) This study has assumed 25 percent of methamphetamine is domestically produced from diverted legal medicines.
33 New Zealand Drug Harm Index The New Zealand Police
April 2008
5.4.1 Pharmaceuticals
This section concentrates on the pharmaceutical cost of treating major health conditions of
drug users. The estimates in this subsection are for pharmaceuticals only, and do not
include costs of medical consultations, counselling or other therapies. These are included in
other health service use, which is described below.
There is considerable research evidence that legal medicines are diverted for illicit drug
use.37 Legal medicines diverted for illicit drug production are captured in the estimates in
section 5.3 above.
Illicit drug-using population
Estimates of the drug-using population were taken from Wilkins et al (2002, 2007) as
described in section 4.1. In addition to the main illicit drug types, the study includes a
measure of tranquiliser use in 2005/06, described below, to capture pharmaceuticals used to
treat co-morbid depression in drug users.
Licit drug prices
Drug prices are based on the Pharmac schedule of December 2007 to estimate costs of
diverted MSTs, Ritalin and tranquillisers (using Valium as a commonly used drug). These
prices reflect costs to the taxpayer and do not include consumer co-payments. In this study,
the consumers are the illicit drug users, so it would not reflect a value to wider society if
consumer co-payments were included.38 Estimated total expenditure was deflated to 2006
dollar terms for consistency.
Major health conditions of illicit drug users
There is considerable research evidence that illicit drug users have a range of conditions
affecting their mental and physical health, requiring treatment in the health system (e.g. see
Sheerin 2004 for a review of the evidence concerning injecting drug users). This study
estimates costs for three health conditions that are recognised widely as affecting many drug
users: depression, HCV and HIV/AIDS. It should be noted that there are many other
disorders that affect drug users, so these estimates are conservative.
37 Examples include: morphine sulphate tablets that are used for injecting opioids; Ritalin used for injecting stimulants; ephedrine and pseudoephedrine used for manufacturing methamphetamines; and tranquillisers consumed as illicit drugs. 38 If consumer co-payments were to be included, the appropriate co-payment would be $3 per prescription as most regular illicit drug users have high user health cards.
34 New Zealand Drug Harm Index The New Zealand Police
April 2008
Many studies have shown the importance of psychiatric co-morbidity in illicit drug users.
This includes a wide range such as psychosis, anti-social personality disorder, anxiety
disorders, post-traumatic stress disorders and depression. Many of these are sufficiently
serious to require treatment. In this study, the only psychiatric condition included is
depression because it is the most common. Therefore, these estimates are conservative
and provide a “low” estimate of costs of pharmaceutical treatments for psychiatric disorders.
Depression occurs with a range of severity. However, in this study the percentages affected
by depression are as reported by Wilkins et al (2007) for drug users who reported having
suicidal thoughts. This criterion was adopted in order to exclude less severe depression that
may not be formally treated. Estimates of pharmaceutical costs were based on fluoxetine,
which is a first line SSRI (selective serotonin reuptake inhibitor) therapy for depression.
There are estimated to be at least 30,000 people in New Zealand with HCV. HCV is mainly
contracted from sharing of needles and injecting equipment by injecting drug users (IDUs).
Infections are also caused by other means, such as blood transfusions and tattoos, but at
least 85 percent of HCV infections are considered to be caused by sharing needles during
injecting of illicit drugs. In New Zealand, approximately 84 percent of IDUs who have been
injecting for some years have chronic HCV (Sheerin 2004). HCV is a major health problem,
and the sequelae of HCV infection include liver cirrhosis and liver cancer.
The annual costs of pharmaceuticals for HCV treatment are based on a current maximum
estimated treatment capacity in New Zealand of 400 people p.a. This reflects that currently,
combination therapy for HCV is provided through specialist liver clinics in general hospitals.
When one considers that there are approximately 1300 new HCV infections per year, this
limit to numbers who can access treatment means the estimate is lower than if this barrier
were removed, as presently most HCV infections in New Zealand remain untreated.
Estimated pharmaceutical costs are based on Pharmac costs for combination therapy, using
pegylated interferon and ribavirin. No allowance has been made for life long anti-rejection
medication for people who have received liver transplants.
HIV/AIDS has relatively low prevalence in New Zealand, and unlike other countries it is not a
major health problem associated with illicit drugs. The Ministry of Health (2007) report that
most HIV infections are caused by sexual contact and that only 2 percent were caused by
illicit drugs (mainly sharing needles). Here, pharmaceutical costs are based on an estimated
55 people in New Zealand who have HIV/AIDS as a result of drug use. Costs of
pharmaceuticals used in their treatment (Combivir plus efavirenz) are based on a review by
Deeks (2006).
35 New Zealand Drug Harm Index The New Zealand Police
April 2008
5.4.2 Hospitals
Data
Data on relevant publicly-funded hospital discharges was supplied by NZHIS for the six
years from 2001 to 2006. The number of cases in the data-set for this period was a little
under 65,000. For a large number of these, however, only a relatively small proportion was
attributed to illicit drug use, such as cases of low birth-weight. Those selected were cases
where the primary diagnosis was for a condition either wholly or partly attributable to illicit
drug use, as for the mortality data-set (also supplied by NZHIS). The selected diagnosis
codes, from ICD-10-AM, are the current equivalents of those tabulated in Collins and
Lapsley (2002: 92, Table B3), and listed in detail in Appendix Table 18. It should be noted
that some diagnosis codes do not identify precisely the illicit drug concerned. For example,
low birth-weight caused by opiates, and low birth-weight caused by cocaine, have the same
diagnosis code.
Attributable Fractions
The attributable fractions (or aetiological fractions) used were the same as those compiled
for Australia in Ridolfo and Stevenson (2001: 84-92, 94-98), which in turn drew on English et
al (1995). The fractions used for this report are based on the diagnosis codes tabulated in
Appendix Table 18. Usually the fractions are the same for males and females, but they differ
by gender for HIV/AIDS diagnoses. In some instances, for example low birth-weight caused
by opiates or cocaine, it is likely that the New Zealand fractions should be lower than those
used in the Australian calculations. In this instance, the Australian fractions have been
retained pending better New Zealand information.
Case Weights and Cost Multipliers
Each discharge has a case-weight attributed to it, given in the data-set as weighted inlier
equivalent separations (WIES). This broadly shows the relative complexity of the particular
case, relative to the average over all cases. This case-weight can then be applied to the
‘average cost’ (or ‘case-weight multiplier’) for a specified year to give the approximate
treatment cost to the hospital of that case in that year. The case-weight method is likely to
be a conservative estimate of illicit drug-related hospital costs as they were not designed to
capture the total cost of hospital procedures.
Table 5.8 shows case-weight multipliers for medical/surgical inpatient cases, excluding GST,
for recent years. A case-weight multiplier shows the average cost of treating a patient with a
case-weight of one, or multiple thereof.
36 New Zealand Drug Harm Index The New Zealand Police
April 2008
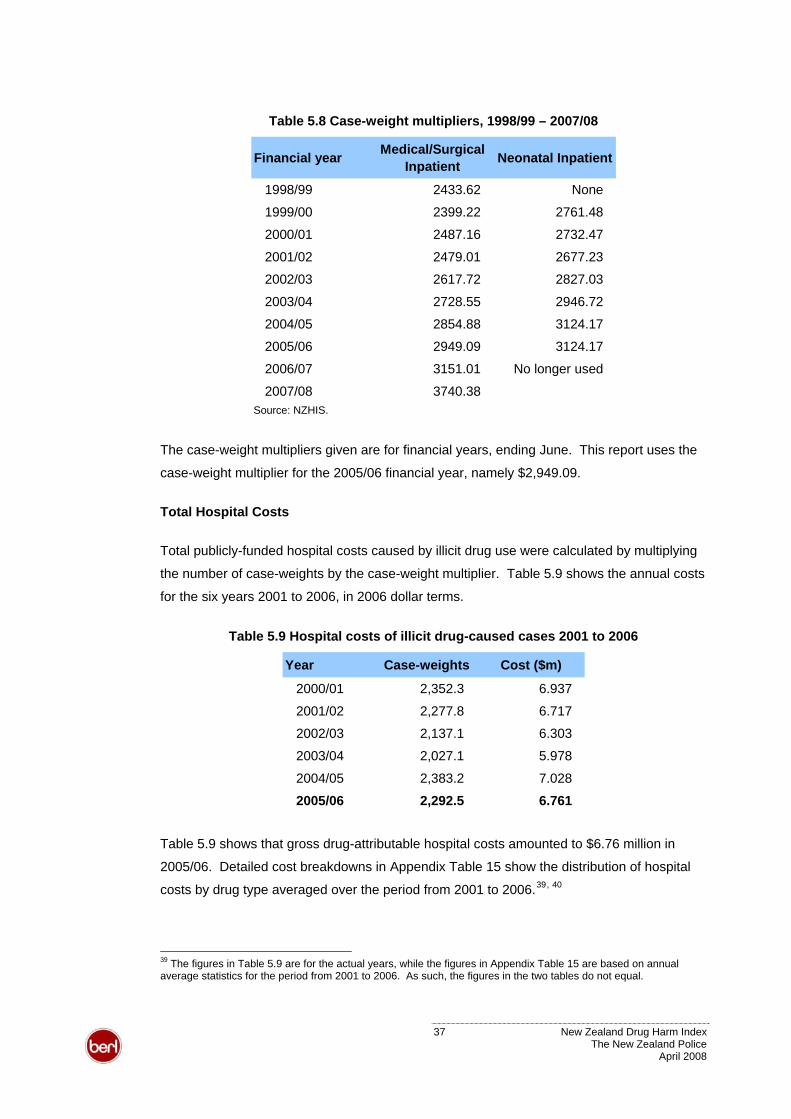
Table 5.8 Case-weight multipliers, 1998/99 – 2007/08
Financial year Medical/Surgical Inpatient Neonatal Inpatient
1998/99 2433.62 None
1999/00 2399.22 2761.48
2000/01 2487.16 2732.47
2001/02 2479.01 2677.23
2002/03 2617.72 2827.03
2003/04 2728.55 2946.72
2004/05 2854.88 3124.17
2005/06 2949.09 3124.17
2006/07 3151.01 No longer used
2007/08 3740.38Source: NZHIS.
The case-weight multipliers given are for financial years, ending June. This report uses the
case-weight multiplier for the 2005/06 financial year, namely $2,949.09.
Total Hospital Costs
Total publicly-funded hospital costs caused by illicit drug use were calculated by multiplying
the number of case-weights by the case-weight multiplier. Table 5.9 shows the annual costs
for the six years 2001 to 2006, in 2006 dollar terms.
Table 5.9 Hospital costs of illicit drug-caused cases 2001 to 2006
Year Case-weights Cost ($m)
2000/01 2,352.3 6.937
2001/02 2,277.8 6.717
2002/03 2,137.1 6.303
2003/04 2,027.1 5.978
2004/05 2,383.2 7.028
2005/06 2,292.5 6.761
Table 5.9 shows that gross drug-attributable hospital costs amounted to $6.76 million in
2005/06. Detailed cost breakdowns in Appendix Table 15 show the distribution of hospital
costs by drug type averaged over the period from 2001 to 2006.39, 40
39 The figures in Table 5.9 are for the actual years, while the figures in Appendix Table 15 are based on annual average statistics for the period from 2001 to 2006. As such, the figures in the two tables do not equal.
37 New Zealand Drug Harm Index The New Zealand Police
April 2008
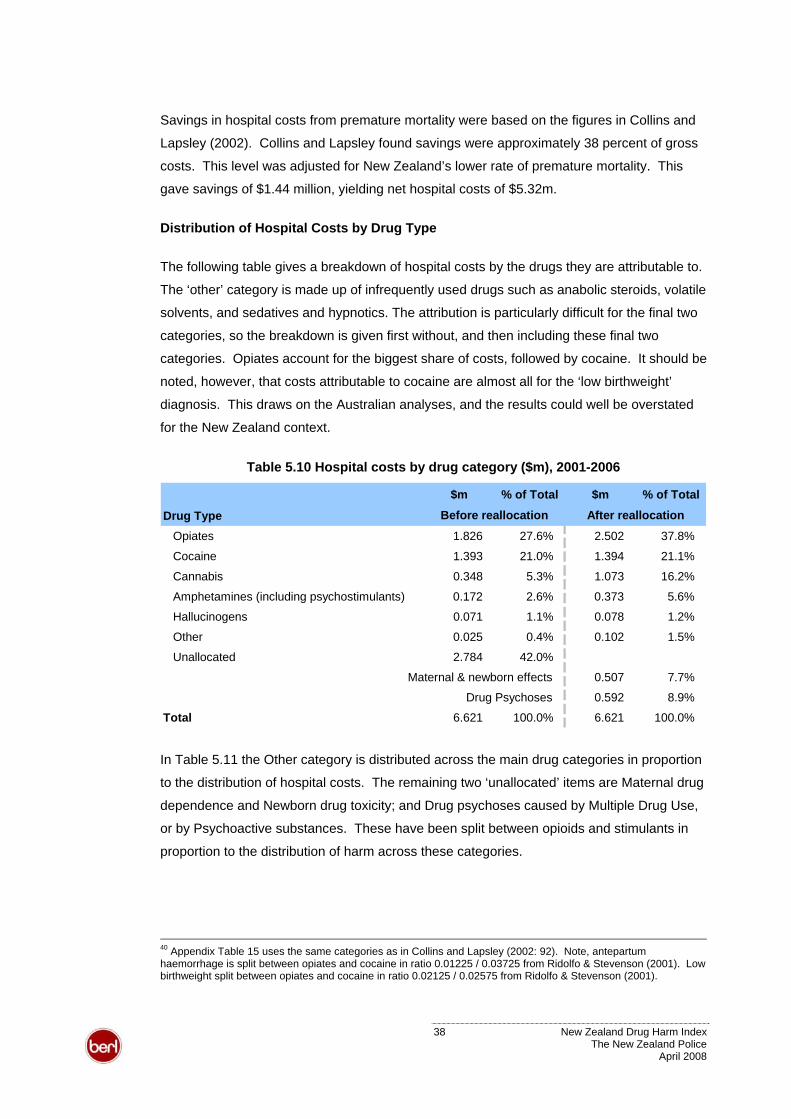
Savings in hospital costs from premature mortality were based on the figures in Collins and
Lapsley (2002). Collins and Lapsley found savings were approximately 38 percent of gross
costs. This level was adjusted for New Zealand’s lower rate of premature mortality. This
gave savings of $1.44 million, yielding net hospital costs of $5.32m.
Distribution of Hospital Costs by Drug Type
The following table gives a breakdown of hospital costs by the drugs they are attributable to.
The ‘other’ category is made up of infrequently used drugs such as anabolic steroids, volatile
solvents, and sedatives and hypnotics. The attribution is particularly difficult for the final two
categories, so the breakdown is given first without, and then including these final two
categories. Opiates account for the biggest share of costs, followed by cocaine. It should be
noted, however, that costs attributable to cocaine are almost all for the ‘low birthweight’
diagnosis. This draws on the Australian analyses, and the results could well be overstated
for the New Zealand context.
Table 5.10 Hospital costs by drug category ($m), 2001-2006
$m % of Total $m % of Total
Drug TypeOpiates 1.826 27.6% 2.502 37.8%
Cocaine 1.393 21.0% 1.394 21.1%
Cannabis 0.348 5.3% 1.073 16.2%
Amphetamines (including psychostimulants) 0.172 2.6% 0.373 5.6%
Hallucinogens 0.071 1.1% 0.078 1.2%
Other 0.025 0.4% 0.102 1.5%
Unallocated 2.784 42.0%
Maternal & newborn effects 0.507 7.7%
Drug Psychoses 0.592 8.9%
Total 6.621 100.0% 6.621 100.0%
After reallocationBefore reallocation
In Table 5.11 the Other category is distributed across the main drug categories in proportion
to the distribution of hospital costs. The remaining two ‘unallocated’ items are Maternal drug
dependence and Newborn drug toxicity; and Drug psychoses caused by Multiple Drug Use,
or by Psychoactive substances. These have been split between opioids and stimulants in
proportion to the distribution of harm across these categories.
40 Appendix Table 15 uses the same categories as in Collins and Lapsley (2002: 92). Note, antepartum haemorrhage is split between opiates and cocaine in ratio 0.01225 / 0.03725 from Ridolfo & Stevenson (2001). Low birthweight split between opiates and cocaine in ratio 0.02125 / 0.02575 from Ridolfo & Stevenson (2001).
38 New Zealand Drug Harm Index The New Zealand Police
April 2008
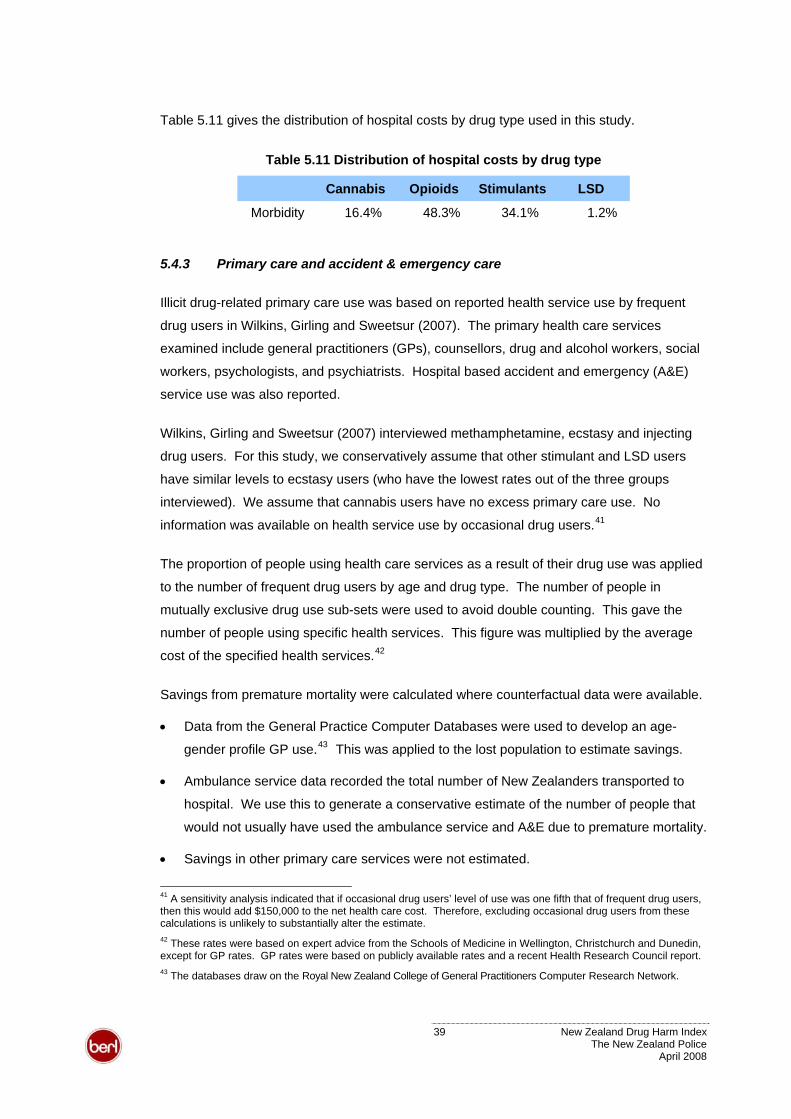
Table 5.11 gives the distribution of hospital costs by drug type used in this study.
Table 5.11 Distribution of hospital costs by drug type
Cannabis Opioids Stimulants LSD
Morbidity 16.4% 48.3% 34.1% 1.2%
5.4.3 Primary care and accident & emergency care
Illicit drug-related primary care use was based on reported health service use by frequent
drug users in Wilkins, Girling and Sweetsur (2007). The primary health care services
examined include general practitioners (GPs), counsellors, drug and alcohol workers, social
workers, psychologists, and psychiatrists. Hospital based accident and emergency (A&E)
service use was also reported.
Wilkins, Girling and Sweetsur (2007) interviewed methamphetamine, ecstasy and injecting
drug users. For this study, we conservatively assume that other stimulant and LSD users
have similar levels to ecstasy users (who have the lowest rates out of the three groups
interviewed). We assume that cannabis users have no excess primary care use. No
information was available on health service use by occasional drug users.41
The proportion of people using health care services as a result of their drug use was applied
to the number of frequent drug users by age and drug type. The number of people in
mutually exclusive drug use sub-sets were used to avoid double counting. This gave the
number of people using specific health services. This figure was multiplied by the average
cost of the specified health services.42
Savings from premature mortality were calculated where counterfactual data were available.
• Data from the General Practice Computer Databases were used to develop an age-
gender profile GP use.43 This was applied to the lost population to estimate savings.
• Ambulance service data recorded the total number of New Zealanders transported to
hospital. We use this to generate a conservative estimate of the number of people that
would not usually have used the ambulance service and A&E due to premature mortality.
• Savings in other primary care services were not estimated.
41 A sensitivity analysis indicated that if occasional drug users’ level of use was one fifth that of frequent drug users, then this would add $150,000 to the net health care cost. Therefore, excluding occasional drug users from these calculations is unlikely to substantially alter the estimate. 42 These rates were based on expert advice from the Schools of Medicine in Wellington, Christchurch and Dunedin, except for GP rates. GP rates were based on publicly available rates and a recent Health Research Council report. 43 The databases draw on the Royal New Zealand College of General Practitioners Computer Research Network.
39 New Zealand Drug Harm Index The New Zealand Police
April 2008
5.4.4 Ambulance services
Estimates of illicit drug-related ambulance service use was based on information provided by
the St John Ambulance Service. The data related specifically to drug-related overdose,
ingestion and poisoning. They do not cover other drug-related callouts such as falls or
violent assaults. Therefore the estimates are likely to under-estimate actual ambulance
service use.
5.5 Road accidents
This section details the methods and data sources used to cost road accident components
that are not explained elsewhere in the report. They include:
• travel delays – Transit New Zealand (TNZ)
• insurance administration – Insurance Council of New Zealand (ICNZ)
• fire/emergency services – New Zealand Fire Service (NZFS).
Other road accident costs were based on Ministry of Transport (2006) research, but are
incorporated in other components of the research, such as health care costs.
5.5.1 Travel delays
Travel delay estimates were based on the Bureau of Transport Economics’ (BTE) study of
road crash costs in Australia (BTE 2000).
The value of travel delays was estimated by multiplying four components:
• average length of time a vehicle is delayed by an accident
• value of time per vehicle
• traffic flow per hour - gives indications of how many vehicles would be involved when
an accident happens
• number of crashes in a particular year.
5.5.2 Insurance
Insurance costs were based on data from ICNZ’s annual report. This covered administration
costs and the number of claims by category, for example, motor, marine, or earthquake.
Total insurance claim costs for the year ending September 2006, according to ICNZ, were
approximately $763 million. Motor vehicle claims were estimated to be almost 50 percent of
40 New Zealand Drug Harm Index The New Zealand Police
April 2008
the total. Administration expenses were assumed to be proportional to motor vehicle claims.
Based on road accident claims accounting for 89 percent of the total motor vehicle claims,
the total cost of road accidents is approximately $312m. Drug-attributable portion of road
accident related insurance costs was based on the number of drug-attributable crashes.
5.5.3 Fire/emergency service
Total operating expenditure (excluding funds) was obtained from the NZFS annual report
2006. The 2006 annual report recorded operating expenditure of $254.2 million, of which 18
percent was related to motor vehicle incidents. 44 These figures gave motor vehicle-related
expenditure of approximately $46m in the 2005/06 financial year.
The annual report also noted that there were 5,211 motor vehicle incidents (excluding fires)
during the financial year 2005/06. Therefore, we calculated the cost per vehicle incident
(excluding fires) at approximately $8,780. The cost of emergency services attending road
accidents was based on the number of drug-attributable crashes.
5.5.4 Intangible costs of road accidents
The Ministry of Transport (2006) study valued loss of life and pain and suffering using a
human capital approach. This approach differs from the prevalence approach here, which
values the loss experienced in a single year. As such, the value placed on a fatality is
scaled to the value of a statistical life year lost, as for other intangible costs estimated in this
study. Equivalently, the dollar values placed on lost quality of life due to severe and minor
accidents are scaled accordingly.
5.6 Intangible costs from loss of life and lost quality of life
Intangible costs result from the pain, suffering and loss of life resulting from the impacts of
drug use. They represent psychological costs. These costs differ from the tangible costs of
lost output as they do not divert society’s productive resources.
Loss of life
This study uses a value of $106,600 per year of life lost due to the premature mortality of
drug users, and drug-related homicides and road accident fatalities. This value is based on
LTNZ’s VOSL of $3.05 million (in 2006 dollars). The VOSL is converted to a single year
estimate using the Pharmac discount rate of 3.5 percent.
44 Neil Challands, Information Analyst, NZFS. Personal communication.
41 New Zealand Drug Harm Index The New Zealand Police
April 2008
The number of people who died in 2006 as a result of their drug use draws on the estimates
in section 4.4. Homicides committed as a result of drug use were estimated in section 5.1.2.
Road accident fatalities in 2005/06 were estimated from Ministry of Transport data on
crashes and casualties where drugs (other than alcohol) were identified as a contributing
factor. The drug types examined in this study were implicated in eight road fatalities during
2005. However, as these records do establish causality. In addition, they only capture
fatalities in the current year rather than the additional population that would have survived to
2005/06 in the absence of illicit drugs. Therefore, the fraction of the estimated additional
population based on drug-attributable road deaths from NZHIS data were used.
Lost quality of life due to crime
The Treasury (2006) report on the costs of crime based intangible costs on the VOSL. The
intangible costs per offence by offence type were scaled so that they are consistent with the
prevalence approach and life year values used in this research. In particular, the cost per
homicide is set at $106,600 and the average intangible cost, for example, of other violent
offences is $244.45 The average intangible cost of property damage and theft, which reflects
the fear and stress induced by such crime, is $22 per offence.
Lost quality of life due to road accidents
The Ministry of Transport (2006) value the pain and suffering resulting from a serious traffic
accident at one tenth of the value of a lost life, that is, $304,700. Pain and suffering from a
minor accident is valued at 0.4 percent, or $12,200. This study applies these proportions to
the value of a statistical life year. These values are used in calculating the intangible costs
of road accidents.
Road accident injuries were also estimated from Ministry of Transport data on crashes where
drugs were a contributing factor. However, as these records do establish causality. In order
to be conservative, the figures were adjusted downwards in proportion to the difference
between Ministry of Transport and NZHIS data on drug-attributable road deaths.
45 The average intangible cost of violent offences borne in a given year covers assaults ranging across threatening behaviour to grievous assault.
42 New Zealand Drug Harm Index The New Zealand Police
April 2008
6 Results
This section summarises the harm generated by drug use in 2005/06 and the estimates of
the harm that can be avoided by drug seizures.
6.1 Harm from drugs consumed in 2005/06
Table 6.1 summarises the resource costs and psychological harm caused by illicit drug
consumption in New Zealand in 2005/06.
Table 6.1 Social costs of illicit drug use ($m), 2005/06
$m Cannabis Opioids Stimulants LSD Total
Tangible costs 425.8 122.4 538.3 5.7 1,092.3
Intangible costs 4.7 203.9 7.4 1.4 217.5
Total social costs 430.5 326.4 545.7 7.1 1,309.8
% of social costs 32.9% 24.9% 41.7% 0.5% 100.0%
Illicit drug use in 2005/06 caused an estimated $1.31 billion of social costs. This was made
up of $1.09 billion of tangible resource costs (0.70 percent of GDP in 2005/06) and $217
million of intangible psychological costs.
Stimulants account for over two fifths of social costs (41.7 percent, $546 million). Cannabis
is responsible for almost one third of the social costs of illicit drug use (32.9 percent, $431
million). Opioids generate almost one quarter of the drug harm (24.9 percent, $326 million).
LSD, and similar hallucinogens, caused $7.1 million (0.5 percent) of harm in 2005/06.
Table 6.2 provides a breakdown of the tangible costs of drug use in 2005/06 according to the
major cost components by drug type. Appendix Table 1 provides further detail.
Table 6.2 Tangible social costs of illicit drug use by drug type ($m), 2005/06
Tangible costs $m Cannabis Opioids Stimulants LSD Total
Illicit drug production 243.2 18.2 257.0 0.2 518.7
Crime n.i.e. 140.6 77.6 191.6 4.0 413.9
Labour costs 33.6 12.5 59.5 0.8 106.4
Health care 7.5 13.8 29.4 0.6 51.4
Road accidents n.i.e. 0.9 0.2 0.8 0.0 2.0
Total tangible costs 425.8 122.4 538.3 5.7 1,092.3
% of tangible costs 39.0% 11.2% 49.3% 0.5% 100.0%
43 New Zealand Drug Harm Index The New Zealand Police
April 2008
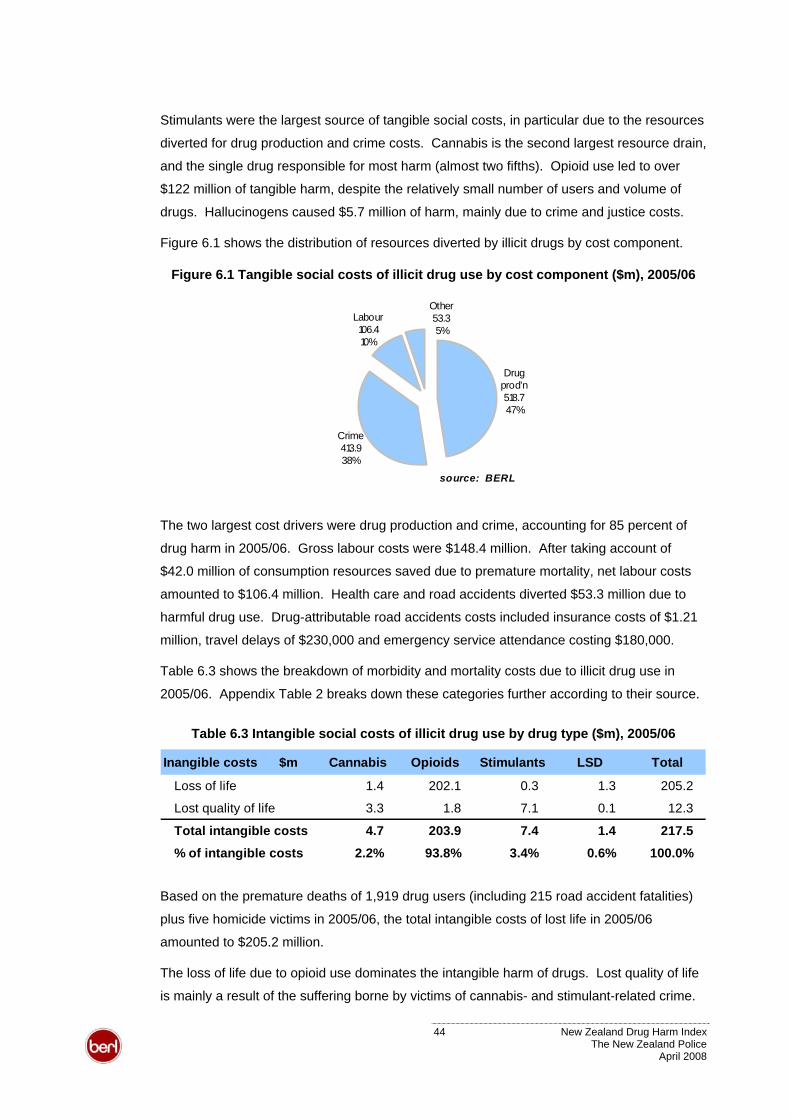
Stimulants were the largest source of tangible social costs, in particular due to the resources
diverted for drug production and crime costs. Cannabis is the second largest resource drain,
and the single drug responsible for most harm (almost two fifths). Opioid use led to over
$122 million of tangible harm, despite the relatively small number of users and volume of
drugs. Hallucinogens caused $5.7 million of harm, mainly due to crime and justice costs.
Figure 6.1 shows the distribution of resources diverted by illicit drugs by cost component.
Figure 6.1 Tangible social costs of illicit drug use by cost component ($m), 2005/06
Drug prod'n518.747%
Crime413.938%
Other53.35%
Labour 106.410%
source: BERL
The two largest cost drivers were drug production and crime, accounting for 85 percent of
drug harm in 2005/06. Gross labour costs were $148.4 million. After taking account of
$42.0 million of consumption resources saved due to premature mortality, net labour costs
amounted to $106.4 million. Health care and road accidents diverted $53.3 million due to
harmful drug use. Drug-attributable road accidents costs included insurance costs of $1.21
million, travel delays of $230,000 and emergency service attendance costing $180,000.
Table 6.3 shows the breakdown of morbidity and mortality costs due to illicit drug use in
2005/06. Appendix Table 2 breaks down these categories further according to their source.
Table 6.3 Intangible social costs of illicit drug use by drug type ($m), 2005/06
Inangible costs $m Cannabis Opioids Stimulants LSD Total
Loss of life 1.4 202.1 0.3 1.3 205.2
Lost quality of life 3.3 1.8 7.1 0.1 12.3
Total intangible costs 4.7 203.9 7.4 1.4 217.5
% of intangible costs 2.2% 93.8% 3.4% 0.6% 100.0%
Based on the premature deaths of 1,919 drug users (including 215 road accident fatalities)
plus five homicide victims in 2005/06, the total intangible costs of lost life in 2005/06
amounted to $205.2 million.
The loss of life due to opioid use dominates the intangible harm of drugs. Lost quality of life
is mainly a result of the suffering borne by victims of cannabis- and stimulant-related crime.
44 New Zealand Drug Harm Index The New Zealand Police
April 2008
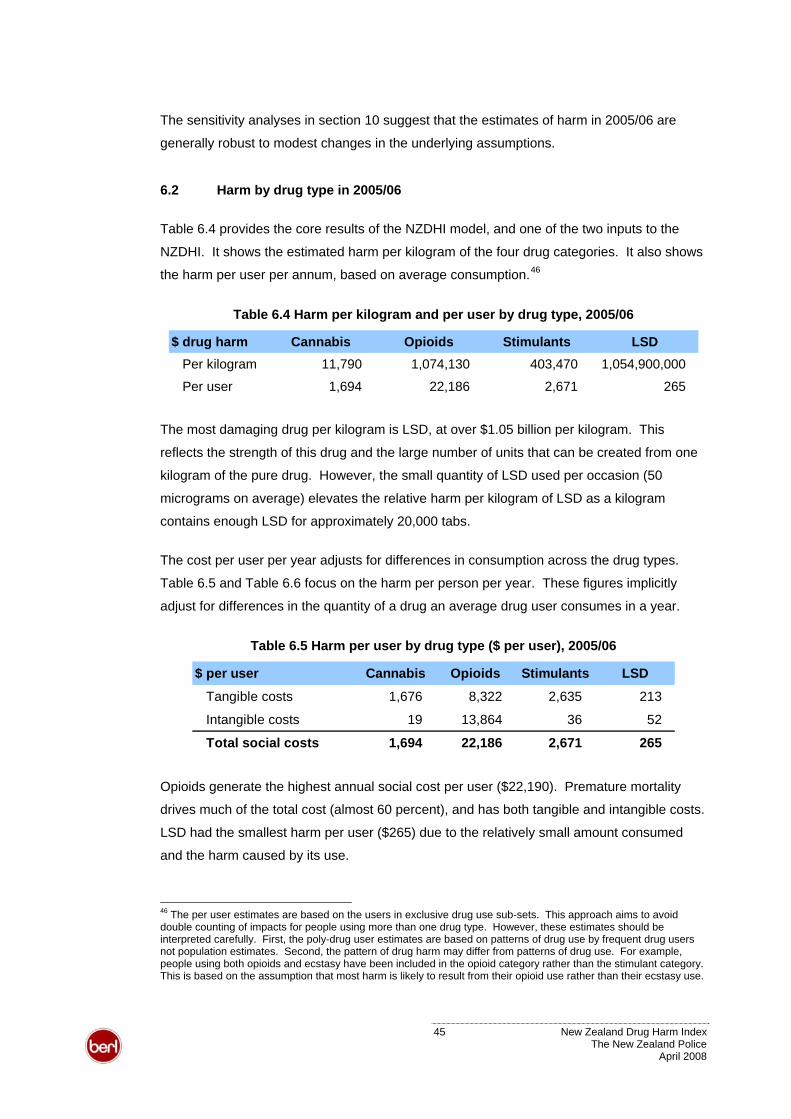
The sensitivity analyses in section 10 suggest that the estimates of harm in 2005/06 are
generally robust to modest changes in the underlying assumptions.
6.2 Harm by drug type in 2005/06
Table 6.4 provides the core results of the NZDHI model, and one of the two inputs to the
NZDHI. It shows the estimated harm per kilogram of the four drug categories. It also shows
the harm per user per annum, based on average consumption.46
Table 6.4 Harm per kilogram and per user by drug type, 2005/06
$ drug harm Cannabis Opioids Stimulants LSDPer kilogram 11,790 1,074,130 403,470 1,054,900,000
Per user 1,694 22,186 2,671 265
The most damaging drug per kilogram is LSD, at over $1.05 billion per kilogram. This
reflects the strength of this drug and the large number of units that can be created from one
kilogram of the pure drug. However, the small quantity of LSD used per occasion (50
micrograms on average) elevates the relative harm per kilogram of LSD as a kilogram
contains enough LSD for approximately 20,000 tabs.
The cost per user per year adjusts for differences in consumption across the drug types.
Table 6.5 and Table 6.6 focus on the harm per person per year. These figures implicitly
adjust for differences in the quantity of a drug an average drug user consumes in a year.
Table 6.5 Harm per user by drug type ($ per user), 2005/06
$ per user Cannabis Opioids Stimulants LSD
Tangible costs 1,676 8,322 2,635 213
Intangible costs 19 13,864 36 52
Total social costs 1,694 22,186 2,671 265
Opioids generate the highest annual social cost per user ($22,190). Premature mortality
drives much of the total cost (almost 60 percent), and has both tangible and intangible costs.
LSD had the smallest harm per user ($265) due to the relatively small amount consumed
and the harm caused by its use.
46 The per user estimates are based on the users in exclusive drug use sub-sets. This approach aims to avoid double counting of impacts for people using more than one drug type. However, these estimates should be interpreted carefully. First, the poly-drug user estimates are based on patterns of drug use by frequent drug users not population estimates. Second, the pattern of drug harm may differ from patterns of drug use. For example, people using both opioids and ecstasy have been included in the opioid category rather than the stimulant category. This is based on the assumption that most harm is likely to result from their opioid use rather than their ecstasy use.
45 New Zealand Drug Harm Index The New Zealand Police
April 2008
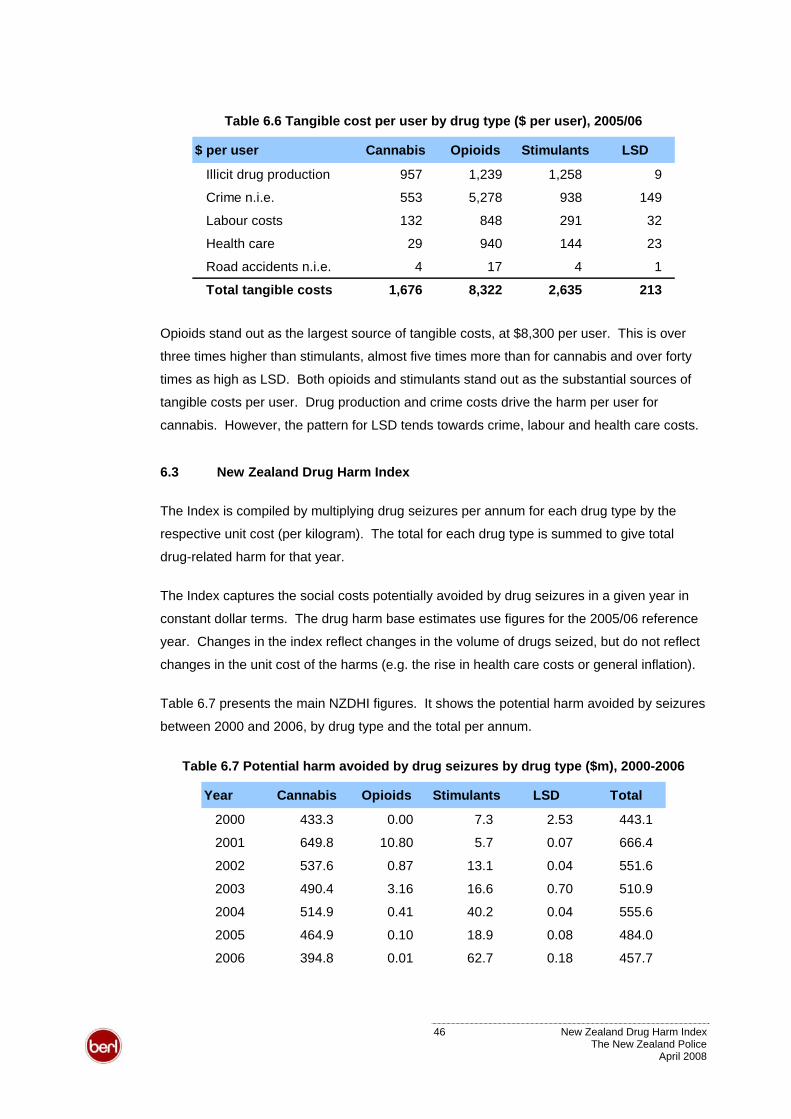
Table 6.6 Tangible cost per user by drug type ($ per user), 2005/06
$ per user Cannabis Opioids Stimulants LSD
Illicit drug production 957 1,239 1,258 9
Crime n.i.e. 553 5,278 938 149
Labour costs 132 848 291 32
Health care 29 940 144 23
Road accidents n.i.e. 4 17 4 1
Total tangible costs 1,676 8,322 2,635 213
Opioids stand out as the largest source of tangible costs, at $8,300 per user. This is over
three times higher than stimulants, almost five times more than for cannabis and over forty
times as high as LSD. Both opioids and stimulants stand out as the substantial sources of
tangible costs per user. Drug production and crime costs drive the harm per user for
cannabis. However, the pattern for LSD tends towards crime, labour and health care costs.
6.3 New Zealand Drug Harm Index
The Index is compiled by multiplying drug seizures per annum for each drug type by the
respective unit cost (per kilogram). The total for each drug type is summed to give total
drug-related harm for that year.
The Index captures the social costs potentially avoided by drug seizures in a given year in
constant dollar terms. The drug harm base estimates use figures for the 2005/06 reference
year. Changes in the index reflect changes in the volume of drugs seized, but do not reflect
changes in the unit cost of the harms (e.g. the rise in health care costs or general inflation).
Table 6.7 presents the main NZDHI figures. It shows the potential harm avoided by seizures
between 2000 and 2006, by drug type and the total per annum.
Table 6.7 Potential harm avoided by drug seizures by drug type ($m), 2000-2006
Year Cannabis Opioids Stimulants LSD Total
2000 433.3 0.00 7.3 2.53 443.1
2001 649.8 10.80 5.7 0.07 666.4
2002 537.6 0.87 13.1 0.04 551.6
2003 490.4 3.16 16.6 0.70 510.9
2004 514.9 0.41 40.2 0.04 555.6
2005 464.9 0.10 18.9 0.08 484.0
2006 394.8 0.01 62.7 0.18 457.7
46 New Zealand Drug Harm Index The New Zealand Police
April 2008
Figure 6.2 presents the NZDHI. It uses the total figures in Table 6.7 to show the pattern of
potential drug harm avoided from 2000 to 2006.
Figure 6.2 New Zealand Drug Harm Index (base year = 2005/06)
0
100
200
300
400
500
600
700
2000 2001 2002 2003 2004 2005 2006
2006 NZ$M
source: BERL
The NZDHI shows that drug seizures could have conservatively saved New Zealand from
almost $458 million of drug harm in 2006. Over the seven years of 2000 to 2006, the
reduction in illicit drug supply from seizures had the potential to save $3.67 billion of harm.
The NZDHI concentrates on the potential harm avoided by drug seizures. Changes between
years do not necessarily mirror changes in actual harm, which depends on consumption.
For example, while seizures may rise (increasing the NZDHI), if the volume of drugs
reaching consumers also rises then actual drug harm is likely to rise. It is likely, though not
necessary, that were these drugs to have reached consumers, however, that drug harm
would have been greater.
6.3.1 NZDHI sub-indices
The NZDHI is composed of the total potential harm avoided by seizures of the underlying
drug categories. Figure 6.3 and Figure 6.4 break down the NZDHI into the separate drug
categories that contribute to it.
Overall, the Index is driven by cannabis seizures due to the sheer volume of cannabis
seized. The NZP and Customs collectively seized just over 33,480 kilograms in 2006 and
just under 295,590 kilograms over the seven year period of 2000 to 2006.
47 New Zealand Drug Harm Index The New Zealand Police
April 2008
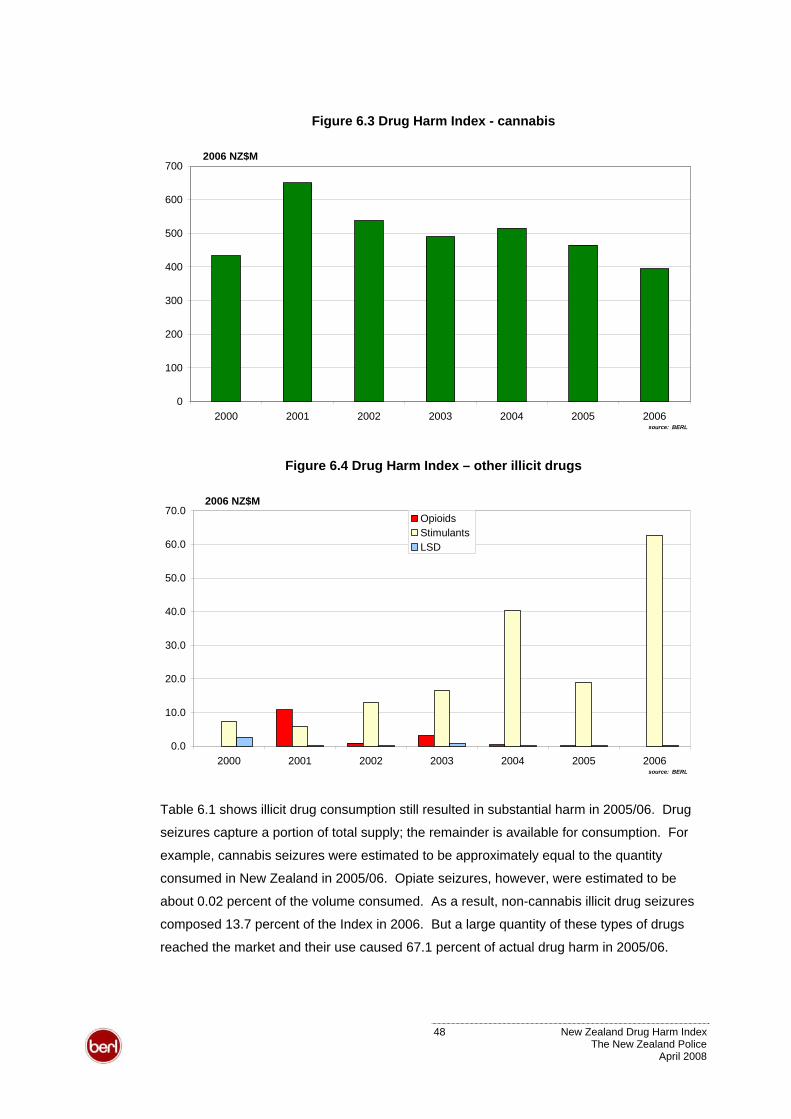
Figure 6.3 Drug Harm Index - cannabis
0
100
200
300
400
500
600
700
2000 2001 2002 2003 2004 2005 2006
2006 NZ$M
source: BERL
Figure 6.4 Drug Harm Index – other illicit drugs
0.0
10.0
20.0
30.0
40.0
50.0
60.0
70.0
2000 2001 2002 2003 2004 2005 2006
2006 NZ$MOpioidsStimulants LSD
source: BERL
Table 6.1 shows illicit drug consumption still resulted in substantial harm in 2005/06. Drug
seizures capture a portion of total supply; the remainder is available for consumption. For
example, cannabis seizures were estimated to be approximately equal to the quantity
consumed in New Zealand in 2005/06. Opiate seizures, however, were estimated to be
about 0.02 percent of the volume consumed. As a result, non-cannabis illicit drug seizures
composed 13.7 percent of the Index in 2006. But a large quantity of these types of drugs
reached the market and their use caused 67.1 percent of actual drug harm in 2005/06.
48 New Zealand Drug Harm Index The New Zealand Police
April 2008
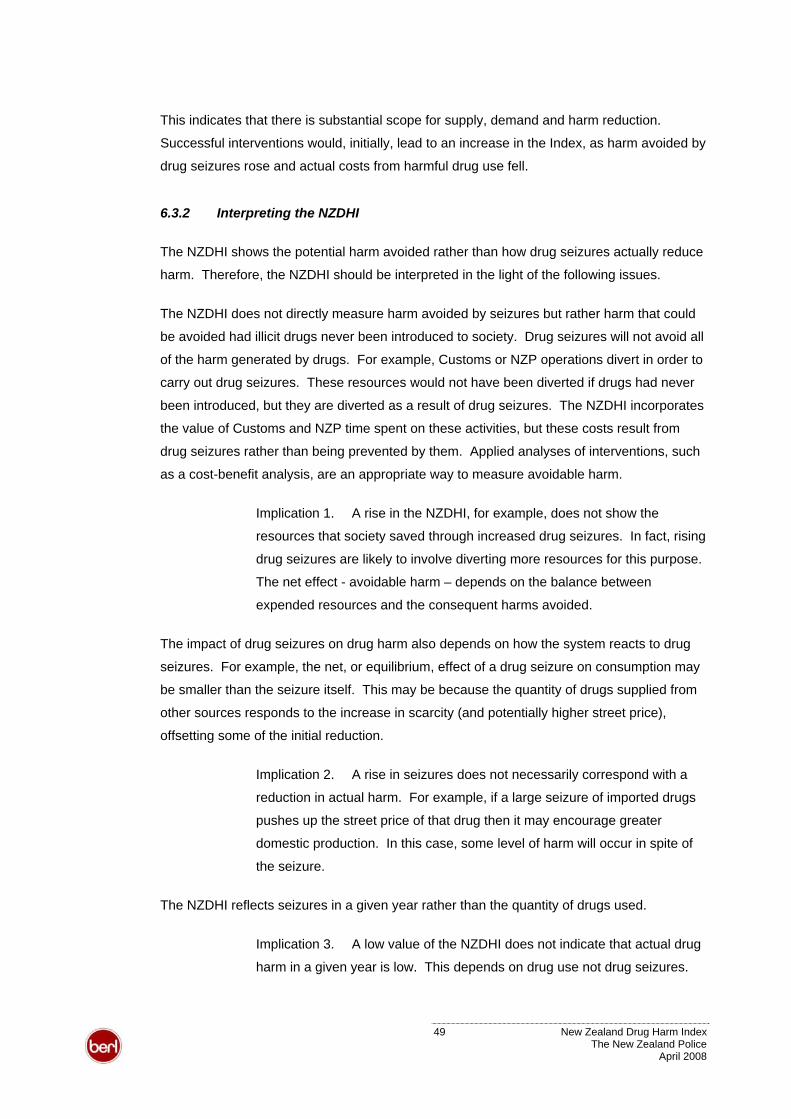
This indicates that there is substantial scope for supply, demand and harm reduction.
Successful interventions would, initially, lead to an increase in the Index, as harm avoided by
drug seizures rose and actual costs from harmful drug use fell.
6.3.2 Interpreting the NZDHI
The NZDHI shows the potential harm avoided rather than how drug seizures actually reduce
harm. Therefore, the NZDHI should be interpreted in the light of the following issues.
The NZDHI does not directly measure harm avoided by seizures but rather harm that could
be avoided had illicit drugs never been introduced to society. Drug seizures will not avoid all
of the harm generated by drugs. For example, Customs or NZP operations divert in order to
carry out drug seizures. These resources would not have been diverted if drugs had never
been introduced, but they are diverted as a result of drug seizures. The NZDHI incorporates
the value of Customs and NZP time spent on these activities, but these costs result from
drug seizures rather than being prevented by them. Applied analyses of interventions, such
as a cost-benefit analysis, are an appropriate way to measure avoidable harm.
Implication 1. A rise in the NZDHI, for example, does not show the
resources that society saved through increased drug seizures. In fact, rising
drug seizures are likely to involve diverting more resources for this purpose.
The net effect - avoidable harm – depends on the balance between
expended resources and the consequent harms avoided.
The impact of drug seizures on drug harm also depends on how the system reacts to drug
seizures. For example, the net, or equilibrium, effect of a drug seizure on consumption may
be smaller than the seizure itself. This may be because the quantity of drugs supplied from
other sources responds to the increase in scarcity (and potentially higher street price),
offsetting some of the initial reduction.
Implication 2. A rise in seizures does not necessarily correspond with a
reduction in actual harm. For example, if a large seizure of imported drugs
pushes up the street price of that drug then it may encourage greater
domestic production. In this case, some level of harm will occur in spite of
the seizure.
The NZDHI reflects seizures in a given year rather than the quantity of drugs used.
Implication 3. A low value of the NZDHI does not indicate that actual drug
harm in a given year is low. This depends on drug use not drug seizures.
49 New Zealand Drug Harm Index The New Zealand Police
April 2008
As noted above, while the two are connected, the relationship requires
further examination.
Implication 4. Equivalently, a fall in the NZDHI does not necessarily
indicate that drug consumption, and therefore harm, is rising. For example,
an interdiction programme targeting a particular drug may effectively reduce
supply and consumption over time. This success would appear as a fall in
the relevant drug sub-index and would pull the overall NZDHI down.
6.4 Comparison with the Australian DHI
This section compares the NZDHI with the Australian DHI. Methodological differences mean
the indices are not directly comparable. To facilitate comparison, this section recalculates
the NZDHI estimates so that the two indices have, as far as possible, a common basis.
6.4.1 Drug use prevalence
New Zealand has lower drug use prevalence than Australia for all drug types except ecstasy.
47Table 6.8 New Zealand and Australian illicit drug use prevalence by age group
New Zealand
Illicit drug 15-45 y.o. 15-45 y.o. 14 y.o.+Cannabis 17.9% 24.2% 33.7%
Opioids 0.2%-0.4% 1.0% 1.5%
Cocaine 1.1% 1.8% 2.6%
Amphetamines (excl CM and MDMA) 3.4% 5.0% 7.0%
Crystal methamphetamine (CM) 0.8% n.a. n.a.
Ecstasy (MDMA) 3.9% 3.2% 4.5%
LSD 1.8% 4.0% 5.7%
Australia
There are also differences in reported drug purity levels across the countries. For example,
“most powder methamphetamine available in New Zealand is of 60-80%... [which] are
considerably higher than the 20-30% purity levels typically seen in Australia” (NDIB 2007c:
73). These differences have not been explicitly accounted for here. However, they are likely
to explain some of the observed differences.
47 This table is based on the 2006 figures for New Zealand (Wilkins et al 2006) and 1998 Australian figures reported in McFadden 2006 (based on AIHW 2000). For comparability we have estimated the Australian 15-45 year old prevalence rates, as well as the rates for all people aged 14 years old and over as reported in AIHW (2000).
50 New Zealand Drug Harm Index The New Zealand Police
April 2008
6.4.2 Methodological differences
The New Zealand and Australian DHIs are constructed and reported differently. This study
did not estimate nursing home expenditure resulting from illicit drug consumption.48 It
extends the Australian study by including:
• drug interdiction expenditure by Customs as a crime cost
• community sentences expenditure by Corrections as a crime cost
• private expenditure related to the prevention of crime as a crime cost
• lost output of crime victims as a labour cost
• homicide as an intangible cost
• crime related pain and suffering as an intangible cost.
In addition, this study uses crime multipliers to estimate total criminal offences, whereas the
Australian approach used recorded crime only. This study also bases the intangible cost of
life lost on a New Zealand VOSL.
To facilitate comparison, this section removes the additional components in the New Zealand
study. It uses actual criminal offences, and uses the Australian life year value. As such, the
New Zealand and Australian figures cover the same areas bar nursing home expenditure.
Lost output of prisoners is reallocated within the overall tangible cost group from labour to
crime, to match the Australian categories.
The comparisons below, however, do not allow for substantial differences in average wage
and cost levels. For example, the average Australian wage is approximately 20 percent
higher than the New Zealand equivalent. This would have the effect of making Australian
labour costs substantially higher than the New Zealand equivalent.
Table 6.9 compares the adjusted 2005/06 figures for New Zealand with the 1998 figures for
Australia. All figures are reported in comparable terms (2006 NZ$). Appendix Table 16 and
Appendix Table 17 provide fuller breakdowns of these summaries.
48 This component was excluded due to limited data and the expected small contribution to overall drug harm.
To give an indication of the magnitude of illicit drug-related nursing home expenditure in New Zealand, the Australian estimate could be reduced to 13.6 percent to allow for differences in population size and drug use prevalence. This would assume behaviour, harm and nursing home use is otherwise the same in both countries. This conversion gives net nursing home expenditure of -$3.2 million in 2006 New Zealand dollar terms.
The negative figure indicates that the savings from premature death outweigh the additional nursing home expenditure resulting from illicit drug consumption. While sizable, this estimate is not large in the context of the other estimated harms. Its exclusion is unlikely to significantly affect the comparisons drawn in this section.
51 New Zealand Drug Harm Index The New Zealand Police
April 2008
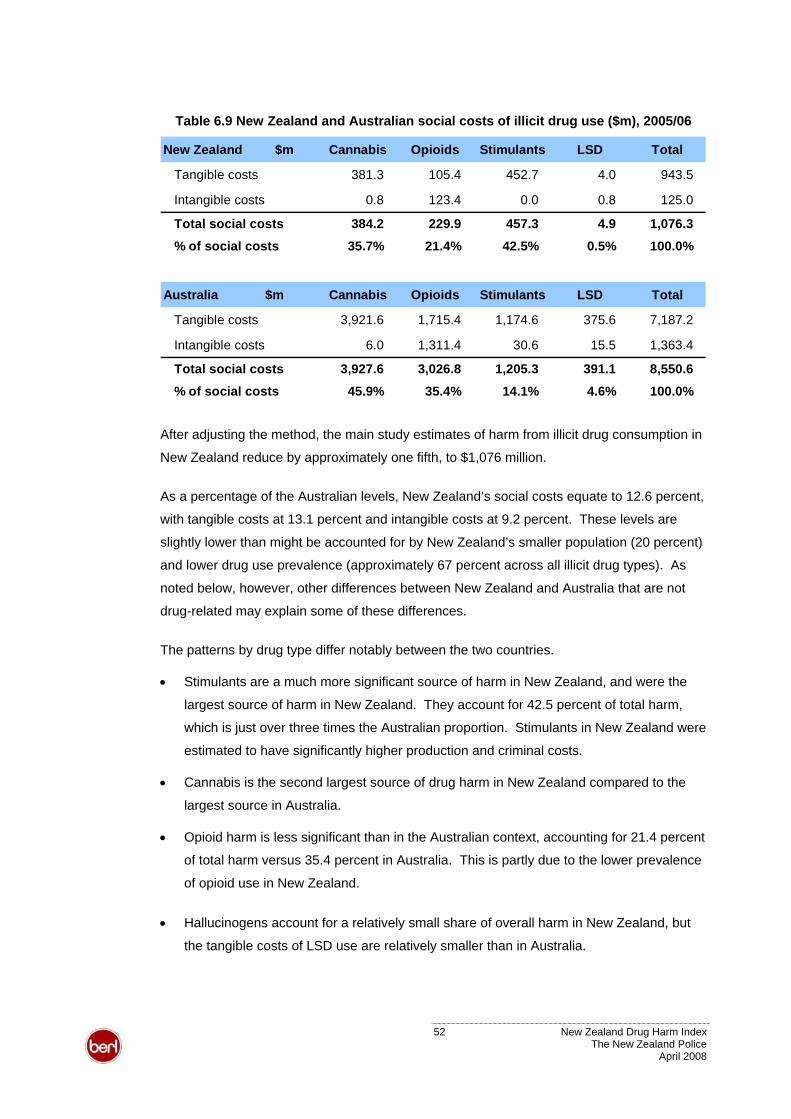
Table 6.9 New Zealand and Australian social costs of illicit drug use ($m), 2005/06
New Zealand $m Cannabis Opioids Stimulants LSD Total
Tangible costs 381.3 105.4 452.7 4.0 943.5
Intangible costs 0.8 123.4 0.0 0.8 125.0
Total social costs 384.2 229.9 457.3 4.9 1,076.3
% of social costs 35.7% 21.4% 42.5% 0.5% 100.0%
Australia $m Cannabis Opioids Stimulants LSD Total
Tangible costs 3,921.6 1,715.4 1,174.6 375.6 7,187.2
Intangible costs 6.0 1,311.4 30.6 15.5 1,363.4
Total social costs 3,927.6 3,026.8 1,205.3 391.1 8,550.6
% of social costs 45.9% 35.4% 14.1% 4.6% 100.0%
After adjusting the method, the main study estimates of harm from illicit drug consumption in
New Zealand reduce by approximately one fifth, to $1,076 million.
As a percentage of the Australian levels, New Zealand’s social costs equate to 12.6 percent,
with tangible costs at 13.1 percent and intangible costs at 9.2 percent. These levels are
slightly lower than might be accounted for by New Zealand’s smaller population (20 percent)
and lower drug use prevalence (approximately 67 percent across all illicit drug types). As
noted below, however, other differences between New Zealand and Australia that are not
drug-related may explain some of these differences.
The patterns by drug type differ notably between the two countries.
• Stimulants are a much more significant source of harm in New Zealand, and were the
largest source of harm in New Zealand. They account for 42.5 percent of total harm,
which is just over three times the Australian proportion. Stimulants in New Zealand were
estimated to have significantly higher production and criminal costs.
• Cannabis is the second largest source of drug harm in New Zealand compared to the
largest source in Australia.
• Opioid harm is less significant than in the Australian context, accounting for 21.4 percent
of total harm versus 35.4 percent in Australia. This is partly due to the lower prevalence
of opioid use in New Zealand.
• Hallucinogens account for a relatively small share of overall harm in New Zealand, but
the tangible costs of LSD use are relatively smaller than in Australia.
52 New Zealand Drug Harm Index The New Zealand Police
April 2008
Aggregate costs may be expected to differ for a number of reasons. For example, with
respect to crime costs, a recent report to the Minister of Justice noted that New Zealand has
the highest rate of imprisonment among western countries apart from the United States. In
relation to labour costs, the Australian estimates may be higher due to wage differences.
For example, the median wage in Australia is approximately 20 percent higher than in New
Zealand. Other things equal, this means lost output in New Zealand would be lower.
It is not possible to calculate costs per user as Australian exclusive user figures were not
available. Dividing aggregate costs by total users would result in double counting due to
poly-drug use. That is, the actual number of people is less than the number of users in each
drug category as some people use more than one drug type. The effect of this double
counting would be to make the per user figures lower than is actually the case.
6.5 Applications, issues and updates
The NZDHI provides a standardised measure of the social harm that can be avoided by
reducing illicit drug consumption in New Zealand. As a consumption-based measure, it can
be applied to a wide range of interventions that aim to reduce supply or demand.
Drug seizures have a high media profile. For example, three major Australasian seizures
were reported while preparing this report alone. Yet the reported values fail to accurately
capture the impact of these drugs as they are based on street prices, not social harm.
• One article reported on a hydroponic cannabis growing operation in Wellington that
could produce an annual crop of 18 cannabis plants (Stuff 23 Feb 2008). This would
have a conservative yield of almost 4.1 kilograms of cannabis and a street value of
$54,500. Based on the NZDHI model, if this cannabis reached the market it could have
caused drug harm of just over $48,200.
• A joint operation between the NZP and Customs seized methamphetamine and
precursors in Tauranga (Stuff 13 March 2008). The 32 kilograms of methamphetamine
would be worth $35 million on the street, while the 127 kilograms of ContacNT could
produce approximately 30 kilograms of methamphetamine with a street value of $15
million. The NZDHI model suggests these two seizures could prevent approximately
$12.9 million and $12.1 million of drug harm each.
• Australian authorities seized 250 kilograms of cocaine with a street value of NZ$100.7m
(Sydney Morning Herald 13 March 2008). The NZDHI shows that if such a quantity of
stimulants were to reach New Zealand consumers, it would cause just under $100.9
million of crime, health and other drug harm.
53 New Zealand Drug Harm Index The New Zealand Police
April 2008
The NZDHI metric uses consistent, real value terms so future drug seizures can be readily
compared across time. This will allow New Zealand authorities to track their progress over
time and to monitor the impact of interdiction and harm reduction strategies.
The NZDHI model draws data from a low level to develop aggregate estimates. This fine
level of information can contribute to cost-benefit analysis of specific interventions, such as
initiatives that aim to reduce drug offences or drug-related crime.
For example, the crime component of NZDHI model measures resources diverted for
Customs and NZP drug enforcement. The detailed information in this component could be
used to examine the cost-effectiveness of drug intervention programmes. Equivalently, this
component separately enumerates resources used to police drug offences versus other
drug-related crime. These data could be used in a cost-benefit analysis of drug enforcement
and to provide a measure of avoidable harm.
6.5.1 Issues in future applications of the harm estimates
The harms estimated in this study are based on drug consumption in 2005/06 and the
cumulative effects of past consumption that manifest in that year. Future applications of the
harm estimates should consider the following issues.
• The harm avoided by drug seizures in the future will be affected by both drug purity and
prevalence of consumption of specific drugs. Changes in drug purity are likely to affect
the level of drug harm resulting from the consumption of a kilogram of that drug.
• Changes in the level of drug use or mix of drugs consumed will affect the harms that
would have resulted from a given quantity of drugs reaching the market.
• Drug harm and the costs that may be avoided by preventing consumption differ. Collins
and Lapsley (2002: x) note,
a significant proportion of abuse costs are not preventable. Some costs will continue to be
borne because of previous events or previously contracted illnesses, while other costs will
continue to be incurred because some level of drug abuse is likely to remain.
Over time, changes in drug enforcement, and the personal impacts and social consequences
of drug use will alter the composition of harms and the resources diverted by drug use.
Therefore, it will be appropriate to revisit the base harm estimates in the future to verify how
robustly they measure drug harm at that point in time.
54 New Zealand Drug Harm Index The New Zealand Police
April 2008
6.5.2 Updates and future research
The NZDHI can be readily updated and extended as additional time series data on drug
seizures becomes available.
The base estimates will best reflect the harmful impact of drug use in the near term, but
should be re-evaluated as time passes and behaviours change. Rebasing the drug harm
estimates will be a larger task. It will have to repeat much of the work done by this study to
re-calculate the base harm estimates from the NZDHI model. For example, the 2005/06
harm per kilogram estimates are based on 2006 surveys of drug use. Changing patterns of
drug use will change the pattern of drug harm. Future updates should seek to incorporate
newer and more detailed information on drug use prevalence. One potential source is
updates of drug prevalence rates planned by SHORE using their CATI lab.
Future research should also consider validating the assumptions used in this study or, where
possible, replacing them with appropriate research-based behavioural estimates. Key areas
for such work include:
• detailed breakdowns on the volume of drugs used by user and drug type
• the prevalence and intensity of drug use by age, sex and drug type
• the resources used in drug production in New Zealand and the fraction of New Zealand’s
drug supply that are imported and the resource cost of imported drugs
• actual criminal offences by offence type, the fraction of offences attributable to drug use
and the distribution of drug type
• labour and consumption patterns of people who do and do not use drugs
• attributable fractions of drug-related death and disease in New Zealand, including
information on illicit drug usage rates in earlier years and the consequences for
premature mortality
• a value of life statistic specific to drug-related harm.
Extensions to the current study could include researching avoidable drug harm and
economic analysis of the net impact specific interventions on drug harm.
55 New Zealand Drug Harm Index The New Zealand Police
April 2008
7 Glossary
Abbreviation Description
A&E Accident and emergencyAMS New Zealand Police’s Activity Monitoring SystemBZPs BenzylpiperazinesDHI Drug Harm IndexDUCO Drug Use Careers of Offenders survey, Australian Institute of CriminologyGDP Gross Domestic ProductGP General practitionerHBV Hepatitis B virusHCV Hepatitis C virusHIV/AIDS Human immunodeficiency virus/ acquired immunodeficiency syndromeIDMS Illicit Drug Monitoring SystemIDUs Injecting drug usersLSD Lysergic acid diethylamideMDMA Methylenedioxy-methamphetamineMSTs Morphine sulphate tabletsNZ-ADAM New Zealand Arrestee Drug Abuse MonitoringNZDHI New Zealand Drug Harm IndexSSRI Selective serotonin reuptake inhibitorVOSL Value of Statistical LifeWIES Weighted inlier equivalent separations
BERL Business and Economic Research LtdBTE Bureau of Transport EconomicsESR Institute of Environmental Science and Research LimitedHOI Health Outcomes International LtdICNZ Insurance Council of New ZealandLTNZ Land Transport New ZealandNDIB National Drug Intelligence BureauNZFS New Zealand Fire ServiceNZHIS New Zealand Health Information ServiceNZP New Zealand PoliceSHORE Centre for Social and Health Outcomes Research and EvaluationStatsNZ Statistics New ZealandTNZ Transit New Zealand
Organisations
56 New Zealand Drug Harm Index The New Zealand Police
April 2008
8 References
Anonymous author. Secrets of methamphetamine manufacture. 3rd edition. Accessed
January 2008. www.homemadedrugs.net.
Australian Federal Police (2004) Research Note 5: AFP Drug Harm Index. AFP Research
Note Series.
Australian Institute of Health and Welfare (2000) 1998 National Drug Strategy Household
Survey.
Australian Institute of Health and Welfare (2005) Statistics on Drug Use in Australia 2004.
BERL (2007) Fiscal impacts of immigration 2005/06 (project reference #4497).
Brand and Price (2005) The economic and social costs of crime. UK Home Office.
Bureau of Transport Economics (2000) Road Crash Costs in Australia. BTE Report 102.
Bureau of Transport Economics (2007) Road Crash Cost Estimation - A Proposal
Incorporating a Decade of Conceptual and Empirical Developments.
Carcach and McDonald (1997) National Police Custody Survey 1995.
Choi et al (1997) Estimating the Economic Costs of the Abuse of Tobacco, Alcohol and Illicit
Drugs - A Review of Methodologies and Canadian Data Sources.
Collins and Lapsley (1996) The social costs of drug abuse in Australia in 1988 and 1992.
Collins D and Lapsley H (2002) Counting the cost - estimates of the social costs of drug
abuse in Australia in 1998-9.
Collins D and Lapsley H (2008). The costs of tobacco, alcohol and illicit drug abuse to
Australian society in 2004/05. Commonwealth Department of Health and Ageing.
Crofts, N, Dore G, Locarnini S (eds) (2001) Hepatitis C: An Australian perspective.
Melbourne: IP Communications.
Darke et al (2000) Illicit drug use in Australia - epidemiology, use patterns and associated
harm.
Deeks S (2006) Antiretroviral treatment of HIV infected adults. British Medical Journal 332:
1489-1493. bmj.com/cgi/content/full/332/7556/1489.
Department of Corrections (2004) Census of Prison Inmates and Home Detainees.
Department of Corrections (2007) Annual report 2007 - section B financial statements.
Drummond M, Stoddart G and Torrance G (1994) Methods for the economic evaluation of
health care programmes. Oxford Medical Publications.
57 New Zealand Drug Harm Index The New Zealand Police
April 2008
Dubourg R, Hamed J and Thorns J (2005) The economic and social costs of crime against
individuals and households 2003-04- UK Home Office Online Report 30-05.
Easton B (1997). The social costs of tobacco use and alcohol misuse. University of Otago.
English D, Holman C, Milne E et al (1995) The quantification of drug caused morbidity and
mortality in Australia. 1995 edition. Canberra: Commonwealth Department of Human
Services and Health.
Field A and Casswell S (1999) Drug use in New Zealand: National Survey 1998. Alcohol
and Public Health Research Unit, University of Auckland.
Fielden J, Cumming J, Horne G, Devane P, Slack A and Gallagher L (2005) Waiting for Hip
Arthroplasty - Economic Costs and Health Outcomes. Journal of Arthroplasty 20(8): 990-97.
Hales J, Bowen J and Manser J (2007) NZ-ADAM 2006 annual report. Prepared for the New
Zealand Police. (Confidential Report).
Hales J, Bowen J and Manser J (2007) NZ-ADAM 2007 annual report. Draft. Prepared for
the New Zealand Police. (Confidential Report).
MacDonald et al (2005) Measuring the harm from illegal drugs using the Drug Harm Index.
UK Home Office.
Matrix Knowledge Group (2007) The illicit drug trade in the United Kingdom. UK Home
Office.
Mayhew (2003) Counting the Costs of Crime in Australia - Technical report.
Mayhew and Reilly (2007) The New Zealand Crime and Safety Survey 2006.
McFadden M (2006) The Australian Federal Police Drug Harm Index - A New Methodology
for Quantifying Success in Combating Drug Use.
McFadden M and Mwesigye SE (2004) Drug Harm Index – Revised.
McLaren and Mattick (2007) Cannabis in Australia - Use, supply, harms and responses.
Media Awareness Project (13 March 2008) New Zealand - Drugs And Ingredients Worth
More Than $50m Seized.
Ministry of Health (2007) HIV and AIDS information. Issue 60. Accessed February 2008.
www.moh.govt.nz/mh.nsf/indexmh/aids-nz-issue60.
Ministry of Justice (1997) Home Detention - The evaluation of the home detention pilot
programme 1995-1997.
Ministry of Justice (2006) Conviction and sentencing of offenders in New Zealand - 1996 to
2005.
Ministry of Justice (2007) Benchmarking Study of Home Detention Programs in Australia and
New Zealand.
58 New Zealand Drug Harm Index The New Zealand Police
April 2008
Ministry of Transport (2005) The social cost of road crashes and injuries – update.
Moore (2007) Working estimates of the social costs per gram and per user of cannabis,
cocaine, opiates and amphetamines (TPA&DC).
NDIB (2000) Lysergic acid diethylamide (LSD) in New Zealand 2000. (Confidential Report).
NDIB (2007a) ‘New Cannabis’: The Cornerstone of Illicit Drug Harm in New Zealand. 2007
Strategic Assessment. (Confidential Report).
NDIB (2007b) Cocaine in New Zealand. 2006. (Confidential Report).
NDIB (2007c) Methamphetamine in New Zealand. 2007 Strategic Assessment. (Confidential
Report).
New Zealand Drug Foundation. Health and safety information - cannabis. Accessed January
2008. www.nzdf.org.nz/cannabis.
New Zealand Drug Foundation. Health and safety information - cocaine. Accessed January
2008. www.nzdf.org.nz/cocaine.
New Zealand Drug Foundation. Health and safety information - ecstasy. Accessed January
2008. www.nzdf.org.nz/ecstasy.
New Zealand Drug Foundation. Health and safety information - heroin and opiates.
Accessed January 2008 www.nzdf.org.nz/heroin-opiates.
New Zealand Drug Foundation. Health and safety information - LSD. Accessed January
2008. www.nzdf.org.nz/LSD.
New Zealand Drug Foundation. Health and safety information - methamphetamine/
amphetamines. Accessed February 2007. www.nzdf.org.nz/methamphetamine.
New Zealand Health Information Service (2001) New Zealand Drug Statistics. Ministry of
Health.
New Zealand Police (2003) An overview of the drug harm index in Australia and the United
Kingdom.
Nice M (2007) New Zealand methamphetamine purity trends – technical report.
O'Dea D and Tucker S (2005) The Cost of Suicide to Society. Wellington: Ministry of Health.
O’Dea D, Thomson G, Edwards R, and Gifford H (2007) Tobacco Taxation in New Zealand.
Wellington: Smokefree Coalition and ASH NZ.
O'Dea D (December 2007) Economic and Social Costs of Smoking in New Zealand - Some
Valuation Issues. Auckland: HSPR conference.
Ratcliffe J, Ryan M and Tucker J (1996) The costs of alternative types of routine antenatal
care for low-risk women: shared care vs care by general practitioners and community
midwives. Journal of Health Services Research and Policy 1(3):135-40.
59 New Zealand Drug Harm Index The New Zealand Police
April 2008
Ridolfo B and Stevenson C (2001) The quantification of drug-caused mortality and morbidity
in Australia, 1998.
Roper and Thompson (2006) Estimating the costs of crime in New Zealand in 2003-04 -
Treasury Working Paper.
Sheerin I (2004) Consequences of drug use and benefits of methadone maintenance
therapy. University of Otago; PhD Thesis.
Sheerin I, Green T, Sellman D, Adamson S and Deerlin D (2004) Reduction in crime by drug
users on a methadone maintenance therapy programme in New Zealand. New Zealand
Medical Journal 117(1190): 1-10.
Sheerin I, Green T and Sellman D (2003) The costs of not treating hepatitis C virus infection
in injecting drug users in New Zealand. Drug and Alcohol Review 22: 159-167.
Single (1995) International guidelines for estimating the costs of substance abuse.
Single et al (2001) International Guidelines for Estimating the Costs of Substance Abuse.
Statistics New Zealand (2001) Around the clock. Findings from the New Zealand Time Use
Survey 1998-99.
Stephens A (2007) Weighing up crime: the estimation of criminal drug-related harm. Oslo:
Conference of the International Society for the Study of Drug Policy.
Stuff (13 Mar 2008) Double drug bust worth over $50m.
Stuff (23 Feb 2008) Stanlake drug crops 'worth $33,000 each'.
Sydney Morning Herald (13 March 2008) Money trail ends in $87m cocaine seizure.
Taylor and Bareja (2005) National Police Custody Survey 2002.
United Nations Office on Drugs and Crime (2005) World Drug Report - Volume 1.
United Nations Office on Drugs and Crime (2005) World Drug Report - Volume 2.
Wilkins C and Sweetsur P (2003) Drug Use in New Zealand. 2003 Health Behaviour Survey.
Wilkins C and Sweetsur P (2007) Trends in drug use in the population in New Zealand:
Findings from national household drug surveying in 1998, 2001, 2003 and 2006. SHORE.
Wilkins C, Casswell S, Bhatta K et al (2002) Drug use in New Zealand: National surveys
comparison 1998 & 2001. Alcohol & Public Health Research Unit, University of Auckland.
Wilkins C, Girling M, Sweetsur P and Butler R (2005) Key findings from the
methamphetamine module of the 2005 illicit drug monitoring system (IDMS). SHORE.
Accessed February 2007. http://www.shore.ac.nz/projects/idms_study.htm.
Wilkins C, Girlng M and Sweetsur P (2006) Recent trends in illegal drug use in New Zealand,
2006. SHORE.
60 New Zealand Drug Harm Index The New Zealand Police
April 2008
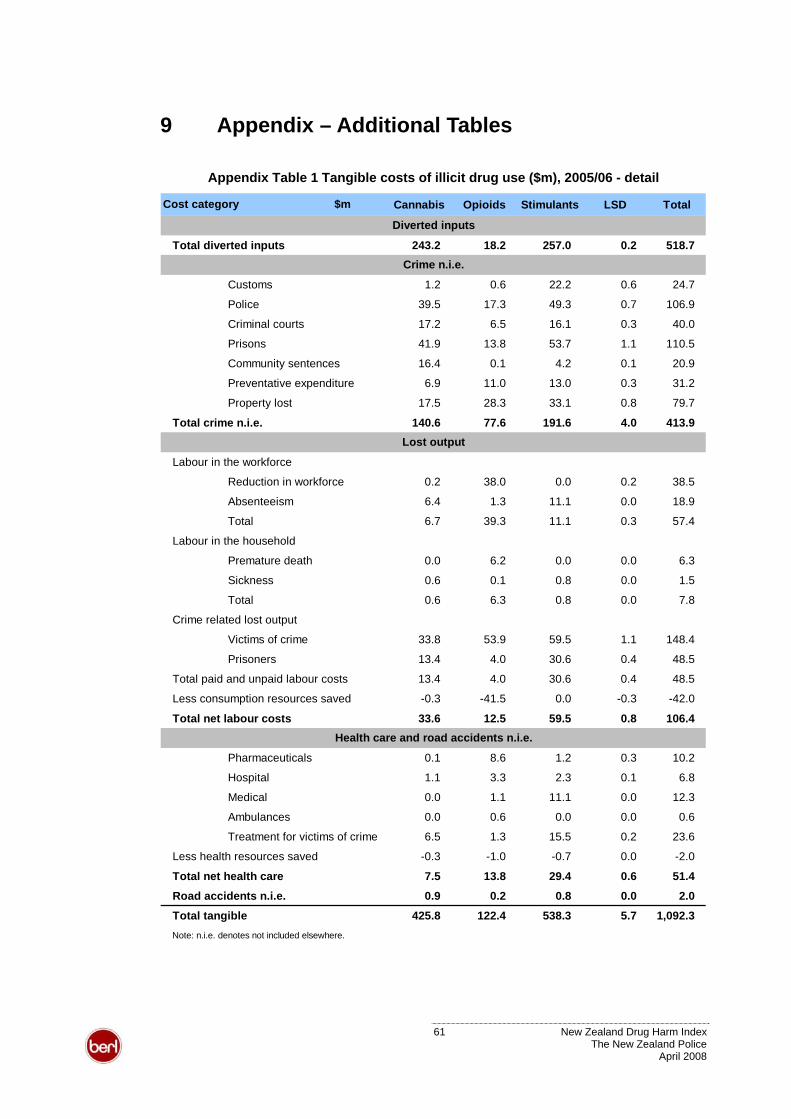
9 Appendix – Additional Tables
Appendix Table 1 Tangible costs of illicit drug use ($m), 2005/06 - detail
Cannabis Opioids Stimulants LSD Total
Total diverted inputs 243.2 18.2 257.0 0.2 518.7
Customs 1.2 0.6 22.2 0.6 24.7
Police 39.5 17.3 49.3 0.7 106.9
Criminal courts 17.2 6.5 16.1 0.3 40.0
Prisons 41.9 13.8 53.7 1.1 110.5
Community sentences 16.4 0.1 4.2 0.1 20.9
Preventative expenditure 6.9 11.0 13.0 0.3 31.2
Property lost 17.5 28.3 33.1 0.8 79.7
Total crime n.i.e. 140.6 77.6 191.6 4.0 413.9
Labour in the workforce
Reduction in workforce 0.2 38.0 0.0 0.2 38.5
Absenteeism 6.4 1.3 11.1 0.0 18.9
Total 6.7 39.3 11.1 0.3 57.4
Labour in the household
Premature death 0.0 6.2 0.0 0.0 6.3
Sickness 0.6 0.1 0.8 0.0 1.5
Total 0.6 6.3 0.8 0.0 7.8
Crime related lost output
Victims of crime 33.8 53.9 59.5 1.1 148.4
Prisoners 13.4 4.0 30.6 0.4 48.5
Total paid and unpaid labour costs 13.4 4.0 30.6 0.4 48.5
Less consumption resources saved -0.3 -41.5 0.0 -0.3 -42.0
Total net labour costs 33.6 12.5 59.5 0.8 106.4
Pharmaceuticals 0.1 8.6 1.2 0.3 10.2
Hospital 1.1 3.3 2.3 0.1 6.8
Medical 0.0 1.1 11.1 0.0 12.3
Ambulances 0.0 0.6 0.0 0.0 0.6
Treatment for victims of crime 6.5 1.3 15.5 0.2 23.6
Less health resources saved -0.3 -1.0 -0.7 0.0 -2.0
Total net health care 7.5 13.8 29.4 0.6 51.4
Road accidents n.i.e. 0.9 0.2 0.8 0.0 2.0
Total tangible 425.8 122.4 538.3 5.7 1,092.3Note: n.i.e. denotes not included elsewhere.
Crime n.i.e.
Lost output
Diverted inputs
Health care and road accidents n.i.e.
Cost category $m
61 New Zealand Drug Harm Index The New Zealand Police
April 2008
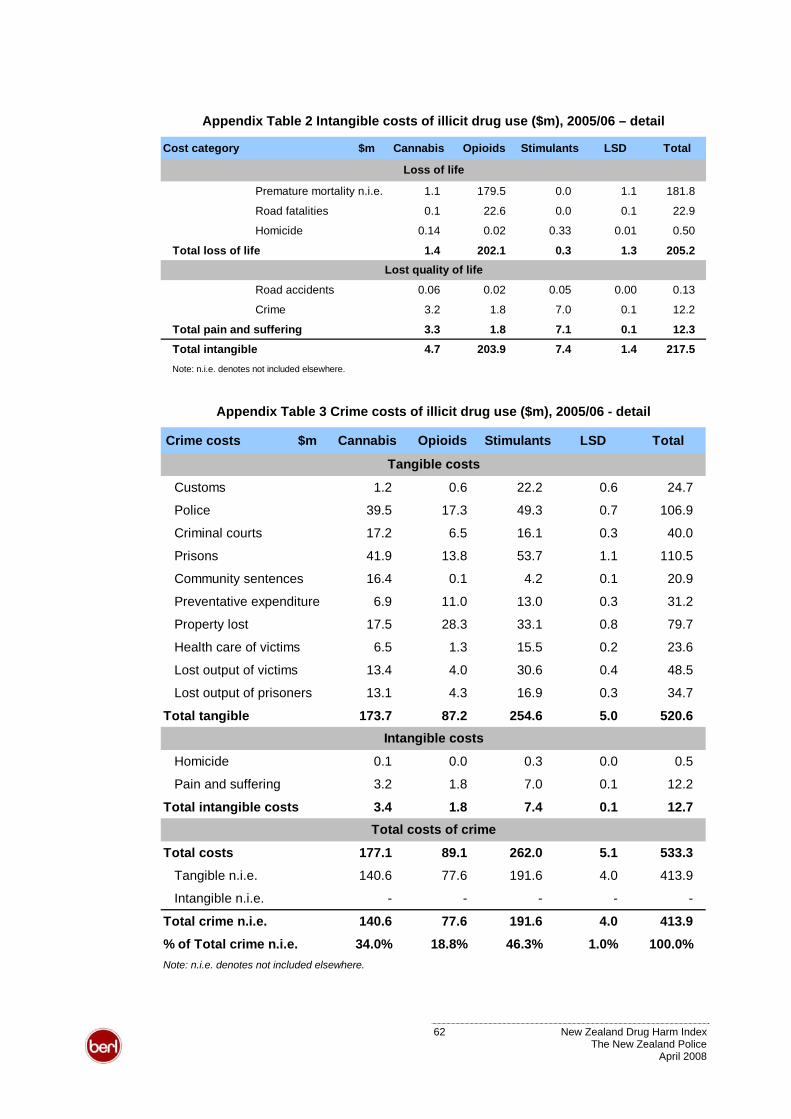
Appendix Table 2 Intangible costs of illicit drug use ($m), 2005/06 – detail
Cost category $m Cannabis Opioids Stimulants LSD Total
Premature mortality n.i.e. 1.1 179.5 0.0 1.1 181.8
Road fatalities 0.1 22.6 0.0 0.1 22.9
Homicide 0.14 0.02 0.33 0.01 0.50
Total loss of life 1.4 202.1 0.3 1.3 205.2
Road accidents 0.06 0.02 0.05 0.00 0.13
Crime 3.2 1.8 7.0 0.1 12.2
Total pain and suffering 3.3 1.8 7.1 0.1 12.3
Total intangible 4.7 203.9 7.4 1.4 217.5Note: n.i.e. denotes not included elsewhere.
Loss of life
Lost quality of life
Appendix Table 3 Crime costs of illicit drug use ($m), 2005/06 - detail
Crime costs $m Cannabis Opioids Stimulants LSD Total
Customs 1.2 0.6 22.2 0.6 24.7
Police 39.5 17.3 49.3 0.7 106.9
Criminal courts 17.2 6.5 16.1 0.3 40.0
Prisons 41.9 13.8 53.7 1.1 110.5
Community sentences 16.4 0.1 4.2 0.1 20.9
Preventative expenditure 6.9 11.0 13.0 0.3 31.2
Property lost 17.5 28.3 33.1 0.8 79.7
Health care of victims 6.5 1.3 15.5 0.2 23.6
Lost output of victims 13.4 4.0 30.6 0.4 48.5
Lost output of prisoners 13.1 4.3 16.9 0.3 34.7
Total tangible 173.7 87.2 254.6 5.0 520.6
Homicide 0.1 0.0 0.3 0.0 0.5
Pain and suffering 3.2 1.8 7.0 0.1 12.2
Total intangible costs 3.4 1.8 7.4 0.1 12.7
Total costs 177.1 89.1 262.0 5.1 533.3
Tangible n.i.e. 140.6 77.6 191.6 4.0 413.9
Intangible n.i.e. - - - - -
Total crime n.i.e. 140.6 77.6 191.6 4.0 413.9
% of Total crime n.i.e. 34.0% 18.8% 46.3% 1.0% 100.0%Note: n.i.e. denotes not included elsewhere.
Tangible costs
Intangible costs
Total costs of crime
62 New Zealand Drug Harm Index The New Zealand Police
April 2008
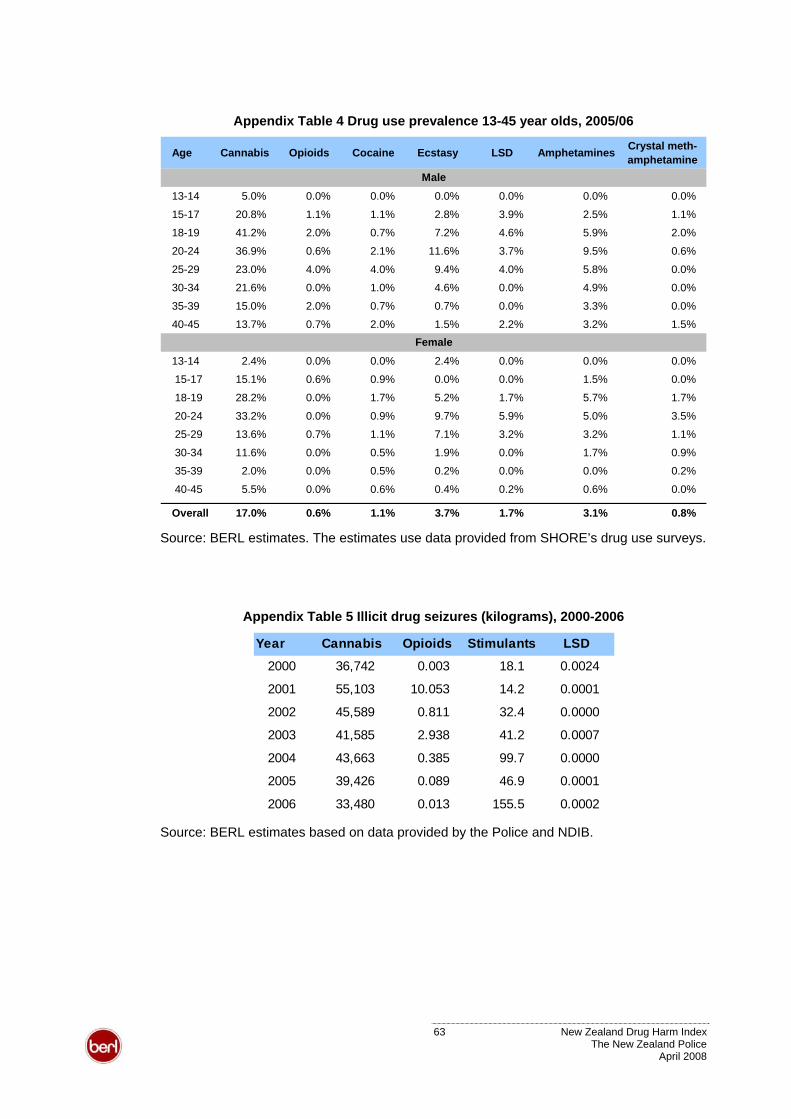
Appendix Table 4 Drug use prevalence 13-45 year olds, 2005/06
Age Cannabis Opioids Cocaine Ecstasy LSD Amphetamines Crystal meth-amphetamine
13-14 5.0% 0.0% 0.0% 0.0% 0.0% 0.0% 0.0%
15-17 20.8% 1.1% 1.1% 2.8% 3.9% 2.5% 1.1
18-19 41.2% 2.0% 0.7% 7.2% 4.6% 5.9% 2.0
20-24 36.9% 0.6% 2.1% 11.6% 3.7% 9.5% 0.6%
25-29 23.0% 4.0% 4.0% 9.4% 4.0% 5.8% 0.0
30-34 21.6% 0.0% 1.0% 4.6% 0.0% 4.9% 0.0
35-39 15.0% 2.0% 0.7% 0.7% 0.0% 3.3% 0.0
40-45 13.7% 0.7% 2.0% 1.5% 2.2% 3.2% 1.5
13-14 2.4% 0.0% 0.0% 2.4% 0.0% 0.0% 0.0%
15-17 15.1% 0.6% 0.9% 0.0% 0.0% 1.5% 0.0
18-19 28.2% 0.0% 1.7% 5.2% 1.7% 5.7% 1.7
20-24 33.2% 0.0% 0.9% 9.7% 5.9% 5.0% 3.5
25-29 13.6% 0.7% 1.1% 7.1% 3.2% 3.2% 1.1
30-34 11.6% 0.0% 0.5% 1.9% 0.0% 1.7% 0.9
35-39 2.0% 0.0% 0.5% 0.2% 0.0% 0.0% 0.2%
40-45 5.5% 0.0% 0.6% 0.4% 0.2% 0.6% 0.0%
Overall 17.0% 0.6% 1.1% 3.7% 1.7% 3.1% 0.8%
Female
Male
%
%
%
%
%
%
%
%
%
%
%
Source: BERL estimates. The estimates use data provided from SHORE’s drug use surveys.
Appendix Table 5 Illicit drug seizures (kilograms), 2000-2006
Year Cannabis Opioids Stimulants LSD
2000 36,742 0.003 18.1 0.0024
2001 55,103 10.053 14.2 0.0001
2002 45,589 0.811 32.4 0.0000
2003 41,585 2.938 41.2 0.0007
2004 43,663 0.385 99.7 0.0000
2005 39,426 0.089 46.9 0.0001
2006 33,480 0.013 155.5 0.0002 Source: BERL estimates based on data provided by the Police and NDIB.
63 New Zealand Drug Harm Index The New Zealand Police
April 2008
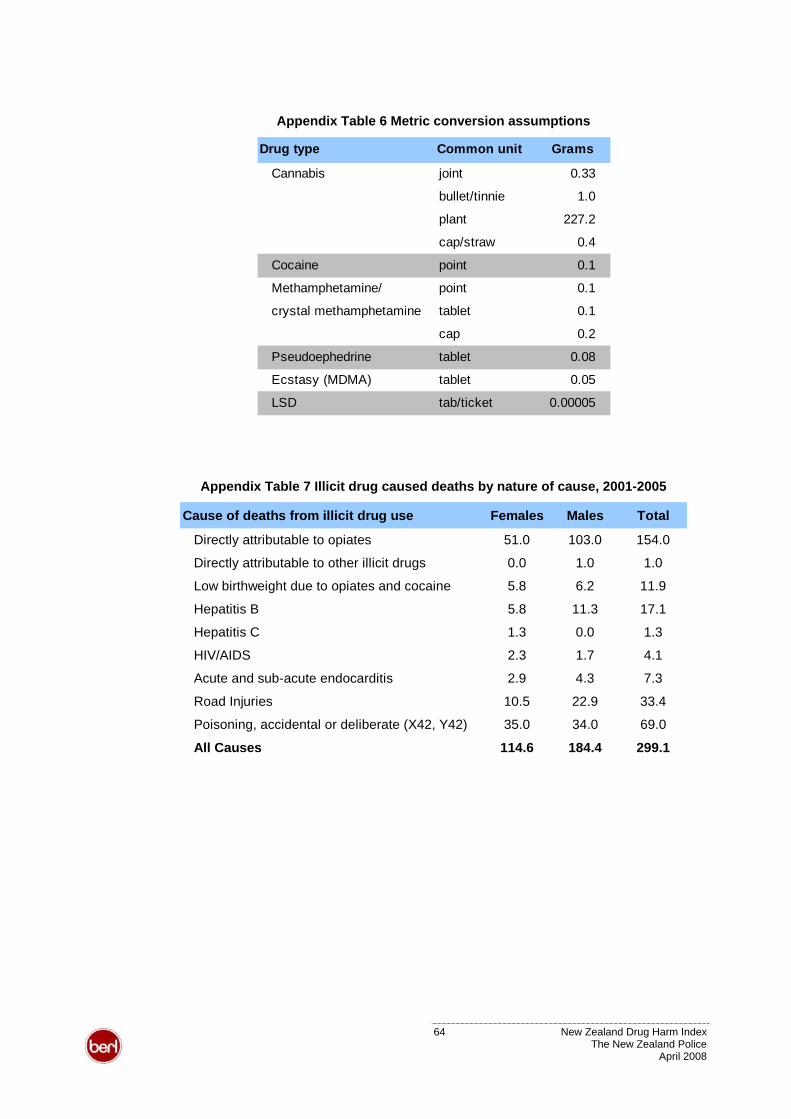
Appendix Table 6 Metric conversion assumptions
Drug type Common unit Grams
Cannabis joint 0.33
bullet/tinnie 1.0
plant 227.2
cap/straw 0.4
Cocaine point 0.1
Methamphetamine/ point 0.1
crystal methamphetamine tablet 0.1
cap 0.2
Pseudoephedrine tablet 0.08
Ecstasy (MDMA) tablet 0.05
LSD tab/ticket 0.00005
Appendix Table 7 Illicit drug caused deaths by nature of cause, 2001-2005
Cause of deaths from illicit drug use Females Males Total
Directly attributable to opiates 51.0 103.0 154.0
Directly attributable to other illicit drugs 0.0 1.0 1.0
Low birthweight due to opiates and cocaine 5.8 6.2 11.9
Hepatitis B 5.8 11.3 17.1
Hepatitis C 1.3 0.0 1.3
HIV/AIDS 2.3 1.7 4.1
Acute and sub-acute endocarditis 2.9 4.3 7.3
Road Injuries 10.5 22.9 33.4
Poisoning, accidental or deliberate (X42, Y42) 35.0 34.0 69.0
All Causes 114.6 184.4 299.1
64 New Zealand Drug Harm Index The New Zealand Police
April 2008
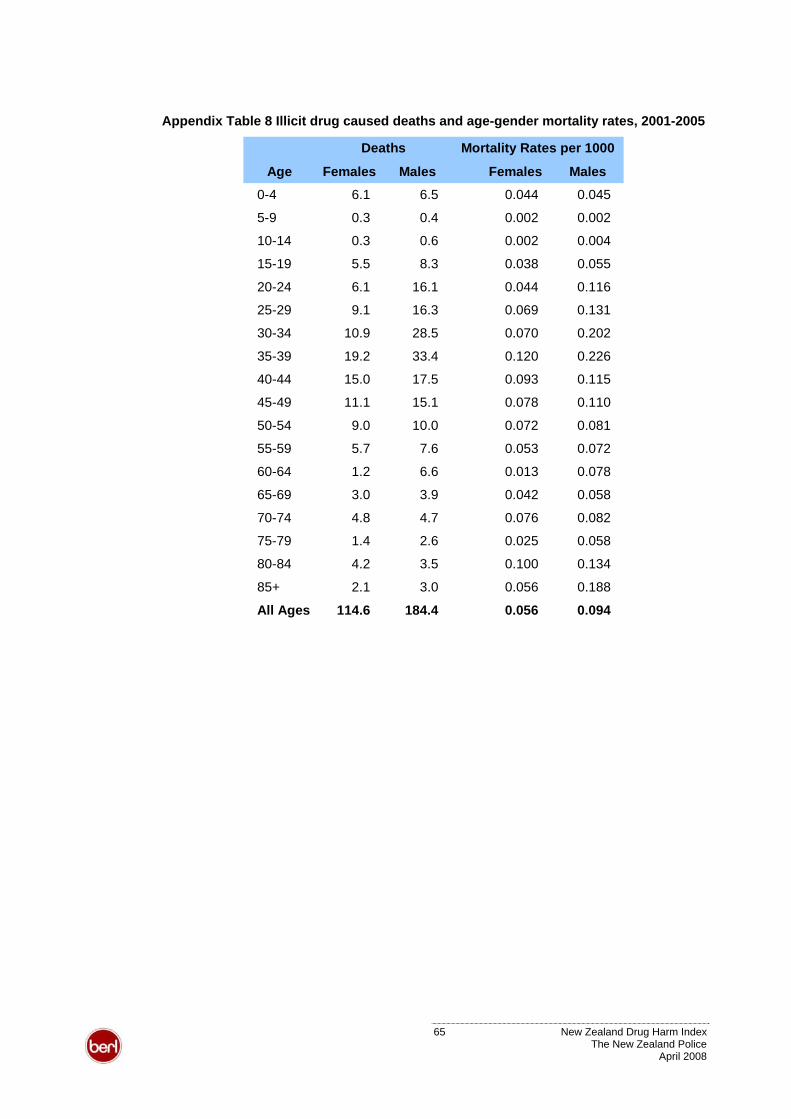
Appendix Table 8 Illicit drug caused deaths and age-gender mortality rates, 2001-2005
Age Females Males Females Males0-4 6.1 6.5 0.044 0.045
5-9 0.3 0.4 0.002 0.002
10-14 0.3 0.6 0.002 0.004
15-19 5.5 8.3 0.038 0.055
20-24 6.1 16.1 0.044 0.116
25-29 9.1 16.3 0.069 0.131
30-34 10.9 28.5 0.070 0.202
35-39 19.2 33.4 0.120 0.226
40-44 15.0 17.5 0.093 0.115
45-49 11.1 15.1 0.078 0.110
50-54 9.0 10.0 0.072 0.081
55-59 5.7 7.6 0.053 0.072
60-64 1.2 6.6 0.013 0.078
65-69 3.0 3.9 0.042 0.058
70-74 4.8 4.7 0.076 0.082
75-79 1.4 2.6 0.025 0.058
80-84 4.2 3.5 0.100 0.134
85+ 2.1 3.0 0.056 0.188
All Ages 114.6 184.4 0.056 0.094
Deaths Mortality Rates per 1000
65 New Zealand Drug Harm Index The New Zealand Police
April 2008

Appendix Table 9 Counterfactual population estimates – males, 2005/06
Males Estimated resident population
Estimated resident population
Additional population
Age Group - no illicit drug use - no illicit drug use0-4 146,420 146,423 35-9 149,230 149,237 710-14 159,500 159,507 715-19 159,470 159,482 1220-24 146,030 146,053 2325-29 127,100 127,138 3830-34 136,420 136,481 6135-39 149,190 149,283 9340-44 156,030 156,148 11845-49 149,130 149,259 12950-54 129,950 130,079 12955-59 119,820 119,948 12860-64 92,300 92,417 11765-69 75,650 75,756 10670-74 57,470 57,559 8975-79 47,590 47,657 6780-84 30,070 30,112 4285-89 13,180 13,201 2190+ 4,990 4,997 7All males 2,049,540 2,050,737 1,197
66 New Zealand Drug Harm Index The New Zealand Police
April 2008
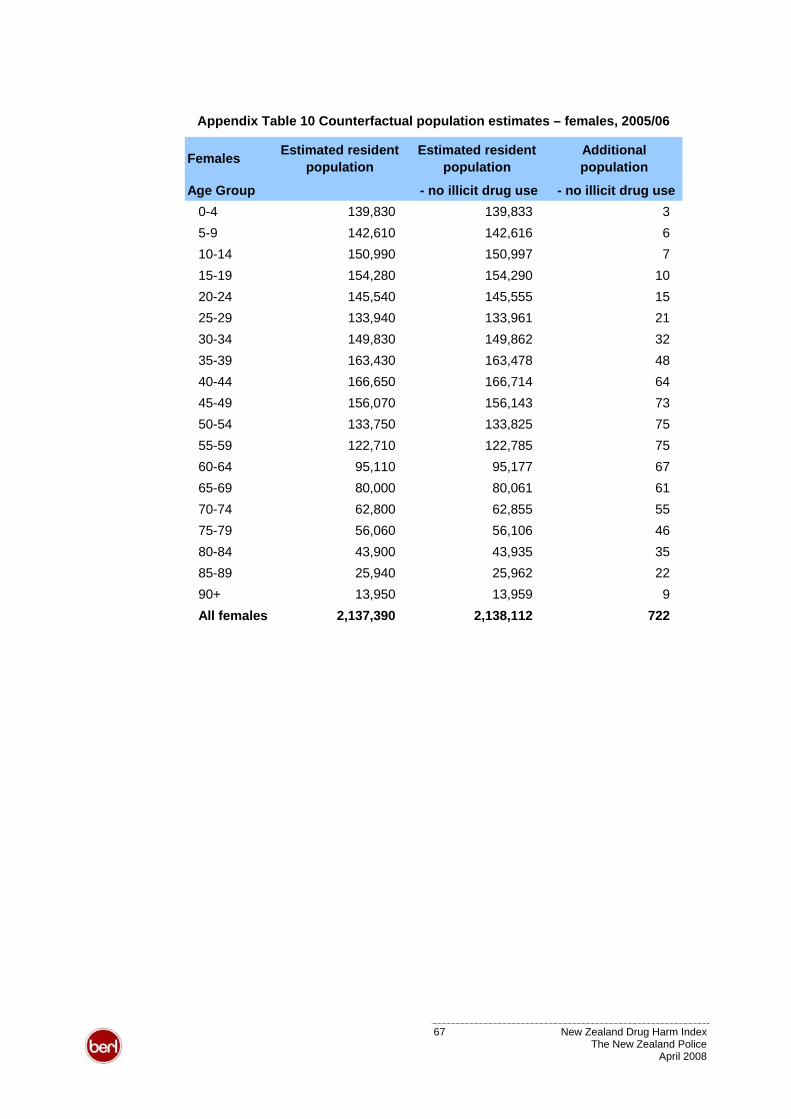
Appendix Table 10 Counterfactual population estimates – females, 2005/06
Females Estimated resident population
Estimated resident population
Additional population
Age Group - no illicit drug use - no illicit drug use0-4 139,830 139,833 35-9 142,610 142,616 610-14 150,990 150,997 715-19 154,280 154,290 1020-24 145,540 145,555 1525-29 133,940 133,961 2130-34 149,830 149,862 3235-39 163,430 163,478 4840-44 166,650 166,714 6445-49 156,070 156,143 7350-54 133,750 133,825 7555-59 122,710 122,785 7560-64 95,110 95,177 6765-69 80,000 80,061 6170-74 62,800 62,855 5575-79 56,060 56,106 4680-84 43,900 43,935 3585-89 25,940 25,962 2290+ 13,950 13,959 9All females 2,137,390 2,138,112 722
67 New Zealand Drug Harm Index The New Zealand Police
April 2008
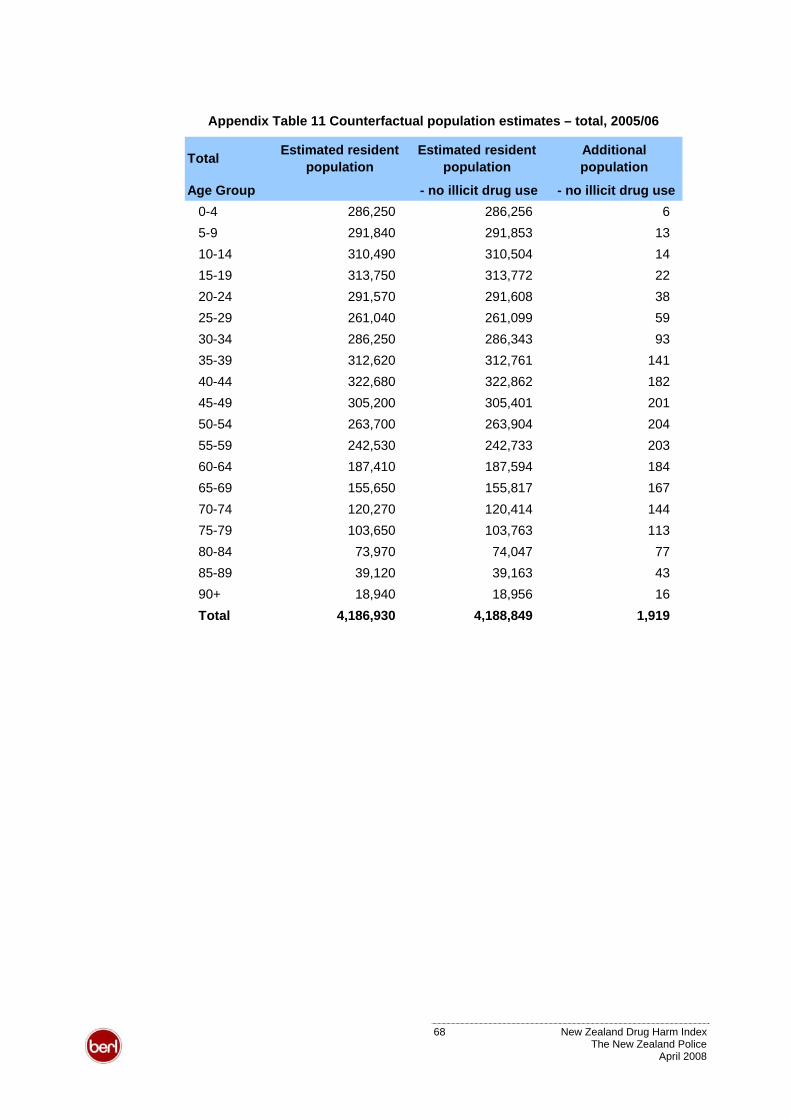
Appendix Table 11 Counterfactual population estimates – total, 2005/06
Total Estimated resident population
Estimated resident population
Additional population
Age Group - no illicit drug use - no illicit drug use0-4 286,250 286,256 65-9 291,840 291,853 1310-14 310,490 310,504 1415-19 313,750 313,772 2220-24 291,570 291,608 3825-29 261,040 261,099 5930-34 286,250 286,343 9335-39 312,620 312,761 14140-44 322,680 322,862 18245-49 305,200 305,401 20150-54 263,700 263,904 20455-59 242,530 242,733 20360-64 187,410 187,594 18465-69 155,650 155,817 16770-74 120,270 120,414 14475-79 103,650 103,763 11380-84 73,970 74,047 7785-89 39,120 39,163 4390+ 18,940 18,956 16Total 4,186,930 4,188,849 1,919
68 New Zealand Drug Harm Index The New Zealand Police
April 2008
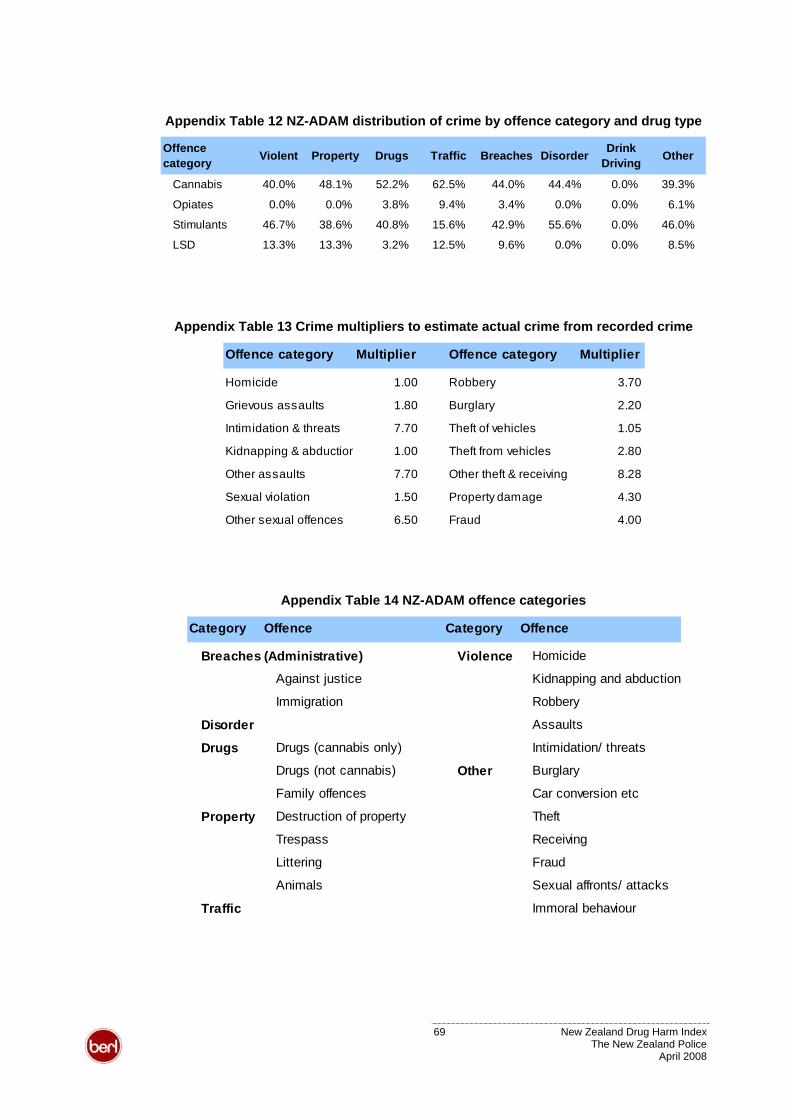
Appendix Table 12 NZ-ADAM distribution of crime by offence category and drug type
Offence category Violent Property Drugs Traffic Breaches Disorder Drink
Driving Other
Cannabis 40.0% 48.1% 52.2% 62.5% 44.0% 44.4% 0.0% 39.3%
Opiates 0.0% 0.0% 3.8% 9.4% 3.4% 0.0% 0.0% 6.1%
Stimulants 46.7% 38.6% 40.8% 15.6% 42.9% 55.6% 0.0% 46.0%
LSD 13.3% 13.3% 3.2% 12.5% 9.6% 0.0% 0.0% 8.5%
Appendix Table 13 Crime multipliers to estimate actual crime from recorded crime
Offence category Multiplier Offence category Multiplier
Homicide 1.00 Robbery 3.70
Grievous assaults 1.80 Burglary 2.20
Intimidation & threats 7.70 Theft of vehicles 1.05
Kidnapping & abduction 1.00 Theft from vehicles 2.80
Other assaults 7.70 Other theft & receiving 8.28
Sexual violation 1.50 Property damage 4.30
Other sexual offences 6.50 Fraud 4.00
Appendix Table 14 NZ-ADAM offence categories
Category Offence Category Offence
Breaches (Administrative) Violence Homicide
Against justice Kidnapping and abduction
Immigration Robbery
Disorder Assaults
Drugs Drugs (cannabis only) Intimidation/ threats
Drugs (not cannabis) Other Burglary
Family offences Car conversion etc
Property Destruction of property Theft
Trespass Receiving
Littering Fraud
Animals Sexual affronts/ attacks
Traffic Immoral behaviour
69 New Zealand Drug Harm Index The New Zealand Police
April 2008
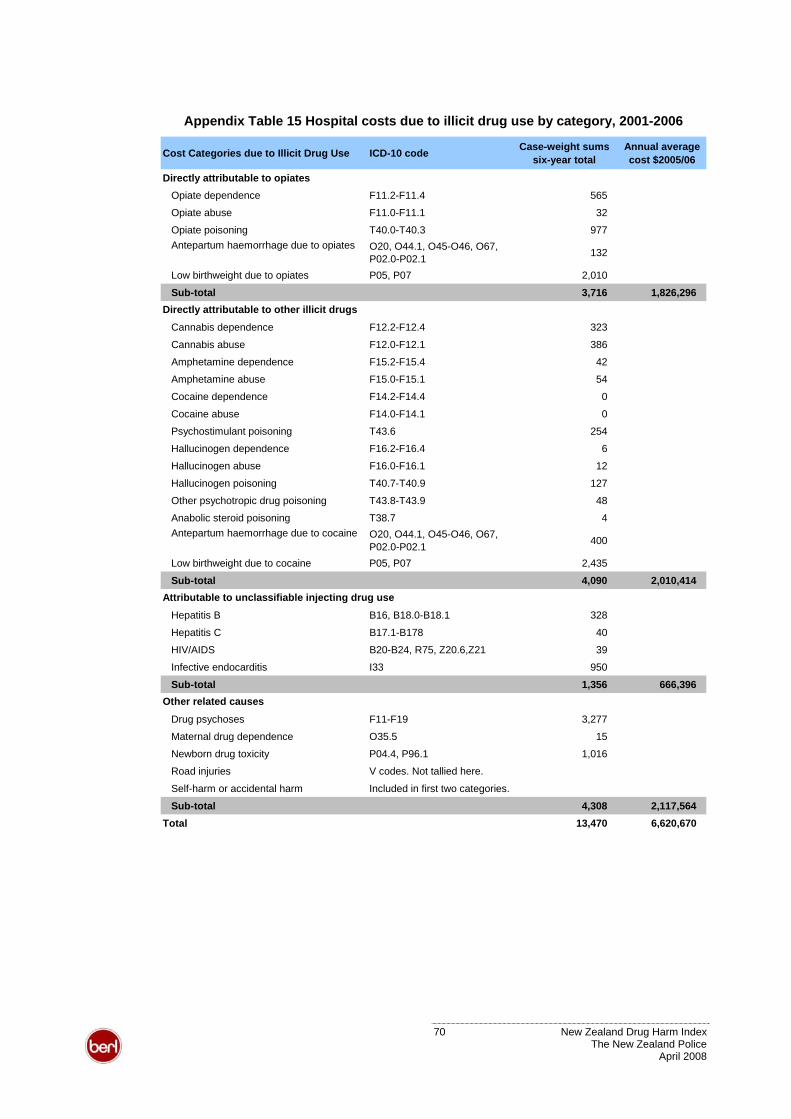
Appendix Table 15 Hospital costs due to illicit drug use by category, 2001-2006
Cost Categories due to Illicit Drug Use ICD-10 code Case-weight sums six-year total
Annual average cost $2005/06
Directly attributable to opiatesOpiate dependence F11.2-F11.4 565
Opiate abuse F11.0-F11.1 32
Opiate poisoning T40.0-T40.3 977Antepartum haemorrhage due to opiates O20, O44.1, O45-O46, O67,
P02.0-P02.1 132
Low birthweight due to opiates P05, P07 2,010
Sub-total 3,716 1,826,296
Cannabis dependence F12.2-F12.4 323
Cannabis abuse F12.0-F12.1 386
Amphetamine dependence F15.2-F15.4 42
Amphetamine abuse F15.0-F15.1 54
Cocaine dependence F14.2-F14.4 0
Cocaine abuse F14.0-F14.1 0
Psychostimulant poisoning T43.6 254
Hallucinogen dependence F16.2-F16.4 6
Hallucinogen abuse F16.0-F16.1 12
Hallucinogen poisoning T40.7-T40.9 127
Other psychotropic drug poisoning T43.8-T43.9 48
Anabolic steroid poisoning T38.7 4Antepartum haemorrhage due to cocaine O20, O44.1, O45-O46, O67,
P02.0-P02.1 400
Low birthweight due to cocaine P05, P07 2,435
Sub-total 4,090 2,010,414
Hepatitis B B16, B18.0-B18.1 328
Hepatitis C B17.1-B178 40
HIV/AIDS B20-B24, R75, Z20.6,Z21 39
Infective endocarditis I33 950
Sub-total 1,356 666,396
Drug psychoses F11-F19 3,277
Maternal drug dependence O35.5 15
Newborn drug toxicity P04.4, P96.1 1,016
Road injuries V codes. Not tallied here.
Self-harm or accidental harm Included in first two categories.
Sub-total 4,308 2,117,564 Total 13,470 6,620,670
Directly attributable to other illicit drugs
Attributable to unclassifiable injecting drug use
Other related causes
70 New Zealand Drug Harm Index The New Zealand Police
April 2008
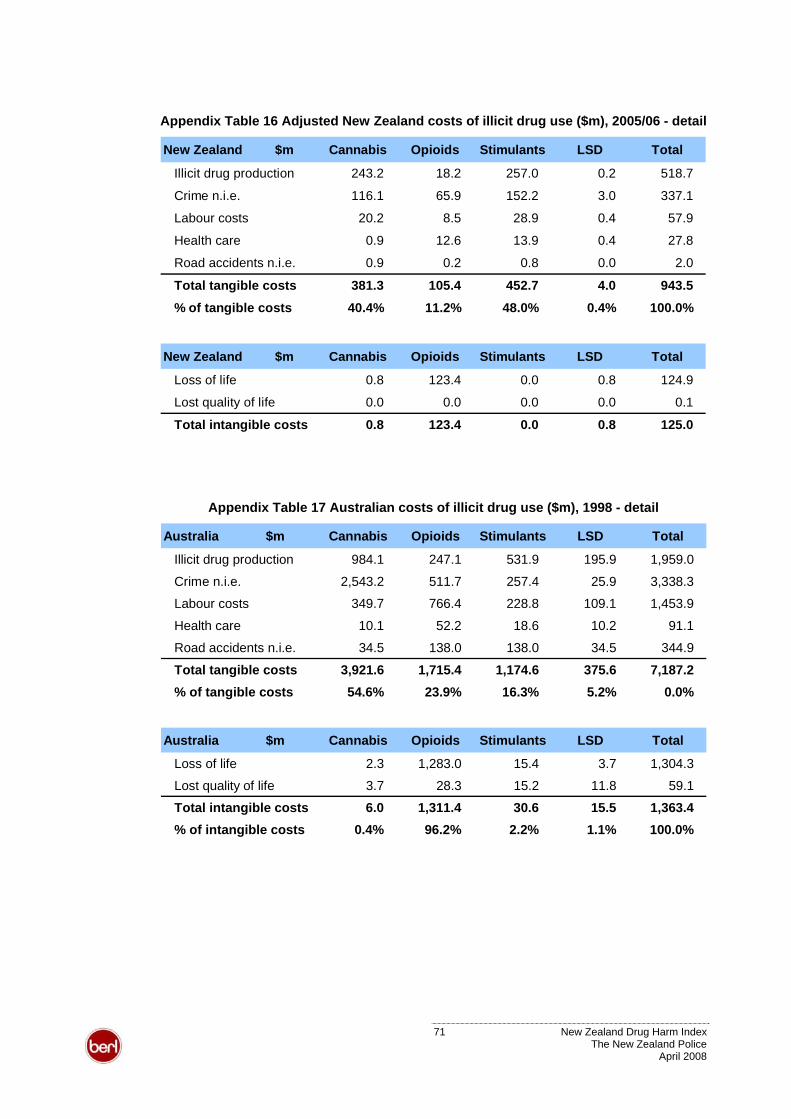
Appendix Table 16 Adjusted New Zealand costs of illicit drug use ($m), 2005/06 - detail
New Zealand $m Cannabis Opioids Stimulants LSD Total
Illicit drug production 243.2 18.2 257.0 0.2 518.7
Crime n.i.e. 116.1 65.9 152.2 3.0 337.1
Labour costs 20.2 8.5 28.9 0.4 57.9
Health care 0.9 12.6 13.9 0.4 27.8
Road accidents n.i.e. 0.9 0.2 0.8 0.0 2.0
Total tangible costs 381.3 105.4 452.7 4.0 943.5
% of tangible costs 40.4% 11.2% 48.0% 0.4% 100.0%
New Zealand $m Cannabis Opioids Stimulants LSD Total
Loss of life 0.8 123.4 0.0 0.8 124.9
Lost quality of life 0.0 0.0 0.0 0.0 0.1
Total intangible costs 0.8 123.4 0.0 0.8 125.0
Appendix Table 17 Australian costs of illicit drug use ($m), 1998 - detail
Australia $m Cannabis Opioids Stimulants LSD Total
Illicit drug production 984.1 247.1 531.9 195.9 1,959.0
Crime n.i.e. 2,543.2 511.7 257.4 25.9 3,338.3
Labour costs 349.7 766.4 228.8 109.1 1,453.9
Health care 10.1 52.2 18.6 10.2 91.1
Road accidents n.i.e. 34.5 138.0 138.0 34.5 344.9
Total tangible costs 3,921.6 1,715.4 1,174.6 375.6 7,187.2% of tangible costs 54.6% 23.9% 16.3% 5.2% 0.0%
Australia $m Cannabis Opioids Stimulants LSD Total
Loss of life 2.3 1,283.0 15.4 3.7 1,304.3
Lost quality of life 3.7 28.3 15.2 11.8 59.1
Total intangible costs 6.0 1,311.4 30.6 15.5 1,363.4% of intangible costs 0.4% 96.2% 2.2% 1.1% 100.0%
71 New Zealand Drug Harm Index The New Zealand Police
April 2008
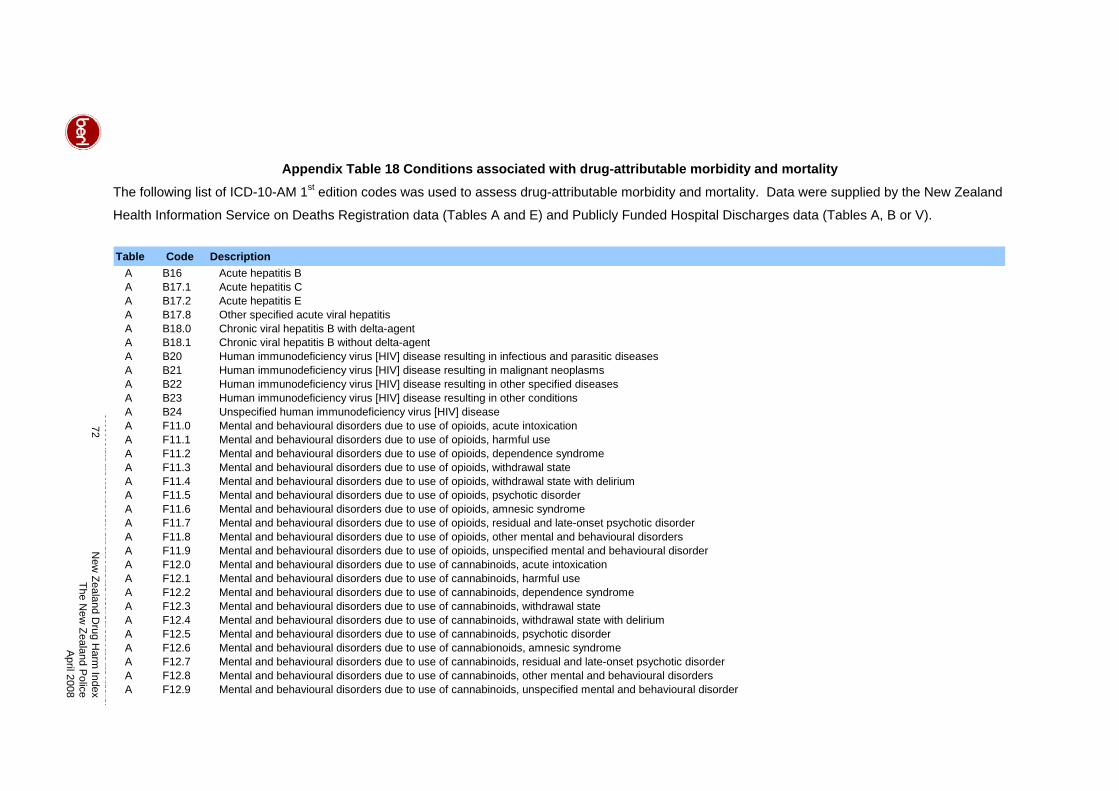
72
New
Zealand Drug H
arm Index
The New
Zealand Police
April 2008
Appendix Table 18 Conditions associated with drug-attributable morbidity and mortality stThe following list of ICD-10-AM 1 edition codes was used to assess drug-attributable morbidity and mortality. Data were supplied by the New Zealand
Health Information Service on Deaths Registration data (Tables A and E) and Publicly Funded Hospital Discharges data (Tables A, B or V).
Table Code DescriptionA B16 Acute hepatitis BA B17.1 Acute hepatitis CA B17.2 Acute hepatitis EA B17.8 Other specified acute viral hepatitisA B18.0 Chronic viral hepatitis B with delta-agentA B18.1 Chronic viral hepatitis B without delta-agentA B20 Human immunodeficiency virus [HIV] disease resulting in infectious and parasitic diseasesA B21 Human immunodeficiency virus [HIV] disease resulting in malignant neoplasmsA B22 Human immunodeficiency virus [HIV] disease resulting in other specified diseasesA B23 Human immunodeficiency virus [HIV] disease resulting in other conditionsA B24 Unspecified human immunodeficiency virus [HIV] diseaseA F11.0 Mental and behavioural disorders due to use of opioids, acute intoxicationA F11.1 Mental and behavioural disorders due to use of opioids, harmful useA F11.2 Mental and behavioural disorders due to use of opioids, dependence syndromeA F11.3 Mental and behavioural disorders due to use of opioids, withdrawal stateA F11.4 Mental and behavioural disorders due to use of opioids, withdrawal state with deliriumA F11.5 Mental and behavioural disorders due to use of opioids, psychotic disorderA F11.6 Mental and behavioural disorders due to use of opioids, amnesic syndromeA F11.7 Mental and behavioural disorders due to use of opioids, residual and late-onset psychotic disorderA F11.8 Mental and behavioural disorders due to use of opioids, other mental and behavioural disordersA F11.9 Mental and behavioural disorders due to use of opioids, unspecified mental and behavioural disorderA F12.0 Mental and behavioural disorders due to use of cannabinoids, acute intoxicationA F12.1 Mental and behavioural disorders due to use of cannabinoids, harmful useA F12.2 Mental and behavioural disorders due to use of cannabinoids, dependence syndromeA F12.3 Mental and behavioural disorders due to use of cannabinoids, withdrawal stateA F12.4 Mental and behavioural disorders due to use of cannabinoids, withdrawal state with deliriumA F12.5 Mental and behavioural disorders due to use of cannabinoids, psychotic disorderA F12.6 Mental and behavioural disorders due to use of cannabionoids, amnesic syndromeA F12.7 Mental and behavioural disorders due to use of cannabinoids, residual and late-onset psychotic disorderA F12.8 Mental and behavioural disorders due to use of cannabinoids, other mental and behavioural disordersA F12.9 Mental and behavioural disorders due to use of cannabinoids, unspecified mental and behavioural disorder
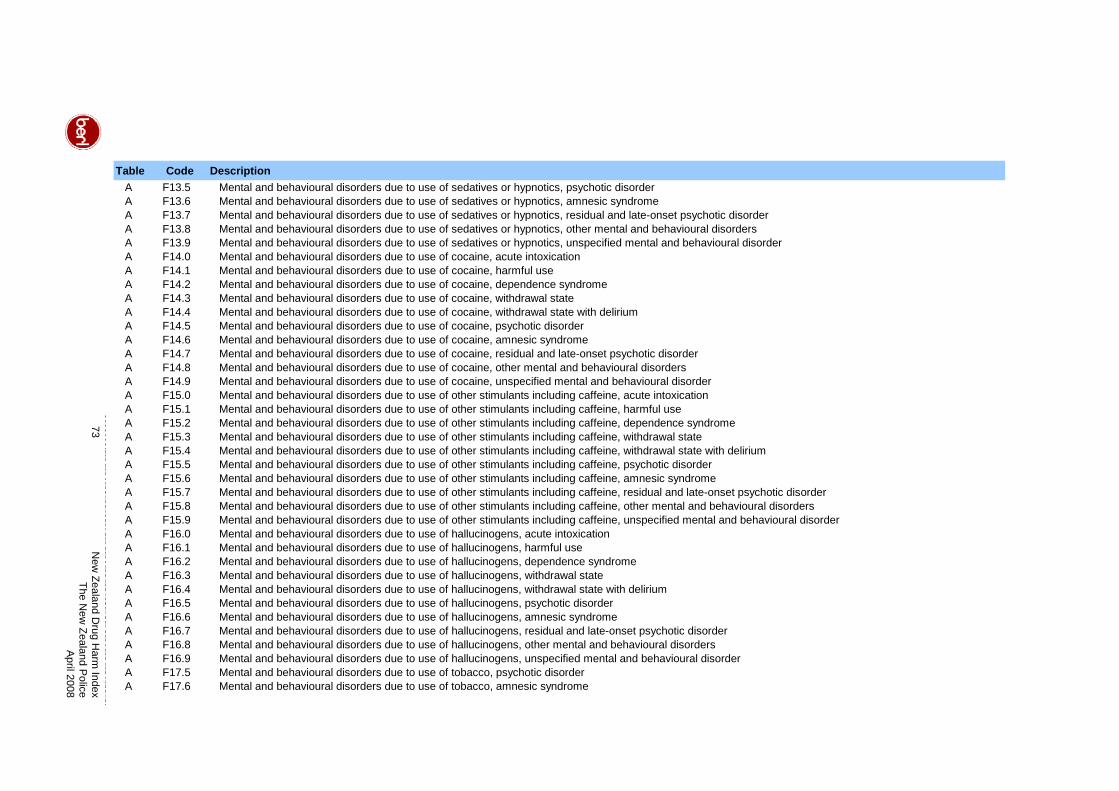
73
New
Zealand Drug H
arm Index
The New
Zealand Police
April 2008
Table Code DescriptionA F13.5 Mental and behavioural disorders due to use of sedatives or hypnotics, psychotic disorderA F13.6 Mental and behavioural disorders due to use of sedatives or hypnotics, amnesic syndromeA F13.7 Mental and behavioural disorders due to use of sedatives or hypnotics, residual and late-onset psychotic disorderA F13.8 Mental and behavioural disorders due to use of sedatives or hypnotics, other mental and behavioural disordersA F13.9 Mental and behavioural disorders due to use of sedatives or hypnotics, unspecified mental and behavioural disorderA F14.0 Mental and behavioural disorders due to use of cocaine, acute intoxicationA F14.1 Mental and behavioural disorders due to use of cocaine, harmful useA F14.2 Mental and behavioural disorders due to use of cocaine, dependence syndromeA F14.3 Mental and behavioural disorders due to use of cocaine, withdrawal stateA F14.4 Mental and behavioural disorders due to use of cocaine, withdrawal state with deliriumA F14.5 Mental and behavioural disorders due to use of cocaine, psychotic disorderA F14.6 Mental and behavioural disorders due to use of cocaine, amnesic syndromeA F14.7 Mental and behavioural disorders due to use of cocaine, residual and late-onset psychotic disorderA F14.8 Mental and behavioural disorders due to use of cocaine, other mental and behavioural disordersA F14.9 Mental and behavioural disorders due to use of cocaine, unspecified mental and behavioural disorderA F15.0 Mental and behavioural disorders due to use of other stimulants including caffeine, acute intoxicationA F15.1 Mental and behavioural disorders due to use of other stimulants including caffeine, harmful useA F15.2 Mental and behavioural disorders due to use of other stimulants including caffeine, dependence syndromeA F15.3 Mental and behavioural disorders due to use of other stimulants including caffeine, withdrawal stateA F15.4 Mental and behavioural disorders due to use of other stimulants including caffeine, withdrawal state with deliriumA F15.5 Mental and behavioural disorders due to use of other stimulants including caffeine, psychotic disorderA F15.6 Mental and behavioural disorders due to use of other stimulants including caffeine, amnesic syndromeA F15.7 Mental and behavioural disorders due to use of other stimulants including caffeine, residual and late-onset psychotic disorderA F15.8 Mental and behavioural disorders due to use of other stimulants including caffeine, other mental and behavioural disordersA F15.9 Mental and behavioural disorders due to use of other stimulants including caffeine, unspecified mental and behavioural disorderA F16.0 Mental and behavioural disorders due to use of hallucinogens, acute intoxicationA F16.1 Mental and behavioural disorders due to use of hallucinogens, harmful useA F16.2 Mental and behavioural disorders due to use of hallucinogens, dependence syndromeA F16.3 Mental and behavioural disorders due to use of hallucinogens, withdrawal stateA F16.4 Mental and behavioural disorders due to use of hallucinogens, withdrawal state with deliriumA F16.5 Mental and behavioural disorders due to use of hallucinogens, psychotic disorderA F16.6 Mental and behavioural disorders due to use of hallucinogens, amnesic syndromeA F16.7 Mental and behavioural disorders due to use of hallucinogens, residual and late-onset psychotic disorderA F16.8 Mental and behavioural disorders due to use of hallucinogens, other mental and behavioural disordersA F16.9 Mental and behavioural disorders due to use of hallucinogens, unspecified mental and behavioural disorderA F17.5 Mental and behavioural disorders due to use of tobacco, psychotic disorderA F17.6 Mental and behavioural disorders due to use of tobacco, amnesic syndrome
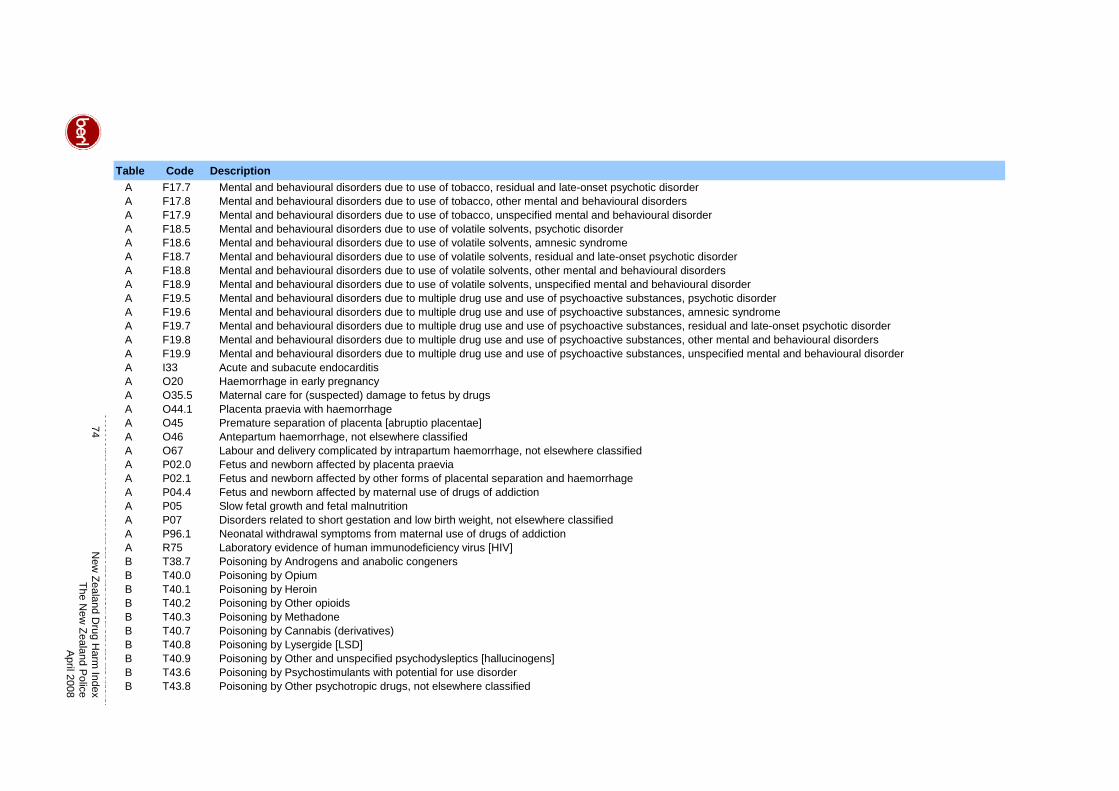
74
New
Zealand Drug H
arm Index
The New
Zealand Police
April 2008
Table Code DescriptionA F17.7 Mental and behavioural disorders due to use of tobacco, residual and late-onset psychotic disorderA F17.8 Mental and behavioural disorders due to use of tobacco, other mental and behavioural disordersA F17.9 Mental and behavioural disorders due to use of tobacco, unspecified mental and behavioural disorderA F18.5 Mental and behavioural disorders due to use of volatile solvents, psychotic disorderA F18.6 Mental and behavioural disorders due to use of volatile solvents, amnesic syndromeA F18.7 Mental and behavioural disorders due to use of volatile solvents, residual and late-onset psychotic disorderA F18.8 Mental and behavioural disorders due to use of volatile solvents, other mental and behavioural disordersA F18.9 Mental and behavioural disorders due to use of volatile solvents, unspecified mental and behavioural disorderA F19.5 Mental and behavioural disorders due to multiple drug use and use of psychoactive substances, psychotic disorderA F19.6 Mental and behavioural disorders due to multiple drug use and use of psychoactive substances, amnesic syndromeA F19.7 Mental and behavioural disorders due to multiple drug use and use of psychoactive substances, residual and late-onset psychotic disorderA F19.8 Mental and behavioural disorders due to multiple drug use and use of psychoactive substances, other mental and behavioural disordersA F19.9 Mental and behavioural disorders due to multiple drug use and use of psychoactive substances, unspecified mental and behavioural disorderA I33 Acute and subacute endocarditisA O20 Haemorrhage in early pregnancyA O35.5 Maternal care for (suspected) damage to fetus by drugsA O44.1 Placenta praevia with haemorrhageA O45 Premature separation of placenta [abruptio placentae]A O46 Antepartum haemorrhage, not elsewhere classifiedA O67 Labour and delivery complicated by intrapartum haemorrhage, not elsewhere classifiedA P02.0 Fetus and newborn affected by placenta praeviaA P02.1 Fetus and newborn affected by other forms of placental separation and haemorrhageA P04.4 Fetus and newborn affected by maternal use of drugs of addictionA P05 Slow fetal growth and fetal malnutritionA P07 Disorders related to short gestation and low birth weight, not elsewhere classifiedA P96.1 Neonatal withdrawal symptoms from maternal use of drugs of addictionA R75 Laboratory evidence of human immunodeficiency virus [HIV]B T38.7 Poisoning by Androgens and anabolic congenersB T40.0 Poisoning by OpiumB T40.1 Poisoning by HeroinB T40.2 Poisoning by Other opioidsB T40.3 Poisoning by MethadoneB T40.7 Poisoning by Cannabis (derivatives)B T40.8 Poisoning by Lysergide [LSD]B T40.9 Poisoning by Other and unspecified psychodysleptics [hallucinogens]B T43.6 Poisoning by Psychostimulants with potential for use disorderB T43.8 Poisoning by Other psychotropic drugs, not elsewhere classified
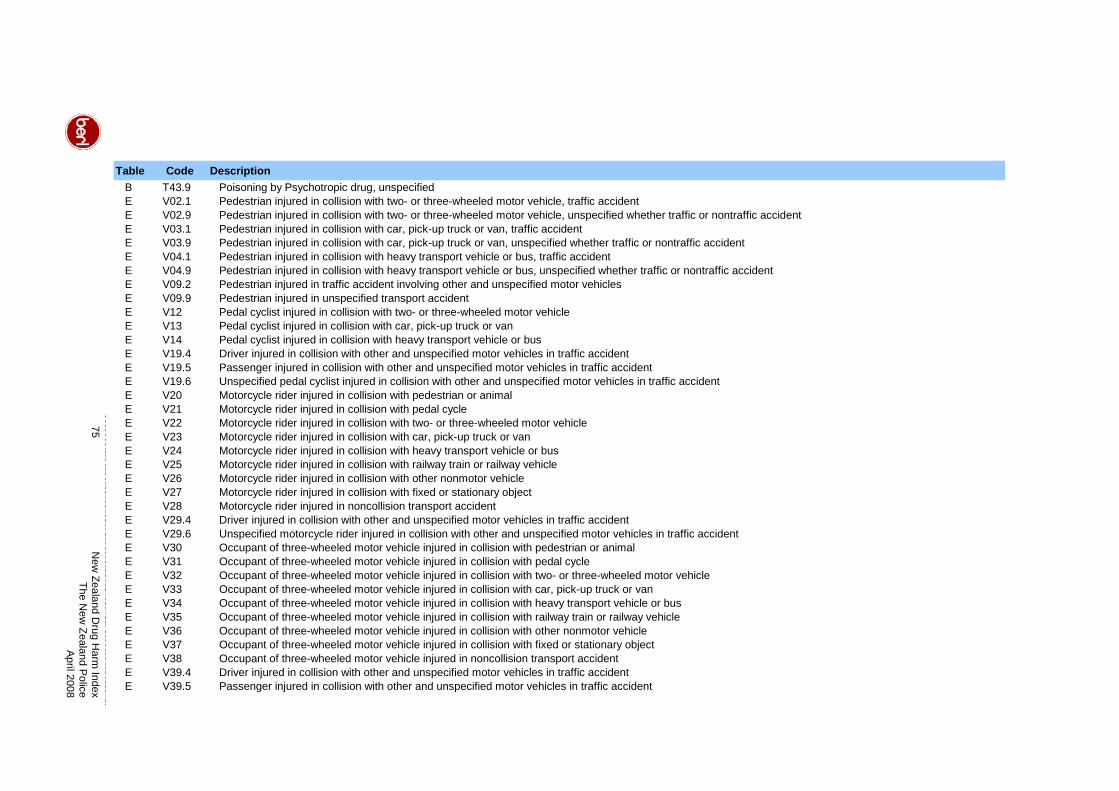
75
New
Zealand Drug H
arm Index
The New
Zealand Police
April 2008
Table Code DescriptionB T43.9 Poisoning by Psychotropic drug, unspecifiedE V02.1 Pedestrian injured in collision with two- or three-wheeled motor vehicle, traffic accidentE V02.9 Pedestrian injured in collision with two- or three-wheeled motor vehicle, unspecified whether traffic or nontraffic accidentE V03.1 Pedestrian injured in collision with car, pick-up truck or van, traffic accidentE V03.9 Pedestrian injured in collision with car, pick-up truck or van, unspecified whether traffic or nontraffic accidentE V04.1 Pedestrian injured in collision with heavy transport vehicle or bus, traffic accidentE V04.9 Pedestrian injured in collision with heavy transport vehicle or bus, unspecified whether traffic or nontraffic accidentE V09.2 Pedestrian injured in traffic accident involving other and unspecified motor vehiclesE V09.9 Pedestrian injured in unspecified transport accidentE V12 Pedal cyclist injured in collision with two- or three-wheeled motor vehicleE V13 Pedal cyclist injured in collision with car, pick-up truck or vanE V14 Pedal cyclist injured in collision with heavy transport vehicle or busE V19.4 Driver injured in collision with other and unspecified motor vehicles in traffic accidentE V19.5 Passenger injured in collision with other and unspecified motor vehicles in traffic accidentE V19.6 Unspecified pedal cyclist injured in collision with other and unspecified motor vehicles in traffic accidentE V20 Motorcycle rider injured in collision with pedestrian or animalE V21 Motorcycle rider injured in collision with pedal cycleE V22 Motorcycle rider injured in collision with two- or three-wheeled motor vehicleE V23 Motorcycle rider injured in collision with car, pick-up truck or vanE V24 Motorcycle rider injured in collision with heavy transport vehicle or busE V25 Motorcycle rider injured in collision with railway train or railway vehicleE V26 Motorcycle rider injured in collision with other nonmotor vehicleE V27 Motorcycle rider injured in collision with fixed or stationary objectE V28 Motorcycle rider injured in noncollision transport accidentE V29.4 Driver injured in collision with other and unspecified motor vehicles in traffic accidentE V29.6 Unspecified motorcycle rider injured in collision with other and unspecified motor vehicles in traffic accidentE V30 Occupant of three-wheeled motor vehicle injured in collision with pedestrian or animalE V31 Occupant of three-wheeled motor vehicle injured in collision with pedal cycleE V32 Occupant of three-wheeled motor vehicle injured in collision with two- or three-wheeled motor vehicleE V33 Occupant of three-wheeled motor vehicle injured in collision with car, pick-up truck or vanE V34 Occupant of three-wheeled motor vehicle injured in collision with heavy transport vehicle or busE V35 Occupant of three-wheeled motor vehicle injured in collision with railway train or railway vehicleE V36 Occupant of three-wheeled motor vehicle injured in collision with other nonmotor vehicleE V37 Occupant of three-wheeled motor vehicle injured in collision with fixed or stationary objectE V38 Occupant of three-wheeled motor vehicle injured in noncollision transport accidentE V39.4 Driver injured in collision with other and unspecified motor vehicles in traffic accidentE V39.5 Passenger injured in collision with other and unspecified motor vehicles in traffic accident
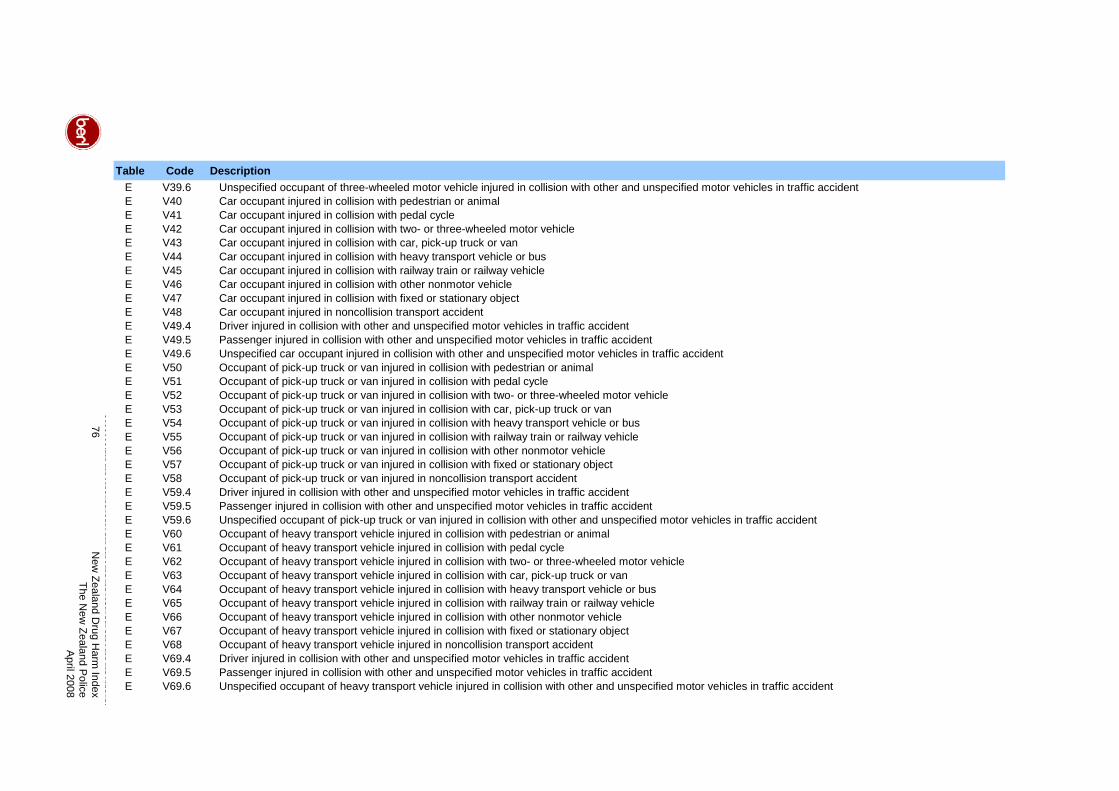
76
New
Zealand Drug H
arm Index
The New
Zealand Police
April 2008
Table Code DescriptionE V39.6 Unspecified occupant of three-wheeled motor vehicle injured in collision with other and unspecified motor vehicles in traffic accidentE V40 Car occupant injured in collision with pedestrian or animalE V41 Car occupant injured in collision with pedal cycleE V42 Car occupant injured in collision with two- or three-wheeled motor vehicleE V43 Car occupant injured in collision with car, pick-up truck or vanE V44 Car occupant injured in collision with heavy transport vehicle or busE V45 Car occupant injured in collision with railway train or railway vehicleE V46 Car occupant injured in collision with other nonmotor vehicleE V47 Car occupant injured in collision with fixed or stationary objectE V48 Car occupant injured in noncollision transport accidentE V49.4 Driver injured in collision with other and unspecified motor vehicles in traffic accidentE V49.5 Passenger injured in collision with other and unspecified motor vehicles in traffic accidentE V49.6 Unspecified car occupant injured in collision with other and unspecified motor vehicles in traffic accidentE V50 Occupant of pick-up truck or van injured in collision with pedestrian or animalE V51 Occupant of pick-up truck or van injured in collision with pedal cycleE V52 Occupant of pick-up truck or van injured in collision with two- or three-wheeled motor vehicleE V53 Occupant of pick-up truck or van injured in collision with car, pick-up truck or vanE V54 Occupant of pick-up truck or van injured in collision with heavy transport vehicle or busE V55 Occupant of pick-up truck or van injured in collision with railway train or railway vehicleE V56 Occupant of pick-up truck or van injured in collision with other nonmotor vehicleE V57 Occupant of pick-up truck or van injured in collision with fixed or stationary objectE V58 Occupant of pick-up truck or van injured in noncollision transport accidentE V59.4 Driver injured in collision with other and unspecified motor vehicles in traffic accidentE V59.5 Passenger injured in collision with other and unspecified motor vehicles in traffic accidentE V59.6 Unspecified occupant of pick-up truck or van injured in collision with other and unspecified motor vehicles in traffic accidentE V60 Occupant of heavy transport vehicle injured in collision with pedestrian or animalE V61 Occupant of heavy transport vehicle injured in collision with pedal cycleE V62 Occupant of heavy transport vehicle injured in collision with two- or three-wheeled motor vehicleE V63 Occupant of heavy transport vehicle injured in collision with car, pick-up truck or vanE V64 Occupant of heavy transport vehicle injured in collision with heavy transport vehicle or busE V65 Occupant of heavy transport vehicle injured in collision with railway train or railway vehicleE V66 Occupant of heavy transport vehicle injured in collision with other nonmotor vehicleE V67 Occupant of heavy transport vehicle injured in collision with fixed or stationary objectE V68 Occupant of heavy transport vehicle injured in noncollision transport accidentE V69.4 Driver injured in collision with other and unspecified motor vehicles in traffic accidentE V69.5 Passenger injured in collision with other and unspecified motor vehicles in traffic accidentE V69.6 Unspecified occupant of heavy transport vehicle injured in collision with other and unspecified motor vehicles in traffic accident
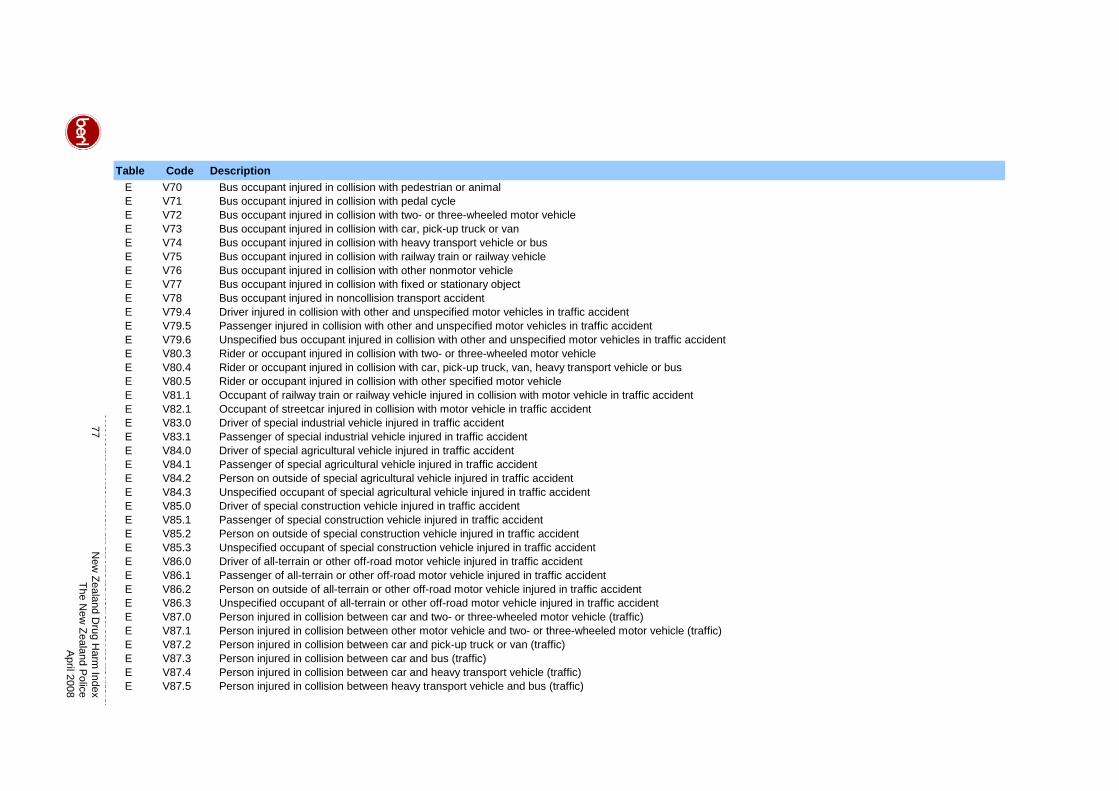
77
New
Zealand Drug H
arm Index
The New
Zealand Police
April 2008
Table Code DescriptionE V70 Bus occupant injured in collision with pedestrian or animalE V71 Bus occupant injured in collision with pedal cycleE V72 Bus occupant injured in collision with two- or three-wheeled motor vehicleE V73 Bus occupant injured in collision with car, pick-up truck or vanE V74 Bus occupant injured in collision with heavy transport vehicle or busE V75 Bus occupant injured in collision with railway train or railway vehicleE V76 Bus occupant injured in collision with other nonmotor vehicleE V77 Bus occupant injured in collision with fixed or stationary objectE V78 Bus occupant injured in noncollision transport accidentE V79.4 Driver injured in collision with other and unspecified motor vehicles in traffic accidentE V79.5 Passenger injured in collision with other and unspecified motor vehicles in traffic accidentE V79.6 Unspecified bus occupant injured in collision with other and unspecified motor vehicles in traffic accidentE V80.3 Rider or occupant injured in collision with two- or three-wheeled motor vehicleE V80.4 Rider or occupant injured in collision with car, pick-up truck, van, heavy transport vehicle or busE V80.5 Rider or occupant injured in collision with other specified motor vehicleE V81.1 Occupant of railway train or railway vehicle injured in collision with motor vehicle in traffic accidentE V82.1 Occupant of streetcar injured in collision with motor vehicle in traffic accidentE V83.0 Driver of special industrial vehicle injured in traffic accidentE V83.1 Passenger of special industrial vehicle injured in traffic accidentE V84.0 Driver of special agricultural vehicle injured in traffic accidentE V84.1 Passenger of special agricultural vehicle injured in traffic accidentE V84.2 Person on outside of special agricultural vehicle injured in traffic accidentE V84.3 Unspecified occupant of special agricultural vehicle injured in traffic accidentE V85.0 Driver of special construction vehicle injured in traffic accidentE V85.1 Passenger of special construction vehicle injured in traffic accidentE V85.2 Person on outside of special construction vehicle injured in traffic accidentE V85.3 Unspecified occupant of special construction vehicle injured in traffic accidentE V86.0 Driver of all-terrain or other off-road motor vehicle injured in traffic accidentE V86.1 Passenger of all-terrain or other off-road motor vehicle injured in traffic accidentE V86.2 Person on outside of all-terrain or other off-road motor vehicle injured in traffic accidentE V86.3 Unspecified occupant of all-terrain or other off-road motor vehicle injured in traffic accidentE V87.0 Person injured in collision between car and two- or three-wheeled motor vehicle (traffic)E V87.1 Person injured in collision between other motor vehicle and two- or three-wheeled motor vehicle (traffic)E V87.2 Person injured in collision between car and pick-up truck or van (traffic)E V87.3 Person injured in collision between car and bus (traffic)E V87.4 Person injured in collision between car and heavy transport vehicle (traffic)E V87.5 Person injured in collision between heavy transport vehicle and bus (traffic)
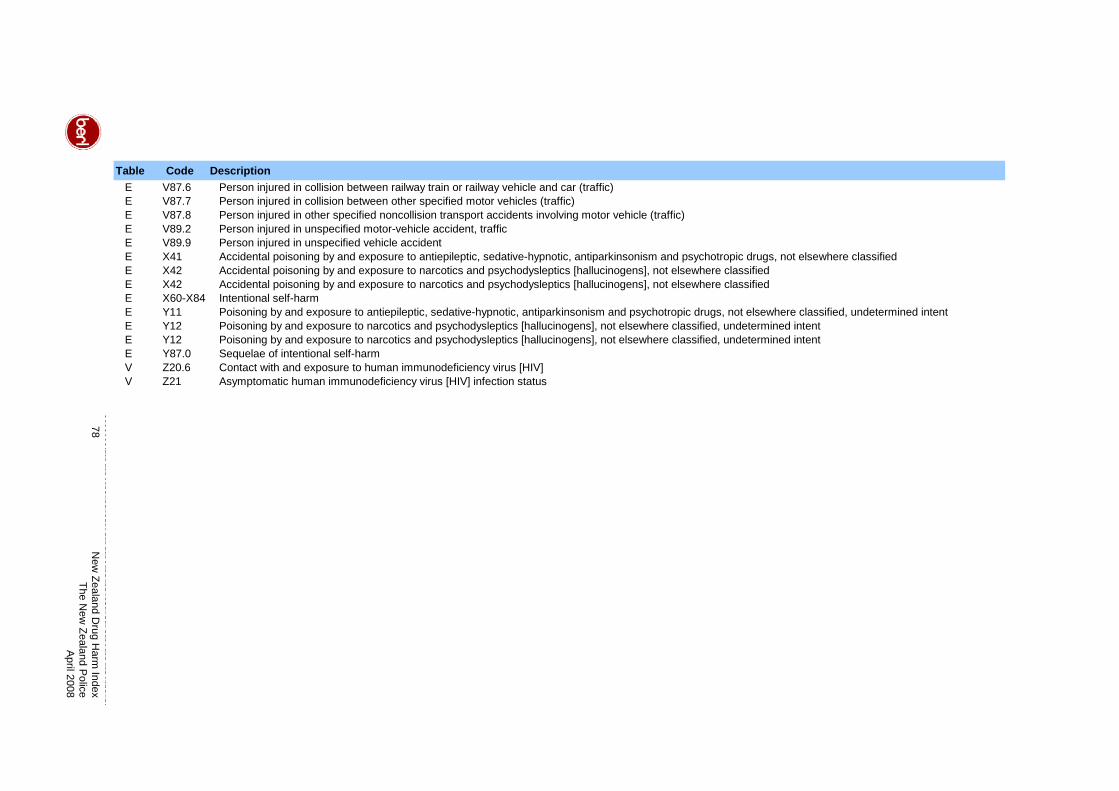
78
New
Zealand Drug H
arm Index
The New
Zealand Police
April 2008
Table Code DescriptionE V87.6 Person injured in collision between railway train or railway vehicle and car (traffic)E V87.7 Person injured in collision between other specified motor vehicles (traffic)E V87.8 Person injured in other specified noncollision transport accidents involving motor vehicle (traffic)E V89.2 Person injured in unspecified motor-vehicle accident, trafficE V89.9 Person injured in unspecified vehicle accidentE X41 Accidental poisoning by and exposure to antiepileptic, sedative-hypnotic, antiparkinsonism and psychotropic drugs, not elsewhere classifiedE X42 Accidental poisoning by and exposure to narcotics and psychodysleptics [hallucinogens], not elsewhere classifiedE X42 Accidental poisoning by and exposure to narcotics and psychodysleptics [hallucinogens], not elsewhere classifiedE X60-X84 Intentional self-harmE Y11 Poisoning by and exposure to antiepileptic, sedative-hypnotic, antiparkinsonism and psychotropic drugs, not elsewhere classified, undetermined intentE Y12 Poisoning by and exposure to narcotics and psychodysleptics [hallucinogens], not elsewhere classified, undetermined intentE Y12 Poisoning by and exposure to narcotics and psychodysleptics [hallucinogens], not elsewhere classified, undetermined intentE Y87.0 Sequelae of intentional self-harmV Z20.6 Contact with and exposure to human immunodeficiency virus [HIV]V Z21 Asymptomatic human immunodeficiency virus [HIV] infection status
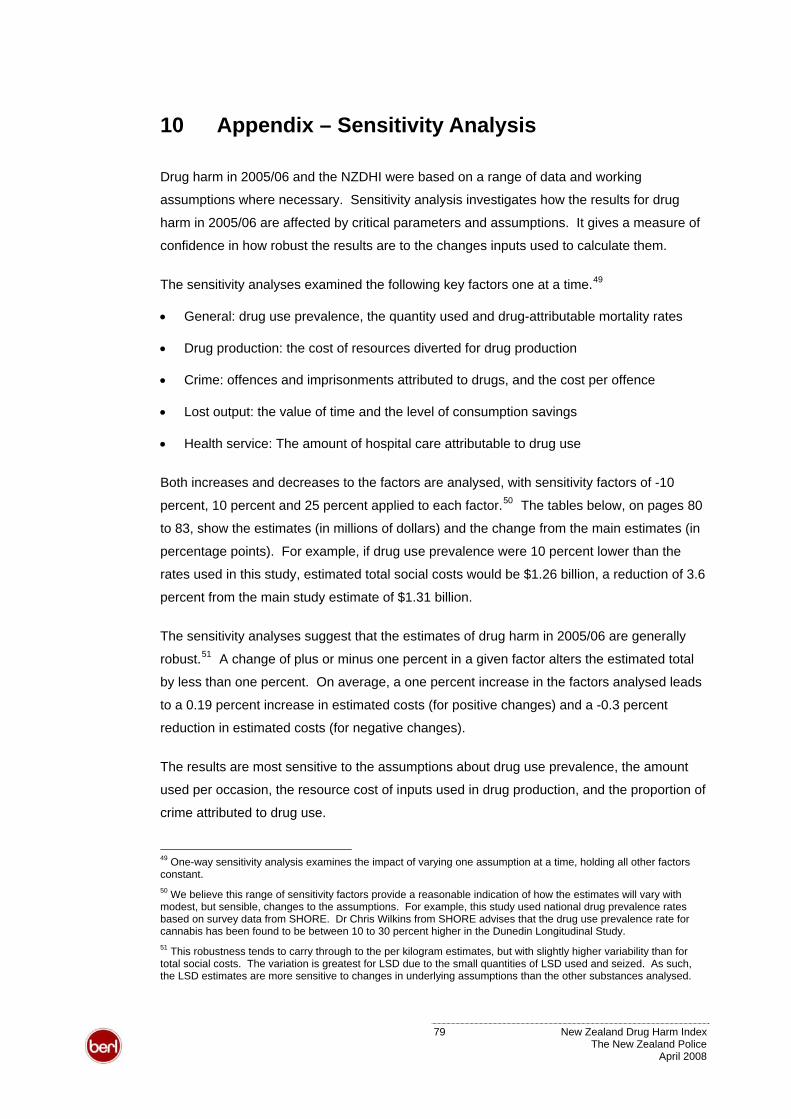
10 Appendix – Sensitivity Analysis
Drug harm in 2005/06 and the NZDHI were based on a range of data and working
assumptions where necessary. Sensitivity analysis investigates how the results for drug
harm in 2005/06 are affected by critical parameters and assumptions. It gives a measure of
confidence in how robust the results are to the changes inputs used to calculate them.
49The sensitivity analyses examined the following key factors one at a time.
• General: drug use prevalence, the quantity used and drug-attributable mortality rates
• Drug production: the cost of resources diverted for drug production
• Crime: offences and imprisonments attributed to drugs, and the cost per offence
• Lost output: the value of time and the level of consumption savings
• Health service: The amount of hospital care attributable to drug use
Both increases and decreases to the factors are analysed, with sensitivity factors of -10
percent, 10 percent and 25 percent applied to each factor.50 The tables below, on pages 80
to 83, show the estimates (in millions of dollars) and the change from the main estimates (in
percentage points). For example, if drug use prevalence were 10 percent lower than the
rates used in this study, estimated total social costs would be $1.26 billion, a reduction of 3.6
percent from the main study estimate of $1.31 billion.
The sensitivity analyses suggest that the estimates of drug harm in 2005/06 are generally
robust.51 A change of plus or minus one percent in a given factor alters the estimated total
by less than one percent. On average, a one percent increase in the factors analysed leads
to a 0.19 percent increase in estimated costs (for positive changes) and a -0.3 percent
reduction in estimated costs (for negative changes).
The results are most sensitive to the assumptions about drug use prevalence, the amount
used per occasion, the resource cost of inputs used in drug production, and the proportion of
crime attributed to drug use.
49 One-way sensitivity analysis examines the impact of varying one assumption at a time, holding all other factors constant. 50 We believe this range of sensitivity factors provide a reasonable indication of how the estimates will vary with modest, but sensible, changes to the assumptions. For example, this study used national drug prevalence rates based on survey data from SHORE. Dr Chris Wilkins from SHORE advises that the drug use prevalence rate for cannabis has been found to be between 10 to 30 percent higher in the Dunedin Longitudinal Study. 51 This robustness tends to carry through to the per kilogram estimates, but with slightly higher variability than for total social costs. The variation is greatest for LSD due to the small quantities of LSD used and seized. As such, the LSD estimates are more sensitive to changes in underlying assumptions than the other substances analysed.
79 New Zealand Drug Harm Index The New Zealand Police
April 2008
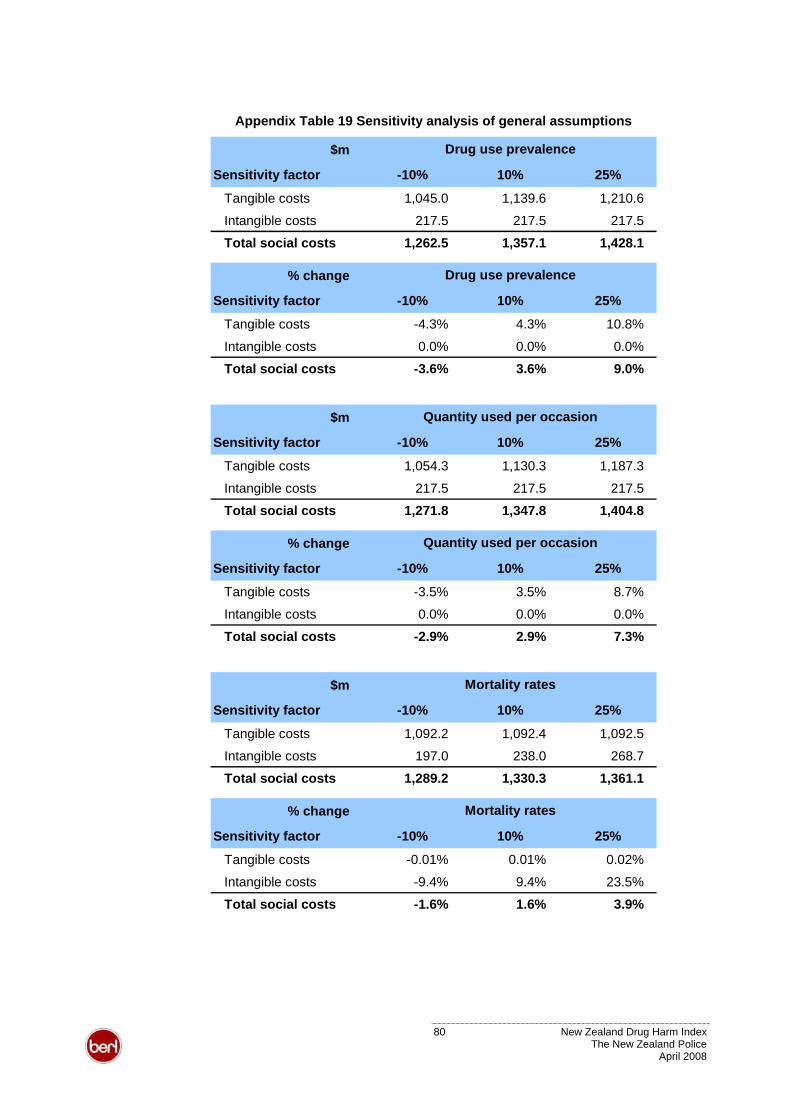
Appendix Table 19 Sensitivity analysis of general assumptions
$m
Sensitivity factor -10% 10% 25%
Tangible costs 1,045.0 1,139.6 1,210.6
Intangible costs 217.5 217.5 217.5
Total social costs 1,262.5 1,357.1 1,428.1
Drug use prevalence
% change
Sensitivity factor -10% 10% 25%
Tangible costs -4.3% 4.3% 10.8%
Intangible costs 0.0% 0.0% 0.0%
Total social costs -3.6% 3.6% 9.0%
Drug use prevalence
$m
Sensitivity factor -10% 10% 25%
Tangible costs 1,054.3 1,130.3 1,187.3
Intangible costs 217.5 217.5 217.5
Total social costs 1,271.8 1,347.8 1,404.8
Quantity used per occasion
% change
Sensitivity factor -10% 10% 25%
Tangible costs -3.5% 3.5% 8.7%
Intangible costs 0.0% 0.0% 0.0%
Total social costs -2.9% 2.9% 7.3%
Quantity used per occasion
$m
Sensitivity factor -10% 10% 25%
Tangible costs 1,092.2 1,092.4 1,092.5
Intangible costs 197.0 238.0 268.7
Total social costs 1,289.2 1,330.3 1,361.1
Mortality rates
% change
Sensitivity factor -10% 10% 25%
Tangible costs -0.01% 0.01% 0.02%
Intangible costs -9.4% 9.4% 23.5%
Total social costs -1.6% 1.6% 3.9%
Mortality rates
80 New Zealand Drug Harm Index The New Zealand Police
April 2008
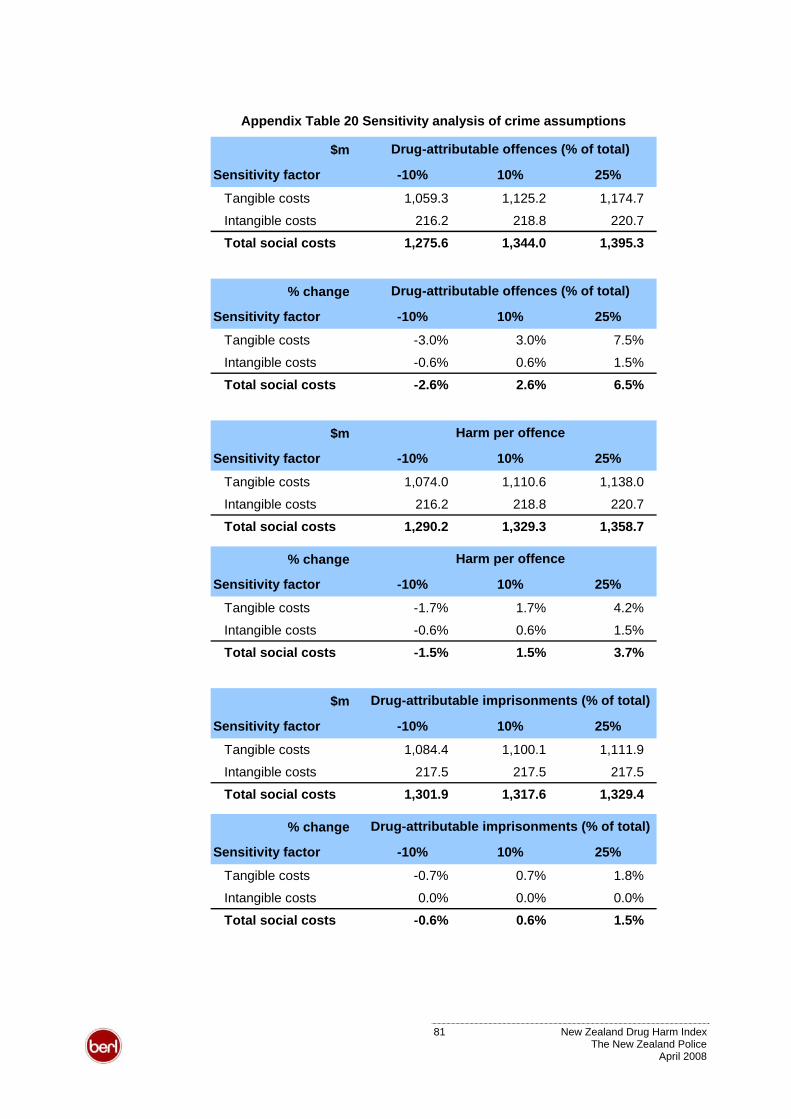
Appendix Table 20 Sensitivity analysis of crime assumptions
$m
Sensitivity factor -10% 10% 25%
Tangible costs 1,059.3 1,125.2 1,174.7
Intangible costs 216.2 218.8 220.7
Total social costs 1,275.6 1,344.0 1,395.3
Drug-attributable offences (% of total)
% change
Sensitivity factor -10% 10% 25%
Tangible costs -3.0% 3.0% 7.5%
Intangible costs -0.6% 0.6% 1.5%
Total social costs -2.6% 2.6% 6.5%
Drug-attributable offences (% of total)
$m
Sensitivity factor -10% 10% 25%
Tangible costs 1,074.0 1,110.6 1,138.0
Intangible costs 216.2 218.8 220.7
Total social costs 1,290.2 1,329.3 1,358.7
Harm per offence
% change
Sensitivity factor -10% 10% 25%
Tangible costs -1.7% 1.7% 4.2%
Intangible costs -0.6% 0.6% 1.5%
Total social costs -1.5% 1.5% 3.7%
Harm per offence
$m
Sensitivity factor -10% 10% 25%
Tangible costs 1,084.4 1,100.1 1,111.9
Intangible costs 217.5 217.5 217.5
Total social costs 1,301.9 1,317.6 1,329.4
Drug-attributable imprisonments (% of total)
% change
Sensitivity factor -10% 10% 25%
Tangible costs -0.7% 0.7% 1.8%
Intangible costs 0.0% 0.0% 0.0%
Total social costs -0.6% 0.6% 1.5%
Drug-attributable imprisonments (% of total)
81 New Zealand Drug Harm Index The New Zealand Police
April 2008
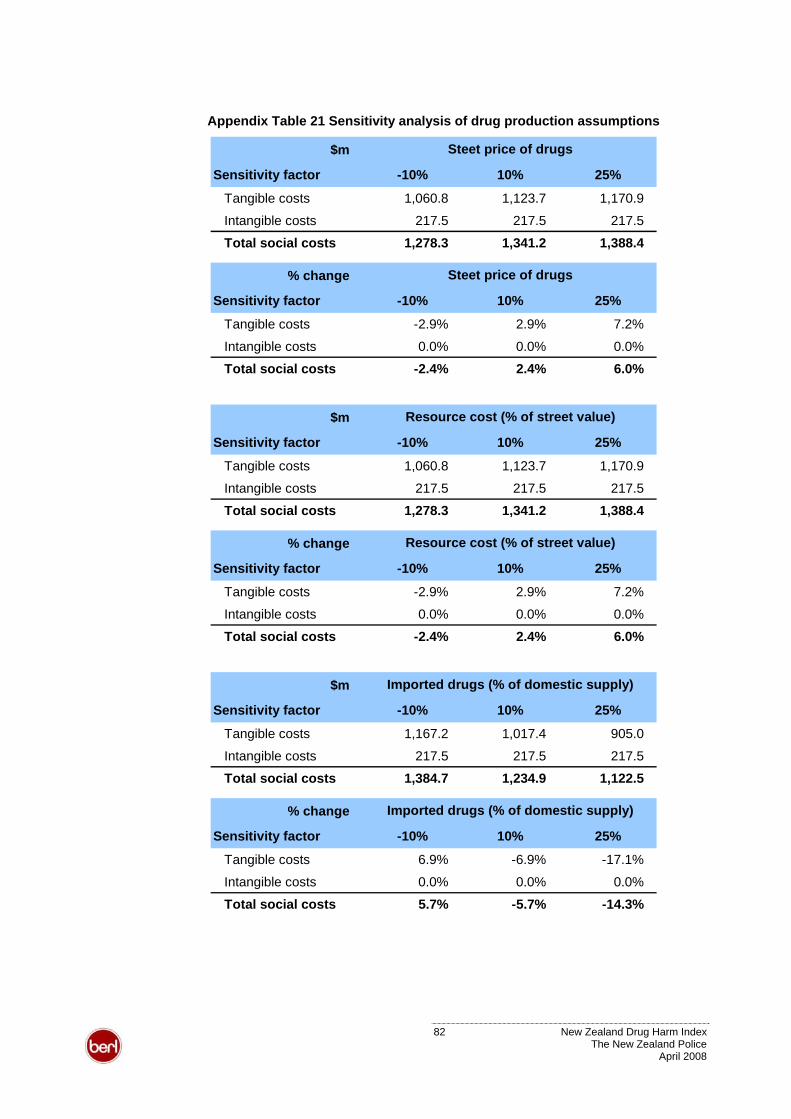
Appendix Table 21 Sensitivity analysis of drug production assumptions
$m
Sensitivity factor -10% 10% 25%
Tangible costs 1,060.8 1,123.7 1,170.9
Intangible costs 217.5 217.5 217.5
Total social costs 1,278.3 1,341.2 1,388.4
Steet price of drugs
% change
Sensitivity factor -10% 10% 25%
Tangible costs -2.9% 2.9% 7.2%
Intangible costs 0.0% 0.0% 0.0%
Total social costs -2.4% 2.4% 6.0%
Steet price of drugs
$m
Sensitivity factor -10% 10% 25%
Tangible costs 1,060.8 1,123.7 1,170.9
Intangible costs 217.5 217.5 217.5
Total social costs 1,278.3 1,341.2 1,388.4
Resource cost (% of street value)
% change
Sensitivity factor -10% 10% 25%
Tangible costs -2.9% 2.9% 7.2%
Intangible costs 0.0% 0.0% 0.0%
Total social costs -2.4% 2.4% 6.0%
Resource cost (% of street value)
$m
Sensitivity factor -10% 10% 25%
Tangible costs 1,167.2 1,017.4 905.0
Intangible costs 217.5 217.5 217.5
Total social costs 1,384.7 1,234.9 1,122.5
Imported drugs (% of domestic supply)
% change
Sensitivity factor -10% 10% 25%
Tangible costs 6.9% -6.9% -17.1%
Intangible costs 0.0% 0.0% 0.0%
Total social costs 5.7% -5.7% -14.3%
Imported drugs (% of domestic supply)
82 New Zealand Drug Harm Index The New Zealand Police
April 2008
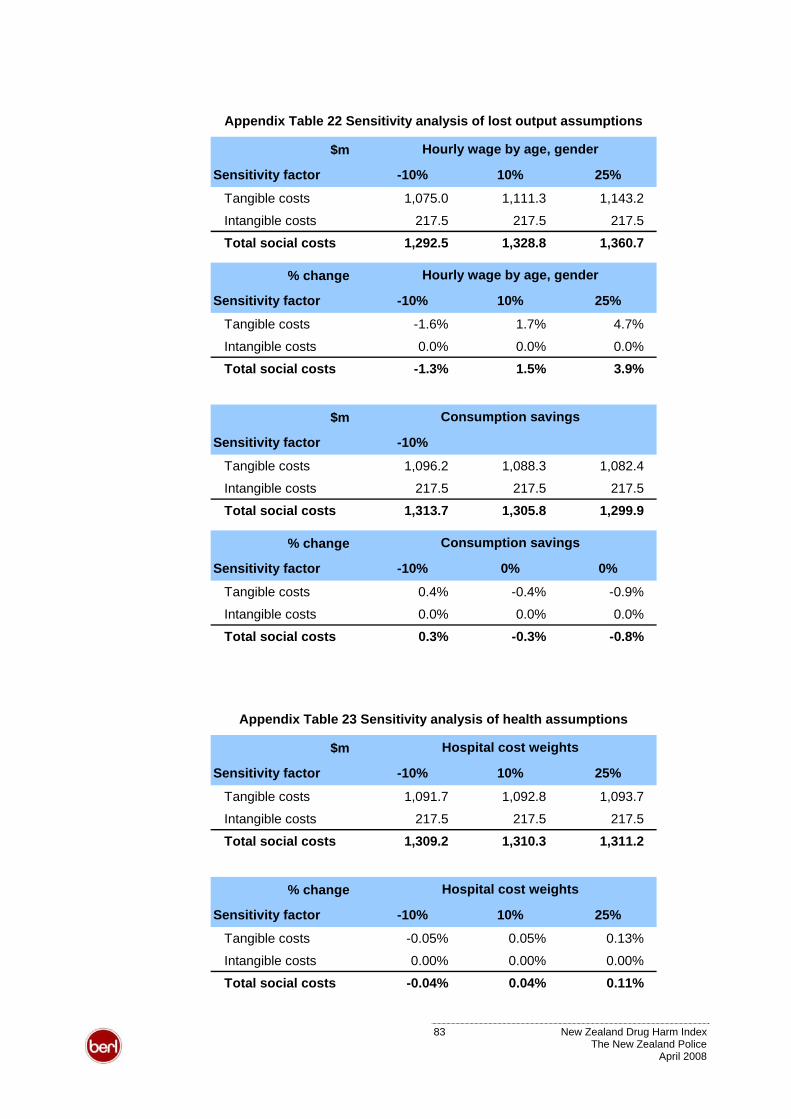
Appendix Table 22 Sensitivity analysis of lost output assumptions
$m
Sensitivity factor -10% 10% 25%
Tangible costs 1,075.0 1,111.3 1,143.2
Intangible costs 217.5 217.5 217.5
Total social costs 1,292.5 1,328.8 1,360.7
Hourly wage by age, gender
% change
Sensitivity factor -10% 10% 25%
Tangible costs -1.6% 1.7% 4.7%
Intangible costs 0.0% 0.0% 0.0%
Total social costs -1.3% 1.5% 3.9%
Hourly wage by age, gender
$m
Sensitivity factor -10%
Tangible costs 1,096.2 1,088.3 1,082.4
Intangible costs 217.5 217.5 217.5
Total social costs 1,313.7 1,305.8 1,299.9
Consumption savings
% change
Sensitivity factor -10% 0% 0%
Tangible costs 0.4% -0.4% -0.9%
Intangible costs 0.0% 0.0% 0.0%
Total social costs 0.3% -0.3% -0.8%
Consumption savings
Appendix Table 23 Sensitivity analysis of health assumptions
$m
Sensitivity factor -10% 10% 25%
Tangible costs 1,091.7 1,092.8 1,093.7
Intangible costs 217.5 217.5 217.5
Total social costs 1,309.2 1,310.3 1,311.2
Hospital cost weights
% change
Sensitivity factor -10% 10% 25%
Tangible costs -0.05% 0.05% 0.13%
Intangible costs 0.00% 0.00% 0.00%
Total social costs -0.04% 0.04% 0.11%
Hospital cost weights
83 New Zealand Drug Harm Index The New Zealand Police
April 2008
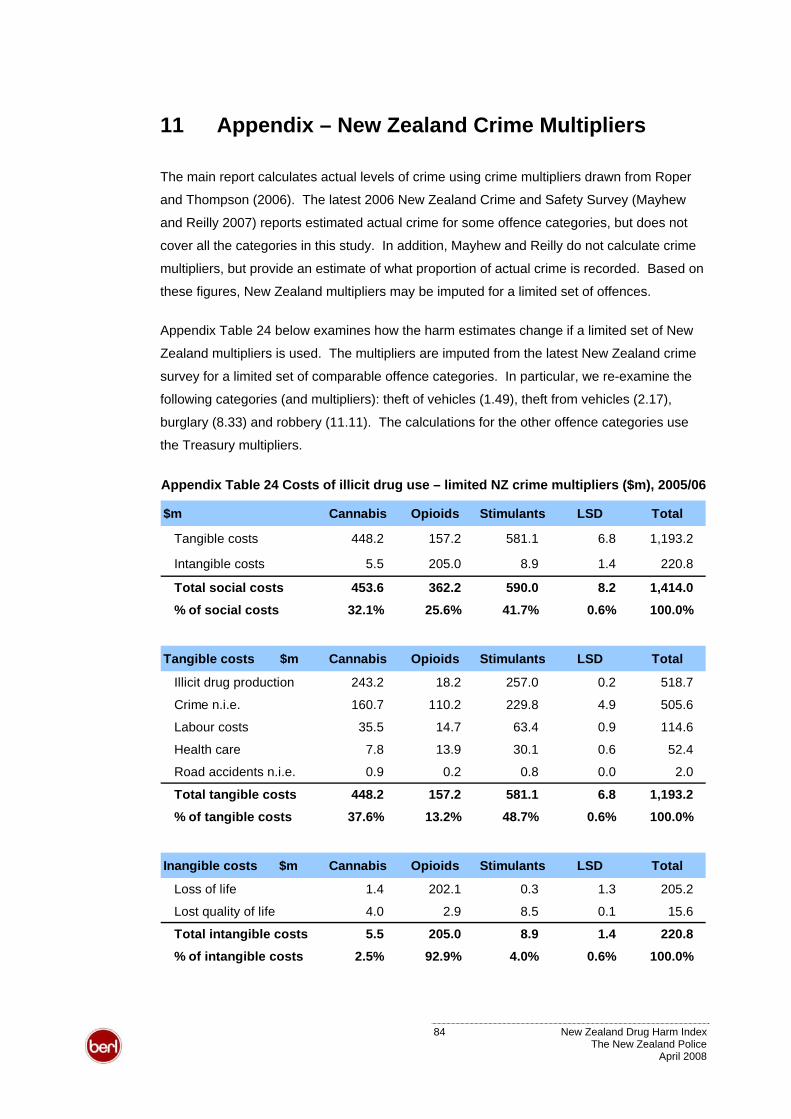
11 Appendix – New Zealand Crime Multipliers
The main report calculates actual levels of crime using crime multipliers drawn from Roper
and Thompson (2006). The latest 2006 New Zealand Crime and Safety Survey (Mayhew
and Reilly 2007) reports estimated actual crime for some offence categories, but does not
cover all the categories in this study. In addition, Mayhew and Reilly do not calculate crime
multipliers, but provide an estimate of what proportion of actual crime is recorded. Based on
these figures, New Zealand multipliers may be imputed for a limited set of offences.
Appendix Table 24 below examines how the harm estimates change if a limited set of New
Zealand multipliers is used. The multipliers are imputed from the latest New Zealand crime
survey for a limited set of comparable offence categories. In particular, we re-examine the
following categories (and multipliers): theft of vehicles (1.49), theft from vehicles (2.17),
burglary (8.33) and robbery (11.11). The calculations for the other offence categories use
the Treasury multipliers.
Appendix Table 24 Costs of illicit drug use – limited NZ crime multipliers ($m), 2005/06
$m Cannabis Opioids Stimulants LSD Total
Tangible costs 448.2 157.2 581.1 6.8 1,193.2
Intangible costs 5.5 205.0 8.9 1.4 220.8
Total social costs 453.6 362.2 590.0 8.2 1,414.0
% of social costs 32.1% 25.6% 41.7% 0.6% 100.0%
Tangible costs $m Cannabis Opioids Stimulants LSD Total
Illicit drug production 243.2 18.2 257.0 0.2 518.7
Crime n.i.e. 160.7 110.2 229.8 4.9 505.6
Labour costs 35.5 14.7 63.4 0.9 114.6
Health care 7.8 13.9 30.1 0.6 52.4
Road accidents n.i.e. 0.9 0.2 0.8 0.0 2.0
Total tangible costs 448.2 157.2 581.1 6.8 1,193.2
% of tangible costs 37.6% 13.2% 48.7% 0.6% 100.0%
Inangible costs $m Cannabis Opioids Stimulants LSD Total
Loss of life 1.4 202.1 0.3 1.3 205.2
Lost quality of life 4.0 2.9 8.5 0.1 15.6
Total intangible costs 5.5 205.0 8.9 1.4 220.8
% of intangible costs 2.5% 92.9% 4.0% 0.6% 100.0%
84 New Zealand Drug Harm Index The New Zealand Police
April 2008
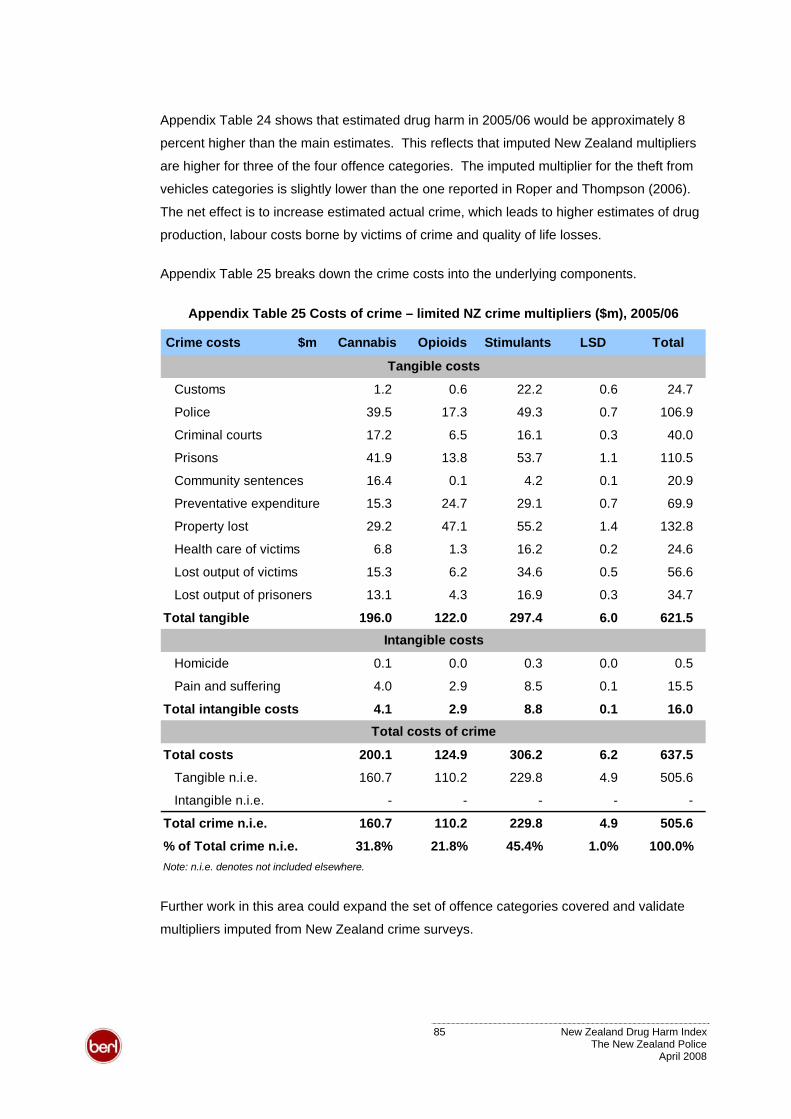
Appendix Table 24 shows that estimated drug harm in 2005/06 would be approximately 8
percent higher than the main estimates. This reflects that imputed New Zealand multipliers
are higher for three of the four offence categories. The imputed multiplier for the theft from
vehicles categories is slightly lower than the one reported in Roper and Thompson (2006).
The net effect is to increase estimated actual crime, which leads to higher estimates of drug
production, labour costs borne by victims of crime and quality of life losses.
Appendix Table 25 breaks down the crime costs into the underlying components.
Appendix Table 25 Costs of crime – limited NZ crime multipliers ($m), 2005/06
Crime costs $m Cannabis Opioids Stimulants LSD Total
Customs 1.2 0.6 22.2 0.6 24.7
Police 39.5 17.3 49.3 0.7 106.9
Criminal courts 17.2 6.5 16.1 0.3 40.0
Prisons 41.9 13.8 53.7 1.1 110.5
Community sentences 16.4 0.1 4.2 0.1 20.9
Preventative expenditure 15.3 24.7 29.1 0.7 69.9
Property lost 29.2 47.1 55.2 1.4 132.8
Health care of victims 6.8 1.3 16.2 0.2 24.6
Lost output of victims 15.3 6.2 34.6 0.5 56.6
Lost output of prisoners 13.1 4.3 16.9 0.3 34.7
Total tangible 196.0 122.0 297.4 6.0 621.5
Homicide 0.1 0.0 0.3 0.0 0.5
Pain and suffering 4.0 2.9 8.5 0.1 15.5
Total intangible costs 4.1 2.9 8.8 0.1 16.0
Total costs 200.1 124.9 306.2 6.2 637.5
Tangible n.i.e. 160.7 110.2 229.8 4.9 505.6
Intangible n.i.e. - - - -
Total crime n.i.e. 160.7 110.2 229.8 4.9 505.6
% of Total crime n.i.e. 31.8% 21.8% 45.4% 1.0% 100.0%Note: n.i.e. denotes not included elsewhere.
Tangible costs
Intangible costs
Total costs of crime
-
Further work in this area could expand the set of offence categories covered and validate
multipliers imputed from New Zealand crime surveys.
85 New Zealand Drug Harm Index The New Zealand Police
April 2008
All work is done, and services rendered at the request of, and for the purposes of the client only. Neither BERL nor
any of its employees accepts any responsibility on any grounds whatsoever, including negligence, to any other
person.
While every effort is made by BERL to ensure that the information, opinions and forecasts provided to the client are
accurate and reliable, BERL shall not be liable for any adverse consequences of the client’s decisions made in
reliance of any report provided by BERL, nor shall BERL be held to have given or implied any warranty as to
whether any report provided by BERL will assist in the performance of the client’s functions.
86 New Zealand Drug Harm Index The New Zealand Police
April 2008


![Harm Reduction Journal BioMed Central · Harm Reduction Journal Research Open Access Overdose prevention for injection drug users: ... [brand name Narcan], a prescription drug used](https://img.pdfslide.us/doc/110x75/5f060a347e708231d415fdc9/harm-reduction-journal-biomed-central-harm-reduction-journal-research-open-access.jpg)