Embed Size (px)
Citation preview

New York University Consolidated Financial Statements August 31, 2016 and 2015
New York University Index August 31, 2016 and 2015
Page(s)
Report of Independent Auditors ........................................................................................................... 1–2
Consolidated Financial Statements
Balance Sheets ............................................................................................................................................ 3
Statements of Activities ................................................................................................................................ 4
Statements of Cash Flows ........................................................................................................................... 5
Notes to Financial Statements ............................................................................................................... 6–46
Appendix A
Supplemental Schedules ..................................................................................................................... 47–57
Notes to Consolidating Supplemental Information……………………………………………………………...58

PricewaterhouseCoopers LLP, PricewaterhouseCoopers Center, 300 Madison Avenue, New York, NY 10017 T: (646) 471 3000, F: (813) 286 6000, www.pwc.com/us
Report of Independent Auditors
To the Board of Trustees of
New York University
We have audited the accompanying consolidated financial statements of New York University (“NYU”),
which comprise the consolidated balance sheets as of August 31, 2016 and 2015, and the related
consolidated statements of activities and cash flows for the years then ended.
Management’s Responsibility for the Consolidated Financial Statements
Management is responsible for the preparation and fair presentation of the consolidated financial
statements in accordance with accounting principles generally accepted in the United States of America;
this includes the design, implementation, and maintenance of internal control relevant to the preparation
and fair presentation of consolidated financial statements that are free from material misstatement,
whether due to fraud or error.
Auditor’s Responsibility
Our responsibility is to express an opinion on the consolidated financial statements based on our audits.
We conducted our audits in accordance with auditing standards generally accepted in the United States of
America. Those standards require that we plan and perform the audit to obtain reasonable assurance
about whether the consolidated financial statements are free from material misstatement.
An audit involves performing procedures to obtain audit evidence about the amounts and disclosures in
the consolidated financial statements. The procedures selected depend on our judgment, including the
assessment of the risks of material misstatement of the consolidated financial statements, whether due to
fraud or error. In making those risk assessments, we consider internal control relevant to NYU’s
preparation and fair presentation of the consolidated financial statements in order to design audit
procedures that are appropriate in the circumstances, but not for the purpose of expressing an opinion on
the effectiveness of NYU’s internal control. Accordingly, we express no such opinion. An audit also
includes evaluating the appropriateness of accounting policies used and the reasonableness of significant
accounting estimates made by management, as well as evaluating the overall presentation of the
consolidated financial statements. We believe that the audit evidence we have obtained is sufficient and
appropriate to provide a basis for our audit opinion.
Opinion
In our opinion, the consolidated financial statements referred to above present fairly, in all material
respects, the financial position of NYU as of August 31, 2016 and 2015, and the changes in their net
assets and their cash flows for the years then ended in accordance with accounting principles generally
accepted in the United States of America.

2
Other Matters
Our audit was conducted for the purpose of forming an opinion on the consolidated financial statements
taken as a whole. The consolidating information on pages 47 through 57 in Appendix A – Supplemental
Schedules is the responsibility of management and was derived from and relates directly to the underlying
accounting and other records used to prepare the consolidated financial statements. The consolidating
information has been subjected to the auditing procedures applied in the audit of the consolidated
financial statements and certain additional procedures, including comparing and reconciling such
information directly to the underlying accounting and other records used to prepare the consolidated
financial statements or to the consolidated financial statements themselves and other additional
procedures, in accordance with auditing standards generally accepted in the United States of America. In
our opinion, the consolidating information is fairly stated, in all material respects, in relation to the
consolidated financial statements taken as a whole. The consolidating information is presented for
purposes of additional analysis of the consolidated financial statements rather than to present the financial
position, changes in net assets and cash flows of the individual companies and is not a required part of
the consolidated financial statements. Accordingly, we do not express an opinion on the financial position,
changes in net assets and cash flows of the individual companies.
December 15, 2016

New York University Consolidated Balance Sheets August 31, 2016 and 2015
(in thousands of dollars)
The accompanying notes are an integral part of these consolidated financial statements.
3
2016 2015
Assets
Cash and cash equivalents 1,033,266$ 1,060,122$
Short-term investments (Note 4) 2,302 119,247
Accounts and loans receivable, net (Note 5) 479,496 490,765
Patient accounts receivable, net (Note 3) 589,946 475,763
Contributions receivable, net (Note 6) 509,842 530,722
Other assets (Note 7) 352,453 339,217
Assets limited as to use - disaster recovery (Note 19) 126,807 16,278
Disaster-related receivable (Note 19) 257,127 393,264
Deposits with trustees (Note 2) 414,927 70,878
Long-term investments (Note 4) 4,432,746 4,265,321
Assets held by insurance captive (CCC550) (Note 11) 400,476 320,426
Land, buildings, and equipment, net (Note 8) 8,276,486 7,310,180
Total assets 16,875,874$ 15,392,183$
Liabilities and Net Assets
Liabilities
Accounts payable and accrued expenses 1,350,784$ 1,132,009$
Disaster-related accounts payable and
accrued expenses (Note 19) 11,296 13,108
Deferred revenue 844,987 849,938
Deferred revenue - disaster related 126,807 16,278
Professional liabilities (Note 11) 459,397 374,262
Bonds and notes payable (Notes 9) 5,291,765 4,509,943
Other leasing obligations (Note 10) - 146,603
Federal grants refundable (Note 5) 79,470 80,030
Accrued benefit obligation (Note 12) 561,203 392,912
Accrued postretirement obligation (Note 13) 630,999 559,271
Asset retirement obligation 225,347 201,466
Total liabilities 9,582,055 8,275,820
Net assets
Unrestricted 3,829,838 3,582,263
Temporarily restricted (Note 17) 1,534,785 1,746,123
Permanently restricted (Note 17) 1,929,196 1,787,977
Total net assets 7,293,819 7,116,363
Total liabilities and net assets 16,875,874$ 15,392,183$

New York University Consolidated Statements of Activities Years Ended August 31, 2016 and 2015
(in thousands of dollars)
The accompanying notes are an integral part of these consolidated financial statements.
4
2016 2015
Changes in unrestricted net assets
Operating revenues
Tuition and fees (net of financial aid awards of $613,962 and $552,445) 1,662,920$ 1,599,870$
Grants and contracts (Note 14) 802,333 762,386
Patient care (net of provision for bad debt $91,799 and $48,566) (Note 3) 4,406,721 3,479,113
Hospital affiliations (Note 15) 321,146 305,458
Insurance premiums earned 65,864 47,203
Contributions 157,128 142,593
Endowment distribution (Note 4) 155,397 146,905
Return on short-term investments (Note 4) 6,284 21,440
Auxiliary enterprises 470,001 434,404
Program fees and other 287,847 257,797
Disaster recovery reimbursement (Note 19) 39,432 15,711
Net assets released from restrictions 125,140 91,987
Total operating revenues 8,500,213 7,304,867
Expenses (Note 16)
Instruction and other academic programs 1,509,379 1,492,235
Research and other sponsored programs 984,702 931,003
Patient care 3,780,268 2,879,440
Hospital affiliations (Note 15) 292,418 282,083
Libraries 79,729 75,635
Student services 129,320 122,042
Auxiliary enterprises 515,901 476,662
Institutional services 994,887 947,893
Disaster-related expenses (Note 19) 29,004 9,973
Total expenses 8,315,608 7,216,966
Excess of operating revenues over expenses 184,605 87,901
Nonoperating activities
Investment return (Note 4) 104,910 3,124
Appropriation of endowment distribution (Note 4) (57,785) (57,467)
Disaster recovery reimbursement for capital (Note 19) 81,173 76,215
Changes in pension and postretirement obligations (Notes 12 and 13) (199,661) (75,795)
Net assets released from restrictions for capital purposes 17,715 32,013
Net assets released from restrictions for hazard mitigation (Note 19) 142,120 92,258
Other 10 14,904
Reclassification related to cy-pres (Note 17) - (48,247)
Loss on bond defeasance (Note 9) (25,512) (104,872)
Acquisition of Lutheran Medical Center (Note 1) - 305,237
Increase in unrestricted net assets 247,575 325,271
Changes in temporarily restricted net assets
Contributions 146,830 188,242
Investment return (Note 4) 76,099 17,603
Appropriation of endowment distribution (Note 4) (97,612) (89,438)
Other (51,680) (19,877)
Net assets released from restrictions for hazard mitigation (Note 19) (142,120) (92,258)
Net assets released from restrictions (142,855) (124,000)
Decrease in temporarily restricted net assets (211,338) (119,728)
Changes in permanently restricted net assets
Contributions 124,505 104,348
Reclassification related to cy-pres (Note 17) - 48,247
Other 16,714 (49,075)
Increase in permanently restricted net assets 141,219 103,520
Increase in net assets 177,456$ 309,063$

New York University Consolidated Statements of Cash Flows Years Ended August 31, 2016 and 2015
(in thousands of dollars)
The accompanying notes are an integral part of these consolidated financial statements.
5
2016 2015
Cash flows from operating activities
Change in net assets 177,456$ 309,063$
Adjustments to reconcile change in net assets to net
cash provided by operating activities
Depreciation and amortization 455,773 394,836
Loss (gain) on sale or disposal of land, buildings and equipment and other adjustments 24,851 (5,706)
Loss on extinguishment of debt 4,793 -
Net (gain) loss on investments and deposits with trustees (137,817) 28,193
Bad debt expense 135,105 124,830
Loss on bond defeasance - 1,534
Pension and postretirement obligation change 199,661 75,795
Contributions received for permanent investment and capital (133,727) (124,776)
Proceeds from disaster recovery award for future mitigation (114,566) (28,736)
Acquisition of Lutheran Medical Center - (305,237)
Changes in operating assets and liabilities
Increase in accounts and loans receivable, net (7,899) (41,151)
Decrease in disaster recovery receivable 136,137 87,119
Increase in patient accounts receivable (205,982) (77,929)
Increase in nonendowment and noncapital contributions receivable (16,404) (28,898)
(Increase) decrease in other assets (3,605) 30,053
Decrease in asset retirement obligation (3,040) (3,722)
Increase (decrease) in accounts payable and accrued expenses 178,519 (63,121)
Decrease in disaster-related accounts payable and accrued expenses (382) (26,306)
Increase in professional liabilities 85,135 45,230
Decrease in deferred revenue (221,022) (45,115)
Increase in accrued pension obligation 14,508 2,458
Increase in accrued postretirement obligation 25,850 34,864
Net cash provided by operating activities 593,344 383,278
Cash flows from investing activities
Purchases of investments (2,820,728) (2,248,549)
Sales and maturities of investments 2,891,095 2,009,759
Proceeds from sale of real estate - 5,891
Increase in deposits held with captive (61,886) (42,930)
Drawdowns of unexpended bond proceeds 382,626 52,120
Additions to land, buildings, and equipment, net of disposals (1,456,482) (1,121,866)
Proceeds from commercial insurance or disaster recovery for capital 216,071 53,220
Cash acquired from acquisition of Lutheran Medical Center - 26,074
Net cash used in investing activities (849,304) (1,266,281)
Cash flows from financing activities
Contributions restricted for permanent investment and capital 133,727 124,776
Proceeds from disaster recovery award for future mitigation 114,566 28,736
Proceeds from short-term borrowings 404,772 276,415
Proceeds from long-term borrowings - 1,634,468
Principal payments on short-term borrowings (317,654) (285,987)
Principal payments on bonds and notes payable (113,831) (1,079,862)
Payments of deferred financing costs (5,623) (7,919)
Decrease in federal grants refundable (560) (87)
Decrease in deposits with bond trustees 13,707 9,895
Net cash provided by financing activities 229,104 700,435
Net decrease in cash (26,856) (182,568)
Cash
Beginning of year 1,060,122 1,242,690
End of year 1,033,266$ 1,060,122$
Supplemental disclosure of cash flow information
Bond proceeds 1,114,910$ -$
Other leasing obligations (146,603) -
Interest paid 217,452 200,373
Acquisitions of land, buildings, and equipment in accounts payable 78,634 45,847
Assets acquired under capital leases 75,630 45,663
Non-cash acquisition of Lutheran Medical Center net assets - 279,163

New York University Notes to Consolidated Financial Statements August 31, 2016 and 2015
(in thousands of dollars)
6
1. Description of New York University
Founded in 1831, New York University (NYU) is a private institution of higher education, research,
and patient care located primarily in New York City. NYU is recognized both nationally and
internationally as a leader in scholarship and is a member of the distinguished Association of
American Universities.
The consolidated reporting entities for NYU consist of the University and NYU Health Operations
(Health Operations), which represents the operations of NYU Langone Health System (Health
System), and NYU School of Medicine (NYUSoM).
The University
The University includes nineteen colleges and divisions each with its own traditions, programs and
faculty. The schools, in order of founding date, are the College of Arts and Science, School of Law,
NYU School of Medicine (reported as a part of NYU Health Operations), College of Dentistry,
Graduate School of Arts and Science, Steinhardt School of Culture, Education and Human
Development, Leonard N. Stern School of Business, Courant Institute of Mathematical Sciences,
School of Continuing and Professional Studies, Institute of Fine Arts, Robert F. Wagner Graduate
School of Public Service, Post-Graduate Medical School, Silver School of Social Work, Tisch
School of the Arts, Gallatin School of Individualized Study, College of Nursing, the Institute for the
Study of the Ancient World, NYU Abu Dhabi, and NYU Tandon School of Engineering (formerly
Polytechnic University founded in 1854). The University also operates academic program sites and
research programs in other parts of the United States and abroad.
In addition to the colleges and divisions, NYU began operating NYU Shanghai in fall 2013, which
grants NYU degrees, as a joint venture with East China Normal University. The NY-based
activities of NYU Shanghai are reported in the University’s balance sheets and statement of
activities.
NYU’s balance sheets and statements of activities also include balances for NYU’s affiliates such
as the Institute for Fine Arts Foundation, NYU School of Business Foundation and NYU School of
Law Foundation.
NYU Health Operations
The Health System is the sole corporate member of NYU Hospitals Center (Hospitals Center). The
Hospitals Center operates the Tisch Hospital, a 705-bed acute care facility and a major center for
specialized procedures in cardiovascular services, neurosurgery, cancer treatment, reconstructive
surgery and transplantation; NYU Hospital for Joint Diseases, a 190-bed acute care facility
specializing in orthopedic, neurologic, and rheumatologic services; NYU Lutheran Medical Center,
a 450-bed acute care hospital in Brooklyn, New York; and several ambulatory facilities, including
the Laura and Isaac Perlmutter Cancer Center, the Ambulatory Care Center, the Center for
Musculoskeletal Care and Hassenfeld Children’s Center.
The NYU School of Medicine is reported as part of NYU Health Operations.
In addition to the Hospitals Center, the Health System’s wholly owned subsidiaries consist of
Lutheran Augustana Center for Extended Care and Rehabilitation, a 240-bed skilled nursing
facility; Lutheran CHHA, Inc., a certified home health agency; Community Care Organization, Inc.,
a licensed home care agency; Shore Hill Housing, Sunset Gardens Housing and Harbor Hill
Housing, which provides senior housing and rent subsidies for people meeting requirements

New York University Notes to Consolidated Financial Statements August 31, 2016 and 2015
(in thousands of dollars)
7
defined by the US Department of Housing and Urban Development; and Sunset Bay Community
Services, Inc., which provides senior services and day care services.
CCC550 is solely owned by the Hospitals Center and provides professional liability insurance to the
Hospitals Center and to physicians employed by the NYUSoM. CCC550 is subject to taxation in
accordance with section 29 of the Exempt Insurance Act in Barbados.
On April 1, 2015, the Hospitals Center completed an affiliation agreement (Affiliation) with Lutheran
Medical Center and its subsidiary entities (Lutheran) which is included in the NYU Langone Health
System. Prior to the Affiliation, the University was the sole corporate member of the Hospitals
Center. With the closing of the Affiliation, the University became the sole corporate member of the
Health System but did not assume any responsibility or liability for the financial obligations of the
Health System. The NYU Board of Trustees appoints the members of the Health System Board,
who are the same individuals who serve on the Hospitals Center Board and the NYUSoM Advisory
Board.
In December 2015, the Hospitals Center and Lutheran Medical Center received a Certificate of
Need approval from the New York State Department of Health for a full asset merger, with the
Hospitals Center as the successor entity. The merger became effective on January 1, 2016, upon
receipt of regulatory approvals.
The change in control of Lutheran was accounted for as a business combination in accordance
with Accounting Standards Codification (ASC), Topic 805, Business Combinations, and ASC
958-805-05, Acquisition by a Not-for-Profit Entity. NYU recorded $305,237 of unrestricted
non-operating income in the 2015 consolidated statement of activities which represents Lutheran’s
net assets at March 31, 2015 and the excess of the fair value of assets acquired over the fair value
of liabilities assumed. No consideration was exchanged for the acquisition.
In 2015, Lutheran changed its fiscal year end from December 31 to August 31 to conform to NYU’s
year end. As a result of this change, obtaining revenues and changes in net assets as though the
acquisition occurred at the beginning of fiscal year 2015 was impracticable.
The following is a summary of the Lutheran activity included in the 2015 consolidated statements of
activities:
2015
Operating revenues 235,508$
Operating expenses 248,030
(12,522)
Non-operating activities 12,512
Net assets as of March 31, 2015 118,138
Excess of the fair value of assets acquired over liabilities 187,099
Change in unrestricted net assets 305,227
Change in temporarily restricted net assets 4,240
Change in permanently restricted net assets 509
Total change in net assets as a result of the acquisition 309,976$

New York University Notes to Consolidated Financial Statements August 31, 2016 and 2015
(in thousands of dollars)
8
The following is a summary of the Lutheran amounts included in the consolidated balance sheet as
of August 31, 2015:
August 31, 2015
Assets 731,742$
Liabilities 421,766
Unrestricted net assets 305,227
Temporarily restricted net assets 4,240
Permanently restricted net assets 509
2. Summary of Significant Accounting Policies
Basis of Presentation
The consolidated financial statements of NYU have, in all material respects, been prepared on an
accrual basis in accordance with accounting principles generally accepted in the United States of
America.
The accompanying consolidated financial statements include the accounts of NYU, as well as its
separately incorporated affiliates. NYU and, generally, all of its affiliates are exempt from federal
income taxes under the provisions of Section 501(c) (3) of the Internal Revenue Code.
NYU prepares its consolidated financial statements in accordance with the provisions of ASC Topic
958, Not for Profit Entities. This standard focuses on the entity as a whole and requires
classification of net assets as unrestricted, temporarily restricted or permanently restricted, as
determined by the existence or absence of restrictions placed on the assets’ uses by donors or by
provision of law. A description of the net assets classifications follows:
Permanently Restricted net assets include gifts, pledges, trusts, and gains explicitly required by
donors to be retained in perpetuity, while allowing the use of the investment return for general or
specific purposes, in accordance with donor provisions.
Temporarily Restricted net assets include contributions and investment return that can be
expended when donor or legal restrictions have been met. Contributions receivable that do not
carry a purpose restriction are deemed to be time restricted. Temporary restrictions are removed
either through the passage of time or because certain actions are taken by NYU that fulfill the
restrictions or both.
Unrestricted net assets are the remaining net assets of NYU that are used to carry out its missions
of education, research and patient care which are not subject to donor restrictions.

New York University Notes to Consolidated Financial Statements August 31, 2016 and 2015
(in thousands of dollars)
9
Operations
Tuition and fees are derived from degree programs as well as executive and continuing education
programs. Tuition and fee revenue is recognized as operating income in the period in which it is
earned. Tuition and fee receipts received in advance are recorded as deferred revenue. Net
tuition and fees are computed after deducting certain scholarships and fellowships awarded to
students. Revenues and expenses related to conducting programmatic activities and provision of
services by NYU are classified as operating in the consolidated statement of activities. Investment
return relating to management-designated endowment funds and the related endowment
appropriation, as well as changes in pension and postretirement obligations and unusual or
nonrecurring activity, are classified as nonoperating in the consolidated statement of activities.
Contributions
Contributions, including unconditional promises to give, are recognized as revenue in the period
received at their fair value. Contributions receivable are reported at their discounted present value,
using an estimated interest rate for the year in which the promise was received and considering
market and credit risk as applicable (2.4% in 2016 and 2.3% in 2015). Amortization of the discount
is recorded as additional contribution revenue. Conditional promises to give are not recognized as
revenue until the conditions on which they depend are substantially met. Allowances are recorded
for estimated uncollectible contributions based upon management’s judgment and analysis of the
creditworthiness of the donors, past collection experience and other relevant factors.
Cash and Cash Equivalents
Cash and cash equivalents include cash and all highly-liquid debt instruments with original
maturities of three months or less when purchased. This does not include pooled investments with
less than three months to maturity held within the long-term investment portfolio. The carrying
amount of cash and cash equivalents approximates fair value due to the short-term maturity of the
instruments.
Deposits with Trustees
Deposits with trustees consist of unexpended bond proceeds (to fund various construction projects)
held by the trustee, the Dormitory Authority of the State of New York (DASNY), of $355,408 and
$9,563 as well as debt service reserve funds held by NYU of $59,519 and $61,315 at August 31,
2016 and 2015, respectively.
Land, Buildings, and Equipment
Land, buildings, and equipment are carried at their acquisition or construction cost. If donated,
these assets are recorded at their fair value on the date of the gift. Buildings and equipment are
depreciated over their estimated useful lives (buildings and building improvements 10-55 years,
equipment 3-10 years) using the straight-line method.
Collections
The University does not assign a value to collection items. Collection items are generally held for
educational purposes and are not disposed of for financial gain or otherwise encumbered in any
manner.
Asset Retirement Obligation
NYU recognizes asset retirement obligations on future events, such as the abatement of asbestos
and removal of lead-based paint and petroleum bulk storage tanks from buildings. The fair value of
the liability for a conditional asset retirement obligation is recognized in the period in which it

New York University Notes to Consolidated Financial Statements August 31, 2016 and 2015
(in thousands of dollars)
10
occurred, provided that it can be reasonably estimated. Corresponding asset retirement costs
(net of accumulated depreciation) have been included in land, buildings, and equipment.
Accounting Estimates
The preparation of financial statements in conformity with accounting principles generally accepted
in the United States of America requires management to make estimates and assumptions that
affect the reported amounts of assets and liabilities, the disclosure of contingencies at the date of
the consolidated financial statements and the reported amounts of revenues and expenses during
the reporting period. Actual results could differ from those estimates.
Reclassifications
Certain amounts in the 2015 consolidated financial statements have been reclassified to conform to
the current year’s presentation.
New Authoritative Pronouncements
In April 2015, the FASB issued Accounting Standard Update (“ASU”) 2015-3, Simplifying the
Presentation of Debt Issuance Costs. This standard requires all costs incurred to issue debt to be
presented in the balance sheet as a direct deduction from the carrying value of the associated debt
liability. The standard is effective for fiscal years beginning after December 15, 2016. In fiscal year
2015, NYU early adopted this standard, and this presentation is reflected on the consolidated
balance sheet as of August 31, 2016 and 2015.
In January 2016, the FASB issued ASU 2016-1, Financial Instruments – Overall (Subtopic 825-10):
Recognition and Measurement of Financial Assets and Financial Liabilities. This guidance
primarily affects the accounting for equity investments, financial liabilities under the fair value
option, and the presentation and disclosure requirements for financial instruments. Certain
financial institutions and companies with large equity investment portfolios that are not currently
being measured at fair value through the income statement are most affected by the new standard.
The new standard also allows entities that are not public business entities and do not carry
financial instruments at fair value in the statement of financial position to no longer be required to
disclose the fair value and significant assumptions used to estimate the fair value of such financial
instruments. The standard is effective for fiscal years beginning after December 15, 2018 for non-
public business entities. NYU early adopted the portion of the standard that eliminates the
disclosure requirement for financial instruments that are not recorded at fair value. As such, NYU
has removed the disclosures of fair value of debt as of August 31, 2016 and 2015.
In May 2015, the FASB issued ASU 2015-7, Fair Value Measurement and Disclosures for
Investments in Certain Entities That Calculate Net Asset Value per Share (or Its Equivalent). This
guidance requires entities to present investments that use net asset value (“NAV”) as a practical
expedient for valuation purposes separately from other investments categorized in the fair value
hierarchy described in Note 4. The standard is effective for fiscal years beginning after
December 15, 2016. NYU is evaluating the impact this will have on the 2017 consolidated financial
statements.
In May 2014, the FASB issued ASU 2014-9, Revenue from Contracts with Customers. This
standard implements a single framework for recognition of all revenue earned from customers.
This framework ensures that entities appropriately reflect the consideration to which they expect to
be entitled in exchange for goods and services by allocating transaction price to identified
performance obligations and recognizing revenue as performance obligations are satisfied.
Qualitative and quantitative disclosures are required to enable users of financial statements to

New York University Notes to Consolidated Financial Statements August 31, 2016 and 2015
(in thousands of dollars)
11
understand the nature, amount, timing, and uncertainty of revenue and cash flows arising from
contracts with customers. The standard is effective for fiscal years beginning after December 15,
2017. NYU is evaluating the impact this will have on the 2019 consolidated financial statements.
In August 2016, the FASB issued ASU 2016-14, Presentation of Financial Statements for Not-for-
Profit Entities. This standard marks the completion of the first phase of a larger project aimed at
improving not-for-profit financial reporting. Under the new guidance, the existing three categories
of net assets will be replaced with a simplified model that combines temporarily restricted and
permanently restricted net assets into a single category called “net assets with donor restrictions”
and renames unrestricted net assets as “net assets without donor restrictions.” There will be new
reporting requirements for expenses and additional disclosures to describe an organization’s
liquidity. The standard is effective for fiscal years beginning after December 15, 2017. NYU is
currently assessing the impact this standard will have on their 2019 consolidated financial
statements.
In February 2016, the FASB issued ASU 2016-02, Leases. Under the new guidance, lessees will
be required to recognize the following for all leases (with the exception of leases with a term of
twelve months or less) at the commencement date: (a) a lease liability, which is a lessee‘s
obligation to make lease payments arising from a lease, measured on a discounted basis; and (b) a
right-of-use asset, which is an asset that represents the lessee’s right to use, or control the use of,
a specified asset for the lease term. The guidance requires a modified retrospective transition
approach for leases existing at, or entered into after, the beginning of the earliest comparative
period presented in the financial statements. The standard is effective for fiscal years beginning
after December 15, 2018. NYU is currently assessing the impact this standard will have on their
2020 consolidated financial statements.
3. Patient Care Revenue
The Health Operations have agreements with third party payors that provide for payments at
amounts different from its established rates (i.e. gross charges). Payment arrangements include
prospective determined rates per discharge, reimbursed costs, discounted charges and per diem
payments.
Patient care services rendered are recorded in the period in which the service is performed, net of
contractual and other allowances that represent differences between gross charges and the
estimated receipts under such programs. Patient care revenue for the Health Operations is
reported at the estimated net realizable amounts due from patients, third-party payors and others
for services rendered and includes estimated retroactive revenue adjustments due to ongoing and
future audits, reviews and investigations. Retroactive adjustments are accrued on an estimated
basis in the period the related services are rendered and adjusted in future periods as final
settlements are determined. Patient accounts receivable are also reduced for allowances for
uncollectible accounts.
The process for estimating the ultimate collection of receivables involves significant assumptions
and judgments. The Health Operations has implemented a quarterly standardized approach to
estimate and review the collectability of receivables based on the payor classification and the
period for which the receivables have been outstanding. Past due balances over 90 days from the
date of billing and in excess of a specified amount are considered delinquent and are reviewed for
collectability. Account balances are written off against the allowance when management feels it is
probable the receivable will not be recovered. Historical collection and payor reimbursement

New York University Notes to Consolidated Financial Statements August 31, 2016 and 2015
(in thousands of dollars)
12
experience is an integral part of the estimation process related to reserves for doubtful accounts.
In addition, the Health Operations assesses the current state of its billing functions in order to
identify any known collection or reimbursement issues and assess the impact, if any, on reserve
estimates. The Health Operations believes that the collectability of its receivables is directly linked
to the quality of its billing processes, most notably those related to obtaining the correct information
in order to bill effectively for the services it provides. Revisions in reserve for doubtful accounts
estimates are recorded as an adjustment to bad debt expense. The Health Operations’ allowance
for uncollectible accounts are $135,532 and $123,279 at August 31, 2016 and 2015 respectively,
and have remained consistent as a percentage of accounts receivables net of contractual
allowances.
Patient service revenue for the Health Operations, net of contractual allowances and discounts, is
as follows for the years ended August 31, 2016 and 2015:
2016 2015
Gross charges 16,046,055$ 12,054,956$
Allowances (11,598,476) (8,567,648)
Patient service revenue, net of contractual allowances 4,447,579 3,487,308
Bad debt (91,799) (48,566)
Total net patient service revenue 4,355,780$ 3,438,742$
The Health Operations has established estimates, based on information presently available, of
amounts due to or from Medicare and non-Medicare payors for adjustments to current and prior
years’ payment rates, based on industry-wide and Health Operations-specific data. The net
amounts due to third party payors at August 31, 2016 and 2015 are $33,624 and $85,609,
respectively. Additionally, certain payors’ payment rates for various years have been appealed by
the Health Operations. If the appeals are successful, additional income applicable to those years
may be realized.
The Hospitals Center’s Medicare cost reports have been audited by the Medicare fiscal
intermediary through December 31, 2012; however, final settlements are pending for 2003, 2004,
and 2011. Lutheran’s Medicare cost reports have been audited by the Medicare fiscal intermediary
through December 31, 2013; however, final settlements are pending for the years 2007 to 2013.
Health Operations grants credit without collateral to its patients, most of who are local residents
and are insured under third-party payor arrangements. The mix of patient service revenue, net of
contractual allowances from patients and third party payors for the years ended August 31, 2016
and 2015 are as follows:
Health System NYUSoM Health System NYUSoM
Medicare 17 % 17 % 16 % 16 %
Medicaid 2 1 2 1
Medicare and Medicaid managed care 15 12 14 9
Blue Cross 25 17 23 17
Managed care and other 41 53 45 57
100 % 100 % 100 % 100 %
20152016

New York University Notes to Consolidated Financial Statements August 31, 2016 and 2015
(in thousands of dollars)
13
The mix of receivables (net of contractual allowances) from patients and third party payors at
August 31, 2016 and 2015 are as follows:
Health System NYUSoM Health System NYUSoM
Medicare 11 % 12 % 12 % 12 %
Medicaid 3 1 3 1
Medicare and Medicaid managed care 25 14 23 11
Blue Cross 16 15 18 15
Managed care and other 45 58 44 61
100 % 100 % 100 % 100 %
2016 2015
The Health System provides significant amounts of partially or totally uncompensated patient care.
For accounting purposes, such uncompensated care is treated either as charity care or bad debt
expense.
The Health System’s charity care policy, in accordance with the New York State Department of
Health’s guidelines, ensures the provision of quality health care to the community served while
carefully considering the ability of the patient to pay. The policy has sliding fee schedules for
inpatient, ambulatory and emergency services provided to the uninsured and under-insured
patients that qualify. Patients are eligible for the charity care fee schedule if they meet certain
income and liquid asset tests. Since payment of the difference between the Hospitals Center’s
standard charges and the charity care fee schedules is not sought, these forgone charges for
charity care are not reported as revenue. Total forgone charges for charity care totaled $129,396
and $55,200 for fiscal year 2016 and 2015, respectively. This equated to an approximate cost of
$33,909 and $14,763 for the years ended August 31, 2016 and 2015, respectively which is based
on a ratio of cost to charges during the respective years.
New York State regulations provide for the distribution of funds from an indigent care pool, which is
intended to partially offset the cost of bad debts and services provided to the uninsured. The funds
are distributed based on each hospital’s level of bad debt and charity care in relation to all other
hospitals. Subsidy payments recognized as revenue amounted to approximately $45,312 and
$27,769 for 2016 and 2015, respectively, and are included in net patient service revenue in the
accompanying consolidated statement of activities.
Patients who do not qualify for sliding scale fees and all uninsured inpatients who do not qualify for
Medicaid assistance are billed at the Hospitals Center’s and Lutheran’s full rates. Uncollected
balances for these patients are categorized as bad debts. Similarly, at NYUSoM, those balances
which are deemed uncollectible based on an inability or unwillingness to pay are written off.
Uncollected balances for these patients are categorized as bad debts and totaled $91,799 and
$48,566 for the years ended August 31, 2016 and 2015, respectively.
4. Investments
Fair Value Measurements
Authoritative guidance of fair value measurements, ASC Topic 820, Fair Value Measurements and
Disclosures, Fair Value Measurements, establishes a hierarchy of valuation methodologies based
on the extent to which asset valuations are observable in the marketplace.

New York University Notes to Consolidated Financial Statements August 31, 2016 and 2015
(in thousands of dollars)
14
The following describes the hierarchy of methodologies used to measure fair value of investments:
Fair value for Level 1 is based on quoted prices in actively traded markets that NYU has the ability
to access for identical assets and liabilities. Market price data is generally obtained from exchange
or dealer markets. NYU does not adjust the quoted price for such assets and liabilities.
Fair value for Level 2 is based on quoted prices for instruments similar to those held by NYU in
actively traded markets, quoted prices for identical instruments held by NYU in markets that are not
actively traded and model-based valuation techniques for which all significant assumptions are
observable in the market or can be corroborated by observable market data. Inputs are obtained
from various sources including market participants, dealers and brokers.
Fair value for Level 3 is based on valuation techniques used to assess prices that are
unobservable as the assets trade infrequently or not at all.
Investments included in Level 3 primarily consist of NYU’s ownership in alternative investments
(principally limited partnership interests in Public Equity, Hedge Funds, Credit, Natural Resources,
Private Equity, Real Estate, and other similar funds). The net asset value (NAV) of the securities
held by limited partnerships that do not have readily determinable fair values are determined by the
general partner and are based on appraisals or other estimates that require varying degrees of
judgment. If no public market exists for the investment securities, the fair value is determined by
the general partner taking into consideration, among other things, the cost of the securities, prices
of recent significant placements of securities of the same issuer and subsequent developments
concerning the companies to which the securities relate. NYU has performed due diligence around
these investments to ensure NAV is an appropriate measure of fair value as of August 31, 2016
and 2015.
If NYU has the ability to redeem from an alternative investment up to 90 days beyond the
measurement date at NAV, the alternative investment is generally categorized as Level 2. If the
redemption period extends beyond 90 days, the investment is categorized as Level 3. Funds for
which NYU does not have discretion for timing of withdrawals are categorized as Level 3.
The methods described above may produce a fair value calculation that may not be indicative of
net realizable value or reflective of future fair values. Furthermore, while NYU believes its valuation
methods are appropriate and consistent with other market participants, the use of different
methodologies or assumptions to determine the fair value of certain financial instruments could
result in a different estimate of fair value at the reporting date.
Asset Classes
NYU invests across a broad range of asset classes, including Public Equity, Hedge Funds, Credit,
Natural Resources, Private Equity, Real Estate, Fixed Income, and Cash and other. NYU may
invest directly in the securities of these asset classes, or indirectly through interests in funds and
limited partnerships. Securities held directly by NYU are valued at their observable market prices.
The value of holdings in funds and limited partnerships are in accordance with the valuations
provided by their investment managers. Funds and limited partnerships may make investments in
securities that are publicly traded, which are generally valued based on observable market prices.
Managers of investment funds and limited partnerships value those investments based upon the
best information available for a given circumstance and may incorporate assumptions that are the
investment manager’s best estimates after consideration of a variety of internal and external
factors.

New York University Notes to Consolidated Financial Statements August 31, 2016 and 2015
(in thousands of dollars)
15
Investments held by NYU’s investment pool are categorized as follows:
Public Equity
Public Equity consists of publicly-traded equity, mutual funds, and other commingled funds (which
may include passive index exposure).
Hedge Funds
Hedge Funds include investments with managers who invest across different strategies such as
long and short equity, multi-strategy, event driven and relative value funds. These managers
typically employ some leverage.
Credit
Credit includes public and private investments in strategies including distressed debt and special
situations.
Natural Resources
Natural Resources includes public and private investments in natural resources.
Private Equity
Private equity investments include limited partnership investments in funds pursuing strategies in
corporate buyouts, growth equity, and venture capital.
Real Estate
Real Estate includes private investments in real estate.
Fixed Income
Fixed Income includes investments in securities such as US government securities, non-US
sovereign bonds, and corporate and asset-backed securities.
Cash & Other
Cash includes investments in cash and cash equivalents. Other investments are predominantly
comprised of liquidating investments (valued at NAV as determined by the general partner).

New York University Notes to Consolidated Financial Statements August 31, 2016 and 2015
(in thousands of dollars)
16
The following table summarizes the fair value of financial instruments at August 31:
Active Observable Unobservable
Markets Inputs Inputs
(Level 1) (Level 2) (Level 3) Total
Long-term investments
Public equity 1,282,671$ 421,266$ 151,284$ 1,855,221$
Hedge funds - 155,179 498,705 653,884
Credit - - 135,310 135,310
Natural resources 9,962 8,308 67,003 85,273
Private equity - - 234,973 234,973
Real estate - - 116,414 116,414
Fixed income - 186,722 - 186,722
Cash and other 316,887 6,304 22,578 345,769
Subtotal investment pool 1,609,520 777,779 1,226,267 3,613,566
Public equity 159,975 2,855 - 162,830
Hedge funds - 506 - 506
Fixed income 649,968 - - 649,968
Cash and other 2,107 7 3,762 5,876
Subtotal other long-term
investments 812,050 3,368 3,762 819,180
Total long-term investments 2,421,570 781,147 1,230,029 4,432,746
Short-term investments
Working capital 2,302 - - 2,302
Total short-term investments 2,302 - - 2,302
Other financial instruments
Split-interest agreements and interest
in perpetual trust (Note 7) - - 33,875 33,875
Deposits with trustees (Note 2) 74,965 339,962 - 414,927
Assets held by CCC550 (Note 11) 5,587 394,889 - 400,476
Total 2,504,424$ 1,515,998$ 1,263,904$ 5,284,326$
2016

New York University Notes to Consolidated Financial Statements August 31, 2016 and 2015
(in thousands of dollars)
17
Active Observable Unobservable
Markets Inputs Inputs
(Level 1) (Level 2) (Level 3) Total
Long-term investments
Public equity 932,780$ 422,912$ 219,157$ 1,574,849$
Hedge funds 7,934 166,647 649,784 824,365
Credit - - 202,444 202,444
Natural resources 6,808 7,242 57,486 71,536
Private equity - - 359,903 359,903
Real estate - - 104,619 104,619
Fixed income - 262,760 - 262,760
Cash and other 88,212 6,134 7,740 102,086
Subtotal investment pool 1,035,734 865,695 1,601,133 3,502,562
Public equity 81,316 3,015 - 84,331
Hedge funds - 36,416 - 36,416
Fixed income 597,230 36,199 - 633,429
Cash and other 1,700 4 6,879 8,583
Subtotal other long-term
investments 680,246 75,634 6,879 762,759
Total long-term investments 1,715,980 941,329 1,608,012 4,265,321
Short-term investments
Working capital 119,247 - - 119,247
Total short-term investments 119,247 - - 119,247
Other financial instruments
Split-interest agreements and interest
in perpetual trust (Note 7) - - 30,474 30,474
Deposits with trustees (Note 2) 52,990 17,888 - 70,878
Assets held by CCC550 (Note 11) 22,292 298,134 - 320,426
Total 1,910,509$ 1,257,351$ 1,638,486$ 4,806,346$
2015
The following table provides the changes in the amounts reported in the consolidated balance
sheets for financial instruments classified by NYU within Level 3 of the fair value hierarchy defined
above:
Public Hedge Natural Private Real Split-interest and Cash and Total
Equity Funds Credit Resources Equity Estate perpetual trust other Investments
Fair value, August 31, 2015 219,157$ 649,784$ 202,444$ 57,486$ 359,903$ 104,619$ 30,474$ 14,619$ 1,638,486$
Realized gains (losses) 24,613 119,947 17,037 4,780 22,887 2,652 - 260 192,176
Unrealized (losses) gains (30,949) (116,192) (18,262) (2,652) (33,315) 5,574 3,448 (25,312) (217,660)
Purchases - 144,000 23,144 15,235 47,422 26,721 - 40,801 297,323
Sales (61,537) (298,834) (89,053) (7,846) (161,924) (23,152) (47) (4,028) (646,421)
Fair value, August 31, 2016 151,284$ 498,705$ 135,310$ 67,003$ 234,973$ 116,414$ 33,875$ 26,340$ 1,263,904$
Public Hedge Natural Private Real Split-interest and Cash and Total
Equity Funds Credit Resources Equity Estate perpetual trust other Investments
Fair value, August 31, 2014 114,941$ 608,300$ 222,437$ 75,031$ 291,455$ 86,442$ 32,698$ 37,862$ 1,469,166$
Realized (losses) gains (106) 5,429 (23,668) 3,624 35,033 10,381 - 10,598 41,291
Unrealized gains (losses) 9,920 3,151 26,998 (17,501) 31,588 1,645 (2,164) (7,658) 45,979
Purchases 4,500 12,000 48,581 13,746 80,327 37,256 - 729 197,139
Sales (1,397) (52,976) (71,904) (4,947) (78,500) (31,105) (60) (28,602) (269,491)
Transfers in (out) 91,299 73,880 - (12,467) - - - 1,690 154,402
Fair value, August 31, 2015 219,157$ 649,784$ 202,444$ 57,486$ 359,903$ 104,619$ 30,474$ 14,619$ 1,638,486$
2016
2015
New York University Notes to Consolidated Financial Statements August 31, 2016 and 2015
(in thousands of dollars)
18
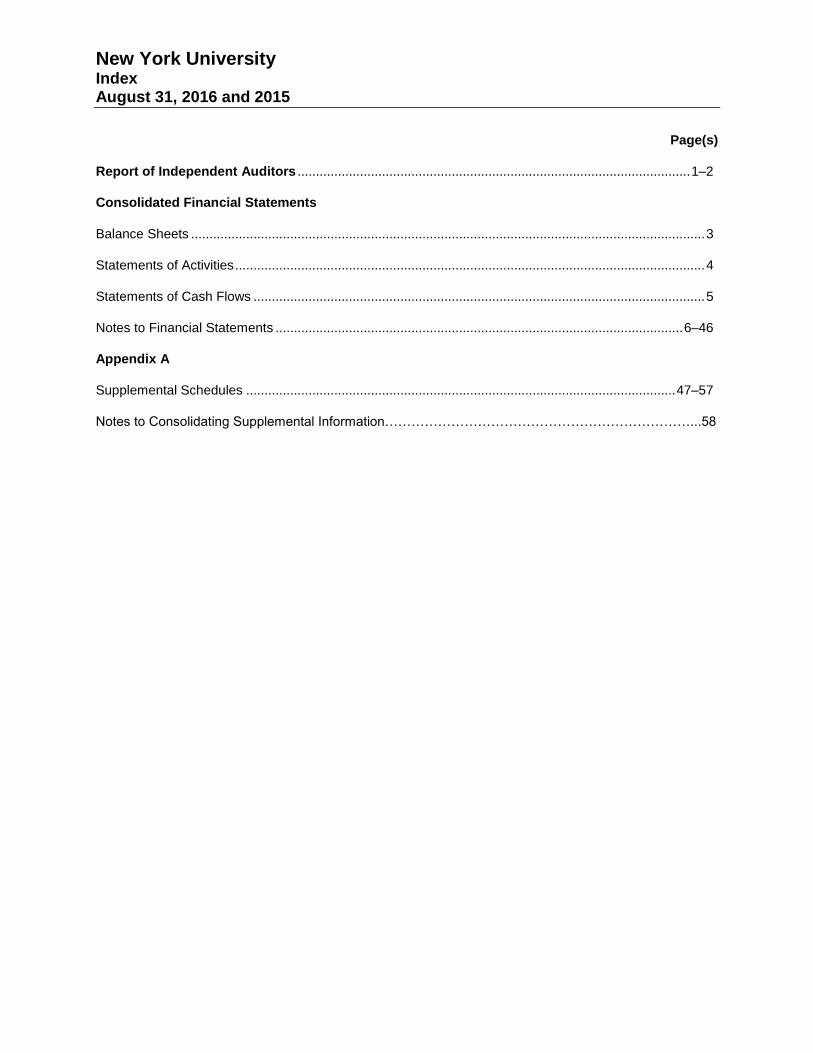
At August 31, 2016, NYU’s unfunded commitments are as follows:
Unfunded Remaining Timing to Draw
Commitments Life Commitments
Private equity 81,775$ Up to 12 years 7 to 30 days
Credit 34,046 Up to 10 years 7 to 30 days
Natural resources 33,815 Up to 10 years 7 to 30 days
Real estate 79,000 Up to 10 years 7 to 30 days
228,636$
NYU records purchases and sales of securities on a trade-date basis. NYU has included
receivables for securities sold of $304 and $69,369 at August 31, 2016 and 2015, respectively, and
liabilities for securities purchased of $560 and $42,382 at August 31, 2016 and 2015, respectively,
in long-term investments.
Total investment return for the years ended August 31, 2016 and 2015 is as follows:
2016 2015
Dividends and interest 50,813$ 71,764$
Realized and unrealized gains (losses), net 142,358 (19,537)
Investment expenses (5,878) (10,060)
Total investment return, net 187,293$ 42,167$
Endowment distribution approved for spending 155,397$ 146,905$
Return on short-term investments 6,284 21,440
Unrestricted investment return, net of spending 47,125 (54,343)
Temporarily restricted investment return, net of spending (21,513) (71,835)
Total investment return, net 187,293$ 42,167$
NYU maintains an investment pool for its long-term investments which include its endowment and
similar funds. The pool is managed to achieve the maximum long-term return given prudent risk
parameters. NYU relies on a total return strategy, the objective of which is to achieve a long-term
rate of return consisting of a combination of current income and capital appreciation, recognizing
that changes in market conditions and interest rates will result in varying strategies in an attempt to
optimize results. Investment return (realized and unrealized net gains or losses, interest and
dividends) and the appropriation for the approved endowment distribution for board-designated
endowment funds are reported as nonoperating activities in the consolidated statement of
activities. Investment return and the appropriation for the approved endowment distribution for true
endowment funds are reported as temporarily restricted activities in the consolidated statement of
activities.

New York University Notes to Consolidated Financial Statements August 31, 2016 and 2015
(in thousands of dollars)
19
NYU’s Board of Trustees has authorized a spending policy designed to allow asset growth while
providing a predictable flow of return to support operations. Distributions from the endowment to
support operations (approximately 5% in 2016 and 2015) are calculated using the prior year
distribution adjusted for the change in the New York Metro Area Consumer Price Index (CPI). To
preserve the endowment’s purchasing power, caps further limit spending as follows: 1) the
distribution of endowment return to support operations may not exceed the prior year ’s distribution
by more than 10%, unless the increase was the result of new gifts to the endowment, and 2) if the
results of using only the average market value of either the final four quarters alone or the final
eight quarters alone would be a decline in the distribution from the prior year’s distribution, then the
distribution may not exceed the previous year’s level.
5. Accounts and Loans Receivable, net
Accounts and loans receivable, net of allowances for uncollectable amounts consist of the following
at August 31, 2016 and 2015:
2016 2015
Students and other 120,534$ 137,230$
Grants and contracts 84,460 79,524
Student loans 120,488 124,154
Housing loans and other loans to employees 65,290 65,818
Insurance premiums and recoveries 133,401 128,628
524,173 535,354
Allowance for uncollectible amounts (44,677) (44,589)
Accounts and loans receivable, net 479,496$ 490,765$
The allowance for uncollectible amounts at August 31, 2016 and 2015 consists of the following:
2016 2015
Students and other (26,540)$ (24,190)$
Grants and contracts (10,173) (12,398)
Student loans (7,515) (7,472)
Housing loans and other loans to employees (449) (529)
Total allowance for uncollectible amounts (44,677)$ (44,589)$
A reasonable estimate of the fair value of loans receivable from students under government loan
programs could not be made because the notes cannot be sold and can only be assigned to the
U.S. Government or its designees. The fair value of loans receivable from students under NYU ’s
loan programs approximates carrying value.
Student loans consist primarily of Federal advances to the University under Perkins and other
Federal Loan Programs which totaled $79,470 and $80,030 at August 31, 2016 and 2015,
respectively. NYU records a liability on its consolidated balance sheet for these advances.
New York University Notes to Consolidated Financial Statements August 31, 2016 and 2015
(in thousands of dollars)
20
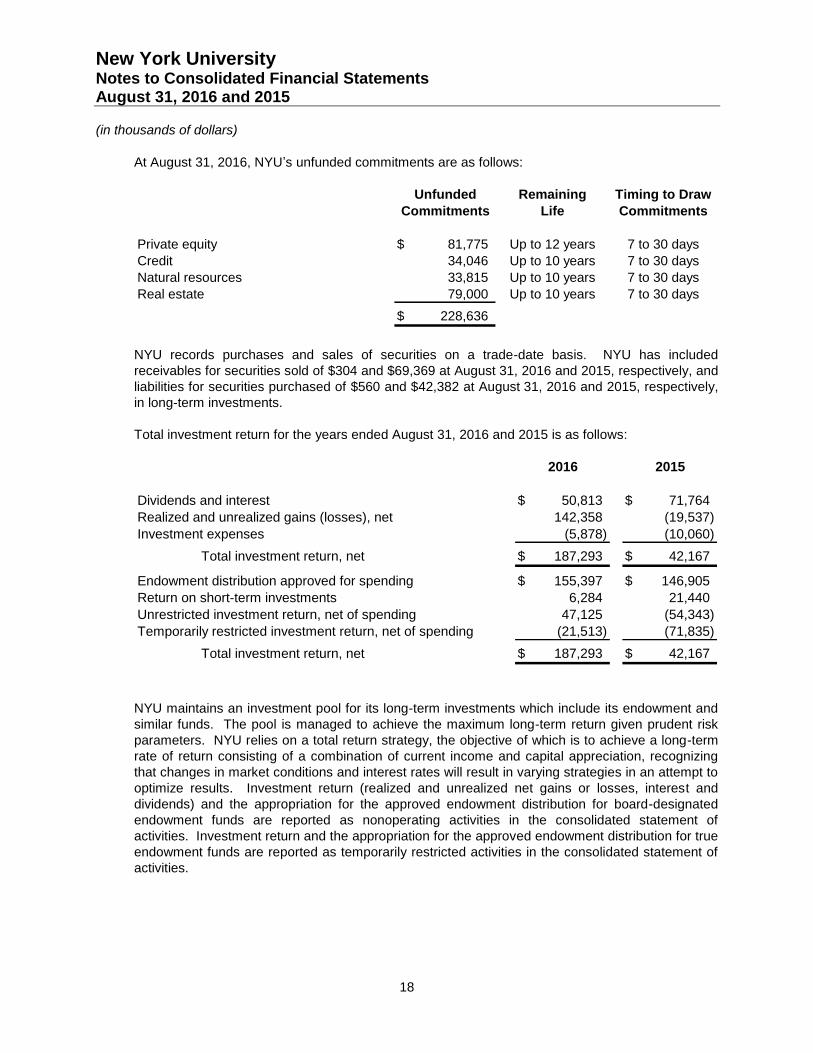
Management regularly assesses the adequacy of the allowance for credit losses by performing
ongoing evaluation of the accounts and loans receivable portfolios.
Housing loans and other loans to employees are secured by an interest in the underlying property
or continued employment.
6. Contributions Receivable
Contributions receivable consist of the following at August 31, 2016 and 2015:
2016 2015
Amounts expected to be collected in
Less than one year 148,233$ 158,328$
One to five years 399,733 380,900
More than five years 91,673 91,320
639,639 630,548
Discount (45,172) (40,045)
Allowance for uncollectible amounts (84,625) (59,781)
Contributions receivable, net 509,842$ 530,722$
Contributions receivable activity for the years ended August 31, 2016 and 2015 is as follows:
2016 2015
Contributions receivable, beginning of year, net 530,722$ 578,125$
Add discount and allowance
for uncollectible amounts 99,826 109,907
Contributions receivable, beginning of year, gross 630,548 688,032
New pledges received 211,702 200,639
Adjustments and write-offs (23,846) (74,998)
Pledge payments received (178,765) (183,125)
Subtotal 639,639 630,548
Deduct discount and allowance
for uncollectible amounts (129,797) (99,826)
Contributions receivable, end of year, net 509,842$ 530,722$
Conditional promises to give, not included in these financial statements, are $691,044 and
$681,625 at August 31, 2016 and 2015, respectively.
Expenses related to fundraising activities are $54,761 and $47,562 for the years ended August 31,
2016 and 2015, respectively.
New York University Notes to Consolidated Financial Statements August 31, 2016 and 2015
(in thousands of dollars)
21
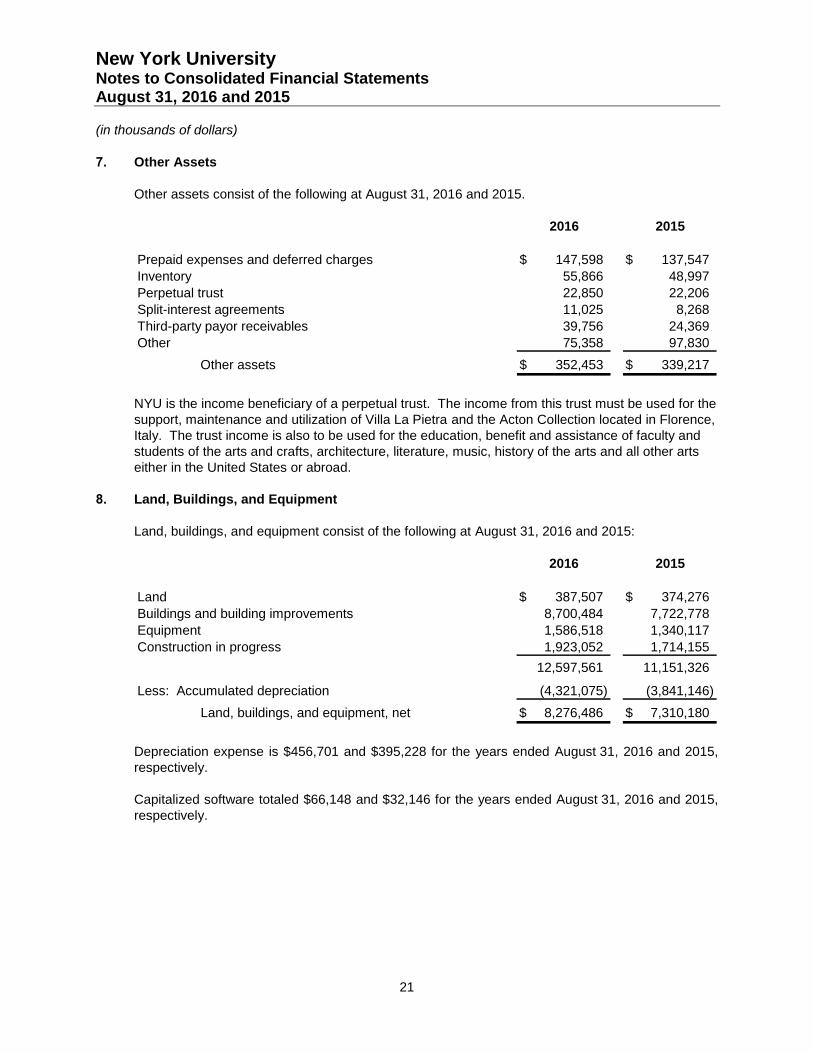
7. Other Assets
Other assets consist of the following at August 31, 2016 and 2015.
2016 2015
Prepaid expenses and deferred charges 147,598$ 137,547$
Inventory 55,866 48,997
Perpetual trust 22,850 22,206
Split-interest agreements 11,025 8,268
Third-party payor receivables 39,756 24,369
Other 75,358 97,830
Other assets 352,453$ 339,217$
NYU is the income beneficiary of a perpetual trust. The income from this trust must be used for the
support, maintenance and utilization of Villa La Pietra and the Acton Collection located in Florence,
Italy. The trust income is also to be used for the education, benefit and assistance of faculty and
students of the arts and crafts, architecture, literature, music, history of the arts and all other arts
either in the United States or abroad.
8. Land, Buildings, and Equipment
Land, buildings, and equipment consist of the following at August 31, 2016 and 2015:
2016 2015
Land 387,507$ 374,276$
Buildings and building improvements 8,700,484 7,722,778
Equipment 1,586,518 1,340,117
Construction in progress 1,923,052 1,714,155
12,597,561 11,151,326
Less: Accumulated depreciation (4,321,075) (3,841,146)
Land, buildings, and equipment, net 8,276,486$ 7,310,180$
Depreciation expense is $456,701 and $395,228 for the years ended August 31, 2016 and 2015,
respectively.
Capitalized software totaled $66,148 and $32,146 for the years ended August 31, 2016 and 2015,
respectively.

New York University Notes to Consolidated Financial Statements August 31, 2016 and 2015
(in thousands of dollars)
22
9. Bonds and Notes Payable
NYU has various bond issues outstanding, primarily issued through DASNY. The University and
NYUSoM are considered the legally obligated group for certain borrowings presented below as the
“Total Obligated Group”.
Bonds and notes payable consist of the following at August 31, 2016 and 2015:
Total
School of Obligated Health Consolidated
University Medicine Group System NYU
Issuer
Dormitory Authority of the State
of New York (DASNY) 2,541,269$ 397,121$ 2,938,390$ 406,908$ 3,345,298$
New York City Industrial
Development Agency (NYCIDA) 88,965 - 88,965 - 88,965
New York University (NYU) 305,957 79,652 385,609 - 385,609
NYU Hospitals Center - - - 894,097 894,097
Other notes payable 94,465 74,037 168,502 409,294 577,796
Bonds and notes payable 3,030,656$ 550,810$ 3,581,466$ 1,710,299$ 5,291,765$
2016
Total
School of Obligated Hospitals Consolidated
University Medicine Group Center NYU
Issuer
Dormitory Authority of the State
of New York (DASNY) 1,857,905$ 200,730$ 2,058,635$ 413,878$ 2,472,513$
New York City Industrial
Development Agency (NYCIDA) 90,983 - 90,983 - 90,983
New York University (NYU) 311,332 82,777 394,109 - 394,109
NYU Hospitals Center - - - 893,892 893,892
Other notes payable 240,347 110,877 351,224 307,222 658,446
Bonds and notes payable 2,500,567$ 394,384$ 2,894,951$ 1,614,992$ 4,509,943$
2015
In June 2016, DASNY issued $582,875 of revenue bonds (Series 2016A) on behalf of the
Obligated Group with interest rates ranging from 2.00% to 5.00%. The Series 2016A bonds mature
serially from July 2021 through July 2036, as well as July 2039, July 2041, and July 2043.
In June 2016, DASNY issued $246,235 of taxable bonds (Series 2016B), with interest rates
ranging from 1.20% to 3.88%. The Series 2016B bonds mature serially from July 2018 through
July 2022, as well as in July 2046. The Series 2016B bonds maturing in July 2046 are payable in
annual sinking fund installments from July 2042 to maturity.
The proceeds from the Series 2016A and Series 2016B bonds were used to fund capital
improvements at the New York City campus.
In June 2016, the Hospitals Center issued through DASNY, Series 2016A bonds totaling
$157,270. The Series 2016A bonds are payable at varying dates through July 2040 at a fixed rate
varying from 2.75% through 5.00%. The proceeds of the Series 2016A bonds were used to
advance refund the Hospitals Center’s outstanding indebtedness on its Series 2006A bonds and a

New York University Notes to Consolidated Financial Statements August 31, 2016 and 2015
(in thousands of dollars)
23
portion of its Series 2011A bonds. In connection with this transaction, the Hospitals Center
recorded a loss on extinguishment of approximately $24,377. This loss is primarily the result of an
interest prepayment requirement of $20,940 and the write-off of unamortized deferred financing
costs and bond discounts of $3,437.
In April 2015, DASNY issued $691,435 of revenue bonds (Series 2015A) on behalf of the Obligated
Group with interest rates ranging from 2.00% to 5.50%. The Series 2015A bonds mature serially
from July 2016 through July 2035, as well as in July 2038, July 2041, July 2045 and July 2048.
The Series 2015A bonds maturing in 2038, 2041, 2045 and 2048 are payable in annual sinking
fund installments from July 2036 to July 2048 to maturity.
In April 2015, the University issued Series 2015 taxable bonds totaling $272,285, with interest rates
ranging from 0.57% to 4.14%. The Series 2015 bonds mature serially from July 2016 through
July 2028, as well as in July 2048. The Series 2015 bonds maturing in 2048 are payable in annual
sinking fund installments from July 2029 to July 2048.
The proceeds from the Series 2015A and Series 2015 taxable bonds were used to advance refund
portions of the Series 2007A, 2008A, 2008B, and 2008C bonds as well as to fund improvements on
the Washington Square and Brooklyn campuses. In connection with this transaction, the University
recorded a loss on bond defeasance of approximately $78,000.
In January 2015, DASNY issued $117,310 of revenue bonds (Series 2014 S2) on behalf of the
Hospitals Center with interest rates ranging from 2.00% to 5.00%. The Series 2014 S2 bonds
mature serially from July 2015 through July 2035. The proceeds from Series 2014 S2 bonds were
used to advance refund the Hospitals Center’s outstanding indebtedness on the Series 2007A
bonds. In connection with this transaction, the Hospitals Center recorded a loss on bond
defeasance of approximately $13,400.
In December 2014, DASNY issued $77,700 of revenue bonds (Hospitals Center Series 2014B) on
behalf of the Hospitals Center with interest rates ranging from 2.00% to 5.00%. The Hospitals
Center Series 2014B bonds mature serially from July 2015 through July 2032. The proceeds from
the Hospitals Center Series 2014B bonds were used to advance refund the outstanding Hospitals
Center DASNY Series 2007B revenue bonds. In connection with this transaction, the Hospitals
Center recorded a loss on bond defeasance of approximately $13,700.
In November 2014, the Hospitals Center issued $300,000 of taxable bonds (Hospitals Center
Series 2014A) with an interest rate of 4.78%. The Hospitals Center Series 2014A bonds mature in
2044. Interest is payable semi-annually on January 1 and July 1 of each year from July 2015 to
maturity. The proceeds from the Hospitals Center Series 2014A bonds will be used to fund the
costs of various construction, renovation and equipping projects, repay certain outstanding lines of
credit and fund other eligible purposes.
In October 2014, DASNY issued $55,000 of revenue bonds (Series 2014A) on behalf of the
Obligated Group with an interest rate of 2.59%. The Series 2014A bonds mature in July 2034 and
are payable in annual sinking fund installments from July 2017 to maturity. The proceeds from the
Series 2014A bonds were used to refinance the University DASNY Series 2004A bonds.

New York University Notes to Consolidated Financial Statements August 31, 2016 and 2015
(in thousands of dollars)
24
The principal amounts outstanding for bonds and notes payable consist of the following at
August 31, 2016 and 2015:
Total
School of Obligated Health Consolidated
University Medicine Group System NYU
DASNY
Series 1998A bonds, with interest rates ranging
from 5.75% to 6.00%, maturing serially through
July 2020, payable thereafter in annual sinking fund
installments to maturity in 2027 (including premium
of $4,499) 150,674$ -$ 150,674$ -$ 150,674$
2001 Series 1 bonds, with an interest rate
of 5.50%, maturing serially through July 2025,
payable thereafter in annual sinking fund
installments to maturities in July 2031 and
July 2040 (including premiums of $2,461 and $2,540) 62,171 51,394 113,565 - 113,565
Series 2007A bonds, with an interest rate of
4.25% maturing serially through the call date in July
2017 (including premiums of $29) 3,584 - 3,584 - 3,584
Series 2008A bonds, with interest rates ranging
from 4.00% to 5.00% maturing serially
through the call date in July 2018
(including premium of $67) 7,437 - 7,437 - 7,437
Series 2008B bonds, with interest rates ranging
from 4.00% to 5.00% maturing serially
through the call date in July 2018
(including premium of $51) 6,066 - 6,066 - 6,066
Series 2008C bonds, with an interest rate of
4.00% maturing serially through the call date in July
2018 (including premium of $22) 4,737 - 4,737 - 4,737
Series 2009A bonds, with interest rates ranging
from 3.10% to 5.25%, maturing serially through
July 2029, payable thereafter in annual sinking fund
installments to maturities in July 2034 and July 2039
(including net premiums of $10,557 and $1,211) 360,958 35,411 396,369 - 396,369
Series 2009B bonds, with an interest rate of 5.00%,
payable in annual sinking fund installments from July
2030 and July 2034, respectively, to maturities in July
2034 and July 2039 (including premium of $840) - 65,100 65,100 - 65,100
Series 2011A bonds, with interest rates ranging from 2.00%
to 6.00%, maturing serially through July 2026,
payable thereafter in annual sinking fund installments
to maturities in July 2031 and July 2040 - - - 15,725 15,725
Series 2012A bonds, with interest rates ranging from 3.00%
to 5.00%, maturing serially through July 2032,
payable thereafter in annual sinking fund installments
to maturities in July 2037 and July 2042 (including
net premiums of $13,603 and $4,586) 156,106 47,458 203,564 - 203,564
Series 2012B bonds, with interest rates ranging from 4.00%
to 5.00%, maturing serially through July 2032,
payable thereafter in annual sinking fund installments
to maturities in July 2037 and July 2042 (including
premium of $4,508) 59,543 - 59,543 - 59,543
2016
New York University Notes to Consolidated Financial Statements August 31, 2016 and 2015
(in thousands of dollars)
25
Total
School of Obligated Health Consolidated
University Medicine Group System NYU
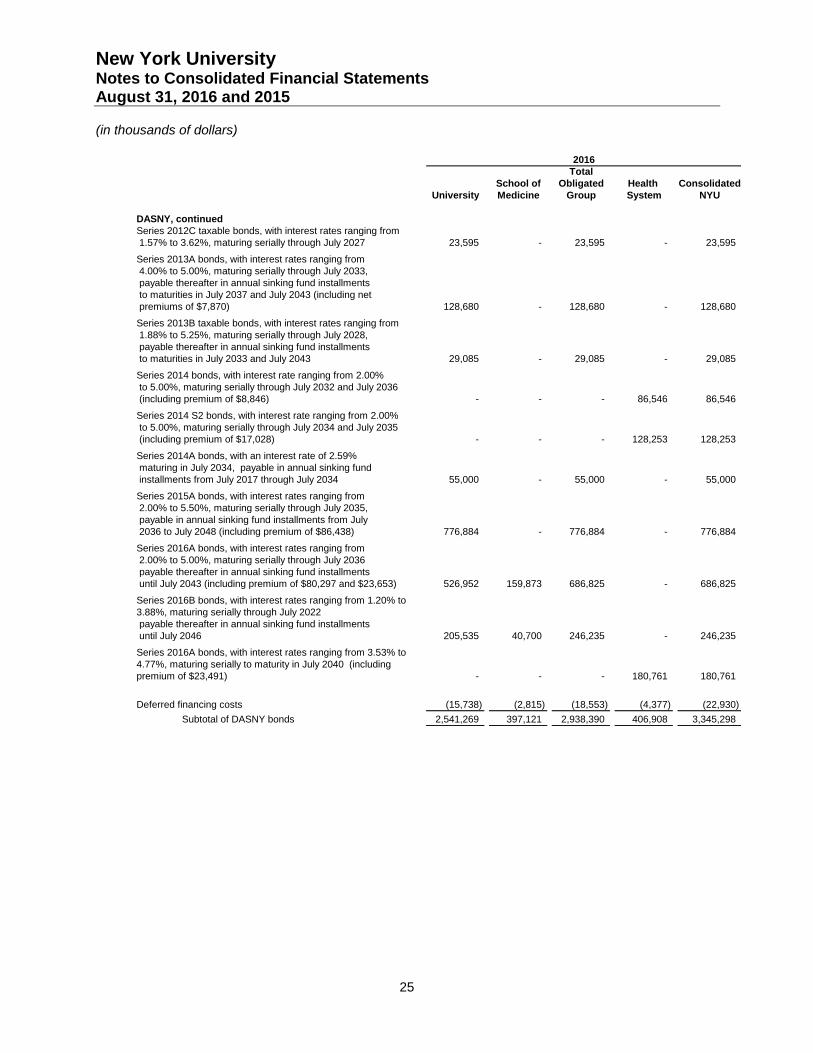
DASNY, continued
Series 2012C taxable bonds, with interest rates ranging from
1.57% to 3.62%, maturing serially through July 2027 23,595 - 23,595 - 23,595
Series 2013A bonds, with interest rates ranging from
4.00% to 5.00%, maturing serially through July 2033,
payable thereafter in annual sinking fund installments
to maturities in July 2037 and July 2043 (including net
premiums of $7,870) 128,680 - 128,680 - 128,680
Series 2013B taxable bonds, with interest rates ranging from
1.88% to 5.25%, maturing serially through July 2028,
payable thereafter in annual sinking fund installments
to maturities in July 2033 and July 2043 29,085 - 29,085 - 29,085
Series 2014 bonds, with interest rate ranging from 2.00%
to 5.00%, maturing serially through July 2032 and July 2036
(including premium of $8,846) - - - 86,546 86,546
Series 2014 S2 bonds, with interest rate ranging from 2.00%
to 5.00%, maturing serially through July 2034 and July 2035
(including premium of $17,028) - - - 128,253 128,253
Series 2014A bonds, with an interest rate of 2.59%
maturing in July 2034, payable in annual sinking fund
installments from July 2017 through July 2034 55,000 - 55,000 - 55,000
Series 2015A bonds, with interest rates ranging from
2.00% to 5.50%, maturing serially through July 2035,
payable in annual sinking fund installments from July
2036 to July 2048 (including premium of $86,438) 776,884 - 776,884 - 776,884
Series 2016A bonds, with interest rates ranging from
2.00% to 5.00%, maturing serially through July 2036
payable thereafter in annual sinking fund installments
until July 2043 (including premium of $80,297 and $23,653) 526,952 159,873 686,825 - 686,825
Series 2016B bonds, with interest rates ranging from 1.20% to
3.88%, maturing serially through July 2022
payable thereafter in annual sinking fund installments
until July 2046 205,535 40,700 246,235 - 246,235
Series 2016A bonds, with interest rates ranging from 3.53% to
4.77%, maturing serially to maturity in July 2040 (including
premium of $23,491) - - - 180,761 180,761
Deferred financing costs (15,738) (2,815) (18,553) (4,377) (22,930)
Subtotal of DASNY bonds 2,541,269 397,121 2,938,390 406,908 3,345,298
2016

New York University Notes to Consolidated Financial Statements August 31, 2016 and 2015
(in thousands of dollars)
26
Total
School of Obligated Health Consolidated
University Medicine Group System NYU
NYCIDA
NYCIDA Series 2007 bonds, with interest rates ranging
4.40% to 5.25%, maturing serially through November 2022,
payable in annual sinking fund installments from November
2023 through November 2037 (including premium of $938) 93,918 - 93,918 - 93,918
Deferred financing costs (4,953) - (4,953) - (4,953)
Subtotal of NYCIDA 88,965 - 88,965 - 88,965
NYU
Series 2009 taxable bonds, with an interest rate of 5.24%,
maturing in July 2032, payable in annual sinking
fund installments from July 2015 to maturity 15,385 80,264 95,649 - 95,649
Series 2010 taxable bonds, with an interest rate
of 4.96%, maturing in July 2032, payable in annual
sinking fund installments from July 2015 to maturity 23,495 - 23,495 - 23,495
Series 2015 taxable bonds, with interest rates ranging
from 0.90% to 4.14%, maturing serially through July
2028, payable in annual sinking fund installments
from July 2029 to July 2048 267,380 - 267,380 - 267,380
Deferred financing costs (303) (612) (915) - (915)
Subtotal of NYU Bonds 305,957 79,652 385,609 - 385,609
NYU Hospitals Center
Series 2012 taxable bonds, with an interest rate
of 4.40%, maturing in July 2042 (including
discount of $897) - - - 249,103 249,103
Series 2013 taxable bonds, with an interest rate
of 5.75%, maturing in July 2043 (including
discount of $1,291) - - - 348,709 348,709
Series 2014 taxable bonds, with an interest rate
of 4.78%, maturing in July 2044 (including
discount of $1,172) - - - 298,829 298,829
Deferred financing costs - - - (2,544) (2,544)
Subtotal of Hospitals Center bonds - - - 894,097 894,097
Other notes payable (Note 10)
Various at fixed and variable interest rates
due through May 2019 - - - 154,004 154,004
Mortgage loans - 42,000 42,000 39,593 81,593
Lines of credit 88,304 1,100 89,404 145,101 234,505
Capital leases 6,161 30,937 37,098 70,596 107,694
Subtotal of other notes payable 94,465 74,037 168,502 409,294 577,796
Total amounts outstanding 3,030,656$ 550,810$ 3,581,466$ 1,710,299$ 5,291,765$
2016
New York University Notes to Consolidated Financial Statements August 31, 2016 and 2015
(in thousands of dollars)
27
Total
School of Obligated Health Consolidated
University Medicine Group System NYU
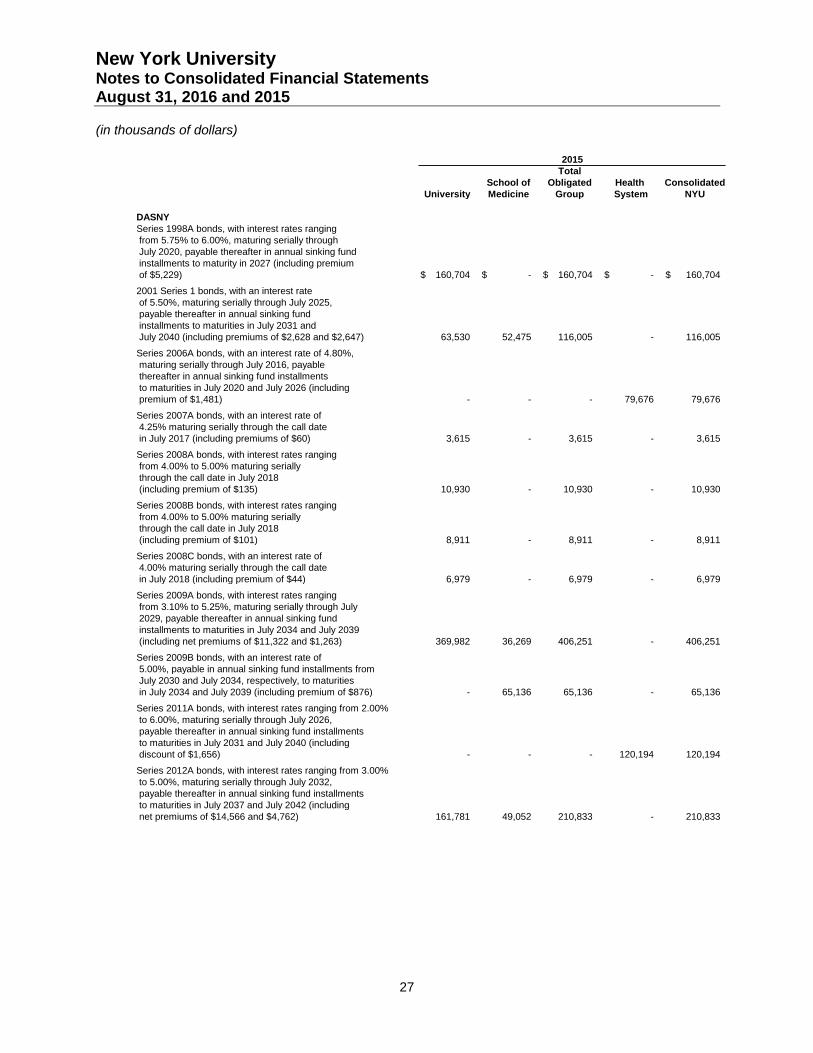
DASNY
Series 1998A bonds, with interest rates ranging
from 5.75% to 6.00%, maturing serially through
July 2020, payable thereafter in annual sinking fund
installments to maturity in 2027 (including premium
of $5,229) 160,704$ -$ 160,704$ -$ 160,704$
2001 Series 1 bonds, with an interest rate
of 5.50%, maturing serially through July 2025,
payable thereafter in annual sinking fund
installments to maturities in July 2031 and
July 2040 (including premiums of $2,628 and $2,647) 63,530 52,475 116,005 - 116,005
Series 2006A bonds, with an interest rate of 4.80%,
maturing serially through July 2016, payable
thereafter in annual sinking fund installments
to maturities in July 2020 and July 2026 (including
premium of $1,481) - - - 79,676 79,676
Series 2007A bonds, with an interest rate of
4.25% maturing serially through the call date
in July 2017 (including premiums of $60) 3,615 - 3,615 - 3,615
Series 2008A bonds, with interest rates ranging
from 4.00% to 5.00% maturing serially
through the call date in July 2018
(including premium of $135) 10,930 - 10,930 - 10,930
Series 2008B bonds, with interest rates ranging
from 4.00% to 5.00% maturing serially
through the call date in July 2018
(including premium of $101) 8,911 - 8,911 - 8,911
Series 2008C bonds, with an interest rate of
4.00% maturing serially through the call date
in July 2018 (including premium of $44) 6,979 - 6,979 - 6,979
Series 2009A bonds, with interest rates ranging
from 3.10% to 5.25%, maturing serially through July
2029, payable thereafter in annual sinking fund
installments to maturities in July 2034 and July 2039
(including net premiums of $11,322 and $1,263) 369,982 36,269 406,251 - 406,251
Series 2009B bonds, with an interest rate of
5.00%, payable in annual sinking fund installments from
July 2030 and July 2034, respectively, to maturities
in July 2034 and July 2039 (including premium of $876) - 65,136 65,136 - 65,136
Series 2011A bonds, with interest rates ranging from 2.00%
to 6.00%, maturing serially through July 2026,
payable thereafter in annual sinking fund installments
to maturities in July 2031 and July 2040 (including
discount of $1,656) - - - 120,194 120,194
Series 2012A bonds, with interest rates ranging from 3.00%
to 5.00%, maturing serially through July 2032,
payable thereafter in annual sinking fund installments
to maturities in July 2037 and July 2042 (including
net premiums of $14,566 and $4,762) 161,781 49,052 210,833 - 210,833
2015

New York University Notes to Consolidated Financial Statements August 31, 2016 and 2015
(in thousands of dollars)
28
Total
School of Obligated Health Consolidated
University Medicine Group System NYU
DASNY, continued
Series 2012B bonds, with interest rates ranging from 4.00%
to 5.00%, maturing serially through July 2032,
payable thereafter in annual sinking fund installments
to maturities in July 2037 and July 2042 (including
premium of $4,827) 59,862 - 59,862 - 59,862
Series 2012C taxable bonds, with interest rates ranging from
1.32% to 3.62%, maturing serially through July 2027 25,495 - 25,495 - 25,495
Series 2013A bonds, with interest rates ranging from
4.00% to 5.00%, maturing serially through July 2033,
payable thereafter in annual sinking fund installments
to maturities in July 2037 and July 2043 (including
net premiums of $8,371) 131,321 - 131,321 - 131,321
Series 2013B taxable bonds, with interest rates ranging from
1.19% to 5.25%, maturing serially through July 2028,
payable thereafter in annual sinking fund installments
to maturities in July 2033 and July 2043 30,260 - 30,260 - 30,260
Series 2014 bonds, with interest rates ranging from 2.00%
to 5.00%, maturing serially through July 2032 and July 2036
(including premium of $9,291) - - - 86,991 86,991
Series 2014 S2 bonds, with interest rates ranging from 3.75%
to 5%, maturing serially through July 2034 and July 2035
(including premium of $17,925) - - - 133,000 133,000
Series 2014A bonds, with an interest rate of 2.59%
maturing in July 2034, payable in annual sinking fund
installments from July 2017 through July 2034 55,000 - 55,000 - 55,000
Series 2015A bonds, with interest rates ranging from
2.00% to 5.50%, maturing serially through July 2035,
payable in annual sinking fund installments from July 2036
to July 2048 (including premium of $91,152) 782,587 - 782,587 - 782,587
Deferred financing costs (13,052) (2,202) (15,254) (5,983) (21,237)
Subtotal of DASNY bonds 1,857,905 200,730 2,058,635 413,878 2,472,513
2015
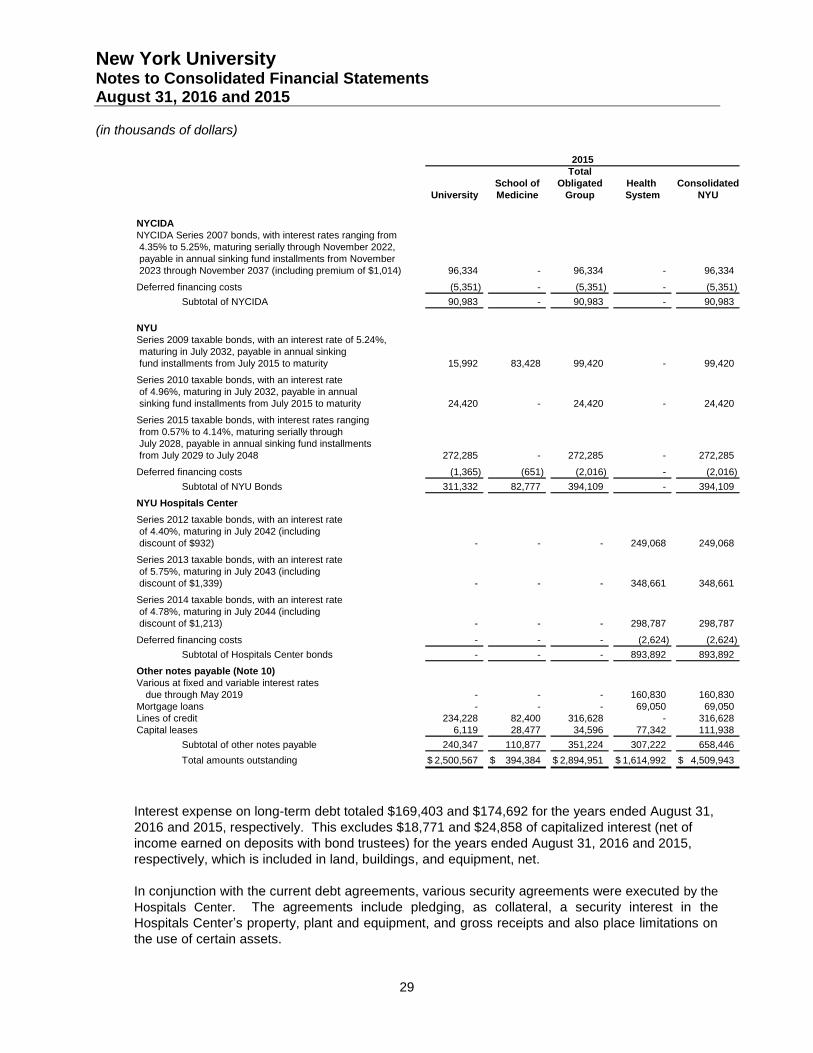
New York University Notes to Consolidated Financial Statements August 31, 2016 and 2015
(in thousands of dollars)
29
Total
School of Obligated Health Consolidated
University Medicine Group System NYU
NYCIDA
NYCIDA Series 2007 bonds, with interest rates ranging from
4.35% to 5.25%, maturing serially through November 2022,
payable in annual sinking fund installments from November
2023 through November 2037 (including premium of $1,014) 96,334 - 96,334 - 96,334
Deferred financing costs (5,351) - (5,351) - (5,351)
Subtotal of NYCIDA 90,983 - 90,983 - 90,983
NYU
Series 2009 taxable bonds, with an interest rate of 5.24%,
maturing in July 2032, payable in annual sinking
fund installments from July 2015 to maturity 15,992 83,428 99,420 - 99,420
Series 2010 taxable bonds, with an interest rate
of 4.96%, maturing in July 2032, payable in annual
sinking fund installments from July 2015 to maturity 24,420 - 24,420 - 24,420
Series 2015 taxable bonds, with interest rates ranging
from 0.57% to 4.14%, maturing serially through
July 2028, payable in annual sinking fund installments
from July 2029 to July 2048 272,285 - 272,285 - 272,285
Deferred financing costs (1,365) (651) (2,016) - (2,016)
Subtotal of NYU Bonds 311,332 82,777 394,109 - 394,109
NYU Hospitals Center
Series 2012 taxable bonds, with an interest rate
of 4.40%, maturing in July 2042 (including
discount of $932) - - - 249,068 249,068
Series 2013 taxable bonds, with an interest rate
of 5.75%, maturing in July 2043 (including
discount of $1,339) - - - 348,661 348,661
Series 2014 taxable bonds, with an interest rate
of 4.78%, maturing in July 2044 (including
discount of $1,213) - - - 298,787 298,787
Deferred financing costs - - - (2,624) (2,624)
Subtotal of Hospitals Center bonds - - - 893,892 893,892
Other notes payable (Note 10)
Various at fixed and variable interest rates
due through May 2019 - - - 160,830 160,830
Mortgage loans - - - 69,050 69,050
Lines of credit 234,228 82,400 316,628 - 316,628
Capital leases 6,119 28,477 34,596 77,342 111,938
Subtotal of other notes payable 240,347 110,877 351,224 307,222 658,446
Total amounts outstanding 2,500,567$ 394,384$ 2,894,951$ 1,614,992$ 4,509,943$
2015
Interest expense on long-term debt totaled $169,403 and $174,692 for the years ended August 31,
2016 and 2015, respectively. This excludes $18,771 and $24,858 of capitalized interest (net of
income earned on deposits with bond trustees) for the years ended August 31, 2016 and 2015,
respectively, which is included in land, buildings, and equipment, net.
In conjunction with the current debt agreements, various security agreements were executed by the
Hospitals Center. The agreements include pledging, as collateral, a security interest in the
Hospitals Center’s property, plant and equipment, and gross receipts and also place limitations on
the use of certain assets.

New York University Notes to Consolidated Financial Statements August 31, 2016 and 2015
(in thousands of dollars)
30
Other agreements include covenants requiring that the Hospitals Center and Lutheran maintain
certain financial ratios. At August 31, 2016 and 2015, NYU is compliant with all financial and
administrative covenants.
Future Principal Payments
The aggregate required principal payments on all bonds and notes payable for each of the next five
fiscal years, and thereafter to maturity, are as follows:
Year Ending August 31,
2017 218,266$
2018 142,716
2019 136,756
2020 140,858
2021 131,118
Thereafter 4,263,216
Total principal payments 5,032,930
Unamortized premiums and discounts, net 290,177
Unamortized cost of issuance (31,342)
5,291,765$
10. Obligations With Financial Institutions & Other Leasing Obligation
At August 31, 2016, the Obligated Group has three contractually committed bank credit
agreements which total $700,000 and expire from December 2016 to June 2018. The interest is
accrued for all three lines of credit at rates based on LIBOR. The amounts outstanding under
these agreements are $89,404 and $316,628 as of August 31, 2016 and 2015, respectively.
At August 31, 2016, the Hospitals Center has four unsecured lines of credit totaling $500,000 which
expire from March 2018 to April 2019. The interest is accrued for all four lines of credit at interest
rates based on LIBOR. The amounts outstanding on these lines of credit as of August 31, 2016
are $145,101. There were no amounts outstanding as of August 31, 2015.
In May 2014, the Hospitals Center entered into a loan agreement with a bank totaling $150,000.
The loan requires fixed monthly principal and interest payments at a variable rate equal to the
Prime Rate in effect through May 2019. The amount outstanding on the loan was $138,749 and
$143,750 at August 31, 2016 and 2015, respectively. The proceeds of the loan are to be used to
finance capital and other general corporate purposes.
Other Leasing Obligation
In June 2013, NYUSoM entered into a lease agreement for four floors in a building which required
construction of certain structural elements to customize them for use as laboratory and vivarium
spaces. These activities and the cap on the construction allowances from the landlord resulted in
NYUSoM being considered the accounting owner of these four floors.

New York University Notes to Consolidated Financial Statements August 31, 2016 and 2015
(in thousands of dollars)
31
During construction, NYUSoM capitalized the total cost to construct the four floors as construction
in progress and recorded a related liability as other leasing obligations on the consolidated balance
sheet. In August 2016, NYUSoM completed construction of the four floors and met the criteria for
sale-leaseback accounting. The lessor assets of $146,603 were de-capitalized and the related
liability was de-obligated from the consolidated balance sheet and prepaid rent totaling $9,456 will
be amortized over the remaining life of the lease.
11. Professional Liabilities
The Hospitals Center has been self-insured for professional liabilities since 2005 through its wholly
owned, segregated cell captive company, CCC550. Beginning October 1, 2015, Lutheran is also
covered for its professional liability coverage through CCC550. These CCC550 policies are written
on an occurrence basis.
CCC550 also provides insurance coverage to certain voluntary attending physicians (“VAPs”)
servicing NYUSoM and the Hospitals Center. The cost of this insurance coverage is the
responsibility of such physicians.
CCC550’s loss reserves are reported on a discounted basis and comprise estimates for known
reported losses and loss expenses plus a provision for losses incurred but not reported. Losses
are actuarially determined and are based on the loss experience of the insured. In management’s
opinion, recorded reserves for self-insured exposures are adequate to cover the ultimate net cost
of losses incurred to date; however, the provision is based on estimates and may ultimately be
settled for a significantly greater or lesser amount.
Prior to October 1, 2015, Lutheran purchased its primary and excess professional liability coverage
through a commercial insurer on a claims made basis and has recorded an estimated liability and
corresponding receivable related to these policies on the consolidated balance sheets as of
August 31, 2016 and 2015 (Note 5).
The Health System’s total professional liabilities recorded on the consolidated balance sheet as of
August 31, 2016 and August 31, 2015 are as follows:
2016 2015
Professional Liabilities
CCC550 professional liablities 386,903$ 278,452$
Lutheran self-insurance liabilities - 17,739
Lutheran commercial insurance liabilities 72,494 78,071
Professional Liabilities 459,397$ 374,262$

New York University Notes to Consolidated Financial Statements August 31, 2016 and 2015
(in thousands of dollars)
32
12. Retirement Plans
Substantially all NYU employees are covered by retirement plans. These plans include various
defined contribution plans, multi-employer defined benefit plans and four NYU-sponsored defined
benefit plans. NYU contributes to its defined contribution and multi-employer defined benefit plans
based on rates required by union or other contractual arrangements. Expenses related to NYU’s
defined contribution plans are $172,810 and $155,500 in 2016 and 2015, respectively.
Contributions to defined benefit plans are intended to provide not only for benefits attributed to
service to date, but also for those expected to be earned in the future. Contributions to the four
defined benefit plans are made in amounts sufficient to meet the minimum funding requirements
set forth in the Employee Retirement Income Security Act of 1974, plus such additional amounts as
the sponsors may deem appropriate. Pension benefits under these four plans are based on
participants’ final average compensation levels and years of service.
The following tables provide information with respect to the defined benefit plans for the years
ended August 31:
Plans’ Funded Status: 2016 2015
Change in benefit obligation
Benefit obligation, beginning of year 1,295,465$ 915,548$
Acquisition of Lutheran Medical Center retirement plan - 325,138
Service cost 25,717 20,376
Interest cost 52,503 42,929
Actuarial loss 184,353 28,270
Benefits paid (46,187) (36,107)
Administrative expenses (689) (689)
Benefit obligation, end of year 1,511,162 1,295,465
Change in fair value of plan assets
Fair value of plan assets, beginning of year 902,553 725,073
Acquisition of Lutheran Medical Center retirement plan - 200,489
Actual return (loss) on plan assets 64,367 (21,613)
Employer contributions 29,915 35,400
Benefits paid (46,187) (36,107)
Administrative expenses (689) (689)
Fair value of plan assets, end of year 949,959 902,553
Accrued benefit obligation 561,203$ 392,912$
Benefit obligation range of assumptions
as of August 31
Discount rate 3.60% - 3.75% 4.50% - 4.62%
Rate of increase in compensation levels 2.00% - 4.00% 2.00% - 4.00%

New York University Notes to Consolidated Financial Statements August 31, 2016 and 2015
(in thousands of dollars)
33
Net Periodic Benefit Cost: 2016 2015
Components of net periodic benefit cost
Service cost 25,717$ 20,376$
Interest cost 52,503 42,929
Expected return on plan assets (61,481) (50,838)
Amortization of prior service cost 2 2
Amortization of actuarial loss 27,684 25,386
Net periodic benefit cost 44,425$ 37,855$
Other changes recognized in unrestricted net assets
Actuarial net loss arising during period 181,469$ 100,722$
Amortization of prior service cost (2) (2)
Amortization of actuarial loss (27,684) (25,386)
Total recognized in nonoperating activities 153,783$ 75,334$
Amounts not yet reflected in net periodic benefit cost and
included in unrestricted net asset
Prior service cost 10$ 11$
Accumulated loss 492,076 338,290
Amounts in unrestricted net assets, end of year 492,086$ 338,301$
Amounts in unrestricted net assets expected to be recognized
in net periodic pension cost in the next fiscal year
Actuarial loss 34,315$ 28,271$
Prior service cost 2 2
Net periodic benefit cost range of assumptions
Discount rate 3.60 % - 4.50% 4.00 % - 4.25%
Rate of increase in compensation levels 2.00 % - 4.00% 2.00 % - 4.00%
Expected long-term rate of return on plan assets 6.00 % - 7.00% 6.00 % - 7.50%
The accumulated benefit obligation for the pension plans is $1,393,540 and $1,198,131 at
August 31, 2016 and 2015, respectively.
Plan Assets:
The following table presents the fair value of the defined benefit plan investments (according to the
hierarchy defined in Note 4) at August 31:
Active Observable Unobservable
Markets Inputs Inputs
(Level 1) (Level 2) (Level 3) Total
Cash equivalents 7,792$ -$ -$ 7,792$
Fixed income 202,273 85,551 - 287,824
Equity 521,997 120,977 - 642,974
Real estate - 11,369 - 11,369
Total 732,062$ 217,897$ -$ 949,959$
2016
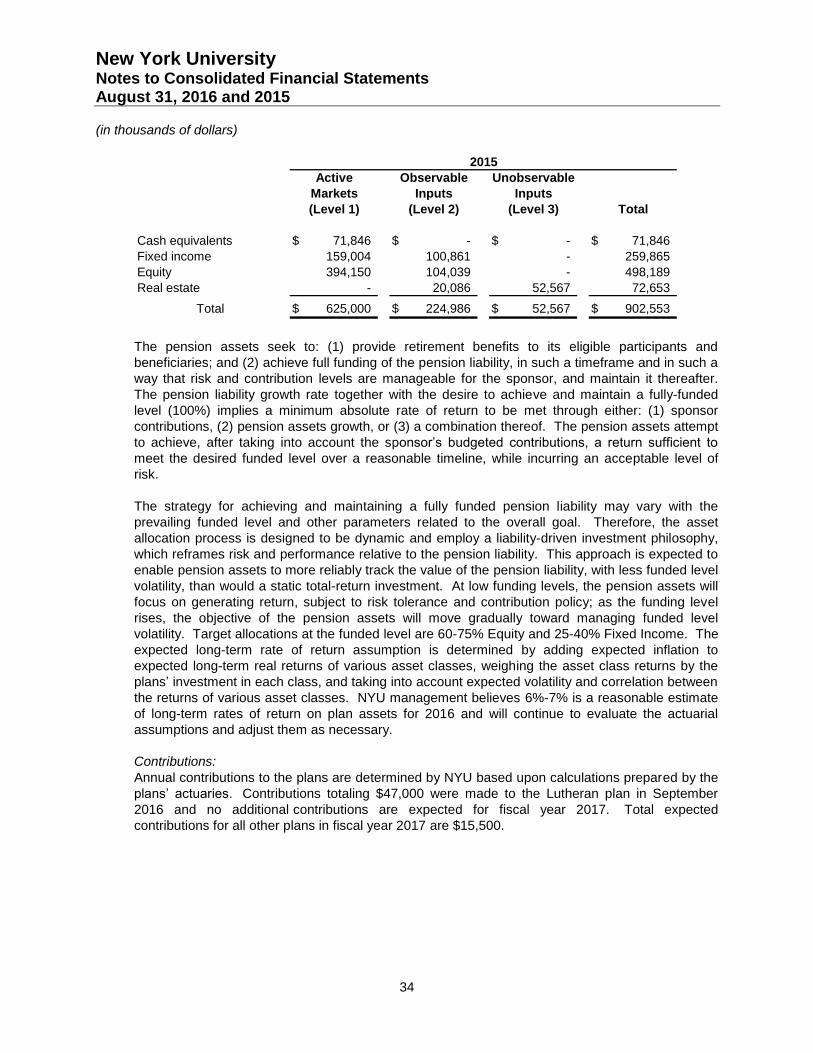
New York University Notes to Consolidated Financial Statements August 31, 2016 and 2015
(in thousands of dollars)
34
Active Observable Unobservable
Markets Inputs Inputs
(Level 1) (Level 2) (Level 3) Total
Cash equivalents 71,846$ -$ -$ 71,846$
Fixed income 159,004 100,861 - 259,865
Equity 394,150 104,039 - 498,189
Real estate - 20,086 52,567 72,653
Total 625,000$ 224,986$ 52,567$ 902,553$
2015
The pension assets seek to: (1) provide retirement benefits to its eligible participants and
beneficiaries; and (2) achieve full funding of the pension liability, in such a timeframe and in such a
way that risk and contribution levels are manageable for the sponsor, and maintain it thereafter.
The pension liability growth rate together with the desire to achieve and maintain a fully-funded
level (100%) implies a minimum absolute rate of return to be met through either: (1) sponsor
contributions, (2) pension assets growth, or (3) a combination thereof. The pension assets attempt
to achieve, after taking into account the sponsor’s budgeted contributions, a return sufficient to
meet the desired funded level over a reasonable timeline, while incurring an acceptable level of
risk.
The strategy for achieving and maintaining a fully funded pension liability may vary with the
prevailing funded level and other parameters related to the overall goal. Therefore, the asset
allocation process is designed to be dynamic and employ a liability-driven investment philosophy,
which reframes risk and performance relative to the pension liability. This approach is expected to
enable pension assets to more reliably track the value of the pension liability, with less funded level
volatility, than would a static total-return investment. At low funding levels, the pension assets will
focus on generating return, subject to risk tolerance and contribution policy; as the funding level
rises, the objective of the pension assets will move gradually toward managing funded level
volatility. Target allocations at the funded level are 60-75% Equity and 25-40% Fixed Income. The
expected long-term rate of return assumption is determined by adding expected inflation to
expected long-term real returns of various asset classes, weighing the asset class returns by the
plans’ investment in each class, and taking into account expected volatility and correlation between
the returns of various asset classes. NYU management believes 6%-7% is a reasonable estimate
of long-term rates of return on plan assets for 2016 and will continue to evaluate the actuarial
assumptions and adjust them as necessary.
Contributions:
Annual contributions to the plans are determined by NYU based upon calculations prepared by the
plans’ actuaries. Contributions totaling $47,000 were made to the Lutheran plan in September
2016 and no additional contributions are expected for fiscal year 2017. Total expected
contributions for all other plans in fiscal year 2017 are $15,500.
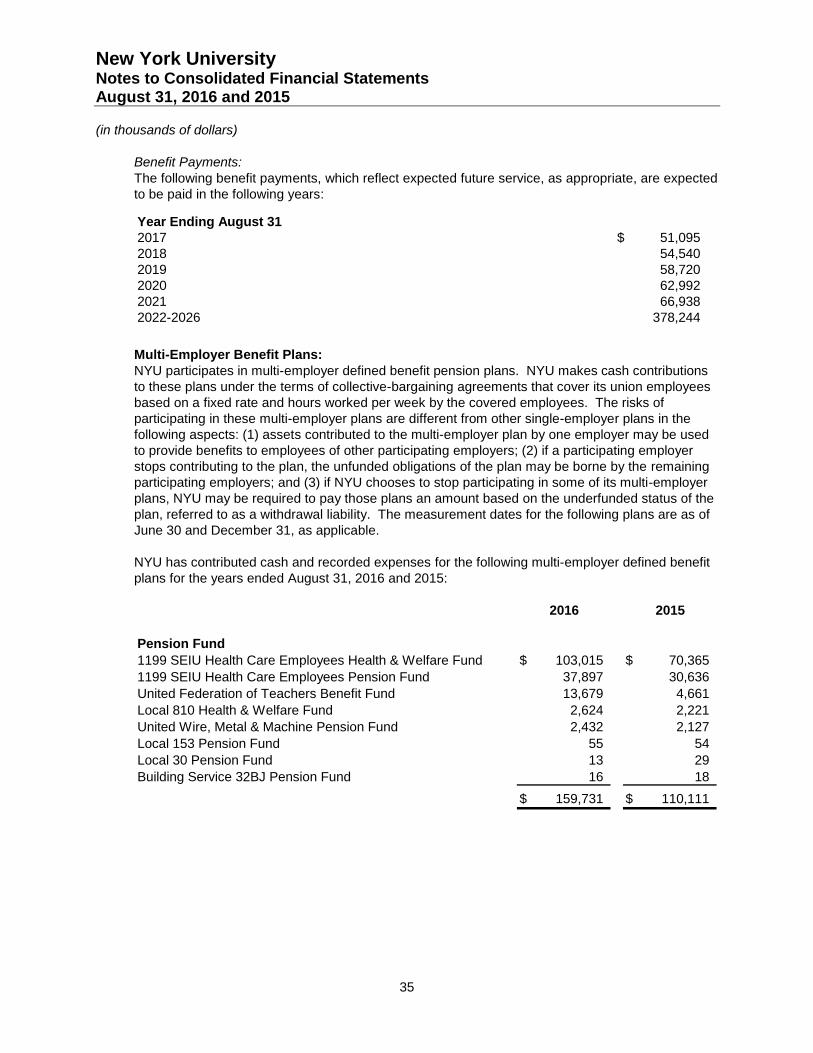
New York University Notes to Consolidated Financial Statements August 31, 2016 and 2015
(in thousands of dollars)
35
Benefit Payments:
The following benefit payments, which reflect expected future service, as appropriate, are expected
to be paid in the following years:
Year Ending August 31
2017 51,095$
2018 54,540
2019 58,720
2020 62,992
2021 66,938
2022-2026 378,244
Multi-Employer Benefit Plans:
NYU participates in multi-employer defined benefit pension plans. NYU makes cash contributions
to these plans under the terms of collective-bargaining agreements that cover its union employees
based on a fixed rate and hours worked per week by the covered employees. The risks of
participating in these multi-employer plans are different from other single-employer plans in the
following aspects: (1) assets contributed to the multi-employer plan by one employer may be used
to provide benefits to employees of other participating employers; (2) if a participating employer
stops contributing to the plan, the unfunded obligations of the plan may be borne by the remaining
participating employers; and (3) if NYU chooses to stop participating in some of its multi-employer
plans, NYU may be required to pay those plans an amount based on the underfunded status of the
plan, referred to as a withdrawal liability. The measurement dates for the following plans are as of
June 30 and December 31, as applicable.
NYU has contributed cash and recorded expenses for the following multi-employer defined benefit
plans for the years ended August 31, 2016 and 2015:
2016 2015
Pension Fund
1199 SEIU Health Care Employees Health & Welfare Fund 103,015$ 70,365$
1199 SEIU Health Care Employees Pension Fund 37,897 30,636
United Federation of Teachers Benefit Fund 13,679 4,661
Local 810 Health & Welfare Fund 2,624 2,221
United Wire, Metal & Machine Pension Fund 2,432 2,127
Local 153 Pension Fund 55 54
Local 30 Pension Fund 13 29
Building Service 32BJ Pension Fund 16 18
159,731$ 110,111$

New York University Notes to Consolidated Financial Statements August 31, 2016 and 2015
(in thousands of dollars)
36
The following table includes additional disclosure information related to the following pension funds:
Plans’ Funded Status: Expiration Date of
FIP/RP Status Collective-
EIN/Pension Pending/ Surcharge Bargaining
Plan Name Plan Number 2016 2015 Implemented Imposed Agreement
1199 Pension Fund 13-3604862/001 Green Green N/A No September 2018
United Wire Pension Fund 13-6596940/001 Red Red Yes No June 2019
Local 153 Pension Fund 13-2864289/001 Red Red Yes N/A N/A
Local 30 Pension Fund 51-6045848/001 Green Green N/A No June 2021
Building Service 32BJ 13-1879376/001 Red Red Yes No February 2016
Pension Protection
Act Zone Status
NYU’s contributions to the United Wire Pension Fund, the Local 153 Pension Fund, the Local 30
Pension Fund, and the Building Service 32BJ Pension Fund represent less than 5% of total plan
contributions. The Health & Welfare Plans provide medical benefits (health, dental, prescription,
vision) for active employees and retirees. Eligibility for benefit coverage level and type is
dependent upon their status as an active employee or retiree.
The Pension Protection Act zone status indicates the plan’s funded status of either at least 80%
funded (green) or less than 80% funded (yellow or red). A zone status of red requires the plan
sponsor implement a Funding Improvement Plan (FIP) or Rehabilitation Plan (RP).
13. Other Postretirement Benefits
NYU has five health and welfare plans that provide certain health care and life insurance benefits
for eligible retired employees. NYU employees may become eligible for these benefits if they reach
the age and service requirements of the plan while working for NYU. The costs related to these
plans are accrued during the period the employees provide service to NYU.

New York University Notes to Consolidated Financial Statements August 31, 2016 and 2015
(in thousands of dollars)
37
The following tables provide information with respect to the other postretirement plans for the years
ended August 31:
2016 2015
Change in benefit obligation
Benefit obligation, beginning of year 656,441$ 612,014$
Service cost 19,170 23,242
Interest cost 28,920 25,860
Plan changes (1,812) -
Actuarial loss 51,990 10,072
Participant contributions 4,229 4,119
Retiree drug subsidy receipts 1,563 1,081
Benefits paid (20,193) (19,947)
Benefit obligation, end of year 740,308 656,441
Change in fair value of plan assets
Fair value of plan assets, beginning of year 97,170 88,069
Actual return (loss) on plan assets 5,435 (638)
Employer contributions 21,105 24,486
Participant contributions 4,229 4,119
Retiree drug subsidy receipts 1,563 1,081
Benefits paid (20,193) (19,947)
Fair value of plan assets, end of year 109,309 97,170
Accrued postretirement benefit obligation 630,999$ 559,271$
Range of assumptions to determine
benefit obligations and net cost as of August 31
Discount rate 3.62 - 3.75% 4.50 - 4.75%
Expected long-term rate of return 6.00 - 7.00% 6.00 - 7.00%
Ultimate retiree health-care cost trend 4.50% 4.50%
Year ultimate trend rate is achieved 2023 - 2038 2023 - 2027

New York University Notes to Consolidated Financial Statements August 31, 2016 and 2015
(in thousands of dollars)
38
Net Periodic Benefit Cost: 2016 2015
Components of net periodic benefit cost
Service cost 19,170$ 23,242$
Interest cost 28,920 25,860
Expected return on plan assets (6,097) (5,553)
Amortization of prior service credit (5,321) (5,323)
Amortization of actuarial loss 10,284 11,396
Net periodic benefit cost 46,956$ 49,622$
Other changes recognized in unrestricted net assets
Actuarial net loss arising during period 52,653$ 16,263$
Amortization of prior service credit 5,321 5,323
Amortization of actuarial net loss (10,284) (11,396)
Prior service cost arising during period (1,812) -
Employer direct benefit payments - (9,729)
Total recognized in nonoperating activities 45,878$ 461$
Amounts not yet reflected in net periodic benefit cost and
included in unrestricted net assets
Prior service credit (8,486) (11,995)
Accumulated loss 212,712 170,344
Amounts in unrestricted net assets, end of year 204,226$ 158,349$
Amounts in unrestricted net assets expected to be recognized
in net periodic pension cost in the next fiscal year
Actuarial loss (11,890)$ (8,999)$
Prior service credit 5,111 5,321
In 2016 and 2015, the effect of a 1% change in the health care cost trend rate is as follows:
1% Increase 1% Decrease 1% Increase 1% Decrease
Effect on net periodic benefit cost 9,935$ (7,677)$ 9,583$ (7,541)$
Effect on postretirement benefit obligation 132,075 (103,578) 112,782 (88,486)
2016 2015
Contributions:
Expected contributions for the next fiscal year are $10,232.

New York University Notes to Consolidated Financial Statements August 31, 2016 and 2015
(in thousands of dollars)
39
Plan Assets:
The following table presents the fair value of the postretirement plan investments (according to the
hierarchy defined in Note 4) at August 31:
Active Observable Unobservable
Markets Inputs Inputs
(Level 1) (Level 2) (Level 3) Total
Cash equivalents 10,105$ 73$ -$ 10,178$
Equity funds - 74,666 - 74,666
Fixed income - 24,465 - 24,465
Total 10,105$ 99,204$ -$ 109,309$
2016
Active Observable Unobservable
Markets Inputs Inputs
(Level 1) (Level 2) (Level 3) Total
Cash equivalents 132$ 71$ -$ 203$
Equity funds - 70,304 - 70,304
Fixed income - 26,663 - 26,663
Total 132$ 97,038$ -$ 97,170$
2015
The plans’ investment objectives seek a positive long-term total rate of return to meet NYU’s
current and future plan obligations. The asset allocations for the plans combine tested theory and
informed market judgments to balance investment risks with the need for high returns.
The expected long-term rate of return assumption is determined by adding expected inflation to
expected long-term real returns of various asset classes, taking into account expected volatility and
correlation between the returns of various asset classes. NYU management believes that 6%-7%
is a reasonable range of long-term rates of return on plan assets for 2016 and will continue to
evaluate the actuarial assumptions and adjust them as necessary.
Benefit Payments:
The following benefit payments (net of retiree contributions), which reflect the effects of the
Medicare Act and expected future service, as appropriate, are expected to be paid in:
Year Ending August 31,
2017 21,691$
2018 23,495
2019 25,426
2020 27,730
2021 30,127
2022-2026 185,414

New York University Notes to Consolidated Financial Statements August 31, 2016 and 2015
(in thousands of dollars)
40
14. Grants and Contracts
Grant and contract revenues represent reimbursements of costs incurred in direct support of
research and other sponsored activities. Additionally, such sponsored grants and contracts
generally provide for the recovery of indirect costs supporting these activities. Indirect costs,
included in grant and contract revenues, are recovered at rates established in advance by NYU
through negotiations with the federal government and other private sponsors and amount to
$135,348 and $138,595 for the years ended August 31, 2016 and 2015, respectively.
15. Hospital Affiliations
NYUSoM has three affiliation agreements with the New York City Health and Hospitals Corporation
to provide general care and mental health services. The three agreements are with Woodhull
Medical and Mental Health Center and Cumberland Diagnostic and Treatment Center, Bellevue
Hospital Center and Gouverneur Healthcare Services and Coler Rehabilitation and Nursing Care
Center and Henry J Carter Specialty Hospital and Nursing Facility and are effective for July 1, 2015
through June 30, 2020.
NYU Hospitals Center has an affiliation agreement with Sunset Park Health Council, Inc., a New
York not-for-profit corporation, d/b/a Lutheran Family Health Centers (LFHC). The LFHC is a
designated Level 3 Medical Home and a Federally Qualified Health Center and has been
established as a “co-operator” with NYU Hospitals Center. A new affiliation agreement is currently
being negotiated between NYU Hospitals Center and LFHC and is expected to be executed in
fiscal 2017.
16. Allocated Expenses
Certain expenses incurred by NYU are allocated to specific program and support service activities
on the basis of utilization of the underlying assets. Expenses included in this allocation are
operation and maintenance of plant, interest on indebtedness, and depreciation and amortization.
The allocation of these expenses, which are included in total operating expenses for the years
ended August 31, 2016 and 2015, are presented below:
Operation and Depreciation
Maintenance Interest on and
of Plant Indebtedness Amortization Total
Instruction and other academic
programs 70,613$ 44,280$ 81,899$ 196,792$
Research and other sponsored
programs 81,960 8,162 43,568 133,690
Patient care 69,753 61,090 157,546 288,389
Libraries 6,946 1,165 7,203 15,314
Student services 12,026 4,296 13,866 30,188
Institutional services 218,749 10,553 62,361 291,663
Auxiliary enterprises 117,059 47,165 89,330 253,554
Total 577,106$ 176,711$ 455,773$ 1,209,590$
2016

New York University Notes to Consolidated Financial Statements August 31, 2016 and 2015
(in thousands of dollars)
41
Operation and Depreciation
Maintenance Interest on and
of Plant Indebtedness Amortization Total
Instruction and other academic
programs 62,371$ 49,606$ 71,496$ 183,473$
Research and other sponsored
programs 67,155 9,032 36,677 112,864
Patient care 51,780 1,825 129,387 182,992
Libraries 7,049 469 7,668 15,186
Student services 13,195 3,304 15,106 31,605
Institutional services 155,964 72,094 50,165 278,223
Auxiliary enterprises 101,618 38,362 84,337 224,317
Total 459,132$ 174,692$ 394,836$ 1,028,660$
2015
17. Components of Temporarily and Permanently Restricted Net Assets
Temporarily restricted net assets are available for the following purposes at August 31, 2016 and
2015:
2016 2015
Contributions and earnings for operating purposes 866,524$ 955,256$
Contributions for buildings and equipment 225,597 224,212
Disaster recovery award for mitigation 284,103 426,223
Annuity trust agreements 34,903 32,402
Scholarships and fellowships 123,658 108,030
Total 1,534,785$ 1,746,123$
Permanently restricted net assets at August 31, 2016 and 2015 are retained in perpetuity to
support the following activities:
2016 2015
Program support 440,264$ 442,659$
Faculty and staff salaries 751,031 784,577
Scholarships and fellowships 672,500 498,554
Library books 15,589 13,594
Research and sponsored programs 42,469 41,158
Buildings and equipment 4,627 4,733
Student loans 2,716 2,702
Total 1,929,196$ 1,787,977$

New York University Notes to Consolidated Financial Statements August 31, 2016 and 2015
(in thousands of dollars)
42
Prior to the merger with NYU, the NYU Tandon School of Engineering (formerly Polytechnic
University) was granted cy-pres relief by the Attorney General’s office. As a result, $48,247 of
permanently restricted net assets was reclassed to unrestricted net assets in order to satisfy the
requirements of the Title IV responsibility ratios and the debt service coverage ratio. In
August 2015, this $48,247 was restored to permanently restricted net assets.
NYU’s investment pools include individual endowed funds established for a variety of purposes.
Pooled assets include both donor restricted endowment funds and funds designated by the Board
of Trustees to function as endowments.
NYU classifies as permanently restricted net assets: (a) the original value of gifts donated to the
permanent endowment, (b) the original value of subsequent gifts to the permanent endowment,
and (c) accumulations to the permanent endowment required by the applicable donor gift
instrument. Accumulated unspent earnings from the permanently restricted endowments are
classified as temporarily restricted net assets. Board-designated endowments, as well as any
accumulated losses on any individual permanently restricted endowment (underwater endowment),
are classified as unrestricted net assets.
NYU defines the appropriation of endowment net assets for expenditure as the authorization of its
investment spending rate as approved annually by the Board of Trustees (see Note 4). However,
when donors have expressly stipulated the payout percentage of earnings on endowments that
differs from NYU policies, the donors’ intent prevails. In making a determination to appropriate or
accumulate, NYU adheres to the standard of prudence prescribed by New York Prudent
Management of Institutional Funds Act (NYPMIFA) and considers the following factors: the
duration and preservation of the endowment fund; NYU’s mission and the purpose of the
endowment fund; general economic conditions; the possible effect of inflation or deflation; the
expected total return from income and the appreciation of investments; other resources of NYU;
where appropriate and circumstances would otherwise warrant, alternatives to expenditures of the
endowment fund giving due consideration to the effect that such alternatives may have on NYU;
and the investment policy of NYU.
From time to time, the fair value of assets associated with individual donor-restricted endowment
funds may fall below the original value of the gift donated to the permanent endowment
(underwater endowment). Deficits of this nature are reported as a reduction of unrestricted net
assets. These deficits resulted from unfavorable market fluctuations that eroded accumulated
gains for the permanently restricted endowments as well as the continued appropriation of certain
programs which was deemed prudent by the University’s Board of Trustees. Current and future
gains will be classified as increases in unrestricted net assets until the shortfalls previously charged
to unrestricted net assets have been eliminated and the individual endowment funds are returned
to their required levels as stipulated by donors.

New York University Notes to Consolidated Financial Statements August 31, 2016 and 2015
(in thousands of dollars)
43
The following table represents the net asset classes of NYU’s endowment funds as of August 31:
Temporarily Permanently
Unrestricted Restricted Restricted Total
Donor-restricted endowment -$ 420,162$ 1,848,638$ 2,268,800$
Board-designated endowment 1,345,766 - - 1,345,766
Underwater endowment (38 funds) (1,000) - - (1,000)
Total 1,344,766$ 420,162$ 1,848,638$ 3,613,566$
2016
Temporarily Permanently
Unrestricted Restricted Restricted Total
Donor-restricted endowment -$ 454,135$ 1,754,401$ 2,208,536$
Board-designated endowment 1,296,979 - - 1,296,979
Underwater endowment (75 funds) (2,953) - - (2,953)
Total 1,294,026$ 454,135$ 1,754,401$ 3,502,562$
2015
The following table provides the changes in the net asset classes of NYU’s endowment funds at
August 31:
Temporarily Permanently
Unrestricted Restricted Restricted Total
Investment pool net assets,
beginning of year 1,294,026$ 454,135$ 1,754,401$ 3,502,562$
Contributions 59,587 - 109,653 169,240
Investment return 46,474 75,642 - 122,116
Endowment distribution (57,785) (97,612) - (155,397)
Liquidations (16,120) - - (16,120)
Reclassification of net assets 18,584 (12,003) (15,416) (8,835)
Investment pool net assets, end of year 1,344,766$ 420,162$ 1,848,638$ 3,613,566$
2016

New York University Notes to Consolidated Financial Statements August 31, 2016 and 2015
(in thousands of dollars)
44
Temporarily Permanently
Unrestricted Restricted Restricted Total
Investment pool net assets,
beginning of year 1,323,324$ 522,386$ 1,617,141$ 3,462,851$
Contributions 96,127 - 89,609 185,736
Investment return 16,981 21,187 - 38,168
Endowment distribution (57,467) (89,438) - (146,905)
Liquidations (36,928) - - (36,928)
Reclassification of net assets (48,011) - 47,651 (360)
Investment pool net assets, end of year 1,294,026$ 454,135$ 1,754,401$ 3,502,562$
2015
18. Commitments and Contingencies
In the normal course of business, NYU leases facilities under operating leases. Minimum rental
payments under these agreements over the next five years and thereafter are as follows:
Rental Lease
Payments
Year Ending August 31,
2017 196,128$
2018 173,603
2019 169,172
2020 148,187
2021 141,197
Thereafter 1,033,472
Rent expense is $219,921 and $199,428 for the years ended August 31, 2016 and 2015,
respectively.
NYU is self-insured for workers’ compensation benefits. The University purchases an excess
workers' compensation insurance policy with a retention of $500 per claim. In connection with
being self-insured, the University has maintained a surety bond in the amount of $11,749 at August
31, 2016. Additionally, the Hospitals Center has maintained stand-by letters of credit aggregating
approximately $27,466 and $26,891 at August 31, 2016 and 2015, respectively. Cash and
marketable securities collateralize the letters of credit.
NYU is a defendant in various legal actions arising from the normal course of its operations and
amounts expended under government grants and contracts are subject to audit by governmental
agencies. In addition, amounts received for patient care from Medicare and Medicaid are
subject to audit. Although the final outcome of such actions and audits cannot be determined,
management believes that eventual liability, if any, will not have a material effect on NYU’s
consolidated financial position.

New York University Notes to Consolidated Financial Statements August 31, 2016 and 2015
(in thousands of dollars)
45
19. Superstorm Sandy
On October 29, 2012, Superstorm Sandy struck New York City causing widespread damage to the
main campus facilities of the Medical Center. The Medical Center incurred business interruption
losses during the period that facilities were shut down or being repaired. In addition, the Medical
Center incurred costs to replace and repair damage to or demolish properties.
Commercial Insurance
The Medical Center had insurance policies in effect at the time of Superstorm Sandy for business
interruption, property, casualty, and other insurance coverage subject to various limitations and
deductibles. The University, on behalf of the Medical Center, has initiated lawsuits to recover
additional insurance proceeds but the ultimate outcome cannot be determined at this time and
therefore, no revenue has been recorded for the years ended August 31, 2016 and 2015.
Federal Disaster Recovery Assistance
The Federal Emergency Management Agency (FEMA) committed significant aid to the Medical
Center to assist in the recovery process and to mitigate losses which may occur as a result of
future storms. In 2014, FEMA awarded the Medical Center a fixed capped Public Assistance Grant
(the Capped Grant) in the amount of $1,130,073. The Medical Center will receive 90% of the
awarded amount ($1,017,066) for the performance of an agreed upon scope of work less amounts
received from commercial insurance. This agreed upon scope of work is for the repair and
replacement of eligible damage and for hazard mitigation projects for Medical Center properties.
Through August 31, 2016 the Medical Center has received $786,217 under the Capped Grant and
$230,849 remains available for drawdown for eligible expenditures.
Disaster recovery reimbursement revenues relate to repairs and replacement and are recognized
as allowable costs are incurred. Cash received in advance of spending is recorded as deferred
revenue with a corresponding balance in assets limited as to use – disaster recovery.
The Medical Center recognized $530,748 as a temporarily restricted disaster recovery award for
future mitigation in fiscal 2014. The net assets are released from restriction as the costs are
incurred. For the years ended August 31, 2016 and 2015, the Medical Center released $142,120
and $92,258, respectively, from restriction for hazard mitigation.
In addition to the Capped Grant award, FEMA continues to work with the Medical Center to finalize
additional awards related to eligible disaster expenses that are not included in the Capped Grant.

New York University Notes to Consolidated Financial Statements August 31, 2016 and 2015
(in thousands of dollars)
46
The following is a summary of the federal disaster recovery reimbursement revenues reflected in
the consolidated financial statements for the years ended August 31, 2016 and 2015:
Other Federal
Capped Grant Awards
Receivable at August 31, 2014 325,824$ 65,505$ 391,329$
2015 Financial Statements
Operating revenue 11,709 3,675 15,384
Nonoperating revenue 63,447 12,768 76,215
2015 total unrestricted revenues 75,156 16,443 91,599
Reallocation of expenditures between FEMA awards 22,730 (22,730) -
Adjustment of prior emergency and temporary funding - (11,165) (11,165)
2015 cash received (69,188) (25,589) (94,777)
Receivable at August 31, 2015 354,522$ 22,464$ 376,986$
2016 Financial Statements
Operating revenue 18,176$ 21,256$ 39,432$
Nonoperating revenue 48,180 32,993 81,173
2016 total unrestricted revenues 66,356 54,249 120,605
2016 cash received (297,644) (69,627) (367,271)
Receivable at August 31, 2016 123,234 7,086 130,320
Balance sheet classification of 2016 receivable
Disaster recovery receivable 250,041 7,086 257,127
Deferred revenue- disaster recovery (126,807) - (126,807)
123,234$ 7,086$ 130,320$
Federal Disaster Recovery
Total
20. Subsequent Events
NYU performed an evaluation of subsequent events through December 15, 2016, which is the date
the consolidated financial statements were issued.
In October 2016, the Health System entered into an Affiliation Agreement with Winthrop University
Hospital Association (“Winthrop”), a 591-bed acute care hospital located in Mineola, New York.
The two-phase transaction contemplates the Health System becoming the sole corporate member
of Winthrop, and no later than five years after the closing of Phase One, Winthrop will merge with
and into the Hospitals Center, with the Hospitals Center being the successor entity. With
Winthrop’s multiple ambulatory sites throughout Long Island and extensive network of employed
physicians, the affiliation is expected to expand the Health System’s presence throughout Queens,
Nassau and Suffolk Counties. Completion of the proposed affiliation is subject to various
regulatory approvals. There can be no assurance that all necessary regulatory approvals will be
obtained.
In October 2016, NYUSoM took possession of a 25 story office tower under a lease agreement,
which has a 30 year term with two 10 year options to renew. The office space will be converted
into medical offices to expand the NYUSoM ambulatory footprint in Manhattan. The future
minimum lease payments under the 30 year term of this agreement total $647,256.
Appendix A Supplemental Schedules to the Consolidated Financial Statements

New York University Supplemental Schedule to the Consolidated Financial Statements (Consolidating Balance Sheet for NYU - Summary) August 31, 2016
(in thousands of dollars)
The accompanying notes are an integral part of these consolidated financial statements.
48
NYU Consolidated
University Health Operations Eliminations NYU
Assets
Cash and cash equivalents 785,721$ 247,545$ -$ 1,033,266$
Short-term investments (Note 4) 1,860 442 - 2,302
Accounts and loans receivable, net (Note 5) 443,778 205,148 (169,430) 479,496
Patient accounts receivable, net (Note 3) 3,202 586,744 - 589,946
Contributions receivable, net (Note 6) 317,104 192,738 - 509,842
Other assets (Note 7) 127,776 224,677 - 352,453
Assets limited as to use - disaster recovery (Note 19) - 126,807 - 126,807
Disaster-related receivable (Note 19) - 257,127 - 257,127
Deposits with trustees (Note 2) 398,067 16,860 - 414,927
Long-term investments (Note 4) 2,775,812 1,656,934 - 4,432,746
Assets held by insurance captive (CCC550) (Note 11) - 400,476 - 400,476
Land, buildings, and equipment, net (Note 8) 3,722,939 4,553,547 - 8,276,486
Total assets 8,576,259$ 8,469,045$ (169,430)$ 16,875,874$
Liabilities and Net Assets
Liabilities
Accounts payable and accrued expenses 356,512$ 1,163,702$ (169,430)$ 1,350,784$
Disaster-related accounts payable and accrued expenses - 11,296 - 11,296
Deferred revenue 748,905 96,082 - 844,987
Deferred revenue - disaster related (Note 19) - 126,807 - 126,807
Professional liabilities (Note 11) - 459,397 - 459,397
Bonds and notes payable (Note 9) 3,030,656 2,261,109 - 5,291,765
Federal grants refundable (Note 5) 78,486 984 - 79,470
Accrued benefit obligation (Note 12) 127,160 434,043 - 561,203
Accrued postretirement obligation (Note 13) 456,258 174,741 - 630,999
Asset retirement obligation 172,511 52,836 - 225,347
Total liabilities 4,970,488 4,780,997 (169,430) 9,582,055
Net assets
Unrestricted 1,491,913 2,337,925 - 3,829,838
Temporarily restricted (Note 17) 606,181 928,604 - 1,534,785
Permanently restricted (Note 17) 1,507,677 421,519 - 1,929,196
Total net assets 3,605,771 3,688,048 - 7,293,819
Total liabilities and net assets 8,576,259$ 8,469,045$ (169,430)$ 16,875,874$
2016

New York University Supplemental Schedule to the Consolidated Financial Statements (Consolidating Balance Sheet for NYU - Summary) August 31, 2015
(in thousands of dollars)
The accompanying notes are an integral part of these consolidated financial statements.
49
NYU Consolidated
University Health Operations Eliminations NYU
Assets
Cash and cash equivalents 810,454$ 249,668$ -$ 1,060,122$
Short-term investments (Note 4) 2,517 116,730 - 119,247
Accounts and loans receivable, net (Note 5) 447,854 203,042 (160,131) 490,765
Patient accounts receivable, net (Note 3) 3,935 471,828 - 475,763
Contributions receivable, net (Note 6) 312,293 218,429 - 530,722
Other assets (Note 7) 148,598 190,619 - 339,217
Assets limited as to use - disaster recovery (Note 19) - 16,278 - 16,278
Disaster-related receivable (Note 19) - 393,264 - 393,264
Deposits with trustees (Note 2) 19,134 51,744 - 70,878
Long-term investments (Note 4) 2,696,107 1,569,214 - 4,265,321
Assets held by insurance captive (CCC550) (Note 11) - 320,426 - 320,426
Land, buildings, and equipment, net (Note 8) 3,534,149 3,776,031 - 7,310,180
Total assets 7,975,041$ 7,577,273$ (160,131)$ 15,392,183$
Liabilities and Net Assets
Liabilities
Accounts payable and accrued expenses 317,949$ 974,191$ (160,131)$ 1,132,009$
Disaster-related accounts payable and accrued expenses - 13,108 - 13,108
Deferred revenue 783,692 66,246 - 849,938
Deferred revenue - disaster related (Note 19) - 16,278 - 16,278
Professional liabilities (Note 11) - 374,262 - 374,262
Bonds and notes payable (Notes 9 and 10) 2,500,567 2,009,376 - 4,509,943
Other leasing obligations (Note 10) - 146,603 - 146,603
Federal grants refundable (Note 5) 78,237 1,793 - 80,030
Accrued benefit obligation (Note 12) 96,369 296,543 - 392,912
Accrued postretirement obligation (Note 13) 390,890 168,381 - 559,271
Asset retirement obligation 164,522 36,944 - 201,466
Total liabilities 4,332,226 4,103,725 (160,131) 8,275,820
Net assets
Unrestricted 1,601,817 1,980,446 - 3,582,263
Temporarily restricted (Note 17) 660,322 1,085,801 - 1,746,123
Permanently restricted (Note 17) 1,380,676 407,301 - 1,787,977
Total net assets 3,642,815 3,473,548 - 7,116,363
Total liabilities and net assets 7,975,041$ 7,577,273$ (160,131)$ 15,392,183$
2015

New York University Supplemental Schedule to the Consolidated Financial Statements (Consolidating Balance Sheet for NYU - Detail) August 31, 2016
(in thousands of dollars)
The accompanying notes are an integral part of these consolidated financial statements.
50
Total
School of Health Consolidated
University Medicine Eliminations Subtotal System Eliminations NYU
Assets
Cash and cash equivalents 785,721$ 52,582$ -$ 838,303$ 194,963$ -$ 1,033,266$
Short-term investments (Note 4) 1,860 - - 1,860 442 - 2,302
Accounts and loans receivable, net (Note 5) 443,778 89,049 (167,200) 365,627 145,269 (31,400) 479,496
Patient accounts receivable, net (Note 3) 3,202 96,908 - 100,110 489,836 - 589,946
Contributions receivable, net (Note 6) 317,104 63,390 - 380,494 129,348 - 509,842
Other assets (Note 7) 127,776 46,776 - 174,552 177,901 - 352,453
Assets limited as to use - disaster recovery (Note 19) - 42,377 - 42,377 84,430 - 126,807
Disaster-related receivable (Note 19) - 212,446 - 212,446 44,681 - 257,127
Deposits with trustees (Note 2) 398,067 204 - 398,271 16,656 - 414,927
Long-term investments (Note 4) 2,775,812 839,605 - 3,615,417 817,329 - 4,432,746
Assets held by insurance captive (CCC550) (Note 11) - - - - 400,476 - 400,476
Land, buildings, and equipment, net (Note 8) 3,722,939 1,531,407 - 5,254,346 3,022,140 - 8,276,486
Total assets 8,576,259$ 2,974,744$ (167,200)$ 11,383,803$ 5,523,471$ (31,400)$ 16,875,874$
Liabilities and Net Assets
Liabilities
Accounts payable and accrued expenses 356,512$ 611,522$ (167,200)$ 800,834$ 581,350$ (31,400)$ 1,350,784$
Disaster-related accounts payable and accrued
expenses - 5,481 - 5,481 5,815 - 11,296
Deferred revenue 748,905 37,025 - 785,930 59,057 - 844,987
Deferred revenue - disaster related (Note 19) - 42,377 - 42,377 84,430 - 126,807
Professional liabilities (Note 11) - - - - 459,397 - 459,397
Bonds and notes payable (Notes 9 and 10) 3,030,656 550,810 - 3,581,466 1,710,299 - 5,291,765
Federal grants refundable (Note 5) 78,486 984 - 79,470 - - 79,470
Accrued benefit obligation (Note 12) 127,160 73,503 - 200,663 360,540 - 561,203
Accrued postretirement obligation (Note 13) 456,258 95,237 - 551,495 79,504 - 630,999
Asset retirement obligation 172,511 29,359 - 201,870 23,477 - 225,347
Total liabilities 4,970,488 1,446,298 (167,200) 6,249,586 3,363,869 (31,400) 9,582,055
Net assets
Unrestricted 1,491,913 578,030 - 2,069,943 1,759,895 - 3,829,838
Temporarily restricted (Note 17) 606,181 542,146 - 1,148,327 386,458 - 1,534,785
Permanently restricted (Note 17) 1,507,677 408,270 - 1,915,947 13,249 - 1,929,196
Total net assets 3,605,771 1,528,446 - 5,134,217 2,159,602 - 7,293,819
Total liabilities and net assets 8,576,259$ 2,974,744$ (167,200)$ 11,383,803$ 5,523,471$ (31,400)$ 16,875,874$
2016

New York University Supplemental Schedule to the Consolidated Financial Statements (Consolidating Balance Sheet for NYU - Detail) August 31, 2015
(in thousands of dollars)
The accompanying notes are an integral part of these consolidated financial statements.
51
Total
School of Health Consolidated
University Medicine Eliminations Subtotal System Eliminations NYU
Assets
Cash and cash equivalents 810,454$ 106,985$ -$ 917,439$ 142,683$ -$ 1,060,122$
Short-term investments (Note 4) 2,517 - - 2,517 116,730 - 119,247
Accounts and loans receivable, net (Note 5) 447,854 76,384 (160,131) 364,107 130,997 (4,339) 490,765
Patient accounts receivable, net (Note 3) 3,935 73,770 - 77,705 398,058 - 475,763
Contributions receivable, net (Note 6) 312,293 60,785 - 373,078 157,644 - 530,722
Other assets (Note 7) 148,598 44,858 - 193,456 145,761 - 339,217
Assets limited as to use - disaster recovery (Note 19) - - - - 16,278 - 16,278
Disaster-related receivable (Note 19) - 286,493 - 286,493 106,771 - 393,264
Deposits with trustees (Note 2) 19,134 204 - 19,338 51,540 - 70,878
Long-term investments (Note 4) 2,696,107 810,710 - 3,506,817 758,504 - 4,265,321
Assets held by insurance captive (CCC550) (Note 11) - - - - 320,426 - 320,426
Land, buildings, and equipment, net (Note 8) 3,534,149 1,183,548 - 4,717,697 2,592,483 - 7,310,180
Total assets 7,975,041$ 2,643,737$ (160,131)$ 10,458,647$ 4,937,875$ (4,339)$ 15,392,183$
Liabilities and Net Assets
Liabilities
Accounts payable and accrued expenses 317,949$ 455,560$ (160,131)$ 613,378$ 522,970$ (4,339)$ 1,132,009$
Disaster-related accounts payable and accrued
expenses - 6,843 - 6,843 6,265 - 13,108
Deferred revenue 783,692 34,767 - 818,459 31,479 - 849,938
Deferred revenue - disaster related (Note 19) - - - - 16,278 - 16,278
Professional liabilities (Note 11) - - - - 374,262 - 374,262
Bonds and notes payable (Notes 9 and 10) 2,500,567 394,384 - 2,894,951 1,614,992 - 4,509,943
Other leasing obligations (Note 10) - 146,603 - 146,603 - - 146,603
Federal grants refundable (Note 5) 78,237 1,793 - 80,030 - - 80,030
Accrued benefit obligation (Note 12) 96,369 53,772 - 150,141 242,771 - 392,912
Accrued postretirement obligation (Note 13) 390,890 93,563 - 484,453 74,818 - 559,271
Asset retirement obligation 164,522 22,866 - 187,388 14,078 - 201,466
Total liabilities 4,332,226 1,210,151 (160,131) 5,382,246 2,897,913 (4,339) 8,275,820
Net assets
Unrestricted 1,601,817 415,202 - 2,017,019 1,565,244 - 3,582,263
Temporarily restricted (Note 17) 660,322 624,637 - 1,284,959 461,164 - 1,746,123
Permanently restricted (Note 17) 1,380,676 393,747 - 1,774,423 13,554 - 1,787,977
Total net assets 3,642,815 1,433,586 - 5,076,401 2,039,962 - 7,116,363
Total liabilities and net assets 7,975,041$ 2,643,737$ (160,131)$ 10,458,647$ 4,937,875$ (4,339)$ 15,392,183$
2015

New York University Supplemental Schedule to the Consolidated Financial Statements (Consolidating Statement of Activities for NYU - Summary) Year Ended August 31, 2016
(in thousands of dollars)
The accompanying notes are an integral part of these consolidated financial statements.
52
NYU Consolidated
University Health Operations Eliminations NYU
Changes in unrestricted net assets
Operating revenues
Tuition and fees (net of financial aid awards of $604,789 University; $9,173
NYU Langone Health Operations) 1,612,189$ 50,731$ -$ 1,662,920$
Grants and contracts (Note 14) 490,709 311,624 - 802,333
Patient care (net of provision for bad debts $91,799 NYU Langone
Health Operations) (Note 3) 50,941 4,355,780 - 4,406,721
Hospital affiliations (Note 15) - 321,146 - 321,146
Insurance premiums earned - 65,864 - 65,864
Contributions 111,431 45,697 - 157,128
Endowment distribution (Note 4) 119,529 35,868 - 155,397
Return on short-term investments (Note 4) 6,308 (24) - 6,284
Auxiliary enterprises 444,048 30,894 (4,941) 470,001
Program fees and other 103,310 191,962 (7,425) 287,847
Disaster recovery reimbursement (Note 19) - 39,432 - 39,432
Net assets released from restrictions 67,590 57,550 - 125,140
Total operating revenues 3,006,055 5,506,524 (12,366) 8,500,213
Expenses (Note 16)
Instruction and other academic programs 1,451,983 57,396 - 1,509,379
Research and other sponsored programs 461,033 523,669 - 984,702
Patient care 51,282 3,728,986 - 3,780,268
Hospital affiliations (Note 15) - 292,418 - 292,418
Libraries 69,804 9,925 - 79,729
Student services 119,410 9,910 - 129,320
Auxiliary enterprises 431,490 89,352 (4,941) 515,901
Institutional services 429,051 573,261 (7,425) 994,887
Disaster-related expenses - 29,004 - 29,004
Total expenses 3,014,053 5,313,921 (12,366) 8,315,608
(Deficiency) excess of operating revenues over expenses (7,998) 192,603 - 184,605
Nonoperating activities
Investment return (Note 4) 35,959 68,951 - 104,910
Appropriation of endowment distribution (Note 4) (44,600) (13,185) - (57,785)
Disaster recovery reimbursement for capital (Note 19) - 81,173 - 81,173
Changes in pension and postretirement obligations (Notes 12 and 13) (75,695) (123,966) - (199,661)
Net assets released from restrictions for capital purposes 7,809 9,906 - 17,715
Net assets released from restrictions for hazard mitigation - 142,120 - 142,120
Other (25,379) 25,389 - 10
Loss on bond defeasance (Note 9) - (25,512) - (25,512)
(Decrease) increase in unrestricted net assets (109,904) 357,479 - 247,575
Changes in temporarily restricted net assets
Contributions 84,538 62,292 - 146,830
Investment return (Note 4) 56,964 19,135 - 76,099
Appropriation of endowment distribution (Note 4) (74,929) (22,683) - (97,612)
Other (45,315) (6,365) - (51,680)
Net assets released from restrictions for hazard mitigation (Note 19) - (142,120) - (142,120)
Net assets released from restrictions (75,399) (67,456) - (142,855)
Decrease in temporarily restricted net assets (54,141) (157,197) - (211,338)
Changes in permanently restricted net assets
Contributions 111,022 13,483 - 124,505
Other 15,979 735 - 16,714
Increase in permanently restricted net assets 127,001 14,218 - 141,219
(Decrease) increase in net assets (37,044)$ 214,500$ -$ 177,456$
2016

New York University Supplemental Schedule to the Consolidated Financial Statements (Consolidating Statement of Activities for NYU - Summary) Year Ended August 31, 2015
(in thousands of dollars)
The accompanying notes are an integral part of these consolidated financial statements.
53
NYU Consolidated
University Health Operations Eliminations NYU
Changes in unrestricted net assets
Operating revenues
Tuition and fees (net of financial aid awards of $545,684 University; $6,761
NYU Langone Health Operations) 1,548,058$ 51,812$ -$ 1,599,870$
Grants and contracts (Note 14) 460,513 301,873 - 762,386
Patient care (net of provision for bad debts $48,566 NYU Langone
Health Operations) (Note 3) 40,371 3,438,742 - 3,479,113
Hospital affiliations (Note 15) - 305,458 - 305,458
Insurance premiums earned - 47,203 - 47,203
Contributions 101,256 41,337 - 142,593
Endowment distribution (Note 4) 111,423 35,482 - 146,905
Return on short-term investments (Note 4) 4,916 16,524 - 21,440
Auxiliary enterprises 413,680 25,766 (5,042) 434,404
Program fees and other 83,855 181,200 (7,258) 257,797
Disaster recovery reimbursement (Note 19) - 15,711 - 15,711
Net assets released from restrictions 50,451 41,536 - 91,987
Total operating revenues 2,814,523 4,502,644 (12,300) 7,304,867
Expenses (Note 16)
Instruction and other academic programs 1,444,449 47,786 - 1,492,235
Research and other sponsored programs 432,930 498,073 - 931,003
Patient care 40,684 2,838,756 - 2,879,440
Hospital affiliations (Note 15) - 282,083 - 282,083
Libraries 69,006 6,629 - 75,635
Student services 115,158 6,884 - 122,042
Auxiliary enterprises 417,709 63,995 (5,042) 476,662
Institutional services 384,680 570,471 (7,258) 947,893
Disaster-related expenses - 9,973 - 9,973
Total expenses 2,904,616 4,324,650 (12,300) 7,216,966
(Deficiency) excess of operating revenues over expenses (90,093) 177,994 - 87,901
Nonoperating activities
Investment return (Note 4) 10,888 (7,764) - 3,124
Appropriation of endowment distribution (Note 4) (42,857) (14,610) - (57,467)
Disaster recovery reimbursement for capital (Note 19) - 76,215 - 76,215
Changes in pension and postretirement obligations (Notes 12 and 13) (56,291) (19,504) - (75,795)
Net assets released from restrictions for capital purposes 24,455 7,558 - 32,013
Net assets released from restrictions for hazard mitigation - 92,258 - 92,258
Other 3,449 11,455 - 14,904
Reclassification related to cy-pres (Note 17) (48,247) - - (48,247)
Loss on bond defeasance (Note 9) (77,798) (27,074) - (104,872)
Acquisition of Lutheran Medical Center (Note 1) - 305,237 - 305,237
(Decrease) increase in unrestricted net assets (276,494) 601,765 - 325,271
Changes in temporarily restricted net assets
Contributions 102,318 85,924 - 188,242
Investment return (Note 4) 11,377 6,226 - 17,603
Appropriation of endowment distribution (Note 4) (68,566) (20,872) - (89,438)
Other (13,082) (6,795) - (19,877)
Net assets released from restrictions for hazard mitigation (Note 19) - (92,258) - (92,258)
Net assets released from restrictions (74,906) (49,094) - (124,000)
Decrease in temporarily restricted net assets (42,859) (76,869) - (119,728)
Changes in permanently restricted net assets
Contributions 55,240 49,108 - 104,348
Reclassification related to cy-pres (Note 17) 48,247 - - 48,247
Other (53,965) 4,890 - (49,075)
Increase in permanently restricted net assets 49,522 53,998 - 103,520
(Decrease) increase in net assets (269,831)$ 578,894$ -$ 309,063$
2015
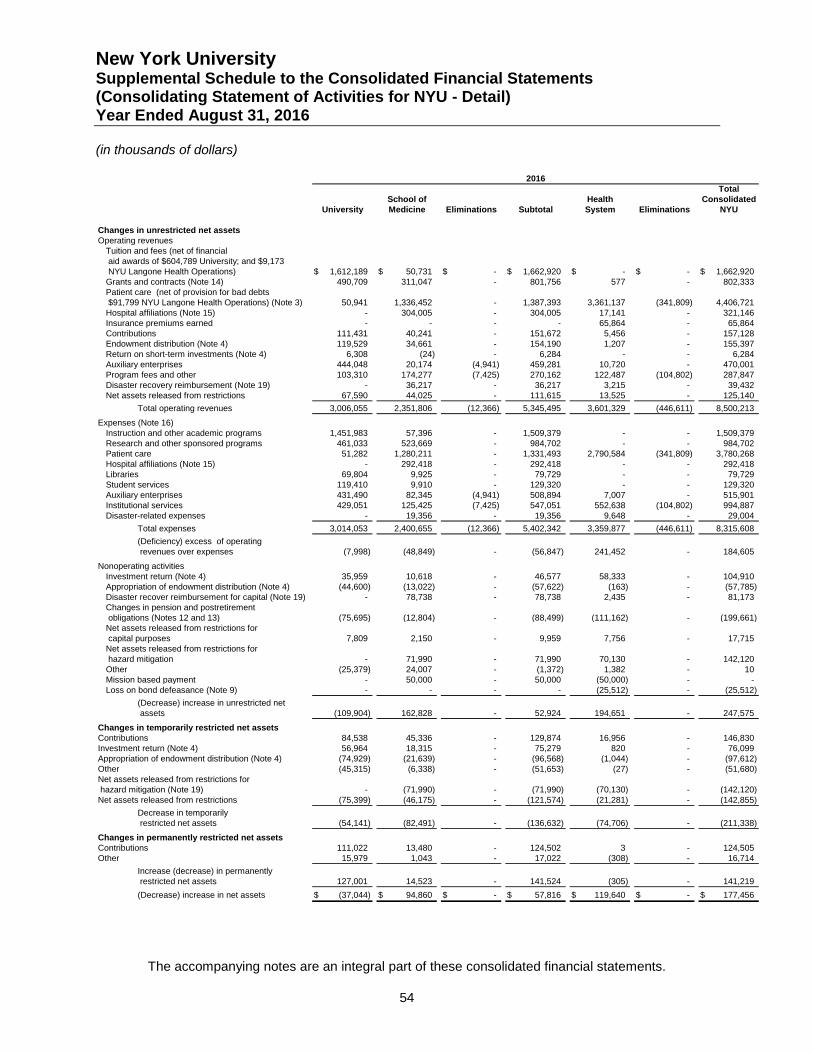
New York University Supplemental Schedule to the Consolidated Financial Statements (Consolidating Statement of Activities for NYU - Detail) Year Ended August 31, 2016
(in thousands of dollars)
The accompanying notes are an integral part of these consolidated financial statements.
54
Total
School of Health Consolidated
University Medicine Eliminations Subtotal System Eliminations NYU
Changes in unrestricted net assets
Operating revenues
Tuition and fees (net of financial
aid awards of $604,789 University; and $9,173
NYU Langone Health Operations) 1,612,189$ 50,731$ -$ 1,662,920$ -$ -$ 1,662,920$
Grants and contracts (Note 14) 490,709 311,047 - 801,756 577 - 802,333
Patient care (net of provision for bad debts
$91,799 NYU Langone Health Operations) (Note 3) 50,941 1,336,452 - 1,387,393 3,361,137 (341,809) 4,406,721
Hospital affiliations (Note 15) - 304,005 - 304,005 17,141 - 321,146
Insurance premiums earned - - - - 65,864 - 65,864
Contributions 111,431 40,241 - 151,672 5,456 - 157,128
Endowment distribution (Note 4) 119,529 34,661 - 154,190 1,207 - 155,397
Return on short-term investments (Note 4) 6,308 (24) - 6,284 - - 6,284
Auxiliary enterprises 444,048 20,174 (4,941) 459,281 10,720 - 470,001
Program fees and other 103,310 174,277 (7,425) 270,162 122,487 (104,802) 287,847
Disaster recovery reimbursement (Note 19) - 36,217 - 36,217 3,215 - 39,432
Net assets released from restrictions 67,590 44,025 - 111,615 13,525 - 125,140
Total operating revenues 3,006,055 2,351,806 (12,366) 5,345,495 3,601,329 (446,611) 8,500,213
Expenses (Note 16)
Instruction and other academic programs 1,451,983 57,396 - 1,509,379 - - 1,509,379
Research and other sponsored programs 461,033 523,669 - 984,702 - - 984,702
Patient care 51,282 1,280,211 - 1,331,493 2,790,584 (341,809) 3,780,268
Hospital affiliations (Note 15) - 292,418 - 292,418 - - 292,418
Libraries 69,804 9,925 - 79,729 - - 79,729
Student services 119,410 9,910 - 129,320 - - 129,320
Auxiliary enterprises 431,490 82,345 (4,941) 508,894 7,007 - 515,901
Institutional services 429,051 125,425 (7,425) 547,051 552,638 (104,802) 994,887
Disaster-related expenses - 19,356 - 19,356 9,648 - 29,004
Total expenses 3,014,053 2,400,655 (12,366) 5,402,342 3,359,877 (446,611) 8,315,608
(Deficiency) excess of operating
revenues over expenses (7,998) (48,849) - (56,847) 241,452 - 184,605
Nonoperating activities
Investment return (Note 4) 35,959 10,618 - 46,577 58,333 - 104,910
Appropriation of endowment distribution (Note 4) (44,600) (13,022) - (57,622) (163) - (57,785)
Disaster recover reimbursement for capital (Note 19) - 78,738 - 78,738 2,435 - 81,173
Changes in pension and postretirement
obligations (Notes 12 and 13) (75,695) (12,804) - (88,499) (111,162) - (199,661)
Net assets released from restrictions for
capital purposes 7,809 2,150 - 9,959 7,756 - 17,715
Net assets released from restrictions for
hazard mitigation - 71,990 - 71,990 70,130 - 142,120
Other (25,379) 24,007 - (1,372) 1,382 - 10
Mission based payment - 50,000 - 50,000 (50,000) - -
Loss on bond defeasance (Note 9) - - - - (25,512) - (25,512)
(Decrease) increase in unrestricted net
assets (109,904) 162,828 - 52,924 194,651 - 247,575
Changes in temporarily restricted net assets
Contributions 84,538 45,336 - 129,874 16,956 - 146,830
Investment return (Note 4) 56,964 18,315 - 75,279 820 - 76,099
Appropriation of endowment distribution (Note 4) (74,929) (21,639) - (96,568) (1,044) - (97,612)
Other (45,315) (6,338) - (51,653) (27) - (51,680)
Net assets released from restrictions for
hazard mitigation (Note 19) - (71,990) - (71,990) (70,130) - (142,120)
Net assets released from restrictions (75,399) (46,175) - (121,574) (21,281) - (142,855)
Decrease in temporarily
restricted net assets (54,141) (82,491) - (136,632) (74,706) - (211,338)
Changes in permanently restricted net assets
Contributions 111,022 13,480 - 124,502 3 - 124,505
Other 15,979 1,043 - 17,022 (308) - 16,714
Increase (decrease) in permanently
restricted net assets 127,001 14,523 - 141,524 (305) - 141,219
(Decrease) increase in net assets (37,044)$ 94,860$ -$ 57,816$ 119,640$ -$ 177,456$
2016

New York University Supplemental Schedule to the Consolidated Financial Statements (Consolidating Statement of Activities for NYU - Detail) Year Ended August 31, 2015
(in thousands of dollars)
The accompanying notes are an integral part of these consolidated financial statements.
55
Total
School of Health Consolidated
University Medicine Eliminations Subtotal System Eliminations NYU
Changes in unrestricted net assets
Operating revenues
Tuition and fees (net of financial
aid awards of $545,684 University; and $6,761
NYU Langone Health Operations) 1,548,058$ 51,812$ -$ 1,599,870$ -$ -$ 1,599,870$
Grants and contracts (Note 14) 460,513 295,578 - 756,091 6,295 - 762,386
Patient care (net of provision for bad debts
$48,566 NYU Langone Health Operations) (Note 3) 40,371 986,488 - 1,026,859 2,671,575 (219,321) 3,479,113
Hospital affiliations (Note 15) - 289,666 - 289,666 15,792 - 305,458
Insurance premiums earned - - - - 47,203 - 47,203
Contributions 101,256 36,407 - 137,663 4,930 - 142,593
Endowment distribution (Note 4) 111,423 34,277 - 145,700 1,205 - 146,905
Return on short-term investments (Note 4) 4,916 1 - 4,917 16,523 - 21,440
Auxiliary enterprises 413,680 21,444 (5,042) 430,082 4,322 - 434,404
Program fees and other 83,855 196,198 (7,258) 272,795 94,429 (109,427) 257,797
Disaster recovery reimbursement (Note 19) - 10,042 - 10,042 5,669 - 15,711
Net assets released from restrictions 50,451 32,977 - 83,428 8,559 - 91,987
Total operating revenues 2,814,523 1,954,890 (12,300) 4,757,113 2,876,502 (328,748) 7,304,867
Expenses (Note 16)
Instruction and other academic programs 1,444,449 47,786 - 1,492,235 - - 1,492,235
Research and other sponsored programs 432,930 498,073 - 931,003 - - 931,003
Patient care 40,684 970,687 - 1,011,371 2,087,390 (219,321) 2,879,440
Hospital affiliations (Note 15) - 282,083 - 282,083 - - 282,083
Libraries 69,006 6,629 - 75,635 - - 75,635
Student services 115,158 6,884 - 122,042 - - 122,042
Auxiliary enterprises 417,709 59,352 (5,042) 472,019 4,643 - 476,662
Institutional services 384,680 120,713 (7,258) 498,135 559,185 (109,427) 947,893
Disaster-related expenses - 3,970 - 3,970 6,003 - 9,973
Total expenses 2,904,616 1,996,177 (12,300) 4,888,493 2,657,221 (328,748) 7,216,966
(Deficiency) excess of operating
revenues over expenses (90,093) (41,287) - (131,380) 219,281 - 87,901
Nonoperating activities
Investment return (Note 4) 10,888 4,394 - 15,282 (12,158) - 3,124
Appropriation of endowment distribution (Note 4) (42,857) (14,446) - (57,303) (164) - (57,467)
Disaster recover reimbursement for capital (Note 19) - 45,173 - 45,173 31,042 - 76,215
Changes in pension and postretirement
obligations (Notes 12 and 13) (56,291) (11,275) - (67,566) (8,229) - (75,795)
Net assets released from restrictions for
capital purposes 24,455 - - 24,455 7,558 - 32,013
Net assets released from restrictions for
hazard mitigation - 23,170 - 23,170 69,088 - 92,258
Other 3,449 12,157 - 15,606 (702) - 14,904
Reclassification related to cy-pres (Note 17) (48,247) - - (48,247) - - (48,247)
Mission based payment - 50,000 - 50,000 (50,000) - -
Loss on bond defeasance (Note 9) (77,798) - - (77,798) (27,074) - (104,872)
Acquisition of Lutheran Medical Center (Note 1) - - - - 305,237 - 305,237
(Decrease) increase in unrestricted net
assets (276,494) 67,886 - (208,608) 533,879 - 325,271
Changes in temporarily restricted net assets
Contributions 102,318 54,806 - 157,124 31,118 - 188,242
Investment return (Note 4) 11,377 6,359 - 17,736 (133) - 17,603
Appropriation of endowment distribution (Note 4) (68,566) (19,831) - (88,397) (1,041) - (89,438)
Other (13,082) (6,795) - (19,877) - - (19,877)
Net assets released from restrictions for
hazard mitigation (Note 19) - (23,170) - (23,170) (69,088) - (92,258)
Net assets released from restrictions (74,906) (32,977) - (107,883) (16,117) - (124,000)
Decrease in temporarily
restricted net assets (42,859) (21,608) - (64,467) (55,261) - (119,728)
Changes in permanently restricted net assets
Contributions 55,240 48,599 - 103,839 509 - 104,348
Reclassification related to cy-pres (Note 17) 48,247 - - 48,247 - - 48,247
Other (53,965) 4,890 - (49,075) - - (49,075)
Increase in permanently
restricted net assets 49,522 53,489 - 103,011 509 - 103,520
(Decrease) increase in net assets (269,831)$ 99,767$ -$ (170,064)$ 479,127$ -$ 309,063$
2015

New York University Supplemental Schedule to the Consolidated Financial Statements (Consolidating Statement of Cash Flows for NYU – Summary) Year Ended August 31, 2016
(in thousands of dollars)
The accompanying notes are an integral part of these consolidated financial statements.
56
NYU Consolidated
Cash flows from operating activities University Health Operations Eliminations NYU
Change in net assets (37,044)$ 214,500$ -$ 177,456$
Adjustments to reconcile change in net assets to net
cash provided by operating activities
Depreciation and amortization 243,584 212,189 455,773
Loss on sale or disposal of land, buildings and equipment and other adjustments 23,069 1,782 - 24,851
Loss on extinguishment of debt - 4,793 - 4,793
Net gain on investments and deposits with trustees (71,703) (66,114) (137,817)
Bad debt expense 38,926 96,179 - 135,105
Pension and postretirement obligation change 75,695 123,966 - 199,661
Contributions received for permanent investment and capital (81,487) (52,240) - (133,727)
Proceeds from disaster recovery award for future mitigation - (114,566) - (114,566)
Changes in operating assets and liabilities
(Increase) decrease in accounts and loans receivable, net (1,946) 2,233 (8,186) (7,899)
Decrease in disaster recovery receivable - 136,137 - 136,137
Decrease (increase) in patient accounts receivable 733 (206,715) - (205,982)
(Increase) decrease in nonendowment and noncapital contributions receivable (37,715) 21,311 - (16,404)
Decrease (increase) in other assets 20,822 (24,427) - (3,605)
Decrease in asset retirement obligation - (3,040) - (3,040)
Increase in accounts payable and accrued expenses 40,672 129,661 8,186 178,519
Decrease in disaster-related accounts payable and accrued expenses - (382) - (382)
Increase in professional liabilities - 85,135 - 85,135
Decrease in deferred revenue (34,787) (186,235) - (221,022)
Increase in accrued pension obligation 4,797 9,711 - 14,508
Increase in accrued postretirement obligation 15,667 10,183 - 25,850
Net cash provided by operating activities 199,283 394,061 - 593,344
Cash flows from investing activities
Purchases of investments (1,931,086) (889,642) - (2,820,728)
Sales and maturities of investments 1,924,935 966,160 - 2,891,095
Increase in deposits held with captive - (61,886) - (61,886)
Drawdowns of unexpended bond proceeds 351,121 31,505 - 382,626
Additions to land, buildings, and equipment, net of disposals (456,862) (999,620) - (1,456,482)
Proceeds from commercial insurance or disaster recovery for capital - 216,071 - 216,071
Net cash used in investing activities (111,892) (737,412) - (849,304)
Cash flows from financing activities
Contributions restricted for permanent investment and capital 81,487 52,240 - 133,727
Proceeds from disaster recovery award for future mitigation - 114,566 - 114,566
Proceeds from short-term borrowings 171,771 233,001 - 404,772
Proceeds from long-term borrowings - - - -
Principal payments on short-term borrowings (317,654) - - (317,654)
Principal payments on bonds and notes payable (46,883) (66,948) (113,831)
Payments of deferred financing costs (2,742) (2,881) - (5,623)
Increase (decrease) in federal grants refundable 249 (809) - (560)
Decrease in deposits with bond trustees 1,648 12,059 - 13,707
Net cash provided by financing activities (112,124) 341,228 - 229,104
Net decrease in cash (24,733) (2,123) - (26,856)
Cash
Beginning of year 810,454 249,668 - 1,060,122
End of year 785,721$ 247,545$ -$ 1,033,266$
Supplemental disclosure of cash flow information
Bond proceeds 733,197$ 381,713$ -$ 1,114,910$
Other leasing obligations - (146,603) - (146,603)
Interest paid 108,200 109,252 - 217,452
Non-cash acquisitions of land, buildings, and equipment (1,908) 80,542 - 78,634
Assets acquired under capital leases 42 75,588 - 75,630
2016

New York University Supplemental Schedule to the Consolidated Financial Statements (Consolidating Statement of Cash Flows for NYU – Summary) Year Ended August 31, 2015
(in thousands of dollars)
The accompanying notes are an integral part of these consolidated financial statements.
57
NYU Consolidated
Cash flows from operating activities University Health Operations Eliminations NYU
Change in net assets (269,831)$ 578,894$ -$ 309,063$
Adjustments to reconcile change in net assets to net
cash provided by operating activities
Depreciation and amortization 217,930 176,906 394,836
(Gain) loss on sale or disposal of land, buildings and equipment (5,749) 43 - (5,706)
Net loss on investments and deposits with trustees 18,434 9,759 28,193
Bad debt expense 70,340 54,490 - 124,830
(Gain) loss on bond defeasance (2,204) 3,738 - 1,534
Pension and postretirement obligation change 66,019 9,776 - 75,795
Contributions received for permanent investment and capital (51,239) (73,537) - (124,776)
Proceeds from disaster recovery award for future mitigation - (28,736) - (28,736)
Acquisition of Lutheran Medical center - (305,237) - (305,237)
Changes in operating assets and liabilities
Increase in accounts and loans receivable, net (13,679) (18,699) (8,773) (41,151)
Decrease in disaster recovery receivable - 87,119 - 87,119
Increase in patient accounts receivable (1,088) (76,841) - (77,929)
Increase in nonendowment and noncapital contributions receivable (19,886) (9,012) - (28,898)
Decrease in other assets 12,228 17,825 - 30,053
Decrease in asset retirement obligation - (3,722) - (3,722)
Increase (decrease) in accounts payable and accrued expenses 78,524 (150,418) 8,773 (63,121)
Decrease in disaster-related accounts payable and accrued expenses - (26,306) - (26,306)
Increase in professional liabilities - 45,230 - 45,230
Decrease in deferred revenue (631) (44,484) - (45,115)
(Decrease) increase in accrued pension obligation (2,841) 5,299 - 2,458
Increase in accrued postretirement obligation 16,375 18,489 - 34,864
Net cash provided by operating activities 112,702 270,576 - 383,278
Cash flows from investing activities
Purchases of investments (1,406,827) (841,722) - (2,248,549)
Sales and maturities of investments 1,393,881 615,878 - 2,009,759
Proceeds from sale of building 5,891 - 5,891
Increase in deposits held with captive - (42,930) - (42,930)
Drawdowns of unexpended bond proceeds 31,144 20,976 - 52,120
Additions to land, buildings, and equipment, net of disposals (488,496) (633,370) - (1,121,866)
Proceeds from commercial insurance or disaster recovery for capital - 53,220 - 53,220
Cash acquired from acquisition of Lutheran Medical Center - 26,074 26,074
Net cash used in investing activities (464,407) (801,874) - (1,266,281)
Cash flows from financing activities
Contributions restricted for permanent investment and capital 51,239 73,537 - 124,776
Proceeds from disaster recovery award for future mitigation - 28,736 - 28,736
Proceeds from short-term borrowings 220,015 56,400 - 276,415
Proceeds from long-term borrowings 1,112,673 521,795 - 1,634,468
Principal payments on bonds and notes payable (75,987) (210,000) (285,987)
Principal payments on short-term borrowings (821,121) (258,741) - (1,079,862)
Payments of deferred financing costs (4,407) (3,512) - (7,919)
Increase (decrease) in federal grants refundable 238 (325) - (87)
Decrease (increase) in deposits with bond trustees 11,722 (1,827) - 9,895
Net cash provided by financing activities 494,372 206,063 - 700,435
Net increase (decrease) in cash 142,667 (325,235) - (182,568)
Cash
Beginning of year 667,787 574,903 - 1,242,690
End of year 810,454$ 249,668$ -$ 1,060,122$
Supplemental disclosure of cash flow information
Interest paid 91,030$ 109,343$ -$ 200,373$
Non-cash acquisitions of land, buildings, and equipment 26,140 19,707 - 45,847
Assets acquired under capital leases - 45,663 - 45,663
Non-cash acquisition of Lutheran Medical Center net assets - 279,163 - 279,163
2015

New York University Notes to Consolidating Supplemental Information August 31, 2016 and 2015
(in thousands of dollars)
.
58
1. Basis of Presentation – Consolidating Supplemental Information
The consolidating supplemental information ("consolidating information") presented on pages 47- 57 was derived from and relates directly to the underlying accounting and other records used to prepare the consolidated financial statements. The consolidating information is presented for purposes of additional analysis of the consolidated financial statements rather than to present the financial position, changes in net assets and cash flows of the individual companies within NYU and is not a required part of the consolidated financial statements. The individual companies within NYU as presented within the consolidating information are disclosed within Note 1 to the consolidated financial statements.


![Consolidated Financial Statements with … OF MANAGEMENT RESPONSIBILITY The accompanying consolidated financial statements of Memorial University of Newfoundland [the “University”]](https://img.pdfslide.us/doc/110x75/5aae76557f8b9a59478c1b1f/consolidated-financial-statements-with-of-management-responsibility-the-accompanying.jpg)