Embed Size (px)
Citation preview
New York UniversityConsolidated Financial StatementsAugust 31, 2015 and 2014
New York UniversityIndexAugust 31, 2015 and 2014
Page(s)
Independent Auditor’s Report.......................................................................................................... 1–2
Consolidated Financial Statements
Balance Sheets ......................................................................................................................................3
Statements of Activities ..........................................................................................................................4
Statements of Cash Flows ......................................................................................................................5
Notes to Financial Statements .......................................................................................................... 6–44
Appendix A
Supplemental Schedules ................................................................................................................ 46–53
Independent Auditor’s Report
To the Board of Trustees ofNew York University
We have audited the accompanying consolidated financial statements of New York University (“NYU”),which comprise the consolidated balance sheets as of August 31, 2015 and 2014, and the relatedconsolidated statements of activities and cash flows for the years then ended.
Management’s Responsibility for the Consolidated Financial Statements
Management is responsible for the preparation and fair presentation of the consolidated financialstatements in accordance with accounting principles generally accepted in the United States of America;this includes the design, implementation, and maintenance of internal control relevant to the preparationand fair presentation of consolidated financial statements that are free from material misstatement,whether due to fraud or error.
Auditor’s Responsibility
Our responsibility is to express an opinion on the consolidated financial statements based on our audits.We conducted our audits in accordance with auditing standards generally accepted in the United States ofAmerica. Those standards require that we plan and perform the audit to obtain reasonable assuranceabout whether the consolidated financial statements are free from material misstatement.
An audit involves performing procedures to obtain audit evidence about the amounts and disclosures inthe consolidated financial statements. The procedures selected depend on our judgment, including theassessment of the risks of material misstatement of the consolidated financial statements, whether due tofraud or error. In making those risk assessments, we consider internal control relevant to NYU’spreparation and fair presentation of the consolidated financial statements in order to design auditprocedures that are appropriate in the circumstances, but not for the purpose of expressing an opinion onthe effectiveness of NYU’s internal control. Accordingly, we express no such opinion. An audit alsoincludes evaluating the appropriateness of accounting policies used and the reasonableness of significantaccounting estimates made by management, as well as evaluating the overall presentation of theconsolidated financial statements. We believe that the audit evidence we have obtained is sufficient andappropriate to provide a basis for our audit opinion.
Opinion
In our opinion, the consolidated financial statements referred to above present fairly, in all materialrespects, the financial position of New York University at August 31, 2015 and 2014, and the changes intheir net assets and their cash flows for the years then ended in accordance with accounting principlesgenerally accepted in the United States of America.
PricewaterhouseCoopers LLP, PricewaterhouseCoopers Center, 300 Madison Avenue, New York, NY 10017T: (646) 471 3000, F: (813) 286 6000, www.pwc.com/us
2
Other Matter
Our audit was conducted for the purpose of forming an opinion on the consolidated financial statementstaken as a whole. The consolidating information on pages 46 through 53 in Appendix A SupplementalSchedules is the responsibility of management and was derived from and relates directly to the underlyingaccounting and other records used to prepare the consolidated financial statements. The consolidatinginformation has been subjected to the auditing procedures applied in the audit of the financial statementsand certain additional procedures, including comparing and reconciling such information directly to theunderlying accounting and other records used to prepare the financial statements or to the financialstatements themselves and other additional procedures, in accordance with auditing standards generallyaccepted in the United States of America. In our opinion, the consolidating information is fairly stated, inall material respects, in relation to the consolidated financial statements taken as a whole. Theconsolidating information is presented for purposes of additional analysis of the consolidated financialstatements rather than to present the financial position, changes in net assets and cash flows of theindividual companies and is not a required part of the consolidated financial statements. Accordingly, wedo not express an opinion on the financial position, changes in net assets and cash flows of the individualcompanies.
December 14, 2015
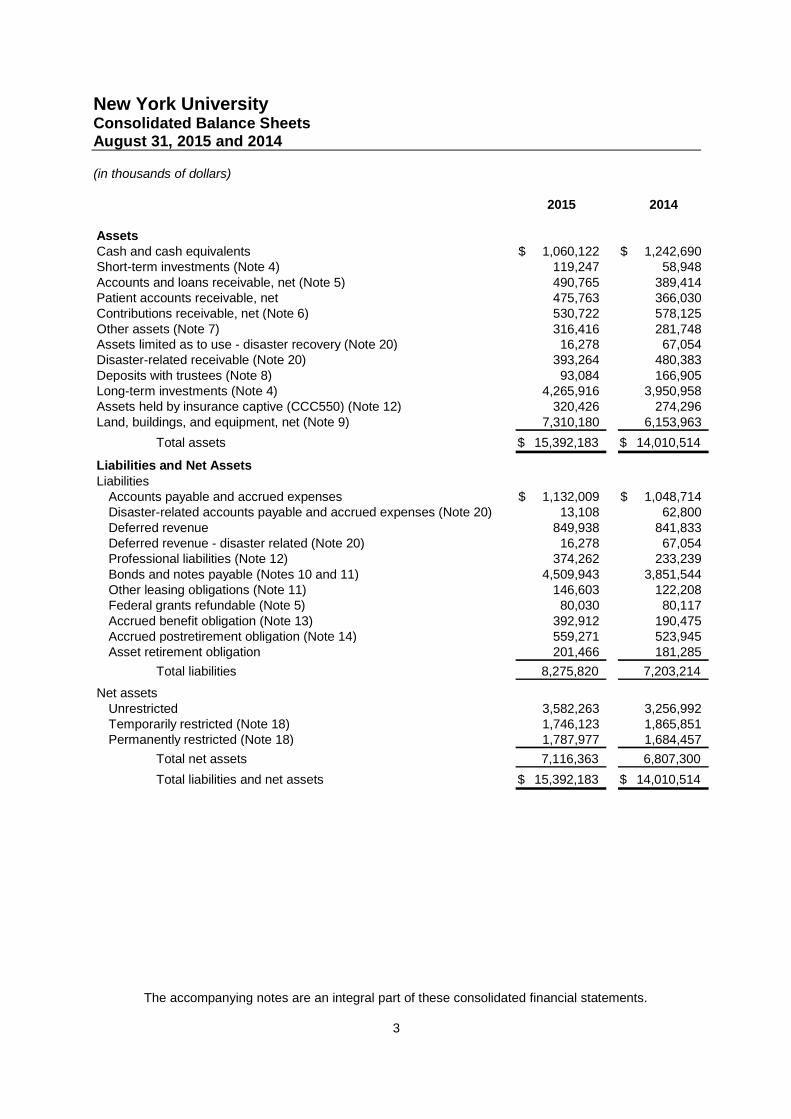
New York UniversityConsolidated Balance SheetsAugust 31, 2015 and 2014
(in thousands of dollars)
The accompanying notes are an integral part of these consolidated financial statements.
3
2015 2014
AssetsCash and cash equivalents 1,060,122$ 1,242,690$Short-term investments (Note 4) 119,247 58,948Accounts and loans receivable, net (Note 5) 490,765 389,414Patient accounts receivable, net 475,763 366,030Contributions receivable, net (Note 6) 530,722 578,125Other assets (Note 7) 316,416 281,748Assets limited as to use - disaster recovery (Note 20) 16,278 67,054Disaster-related receivable (Note 20) 393,264 480,383Deposits with trustees (Note 8) 93,084 166,905Long-term investments (Note 4) 4,265,916 3,950,958Assets held by insurance captive (CCC550) (Note 12) 320,426 274,296Land, buildings, and equipment, net (Note 9) 7,310,180 6,153,963
Total assets 15,392,183$ 14,010,514$
Liabilities and Net AssetsLiabilities
Accounts payable and accrued expenses 1,132,009$ 1,048,714$Disaster-related accounts payable and accrued expenses (Note 20) 13,108 62,800Deferred revenue 849,938 841,833Deferred revenue - disaster related (Note 20) 16,278 67,054Professional liabilities (Note 12) 374,262 233,239Bonds and notes payable (Notes 10 and 11) 4,509,943 3,851,544Other leasing obligations (Note 11) 146,603 122,208Federal grants refundable (Note 5) 80,030 80,117Accrued benefit obligation (Note 13) 392,912 190,475Accrued postretirement obligation (Note 14) 559,271 523,945Asset retirement obligation 201,466 181,285
Total liabilities 8,275,820 7,203,214
Net assetsUnrestricted 3,582,263 3,256,992Temporarily restricted (Note 18) 1,746,123 1,865,851Permanently restricted (Note 18) 1,787,977 1,684,457
Total net assets 7,116,363 6,807,300
Total liabilities and net assets 15,392,183$ 14,010,514$
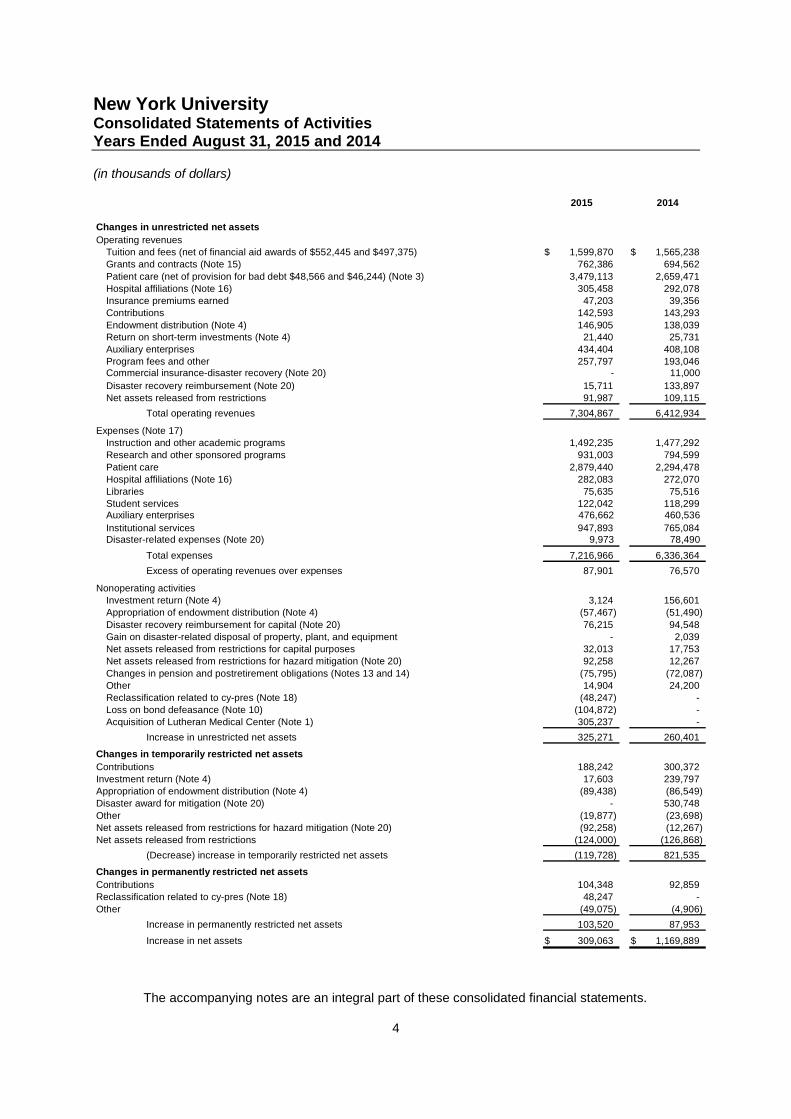
New York UniversityConsolidated Statements of ActivitiesYears Ended August 31, 2015 and 2014
(in thousands of dollars)
The accompanying notes are an integral part of these consolidated financial statements.
4
2015 2014
Changes in unrestricted net assets
Operating revenuesTuition and fees (net of financial aid awards of $552,445 and $497,375) 1,599,870$ 1,565,238$Grants and contracts (Note 15) 762,386 694,562
Patient care (net of provision for bad debt $48,566 and $46,244) (Note 3) 3,479,113 2,659,471Hospital affiliations (Note 16) 305,458 292,078Insurance premiums earned 47,203 39,356Contributions 142,593 143,293
Endowment distribution (Note 4) 146,905 138,039Return on short-term investments (Note 4) 21,440 25,731Auxiliary enterprises 434,404 408,108Program fees and other 257,797 193,046Commercial insurance-disaster recovery (Note 20) - 11,000
Disaster recovery reimbursement (Note 20) 15,711 133,897Net assets released from restrictions 91,987 109,115
Total operating revenues 7,304,867 6,412,934
Expenses (Note 17)Instruction and other academic programs 1,492,235 1,477,292Research and other sponsored programs 931,003 794,599
Patient care 2,879,440 2,294,478Hospital affiliations (Note 16) 282,083 272,070Libraries 75,635 75,516Student services 122,042 118,299Auxiliary enterprises 476,662 460,536
Institutional services 947,893 765,084Disaster-related expenses (Note 20) 9,973 78,490
Total expenses 7,216,966 6,336,364
Excess of operating revenues over expenses 87,901 76,570
Nonoperating activitiesInvestment return (Note 4) 3,124 156,601Appropriation of endowment distribution (Note 4) (57,467) (51,490)
Disaster recovery reimbursement for capital (Note 20) 76,215 94,548Gain on disaster-related disposal of property, plant, and equipment - 2,039Net assets released from restrictions for capital purposes 32,013 17,753Net assets released from restrictions for hazard mitigation (Note 20) 92,258 12,267
Changes in pension and postretirement obligations (Notes 13 and 14) (75,795) (72,087)Other 14,904 24,200Reclassification related to cy-pres (Note 18) (48,247) -Loss on bond defeasance (Note 10) (104,872) -Acquisition of Lutheran Medical Center (Note 1) 305,237 -
Increase in unrestricted net assets 325,271 260,401
Changes in temporarily restricted net assets
Contributions 188,242 300,372Investment return (Note 4) 17,603 239,797Appropriation of endowment distribution (Note 4) (89,438) (86,549)Disaster award for mitigation (Note 20) - 530,748
Other (19,877) (23,698)Net assets released from restrictions for hazard mitigation (Note 20) (92,258) (12,267)Net assets released from restrictions (124,000) (126,868)
(Decrease) increase in temporarily restricted net assets (119,728) 821,535
Changes in permanently restricted net assets
Contributions 104,348 92,859Reclassification related to cy-pres (Note 18) 48,247 -
Other (49,075) (4,906)
Increase in permanently restricted net assets 103,520 87,953
Increase in net assets 309,063$ 1,169,889$
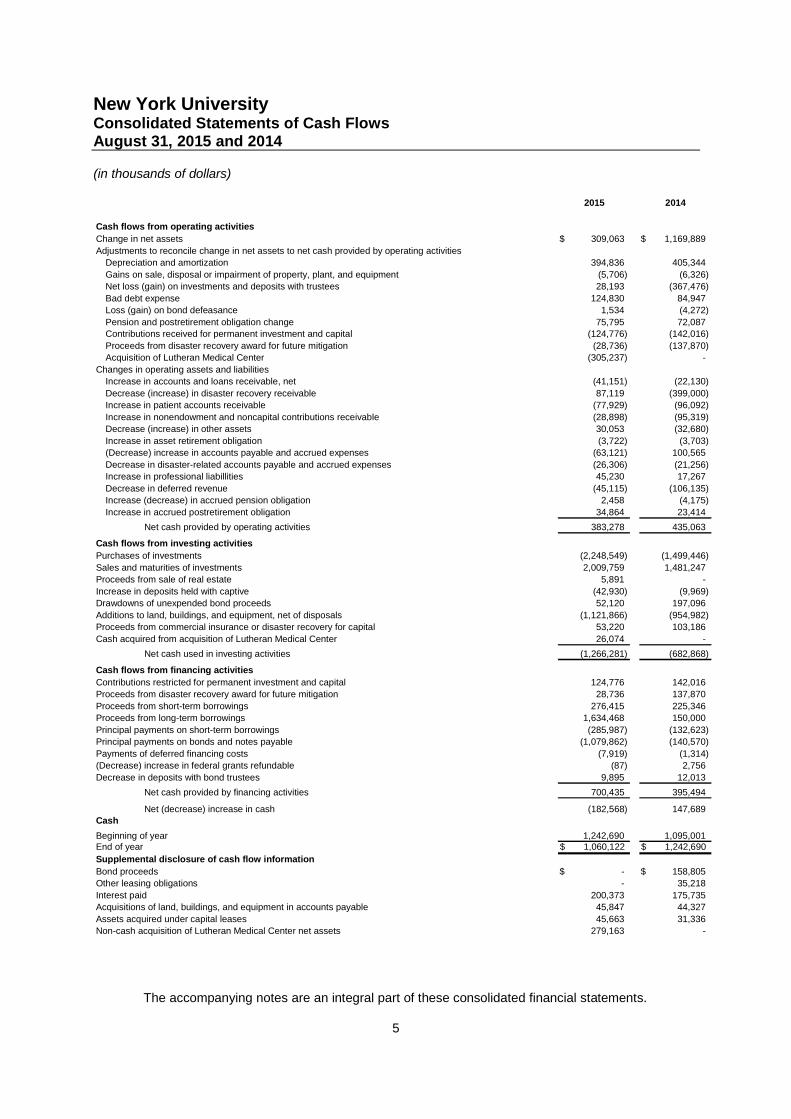
New York UniversityConsolidated Statements of Cash FlowsAugust 31, 2015 and 2014
(in thousands of dollars)
The accompanying notes are an integral part of these consolidated financial statements.
5
2015 2014
Cash flows from operating activities
Change in net assets 309,063$ 1,169,889$
Adjustments to reconcile change in net assets to net cash provided by operating activities
Depreciation and amortization 394,836 405,344
Gains on sale, disposal or impairment of property, plant, and equipment (5,706) (6,326)
Net loss (gain) on investments and deposits with trustees 28,193 (367,476)
Bad debt expense 124,830 84,947
Loss (gain) on bond defeasance 1,534 (4,272)
Pension and postretirement obligation change 75,795 72,087
Contributions received for permanent investment and capital (124,776) (142,016)
Proceeds from disaster recovery award for future mitigation (28,736) (137,870)
Acquisition of Lutheran Medical Center (305,237) -
Changes in operating assets and liabilities
Increase in accounts and loans receivable, net (41,151) (22,130)
Decrease (increase) in disaster recovery receivable 87,119 (399,000)
Increase in patient accounts receivable (77,929) (96,092)
Increase in nonendowment and noncapital contributions receivable (28,898) (95,319)
Decrease (increase) in other assets 30,053 (32,680)
Increase in asset retirement obligation (3,722) (3,703)
(Decrease) increase in accounts payable and accrued expenses (63,121) 100,565
Decrease in disaster-related accounts payable and accrued expenses (26,306) (21,256)
Increase in professional liabillities 45,230 17,267
Decrease in deferred revenue (45,115) (106,135)
Increase (decrease) in accrued pension obligation 2,458 (4,175)
Increase in accrued postretirement obligation 34,864 23,414
Net cash provided by operating activities 383,278 435,063
Cash flows from investing activities
Purchases of investments (2,248,549) (1,499,446)
Sales and maturities of investments 2,009,759 1,481,247
Proceeds from sale of real estate 5,891 -
Increase in deposits held with captive (42,930) (9,969)
Drawdowns of unexpended bond proceeds 52,120 197,096
Additions to land, buildings, and equipment, net of disposals (1,121,866) (954,982)
Proceeds from commercial insurance or disaster recovery for capital 53,220 103,186
Cash acquired from acquisition of Lutheran Medical Center 26,074 -
Net cash used in investing activities (1,266,281) (682,868)
Cash flows from financing activities
Contributions restricted for permanent investment and capital 124,776 142,016
Proceeds from disaster recovery award for future mitigation 28,736 137,870
Proceeds from short-term borrowings 276,415 225,346
Proceeds from long-term borrowings 1,634,468 150,000
Principal payments on short-term borrowings (285,987) (132,623)
Principal payments on bonds and notes payable (1,079,862) (140,570)
Payments of deferred financing costs (7,919) (1,314)
(Decrease) increase in federal grants refundable (87) 2,756
Decrease in deposits with bond trustees 9,895 12,013
Net cash provided by financing activities 700,435 395,494
Net (decrease) increase in cash (182,568) 147,689Cash
Beginning of year 1,242,690 1,095,001End of year 1,060,122$ 1,242,690$
Supplemental disclosure of cash flow information
Bond proceeds -$ 158,805$
Other leasing obligations - 35,218
Interest paid 200,373 175,735
Acquisitions of land, buildings, and equipment in accounts payable 45,847 44,327
Assets acquired under capital leases 45,663 31,336
Non-cash acquisition of Lutheran Medical Center net assets 279,163 -
New York UniversityNotes to Consolidated Financial StatementsAugust 31, 2015 and 2014
(in thousands of dollars)
6
1. Description of New York University
Founded in 1831, New York University (NYU) is a private institution of higher education, research,and patient care located primarily in New York City. NYU is recognized both nationally andinternationally as a leader in scholarship and is a member of the distinguished Association ofAmerican Universities.
The consolidated reporting entities for NYU consist of the University and NYU Health Operations(Health Operations), which represents the operations of NYU Hospitals Center (the HospitalsCenter or NYUHC), NYU School of Medicine (NYUSoM), CCC550, and NYU Lutheran MedicalCenter and its subsidiaries (Lutheran). Prior to April 1, 2015, the operations of the HospitalsCenter, NYUSoM, and CCC550 were known as NYU Langone Medical Center (the MedicalCenter).
NYU’s balance sheets and statements of activities presented in Appendix A include balances forNYU’s affiliates such as the Institute for Fine Arts Foundation, NYU Imaging, Inc., NYU School ofBusiness Foundation and NYU School of Law Foundation.
The UniversityThe University includes nineteen colleges and divisions each with its own traditions, programs andfaculty. The schools, in order of founding date, are the College of Arts and Science, School ofLaw, NYU School of Medicine (reported as a part of NYU Health Operations), College of Dentistry,Graduate School of Arts and Science, Steinhardt School of Culture, Education and HumanDevelopment, Leonard N. Stern School of Business, Courant Institute of Mathematical Sciences,School of Continuing and Professional Studies, Institute of Fine Arts, Robert F. Wagner GraduateSchool of Public Service, Post-Graduate Medical School, Silver School of Social Work, TischSchool of the Arts, Gallatin School of Individualized Study, College of Nursing, the Institute for theStudy of the Ancient World, NYU Abu Dhabi, and NYU Tandon School of Engineering. TheUniversity also operates academic program sites and research programs in other parts of theUnited States and abroad.
In addition to the colleges and divisions, NYU began operating NYU Shanghai in fall 2013, whichgrants NYU degrees, as a joint venture with East China Normal University. The NY-basedactivities of NYU Shanghai are reported in the University’s balance sheets and statement ofactivities.
NYU Health OperationsOn April 1, 2015, the Hospitals Center and Lutheran Medical Center completed an affiliationagreement whereby NYU Langone Health System (Health System), a newly-formed not-for-profitcorporation, became the sole corporate member of the Hospitals Center and Lutheran (Affiliation),each Section 501(c)(3) organizations exempt from federal income taxes under Section 501(a) ofthe Internal Revenue Code. The Hospitals Center’s affiliation with Lutheran will bring the twoorganizations together to create a clinically integrated healthcare provider network. It extends theHospitals Center’s presence in Brooklyn, while bolstering Lutheran’s access to the HospitalsCenter’s vast offering of medical and surgical specialties.
New York UniversityNotes to Consolidated Financial StatementsAugust 31, 2015 and 2014
(in thousands of dollars)
7
Prior to the Affiliation, the University was the sole corporate member of the Hospitals Center. Withthe closing of the Affiliation, the University became the sole corporate member of the HealthSystem but did not assume any responsibility or liability for the financial obligations of the HealthSystem. The NYU Board of Trustees appoints the members of the Health System Board, who arethe same individuals who serve on the Hospitals Center Board and the NYUSoM Advisory Board.
In December 2015, Hospitals Center and Lutheran received a Certificate of Need approval fromthe New York State Department of Health for a full asset merger, with the Hospitals Center as thesuccessor entity. The merger will become effective upon the receipt of regulatory approvals, whichis expected to be completed during fiscal year 2016.
The Hospitals Center operates the Tisch Hospital, a 705-bed acute care facility and a major centerfor specialized procedures in cardiovascular services, neurosurgery, cancer treatment,reconstructive surgery and transplantation; NYU Hospital for Joint Diseases, a 190-bed acute carefacility specializing in orthopedic, neurologic, and rheumatologic services; and several ambulatoryfacilities, including the Laura and Isaac Perlmutter Cancer Center, the Ambulatory Care Center, theCenter for Musculoskeletal Care and Hassenfeld Children’s Center.
CCC550 is solely owned by the Hospitals Center and provides professional liability insurance tothe Hospitals Center and to physicians employed by the NYUSoM. CCC550 is subject to taxationin accordance with section 29 of the Exempt Insurance Act in Barbados.
Lutheran Medical Center is a 450 bed acute care hospital in Brooklyn, New York. Its wholly ownedsubsidiaries consist of Lutheran Augustana Center for Extended Care and Rehabilitation, a 240bed skilled nursing facility; Lutheran CHHA, Inc., a certified home health agency; Community CareOrganization, Inc., a licensed home care agency; Shore Hill Housing, Sunset Gardens Housingand Harbor Hill Housing, which provides senior housing and rent subsidies for people meetingrequirements defined by the US Department of Housing and Urban Development; and Sunset BayCommunity Services, Inc., which provides senior services and day care services.
The change in control of Lutheran was accounted for as a business combination in accordancewith Accounting Standards Codification (ASC), Topic 805, Business Combinations, and ASC 958-805-05, Acquisition by a Not-for-Profit Entity. NYU recorded $305,237 of unrestricted non-operating income in the 2015 consolidated statement of activities which represents Lutheran’s netassets at March 31, 2015 and the excess of the fair value of assets acquired over the fair value ofliabilities assumed. No consideration was exchanged for the acquisition.
In 2015, Lutheran changed its fiscal year end from December 31 to August 31 to conform to NYU’syear end. As a result of this change, obtaining revenues and changes in net assets as though theacquisition occurred at the beginning of the year and for comparable prior year periods isimpracticable.
New York UniversityNotes to Consolidated Financial StatementsAugust 31, 2015 and 2014
(in thousands of dollars)
8
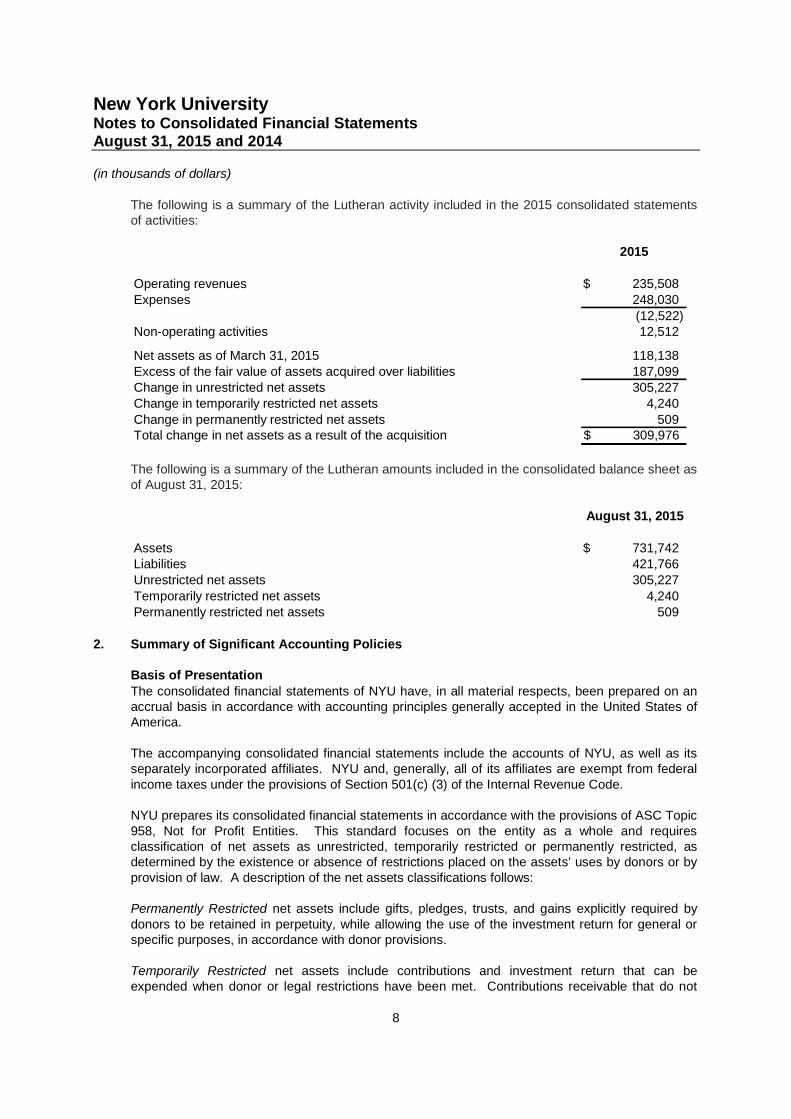
The following is a summary of the Lutheran activity included in the 2015 consolidated statementsof activities:
2015
Operating revenues 235,508$Expenses 248,030
(12,522)Non-operating activities 12,512
Net assets as of March 31, 2015 118,138Excess of the fair value of assets acquired over liabilities 187,099Change in unrestricted net assets 305,227Change in temporarily restricted net assets 4,240Change in permanently restricted net assets 509Total change in net assets as a result of the acquisition 309,976$
The following is a summary of the Lutheran amounts included in the consolidated balance sheet asof August 31, 2015:
August 31, 2015
Assets 731,742$Liabilities 421,766Unrestricted net assets 305,227Temporarily restricted net assets 4,240Permanently restricted net assets 509
2. Summary of Significant Accounting Policies
Basis of PresentationThe consolidated financial statements of NYU have, in all material respects, been prepared on anaccrual basis in accordance with accounting principles generally accepted in the United States ofAmerica.
The accompanying consolidated financial statements include the accounts of NYU, as well as itsseparately incorporated affiliates. NYU and, generally, all of its affiliates are exempt from federalincome taxes under the provisions of Section 501(c) (3) of the Internal Revenue Code.
NYU prepares its consolidated financial statements in accordance with the provisions of ASC Topic958, Not for Profit Entities. This standard focuses on the entity as a whole and requiresclassification of net assets as unrestricted, temporarily restricted or permanently restricted, asdetermined by the existence or absence of restrictions placed on the assets’ uses by donors or byprovision of law. A description of the net assets classifications follows:
Permanently Restricted net assets include gifts, pledges, trusts, and gains explicitly required bydonors to be retained in perpetuity, while allowing the use of the investment return for general orspecific purposes, in accordance with donor provisions.
Temporarily Restricted net assets include contributions and investment return that can beexpended when donor or legal restrictions have been met. Contributions receivable that do not
New York UniversityNotes to Consolidated Financial StatementsAugust 31, 2015 and 2014
(in thousands of dollars)
9
carry a purpose restriction are deemed to be time restricted. Temporary restrictions are removedeither through the passage of time or because certain actions are taken by NYU that fulfill therestrictions or both.
Unrestricted net assets are the remaining net assets of NYU that are used to carry out its missionsof education, research and patient care which are not subject to donor restrictions.
OperationsTuition and fees are derived from degree programs as well as executive and continuing educationprograms. Tuition and fee revenue is recognized as operating income in the period in which it isearned. Tuition and fee receipts received in advance are recorded as deferred revenue. Nettuition and fees are computed after deducting certain scholarships and fellowships awarded tostudents. Revenues and expenses related to conducting programmatic activities and provision ofservices by NYU are classified as operating in the consolidated statement of activities. Investmentreturn relating to board-designated endowment funds and the related endowment appropriation, aswell as changes in pension and postretirement obligations and unusual or nonrecurring activity, areclassified as nonoperating in the consolidated statement of activities.
ContributionsContributions, including unconditional promises to give, are recognized as revenue in the periodreceived at their fair value. Contributions receivable are reported at their discounted present value,using an estimated interest rate for the year in which the promise was received and consideringmarket and credit risk as applicable (2.3% in 2015 and 1.9% in 2014). Amortization of the discountis recorded as additional contribution revenue. Conditional promises to give are not recognized asrevenue until the conditions on which they depend are substantially met. Allowances are recordedfor estimated uncollectible contributions based upon management’s judgment and analysis of thecreditworthiness of the donors, past collection experience and other relevant factors.
Uncompensated CareAs a matter of policy, the Health System provides significant amounts of partially or totallyuncompensated patient care. For accounting purposes, such uncompensated care is treatedeither as charity care or bad debt expense.
The Health System’s charity care policy, in accordance with the New York State Department ofHealth’s guidelines, ensures the provision of quality health care to the community served whilecarefully considering the ability of the patient to pay. The policy has sliding fee schedules forinpatient, ambulatory and emergency services provided to the uninsured and under-insuredpatients that qualify. Patients are eligible for the charity care fee schedule if they meet certainincome and liquid asset tests. For accounting and disclosure purposes, charity care is reported atcost. Since payment of this difference is not sought, charity care allowances are not reported asrevenue. Total forgone charges for charity care totaled $55,200 and $24,274 for fiscal year 2015and 2014, respectively. This equated to an approximate cost of $14,763 and $7,587 for the yearsended August 31, 2015 and 2014, which is based on a ratio of cost to charges during the year.
New York State regulations provide for the distribution of funds from an indigent care pool, which isintended to partially offset the cost of bad debts and services provided to the uninsured. The fundsare distributed based on each hospital’s level of bad debt and charity care in relation to all otherhospitals. Subsidy payments recognized as revenue amounted to approximately $27,769 and$8,496 for 2015 and 2014, respectively, and are included in net patient service revenue in theaccompanying consolidated statement of activities.
New York UniversityNotes to Consolidated Financial StatementsAugust 31, 2015 and 2014
(in thousands of dollars)
10
Patients who do not qualify for sliding scale fees and all uninsured inpatients who do not qualify forMedicaid assistance are billed at the Hospitals Center’s and Lutheran’s full rates. Uncollectedbalances for these patients are categorized as bad debts. Similarly, at NYUSoM, those balanceswhich are deemed uncollectible based on an inability or unwillingness to pay are written off.Uncollected balances for these patients are categorized as bad debts and totaled $48,566 and$46,244 for the years ended August 31, 2015 and 2014, respectively.
Cash and Cash EquivalentsCash and cash equivalents include cash and all highly-liquid debt instruments with originalmaturities of three months or less when purchased. This does not include pooled investments withless than three months to maturity held within the long-term investment portfolio. The carryingamount of cash and cash equivalents approximates fair value due to the short-term maturity of theinstruments.
Land, Buildings, and EquipmentLand, buildings, and equipment are carried at their acquisition or construction cost. If donated,these assets are recorded at their fair value on the date of the gift. Buildings and equipment aredepreciated over their estimated useful lives (buildings and building improvements 10-55 years,equipment 3-10 years) using the straight-line method.
CollectionsThe University does not assign a value to collection items. Collection items are generally held foreducational purposes and are not disposed of for financial gain or otherwise encumbered in anymanner.
Asset Retirement ObligationNYU recognizes asset retirement obligations on future events, such as the abatement of asbestos,and removal of lead-based paint and petroleum bulk storage tanks from buildings. The fair valueof the liability for a conditional asset retirement obligation is recognized in the period in which itoccurred, provided that it can be reasonably estimated. Corresponding asset retirement costs (netof accumulated depreciation) have been included in land, buildings, and equipment.
Accounting EstimatesThe preparation of financial statements in conformity with accounting principles generally acceptedin the United States of America requires management to make estimates and assumptions thataffect the reported amounts of assets and liabilities, the disclosure of contingencies at the date ofthe consolidated financial statements and the reported amounts of revenues and expenses duringthe reporting period. Actual results could differ from those estimates.
ReclassificationsCertain amounts in the 2014 consolidated financial statements have been reclassified to conformto the current year’s presentation.
New Authoritative PronouncementsIn May 2014, the FASB issued a standard on Revenue from Contracts with Customers. Thisstandard implements a single framework for recognition of all revenue earned from customers.This framework ensures that entities appropriately reflect the consideration to which they expect tobe entitled in exchange for goods and services by allocating transaction price to identifiedperformance obligations and recognizing revenue as performance obligations are satisfied.Qualitative and quantitative disclosures are required to enable users of financial statements tounderstand the nature, amount, timing, and uncertainty of revenue and cash flows arising from
New York UniversityNotes to Consolidated Financial StatementsAugust 31, 2015 and 2014
(in thousands of dollars)
11
contracts with customers. The standard is effective for fiscal years beginning after December 15,2017. NYU is evaluating the impact this will have on the consolidated financial statementsbeginning in fiscal year 2019.
In April 2015, the FASB issued a standard on Simplifying the Presentation of Debt Issuance Costs.This standard requires all costs incurred to issue debt to be presented in the balance sheet as adirect deduction from the carrying value of the associated debt liability. The standard is effective forfiscal years beginning after December 15, 2016. In fiscal year 2015, NYU early adopted thisstandard, and the updated presentation is reflected in the consolidated balance sheets as ofAugust 31, 2015 and 2014.
In May 2015, the FASB issued guidance about Fair Value Measurement and Disclosures forInvestments in Certain Entities That Calculate Net Asset Value per Share (or Its Equivalent). Thisguidance requires entities to present investments that use net asset value (NAV) as a practicalexpedient for valuation purposes separately from other investments categorized in the fair valuehierarchy. The standard is effective for fiscal years beginning after December 15, 2017. NYU isevaluating the impact this will have on the consolidated financial statements beginning in fiscalyear 2019.
3. Patient Care Revenue
The Health Operations have agreements with third party payors that provide for payments atamounts different from its established rates (i.e. gross charges). Payment arrangements includeprospective determined rates per discharge, reimbursed costs, discounted charges and per diempayments.
Patient care services rendered are recorded in the period in which the service is performed, net ofcontractual and other allowances that represent differences between gross charges and theestimated receipts under such programs. Patient care revenue for the Health Operations isreported at the estimated net realizable amounts due from patients, third-party payors and othersfor services rendered and includes estimated retroactive revenue adjustments due to ongoing andfuture audits, reviews and investigations. Retroactive adjustments are accrued on an estimatedbasis in the period the related services are rendered and adjusted in future periods as finalsettlements are determined. Patient accounts receivable are also reduced for allowances foruncollectible accounts.
The process for estimating the ultimate collection of receivables involves significant assumptionsand judgments. The Health Operations has implemented a monthly standardized approach toestimate and review the collectability of receivables based on the payor classification and theperiod for which the receivables have been outstanding. Past due balances over 90 days from thedate of billing and in excess of a specified amount are considered delinquent and are reviewed forcollectability. Account balances are written off against the allowance when management feels it isprobable the receivable will not be recovered. Historical collection and payor reimbursementexperience is an integral part of the estimation process related to reserves for doubtful accounts.In addition, the Health Operations assesses the current state of its billing functions in order toidentify any known collection or reimbursement issues and assess the impact, if any, on reserveestimates. The Health Operations believes that the collectability of its receivables is directly linkedto the quality of its billing processes, most notably those related to obtaining the correct informationin order to bill effectively for the services it provides. Revisions in reserve for doubtful accountsestimates are recorded as an adjustment to bad debt expense. The Health Operations’ allowancefor uncollectible accounts has remained consistent as a percentage of accounts receivables net ofcontractual allowances as of both August 31, 2015 and 2014.
New York UniversityNotes to Consolidated Financial StatementsAugust 31, 2015 and 2014
(in thousands of dollars)
12
Federal and state law requires that hospitals provide emergency services regardless of a patient’sability to pay. Uninsured patients seen in the emergency department, including patientssubsequently admitted for inpatient services, often do not provide information necessary to allowthe Health Operations to qualify such patients for charity care. Uncollectible amounts due fromsuch uninsured patients represent a substantial portion of the provision for bad debts.
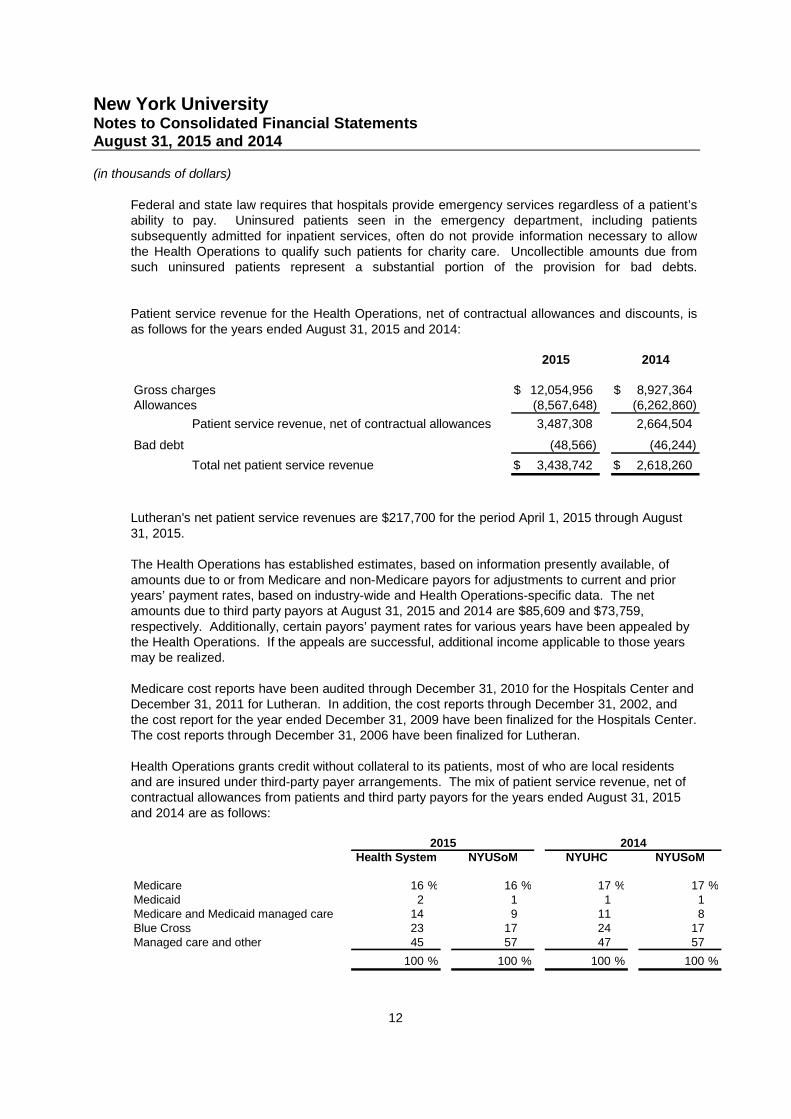
Patient service revenue for the Health Operations, net of contractual allowances and discounts, isas follows for the years ended August 31, 2015 and 2014:
2015 2014
Gross charges 12,054,956$ 8,927,364$Allowances (8,567,648) (6,262,860)
Patient service revenue, net of contractual allowances 3,487,308 2,664,504
Bad debt (48,566) (46,244)
Total net patient service revenue 3,438,742$ 2,618,260$
Lutheran's net patient service revenues are $217,700 for the period April 1, 2015 through August31, 2015.
The Health Operations has established estimates, based on information presently available, ofamounts due to or from Medicare and non-Medicare payors for adjustments to current and prioryears’ payment rates, based on industry-wide and Health Operations-specific data. The netamounts due to third party payors at August 31, 2015 and 2014 are $85,609 and $73,759,respectively. Additionally, certain payors’ payment rates for various years have been appealed bythe Health Operations. If the appeals are successful, additional income applicable to those yearsmay be realized.
Medicare cost reports have been audited through December 31, 2010 for the Hospitals Center andDecember 31, 2011 for Lutheran. In addition, the cost reports through December 31, 2002, andthe cost report for the year ended December 31, 2009 have been finalized for the Hospitals Center.The cost reports through December 31, 2006 have been finalized for Lutheran.
Health Operations grants credit without collateral to its patients, most of who are local residentsand are insured under third-party payer arrangements. The mix of patient service revenue, net ofcontractual allowances from patients and third party payors for the years ended August 31, 2015and 2014 are as follows:
Health System NYUSoM NYUHC NYUSoM
Medicare 16 % 16 % 17 % 17 %Medicaid 2 1 1 1Medicare and Medicaid managed care 14 9 11 8Blue Cross 23 17 24 17Managed care and other 45 57 47 57
100 % 100 % 100 % 100 %
20142015
New York UniversityNotes to Consolidated Financial StatementsAugust 31, 2015 and 2014
(in thousands of dollars)
13
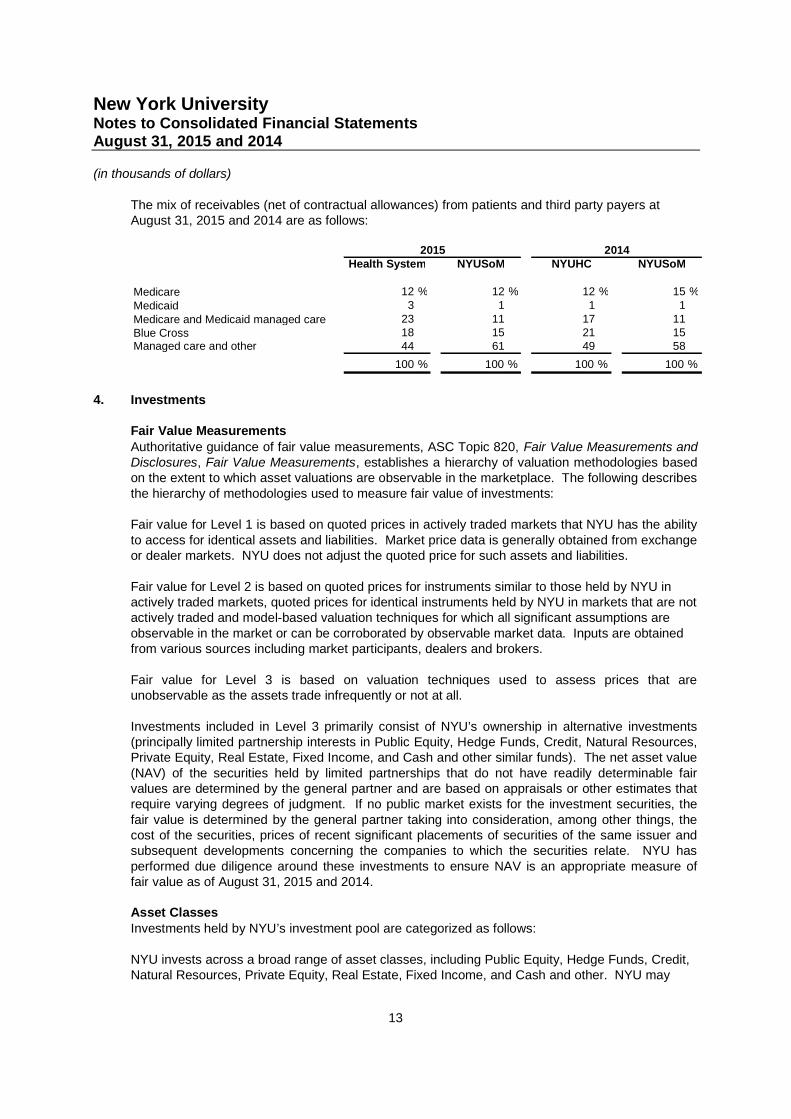
The mix of receivables (net of contractual allowances) from patients and third party payers atAugust 31, 2015 and 2014 are as follows:
Health System NYUSoM NYUHC NYUSoM
Medicare 12 % 12 % 12 % 15 %
Medicaid 3 1 1 1
Medicare and Medicaid managed care 23 11 17 11Blue Cross 18 15 21 15Managed care and other 44 61 49 58
100 % 100 % 100 % 100 %
2015 2014
4. Investments
Fair Value MeasurementsAuthoritative guidance of fair value measurements, ASC Topic 820, Fair Value Measurements andDisclosures, Fair Value Measurements, establishes a hierarchy of valuation methodologies basedon the extent to which asset valuations are observable in the marketplace. The following describesthe hierarchy of methodologies used to measure fair value of investments:
Fair value for Level 1 is based on quoted prices in actively traded markets that NYU has the abilityto access for identical assets and liabilities. Market price data is generally obtained from exchangeor dealer markets. NYU does not adjust the quoted price for such assets and liabilities.
Fair value for Level 2 is based on quoted prices for instruments similar to those held by NYU inactively traded markets, quoted prices for identical instruments held by NYU in markets that are notactively traded and model-based valuation techniques for which all significant assumptions areobservable in the market or can be corroborated by observable market data. Inputs are obtainedfrom various sources including market participants, dealers and brokers.
Fair value for Level 3 is based on valuation techniques used to assess prices that areunobservable as the assets trade infrequently or not at all.
Investments included in Level 3 primarily consist of NYU’s ownership in alternative investments(principally limited partnership interests in Public Equity, Hedge Funds, Credit, Natural Resources,Private Equity, Real Estate, Fixed Income, and Cash and other similar funds). The net asset value(NAV) of the securities held by limited partnerships that do not have readily determinable fairvalues are determined by the general partner and are based on appraisals or other estimates thatrequire varying degrees of judgment. If no public market exists for the investment securities, thefair value is determined by the general partner taking into consideration, among other things, thecost of the securities, prices of recent significant placements of securities of the same issuer andsubsequent developments concerning the companies to which the securities relate. NYU hasperformed due diligence around these investments to ensure NAV is an appropriate measure offair value as of August 31, 2015 and 2014.
Asset ClassesInvestments held by NYU’s investment pool are categorized as follows:
NYU invests across a broad range of asset classes, including Public Equity, Hedge Funds, Credit,Natural Resources, Private Equity, Real Estate, Fixed Income, and Cash and other. NYU may
New York UniversityNotes to Consolidated Financial StatementsAugust 31, 2015 and 2014
(in thousands of dollars)
14
invest directly in the securities of these asset classes, or indirectly through interests in funds andlimited partnerships. Securities held directly by NYU are valued at their observable market prices.The value of holdings in funds and limited partnerships are in accordance with the valuationsprovided by their investment managers. Funds and limited partnerships may make investments insecurities that are publicly traded, which are generally valued based on observable market prices.Managers of investment funds and limited partnerships value those investments based upon thebest information available for a given circumstance and may incorporate assumptions that are theinvestment manager’s best estimates after consideration of a variety of internal and externalfactors. If no public market exists for the investments, the fair value is determined by theinvestment manager taking into consideration, among other things, the cost of the investment,prices of recent significant placements of similar investments of the same issuer and subsequentdevelopments concerning the companies to which the investments relate. If NYU has the ability toredeem from an alternative investment up to 90 days beyond the measurement date at NAV, thealternative investment is generally categorized as Level 2. If the redemption period extendsbeyond 90 days, the investment is categorized as Level 3. Funds that NYU does not havediscretion for timing of withdrawals are categorized as Level 3.
Public EquityPublic Equity consists of publicly-traded equity, mutual funds, and other commingled funds (whichmay include passive index exposure).
Hedge FundsHedge Funds include investments with managers who invest across different strategies such aslong and short equity, multi-strategy, event driven and relative value funds. These managerstypically employ some leverage.
CreditCredit includes public and private investments in strategies including distressed debt and specialsituations.
Natural ResourcesNatural Resources includes public and private investments in natural resources.
Private EquityPrivate equity investments include limited partnership investments in funds pursuing strategies incorporate buyouts, growth equity, and venture capital.
Real EstateReal Estate includes private investments in real estate.
Fixed IncomeFixed Income includes investments in securities such as US and sovereign bonds, and corporateand asset-backed securities.
Cash & OtherCash includes investments in cash and cash equivalents. Other investments are predominantlycomprised of liquidating investments (valued at NAV as determined by the general partner).
The methods described above may produce a fair value calculation that may not be indicative ofnet realizable value or reflective of future fair values. Furthermore, while NYU believes itsvaluation methods are appropriate and consistent with other market participants, the use of
New York UniversityNotes to Consolidated Financial StatementsAugust 31, 2015 and 2014
(in thousands of dollars)
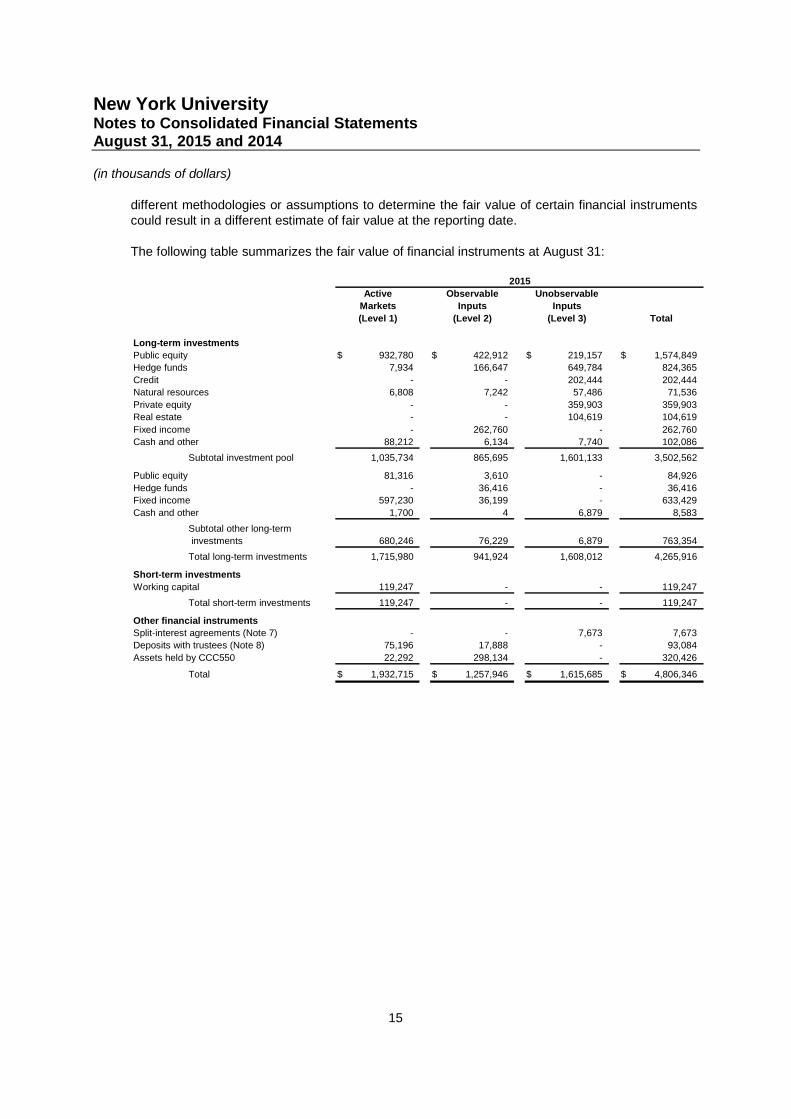
15
different methodologies or assumptions to determine the fair value of certain financial instrumentscould result in a different estimate of fair value at the reporting date.
The following table summarizes the fair value of financial instruments at August 31:
Active Observable Unobservable
Markets Inputs Inputs
(Level 1) (Level 2) (Level 3) Total
Long-term investments
Public equity 932,780$ 422,912$ 219,157$ 1,574,849$
Hedge funds 7,934 166,647 649,784 824,365
Credit - - 202,444 202,444
Natural resources 6,808 7,242 57,486 71,536
Private equity - - 359,903 359,903
Real estate - - 104,619 104,619
Fixed income - 262,760 - 262,760
Cash and other 88,212 6,134 7,740 102,086
Subtotal investment pool 1,035,734 865,695 1,601,133 3,502,562
Public equity 81,316 3,610 - 84,926
Hedge funds - 36,416 - 36,416
Fixed income 597,230 36,199 - 633,429
Cash and other 1,700 4 6,879 8,583
Subtotal other long-term
investments 680,246 76,229 6,879 763,354
Total long-term investments 1,715,980 941,924 1,608,012 4,265,916
Short-term investments
Working capital 119,247 - - 119,247
Total short-term investments 119,247 - - 119,247
Other financial instruments
Split-interest agreements (Note 7) - - 7,673 7,673
Deposits with trustees (Note 8) 75,196 17,888 - 93,084
Assets held by CCC550 22,292 298,134 - 320,426
Total 1,932,715$ 1,257,946$ 1,615,685$ 4,806,346$
2015
New York UniversityNotes to Consolidated Financial StatementsAugust 31, 2015 and 2014
(in thousands of dollars)
16
Active Observable Unobservable
Markets Inputs Inputs
(Level 1) (Level 2) (Level 3) Total
Long-term investments
Public equity 459,366$ 715,246$ 114,941$ 1,289,553$
Hedge funds - 325,667 608,300 933,967
Credit - 72,279 222,437 294,716
Natural resources 76,909 113,783 75,031 265,723
Private equity - - 291,455 291,455
Real estate - - 86,442 86,442
Fixed income - 136,325 - 136,325
Cash and other 124,074 9,937 30,659 164,670
Subtotal investment pool 660,349 1,373,237 1,429,265 3,462,851
Public equity 33,801 - - 33,801
Fixed income 445,932 - - 445,932
Cash and other 1,171 - 7,203 8,374
Subtotal other long-term
investments 480,904 - 7,203 488,107
Total long-term investments 1,141,253 1,373,237 1,436,468 3,950,958
Short-term investments
Working capital 58,948 - - 58,948
Total short-term investments 58,948 - - 58,948
Other financial instruments
Split-interest agreements (Note 7) - - 8,504 8,504
Deposits with trustees (Note 8) 112,167 54,738 - 166,905
Assets held by CCC550 22,984 251,312 - 274,296
Total 1,335,352$ 1,679,287$ 1,444,972$ 4,459,611$
2014
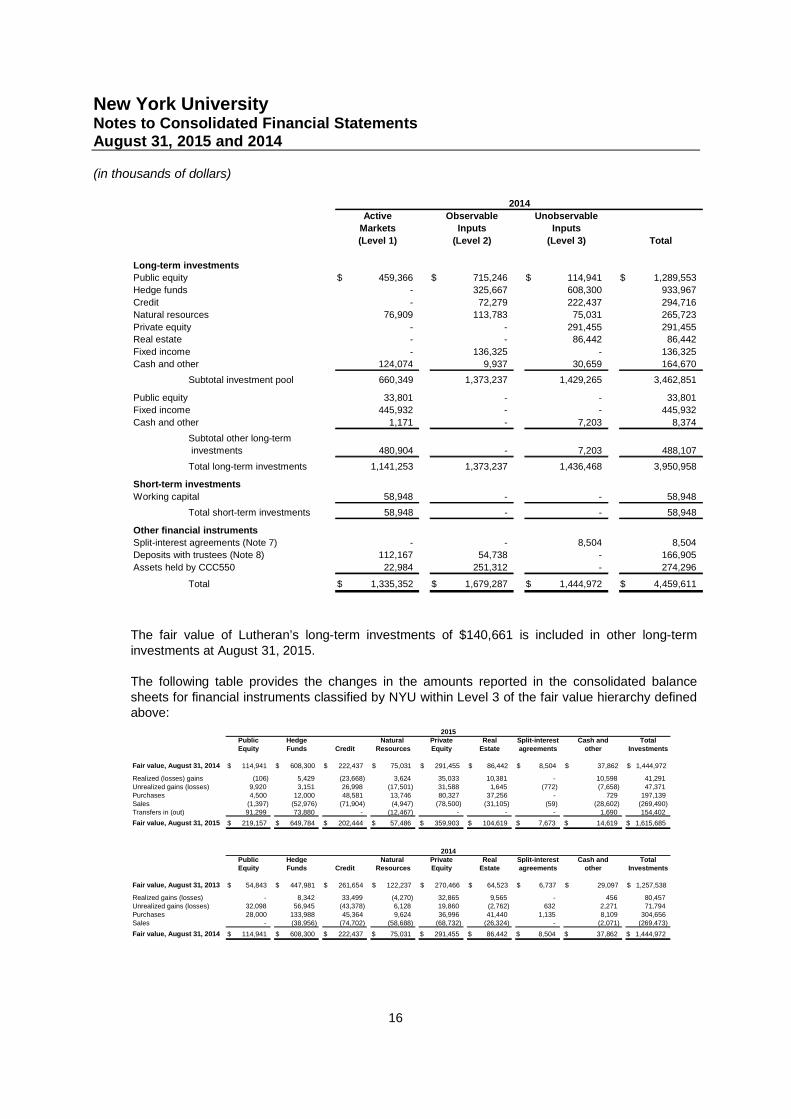
The fair value of Lutheran’s long-term investments of $140,661 is included in other long-terminvestments at August 31, 2015.
The following table provides the changes in the amounts reported in the consolidated balancesheets for financial instruments classified by NYU within Level 3 of the fair value hierarchy definedabove:
Public Hedge Natural Private Real Split-interest Cash and TotalEquity Funds Credit Resources Equity Estate agreements other Investments
Fair value, August 31, 2014 114,941$ 608,300$ 222,437$ 75,031$ 291,455$ 86,442$ 8,504$ 37,862$ 1,444,972$
Realized (losses) gains (106) 5,429 (23,668) 3,624 35,033 10,381 - 10,598 41,291Unrealized gains (losses) 9,920 3,151 26,998 (17,501) 31,588 1,645 (772) (7,658) 47,371Purchases 4,500 12,000 48,581 13,746 80,327 37,256 - 729 197,139Sales (1,397) (52,976) (71,904) (4,947) (78,500) (31,105) (59) (28,602) (269,490)Transfers in (out) 91,299 73,880 - (12,467) - - - 1,690 154,402
Fair value, August 31, 2015 219,157$ 649,784$ 202,444$ 57,486$ 359,903$ 104,619$ 7,673$ 14,619$ 1,615,685$
Public Hedge Natural Private Real Split-interest Cash and TotalEquity Funds Credit Resources Equity Estate agreements other Investments
Fair value, August 31, 2013 54,843$ 447,981$ 261,654$ 122,237$ 270,466$ 64,523$ 6,737$ 29,097$ 1,257,538$
Realized gains (losses) - 8,342 33,499 (4,270) 32,865 9,565 - 456 80,457Unrealized gains (losses) 32,098 56,945 (43,378) 6,128 19,860 (2,762) 632 2,271 71,794Purchases 28,000 133,988 45,364 9,624 36,996 41,440 1,135 8,109 304,656Sales - (38,956) (74,702) (58,688) (68,732) (26,324) - (2,071) (269,473)
Fair value, August 31, 2014 114,941$ 608,300$ 222,437$ 75,031$ 291,455$ 86,442$ 8,504$ 37,862$ 1,444,972$
2015
2014
New York UniversityNotes to Consolidated Financial StatementsAugust 31, 2015 and 2014
(in thousands of dollars)
17
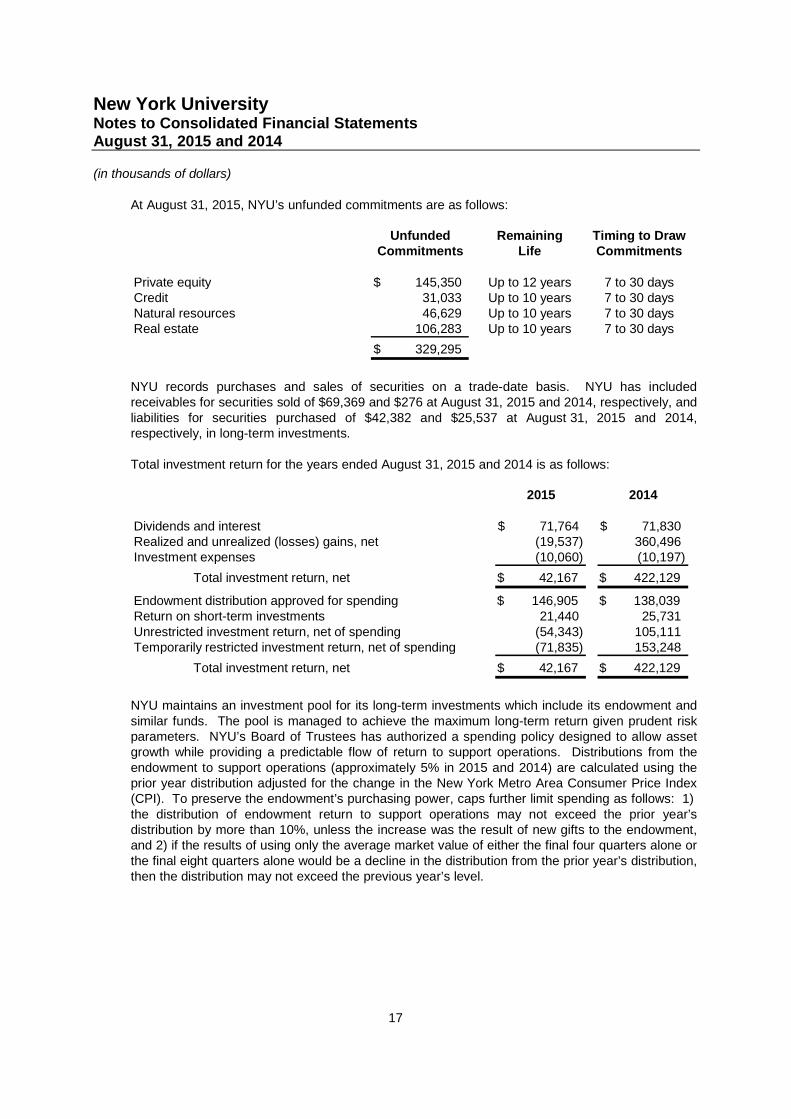
At August 31, 2015, NYU’s unfunded commitments are as follows:
Unfunded Remaining Timing to DrawCommitments Life Commitments
Private equity 145,350$ Up to 12 years 7 to 30 daysCredit 31,033 Up to 10 years 7 to 30 daysNatural resources 46,629 Up to 10 years 7 to 30 daysReal estate 106,283 Up to 10 years 7 to 30 days
329,295$
NYU records purchases and sales of securities on a trade-date basis. NYU has includedreceivables for securities sold of $69,369 and $276 at August 31, 2015 and 2014, respectively, andliabilities for securities purchased of $42,382 and $25,537 at August 31, 2015 and 2014,respectively, in long-term investments.
Total investment return for the years ended August 31, 2015 and 2014 is as follows:
2015 2014
Dividends and interest 71,764$ 71,830$Realized and unrealized (losses) gains, net (19,537) 360,496Investment expenses (10,060) (10,197)
Total investment return, net 42,167$ 422,129$
Endowment distribution approved for spending 146,905$ 138,039$Return on short-term investments 21,440 25,731Unrestricted investment return, net of spending (54,343) 105,111Temporarily restricted investment return, net of spending (71,835) 153,248
Total investment return, net 42,167$ 422,129$
NYU maintains an investment pool for its long-term investments which include its endowment andsimilar funds. The pool is managed to achieve the maximum long-term return given prudent riskparameters. NYU’s Board of Trustees has authorized a spending policy designed to allow assetgrowth while providing a predictable flow of return to support operations. Distributions from theendowment to support operations (approximately 5% in 2015 and 2014) are calculated using theprior year distribution adjusted for the change in the New York Metro Area Consumer Price Index(CPI). To preserve the endowment’s purchasing power, caps further limit spending as follows: 1)the distribution of endowment return to support operations may not exceed the prior year’sdistribution by more than 10%, unless the increase was the result of new gifts to the endowment,and 2) if the results of using only the average market value of either the final four quarters alone orthe final eight quarters alone would be a decline in the distribution from the prior year’s distribution,then the distribution may not exceed the previous year’s level.
New York UniversityNotes to Consolidated Financial StatementsAugust 31, 2015 and 2014
(in thousands of dollars)
18
NYU relies on a total return strategy, the objective of which is to achieve a long-term rate of returnconsisting of a combination of current income and capital appreciation, recognizing that changes inmarket conditions and interest rates will result in varying strategies in an attempt to optimizeresults. Investment return (realized and unrealized net gains or losses, interest and dividends) andthe appropriation for the approved endowment distribution for board-designated endowment fundsare reported as nonoperating activities in the consolidated statement of activities. Investmentreturn and the appropriation for the approved endowment distribution for true endowment funds arereported as temporarily restricted activities in the consolidated statement of activities.
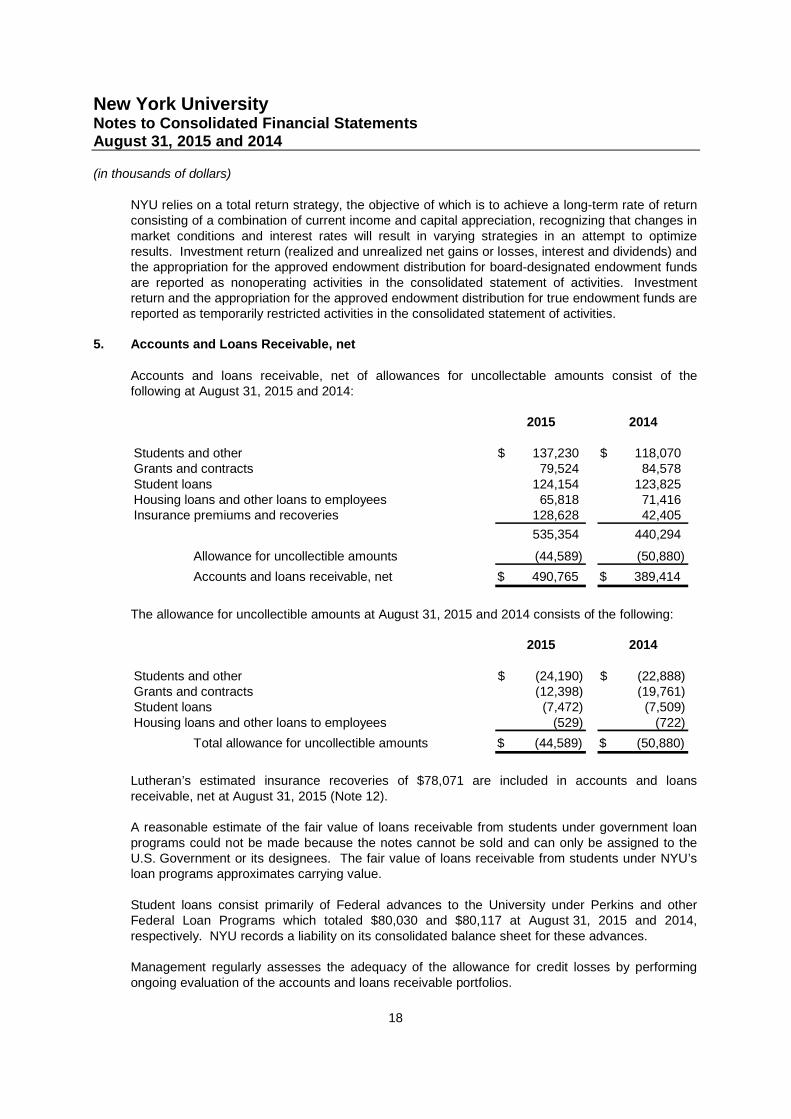
5. Accounts and Loans Receivable, net
Accounts and loans receivable, net of allowances for uncollectable amounts consist of thefollowing at August 31, 2015 and 2014:
2015 2014
Students and other 137,230$ 118,070$Grants and contracts 79,524 84,578Student loans 124,154 123,825Housing loans and other loans to employees 65,818 71,416Insurance premiums and recoveries 128,628 42,405
535,354 440,294
Allowance for uncollectible amounts (44,589) (50,880)
Accounts and loans receivable, net 490,765$ 389,414$
The allowance for uncollectible amounts at August 31, 2015 and 2014 consists of the following:
2015 2014
Students and other (24,190)$ (22,888)$Grants and contracts (12,398) (19,761)Student loans (7,472) (7,509)Housing loans and other loans to employees (529) (722)
Total allowance for uncollectible amounts (44,589)$ (50,880)$
Lutheran’s estimated insurance recoveries of $78,071 are included in accounts and loansreceivable, net at August 31, 2015 (Note 12).
A reasonable estimate of the fair value of loans receivable from students under government loanprograms could not be made because the notes cannot be sold and can only be assigned to theU.S. Government or its designees. The fair value of loans receivable from students under NYU’sloan programs approximates carrying value.
Student loans consist primarily of Federal advances to the University under Perkins and otherFederal Loan Programs which totaled $80,030 and $80,117 at August 31, 2015 and 2014,respectively. NYU records a liability on its consolidated balance sheet for these advances.
Management regularly assesses the adequacy of the allowance for credit losses by performingongoing evaluation of the accounts and loans receivable portfolios.
New York UniversityNotes to Consolidated Financial StatementsAugust 31, 2015 and 2014
(in thousands of dollars)
19
Housing loans and other loans to employees are secured by an interest in the underlying propertyor continued employment.
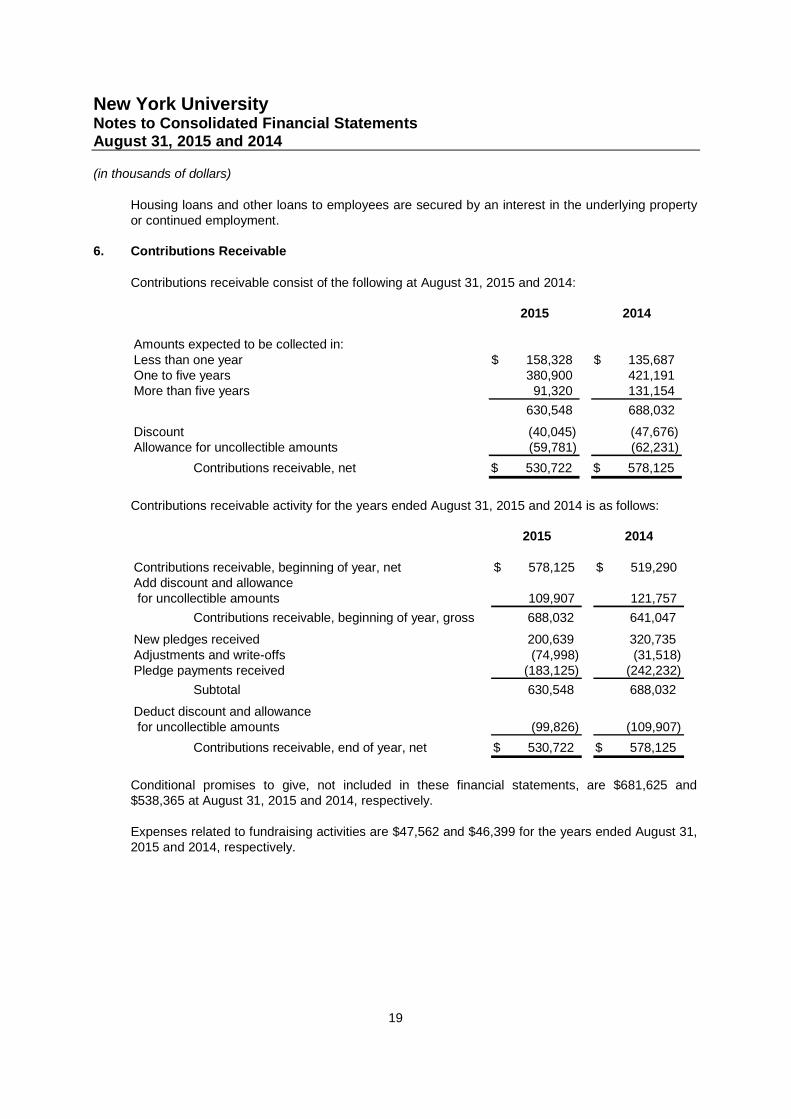
6. Contributions Receivable
Contributions receivable consist of the following at August 31, 2015 and 2014:
2015 2014
Amounts expected to be collected in:Less than one year 158,328$ 135,687$One to five years 380,900 421,191More than five years 91,320 131,154
630,548 688,032
Discount (40,045) (47,676)Allowance for uncollectible amounts (59,781) (62,231)
Contributions receivable, net 530,722$ 578,125$
Contributions receivable activity for the years ended August 31, 2015 and 2014 is as follows:
2015 2014
Contributions receivable, beginning of year, net 578,125$ 519,290$Add discount and allowancefor uncollectible amounts 109,907 121,757
Contributions receivable, beginning of year, gross 688,032 641,047
New pledges received 200,639 320,735Adjustments and write-offs (74,998) (31,518)Pledge payments received (183,125) (242,232)
Subtotal 630,548 688,032
Deduct discount and allowancefor uncollectible amounts (99,826) (109,907)
Contributions receivable, end of year, net 530,722$ 578,125$
Conditional promises to give, not included in these financial statements, are $681,625 and$538,365 at August 31, 2015 and 2014, respectively.
Expenses related to fundraising activities are $47,562 and $46,399 for the years ended August 31,2015 and 2014, respectively.
New York UniversityNotes to Consolidated Financial StatementsAugust 31, 2015 and 2014
(in thousands of dollars)
20
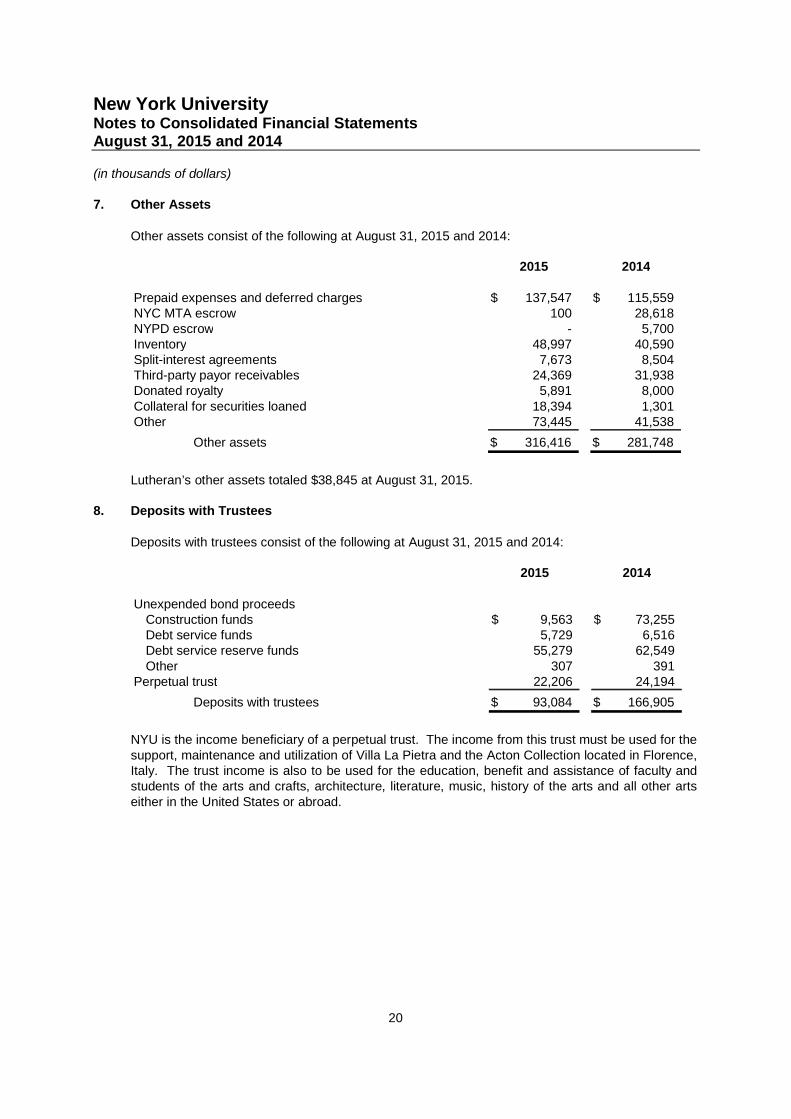
7. Other Assets
Other assets consist of the following at August 31, 2015 and 2014:
2015 2014
Prepaid expenses and deferred charges 137,547$ 115,559$NYC MTA escrow 100 28,618NYPD escrow - 5,700Inventory 48,997 40,590Split-interest agreements 7,673 8,504Third-party payor receivables 24,369 31,938Donated royalty 5,891 8,000Collateral for securities loaned 18,394 1,301Other 73,445 41,538
Other assets 316,416$ 281,748$
Lutheran’s other assets totaled $38,845 at August 31, 2015.
8. Deposits with Trustees
Deposits with trustees consist of the following at August 31, 2015 and 2014:
2015 2014
Unexpended bond proceedsConstruction funds 9,563$ 73,255$Debt service funds 5,729 6,516Debt service reserve funds 55,279 62,549Other 307 391
Perpetual trust 22,206 24,194
Deposits with trustees 93,084$ 166,905$
NYU is the income beneficiary of a perpetual trust. The income from this trust must be used for thesupport, maintenance and utilization of Villa La Pietra and the Acton Collection located in Florence,Italy. The trust income is also to be used for the education, benefit and assistance of faculty andstudents of the arts and crafts, architecture, literature, music, history of the arts and all other artseither in the United States or abroad.
New York UniversityNotes to Consolidated Financial StatementsAugust 31, 2015 and 2014
(in thousands of dollars)
21
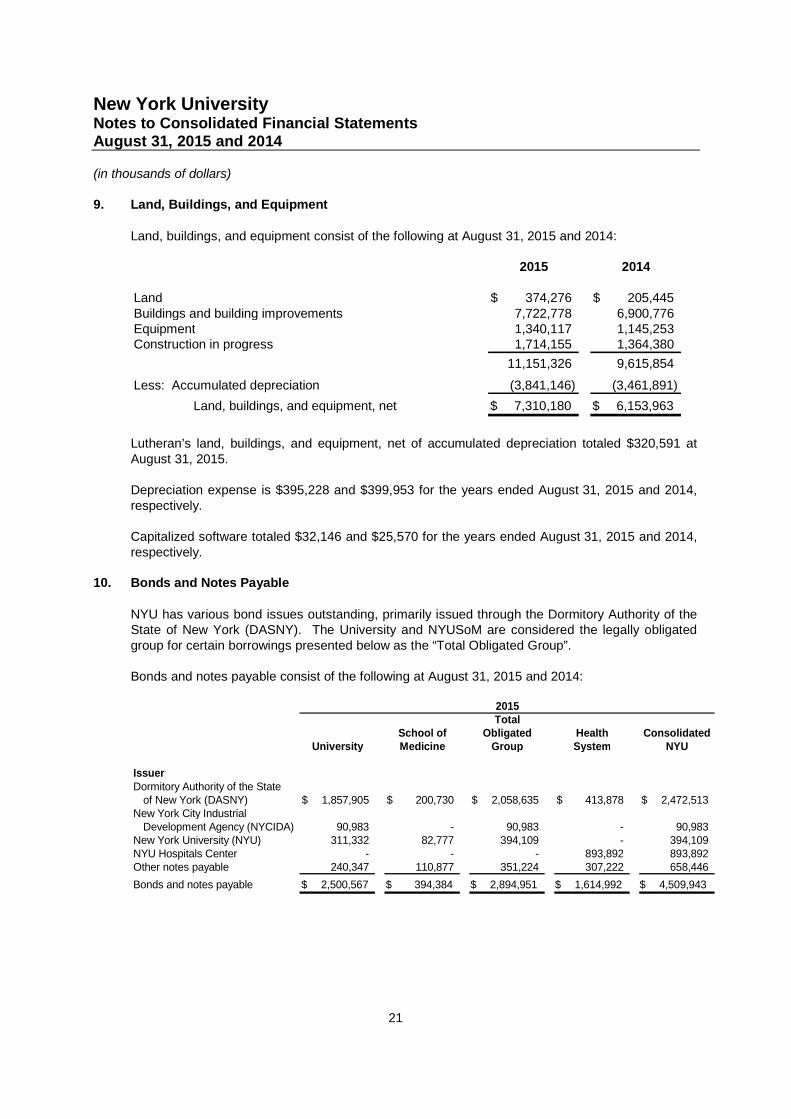
9. Land, Buildings, and Equipment
Land, buildings, and equipment consist of the following at August 31, 2015 and 2014:
2015 2014
Land 374,276$ 205,445$Buildings and building improvements 7,722,778 6,900,776Equipment 1,340,117 1,145,253Construction in progress 1,714,155 1,364,380
11,151,326 9,615,854
Less: Accumulated depreciation (3,841,146) (3,461,891)
Land, buildings, and equipment, net 7,310,180$ 6,153,963$
Lutheran’s land, buildings, and equipment, net of accumulated depreciation totaled $320,591 atAugust 31, 2015.
Depreciation expense is $395,228 and $399,953 for the years ended August 31, 2015 and 2014,respectively.
Capitalized software totaled $32,146 and $25,570 for the years ended August 31, 2015 and 2014,respectively.
10. Bonds and Notes Payable
NYU has various bond issues outstanding, primarily issued through the Dormitory Authority of theState of New York (DASNY). The University and NYUSoM are considered the legally obligatedgroup for certain borrowings presented below as the “Total Obligated Group”.
Bonds and notes payable consist of the following at August 31, 2015 and 2014:
TotalSchool of Obligated Health Consolidated
University Medicine Group System NYU
IssuerDormitory Authority of the State
of New York (DASNY) 1,857,905$ 200,730$ 2,058,635$ 413,878$ 2,472,513$New York City Industrial
Development Agency (NYCIDA) 90,983 - 90,983 - 90,983New York University (NYU) 311,332 82,777 394,109 - 394,109NYU Hospitals Center - - - 893,892 893,892Other notes payable 240,347 110,877 351,224 307,222 658,446
Bonds and notes payable 2,500,567$ 394,384$ 2,894,951$ 1,614,992$ 4,509,943$
2015

New York UniversityNotes to Consolidated Financial StatementsAugust 31, 2015 and 2014
(in thousands of dollars)
22
TotalSchool of Obligated Hospitals Consolidated
University Medicine Group Center NYU
IssuerDormitory Authority of the State
of New York (DASNY) 1,812,371$ 206,973$ 2,019,344$ 435,999$ 2,455,343$New York City Industrial
Development Agency (NYCIDA) 98,650 - 98,650 - 98,650New York University (NYU) 41,868 86,432 128,300 - 128,300NYU Hospitals Center - - - 597,647 597,647Other notes payable 149,109 57,187 206,296 403,916 610,212Deferred financing costs (25,103) (3,751) (28,854) (9,754) (38,608)
Bonds and notes payable 2,076,895$ 346,841$ 2,423,736$ 1,427,808$ 3,851,544$
2014
Lutheran’s notes payable totaled $92,788 at August 31, 2015.
In April 2015, DASNY issued $691,435 of revenue bonds (Series 2015A) on behalf of theObligated Group with interest rates ranging from 2.50% to 5%. The Series 2015A bonds matureserially from July 2016 through July 2035, as well as in July 2038, July 2041, July 2045 and July2048. The Series 2015A bonds maturing in 2038, 2041, 2045 and 2048 are payable in annualsinking fund installments from July 2036 to July 2048, respectively, to maturity.
In April 2015, the University issued Series 2015 taxable bonds totaling $272,285, with interestrates ranging from 0.57% to 4.14%. The Series 2015 bonds mature serially from July 2016through July 2028, as well as in July 2048. The Series 2015 bonds maturing in 2048 are payablein annual sinking fund installments from July 2029 to July 2048.
The proceeds from the Series 2015A and Series 2015 taxable bonds were used to advance refundthe Series 2007A, 2008A, 2008B, and 2008C bonds as well as to fund future renovations on theWashington Square and Brooklyn campuses. In connection with this transaction, the Universityrecorded a loss on bond defeasance of approximately $78,000.
In January 2015, DASNY issued $117,300 of revenue bonds (Series 2014 S2) on behalf of theHospitals Center with interest rates ranging from 3.75% to 4.95%. The Series 2014 S2 bondsmature serially from July 2015 through July 2035. The proceeds from Series 2014 S2 bonds wereused to advance refund the Hospitals Center’s outstanding indebtedness on the Series 2007Abonds. In connection with this transaction, the Hospitals Center recorded a loss on bonddefeasance of approximately $13,400.
In December 2014, DASNY issued $77,700 of revenue bonds (Hospitals Center Series 2014B) onbehalf of the Hospitals Center with interest rates ranging from 2.00% to 5.00%. The HospitalsCenter Series 2014B bonds mature serially from August 2015 through July 2036. The proceedsfrom the Hospitals Center Series 2014B bonds were used to advance refund the outstandingHospitals Center DASNY Series 2007B revenue bonds. In connection with this transaction, theHospitals Center recorded a loss on bond defeasance of approximately $13,700.
New York UniversityNotes to Consolidated Financial StatementsAugust 31, 2015 and 2014
(in thousands of dollars)
23
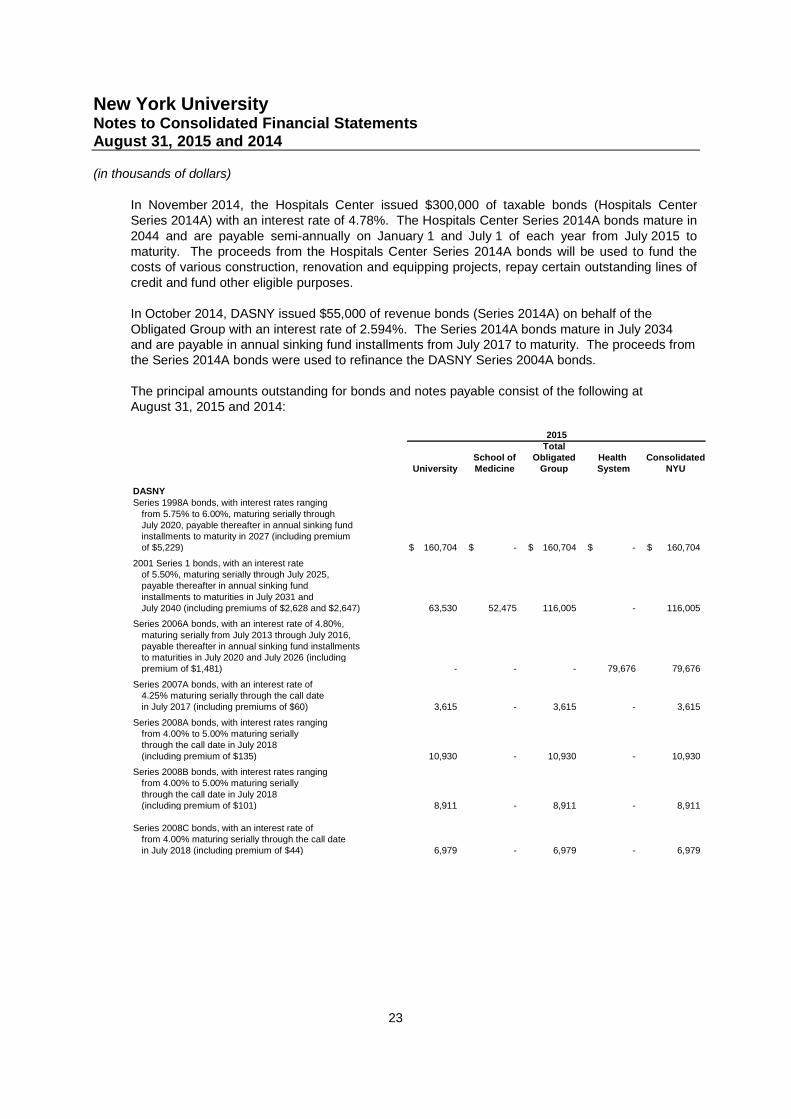
In November 2014, the Hospitals Center issued $300,000 of taxable bonds (Hospitals CenterSeries 2014A) with an interest rate of 4.78%. The Hospitals Center Series 2014A bonds mature in2044 and are payable semi-annually on January 1 and July 1 of each year from July 2015 tomaturity. The proceeds from the Hospitals Center Series 2014A bonds will be used to fund thecosts of various construction, renovation and equipping projects, repay certain outstanding lines ofcredit and fund other eligible purposes.
In October 2014, DASNY issued $55,000 of revenue bonds (Series 2014A) on behalf of theObligated Group with an interest rate of 2.594%. The Series 2014A bonds mature in July 2034and are payable in annual sinking fund installments from July 2017 to maturity. The proceeds fromthe Series 2014A bonds were used to refinance the DASNY Series 2004A bonds.
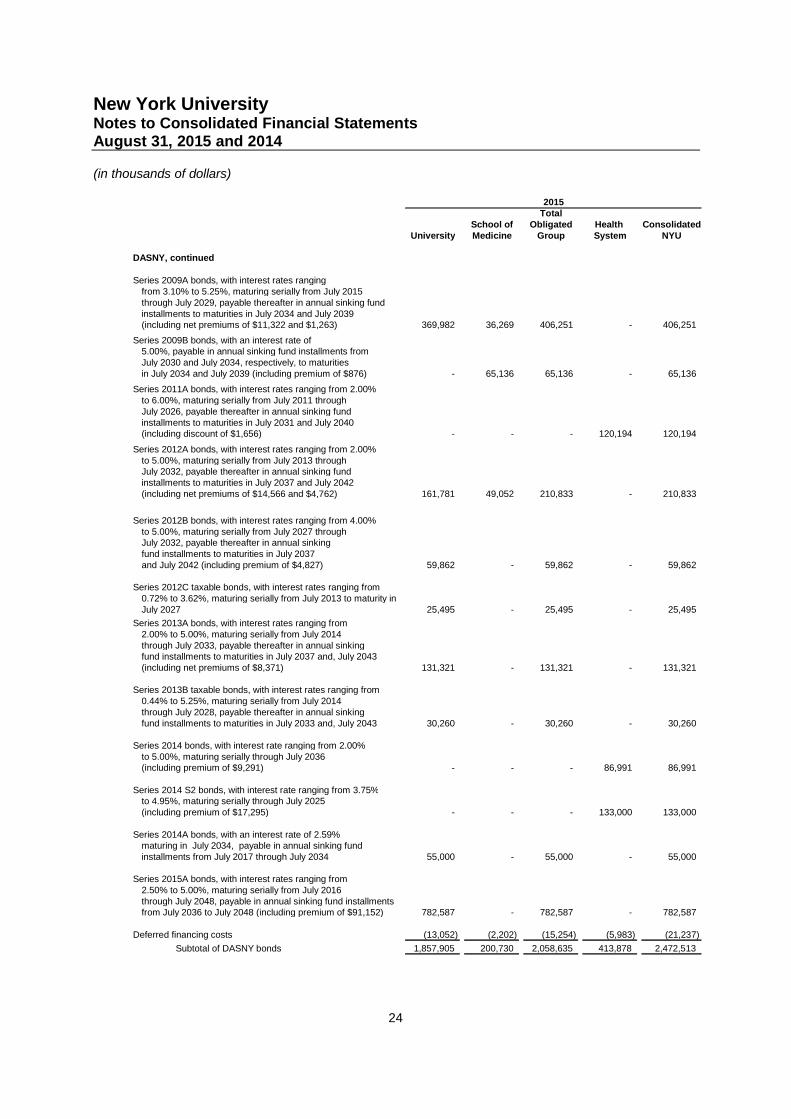
The principal amounts outstanding for bonds and notes payable consist of the following atAugust 31, 2015 and 2014:
TotalSchool of Obligated Health Consolidated
University Medicine Group System NYU
DASNYSeries 1998A bonds, with interest rates ranging
from 5.75% to 6.00%, maturing serially throughJuly 2020, payable thereafter in annual sinking fundinstallments to maturity in 2027 (including premiumof $5,229) 160,704$ -$ 160,704$ -$ 160,704$
2001 Series 1 bonds, with an interest rateof 5.50%, maturing serially through July 2025,payable thereafter in annual sinking fundinstallments to maturities in July 2031 andJuly 2040 (including premiums of $2,628 and $2,647) 63,530 52,475 116,005 - 116,005
Series 2006A bonds, with an interest rate of 4.80%,maturing serially from July 2013 through July 2016,payable thereafter in annual sinking fund installmentsto maturities in July 2020 and July 2026 (includingpremium of $1,481) - - - 79,676 79,676
Series 2007A bonds, with an interest rate of4.25% maturing serially through the call datein July 2017 (including premiums of $60) 3,615 - 3,615 - 3,615
Series 2008A bonds, with interest rates rangingfrom 4.00% to 5.00% maturing seriallythrough the call date in July 2018(including premium of $135) 10,930 - 10,930 - 10,930
Series 2008B bonds, with interest rates rangingfrom 4.00% to 5.00% maturing seriallythrough the call date in July 2018(including premium of $101) 8,911 - 8,911 - 8,911
Series 2008C bonds, with an interest rate offrom 4.00% maturing serially through the call datein July 2018 (including premium of $44) 6,979 - 6,979 - 6,979
2015
New York UniversityNotes to Consolidated Financial StatementsAugust 31, 2015 and 2014
(in thousands of dollars)
24
TotalSchool of Obligated Health Consolidated
University Medicine Group System NYU
DASNY, continued
Series 2009A bonds, with interest rates rangingfrom 3.10% to 5.25%, maturing serially from July 2015through July 2029, payable thereafter in annual sinking fundinstallments to maturities in July 2034 and July 2039(including net premiums of $11,322 and $1,263) 369,982 36,269 406,251 - 406,251
Series 2009B bonds, with an interest rate of5.00%, payable in annual sinking fund installments fromJuly 2030 and July 2034, respectively, to maturitiesin July 2034 and July 2039 (including premium of $876) - 65,136 65,136 - 65,136
Series 2011A bonds, with interest rates ranging from 2.00%to 6.00%, maturing serially from July 2011 throughJuly 2026, payable thereafter in annual sinking fundinstallments to maturities in July 2031 and July 2040(including discount of $1,656) - - - 120,194 120,194
Series 2012A bonds, with interest rates ranging from 2.00%to 5.00%, maturing serially from July 2013 throughJuly 2032, payable thereafter in annual sinking fundinstallments to maturities in July 2037 and July 2042(including net premiums of $14,566 and $4,762) 161,781 49,052 210,833 - 210,833
Series 2012B bonds, with interest rates ranging from 4.00%to 5.00%, maturing serially from July 2027 throughJuly 2032, payable thereafter in annual sinkingfund installments to maturities in July 2037and July 2042 (including premium of $4,827) 59,862 - 59,862 - 59,862
Series 2012C taxable bonds, with interest rates ranging from0.72% to 3.62%, maturing serially from July 2013 to maturity inJuly 2027 25,495 - 25,495 - 25,495
Series 2013A bonds, with interest rates ranging from2.00% to 5.00%, maturing serially from July 2014through July 2033, payable thereafter in annual sinkingfund installments to maturities in July 2037 and, July 2043(including net premiums of $8,371) 131,321 - 131,321 - 131,321
Series 2013B taxable bonds, with interest rates ranging from0.44% to 5.25%, maturing serially from July 2014through July 2028, payable thereafter in annual sinkingfund installments to maturities in July 2033 and, July 2043 30,260 - 30,260 - 30,260
Series 2014 bonds, with interest rate ranging from 2.00%to 5.00%, maturing serially through July 2036(including premium of $9,291) - - - 86,991 86,991
Series 2014 S2 bonds, with interest rate ranging from 3.75%to 4.95%, maturing serially through July 2025(including premium of $17,295) - - - 133,000 133,000
Series 2014A bonds, with an interest rate of 2.59%maturing in July 2034, payable in annual sinking fundinstallments from July 2017 through July 2034 55,000 - 55,000 - 55,000
Series 2015A bonds, with interest rates ranging from2.50% to 5.00%, maturing serially from July 2016through July 2048, payable in annual sinking fund installmentsfrom July 2036 to July 2048 (including premium of $91,152) 782,587 - 782,587 - 782,587
Deferred financing costs (13,052) (2,202) (15,254) (5,983) (21,237)
Subtotal of DASNY bonds 1,857,905 200,730 2,058,635 413,878 2,472,513
2015
New York UniversityNotes to Consolidated Financial StatementsAugust 31, 2015 and 2014
(in thousands of dollars)
25
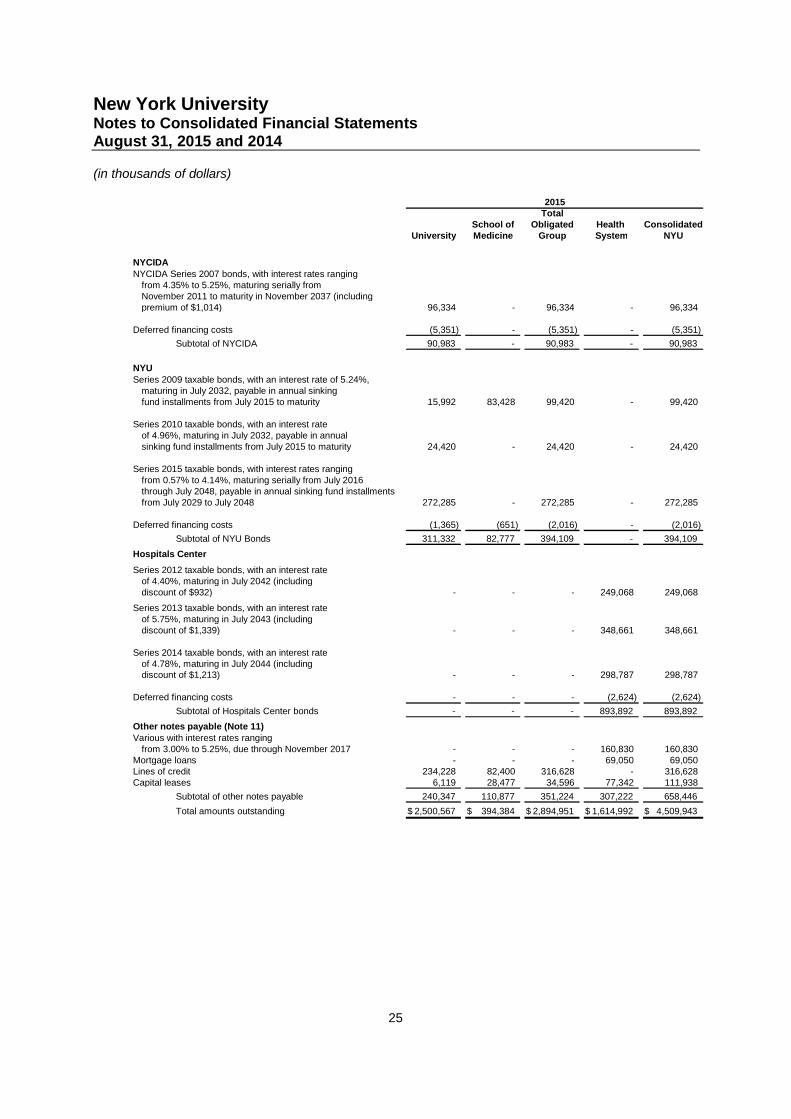
TotalSchool of Obligated Health Consolidated
University Medicine Group System NYU
NYCIDANYCIDA Series 2007 bonds, with interest rates ranging
from 4.35% to 5.25%, maturing serially fromNovember 2011 to maturity in November 2037 (includingpremium of $1,014) 96,334 - 96,334 - 96,334
Deferred financing costs (5,351) - (5,351) - (5,351)
Subtotal of NYCIDA 90,983 - 90,983 - 90,983
NYUSeries 2009 taxable bonds, with an interest rate of 5.24%,
maturing in July 2032, payable in annual sinkingfund installments from July 2015 to maturity 15,992 83,428 99,420 - 99,420
Series 2010 taxable bonds, with an interest rateof 4.96%, maturing in July 2032, payable in annualsinking fund installments from July 2015 to maturity 24,420 - 24,420 - 24,420
Series 2015 taxable bonds, with interest rates rangingfrom 0.57% to 4.14%, maturing serially from July 2016through July 2048, payable in annual sinking fund installmentsfrom July 2029 to July 2048 272,285 - 272,285 - 272,285
Deferred financing costs (1,365) (651) (2,016) - (2,016)
Subtotal of NYU Bonds 311,332 82,777 394,109 - 394,109
Hospitals Center
Series 2012 taxable bonds, with an interest rateof 4.40%, maturing in July 2042 (includingdiscount of $932) - - - 249,068 249,068
Series 2013 taxable bonds, with an interest rateof 5.75%, maturing in July 2043 (includingdiscount of $1,339) - - - 348,661 348,661
Series 2014 taxable bonds, with an interest rateof 4.78%, maturing in July 2044 (includingdiscount of $1,213) - - - 298,787 298,787
Deferred financing costs - - - (2,624) (2,624)
Subtotal of Hospitals Center bonds - - - 893,892 893,892
Other notes payable (Note 11)Various with interest rates ranging
from 3.00% to 5.25%, due through November 2017 - - - 160,830 160,830Mortgage loans - - - 69,050 69,050Lines of credit 234,228 82,400 316,628 - 316,628Capital leases 6,119 28,477 34,596 77,342 111,938
Subtotal of other notes payable 240,347 110,877 351,224 307,222 658,446
Total amounts outstanding 2,500,567$ 394,384$ 2,894,951$ 1,614,992$ 4,509,943$
2015
New York UniversityNotes to Consolidated Financial StatementsAugust 31, 2015 and 2014
(in thousands of dollars)
26
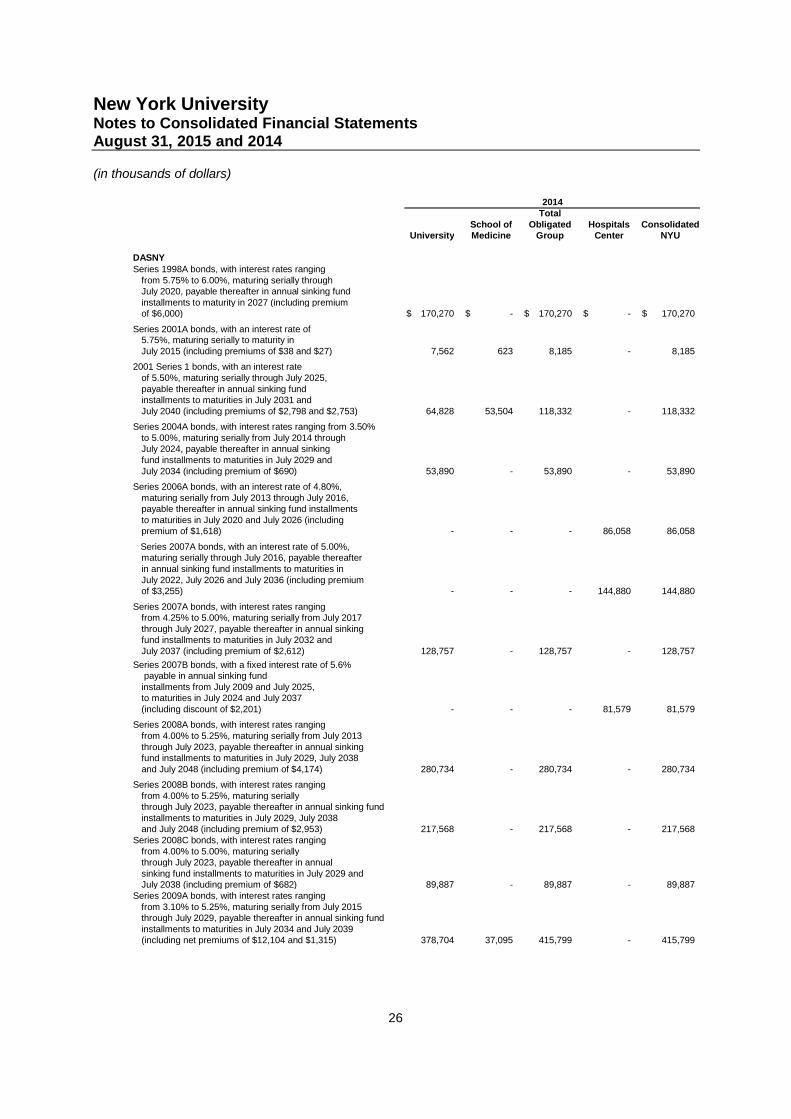
TotalSchool of Obligated Hospitals Consolidated
University Medicine Group Center NYU
DASNYSeries 1998A bonds, with interest rates ranging
from 5.75% to 6.00%, maturing serially throughJuly 2020, payable thereafter in annual sinking fundinstallments to maturity in 2027 (including premiumof $6,000) 170,270$ -$ 170,270$ -$ 170,270$
Series 2001A bonds, with an interest rate of5.75%, maturing serially to maturity inJuly 2015 (including premiums of $38 and $27) 7,562 623 8,185 - 8,185
2001 Series 1 bonds, with an interest rateof 5.50%, maturing serially through July 2025,payable thereafter in annual sinking fundinstallments to maturities in July 2031 andJuly 2040 (including premiums of $2,798 and $2,753) 64,828 53,504 118,332 - 118,332
Series 2004A bonds, with interest rates ranging from 3.50%to 5.00%, maturing serially from July 2014 throughJuly 2024, payable thereafter in annual sinkingfund installments to maturities in July 2029 andJuly 2034 (including premium of $690) 53,890 - 53,890 - 53,890
Series 2006A bonds, with an interest rate of 4.80%,maturing serially from July 2013 through July 2016,payable thereafter in annual sinking fund installmentsto maturities in July 2020 and July 2026 (includingpremium of $1,618) - - - 86,058 86,058
Series 2007A bonds, with an interest rate of 5.00%,maturing serially through July 2016, payable thereafterin annual sinking fund installments to maturities inJuly 2022, July 2026 and July 2036 (including premiumof $3,255) - - - 144,880 144,880
Series 2007A bonds, with interest rates rangingfrom 4.25% to 5.00%, maturing serially from July 2017through July 2027, payable thereafter in annual sinkingfund installments to maturities in July 2032 andJuly 2037 (including premium of $2,612) 128,757 - 128,757 - 128,757
Series 2007B bonds, with a fixed interest rate of 5.6%payable in annual sinking fundinstallments from July 2009 and July 2025,to maturities in July 2024 and July 2037(including discount of $2,201) - - - 81,579 81,579
Series 2008A bonds, with interest rates rangingfrom 4.00% to 5.25%, maturing serially from July 2013through July 2023, payable thereafter in annual sinkingfund installments to maturities in July 2029, July 2038and July 2048 (including premium of $4,174) 280,734 - 280,734 - 280,734
Series 2008B bonds, with interest rates rangingfrom 4.00% to 5.25%, maturing seriallythrough July 2023, payable thereafter in annual sinking fundinstallments to maturities in July 2029, July 2038and July 2048 (including premium of $2,953) 217,568 - 217,568 - 217,568
Series 2008C bonds, with interest rates rangingfrom 4.00% to 5.00%, maturing seriallythrough July 2023, payable thereafter in annualsinking fund installments to maturities in July 2029 andJuly 2038 (including premium of $682) 89,887 - 89,887 - 89,887
Series 2009A bonds, with interest rates rangingfrom 3.10% to 5.25%, maturing serially from July 2015through July 2029, payable thereafter in annual sinking fundinstallments to maturities in July 2034 and July 2039(including net premiums of $12,104 and $1,315) 378,704 37,095 415,799 - 415,799
2014
New York UniversityNotes to Consolidated Financial StatementsAugust 31, 2015 and 2014
(in thousands of dollars)
27
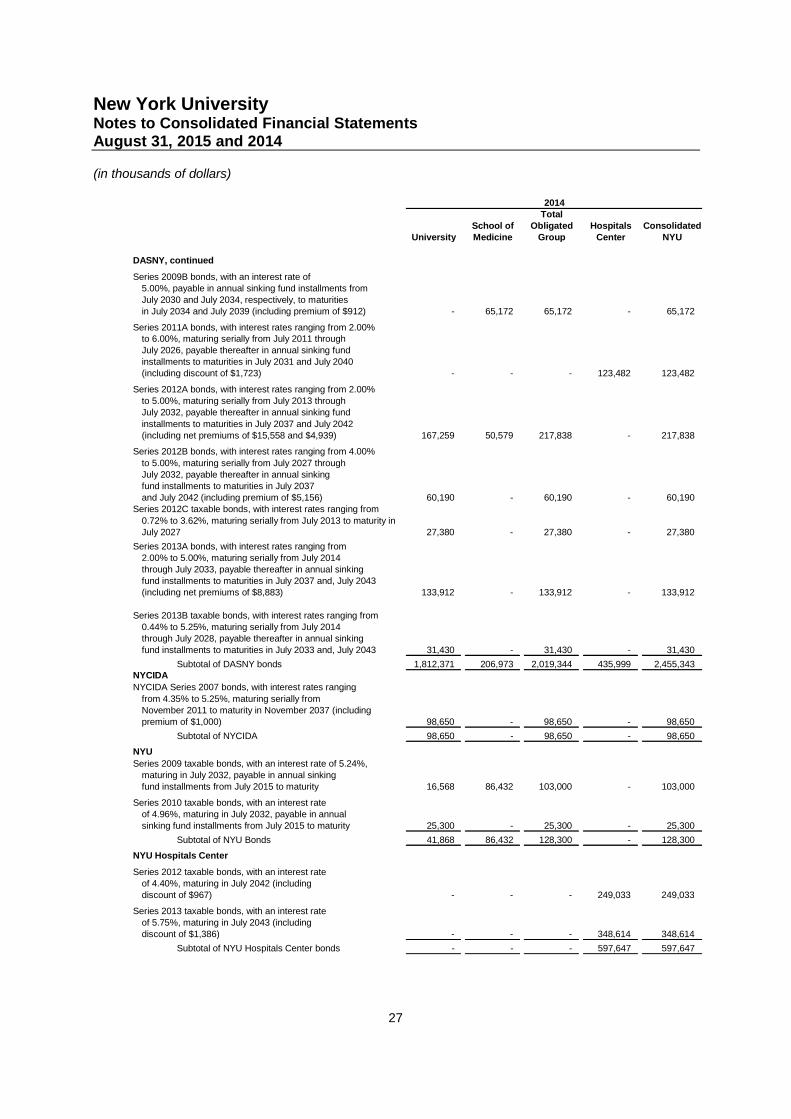
TotalSchool of Obligated Hospitals Consolidated
University Medicine Group Center NYU
DASNY, continued
Series 2009B bonds, with an interest rate of5.00%, payable in annual sinking fund installments fromJuly 2030 and July 2034, respectively, to maturitiesin July 2034 and July 2039 (including premium of $912) - 65,172 65,172 - 65,172
Series 2011A bonds, with interest rates ranging from 2.00%to 6.00%, maturing serially from July 2011 throughJuly 2026, payable thereafter in annual sinking fundinstallments to maturities in July 2031 and July 2040(including discount of $1,723) - - - 123,482 123,482
Series 2012A bonds, with interest rates ranging from 2.00%to 5.00%, maturing serially from July 2013 throughJuly 2032, payable thereafter in annual sinking fund
installments to maturities in July 2037 and July 2042(including net premiums of $15,558 and $4,939) 167,259 50,579 217,838 - 217,838
Series 2012B bonds, with interest rates ranging from 4.00%
to 5.00%, maturing serially from July 2027 throughJuly 2032, payable thereafter in annual sinkingfund installments to maturities in July 2037and July 2042 (including premium of $5,156) 60,190 - 60,190 - 60,190
Series 2012C taxable bonds, with interest rates ranging from
0.72% to 3.62%, maturing serially from July 2013 to maturity inJuly 2027 27,380 - 27,380 - 27,380
Series 2013A bonds, with interest rates ranging from2.00% to 5.00%, maturing serially from July 2014through July 2033, payable thereafter in annual sinkingfund installments to maturities in July 2037 and, July 2043(including net premiums of $8,883) 133,912 - 133,912 - 133,912
Series 2013B taxable bonds, with interest rates ranging from0.44% to 5.25%, maturing serially from July 2014through July 2028, payable thereafter in annual sinkingfund installments to maturities in July 2033 and, July 2043 31,430 - 31,430 - 31,430
Subtotal of DASNY bonds 1,812,371 206,973 2,019,344 435,999 2,455,343NYCIDA
NYCIDA Series 2007 bonds, with interest rates ranging
from 4.35% to 5.25%, maturing serially fromNovember 2011 to maturity in November 2037 (includingpremium of $1,000) 98,650 - 98,650 - 98,650
Subtotal of NYCIDA 98,650 - 98,650 - 98,650
NYU
Series 2009 taxable bonds, with an interest rate of 5.24%,maturing in July 2032, payable in annual sinkingfund installments from July 2015 to maturity 16,568 86,432 103,000 - 103,000
Series 2010 taxable bonds, with an interest rateof 4.96%, maturing in July 2032, payable in annualsinking fund installments from July 2015 to maturity 25,300 - 25,300 - 25,300
Subtotal of NYU Bonds 41,868 86,432 128,300 - 128,300
NYU Hospitals Center
Series 2012 taxable bonds, with an interest rateof 4.40%, maturing in July 2042 (includingdiscount of $967) - - - 249,033 249,033
Series 2013 taxable bonds, with an interest rateof 5.75%, maturing in July 2043 (includingdiscount of $1,386) - - - 348,614 348,614
Subtotal of NYU Hospitals Center bonds - - - 597,647 597,647
2014
New York UniversityNotes to Consolidated Financial StatementsAugust 31, 2015 and 2014
(in thousands of dollars)
28
TotalSchool of Obligated Hospitals Consolidated
University Medicine Group Center NYU
Other notes payable (Note 11)Various with interest rates ranging
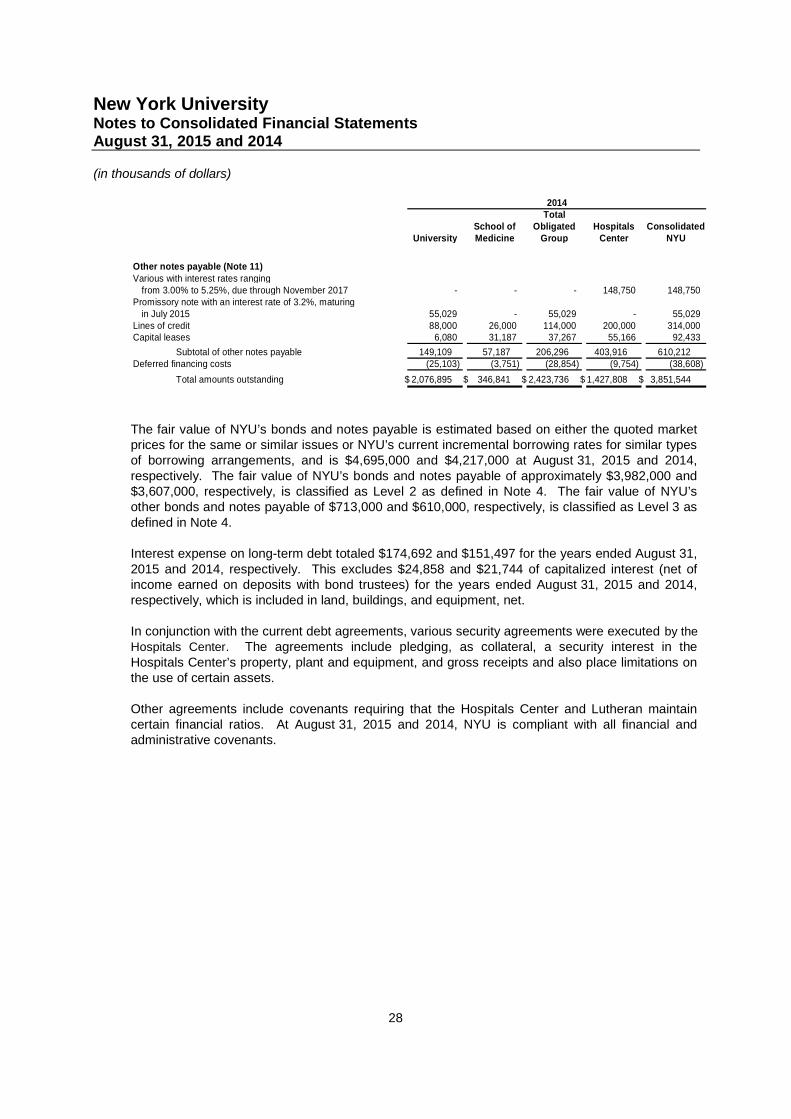
from 3.00% to 5.25%, due through November 2017 - - - 148,750 148,750Promissory note with an interest rate of 3.2%, maturing
in July 2015 55,029 - 55,029 - 55,029Lines of credit 88,000 26,000 114,000 200,000 314,000Capital leases 6,080 31,187 37,267 55,166 92,433
Subtotal of other notes payable 149,109 57,187 206,296 403,916 610,212Deferred financing costs (25,103) (3,751) (28,854) (9,754) (38,608)
Total amounts outstanding 2,076,895$ 346,841$ 2,423,736$ 1,427,808$ 3,851,544$
2014
The fair value of NYU’s bonds and notes payable is estimated based on either the quoted marketprices for the same or similar issues or NYU’s current incremental borrowing rates for similar typesof borrowing arrangements, and is $4,695,000 and $4,217,000 at August 31, 2015 and 2014,respectively. The fair value of NYU’s bonds and notes payable of approximately $3,982,000 and$3,607,000, respectively, is classified as Level 2 as defined in Note 4. The fair value of NYU’sother bonds and notes payable of $713,000 and $610,000, respectively, is classified as Level 3 asdefined in Note 4.
Interest expense on long-term debt totaled $174,692 and $151,497 for the years ended August 31,2015 and 2014, respectively. This excludes $24,858 and $21,744 of capitalized interest (net ofincome earned on deposits with bond trustees) for the years ended August 31, 2015 and 2014,respectively, which is included in land, buildings, and equipment, net.
In conjunction with the current debt agreements, various security agreements were executed by the
Hospitals Center. The agreements include pledging, as collateral, a security interest in theHospitals Center’s property, plant and equipment, and gross receipts and also place limitations onthe use of certain assets.
Other agreements include covenants requiring that the Hospitals Center and Lutheran maintaincertain financial ratios. At August 31, 2015 and 2014, NYU is compliant with all financial andadministrative covenants.
New York UniversityNotes to Consolidated Financial StatementsAugust 31, 2015 and 2014
(in thousands of dollars)
29
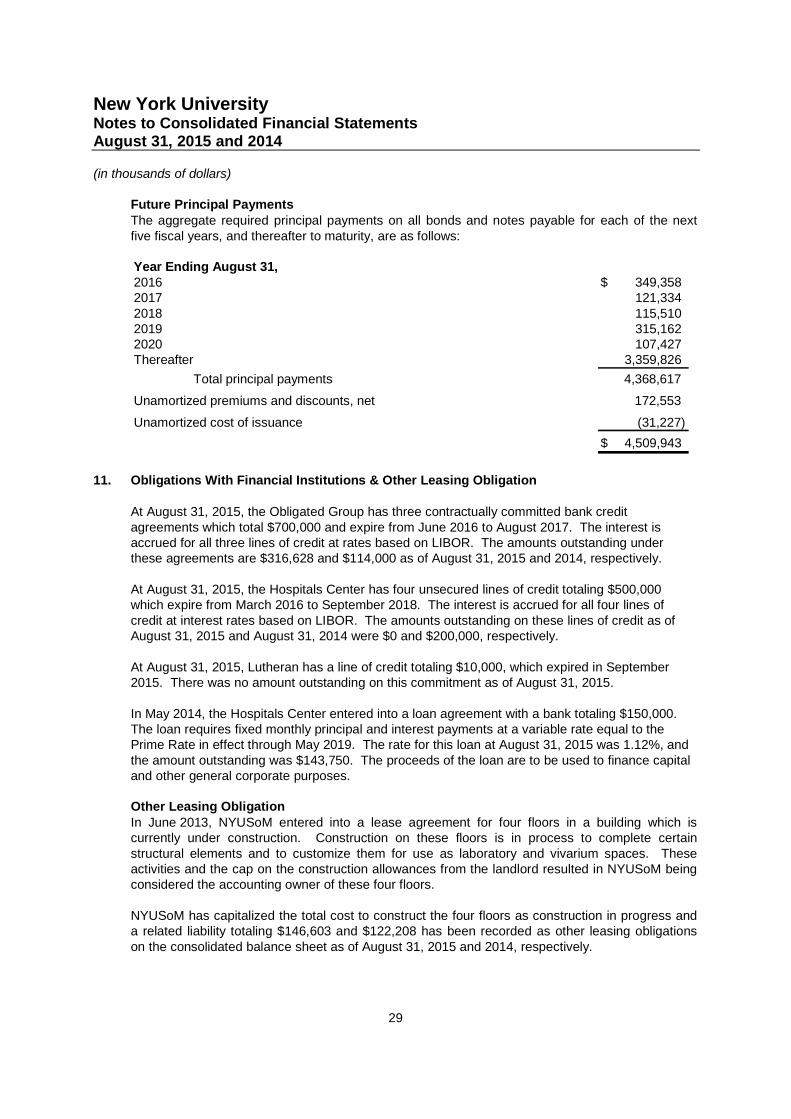
Future Principal PaymentsThe aggregate required principal payments on all bonds and notes payable for each of the nextfive fiscal years, and thereafter to maturity, are as follows:
Year Ending August 31,2016 349,358$2017 121,3342018 115,5102019 315,1622020 107,427Thereafter 3,359,826
Total principal payments 4,368,617
Unamortized premiums and discounts, net 172,553
Unamortized cost of issuance (31,227)
4,509,943$
11. Obligations With Financial Institutions & Other Leasing Obligation
At August 31, 2015, the Obligated Group has three contractually committed bank creditagreements which total $700,000 and expire from June 2016 to August 2017. The interest isaccrued for all three lines of credit at rates based on LIBOR. The amounts outstanding underthese agreements are $316,628 and $114,000 as of August 31, 2015 and 2014, respectively.
At August 31, 2015, the Hospitals Center has four unsecured lines of credit totaling $500,000which expire from March 2016 to September 2018. The interest is accrued for all four lines ofcredit at interest rates based on LIBOR. The amounts outstanding on these lines of credit as ofAugust 31, 2015 and August 31, 2014 were $0 and $200,000, respectively.
At August 31, 2015, Lutheran has a line of credit totaling $10,000, which expired in September2015. There was no amount outstanding on this commitment as of August 31, 2015.
In May 2014, the Hospitals Center entered into a loan agreement with a bank totaling $150,000.The loan requires fixed monthly principal and interest payments at a variable rate equal to thePrime Rate in effect through May 2019. The rate for this loan at August 31, 2015 was 1.12%, andthe amount outstanding was $143,750. The proceeds of the loan are to be used to finance capitaland other general corporate purposes.
Other Leasing ObligationIn June 2013, NYUSoM entered into a lease agreement for four floors in a building which iscurrently under construction. Construction on these floors is in process to complete certainstructural elements and to customize them for use as laboratory and vivarium spaces. Theseactivities and the cap on the construction allowances from the landlord resulted in NYUSoM beingconsidered the accounting owner of these four floors.
NYUSoM has capitalized the total cost to construct the four floors as construction in progress anda related liability totaling $146,603 and $122,208 has been recorded as other leasing obligationson the consolidated balance sheet as of August 31, 2015 and 2014, respectively.
New York UniversityNotes to Consolidated Financial StatementsAugust 31, 2015 and 2014
(in thousands of dollars)
30
12. Professional Liabilities
As described in Note 1, the Hospitals Center is self-insured for professional liability, primarilythrough a wholly-owned segregated cell captive company, CCC550. Prior coverage forprofessional and general liability risks was provided through a multi-provider pooled insuranceprogram that included commercial coverage and a captive insurance program.
CCC550 has investment assets of $320,426 and $274,296 at August 31, 2015 and 2014,respectively, to fund related obligations. CCC550 has total obligations for insurance exposure of$278,452 and $233,239 as of August 31, 2015 and 2014, respectively. Also, within accountspayable and accrued expenses, the Hospitals Center has recorded obligations related to themulti-provider pooled program and excess self-insured exposures not covered by CCC550.
CCC550 also provides insurance coverage to certain voluntary attending physicians servicingNYUSoM and the Hospitals Center. The cost of this insurance coverage is the responsibility ofsuch physicians.
Lutheran purchases primary and excess professional liability coverage on a claims-made basisand general liability coverage on an occurrence basis from a commercial insurer. At August 31,2015, Lutheran’s estimated liability for reported claims and claims incurred but not reported totaled$95,810. This liability is reported on a discounted basis, using a discount rate of 3.0%. Estimatedinsurance recoveries of $78,071 as of August 31, 2015 are included in accounts and loansreceivable, net in the consolidated balance sheet (Note 5).
The professional liabilities of the Hospitals Center and Lutheran comprise estimates for knownreported losses and loss expenses, plus a provision for losses incurred but not reported. Lossesare valued by an independent actuary and are based on the loss experience of the insured. Inmanagement’s opinion, recorded reserves for self-insured exposures are adequate to cover theultimate net cost of losses incurred to date; however, the provision is based on estimates and mayultimately be settled for a significantly greater or lesser amount.
13. Retirement Plans
Substantially all NYU employees are covered by retirement plans. These plans include variousdefined contribution plans, multi-employer defined benefit plans and four NYU-sponsored definedbenefit plans. NYU contributes to its defined contribution and multi-employer defined benefit plansbased on rates required by union or other contractual arrangements. Expenses related to NYU’sdefined contribution plans are $155,500 and $145,380 in 2015 and 2014, respectively.
Contributions to defined benefit plans are intended to provide not only for benefits attributed toservice to date, but also for those expected to be earned in the future. Contributions to the fourdefined benefit plans are made in amounts sufficient to meet the minimum funding requirementsset forth in the Employee Retirement Income Security Act of 1974, plus such additional amounts asthe sponsors may deem appropriate. Pension benefits under these four plans are based onparticipants’ final average compensation levels and years of service.
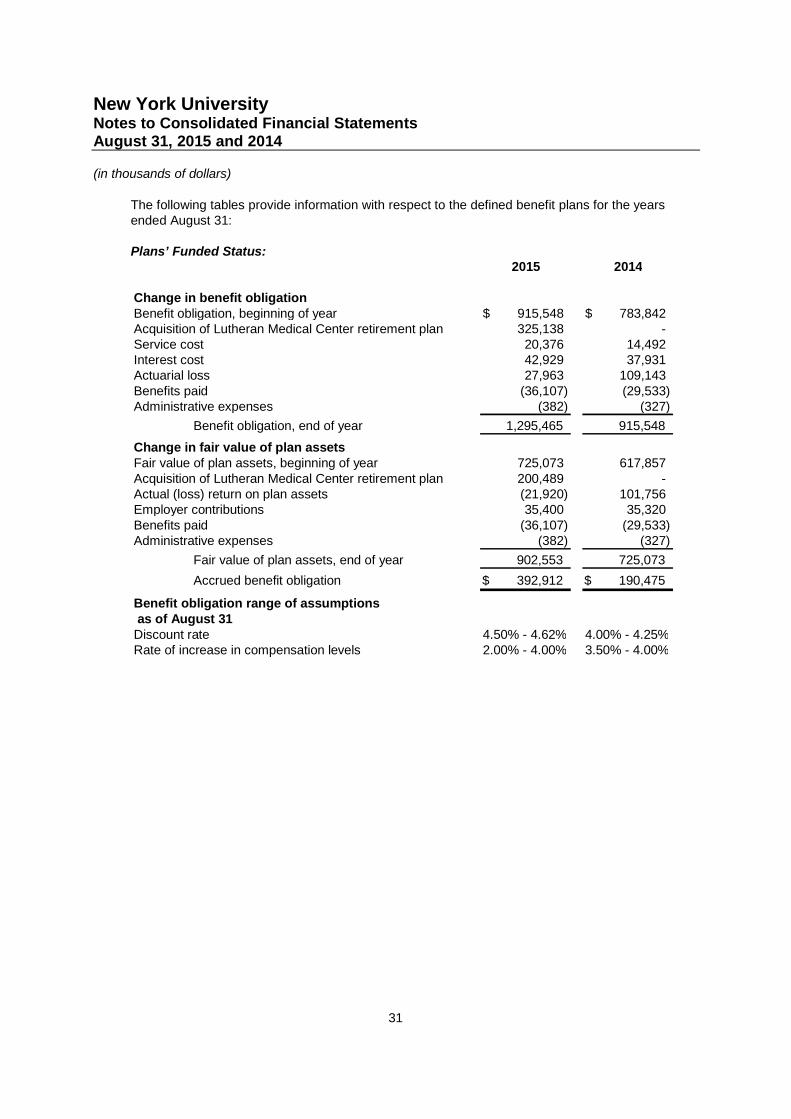
New York UniversityNotes to Consolidated Financial StatementsAugust 31, 2015 and 2014
(in thousands of dollars)
31
The following tables provide information with respect to the defined benefit plans for the yearsended August 31:
Plans’ Funded Status:2015 2014
Change in benefit obligationBenefit obligation, beginning of year 915,548$ 783,842$Acquisition of Lutheran Medical Center retirement plan 325,138 -Service cost 20,376 14,492Interest cost 42,929 37,931Actuarial loss 27,963 109,143Benefits paid (36,107) (29,533)Administrative expenses (382) (327)
Benefit obligation, end of year 1,295,465 915,548
Change in fair value of plan assetsFair value of plan assets, beginning of year 725,073 617,857Acquisition of Lutheran Medical Center retirement plan 200,489 -Actual (loss) return on plan assets (21,920) 101,756Employer contributions 35,400 35,320Benefits paid (36,107) (29,533)Administrative expenses (382) (327)
Fair value of plan assets, end of year 902,553 725,073
Accrued benefit obligation 392,912$ 190,475$
Benefit obligation range of assumptionsas of August 31
Discount rate 4.50% - 4.62% 4.00% - 4.25%Rate of increase in compensation levels 2.00% - 4.00% 3.50% - 4.00%
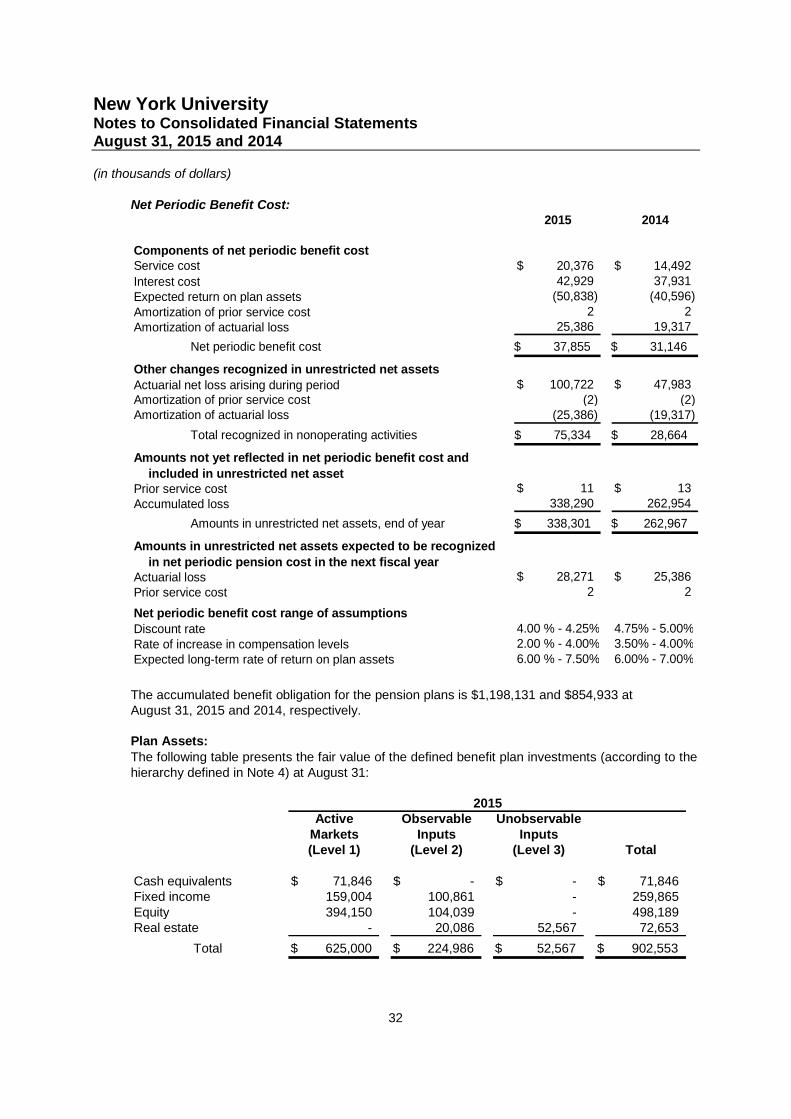
New York UniversityNotes to Consolidated Financial StatementsAugust 31, 2015 and 2014
(in thousands of dollars)
32
Net Periodic Benefit Cost:2015 2014
Components of net periodic benefit costService cost 20,376$ 14,492$
Interest cost 42,929 37,931
Expected return on plan assets (50,838) (40,596)
Amortization of prior service cost 2 2
Amortization of actuarial loss 25,386 19,317
Net periodic benefit cost 37,855$ 31,146$
Other changes recognized in unrestricted net assets
Actuarial net loss arising during period 100,722$ 47,983$Amortization of prior service cost (2) (2)Amortization of actuarial loss (25,386) (19,317)
Total recognized in nonoperating activities 75,334$ 28,664$
Amounts not yet reflected in net periodic benefit cost and
included in unrestricted net assetPrior service cost 11$ 13$
Accumulated loss 338,290 262,954
Amounts in unrestricted net assets, end of year 338,301$ 262,967$
Amounts in unrestricted net assets expected to be recognized
in net periodic pension cost in the next fiscal yearActuarial loss 28,271$ 25,386$
Prior service cost 2 2
Net periodic benefit cost range of assumptions
Discount rate 4.00 % - 4.25% 4.75% - 5.00%
Rate of increase in compensation levels 2.00 % - 4.00% 3.50% - 4.00%
Expected long-term rate of return on plan assets 6.00 % - 7.50% 6.00% - 7.00%
The accumulated benefit obligation for the pension plans is $1,198,131 and $854,933 atAugust 31, 2015 and 2014, respectively.
Plan Assets:The following table presents the fair value of the defined benefit plan investments (according to thehierarchy defined in Note 4) at August 31:
Active Observable UnobservableMarkets Inputs Inputs(Level 1) (Level 2) (Level 3) Total
Cash equivalents 71,846$ -$ -$ 71,846$Fixed income 159,004 100,861 - 259,865Equity 394,150 104,039 - 498,189Real estate - 20,086 52,567 72,653
Total 625,000$ 224,986$ 52,567$ 902,553$
2015
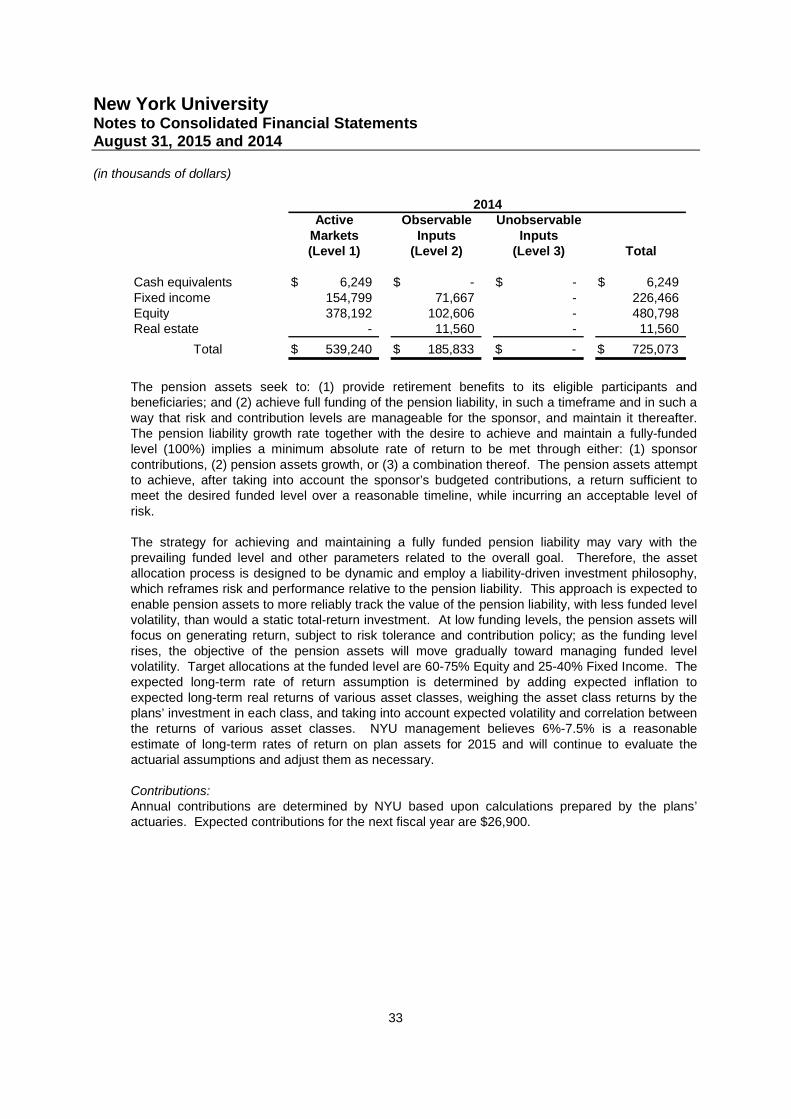
New York UniversityNotes to Consolidated Financial StatementsAugust 31, 2015 and 2014
(in thousands of dollars)
33
Active Observable UnobservableMarkets Inputs Inputs(Level 1) (Level 2) (Level 3) Total
Cash equivalents 6,249$ -$ -$ 6,249$Fixed income 154,799 71,667 - 226,466Equity 378,192 102,606 - 480,798Real estate - 11,560 - 11,560
Total 539,240$ 185,833$ -$ 725,073$
2014
The pension assets seek to: (1) provide retirement benefits to its eligible participants andbeneficiaries; and (2) achieve full funding of the pension liability, in such a timeframe and in such away that risk and contribution levels are manageable for the sponsor, and maintain it thereafter.The pension liability growth rate together with the desire to achieve and maintain a fully-fundedlevel (100%) implies a minimum absolute rate of return to be met through either: (1) sponsorcontributions, (2) pension assets growth, or (3) a combination thereof. The pension assets attemptto achieve, after taking into account the sponsor’s budgeted contributions, a return sufficient tomeet the desired funded level over a reasonable timeline, while incurring an acceptable level ofrisk.
The strategy for achieving and maintaining a fully funded pension liability may vary with theprevailing funded level and other parameters related to the overall goal. Therefore, the assetallocation process is designed to be dynamic and employ a liability-driven investment philosophy,which reframes risk and performance relative to the pension liability. This approach is expected toenable pension assets to more reliably track the value of the pension liability, with less funded levelvolatility, than would a static total-return investment. At low funding levels, the pension assets willfocus on generating return, subject to risk tolerance and contribution policy; as the funding levelrises, the objective of the pension assets will move gradually toward managing funded levelvolatility. Target allocations at the funded level are 60-75% Equity and 25-40% Fixed Income. Theexpected long-term rate of return assumption is determined by adding expected inflation toexpected long-term real returns of various asset classes, weighing the asset class returns by theplans’ investment in each class, and taking into account expected volatility and correlation betweenthe returns of various asset classes. NYU management believes 6%-7.5% is a reasonableestimate of long-term rates of return on plan assets for 2015 and will continue to evaluate theactuarial assumptions and adjust them as necessary.
Contributions:Annual contributions are determined by NYU based upon calculations prepared by the plans’actuaries. Expected contributions for the next fiscal year are $26,900.
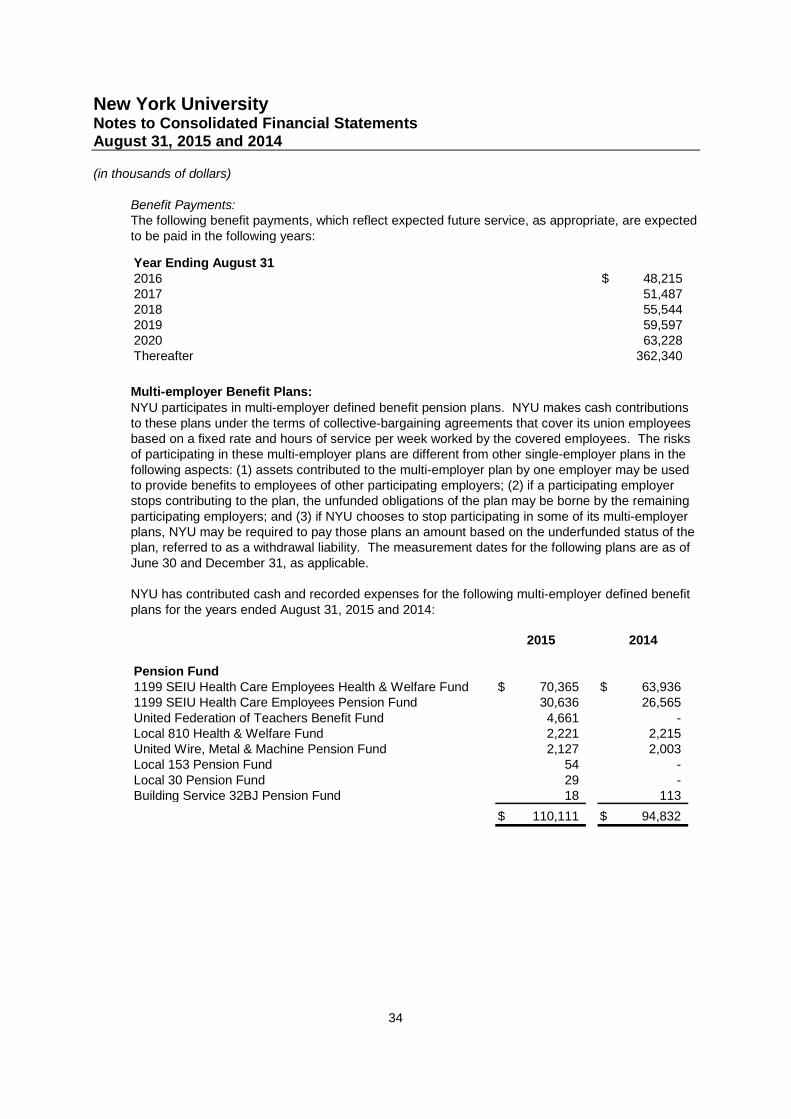
New York UniversityNotes to Consolidated Financial StatementsAugust 31, 2015 and 2014
(in thousands of dollars)
34
Benefit Payments:The following benefit payments, which reflect expected future service, as appropriate, are expectedto be paid in the following years:
Year Ending August 312016 48,215$2017 51,4872018 55,5442019 59,5972020 63,228Thereafter 362,340
Multi-employer Benefit Plans:NYU participates in multi-employer defined benefit pension plans. NYU makes cash contributionsto these plans under the terms of collective-bargaining agreements that cover its union employeesbased on a fixed rate and hours of service per week worked by the covered employees. The risksof participating in these multi-employer plans are different from other single-employer plans in thefollowing aspects: (1) assets contributed to the multi-employer plan by one employer may be usedto provide benefits to employees of other participating employers; (2) if a participating employerstops contributing to the plan, the unfunded obligations of the plan may be borne by the remainingparticipating employers; and (3) if NYU chooses to stop participating in some of its multi-employerplans, NYU may be required to pay those plans an amount based on the underfunded status of theplan, referred to as a withdrawal liability. The measurement dates for the following plans are as ofJune 30 and December 31, as applicable.
NYU has contributed cash and recorded expenses for the following multi-employer defined benefitplans for the years ended August 31, 2015 and 2014:
2015 2014
Pension Fund1199 SEIU Health Care Employees Health & Welfare Fund 70,365$ 63,936$1199 SEIU Health Care Employees Pension Fund 30,636 26,565United Federation of Teachers Benefit Fund 4,661 -Local 810 Health & Welfare Fund 2,221 2,215United Wire, Metal & Machine Pension Fund 2,127 2,003Local 153 Pension Fund 54 -Local 30 Pension Fund 29 -Building Service 32BJ Pension Fund 18 113
110,111$ 94,832$
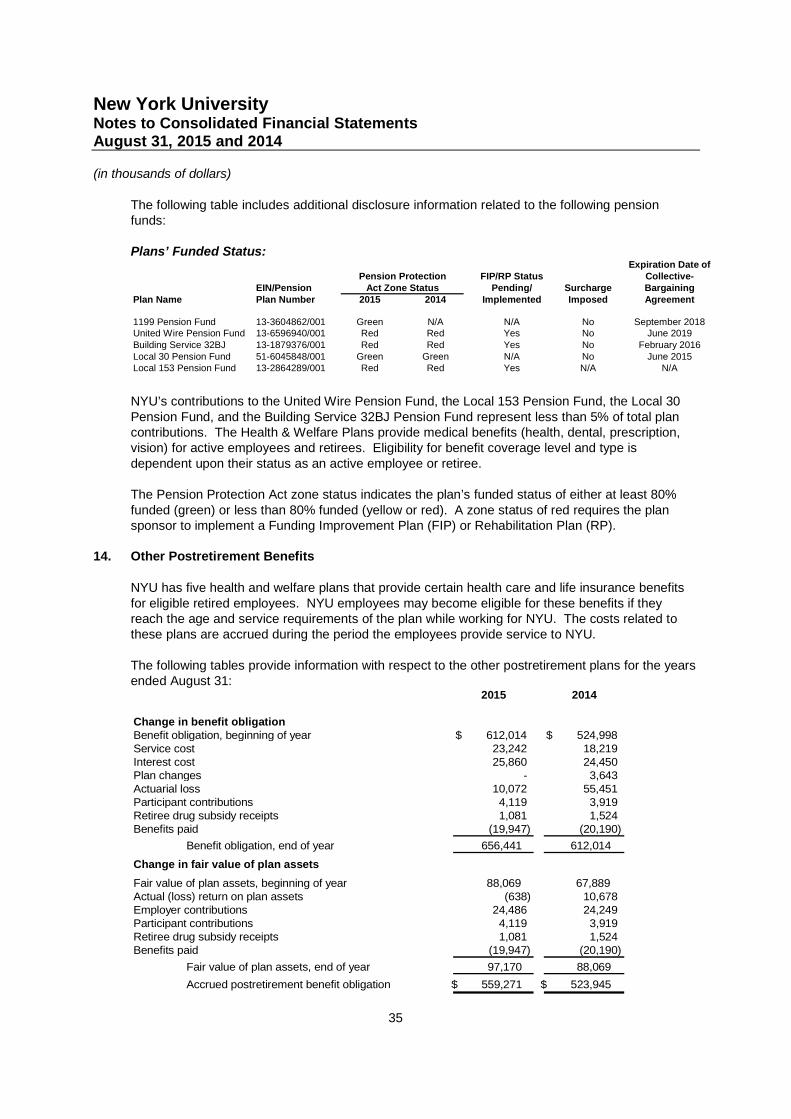
New York UniversityNotes to Consolidated Financial StatementsAugust 31, 2015 and 2014
(in thousands of dollars)
35
The following table includes additional disclosure information related to the following pensionfunds:
Plans’ Funded Status:Expiration Date of
FIP/RP Status Collective-EIN/Pension Pending/ Surcharge Bargaining
Plan Name Plan Number 2015 2014 Implemented Imposed Agreement
1199 Pension Fund 13-3604862/001 Green N/A N/A No September 2018United Wire Pension Fund 13-6596940/001 Red Red Yes No June 2019Building Service 32BJ 13-1879376/001 Red Red Yes No February 2016Local 30 Pension Fund 51-6045848/001 Green Green N/A No June 2015Local 153 Pension Fund 13-2864289/001 Red Red Yes N/A N/A
Pension ProtectionAct Zone Status
NYU’s contributions to the United Wire Pension Fund, the Local 153 Pension Fund, the Local 30Pension Fund, and the Building Service 32BJ Pension Fund represent less than 5% of total plancontributions. The Health & Welfare Plans provide medical benefits (health, dental, prescription,vision) for active employees and retirees. Eligibility for benefit coverage level and type isdependent upon their status as an active employee or retiree.
The Pension Protection Act zone status indicates the plan’s funded status of either at least 80%funded (green) or less than 80% funded (yellow or red). A zone status of red requires the plansponsor to implement a Funding Improvement Plan (FIP) or Rehabilitation Plan (RP).
14. Other Postretirement Benefits
NYU has five health and welfare plans that provide certain health care and life insurance benefitsfor eligible retired employees. NYU employees may become eligible for these benefits if theyreach the age and service requirements of the plan while working for NYU. The costs related tothese plans are accrued during the period the employees provide service to NYU.
The following tables provide information with respect to the other postretirement plans for the yearsended August 31:
2015 2014
Change in benefit obligationBenefit obligation, beginning of year 612,014$ 524,998$Service cost 23,242 18,219Interest cost 25,860 24,450Plan changes - 3,643Actuarial loss 10,072 55,451Participant contributions 4,119 3,919Retiree drug subsidy receipts 1,081 1,524Benefits paid (19,947) (20,190)
Benefit obligation, end of year 656,441 612,014
Change in fair value of plan assets
Fair value of plan assets, beginning of year 88,069 67,889Actual (loss) return on plan assets (638) 10,678Employer contributions 24,486 24,249Participant contributions 4,119 3,919Retiree drug subsidy receipts 1,081 1,524Benefits paid (19,947) (20,190)
Fair value of plan assets, end of year 97,170 88,069
Accrued postretirement benefit obligation 559,271$ 523,945$
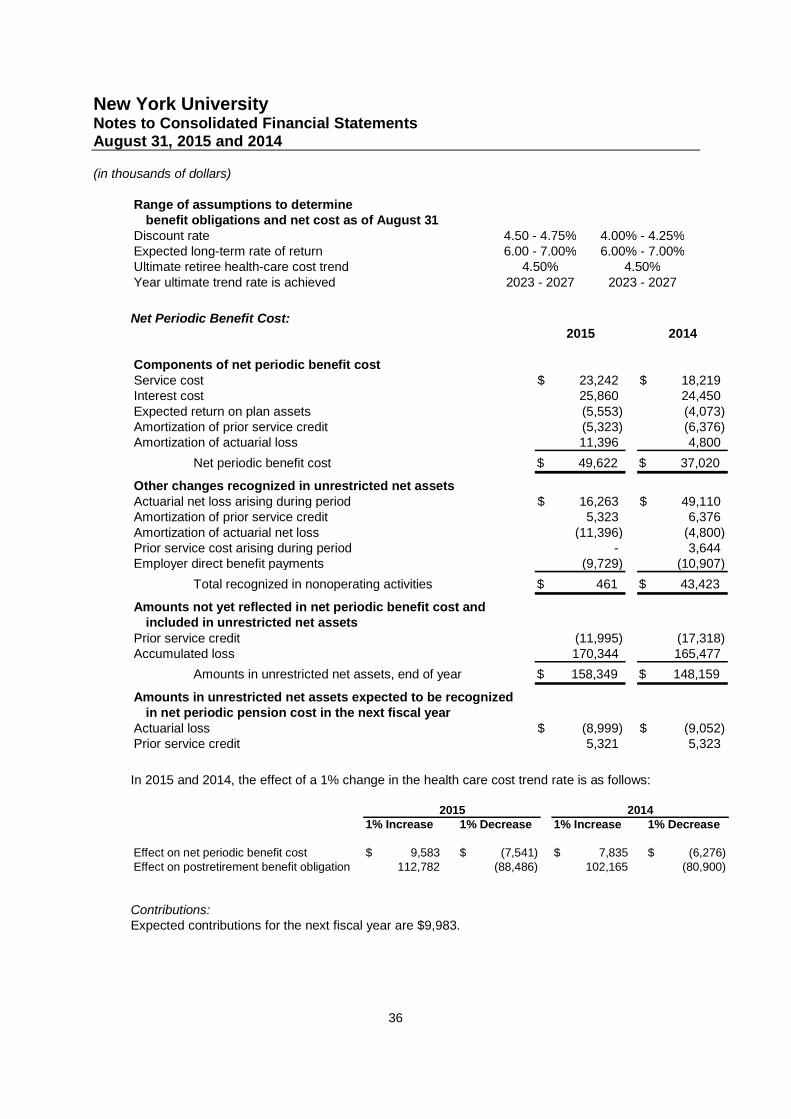
New York UniversityNotes to Consolidated Financial StatementsAugust 31, 2015 and 2014
(in thousands of dollars)
36
Range of assumptions to determinebenefit obligations and net cost as of August 31
Discount rate 4.50 - 4.75% 4.00% - 4.25%Expected long-term rate of return 6.00 - 7.00% 6.00% - 7.00%Ultimate retiree health-care cost trend 4.50% 4.50%Year ultimate trend rate is achieved 2023 - 2027 2023 - 2027
Net Periodic Benefit Cost:2015 2014
Components of net periodic benefit costService cost 23,242$ 18,219$Interest cost 25,860 24,450Expected return on plan assets (5,553) (4,073)Amortization of prior service credit (5,323) (6,376)Amortization of actuarial loss 11,396 4,800
Net periodic benefit cost 49,622$ 37,020$
Other changes recognized in unrestricted net assetsActuarial net loss arising during period 16,263$ 49,110$Amortization of prior service credit 5,323 6,376Amortization of actuarial net loss (11,396) (4,800)Prior service cost arising during period - 3,644Employer direct benefit payments (9,729) (10,907)
Total recognized in nonoperating activities 461$ 43,423$
Amounts not yet reflected in net periodic benefit cost andincluded in unrestricted net assets
Prior service credit (11,995) (17,318)Accumulated loss 170,344 165,477
Amounts in unrestricted net assets, end of year 158,349$ 148,159$
Amounts in unrestricted net assets expected to be recognizedin net periodic pension cost in the next fiscal year
Actuarial loss (8,999)$ (9,052)$Prior service credit 5,321 5,323
In 2015 and 2014, the effect of a 1% change in the health care cost trend rate is as follows:
1% Increase 1% Decrease 1% Increase 1% Decrease
Effect on net periodic benefit cost 9,583$ (7,541)$ 7,835$ (6,276)$Effect on postretirement benefit obligation 112,782 (88,486) 102,165 (80,900)
2015 2014
Contributions:Expected contributions for the next fiscal year are $9,983.
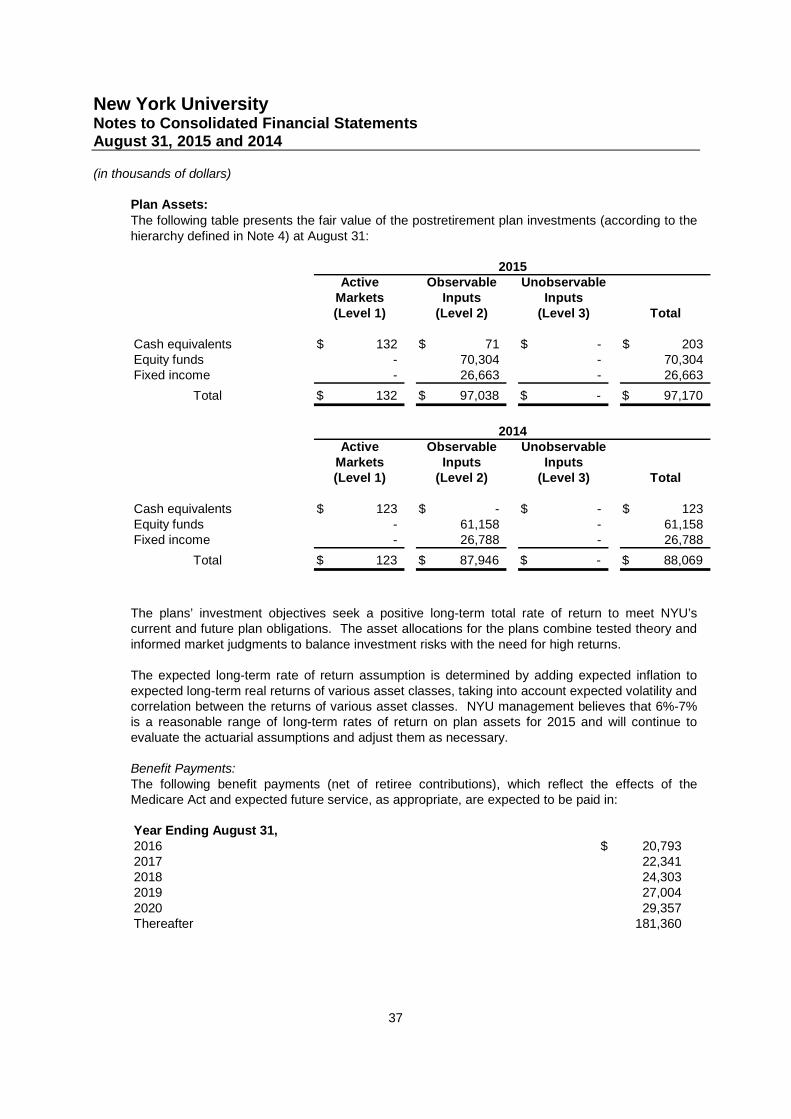
New York UniversityNotes to Consolidated Financial StatementsAugust 31, 2015 and 2014
(in thousands of dollars)
37
Plan Assets:The following table presents the fair value of the postretirement plan investments (according to thehierarchy defined in Note 4) at August 31:
Active Observable UnobservableMarkets Inputs Inputs(Level 1) (Level 2) (Level 3) Total
Cash equivalents 132$ 71$ -$ 203$Equity funds - 70,304 - 70,304Fixed income - 26,663 - 26,663
Total 132$ 97,038$ -$ 97,170$
Active Observable UnobservableMarkets Inputs Inputs(Level 1) (Level 2) (Level 3) Total
Cash equivalents 123$ -$ -$ 123$Equity funds - 61,158 - 61,158Fixed income - 26,788 - 26,788
Total 123$ 87,946$ -$ 88,069$
2015
2014
The plans’ investment objectives seek a positive long-term total rate of return to meet NYU’scurrent and future plan obligations. The asset allocations for the plans combine tested theory andinformed market judgments to balance investment risks with the need for high returns.
The expected long-term rate of return assumption is determined by adding expected inflation toexpected long-term real returns of various asset classes, taking into account expected volatility andcorrelation between the returns of various asset classes. NYU management believes that 6%-7%is a reasonable range of long-term rates of return on plan assets for 2015 and will continue toevaluate the actuarial assumptions and adjust them as necessary.
Benefit Payments:The following benefit payments (net of retiree contributions), which reflect the effects of theMedicare Act and expected future service, as appropriate, are expected to be paid in:
Year Ending August 31,2016 20,793$2017 22,3412018 24,3032019 27,0042020 29,357Thereafter 181,360
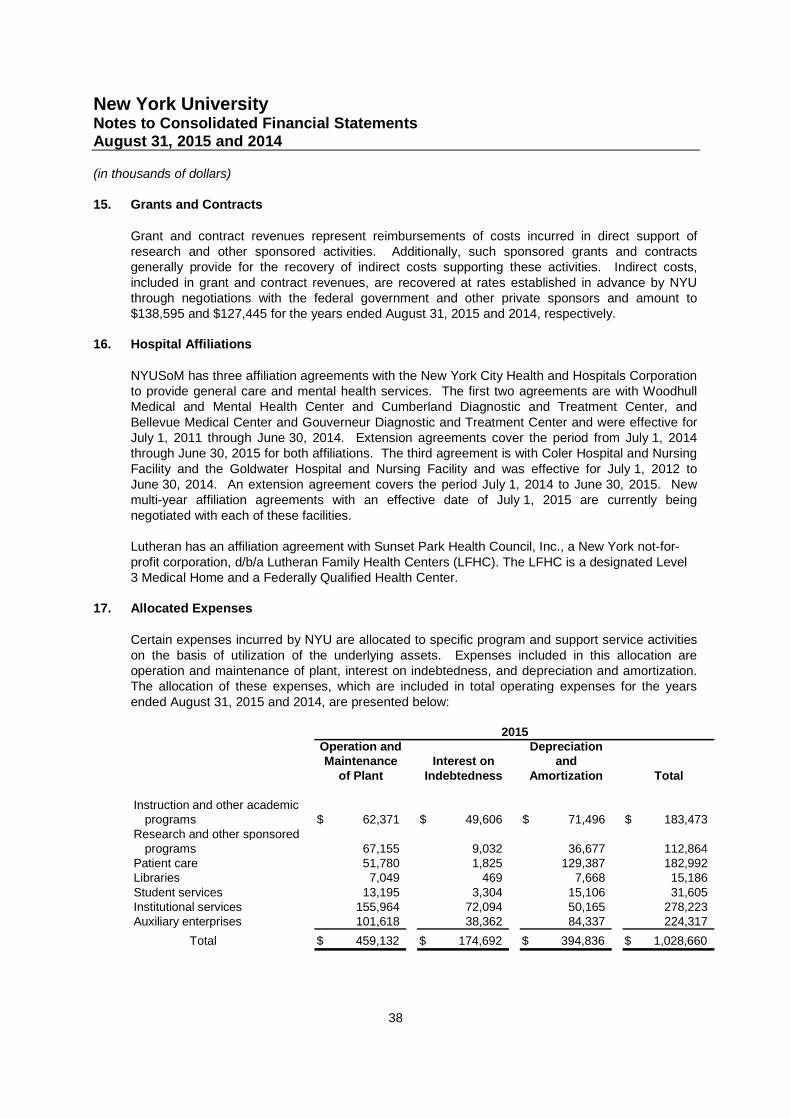
New York UniversityNotes to Consolidated Financial StatementsAugust 31, 2015 and 2014
(in thousands of dollars)
38
15. Grants and Contracts
Grant and contract revenues represent reimbursements of costs incurred in direct support ofresearch and other sponsored activities. Additionally, such sponsored grants and contractsgenerally provide for the recovery of indirect costs supporting these activities. Indirect costs,included in grant and contract revenues, are recovered at rates established in advance by NYUthrough negotiations with the federal government and other private sponsors and amount to$138,595 and $127,445 for the years ended August 31, 2015 and 2014, respectively.
16. Hospital Affiliations
NYUSoM has three affiliation agreements with the New York City Health and Hospitals Corporationto provide general care and mental health services. The first two agreements are with WoodhullMedical and Mental Health Center and Cumberland Diagnostic and Treatment Center, andBellevue Medical Center and Gouverneur Diagnostic and Treatment Center and were effective forJuly 1, 2011 through June 30, 2014. Extension agreements cover the period from July 1, 2014through June 30, 2015 for both affiliations. The third agreement is with Coler Hospital and NursingFacility and the Goldwater Hospital and Nursing Facility and was effective for July 1, 2012 toJune 30, 2014. An extension agreement covers the period July 1, 2014 to June 30, 2015. Newmulti-year affiliation agreements with an effective date of July 1, 2015 are currently beingnegotiated with each of these facilities.
Lutheran has an affiliation agreement with Sunset Park Health Council, Inc., a New York not-for-profit corporation, d/b/a Lutheran Family Health Centers (LFHC). The LFHC is a designated Level3 Medical Home and a Federally Qualified Health Center.
17. Allocated Expenses
Certain expenses incurred by NYU are allocated to specific program and support service activitieson the basis of utilization of the underlying assets. Expenses included in this allocation areoperation and maintenance of plant, interest on indebtedness, and depreciation and amortization.The allocation of these expenses, which are included in total operating expenses for the yearsended August 31, 2015 and 2014, are presented below:
Operation and DepreciationMaintenance Interest on and
of Plant Indebtedness Amortization Total
Instruction and other academicprograms 62,371$ 49,606$ 71,496$ 183,473$
Research and other sponsoredprograms 67,155 9,032 36,677 112,864
Patient care 51,780 1,825 129,387 182,992Libraries 7,049 469 7,668 15,186Student services 13,195 3,304 15,106 31,605Institutional services 155,964 72,094 50,165 278,223Auxiliary enterprises 101,618 38,362 84,337 224,317
Total 459,132$ 174,692$ 394,836$ 1,028,660$
2015
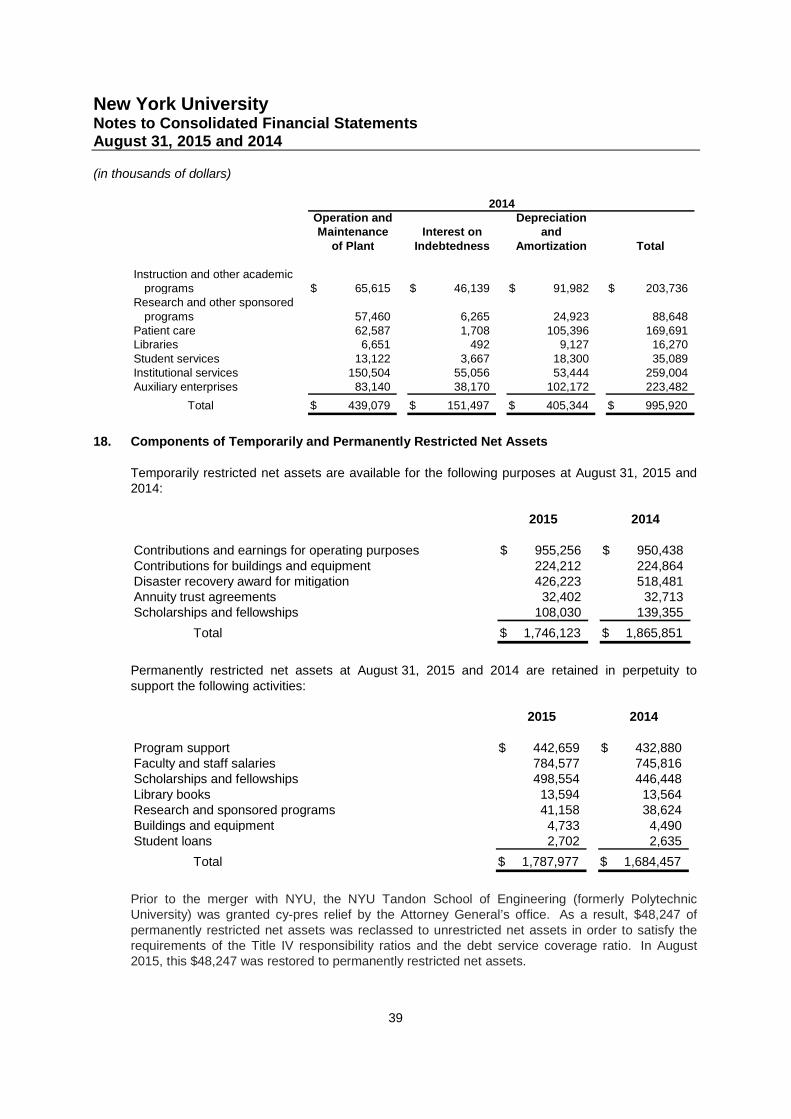
New York UniversityNotes to Consolidated Financial StatementsAugust 31, 2015 and 2014
(in thousands of dollars)
39
Operation and DepreciationMaintenance Interest on and
of Plant Indebtedness Amortization Total
Instruction and other academicprograms 65,615$ 46,139$ 91,982$ 203,736$
Research and other sponsoredprograms 57,460 6,265 24,923 88,648
Patient care 62,587 1,708 105,396 169,691Libraries 6,651 492 9,127 16,270Student services 13,122 3,667 18,300 35,089Institutional services 150,504 55,056 53,444 259,004Auxiliary enterprises 83,140 38,170 102,172 223,482
Total 439,079$ 151,497$ 405,344$ 995,920$
2014
18. Components of Temporarily and Permanently Restricted Net Assets
Temporarily restricted net assets are available for the following purposes at August 31, 2015 and2014:
2015 2014
Contributions and earnings for operating purposes 955,256$ 950,438$Contributions for buildings and equipment 224,212 224,864Disaster recovery award for mitigation 426,223 518,481Annuity trust agreements 32,402 32,713Scholarships and fellowships 108,030 139,355
Total 1,746,123$ 1,865,851$
Permanently restricted net assets at August 31, 2015 and 2014 are retained in perpetuity tosupport the following activities:
2015 2014
Program support 442,659$ 432,880$Faculty and staff salaries 784,577 745,816Scholarships and fellowships 498,554 446,448Library books 13,594 13,564Research and sponsored programs 41,158 38,624Buildings and equipment 4,733 4,490Student loans 2,702 2,635
Total 1,787,977$ 1,684,457$
Prior to the merger with NYU, the NYU Tandon School of Engineering (formerly PolytechnicUniversity) was granted cy-pres relief by the Attorney General’s office. As a result, $48,247 ofpermanently restricted net assets was reclassed to unrestricted net assets in order to satisfy therequirements of the Title IV responsibility ratios and the debt service coverage ratio. In August2015, this $48,247 was restored to permanently restricted net assets.
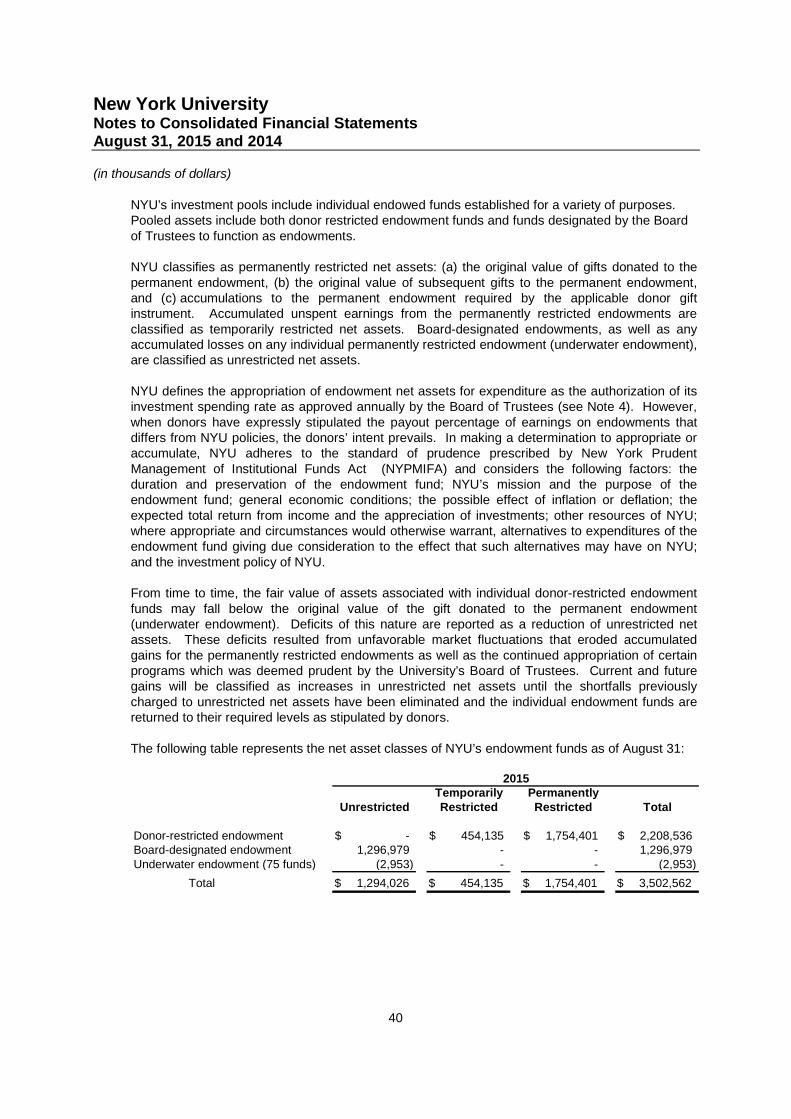
New York UniversityNotes to Consolidated Financial StatementsAugust 31, 2015 and 2014
(in thousands of dollars)
40
NYU’s investment pools include individual endowed funds established for a variety of purposes.Pooled assets include both donor restricted endowment funds and funds designated by the Boardof Trustees to function as endowments.
NYU classifies as permanently restricted net assets: (a) the original value of gifts donated to thepermanent endowment, (b) the original value of subsequent gifts to the permanent endowment,and (c) accumulations to the permanent endowment required by the applicable donor giftinstrument. Accumulated unspent earnings from the permanently restricted endowments areclassified as temporarily restricted net assets. Board-designated endowments, as well as anyaccumulated losses on any individual permanently restricted endowment (underwater endowment),are classified as unrestricted net assets.
NYU defines the appropriation of endowment net assets for expenditure as the authorization of itsinvestment spending rate as approved annually by the Board of Trustees (see Note 4). However,when donors have expressly stipulated the payout percentage of earnings on endowments thatdiffers from NYU policies, the donors’ intent prevails. In making a determination to appropriate oraccumulate, NYU adheres to the standard of prudence prescribed by New York PrudentManagement of Institutional Funds Act (NYPMIFA) and considers the following factors: theduration and preservation of the endowment fund; NYU’s mission and the purpose of theendowment fund; general economic conditions; the possible effect of inflation or deflation; theexpected total return from income and the appreciation of investments; other resources of NYU;where appropriate and circumstances would otherwise warrant, alternatives to expenditures of theendowment fund giving due consideration to the effect that such alternatives may have on NYU;and the investment policy of NYU.
From time to time, the fair value of assets associated with individual donor-restricted endowmentfunds may fall below the original value of the gift donated to the permanent endowment(underwater endowment). Deficits of this nature are reported as a reduction of unrestricted netassets. These deficits resulted from unfavorable market fluctuations that eroded accumulatedgains for the permanently restricted endowments as well as the continued appropriation of certainprograms which was deemed prudent by the University’s Board of Trustees. Current and futuregains will be classified as increases in unrestricted net assets until the shortfalls previouslycharged to unrestricted net assets have been eliminated and the individual endowment funds arereturned to their required levels as stipulated by donors.
The following table represents the net asset classes of NYU’s endowment funds as of August 31:
Temporarily PermanentlyUnrestricted Restricted Restricted Total
Donor-restricted endowment -$ 454,135$ 1,754,401$ 2,208,536$Board-designated endowment 1,296,979 - - 1,296,979Underwater endowment (75 funds) (2,953) - - (2,953)
Total 1,294,026$ 454,135$ 1,754,401$ 3,502,562$
2015
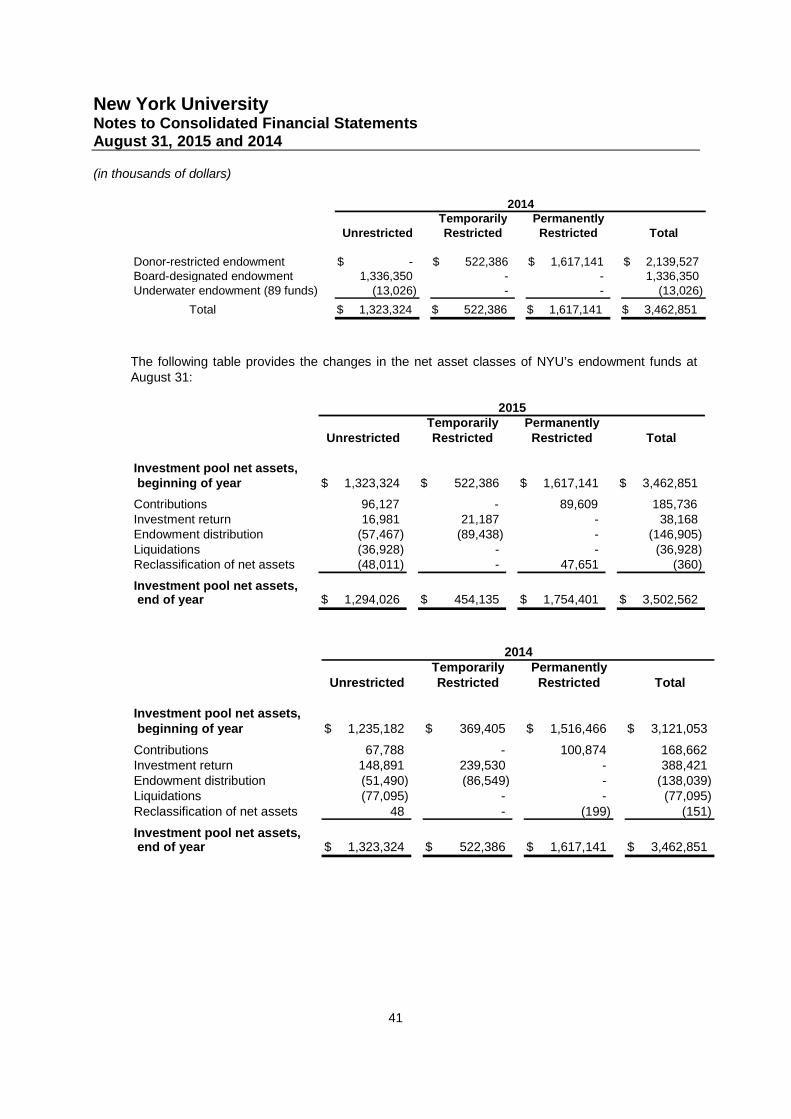
New York UniversityNotes to Consolidated Financial StatementsAugust 31, 2015 and 2014
(in thousands of dollars)
41
Temporarily PermanentlyUnrestricted Restricted Restricted Total
Donor-restricted endowment -$ 522,386$ 1,617,141$ 2,139,527$Board-designated endowment 1,336,350 - - 1,336,350Underwater endowment (89 funds) (13,026) - - (13,026)
Total 1,323,324$ 522,386$ 1,617,141$ 3,462,851$
2014
The following table provides the changes in the net asset classes of NYU’s endowment funds atAugust 31:
Temporarily PermanentlyUnrestricted Restricted Restricted Total
Investment pool net assets,beginning of year 1,323,324$ 522,386$ 1,617,141$ 3,462,851$
Contributions 96,127 - 89,609 185,736Investment return 16,981 21,187 - 38,168Endowment distribution (57,467) (89,438) - (146,905)Liquidations (36,928) - - (36,928)Reclassification of net assets (48,011) - 47,651 (360)
Investment pool net assets,end of year 1,294,026$ 454,135$ 1,754,401$ 3,502,562$
2015
Temporarily PermanentlyUnrestricted Restricted Restricted Total
Investment pool net assets,beginning of year 1,235,182$ 369,405$ 1,516,466$ 3,121,053$
Contributions 67,788 - 100,874 168,662Investment return 148,891 239,530 - 388,421Endowment distribution (51,490) (86,549) - (138,039)Liquidations (77,095) - - (77,095)Reclassification of net assets 48 - (199) (151)
Investment pool net assets,end of year 1,323,324$ 522,386$ 1,617,141$ 3,462,851$
2014
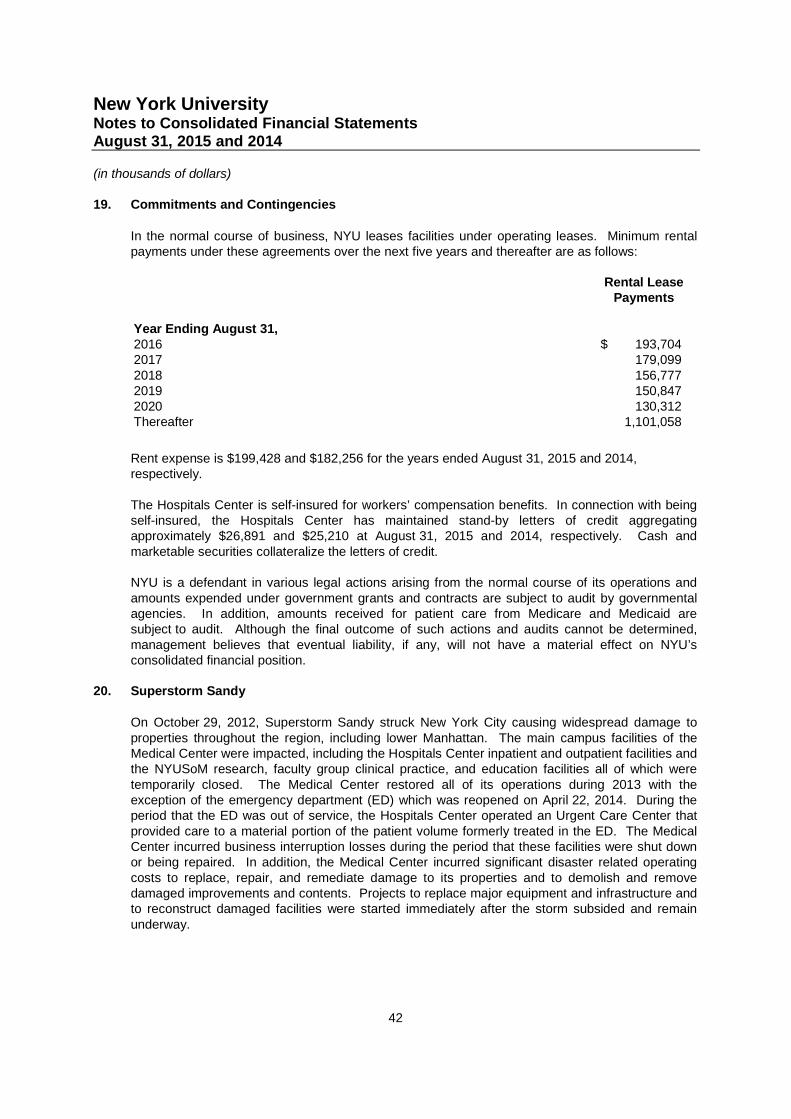
New York UniversityNotes to Consolidated Financial StatementsAugust 31, 2015 and 2014
(in thousands of dollars)
42
19. Commitments and Contingencies
In the normal course of business, NYU leases facilities under operating leases. Minimum rentalpayments under these agreements over the next five years and thereafter are as follows:
Rental LeasePayments
Year Ending August 31,2016 193,704$2017 179,0992018 156,7772019 150,8472020 130,312Thereafter 1,101,058
Rent expense is $199,428 and $182,256 for the years ended August 31, 2015 and 2014,respectively.
The Hospitals Center is self-insured for workers’ compensation benefits. In connection with beingself-insured, the Hospitals Center has maintained stand-by letters of credit aggregatingapproximately $26,891 and $25,210 at August 31, 2015 and 2014, respectively. Cash andmarketable securities collateralize the letters of credit.
NYU is a defendant in various legal actions arising from the normal course of its operations andamounts expended under government grants and contracts are subject to audit by governmentalagencies. In addition, amounts received for patient care from Medicare and Medicaid aresubject to audit. Although the final outcome of such actions and audits cannot be determined,management believes that eventual liability, if any, will not have a material effect on NYU’sconsolidated financial position.
20. Superstorm Sandy
On October 29, 2012, Superstorm Sandy struck New York City causing widespread damage toproperties throughout the region, including lower Manhattan. The main campus facilities of theMedical Center were impacted, including the Hospitals Center inpatient and outpatient facilities andthe NYUSoM research, faculty group clinical practice, and education facilities all of which weretemporarily closed. The Medical Center restored all of its operations during 2013 with theexception of the emergency department (ED) which was reopened on April 22, 2014. During theperiod that the ED was out of service, the Hospitals Center operated an Urgent Care Center thatprovided care to a material portion of the patient volume formerly treated in the ED. The MedicalCenter incurred business interruption losses during the period that these facilities were shut downor being repaired. In addition, the Medical Center incurred significant disaster related operatingcosts to replace, repair, and remediate damage to its properties and to demolish and removedamaged improvements and contents. Projects to replace major equipment and infrastructure andto reconstruct damaged facilities were started immediately after the storm subsided and remainunderway.
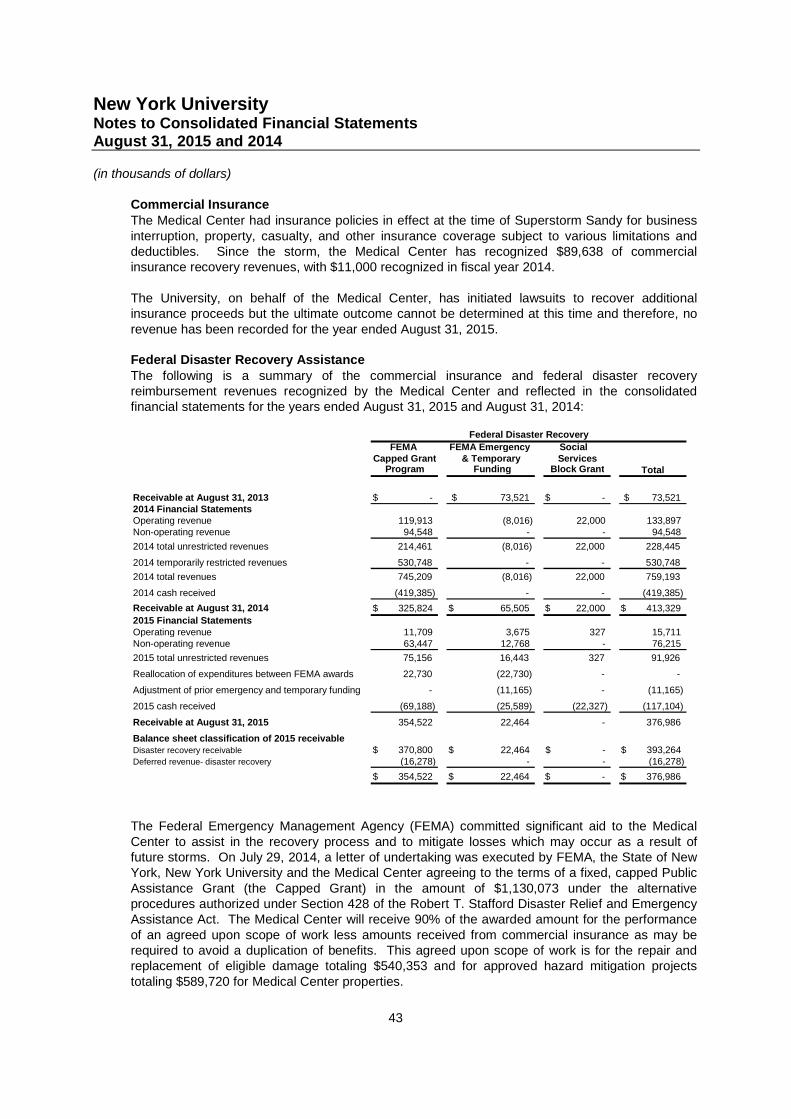
New York UniversityNotes to Consolidated Financial StatementsAugust 31, 2015 and 2014
(in thousands of dollars)
43
Commercial InsuranceThe Medical Center had insurance policies in effect at the time of Superstorm Sandy for businessinterruption, property, casualty, and other insurance coverage subject to various limitations anddeductibles. Since the storm, the Medical Center has recognized $89,638 of commercialinsurance recovery revenues, with $11,000 recognized in fiscal year 2014.
The University, on behalf of the Medical Center, has initiated lawsuits to recover additionalinsurance proceeds but the ultimate outcome cannot be determined at this time and therefore, norevenue has been recorded for the year ended August 31, 2015.
Federal Disaster Recovery AssistanceThe following is a summary of the commercial insurance and federal disaster recoveryreimbursement revenues recognized by the Medical Center and reflected in the consolidatedfinancial statements for the years ended August 31, 2015 and August 31, 2014:
FEMA FEMA Emergency SocialCapped Grant & Temporary Services
Program Funding Block Grant
Receivable at August 31, 2013 -$ 73,521$ -$ 73,521$2014 Financial StatementsOperating revenue 119,913 (8,016) 22,000 133,897Non-operating revenue 94,548 - - 94,548
2014 total unrestricted revenues 214,461 (8,016) 22,000 228,445
2014 temporarily restricted revenues 530,748 - - 530,748
2014 total revenues 745,209 (8,016) 22,000 759,193
2014 cash received (419,385) - - (419,385)
Receivable at August 31, 2014 325,824$ 65,505$ 22,000$ 413,329$
2015 Financial StatementsOperating revenue 11,709 3,675 327 15,711Non-operating revenue 63,447 12,768 - 76,215
2015 total unrestricted revenues 75,156 16,443 327 91,926
Reallocation of expenditures between FEMA awards 22,730 (22,730) - -
Adjustment of prior emergency and temporary funding - (11,165) - (11,165)
2015 cash received (69,188) (25,589) (22,327) (117,104)
Receivable at August 31, 2015 354,522 22,464 - 376,986
Balance sheet classification of 2015 receivableDisaster recovery receivable 370,800$ 22,464$ -$ 393,264$Deferred revenue- disaster recovery (16,278) - - (16,278)
354,522$ 22,464$ -$ 376,986$
Federal Disaster Recovery
Total
The Federal Emergency Management Agency (FEMA) committed significant aid to the MedicalCenter to assist in the recovery process and to mitigate losses which may occur as a result offuture storms. On July 29, 2014, a letter of undertaking was executed by FEMA, the State of NewYork, New York University and the Medical Center agreeing to the terms of a fixed, capped PublicAssistance Grant (the Capped Grant) in the amount of $1,130,073 under the alternativeprocedures authorized under Section 428 of the Robert T. Stafford Disaster Relief and EmergencyAssistance Act. The Medical Center will receive 90% of the awarded amount for the performanceof an agreed upon scope of work less amounts received from commercial insurance as may berequired to avoid a duplication of benefits. This agreed upon scope of work is for the repair andreplacement of eligible damage totaling $540,353 and for approved hazard mitigation projectstotaling $589,720 for Medical Center properties.
New York UniversityNotes to Consolidated Financial StatementsAugust 31, 2015 and 2014
(in thousands of dollars)
44
Of the $540,353 related to repairs and replacement, the Medical Center recognized revenue of$289,617 which represents 90% of eligible costs incurred through August 31, 2015. Additionally,during 2015, $22,730 of reimbursable costs incurred in prior years were reallocated to the CappedGrant, for a total of $312,347 expended for eligible repair and replacement costs. As of August 31,2015 and 2014, the unspent portion of the cash received for repairs and replacement totaling$16,278 and $67,054, respectively, is recorded on the consolidated balance sheet in assets limitedas to use-disaster recovery and deferred revenue. The revenues will be recognized as theallowable costs are incurred.
Of the $589,720 related to hazard mitigation projects, the Medical Center has recognized 90% ofthis total (or $530,748) as a temporarily restricted disaster recovery award for future mitigation thatwill be released from restriction as these related costs are incurred. For the years ended August31, 2015 and 2014, the Medical Center released $92.3 million and $12.3 million, respectively, fromrestriction for hazard mitigation.
In addition to the Capped Grant award, FEMA continues to work with the Medical Center to finalizeadditional awards related to eligible disaster related emergency and non-permanent expenses thatare not included in the Capped Grant. Revenue recognized is net of applicable insuranceproceeds.
The Medical Center has received awards from federal agencies other than FEMA to assist in therecovery of certain disaster related costs. The Hospitals Center received a Social Services BlockGrant (SSBG) totaling $22,327 to assist in the recovery of certain disaster related costs.Additionally, in 2014, NYUSoM received $128,586 of NIH Disaster Recovery Appropriation Awards(NIH – DRAA) to restore lost research and to rebuild research space damaged as a result of theStorm. NYUSoM had total expenditures of NIH – DRAA awards of $23,929 and $37,531 duringthe years ended August 31, 2015 and 2014, respectively, which were recognized as grants andsponsored program revenue.
Disaster-related CostsThe consolidated financial statements reflect disaster-related operating and capital expendituresfor the years ended August 31, 2015 and 2014.
Disaster-related operating expenses include the remediation of building and grounds includeenvironmental clean-up, emergency stabilization, and temporary repairs. Other disaster-relatedoperating costs include temporary facilities, replacement of lost medical, surgical, pharmaceuticaland research supplies, and other miscellaneous items. The Medical Center recorded $9,973 and$78,490 of disaster-related operating expenses for the years ended August 31, 2015 and 2014,respectively.
Disaster related capital expenditures include capital expenses incurred for hazard mitigation andthe repair/restoration for eligible damages to the main campus and offsite facilities. The MedicalCenter capitalized $172,164 and $102,020 of disaster-related expenditures within property, plantand equipment for the years ended August 31, 2015 and 2014, respectively.
21. Subsequent Events
NYU performed an evaluation of subsequent events through December 14, 2015, which is the datethe consolidated financial statements were issued.
45
Appendix A
Supplemental Schedules to the Consolidated Financial Statements
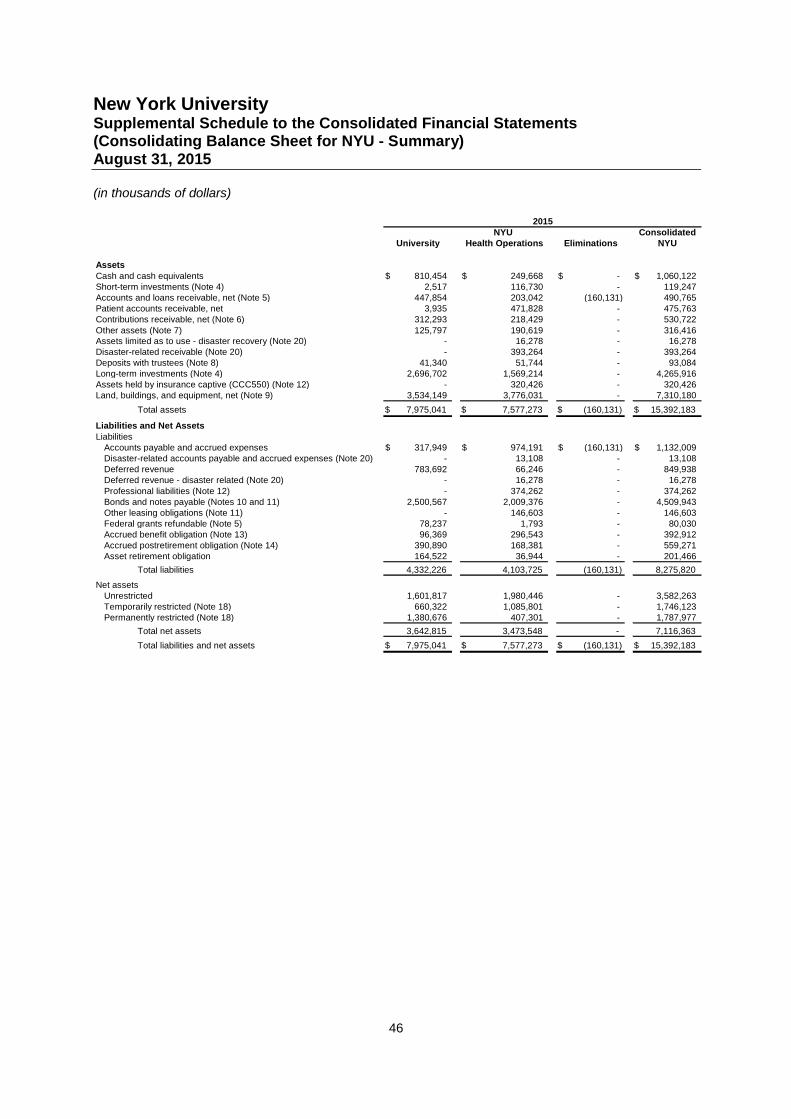
New York UniversitySupplemental Schedule to the Consolidated Financial Statements(Consolidating Balance Sheet for NYU - Summary)August 31, 2015
(in thousands of dollars)
46
NYU ConsolidatedUniversity Health Operations Eliminations NYU
AssetsCash and cash equivalents 810,454$ 249,668$ -$ 1,060,122$Short-term investments (Note 4) 2,517 116,730 - 119,247Accounts and loans receivable, net (Note 5) 447,854 203,042 (160,131) 490,765Patient accounts receivable, net 3,935 471,828 - 475,763Contributions receivable, net (Note 6) 312,293 218,429 - 530,722Other assets (Note 7) 125,797 190,619 - 316,416Assets limited as to use - disaster recovery (Note 20) - 16,278 - 16,278Disaster-related receivable (Note 20) - 393,264 - 393,264Deposits with trustees (Note 8) 41,340 51,744 - 93,084Long-term investments (Note 4) 2,696,702 1,569,214 - 4,265,916Assets held by insurance captive (CCC550) (Note 12) - 320,426 - 320,426Land, buildings, and equipment, net (Note 9) 3,534,149 3,776,031 - 7,310,180
Total assets 7,975,041$ 7,577,273$ (160,131)$ 15,392,183$
Liabilities and Net AssetsLiabilities
Accounts payable and accrued expenses 317,949$ 974,191$ (160,131)$ 1,132,009$Disaster-related accounts payable and accrued expenses (Note 20) - 13,108 - 13,108Deferred revenue 783,692 66,246 - 849,938Deferred revenue - disaster related (Note 20) - 16,278 - 16,278Professional liabilities (Note 12) - 374,262 - 374,262Bonds and notes payable (Notes 10 and 11) 2,500,567 2,009,376 - 4,509,943Other leasing obligations (Note 11) - 146,603 - 146,603Federal grants refundable (Note 5) 78,237 1,793 - 80,030Accrued benefit obligation (Note 13) 96,369 296,543 - 392,912Accrued postretirement obligation (Note 14) 390,890 168,381 - 559,271Asset retirement obligation 164,522 36,944 - 201,466
Total liabilities 4,332,226 4,103,725 (160,131) 8,275,820
Net assetsUnrestricted 1,601,817 1,980,446 - 3,582,263Temporarily restricted (Note 18) 660,322 1,085,801 - 1,746,123Permanently restricted (Note 18) 1,380,676 407,301 - 1,787,977
Total net assets 3,642,815 3,473,548 - 7,116,363
Total liabilities and net assets 7,975,041$ 7,577,273$ (160,131)$ 15,392,183$
2015
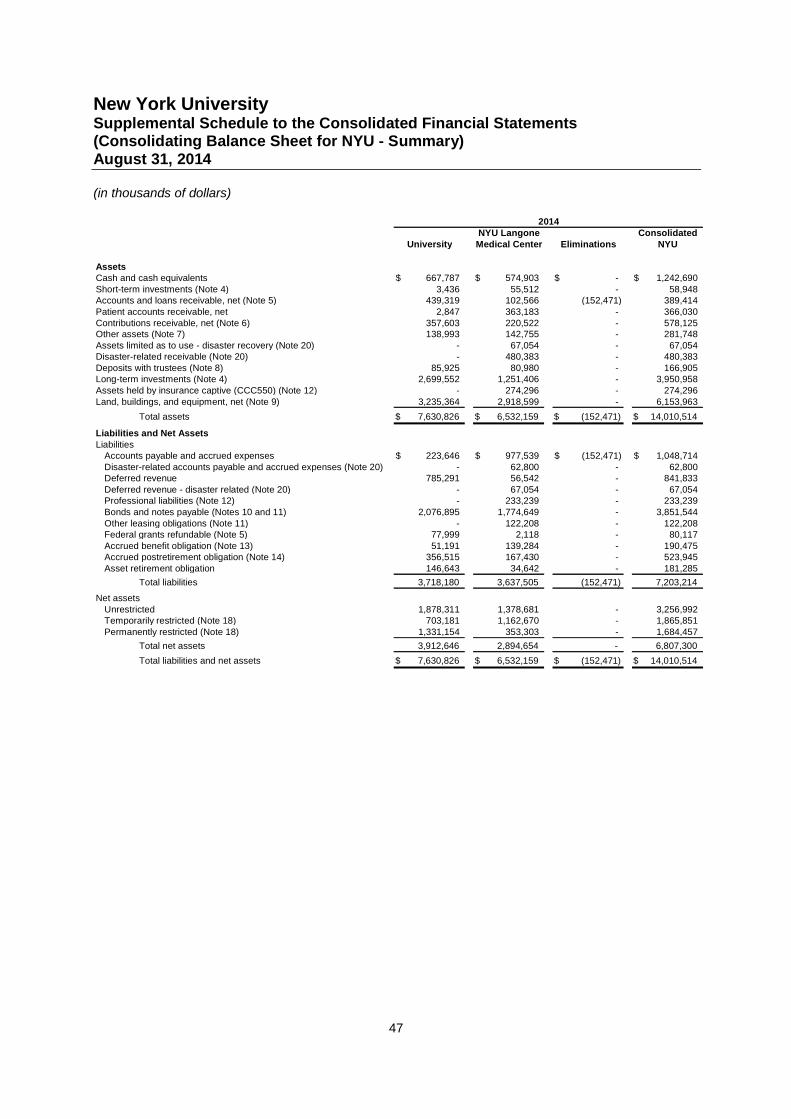
New York UniversitySupplemental Schedule to the Consolidated Financial Statements(Consolidating Balance Sheet for NYU - Summary)August 31, 2014
(in thousands of dollars)
47
NYU Langone ConsolidatedUniversity Medical Center Eliminations NYU
AssetsCash and cash equivalents 667,787$ 574,903$ -$ 1,242,690$Short-term investments (Note 4) 3,436 55,512 - 58,948Accounts and loans receivable, net (Note 5) 439,319 102,566 (152,471) 389,414Patient accounts receivable, net 2,847 363,183 - 366,030Contributions receivable, net (Note 6) 357,603 220,522 - 578,125Other assets (Note 7) 138,993 142,755 - 281,748Assets limited as to use - disaster recovery (Note 20) - 67,054 - 67,054Disaster-related receivable (Note 20) - 480,383 - 480,383Deposits with trustees (Note 8) 85,925 80,980 - 166,905Long-term investments (Note 4) 2,699,552 1,251,406 - 3,950,958Assets held by insurance captive (CCC550) (Note 12) - 274,296 - 274,296Land, buildings, and equipment, net (Note 9) 3,235,364 2,918,599 - 6,153,963
Total assets 7,630,826$ 6,532,159$ (152,471)$ 14,010,514$
Liabilities and Net AssetsLiabilities
Accounts payable and accrued expenses 223,646$ 977,539$ (152,471)$ 1,048,714$Disaster-related accounts payable and accrued expenses (Note 20) - 62,800 - 62,800Deferred revenue 785,291 56,542 - 841,833Deferred revenue - disaster related (Note 20) - 67,054 - 67,054Professional liabilities (Note 12) - 233,239 - 233,239Bonds and notes payable (Notes 10 and 11) 2,076,895 1,774,649 - 3,851,544Other leasing obligations (Note 11) - 122,208 - 122,208Federal grants refundable (Note 5) 77,999 2,118 - 80,117Accrued benefit obligation (Note 13) 51,191 139,284 - 190,475Accrued postretirement obligation (Note 14) 356,515 167,430 - 523,945Asset retirement obligation 146,643 34,642 - 181,285
Total liabilities 3,718,180 3,637,505 (152,471) 7,203,214
Net assetsUnrestricted 1,878,311 1,378,681 - 3,256,992Temporarily restricted (Note 18) 703,181 1,162,670 - 1,865,851Permanently restricted (Note 18) 1,331,154 353,303 - 1,684,457
Total net assets 3,912,646 2,894,654 - 6,807,300
Total liabilities and net assets 7,630,826$ 6,532,159$ (152,471)$ 14,010,514$
2014
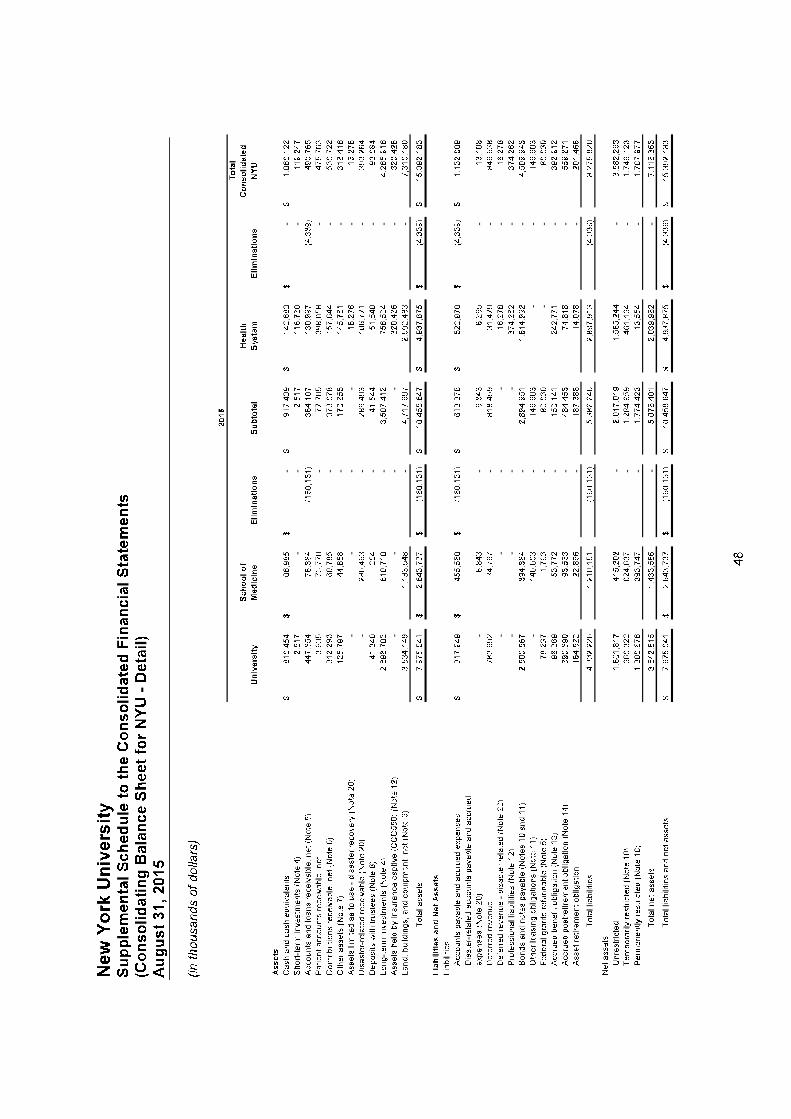
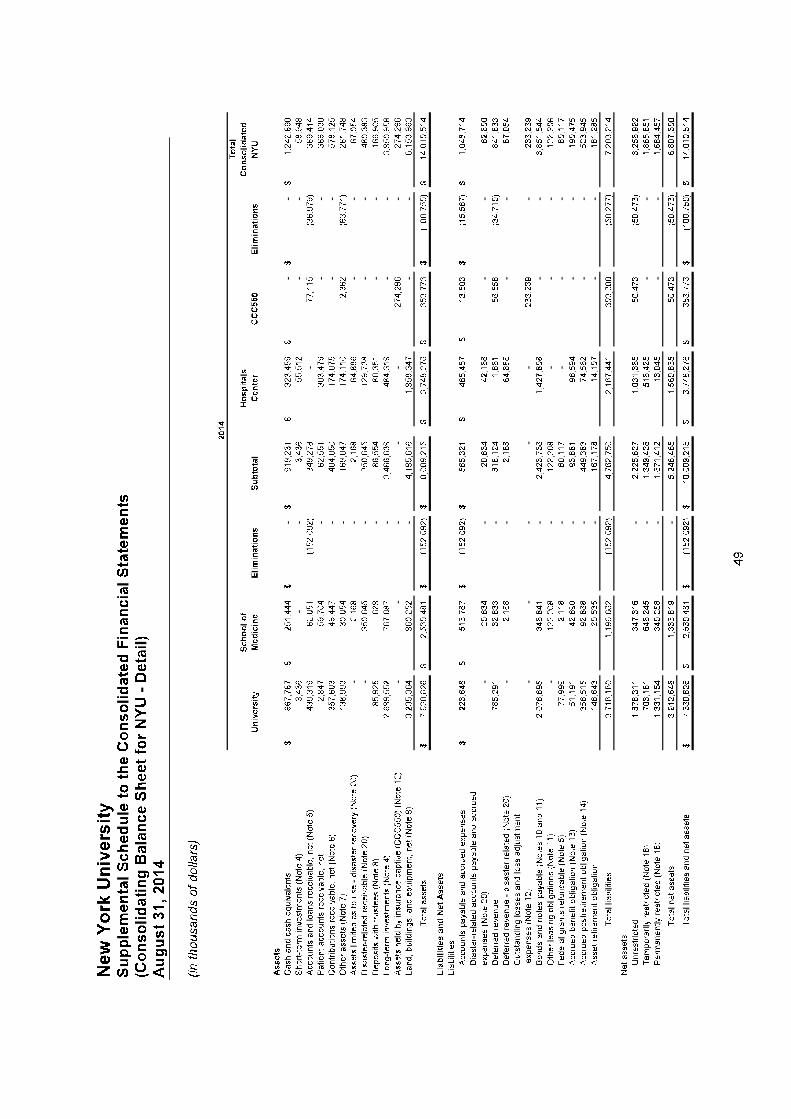
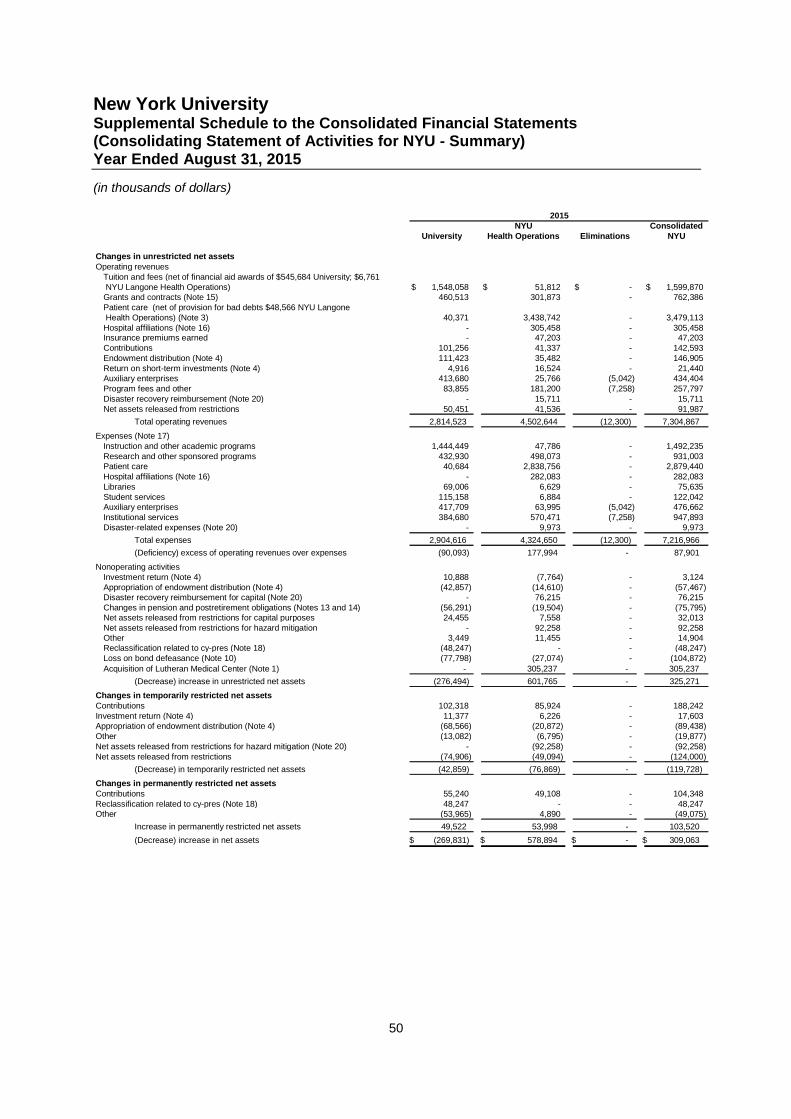
New York UniversitySupplemental Schedule to the Consolidated Financial Statements(Consolidating Statement of Activities for NYU - Summary)Year Ended August 31, 2015
(in thousands of dollars)
50
NYU ConsolidatedUniversity Health Operations Eliminations NYU
Changes in unrestricted net assetsOperating revenues
Tuition and fees (net of financial aid awards of $545,684 University; $6,761NYU Langone Health Operations) 1,548,058$ 51,812$ -$ 1,599,870$Grants and contracts (Note 15) 460,513 301,873 - 762,386Patient care (net of provision for bad debts $48,566 NYU LangoneHealth Operations) (Note 3) 40,371 3,438,742 - 3,479,113Hospital affiliations (Note 16) - 305,458 - 305,458Insurance premiums earned - 47,203 - 47,203Contributions 101,256 41,337 - 142,593Endowment distribution (Note 4) 111,423 35,482 - 146,905Return on short-term investments (Note 4) 4,916 16,524 - 21,440Auxiliary enterprises 413,680 25,766 (5,042) 434,404Program fees and other 83,855 181,200 (7,258) 257,797Disaster recovery reimbursement (Note 20) - 15,711 - 15,711Net assets released from restrictions 50,451 41,536 - 91,987
Total operating revenues 2,814,523 4,502,644 (12,300) 7,304,867
Expenses (Note 17)Instruction and other academic programs 1,444,449 47,786 - 1,492,235Research and other sponsored programs 432,930 498,073 - 931,003Patient care 40,684 2,838,756 - 2,879,440Hospital affiliations (Note 16) - 282,083 - 282,083Libraries 69,006 6,629 - 75,635Student services 115,158 6,884 - 122,042Auxiliary enterprises 417,709 63,995 (5,042) 476,662Institutional services 384,680 570,471 (7,258) 947,893Disaster-related expenses (Note 20) - 9,973 - 9,973
Total expenses 2,904,616 4,324,650 (12,300) 7,216,966
(Deficiency) excess of operating revenues over expenses (90,093) 177,994 - 87,901
Nonoperating activitiesInvestment return (Note 4) 10,888 (7,764) - 3,124Appropriation of endowment distribution (Note 4) (42,857) (14,610) - (57,467)Disaster recovery reimbursement for capital (Note 20) - 76,215 - 76,215Changes in pension and postretirement obligations (Notes 13 and 14) (56,291) (19,504) - (75,795)Net assets released from restrictions for capital purposes 24,455 7,558 - 32,013Net assets released from restrictions for hazard mitigation - 92,258 - 92,258Other 3,449 11,455 - 14,904Reclassification related to cy-pres (Note 18) (48,247) - - (48,247)Loss on bond defeasance (Note 10) (77,798) (27,074) - (104,872)Acquisition of Lutheran Medical Center (Note 1) - 305,237 - 305,237
(Decrease) increase in unrestricted net assets (276,494) 601,765 - 325,271
Changes in temporarily restricted net assetsContributions 102,318 85,924 - 188,242Investment return (Note 4) 11,377 6,226 - 17,603Appropriation of endowment distribution (Note 4) (68,566) (20,872) - (89,438)Other (13,082) (6,795) - (19,877)Net assets released from restrictions for hazard mitigation (Note 20) - (92,258) - (92,258)Net assets released from restrictions (74,906) (49,094) - (124,000)
(Decrease) in temporarily restricted net assets (42,859) (76,869) - (119,728)
Changes in permanently restricted net assetsContributions 55,240 49,108 - 104,348Reclassification related to cy-pres (Note 18) 48,247 - - 48,247Other (53,965) 4,890 - (49,075)
Increase in permanently restricted net assets 49,522 53,998 - 103,520
(Decrease) increase in net assets (269,831)$ 578,894$ -$ 309,063$
2015
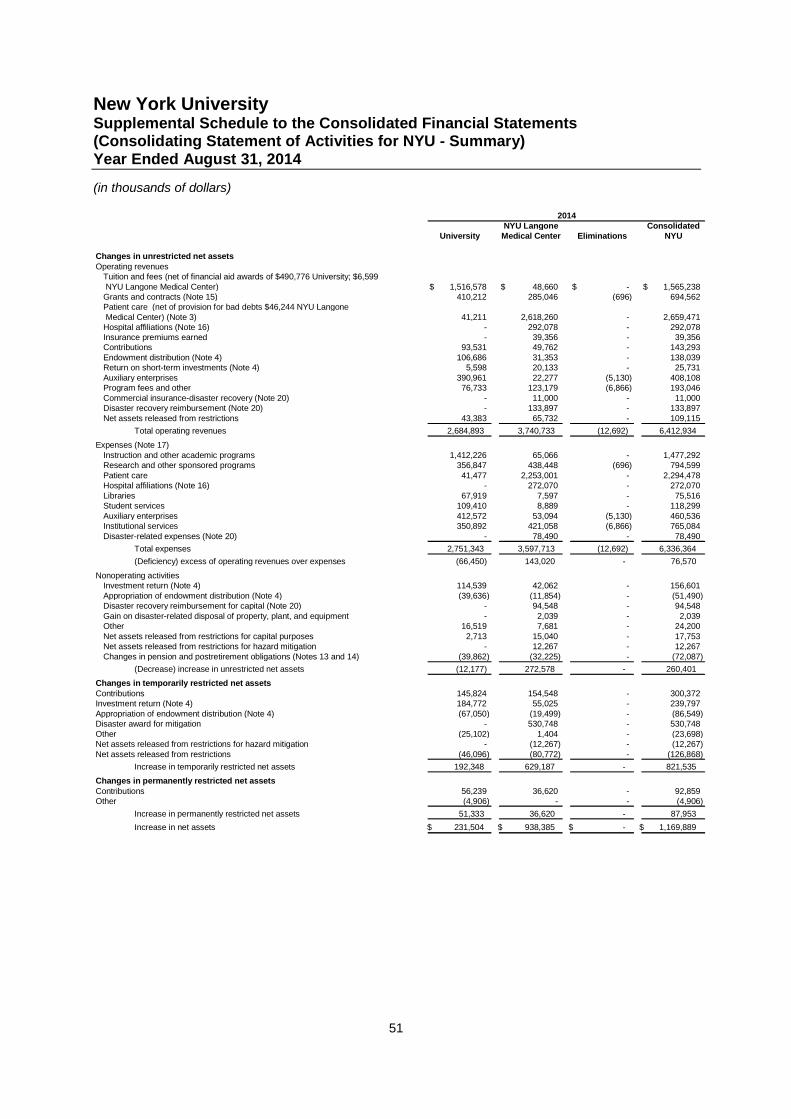
New York UniversitySupplemental Schedule to the Consolidated Financial Statements(Consolidating Statement of Activities for NYU - Summary)Year Ended August 31, 2014
(in thousands of dollars)
51
NYU Langone ConsolidatedUniversity Medical Center Eliminations NYU
Changes in unrestricted net assetsOperating revenues
Tuition and fees (net of financial aid awards of $490,776 University; $6,599NYU Langone Medical Center) 1,516,578$ 48,660$ -$ 1,565,238$
Grants and contracts (Note 15) 410,212 285,046 (696) 694,562Patient care (net of provision for bad debts $46,244 NYU LangoneMedical Center) (Note 3) 41,211 2,618,260 - 2,659,471
Hospital affiliations (Note 16) - 292,078 - 292,078Insurance premiums earned - 39,356 - 39,356Contributions 93,531 49,762 - 143,293Endowment distribution (Note 4) 106,686 31,353 - 138,039Return on short-term investments (Note 4) 5,598 20,133 - 25,731Auxiliary enterprises 390,961 22,277 (5,130) 408,108Program fees and other 76,733 123,179 (6,866) 193,046Commercial insurance-disaster recovery (Note 20) - 11,000 - 11,000Disaster recovery reimbursement (Note 20) - 133,897 - 133,897Net assets released from restrictions 43,383 65,732 - 109,115
Total operating revenues 2,684,893 3,740,733 (12,692) 6,412,934
Expenses (Note 17)Instruction and other academic programs 1,412,226 65,066 - 1,477,292Research and other sponsored programs 356,847 438,448 (696) 794,599Patient care 41,477 2,253,001 - 2,294,478Hospital affiliations (Note 16) - 272,070 - 272,070Libraries 67,919 7,597 - 75,516Student services 109,410 8,889 - 118,299Auxiliary enterprises 412,572 53,094 (5,130) 460,536Institutional services 350,892 421,058 (6,866) 765,084Disaster-related expenses (Note 20) - 78,490 - 78,490
Total expenses 2,751,343 3,597,713 (12,692) 6,336,364
(Deficiency) excess of operating revenues over expenses (66,450) 143,020 - 76,570
Nonoperating activitiesInvestment return (Note 4) 114,539 42,062 - 156,601Appropriation of endowment distribution (Note 4) (39,636) (11,854) - (51,490)Disaster recovery reimbursement for capital (Note 20) - 94,548 - 94,548Gain on disaster-related disposal of property, plant, and equipment - 2,039 - 2,039Other 16,519 7,681 - 24,200Net assets released from restrictions for capital purposes 2,713 15,040 - 17,753Net assets released from restrictions for hazard mitigation - 12,267 - 12,267Changes in pension and postretirement obligations (Notes 13 and 14) (39,862) (32,225) - (72,087)
(Decrease) increase in unrestricted net assets (12,177) 272,578 - 260,401
Changes in temporarily restricted net assetsContributions 145,824 154,548 - 300,372Investment return (Note 4) 184,772 55,025 - 239,797Appropriation of endowment distribution (Note 4) (67,050) (19,499) - (86,549)Disaster award for mitigation - 530,748 - 530,748Other (25,102) 1,404 - (23,698)Net assets released from restrictions for hazard mitigation - (12,267) - (12,267)Net assets released from restrictions (46,096) (80,772) - (126,868)
Increase in temporarily restricted net assets 192,348 629,187 - 821,535
Changes in permanently restricted net assetsContributions 56,239 36,620 - 92,859Other (4,906) - - (4,906)
Increase in permanently restricted net assets 51,333 36,620 - 87,953
Increase in net assets 231,504$ 938,385$ -$ 1,169,889$
2014
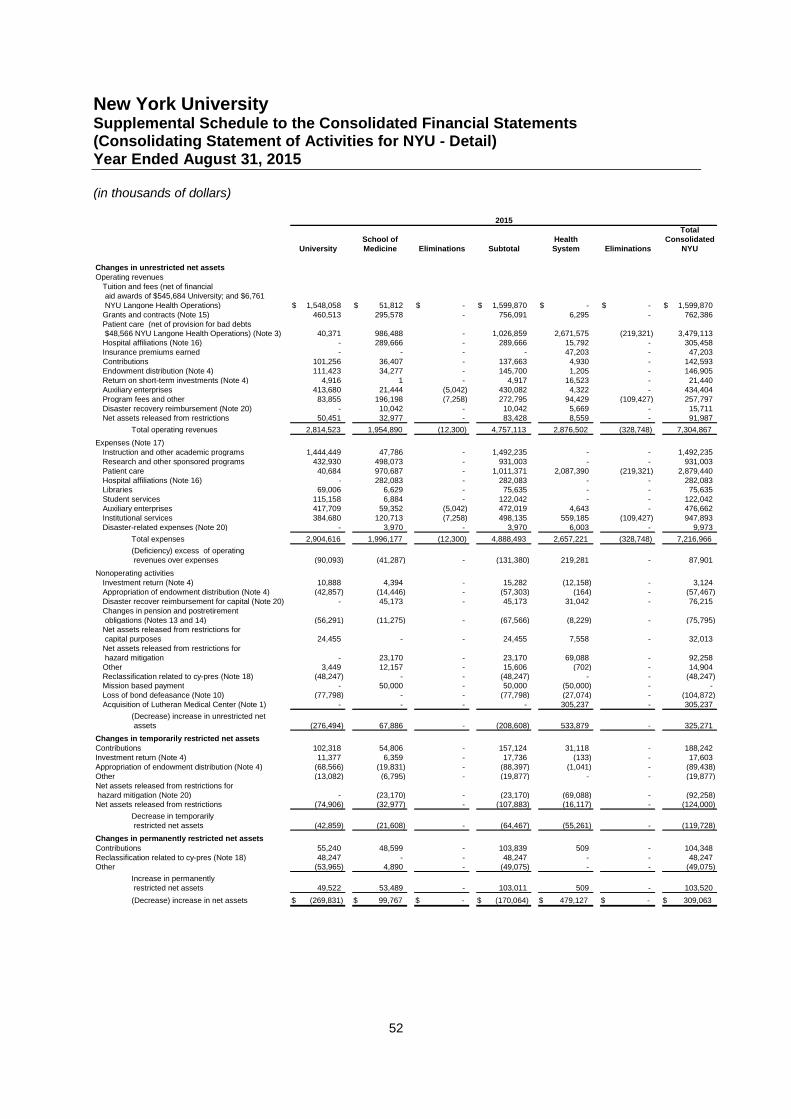
New York UniversitySupplemental Schedule to the Consolidated Financial Statements(Consolidating Statement of Activities for NYU - Detail)Year Ended August 31, 2015
(in thousands of dollars)
52
TotalSchool of Health Consolidated
University Medicine Eliminations Subtotal System Eliminations NYU
Changes in unrestricted net assetsOperating revenues
Tuition and fees (net of financialaid awards of $545,684 University; and $6,761NYU Langone Health Operations) 1,548,058$ 51,812$ -$ 1,599,870$ -$ -$ 1,599,870$
Grants and contracts (Note 15) 460,513 295,578 - 756,091 6,295 - 762,386Patient care (net of provision for bad debts$48,566 NYU Langone Health Operations) (Note 3) 40,371 986,488 - 1,026,859 2,671,575 (219,321) 3,479,113
Hospital affiliations (Note 16) - 289,666 - 289,666 15,792 - 305,458Insurance premiums earned - - - - 47,203 - 47,203Contributions 101,256 36,407 - 137,663 4,930 - 142,593Endowment distribution (Note 4) 111,423 34,277 - 145,700 1,205 - 146,905Return on short-term investments (Note 4) 4,916 1 - 4,917 16,523 - 21,440Auxiliary enterprises 413,680 21,444 (5,042) 430,082 4,322 - 434,404Program fees and other 83,855 196,198 (7,258) 272,795 94,429 (109,427) 257,797Disaster recovery reimbursement (Note 20) - 10,042 - 10,042 5,669 - 15,711Net assets released from restrictions 50,451 32,977 - 83,428 8,559 - 91,987
Total operating revenues 2,814,523 1,954,890 (12,300) 4,757,113 2,876,502 (328,748) 7,304,867
Expenses (Note 17)Instruction and other academic programs 1,444,449 47,786 - 1,492,235 - - 1,492,235Research and other sponsored programs 432,930 498,073 - 931,003 - - 931,003Patient care 40,684 970,687 - 1,011,371 2,087,390 (219,321) 2,879,440Hospital affiliations (Note 16) - 282,083 - 282,083 - - 282,083Libraries 69,006 6,629 - 75,635 - - 75,635Student services 115,158 6,884 - 122,042 - - 122,042Auxiliary enterprises 417,709 59,352 (5,042) 472,019 4,643 - 476,662Institutional services 384,680 120,713 (7,258) 498,135 559,185 (109,427) 947,893Disaster-related expenses (Note 20) - 3,970 - 3,970 6,003 - 9,973
Total expenses 2,904,616 1,996,177 (12,300) 4,888,493 2,657,221 (328,748) 7,216,966
(Deficiency) excess of operatingrevenues over expenses (90,093) (41,287) - (131,380) 219,281 - 87,901
Nonoperating activitiesInvestment return (Note 4) 10,888 4,394 - 15,282 (12,158) - 3,124Appropriation of endowment distribution (Note 4) (42,857) (14,446) - (57,303) (164) - (57,467)Disaster recover reimbursement for capital (Note 20) - 45,173 - 45,173 31,042 - 76,215Changes in pension and postretirementobligations (Notes 13 and 14) (56,291) (11,275) - (67,566) (8,229) - (75,795)
Net assets released from restrictions forcapital purposes 24,455 - - 24,455 7,558 - 32,013
Net assets released from restrictions forhazard mitigation - 23,170 - 23,170 69,088 - 92,258
Other 3,449 12,157 - 15,606 (702) - 14,904Reclassification related to cy-pres (Note 18) (48,247) - - (48,247) - - (48,247)Mission based payment - 50,000 - 50,000 (50,000) - -Loss of bond defeasance (Note 10) (77,798) - - (77,798) (27,074) - (104,872)Acquisition of Lutheran Medical Center (Note 1) - - - - 305,237 - 305,237
(Decrease) increase in unrestricted netassets (276,494) 67,886 - (208,608) 533,879 - 325,271
Changes in temporarily restricted net assetsContributions 102,318 54,806 - 157,124 31,118 - 188,242Investment return (Note 4) 11,377 6,359 - 17,736 (133) - 17,603Appropriation of endowment distribution (Note 4) (68,566) (19,831) - (88,397) (1,041) - (89,438)Other (13,082) (6,795) - (19,877) - - (19,877)Net assets released from restrictions forhazard mitigation (Note 20) - (23,170) - (23,170) (69,088) - (92,258)Net assets released from restrictions (74,906) (32,977) - (107,883) (16,117) - (124,000)
Decrease in temporarilyrestricted net assets (42,859) (21,608) - (64,467) (55,261) - (119,728)
Changes in permanently restricted net assetsContributions 55,240 48,599 - 103,839 509 - 104,348Reclassification related to cy-pres (Note 18) 48,247 - - 48,247 - - 48,247Other (53,965) 4,890 - (49,075) - - (49,075)
Increase in permanentlyrestricted net assets 49,522 53,489 - 103,011 509 - 103,520
(Decrease) increase in net assets (269,831)$ 99,767$ -$ (170,064)$ 479,127$ -$ 309,063$
2015
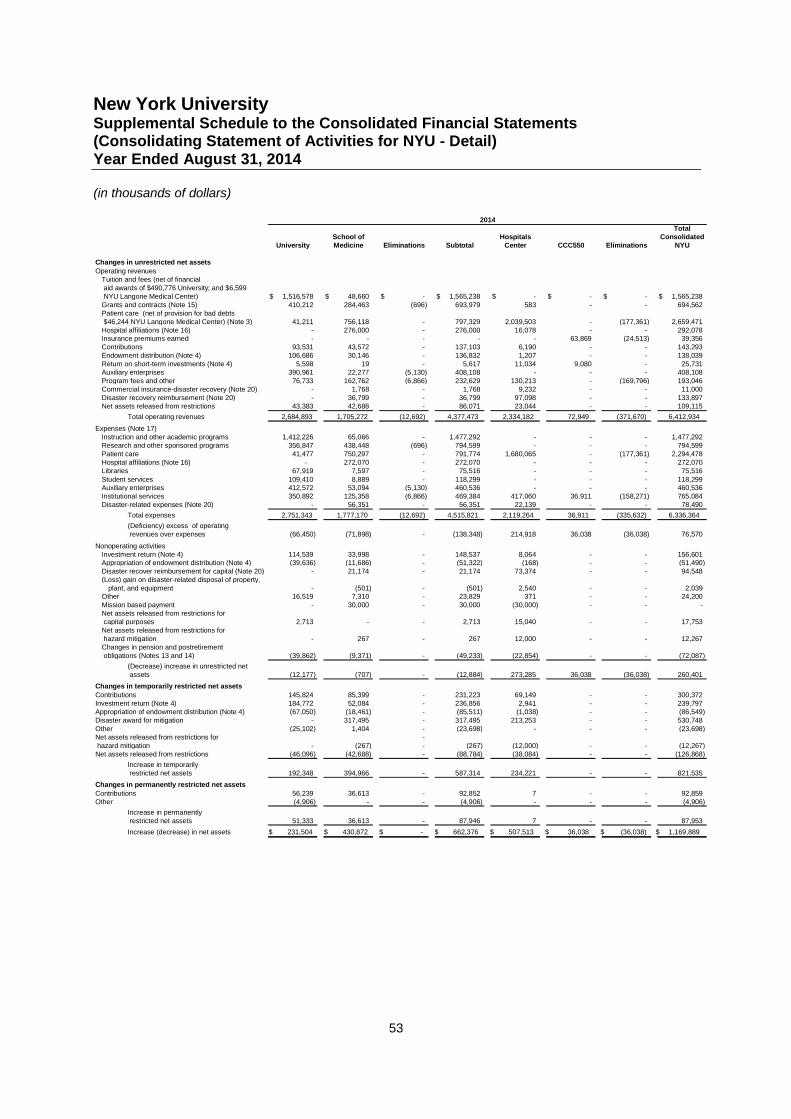
New York UniversitySupplemental Schedule to the Consolidated Financial Statements(Consolidating Statement of Activities for NYU - Detail)Year Ended August 31, 2014
(in thousands of dollars)
53
TotalSchool of Hospitals Consolidated
University Medicine Eliminations Subtotal Center CCC550 Eliminations NYU
Changes in unrestricted net assetsOperating revenues
Tuition and fees (net of financialaid awards of $490,776 University; and $6,599NYU Langone Medical Center) 1,516,578$ 48,660$ -$ 1,565,238$ -$ -$ -$ 1,565,238$Grants and contracts (Note 15) 410,212 284,463 (696) 693,979 583 - - 694,562Patient care (net of provision for bad debts$46,244 NYU Langone Medical Center) (Note 3) 41,211 756,118 - 797,329 2,039,503 - (177,361) 2,659,471Hospital affiliations (Note 16) - 276,000 - 276,000 16,078 - - 292,078Insurance premiums earned - - - - - 63,869 (24,513) 39,356Contributions 93,531 43,572 - 137,103 6,190 - - 143,293Endowment distribution (Note 4) 106,686 30,146 - 136,832 1,207 - - 138,039Return on short-term investments (Note 4) 5,598 19 - 5,617 11,034 9,080 - 25,731Auxiliary enterprises 390,961 22,277 (5,130) 408,108 - - - 408,108Program fees and other 76,733 162,762 (6,866) 232,629 130,213 - (169,796) 193,046Commercial insurance-disaster recovery (Note 20) - 1,768 - 1,768 9,232 - - 11,000Disaster recovery reimbursement (Note 20) - 36,799 - 36,799 97,098 - - 133,897Net assets released from restrictions 43,383 42,688 - 86,071 23,044 - - 109,115
Total operating revenues 2,684,893 1,705,272 (12,692) 4,377,473 2,334,182 72,949 (371,670) 6,412,934
Expenses (Note 17)Instruction and other academic programs 1,412,226 65,066 - 1,477,292 - - - 1,477,292Research and other sponsored programs 356,847 438,448 (696) 794,599 - - - 794,599Patient care 41,477 750,297 - 791,774 1,680,065 - (177,361) 2,294,478Hospital affiliations (Note 16) - 272,070 - 272,070 - - - 272,070Libraries 67,919 7,597 - 75,516 - - - 75,516Student services 109,410 8,889 - 118,299 - - - 118,299Auxiliary enterprises 412,572 53,094 (5,130) 460,536 - - - 460,536Institutional services 350,892 125,358 (6,866) 469,384 417,060 36,911 (158,271) 765,084Disaster-related expenses (Note 20) - 56,351 - 56,351 22,139 - - 78,490
Total expenses 2,751,343 1,777,170 (12,692) 4,515,821 2,119,264 36,911 (335,632) 6,336,364
(Deficiency) excess of operatingrevenues over expenses (66,450) (71,898) - (138,348) 214,918 36,038 (36,038) 76,570
Nonoperating activitiesInvestment return (Note 4) 114,539 33,998 - 148,537 8,064 - - 156,601Appropriation of endowment distribution (Note 4) (39,636) (11,686) - (51,322) (168) - - (51,490)Disaster recover reimbursement for capital (Note 20) - 21,174 - 21,174 73,374 - - 94,548(Loss) gain on disaster-related disposal of property,
plant, and equipment - (501) - (501) 2,540 - - 2,039Other 16,519 7,310 - 23,829 371 - - 24,200Mission based payment - 30,000 - 30,000 (30,000) - - -Net assets released from restrictions forcapital purposes 2,713 - - 2,713 15,040 - - 17,753Net assets released from restrictions forhazard mitigation - 267 - 267 12,000 - - 12,267Changes in pension and postretirementobligations (Notes 13 and 14) (39,862) (9,371) - (49,233) (22,854) - - (72,087)
(Decrease) increase in unrestricted netassets (12,177) (707) - (12,884) 273,285 36,038 (36,038) 260,401
Changes in temporarily restricted net assetsContributions 145,824 85,399 - 231,223 69,149 - - 300,372Investment return (Note 4) 184,772 52,084 - 236,856 2,941 - - 239,797Appropriation of endowment distribution (Note 4) (67,050) (18,461) - (85,511) (1,038) - - (86,549)Disaster award for mitigation - 317,495 - 317,495 213,253 - - 530,748Other (25,102) 1,404 - (23,698) - - - (23,698)Net assets released from restrictions for -hazard mitigation - (267) - (267) (12,000) - - (12,267)Net assets released from restrictions (46,096) (42,688) - (88,784) (38,084) - - (126,868)
Increase in temporarilyrestricted net assets 192,348 394,966 - 587,314 234,221 - - 821,535
Changes in permanently restricted net assetsContributions 56,239 36,613 - 92,852 7 - - 92,859Other (4,906) - - (4,906) - - - (4,906)
Increase in permanentlyrestricted net assets 51,333 36,613 - 87,946 7 - - 87,953
Increase (decrease) in net assets 231,504$ 430,872$ -$ 662,376$ 507,513$ 36,038$ (36,038)$ 1,169,889$
2014


![New York New York [Big Band]](https://img.pdfslide.us/doc/110x75/55cf9017550346703ba2dc98/new-york-new-york-big-band-56499fb54c27d.jpg)