Embed Size (px)
Citation preview
NEW YORK STATE LOTTERY Financial Statements and Supplementary Information Years Ended March 31, 2017 and 2016 With Independent Auditor’s Report
NEW YORK STATE LOTTERY Financial Statements and Supplementary Information Years Ended March 31, 2017 and 2016
TABLE OF CONTENTS Page(s) INDEPENDENT AUDITOR’S REPORT 1−2 MANAGEMENT’S DISCUSSION AND ANALYSIS (UNAUDITED) 3–8 FINANCIAL STATEMENTS Statements of Net Position 9 Statements of Revenue, Expenses, and Changes in Net Position 10 Statements of Cash Flows 11 Notes to Financial Statements 12−33 REQUIRED SUPPLEMENTARY INFORMATION (UNAUDITED) Schedule of the Lottery’s Proportionate Share of the Net Pension Liability for New York State and Local Employees’ Retirement System 34 Schedule of the Lottery’s Contributions for New York State and Local Employees’ Retirement System 34
One Battery Park Plaza New York, NY 10004
T +1 212 709 4500 F +1 212 709 4680
1 mitchelltitus.com
INDEPENDENT AUDITOR’S REPORT Gaming Commissioners and Senior Management The New York State Gaming Commission Report on the Financial Statements We have audited the accompanying statements of net position of the New York State Lottery (the Lottery), an enterprise fund of the State of New York, as of March 31, 2017 and 2016, and the related statements of revenue, expenses, and change in net position and cash flows for the years then ended, and the related notes to the basic financial statements. Management’s Responsibility for the Financial Statements Management is responsible for the preparation and fair presentation of these financial statements in accordance with accounting principles generally accepted in the United States of America; this includes the design, implementation, and maintenance of internal control relevant to the preparation and fair presentation of financial statements that are free from material misstatement, whether due to fraud or error. Auditor’s Responsibility Our responsibility is to express an opinion on these financial statements based on our audits. We conducted our audits in accordance with auditing standards generally accepted in the United States of America. Those standards require that we plan and perform the audits to obtain reasonable assurance about whether the financial statements are free from material misstatement. An audit involves performing procedures to obtain audit evidence about the amounts and disclosures in the financial statements. The procedures selected depend on the auditors’ judgment, including the assessment of the risks of material misstatement of the financial statements, whether due to fraud or error. In making those risk assessments, the auditor considers internal control relevant to the entity’s preparation and fair presentation of the financial statements in order to design audit procedures that are appropriate in the circumstances, but not for the purpose of expressing an opinion on the effectiveness of the entity’s internal control. Accordingly, we express no such opinion. An audit also includes evaluating the appropriateness of accounting policies used and the reasonableness of significant accounting estimates made by management, as well as evaluating the overall presentation of the financial statements.
2
We believe that the audit evidence we have obtained is sufficient and appropriate to provide a basis for our audit opinion. Opinion In our opinion, the financial statements referred to above present fairly, in all material respects, the financial position of the New York State Lottery as of March 31, 2017 and 2016, and the change in its financial position and its cash flows for the years then ended in accordance with accounting principles generally accepted in the United States of America. Emphasis of Matter As discussed in Note 1, the Lottery’s financial statements present only the New York State Lottery enterprise fund of the State of New York and do not purport to, and do not, present fairly the financial position of the State of New York, as of March 31, 2017 and 2016, the change in its financial position, or, where applicable, its cash flows for the years then ended in conformity with accounting principles generally accepted in the United States of America. Our opinion is not modified with respect to this matter. Required Supplementary Information Accounting principles generally accepted in the United States of America require that the management’s discussion and analysis, the required schedules of the Lottery’s proportionate share of the net pension liability and the Lottery’s contributions for the New York State and Local Employees’ Retirement System on pages 3 through 8 and 34 be presented to supplement the basic financial statements. Such information, although not a part of the basic financial statements, is required by the Governmental Accounting Standards Board who considers it to be an essential part of financial reporting for placing the basic financial statements in an appropriate operational, economic, or historical context. We have applied certain limited procedures to the required supplementary information in accordance with auditing standards generally accepted in the United States of America, which consisted of inquiries of management about the methods of preparing the information and comparing the information for consistency with management’s responses to our inquiries, the basic financial statements, and other knowledge we obtained during our audit of the basic financial statements. We do not express an opinion or provide any assurance on the information because the limited procedures do not provide us with sufficient evidence to express an opinion or provide any assurance.
July 19, 2017
MANAGEMENT’S DISCUSSION AND ANALYSIS (UNAUDITED)
3
The management of the New York State Lottery (New York Lottery or Lottery) offers readers the following general overview and analysis of the New York Lottery’s financial position and activities for the fiscal years ended March 31, 2017 and 2016. We encourage readers to consider this information in conjunction with the detailed financial statements and explanatory notes that follow. The New York Lottery’s basic financial statements for the fiscal years ended March 31, 2017 and 2016 have been prepared in accordance with accounting principles generally accepted in the United States of America. FINANCIAL HIGHLIGHTS New York Lottery revenues totaled $9.676 billion, while net proceeds earned for Lottery Aid
to Education reached $3.268 billion for fiscal year 2017. New York Lottery revenues, net in fiscal year 2017 were less than the net revenues of 2016
by $14.8 million, or 0.2%. In fiscal year 2016, the annual revenue increased by $534.2 million, or 5.8%.
Net proceeds earned for Lottery Aid to Education in fiscal year 2017 were less than the net
proceeds of 2016 by $33.9 million, or 1.0%. Comparatively, the annual earnings for education in fiscal year 2016 were greater than the net proceeds of 2015 by $191.2 million, or 6.1%.
Prize expense increased by $9.4 million, or 0.2%, during fiscal year 2017. Prize expense
increased by $232.8 million or 5.3% during fiscal year 2016. Prize expense generally follows the changes occurring in sales of the corresponding games.
Operating income decreased by $30.4 million, or 0.9%, during fiscal year 2017. Operating
income increased by $218.8 million, or 7.1%, during fiscal year 2016. Nonoperating expenses increased by $47.1 million during fiscal year 2017 after increasing
by $102.1 million during fiscal year 2016. Changes in this category are generally the result of unrealized gains/losses on investments, which can change by large amounts in either direction from year to year.
Working capital (current assets minus current liabilities) increased by $23.9 million in fiscal
year 2017 after increasing by $38.1 million in fiscal year 2016. OVERVIEW OF FINANCIAL STATEMENTS The New York Lottery presents its financial statements using the accrual basis of accounting, which is comparable to the method used by many private sector businesses. The accrual basis recognizes revenues when earned, not when received. Likewise, expenses are recognized when incurred, not when paid. The Lottery prepares the following three financial statements for fiscal years 2017 and 2016:
MANAGEMENT’S DISCUSSION AND ANALYSIS (UNAUDITED)
4
OVERVIEW OF FINANCIAL STATEMENTS (continued) Statements of Net Position – This statement provides information on the nature and amount of the Lottery’s assets, deferred outflow of resources, liabilities, deferred inflows of resources and net position at the close of fiscal years 2017 and 2016. The relationship of assets and deferred outflow of resources to liabilities and deferred inflows of resources and resulting net position is one indicator of the financial condition of the Lottery and can also be a reflection of changes within the Lottery. Statements of Revenue, Expenses, and Changes in Net Position – This statement reflects the Lottery’s operating and nonoperating revenues and expenses and the change in net position for the year. Statements of Cash Flows – This statement is presented on the direct method of reporting and reflects cash flows from operating activities as well as capital and noncapital financing and investing activities. Cash collections and payments are reflected in this statement to arrive at the net increase or decrease in cash and cash equivalents for the year. The above-mentioned financial statements, the notes to the financial statements and this management’s discussion and analysis provide information about the Lottery’s overall financial condition. This management’s discussion and analysis is meant to be an introduction to the financial statements and to assist readers in understanding the results of the operations and the financial condition of the New York Lottery. The notes to the financial statements are an integral part of the statements and include additional data and explanations, which are to be used in concert with the financial statements. Following the notes to the financial statements are pension schedules, presented as Required Supplementary Information, which provide details on the Lottery’s net pension liability and contributions. The New York Lottery deposits its net proceeds into six accounts held in joint custody by the Commissioner of Taxation and Finance and the State Comptroller. These six accounts and the purpose of the funds are as follows: Lottery Education Account – Accumulates the required deposits for Aid to Education from
revenues, not including video gaming revenues. Prize Pending Account – Consists of Lottery prizes claimed but not yet been paid from
revenues, excluding video gaming revenues. Administration Account – Utilized to pay for the Lottery’s administrative costs that are not
related to or funded by video gaming revenues. Video Gaming Education Account – Accumulates the required deposits for Aid to Education
from video gaming operations. Video Gaming Prize Pending Account – Consists of video gaming prizes awarded that have
not yet been claimed.
MANAGEMENT’S DISCUSSION AND ANALYSIS (UNAUDITED)
5
OVERVIEW OF FINANCIAL STATEMENTS (continued) Video Gaming Administration Account – Utilized to pay the administrative costs of video
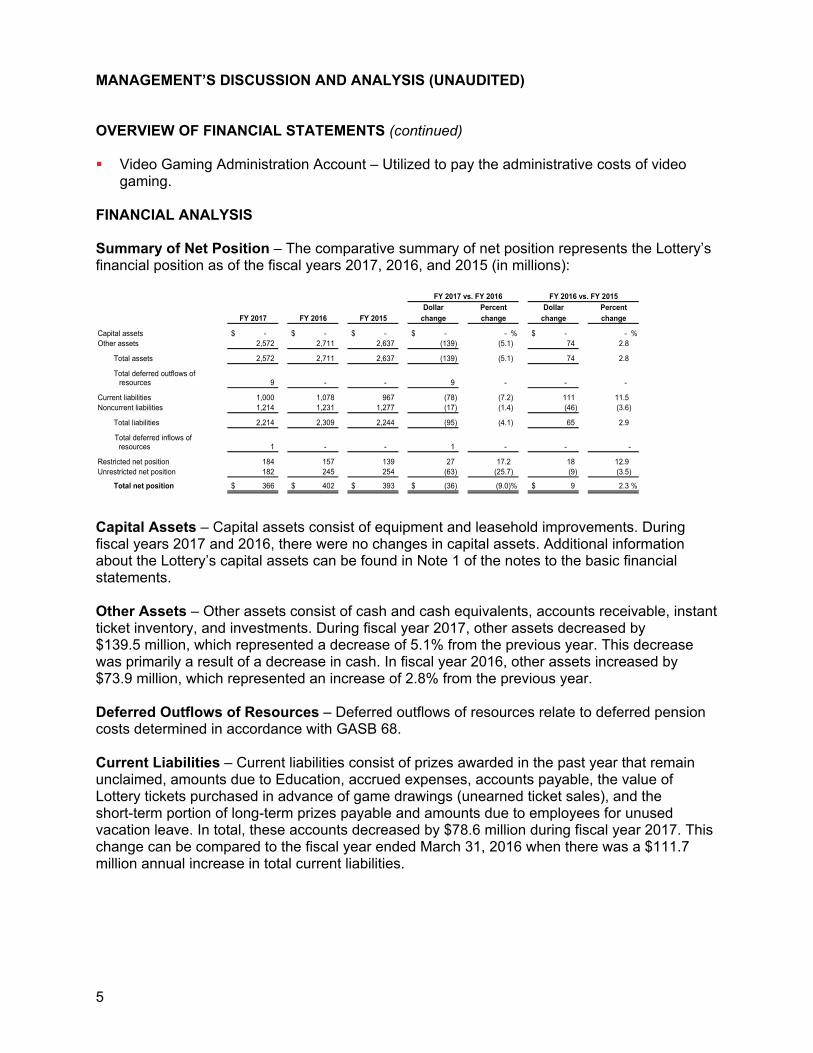
gaming. FINANCIAL ANALYSIS Summary of Net Position – The comparative summary of net position represents the Lottery’s financial position as of the fiscal years 2017, 2016, and 2015 (in millions):
FY 2017 vs. FY 2016 FY 2016 vs. FY 2015
Dollar Percent Dollar PercentFY 2017 FY 2016 FY 2015 change change change change
Capital assets -$ -$ -$ -$ - % -$ - %Other assets 2,572 2,711 2,637 (139) (5.1) 74 2.8
Total assets 2,572 2,711 2,637 (139) (5.1) 74 2.8
Total deferred outflows of resources 9 - - 9 - - -
Current liabilities 1,000 1,078 967 (78) (7.2) 111 11.5 Noncurrent liabilities 1,214 1,231 1,277 (17) (1.4) (46) (3.6)
Total liabilities 2,214 2,309 2,244 (95) (4.1) 65 2.9
Total deferred inflows of resources 1 - - 1 - - -
Restricted net position 184 157 139 27 17.2 18 12.9 Unrestricted net position 182 245 254 (63) (25.7) (9) (3.5)
Total net position 366$ 402$ 393$ (36)$ (9.0)% 9$ 2.3 %
Capital Assets – Capital assets consist of equipment and leasehold improvements. During fiscal years 2017 and 2016, there were no changes in capital assets. Additional information about the Lottery’s capital assets can be found in Note 1 of the notes to the basic financial statements. Other Assets – Other assets consist of cash and cash equivalents, accounts receivable, instant ticket inventory, and investments. During fiscal year 2017, other assets decreased by $139.5 million, which represented a decrease of 5.1% from the previous year. This decrease was primarily a result of a decrease in cash. In fiscal year 2016, other assets increased by $73.9 million, which represented an increase of 2.8% from the previous year. Deferred Outflows of Resources – Deferred outflows of resources relate to deferred pension costs determined in accordance with GASB 68. Current Liabilities – Current liabilities consist of prizes awarded in the past year that remain unclaimed, amounts due to Education, accrued expenses, accounts payable, the value of Lottery tickets purchased in advance of game drawings (unearned ticket sales), and the short-term portion of long-term prizes payable and amounts due to employees for unused vacation leave. In total, these accounts decreased by $78.6 million during fiscal year 2017. This change can be compared to the fiscal year ended March 31, 2016 when there was a $111.7 million annual increase in total current liabilities.
MANAGEMENT’S DISCUSSION AND ANALYSIS (UNAUDITED)
6
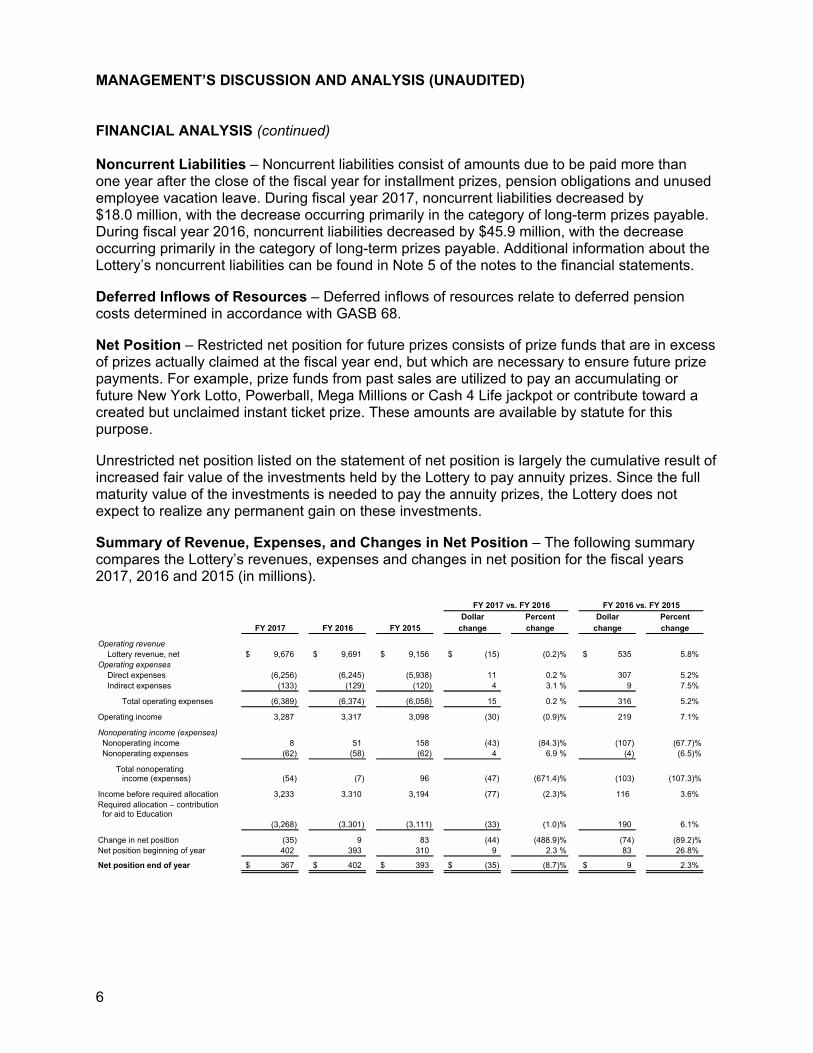
FINANCIAL ANALYSIS (continued) Noncurrent Liabilities – Noncurrent liabilities consist of amounts due to be paid more than one year after the close of the fiscal year for installment prizes, pension obligations and unused employee vacation leave. During fiscal year 2017, noncurrent liabilities decreased by $18.0 million, with the decrease occurring primarily in the category of long-term prizes payable. During fiscal year 2016, noncurrent liabilities decreased by $45.9 million, with the decrease occurring primarily in the category of long-term prizes payable. Additional information about the Lottery’s noncurrent liabilities can be found in Note 5 of the notes to the financial statements. Deferred Inflows of Resources – Deferred inflows of resources relate to deferred pension costs determined in accordance with GASB 68. Net Position – Restricted net position for future prizes consists of prize funds that are in excess of prizes actually claimed at the fiscal year end, but which are necessary to ensure future prize payments. For example, prize funds from past sales are utilized to pay an accumulating or future New York Lotto, Powerball, Mega Millions or Cash 4 Life jackpot or contribute toward a created but unclaimed instant ticket prize. These amounts are available by statute for this purpose. Unrestricted net position listed on the statement of net position is largely the cumulative result of increased fair value of the investments held by the Lottery to pay annuity prizes. Since the full maturity value of the investments is needed to pay the annuity prizes, the Lottery does not expect to realize any permanent gain on these investments. Summary of Revenue, Expenses, and Changes in Net Position – The following summary compares the Lottery’s revenues, expenses and changes in net position for the fiscal years 2017, 2016 and 2015 (in millions).
FY 2017 vs. FY 2016 FY 2016 vs. FY 2015Dollar Percent Dollar Percent
FY 2017 FY 2016 FY 2015 change change change change
Operating revenueLottery revenue, net 9,676$ 9,691$ 9,156$ (15)$ (0.2)% 535$ 5.8%
Operating expensesDirect expenses (6,256) (6,245) (5,938) 11 0.2 % 307 5.2%Indirect expenses (133) (129) (120) 4 3.1 % 9 7.5%
Total operating expenses (6,389) (6,374) (6,058) 15 0.2 % 316 5.2%
Operating income 3,287 3,317 3,098 (30) (0.9)% 219 7.1%
Nonoperating income (expenses) Nonoperating income 8 51 158 (43) (84.3)% (107) (67.7)% Nonoperating expenses (62) (58) (62) 4 6.9 % (4) (6.5)%
Total nonoperatingincome (expenses) (54) (7) 96 (47) (671.4)% (103) (107.3)%
Income before required allocation 3,233 3,310 3,194 (77) (2.3)% 116 3.6%Required allocation – contribution for aid to Education
(3,268) (3,301) (3,111) (33) (1.0)% 190 6.1%
Change in net position (35) 9 83 (44) (488.9)% (74) (89.2)%Net position beginning of year 402 393 310 9 2.3 % 83 26.8%
Net position end of year 367$ 402$ 393$ (35)$ (8.7)% 9$ 2.3%
MANAGEMENT’S DISCUSSION AND ANALYSIS (UNAUDITED)
7
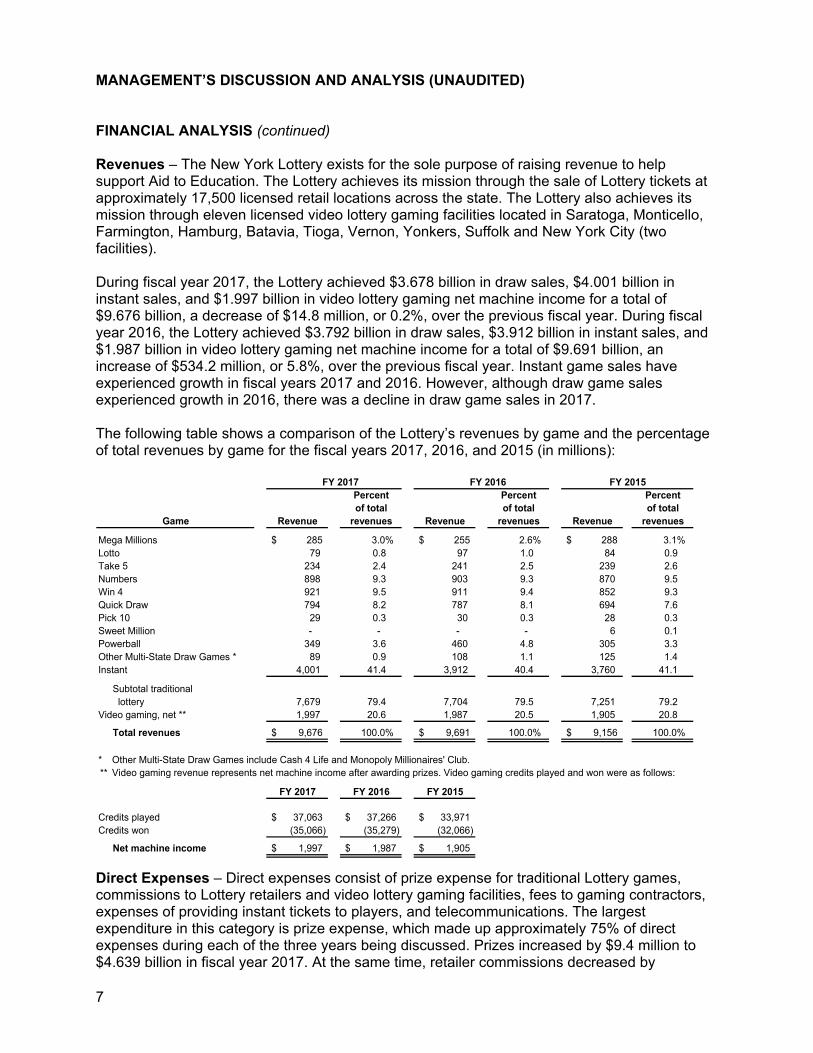
FINANCIAL ANALYSIS (continued) Revenues – The New York Lottery exists for the sole purpose of raising revenue to help support Aid to Education. The Lottery achieves its mission through the sale of Lottery tickets at approximately 17,500 licensed retail locations across the state. The Lottery also achieves its mission through eleven licensed video lottery gaming facilities located in Saratoga, Monticello, Farmington, Hamburg, Batavia, Tioga, Vernon, Yonkers, Suffolk and New York City (two facilities). During fiscal year 2017, the Lottery achieved $3.678 billion in draw sales, $4.001 billion in instant sales, and $1.997 billion in video lottery gaming net machine income for a total of $9.676 billion, a decrease of $14.8 million, or 0.2%, over the previous fiscal year. During fiscal year 2016, the Lottery achieved $3.792 billion in draw sales, $3.912 billion in instant sales, and $1.987 billion in video lottery gaming net machine income for a total of $9.691 billion, an increase of $534.2 million, or 5.8%, over the previous fiscal year. Instant game sales have experienced growth in fiscal years 2017 and 2016. However, although draw game sales experienced growth in 2016, there was a decline in draw game sales in 2017. The following table shows a comparison of the Lottery’s revenues by game and the percentage of total revenues by game for the fiscal years 2017, 2016, and 2015 (in millions):
FY 2017 FY 2016 FY 2015Percent Percent Percentof total of total of total
Game Revenue revenues Revenue revenues Revenue revenues
Mega Millions 285$ 3.0% 255$ 2.6% 288$ 3.1% Lotto 79 0.8 97 1.0 84 0.9 Take 5 234 2.4 241 2.5 239 2.6 Numbers 898 9.3 903 9.3 870 9.5 Win 4 921 9.5 911 9.4 852 9.3 Quick Draw 794 8.2 787 8.1 694 7.6 Pick 10 29 0.3 30 0.3 28 0.3 Sweet Million - - - - 6 0.1 Powerball 349 3.6 460 4.8 305 3.3 Other Multi-State Draw Games * 89 0.9 108 1.1 125 1.4 Instant 4,001 41.4 3,912 40.4 3,760 41.1
Subtotal traditional lottery 7,679 79.4 7,704 79.5 7,251 79.2
Video gaming, net ** 1,997 20.6 1,987 20.5 1,905 20.8
Total revenues 9,676$ 100.0% 9,691$ 100.0% 9,156$ 100.0%
* Other Multi-State Draw Games include Cash 4 Life and Monopoly Millionaires' Club.**
FY 2017 FY 2016 FY 2015
Credits played 37,063$ 37,266$ 33,971$ Credits won (35,066) (35,279) (32,066)
Net machine income 1,997$ 1,987$ 1,905$
Video gaming revenue represents net machine income after awarding prizes. Video gaming credits played and won were as follows:
Direct Expenses – Direct expenses consist of prize expense for traditional Lottery games, commissions to Lottery retailers and video lottery gaming facilities, fees to gaming contractors, expenses of providing instant tickets to players, and telecommunications. The largest expenditure in this category is prize expense, which made up approximately 75% of direct expenses during each of the three years being discussed. Prizes increased by $9.4 million to $4.639 billion in fiscal year 2017. At the same time, retailer commissions decreased by
MANAGEMENT’S DISCUSSION AND ANALYSIS (UNAUDITED)
8
FINANCIAL ANALYSIS (continued) $1 million to $1.346 billion and gaming contractor fees decreased by $0.3 million to $226.8 million. Prizes increased by $232.8 million to $4.630 billion in fiscal year 2016. At the same time, retailer commissions increased by $63.9 million to $1.347 billion and gaming contractor fees increased by $7.4 million to $227.1 million. Indirect Expenses – Indirect expenses include marketing, state agency charges, personal services, fringe benefits and other administrative costs. These costs were $133.4 million during fiscal year 2017, which was 3.6% higher than the prior year. Corresponding costs in fiscal year 2016 were $128.8 million, which was 6.8% higher than in fiscal year 2015. Nonoperating Revenues (Expenses) – Nonoperating revenues and expenses consist of miscellaneous income plus the net growth or decline in the fair value of investments used to fund long-term prizes. Investment loss of $5.0 million in 2017, income of $49.5 million in 2016, and income of $148.9 million in 2015 consists of both the fair value adjustments of investments plus the normal growth of the value of Lottery investments as the securities move closer to maturity. The market-driven fair value adjustment, which is subject to considerable variance over time, is the primary factor in causing any large differences from year to year. Investment expense is a reflection of the Lottery expending the investment income to increase the valuation of the long-term prizes payable to winners. The annual fair value adjustment of investments flows to the unrestricted net position balance on the statement of net position. Income before Required Allocation and Change in Net Position – The revenues and expenses for fiscal year 2017 resulted in income before required allocation totaling $3.233 billion. This amount consists of a required allocation for Aid to Education of $3.268 billion that transfers out as a contribution for Aid to Education and an $35.1 million decrease in net position for the year. The $35.1 million decrease in net position is a combination of an $27.1 million increase in net position restricted for prizes and a $62.3 million decrease in unrestricted net position. The revenues and expenses for fiscal year 2016 resulted in income before required allocation totaling $3.310 billion. This amount consists of a required allocation for Aid to Education of $3.302 billion that transfers out as a contribution for Aid to Education and an $8.5 million increase in net position for the year. The $8.5 million increase in net position is a combination of an $18.0 million increase in net position restricted for prizes and a $9.5 million decrease in unrestricted net position. Summary and Outlook – As a mature business entity, the New York Lottery generally anticipates only moderate but steady growth from year to year. An opportunity to move beyond normal growth would not be expected unless there were an addition of new games or an expansion in gaming facilities. Contacting New York Lottery’s Financial Management – This financial report is designed to provide the State of New York, the public, and other interested parties with an overview of the financial results of the New York State Lottery and an explanation of the Lottery’s financial condition. If you have any questions about this report or require additional information, email [email protected] or write to The New York State Gaming Commission Communications Office, One Broadway Center, P.O. Box 7500, Schenectady, NY 12301-7500.
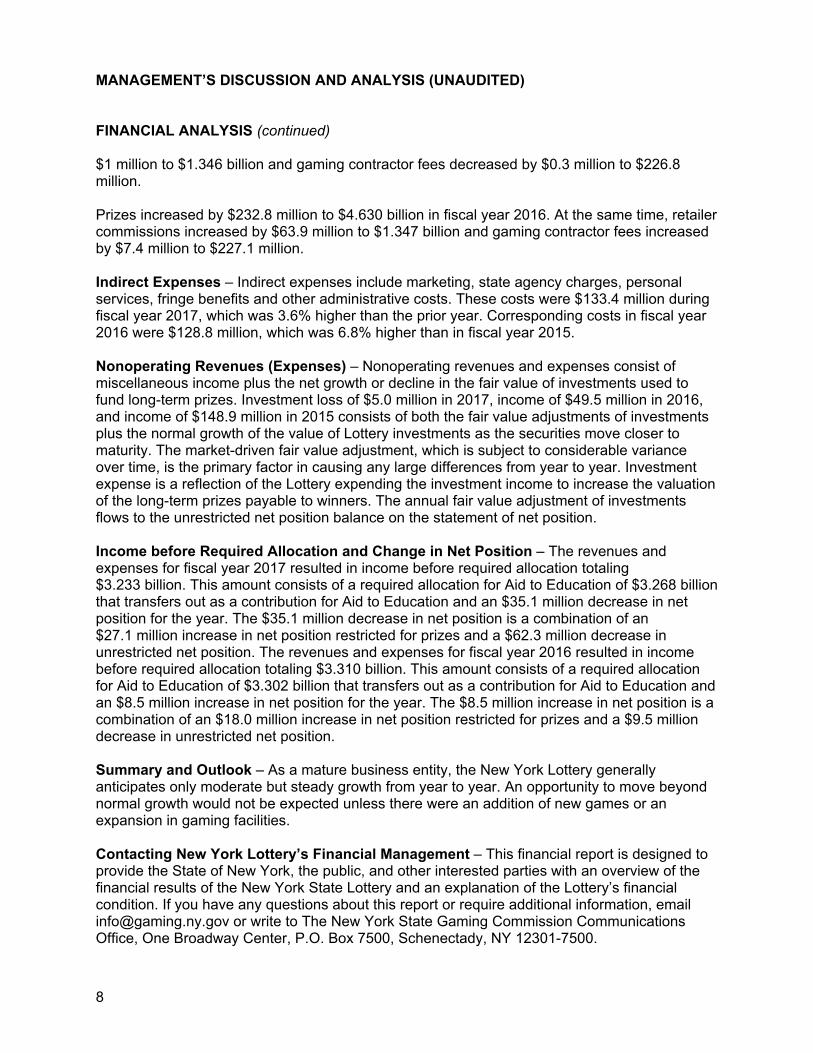
NEW YORK STATE LOTTERYStatements of Net PositionMarch 31, 2017 and 2016(In thousands)
2017 2016
ASSETSCurrent assets
Cash and cash equivalents 643,606$ 724,407$ Accounts receivable, net 476,862 455,443 Instant ticket inventory 11,848 10,273 Investments 102,696 99,667
Total current assets 1,235,012 1,289,790
Noncurrent assetsLong-term investments, net 1,336,488 1,421,189
Total noncurrent assets 1,336,488 1,421,189
Total assets 2,571,500 2,710,979
Deferred outflows of resources 9,190 442
Total assets and deferred outflows of resources 2,580,690 2,711,421
LIABILITIESCurrent liabilities
Prizes payable 130,808 130,207 Unclaimed prizes 550,596 582,709 Due to Education 292,970 346,081 Accounts payable and accrued liabilities 14,641 8,422 Unearned ticket sales 9,610 9,813 Compensated absences 1,119 1,157
Total current liabilities 999,744 1,078,389
Noncurrent liabilitiesCompensated absences 225 134 Pension contribution payable 2,161 2,667 Net pension liability 8,324 1,883 Long-term prizes payable 1,202,856 1,226,840
Total noncurrent liabilities 1,213,566 1,231,524
Total liabilities 2,213,310 2,309,913
Deferred inflows of resources 1,015 -
Total liabilities and deferred inflows of resources 2,214,325 2,309,913
NET POSITIONRestricted for future prizes 184,078 156,955 Unrestricted 182,287 244,553
Total net position 366,365$ 401,508$ See accompanying notes to basic financial statements.
9
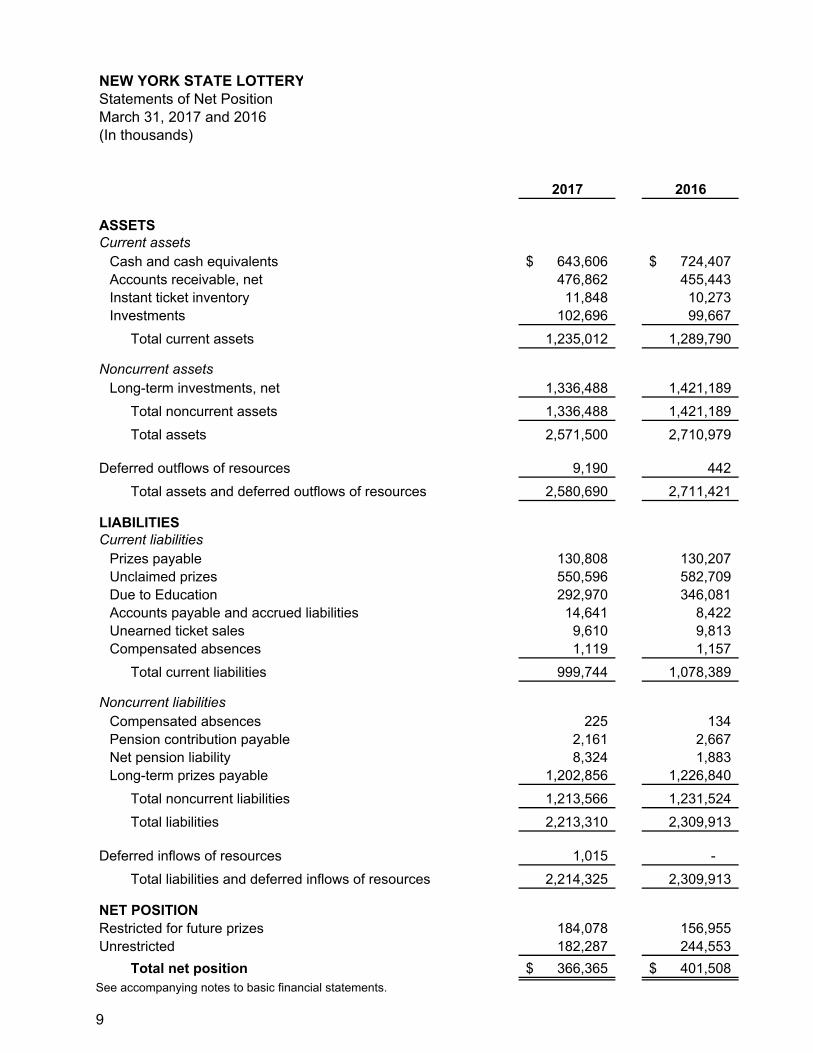
NEW YORK STATE LOTTERYStatements of Revenue, Expenses, and Changes in Net PositionYears Ended March 31, 2017 and 2016(In thousands)
2017 2016
OPERATING REVENUELottery revenue, net 9,675,722$ 9,690,511$
Operating expensesPrize expense, net (4,639,092) (4,629,657) Retailer commissions (1,345,525) (1,346,488) Gaming contractor fees (226,848) (227,116) Instant ticket direct expenses (25,739) (22,970) Telecommunications (18,588) (18,492)
Total direct expenses (6,255,792) (6,244,723)
Marketing and advertising expense (95,838) (85,620) Personal service and fringe benefits (25,150) (32,177) Other administrative costs (6,689) (5,273) State agency charges (5,700) (5,725)
Total indirect expenses (133,377) (128,795)
Total operating expenses (6,389,169) (6,373,518)
Operating income 3,286,553 3,316,993
NONOPERATING REVENUE (EXPENSES)Investment (loss) income (4,973) 49,542 Other revenue, net 7,773 2,102 Investment expense, net (56,613) (58,332)
Total nonoperating expenses, net (53,813) (6,688)
Income before required allocation 3,232,740 3,310,305 Required allocation for aid to Education (3,267,883) (3,301,780)
Change in net position (35,143) 8,525 Net position, beginning of year 401,508 392,983
Net position, end of year 366,365$ 401,508$
See accompanying notes to basic financial statements.
10
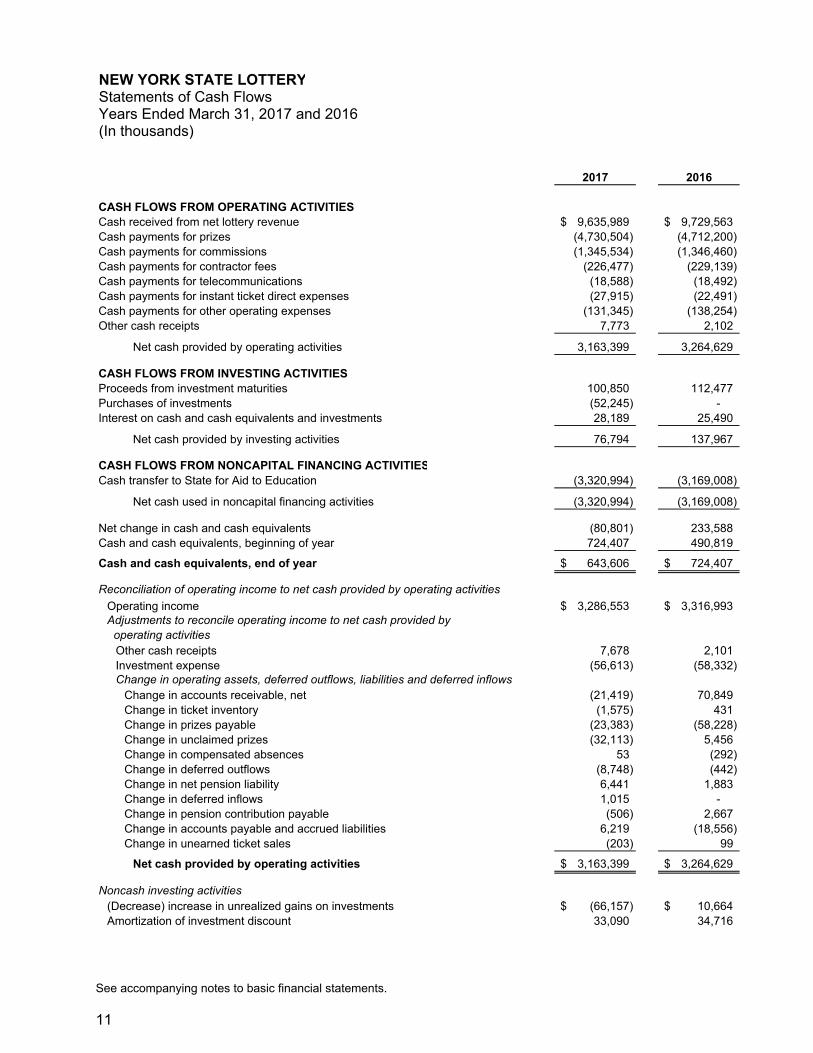
NEW YORK STATE LOTTERYStatements of Cash FlowsYears Ended March 31, 2017 and 2016(In thousands)
2017 2016
CASH FLOWS FROM OPERATING ACTIVITIESCash received from net lottery revenue 9,635,989$ 9,729,563$ Cash payments for prizes (4,730,504) (4,712,200) Cash payments for commissions (1,345,534) (1,346,460) Cash payments for contractor fees (226,477) (229,139) Cash payments for telecommunications (18,588) (18,492) Cash payments for instant ticket direct expenses (27,915) (22,491) Cash payments for other operating expenses (131,345) (138,254) Other cash receipts 7,773 2,102
Net cash provided by operating activities 3,163,399 3,264,629
CASH FLOWS FROM INVESTING ACTIVITIESProceeds from investment maturities 100,850 112,477 Purchases of investments (52,245) - Interest on cash and cash equivalents and investments 28,189 25,490
Net cash provided by investing activities 76,794 137,967
CASH FLOWS FROM NONCAPITAL FINANCING ACTIVITIESCash transfer to State for Aid to Education (3,320,994) (3,169,008)
Net cash used in noncapital financing activities (3,320,994) (3,169,008)
Net change in cash and cash equivalents (80,801) 233,588 Cash and cash equivalents, beginning of year 724,407 490,819
Cash and cash equivalents, end of year 643,606$ 724,407$
Reconciliation of operating income to net cash provided by operating activities
Operating income 3,286,553$ 3,316,993$ Adjustments to reconcile operating income to net cash provided by operating activities
Other cash receipts 7,678 2,101 Investment expense (56,613) (58,332) Change in operating assets, deferred outflows, liabilities and deferred inflows
Change in accounts receivable, net (21,419) 70,849 Change in ticket inventory (1,575) 431 Change in prizes payable (23,383) (58,228) Change in unclaimed prizes (32,113) 5,456 Change in compensated absences 53 (292) Change in deferred outflows (8,748) (442) Change in net pension liability 6,441 1,883 Change in deferred inflows 1,015 - Change in pension contribution payable (506) 2,667 Change in accounts payable and accrued liabilities 6,219 (18,556) Change in unearned ticket sales (203) 99
Net cash provided by operating activities 3,163,399$ 3,264,629$
Noncash investing activities(Decrease) increase in unrealized gains on investments (66,157)$ 10,664$ Amortization of investment discount 33,090 34,716
See accompanying notes to basic financial statements.
11
NEW YORK STATE LOTTERY Notes to Financial Statements Years Ended March 31, 2017 and 2016
12
NOTE 1 SUMMARY OF SIGNIFICANT ACCOUNTING POLICIES
The New York State Lottery (Lottery) was established in 1967. In 1976, the Lottery was placed under the Division of the Lottery, an independent unit of the New York State Department of Taxation and Finance, which operates in accordance with the provisions of the New York State Lottery for Education Law (Tax Law Article 34). On February 1, 2013, the Division of Lottery was merged with the New York State Racing and Wagering Board into a single oversight entity called the New York State Gaming Commission, which was given responsibility to administer traditional and video lottery games as part of its overall responsibility for regulation and enforcement of gaming activity in New York. The purpose of the Lottery is to raise revenue for education in the State of New York (State) through the administration of lottery games. These financial statements represent only the Lottery and do not present the financial position of the State nor changes in the State’s financial position and cash flows. However, the Lottery is included in the State of New York’s basic financial statements as an enterprise fund. The Lottery applies all applicable Governmental Accounting Standards Board (GASB) pronouncements and prepares its financial statements under the economic resources measurement focus, whereby all inflows, outflows and balances affecting net position are reported, and the accrual basis of accounting. Revenues are recognized when earned and expenses are recognized when incurred. The primary operating revenue of the Lottery is ticket sales from games. Nonoperating income consists mostly of investment income and unrealized gains on investments. Operating expenses consist of direct expenses for prizes, commissions to Lottery retailers, fees to gaming contractors, expenses for providing instant tickets to players, and telecommunications. Other operating expenses that are indirect to the results of each game include marketing, state agency charges, personal services, and fringe benefits. Nonoperating expense includes the amortization of the discount on long-term prizes payable. The more significant accounting policies of the Lottery are described below: Revenue Recognition (i) Draw Games Revenue from ticket sales for Lotto, Sweet Million, Quick Draw, Take 5, Pick
10, Mega Millions, Powerball, Cash 4 Life, Monopoly Millionaires’ Club, Numbers and Win-4 games, and promotional games (draw games) is recognized when the related drawing takes place. Receipts from subscription sales and other ticket sales for future drawings are recorded as unearned revenue and will not be recognized as revenue until the related drawings take place.
NEW YORK STATE LOTTERY Notes to Financial Statements Years Ended March 31, 2017 and 2016
13
NOTE 1 SUMMARY OF SIGNIFICANT ACCOUNTING POLICIES (continued)
Revenue Recognition (continued) (ii) Instant Games
Revenue from Instant Games is recognized based on the dollar value of the total number of tickets available for sale. Tickets are available for sale upon being activated on the Lottery Validation System at the retailer locations.
(iii) Video Gaming
Revenue from video lottery gaming is recognized based on net machine income, which is defined as amounts played less prizes won.
Prize Expense The Lottery recognizes prize expense for draw games equivalent to the actual prize liability incurred for each drawing. Prize expense for instant games is recognized when instant books are activated by retailers and is based on the percentage of sales allocated to prizes for each game. Video lottery revenue is reported net of prizes, so prize expense is not recognized on these games. Prize expense is adjusted accordingly for any prizes unclaimed within the time period allowed by law. Commissions and Fees Retailers selling draw and instant game tickets receive a commission of 6% based on the total tickets sold. Video gaming facilities receive a varying percent of incremental annual net machine income according to provisions of Section 1612 of the New York State Tax Law. The particular percent applied to a range of net machine income can vary depending on the facility’s number of video gaming machines, geographical area of the state, population level, or proximity to Native American gaming facilities. The draw game contractor and the video gaming central processing contractor receive fees equal to a contractual percentage of the sales generated through the network maintained by the respective contractor. The instant game contractor is paid a fee equal to a contractual percentage of instant sales. Video lottery terminal contractors receive a fee equal to a contractual percentage of revenue, adjusted for the units of service provided. All other gaming contractors are paid fees based on the units of service provided (see Note 13).
NEW YORK STATE LOTTERY Notes to Financial Statements Years Ended March 31, 2017 and 2016
14
NOTE 1 SUMMARY OF SIGNIFICANT ACCOUNTING POLICIES (continued) Accounts Receivable Accounts receivable primarily represent amounts due from retailers through a Lottery gaming contractor and amounts due from video lottery gaming facilities, net of commissions and fees, as well as amounts due from agents for Instant Game tickets that have been activated, but not yet settled. Instant ticket settlements occur within 45 days after a book of tickets is activated. Video lottery gaming receivables are received two business days after each sales day and draw games are collected within four business days after the close of each sales week. Allocation of Revenue from Ticket Sales The allocation of ticket sales is made in accordance with the provisions of the New York State Lottery for Education Law which requires: Allocations of ticket sales revenue to New York for educational purposes are
to be at least 20% for the New York State Lottery Instant Games, 30% for multi-state games such as Mega Millions, Powerball, Cash 4 Life and Monopoly Millionaires’ Club, 35% for Take 5, Numbers, Win-4, and Pick 10, 45% for Lotto, Sweet Million, and promotional games, and 25% for Quick Draw. In addition, the Lottery has statutory authority to issue up to five Instant Games per year with at least 10% for educational purposes. For video lottery, the required allocation to education is a varying percent of each facility’s annual incremental net machine income, depending on factors such as the facility’s number of video gaming machines, geographical area of the state, population level, and proximity to Native American gaming facilities.
Allocations of ticket sales revenue for the payment of lottery prizes are not to
exceed 65% for the New York State Lottery Instant Games, 55% for multi-state games such as Mega Millions, Powerball, Cash 4 Life and Monopoly Millionaires’ Club, 50% for Take 5, Numbers, Win-4, and Pick 10, 40% for Lotto and Sweet Million and 60% for Quick Draw. In addition, the Lottery has statutory authority to issue up to five Instant Games per year with up to 75% allocated to prizes. Video lottery is required to pay prizes that average no less than 90% of gross sales.
Allocations of ticket sales revenue from all traditional games for the payment
of Lottery administrative expenses (including agent commissions and contractor fees) are not to exceed 15%. For video lottery, 10% of net revenue (the total revenue wagered after payout for prizes) is allocated for Lottery Administration. Unlike traditional games, the video lottery administrative allocation does not include commissions and fees, which are described separately (see previously within Commissions and Fees). Any excess of the maximum allocation over actual administrative expenses is allocated to education. Such allocations amounted to approximately $484,551,680 and $497,419,000 for fiscal years 2017 and 2016, respectively. Administrative expenses incurred by the Lottery represent telecommunications, advertising, salary and other operating costs.
NEW YORK STATE LOTTERY Notes to Financial Statements Years Ended March 31, 2017 and 2016
15
NOTE 1 SUMMARY OF SIGNIFICANT ACCOUNTING POLICIES (continued)
Cash and Cash Equivalents
For purposes of the statements of cash flows, the Lottery considers cash equivalents to be amounts held with banks and amounts held under the joint custody of the Commissioner of Taxation and Finance and the Comptroller of the State of New York through the Short-Term Investment Pool, which is used for the temporary investment of funds not required for immediate payments.
Investments
Investments, consisting of U.S. Government-backed obligations (zero coupon bonds and stripped Government securities) and New York City Transitional Finance Authority municipal bonds, are carried at fair value. Investment income represents accretion of bond discount, interest on bonds and deposits, and the change in fair value of investments.
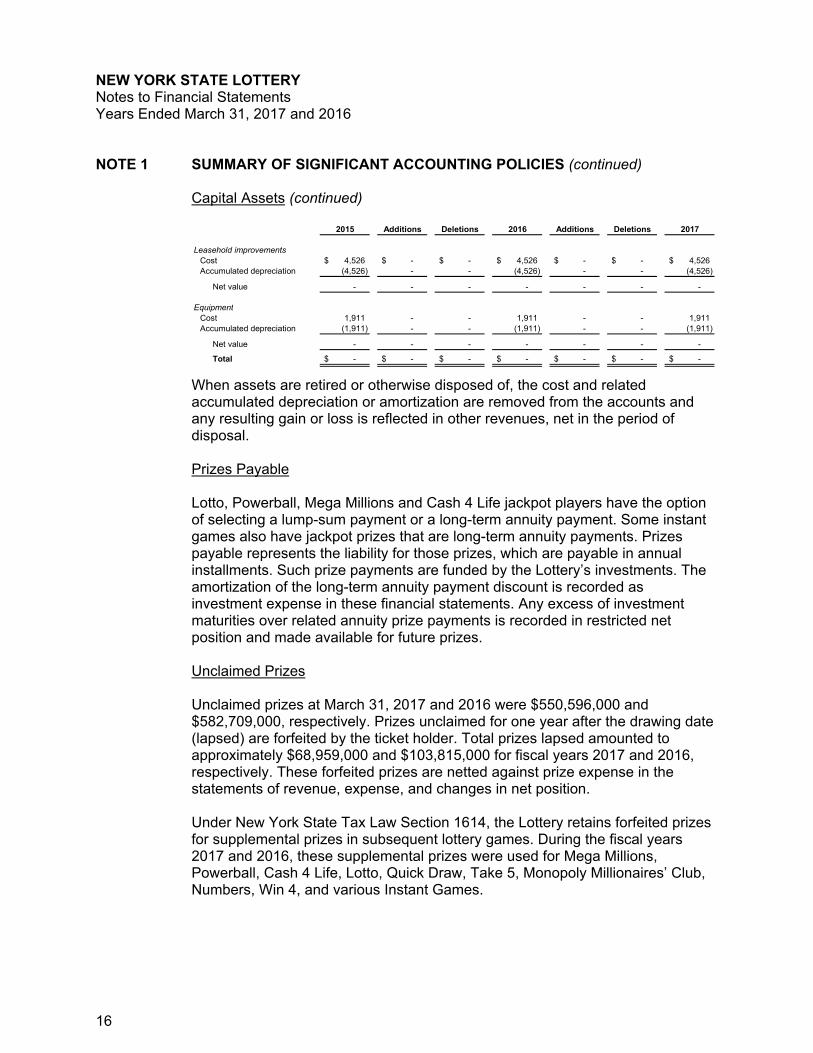
Inventory Instant game tickets are purchased from printing vendors. Tickets not activated for sale are held in inventory and are valued at cost by game. Tickets are charged to instant ticket direct expense under the first-in, first-out (FIFO) accounting method when activated for sale by the lottery retailers. At the conclusion of an instant game, unused inventory is charged to instant ticket direct expense. Capital Assets Capital assets consist of equipment and leasehold improvements, which are carried at historical cost. Equipment is capitalized when it has cost in excess of $40,000 and a useful life of two years or more. Leasehold improvements are capitalized when they have a cost of $100,000 or more. Depreciation of equipment is computed using the straight-line method over five years, the estimated useful lives of the assets. Leasehold improvements and equipment acquired under capital leases are amortized using the straight-line method over ten and five years, respectively, which is the lesser of their useful lives or the term of the leases. Changes in capital assets and related accumulated depreciation are shown in the table below, by major class of asset, for the years ended March 31, 2017 and 2016 (in thousands).
NEW YORK STATE LOTTERY Notes to Financial Statements Years Ended March 31, 2017 and 2016
16
NOTE 1 SUMMARY OF SIGNIFICANT ACCOUNTING POLICIES (continued)
Capital Assets (continued)
2015 Additions Deletions 2016 Additions Deletions 2017
Leasehold improvementsCost 4,526$ -$ -$ 4,526$ -$ -$ 4,526$ Accumulated depreciation (4,526) - - (4,526) - - (4,526)
Net value - - - - - - -
EquipmentCost 1,911 - - 1,911 - - 1,911 Accumulated depreciation (1,911) - - (1,911) - - (1,911)
Net value - - - - - - -
Total -$ -$ -$ -$ -$ -$ -$
When assets are retired or otherwise disposed of, the cost and related accumulated depreciation or amortization are removed from the accounts and any resulting gain or loss is reflected in other revenues, net in the period of disposal. Prizes Payable Lotto, Powerball, Mega Millions and Cash 4 Life jackpot players have the option of selecting a lump-sum payment or a long-term annuity payment. Some instant games also have jackpot prizes that are long-term annuity payments. Prizes payable represents the liability for those prizes, which are payable in annual installments. Such prize payments are funded by the Lottery’s investments. The amortization of the long-term annuity payment discount is recorded as investment expense in these financial statements. Any excess of investment maturities over related annuity prize payments is recorded in restricted net position and made available for future prizes. Unclaimed Prizes Unclaimed prizes at March 31, 2017 and 2016 were $550,596,000 and $582,709,000, respectively. Prizes unclaimed for one year after the drawing date (lapsed) are forfeited by the ticket holder. Total prizes lapsed amounted to approximately $68,959,000 and $103,815,000 for fiscal years 2017 and 2016, respectively. These forfeited prizes are netted against prize expense in the statements of revenue, expense, and changes in net position. Under New York State Tax Law Section 1614, the Lottery retains forfeited prizes for supplemental prizes in subsequent lottery games. During the fiscal years 2017 and 2016, these supplemental prizes were used for Mega Millions, Powerball, Cash 4 Life, Lotto, Quick Draw, Take 5, Monopoly Millionaires’ Club, Numbers, Win 4, and various Instant Games.
NEW YORK STATE LOTTERY Notes to Financial Statements Years Ended March 31, 2017 and 2016
17
NOTE 1 SUMMARY OF SIGNIFICANT ACCOUNTING POLICIES (continued)
Restricted Net Position Restricted net position for prizes includes forfeited prizes and other prize assets that are restricted under New York State Tax Law Sections 1612 and 1614 for the purpose of meeting future prize expense. Use of Estimates The preparation of financial statements in conformity with generally accepted accounting principles in the United States of America (U.S. GAAP) requires management to make estimates and assumptions that affect the amounts reported and disclosed in the financial statements and related notes. Actual results could differ from those estimates. Adoption of New Accounting Pronouncements
During the year ended March 31, 2016, the Lottery adopted GASB Statement No. 68, Accounting and Financial Reporting for Pensions. This Statement revises existing standards for measuring and reporting pension liabilities. For purposes of measuring the net pension liability, deferred outflows of resources and deferred inflows of resources related to pensions, and pension expense, and information about the fiduciary net position of the pension plan and addition to and deductions from the pension plan’s fiduciary net position have been determined on the same basis as they are reported by the State and Local Employees’ Retirement System (ERS). The GASB issued Statement No. 72, Fair Value Measurement and Application (GASB 72). GASB 72 addresses accounting and financial reporting issues related to fair value measurements. The definition of fair value is the price that would be received to sell an asset or paid to transfer a liability in an orderly transaction between market participants at the measurement date. GASB 72 provides guidance for determining a fair value measurement for financial reporting purposes. GASB 72 also provides guidance for applying fair value to certain investments and disclosures related to all fair value measurements. GASB 72 is effective for periods beginning after June 15, 2015. On April 1, 2016, the Lottery adopted and implemented GASB 72, and as of March 31, 2017, there was no material impact to the financial statement presentation and footnote disclosures as a result of adopting and implementing GASB 72.
NEW YORK STATE LOTTERY Notes to Financial Statements Years Ended March 31, 2017 and 2016
18
NOTE 1 SUMMARY OF SIGNIFICANT ACCOUNTING POLICIES (continued)
Adoption of New Accounting Pronouncements (continued)
During 2015, the GASB issued Statement No. 76, The Hierarchy of Generally Accepted Accounting Principles for State and Local Governments (GASB 76). The objective of GASB 76 is to identify—in the context of the current governmental financial reporting environment—the hierarchy of GAAP. The “GAAP hierarchy” consists of the sources of accounting principles used to prepare financial statements of state and local governmental entities in conformity with GAAP and the framework for selecting those principles. GASB 76 reduces the GAAP hierarchy to two categories of authoritative GAAP and addresses the use of authoritative and non-authoritative literature in the event that the accounting treatment for a transaction or other event is not specified within a source of authoritative GAAP. GASB 76 supersedes GASB Statement No. 55, The Hierarchy of Generally Accepted Accounting Principles for State and Local Governments. The requirements of GASB 76 are effective for financial statements for periods beginning after June 15, 2015, and should be applied retroactively. On April 1, 2016, the Lottery adopted and implemented GASB 76 and, as of March 31, 2017, there was no impact to the financial results of adopting and implementing GASB 76.
Recently Issued GASB Pronouncements The GASB issued Statement No. 75, Accounting and Financial Reporting for Postemployment Benefits Other Than Pensions (GASB 75). GASB 75 replaces the requirements of GASB Statement No. 45, Accounting and Financial Reporting by Employers for Postemployment Benefits Other Than Pensions, as amended, and GASB Statement No. 57, OPEB Measurements by Agent Employers and Agent Multiple-Employer Plans, for OPEB. GASB Statement No. 74, Financial Reporting for Postemployment Benefit Plans Other Than Pension Plans, establishes new accounting and financial reporting requirements for Other Post Employee Benefit (OPEB) plans. The scope of GASB 75 addresses accounting and financial reporting for OPEB Plans that are provided to the employees of state and local governmental employers. GASB 75 establishes standards for recognizing and measuring liabilities, deferred outflows of resources, deferred inflows of resources, and expense/expenditures. For defined benefit OPEB plans, GASB 75 identifies the methods and assumptions that are required to be used to project benefit payments, discount projected benefit payments to their actuarial present value, and attribute that present value to periods of employee service. Footnote disclosure and required supplementary information requirements about defined benefit OPEB plans also are addressed. GASB 74 is effective for fiscal years beginning after June 15, 2016. GASB 75 is effective for fiscal years beginning after June 15, 2017. Currently, the Lottery is evaluating the impact of GASB 75 on the financial statements.
NEW YORK STATE LOTTERY Notes to Financial Statements Years Ended March 31, 2017 and 2016
19
NOTE 1 SUMMARY OF SIGNIFICANT ACCOUNTING POLICIES (continued)
Recently Issued GASB Pronouncements (continued)
During 2016, the GASB issued Statement No. 82, Pension Issues an Amendment of GASB Statements No. 67, No. 68, and No. 73 (GASB 82). The objective of GASB 82 is to address certain issues that have been raised with respect to GASB Statements No. 67, Financial Reporting for Pension Plans, No. 68, Accounting and Financial Reporting for Pensions, and No. 73, Accounting and Financial Reporting for Pensions and Related Assets That Are Not within the Scope of GASB Statement 68, and Amendments to Certain Provisions of GASB Statements 67 and 68. Specifically, GASB 82 addresses issues regarding (1) the presentation of payroll-related measures in required supplementary information, (2) the selection of assumptions and the treatment of deviations from the guidance in an Actuarial Standard of Practice for financial reporting purposes, and (3) the classification of payments made by employers to satisfy employee (plan member) contribution requirements. The requirements of GASB 82 are effective for reporting periods beginning after June 15, 2016. Currently, the Lottery is evaluating the impact of GASB 82 on the financial statements, footnotes and required supplementary information.
NOTE 2 CASH AND CASH EQUIVALENTS
Lottery deposits of cash and cash equivalents are made in accordance with New York State Finance Law Sections 92c and 98a and New York State Tax Law Sections 1611 and 1612. Lottery sales receipts are allocated and deposited in separate fund accounts for prizes, education, and administration under the joint custody of the Commissioner of Taxation and Finance and the Comptroller of the State of New York. Per Section 98a of the New York State Finance Law, the accounts for prizes and administration earn interest through participation in a short-term investment pool (STIP) administered by the Office of the State Comptroller of the State of New York. The prize account interest is used for future lottery prizes. The STIP is reported at amortized cost, which approximates fair value. The valuation of the STIP is derived from unobservable inputs (Level 3), which primarily include New York State data and market participant assumptions particular to New York State. The carrying amount of the joint custody accounts included in cash and cash equivalents were $618,175,000 and $706,141,000 at March 31, 2017 and 2016, respectively.
The Lottery also maintains sole custody accounts that are used for daily cash management purposes. Interest-bearing cash accounts are Level 1 financial instruments and are based on quoted prices for similar assets. The Lottery manages the investment of its cash balances to minimize its uninvested funds. At March 31, 2017 and 2016, the amount of sole custody accounts included in cash and cash equivalents was $25,431,000 and $18,266,000, respectively.
NEW YORK STATE LOTTERY Notes to Financial Statements Years Ended March 31, 2017 and 2016
20
NOTE 2 CASH AND CASH EQUIVALENTS (continued)
The Lottery’s deposits are collateralized under a program administered by the Office of the State Comptroller of the State of New York. To manage custodial credit risk, the State requires that its depository banks pledge collateral based on available bank balances. All securities pledged as collateral are held by the State’s fiscal agent in the name of the State. The Lottery’s deposits with financial institutions were fully collateralized at fiscal year end. The Lottery manages custodial credit risk by using several financial institutions and by minimizing balances in the sole custody accounts.
NOTE 3 INVESTMENTS
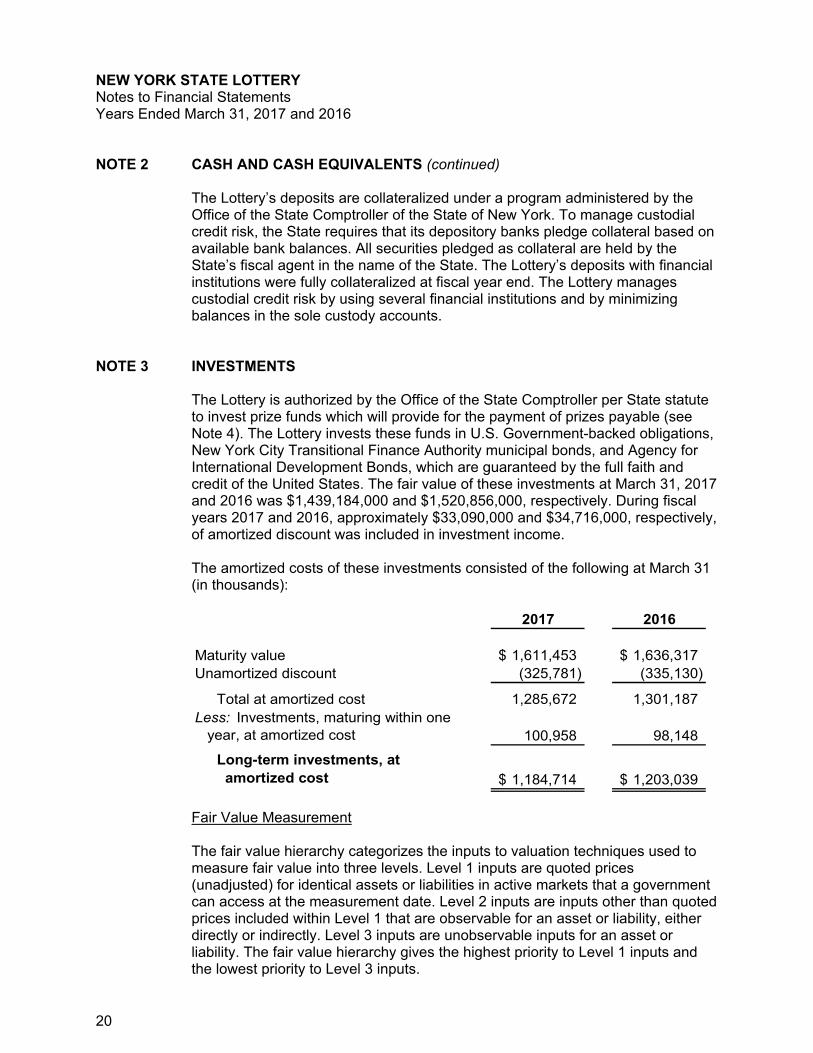
The Lottery is authorized by the Office of the State Comptroller per State statute to invest prize funds which will provide for the payment of prizes payable (see Note 4). The Lottery invests these funds in U.S. Government-backed obligations, New York City Transitional Finance Authority municipal bonds, and Agency for International Development Bonds, which are guaranteed by the full faith and credit of the United States. The fair value of these investments at March 31, 2017 and 2016 was $1,439,184,000 and $1,520,856,000, respectively. During fiscal years 2017 and 2016, approximately $33,090,000 and $34,716,000, respectively, of amortized discount was included in investment income.
The amortized costs of these investments consisted of the following at March 31 (in thousands):
2017 2016
Maturity value 1,611,453$ 1,636,317$ Unamortized discount (325,781) (335,130)
Total at amortized cost 1,285,672 1,301,187 Less: Investments, maturing within one year, at amortized cost 100,958 98,148
Long-term investments, at amortized cost 1,184,714$ 1,203,039$
Fair Value Measurement
The fair value hierarchy categorizes the inputs to valuation techniques used to measure fair value into three levels. Level 1 inputs are quoted prices (unadjusted) for identical assets or liabilities in active markets that a government can access at the measurement date. Level 2 inputs are inputs other than quoted prices included within Level 1 that are observable for an asset or liability, either directly or indirectly. Level 3 inputs are unobservable inputs for an asset or liability. The fair value hierarchy gives the highest priority to Level 1 inputs and the lowest priority to Level 3 inputs.
NEW YORK STATE LOTTERY Notes to Financial Statements Years Ended March 31, 2017 and 2016
21
NOTE 3 INVESTMENTS (continued)
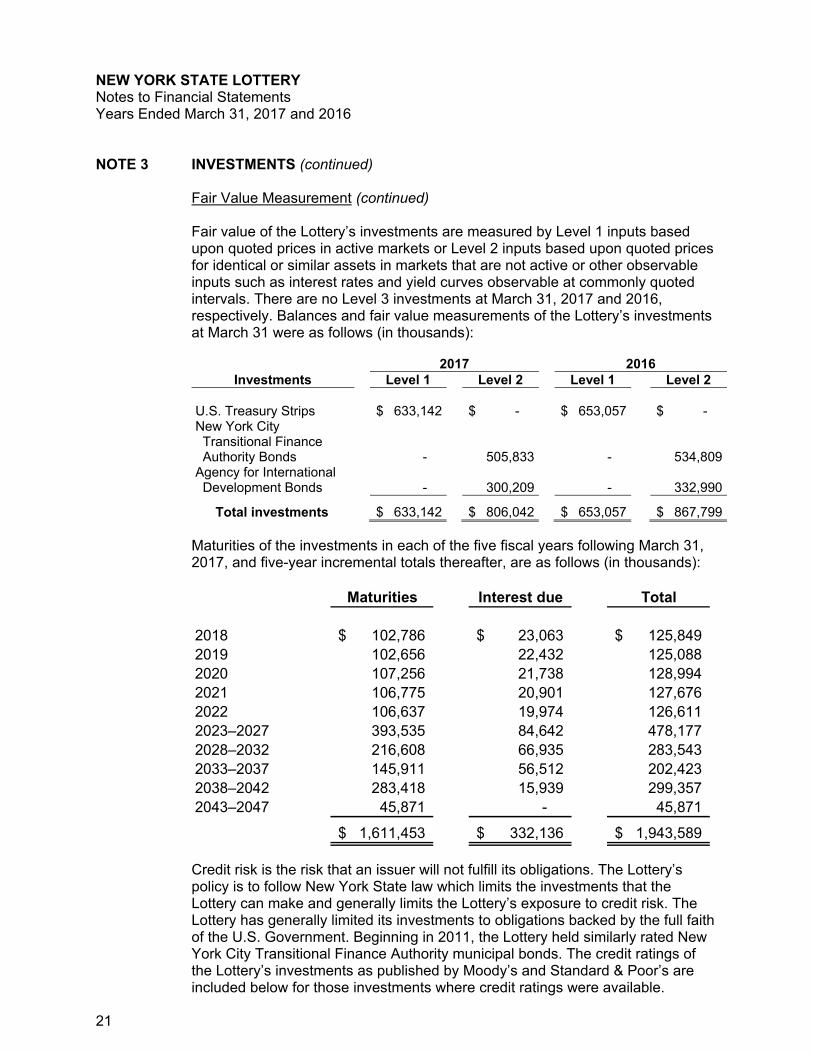
Fair Value Measurement (continued) Fair value of the Lottery’s investments are measured by Level 1 inputs based upon quoted prices in active markets or Level 2 inputs based upon quoted prices for identical or similar assets in markets that are not active or other observable inputs such as interest rates and yield curves observable at commonly quoted intervals. There are no Level 3 investments at March 31, 2017 and 2016, respectively. Balances and fair value measurements of the Lottery’s investments at March 31 were as follows (in thousands):
2017 2016
Investments Level 1 Level 2 Level 1 Level 2 U.S. Treasury Strips $ 633,142 $ - $ 653,057 $ - New York City Transitional Finance Authority Bonds -
505,833 -
534,809Agency for International Development Bonds
-
300,209 -
332,990
Total investments $ 633,142
$ 806,042 $ 653,057
$ 867,799
Maturities of the investments in each of the five fiscal years following March 31, 2017, and five-year incremental totals thereafter, are as follows (in thousands):
Maturities Interest due Total
2018 102,786$ 23,063$ 125,849$ 2019 102,656 22,432 125,088 2020 107,256 21,738 128,994 2021 106,775 20,901 127,676 2022 106,637 19,974 126,611 2023–2027 393,535 84,642 478,177 2028–2032 216,608 66,935 283,543 2033–2037 145,911 56,512 202,423 2038–2042 283,418 15,939 299,357 2043–2047 45,871 - 45,871
1,611,453$ 332,136$ 1,943,589$
Credit risk is the risk that an issuer will not fulfill its obligations. The Lottery’s policy is to follow New York State law which limits the investments that the Lottery can make and generally limits the Lottery’s exposure to credit risk. The Lottery has generally limited its investments to obligations backed by the full faith of the U.S. Government. Beginning in 2011, the Lottery held similarly rated New York City Transitional Finance Authority municipal bonds. The credit ratings of the Lottery’s investments as published by Moody’s and Standard & Poor’s are included below for those investments where credit ratings were available.
NEW YORK STATE LOTTERY Notes to Financial Statements Years Ended March 31, 2017 and 2016
22
NOTE 3 INVESTMENTS (continued)
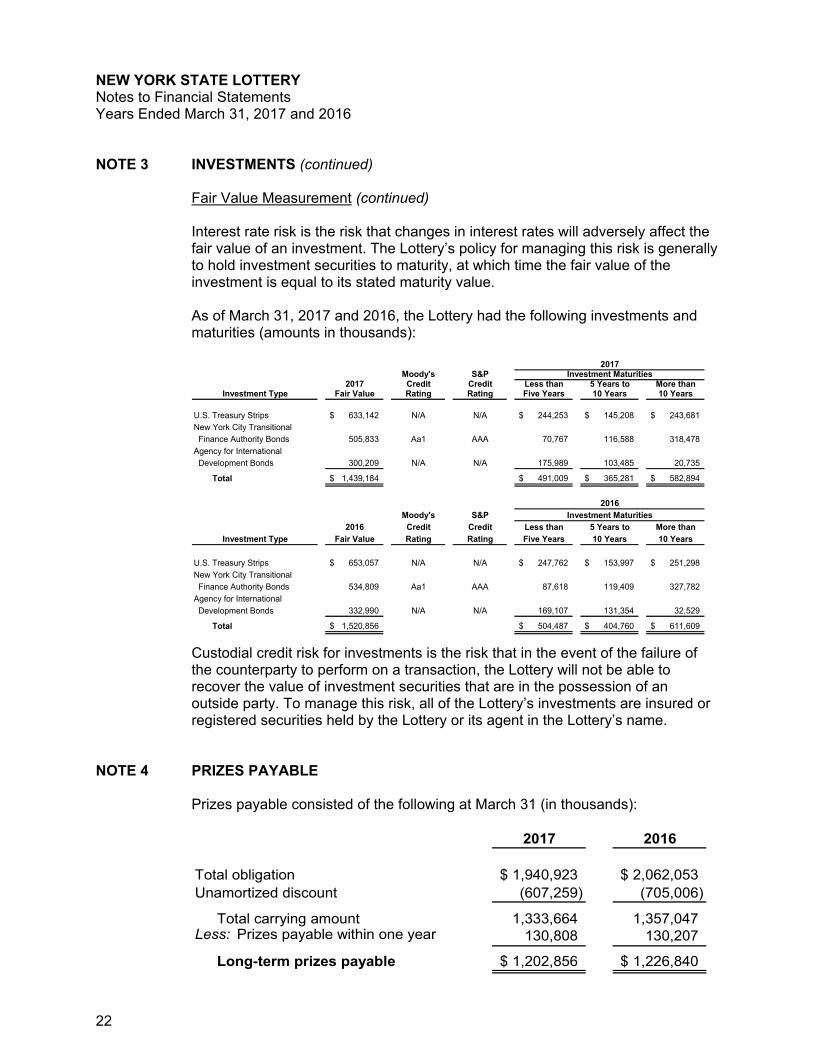
Fair Value Measurement (continued) Interest rate risk is the risk that changes in interest rates will adversely affect the fair value of an investment. The Lottery’s policy for managing this risk is generally to hold investment securities to maturity, at which time the fair value of the investment is equal to its stated maturity value. As of March 31, 2017 and 2016, the Lottery had the following investments and maturities (amounts in thousands):
2017Moody's S&P Investment Maturities
2017 Credit Credit Less than 5 Years to More thanInvestment Type Fair Value Rating Rating Five Years 10 Years 10 Years
U.S. Treasury Strips 633,142$ N/A N/A 244,253$ 145,208$ 243,681$ New York City Transitional Finance Authority Bonds 505,833 Aa1 AAA 70,767 116,588 318,478
Agency for International Development Bonds 300,209 N/A N/A 175,989 103,485 20,735
Total 1,439,184$ 491,009$ 365,281$ 582,894$
2016
Moody's S&P Investment Maturities2016 Credit Credit Less than 5 Years to More than
Investment Type Fair Value Rating Rating Five Years 10 Years 10 Years
U.S. Treasury Strips 653,057$ N/A N/A 247,762$ 153,997$ 251,298$ New York City Transitional Finance Authority Bonds 534,809 Aa1 AAA 87,618 119,409 327,782 Agency for International Development Bonds 332,990 N/A N/A 169,107 131,354 32,529
Total 1,520,856$ 504,487$ 404,760$ 611,609$
Custodial credit risk for investments is the risk that in the event of the failure of the counterparty to perform on a transaction, the Lottery will not be able to recover the value of investment securities that are in the possession of an outside party. To manage this risk, all of the Lottery’s investments are insured or registered securities held by the Lottery or its agent in the Lottery’s name.
NOTE 4 PRIZES PAYABLE
Prizes payable consisted of the following at March 31 (in thousands):
2017 2016
Total obligation 1,940,923$ 2,062,053$ Unamortized discount (607,259) (705,006)
Total carrying amount 1,333,664 1,357,047 Less: Prizes payable within one year 130,808 130,207
Long-term prizes payable 1,202,856$ 1,226,840$
NEW YORK STATE LOTTERY Notes to Financial Statements Years Ended March 31, 2017 and 2016
23
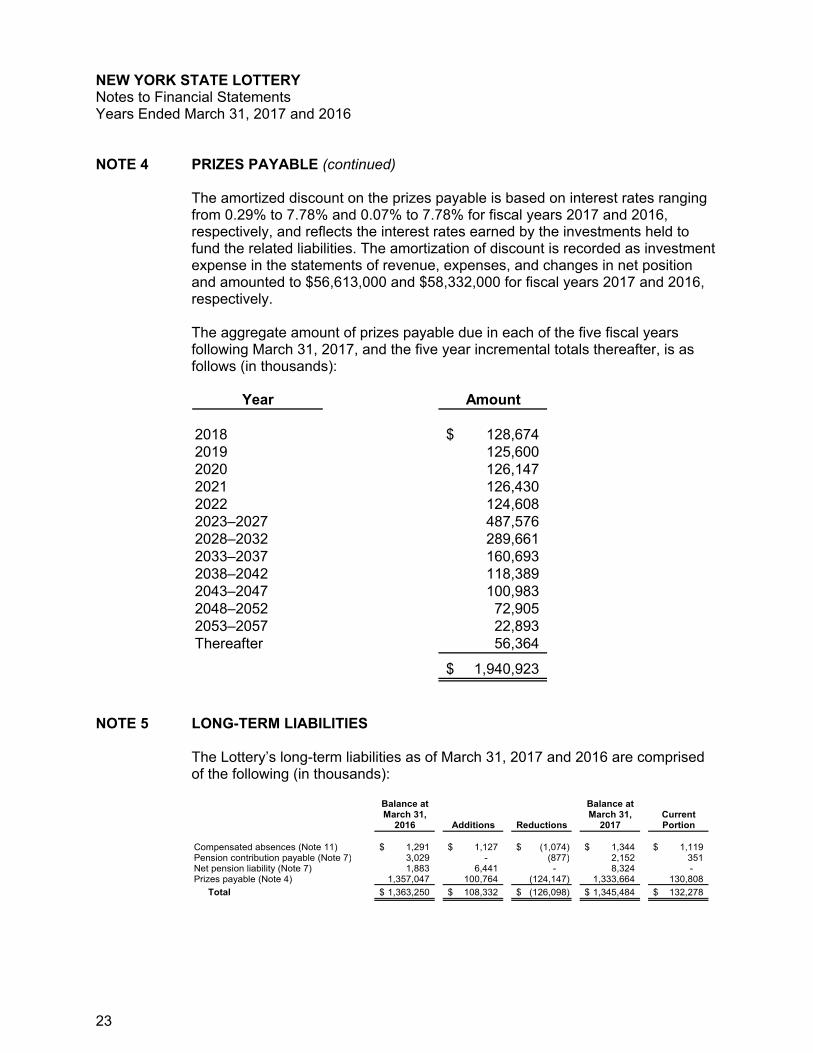
NOTE 4 PRIZES PAYABLE (continued) The amortized discount on the prizes payable is based on interest rates ranging from 0.29% to 7.78% and 0.07% to 7.78% for fiscal years 2017 and 2016, respectively, and reflects the interest rates earned by the investments held to fund the related liabilities. The amortization of discount is recorded as investment expense in the statements of revenue, expenses, and changes in net position and amounted to $56,613,000 and $58,332,000 for fiscal years 2017 and 2016, respectively.
The aggregate amount of prizes payable due in each of the five fiscal years following March 31, 2017, and the five year incremental totals thereafter, is as follows (in thousands):
Year Amount
2018 128,674$ 2019 125,600 2020 126,147 2021 126,430 2022 124,608 2023–2027 487,576 2028–2032 289,661 2033–2037 160,693 2038–2042 118,389 2043–2047 100,983 2048–2052 72,905 2053–2057 22,893 Thereafter 56,364
1,940,923$
NOTE 5 LONG-TERM LIABILITIES
The Lottery’s long-term liabilities as of March 31, 2017 and 2016 are comprised of the following (in thousands):
Balance at Balance atMarch 31, March 31, Current
2016 Additions Reductions 2017 Portion
Compensated absences (Note 11) 1,291$ 1,127$ (1,074)$ 1,344$ 1,119$ Pension contribution payable (Note 7) 3,029 - (877) 2,152 351 Net pension liability (Note 7) 1,883 6,441 - 8,324 - Prizes payable (Note 4) 1,357,047 100,764 (124,147) 1,333,664 130,808
Total 1,363,250$ 108,332$ (126,098)$ 1,345,484$ 132,278$
NEW YORK STATE LOTTERY Notes to Financial Statements Years Ended March 31, 2017 and 2016
24
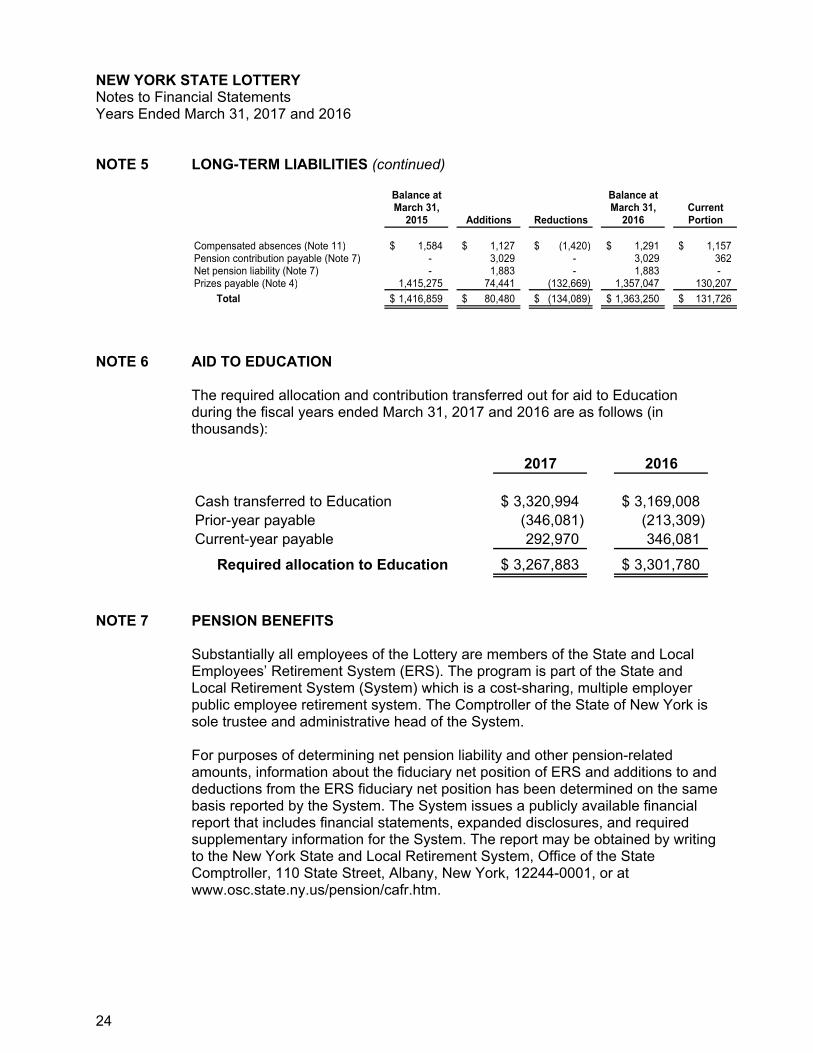
NOTE 5 LONG-TERM LIABILITIES (continued)
Balance at Balance atMarch 31, March 31, Current
2015 Additions Reductions 2016 Portion
Compensated absences (Note 11) 1,584$ 1,127$ (1,420)$ 1,291$ 1,157$ Pension contribution payable (Note 7) - 3,029 - 3,029 362 Net pension liability (Note 7) - 1,883 - 1,883 - Prizes payable (Note 4) 1,415,275 74,441 (132,669) 1,357,047 130,207
Total 1,416,859$ 80,480$ (134,089)$ 1,363,250$ 131,726$
NOTE 6 AID TO EDUCATION
The required allocation and contribution transferred out for aid to Education during the fiscal years ended March 31, 2017 and 2016 are as follows (in thousands):
2017 2016
Cash transferred to Education 3,320,994$ 3,169,008$ Prior-year payable (346,081) (213,309) Current-year payable 292,970 346,081
Required allocation to Education 3,267,883$ 3,301,780$
NOTE 7 PENSION BENEFITS
Substantially all employees of the Lottery are members of the State and Local Employees’ Retirement System (ERS). The program is part of the State and Local Retirement System (System) which is a cost-sharing, multiple employer public employee retirement system. The Comptroller of the State of New York is sole trustee and administrative head of the System. For purposes of determining net pension liability and other pension-related amounts, information about the fiduciary net position of ERS and additions to and deductions from the ERS fiduciary net position has been determined on the same basis reported by the System. The System issues a publicly available financial report that includes financial statements, expanded disclosures, and required supplementary information for the System. The report may be obtained by writing to the New York State and Local Retirement System, Office of the State Comptroller, 110 State Street, Albany, New York, 12244-0001, or at www.osc.state.ny.us/pension/cafr.htm.
NEW YORK STATE LOTTERY Notes to Financial Statements Years Ended March 31, 2017 and 2016
25
NOTE 7 PENSION BENEFITS (continued) The System provides retirement benefits as well as death and disability benefits. Retirement benefits are established by the New York State Retirement and Social Security Law. Vesting, retirement benefits, and contributory requirements depend upon the point in time at which an employee last joined the System. Most members of the System who joined before July 27, 1976 are enrolled in a noncontributory plan; the Lottery contributes the entire amount determined to be payable to the System. Personnel who joined the System on or after July 27, 1976 are required by law to contribute some percent of their gross salary for a specified number of years of employment; the Lottery withholds and contributes the balance payable to the System for these employees.
The Lottery paid to the Office of the State Comptroller of the State of New York $2,896,000 for 2017 and $2,921,000 for 2016, to cover required employer contributions for retirement benefits and equaled 100% of the required contribution in each of the respective years. These payments represent 16.47% and 16.73%, of covered payroll for each of the years, respectively. Net Pension Liabilities and Other Pension-Related Amounts The Lottery recognized a net pension liability of $8,324,434 and $1,883,161, at March 31, 2017 and 2016, respectively, for its proportionate share of the ERS net pension liability. The State’s proportionate share of the collective net pension liability reported at March 31, 2017, was measured as of March 31, 2016, and was determined using an actuarial valuation as of April 1, 2015, with update procedures used to roll forward the total pension liability to March 31, 2016. The State’s proportion of the ERS net pension liability measured at March 31, 2016, was 42.5% for ERS, which was comparable with the proportions allocated to the State at March 31, 2015 of 41.9%. The State’s proportion related to the plan was determined consistently with the manner in which contributions to the pension plan are determined. The State’s total projected long-term contribution effort to ERS was compared to the total projected long-term contribution effort from all employers to ERS in order to determine the State’s proportion of the plan’s net pension liability. The Office of the State Comptroller provided the Lottery with its proportionate share of the ERS collective liability. The Statewide proportionate share of the ERS collective net pension liability measured at March 31, 2016 allocated to the Lottery enterprise fund was 0.12%, which is comparable with the allocation of the ERS collective net pension liability measured as of March 31, 2015 of 0.13%.
NEW YORK STATE LOTTERY Notes to Financial Statements Years Ended March 31, 2017 and 2016
26
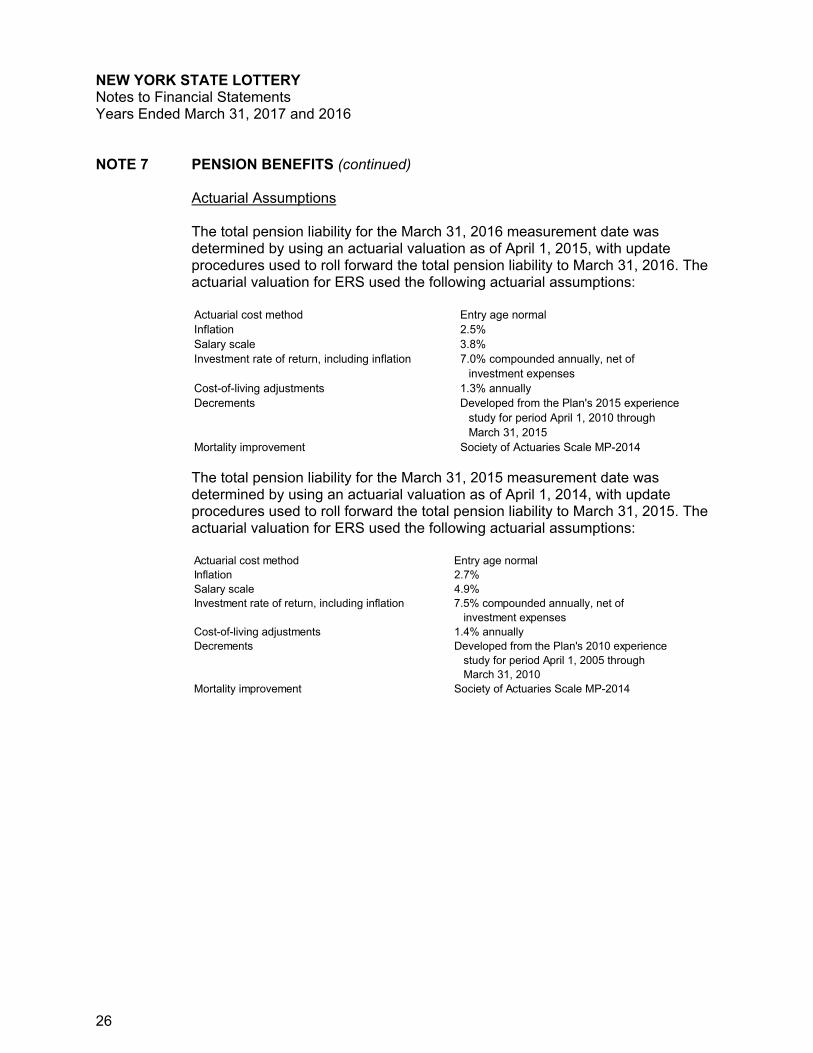
NOTE 7 PENSION BENEFITS (continued) Actuarial Assumptions The total pension liability for the March 31, 2016 measurement date was determined by using an actuarial valuation as of April 1, 2015, with update procedures used to roll forward the total pension liability to March 31, 2016. The actuarial valuation for ERS used the following actuarial assumptions: Actuarial cost method Entry age normalInflation 2.5%Salary scale 3.8%Investment rate of return, including inflation 7.0% compounded annually, net of
investment expensesCost-of-living adjustments 1.3% annuallyDecrements Developed from the Plan's 2015 experience
study for period April 1, 2010 throughMarch 31, 2015
Mortality improvement Society of Actuaries Scale MP-2014
The total pension liability for the March 31, 2015 measurement date was determined by using an actuarial valuation as of April 1, 2014, with update procedures used to roll forward the total pension liability to March 31, 2015. The actuarial valuation for ERS used the following actuarial assumptions: Actuarial cost method Entry age normalInflation 2.7%Salary scale 4.9%Investment rate of return, including inflation 7.5% compounded annually, net of
investment expensesCost-of-living adjustments 1.4% annuallyDecrements Developed from the Plan's 2010 experience
study for period April 1, 2005 throughMarch 31, 2010
Mortality improvement Society of Actuaries Scale MP-2014
NEW YORK STATE LOTTERY Notes to Financial Statements Years Ended March 31, 2017 and 2016
27
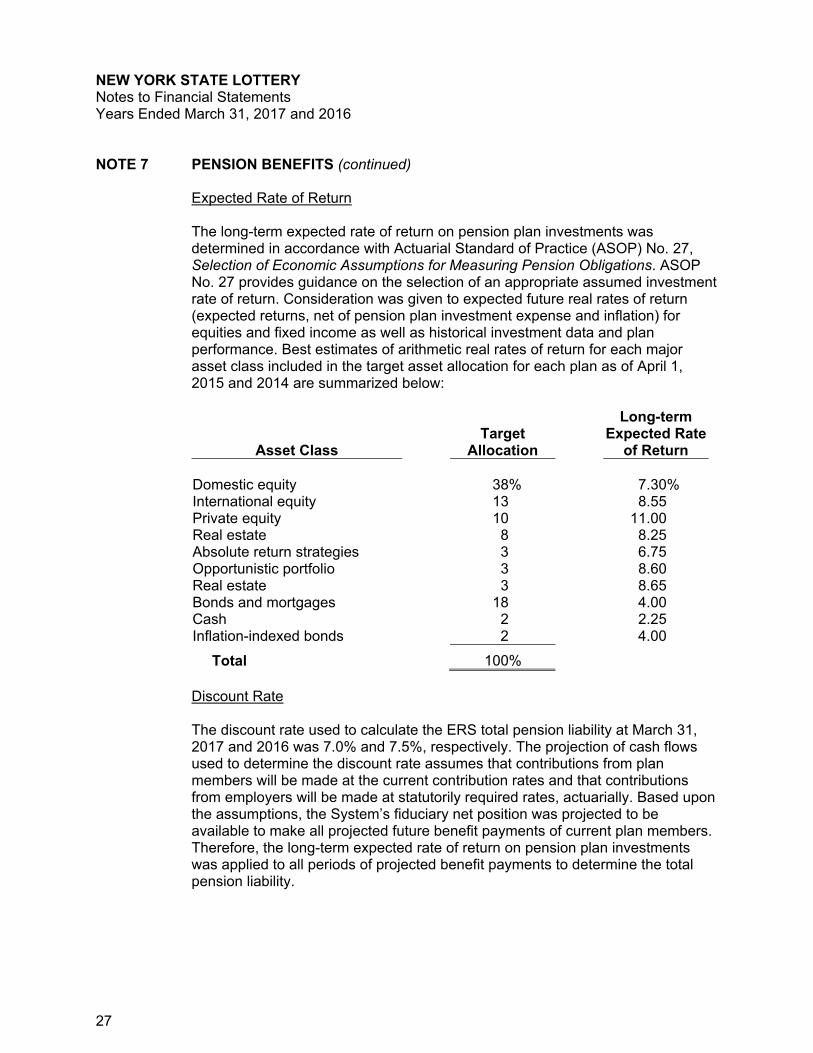
NOTE 7 PENSION BENEFITS (continued) Expected Rate of Return The long-term expected rate of return on pension plan investments was determined in accordance with Actuarial Standard of Practice (ASOP) No. 27, Selection of Economic Assumptions for Measuring Pension Obligations. ASOP No. 27 provides guidance on the selection of an appropriate assumed investment rate of return. Consideration was given to expected future real rates of return (expected returns, net of pension plan investment expense and inflation) for equities and fixed income as well as historical investment data and plan performance. Best estimates of arithmetic real rates of return for each major asset class included in the target asset allocation for each plan as of April 1, 2015 and 2014 are summarized below:
Asset Class Target
Allocation
Long-term Expected Rate
of Return Domestic equity 38% 7.30% International equity 13 8.55 Private equity 10 11.00 Real estate 8 8.25 Absolute return strategies 3 6.75 Opportunistic portfolio 3 8.60 Real estate 3 8.65 Bonds and mortgages 18 4.00 Cash 2 2.25 Inflation-indexed bonds 2 4.00
Total 100%
Discount Rate The discount rate used to calculate the ERS total pension liability at March 31, 2017 and 2016 was 7.0% and 7.5%, respectively. The projection of cash flows used to determine the discount rate assumes that contributions from plan members will be made at the current contribution rates and that contributions from employers will be made at statutorily required rates, actuarially. Based upon the assumptions, the System’s fiduciary net position was projected to be available to make all projected future benefit payments of current plan members. Therefore, the long-term expected rate of return on pension plan investments was applied to all periods of projected benefit payments to determine the total pension liability.
NEW YORK STATE LOTTERY Notes to Financial Statements Years Ended March 31, 2017 and 2016
28
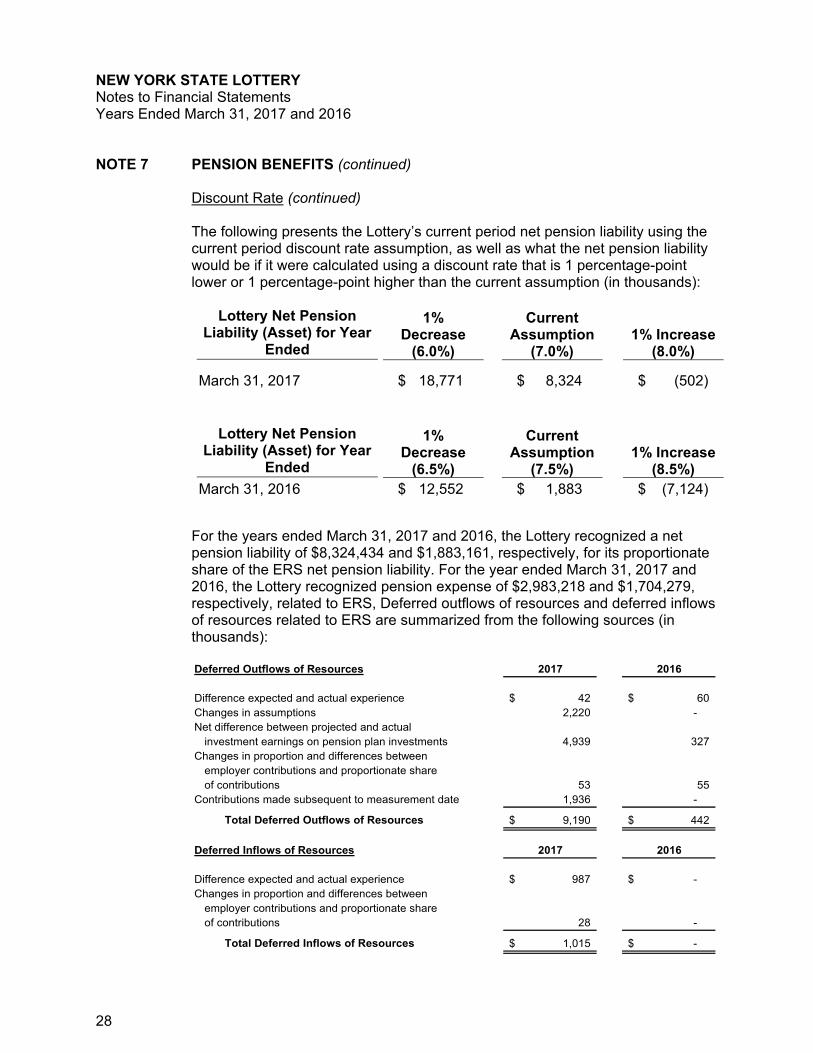
NOTE 7 PENSION BENEFITS (continued) Discount Rate (continued) The following presents the Lottery’s current period net pension liability using the current period discount rate assumption, as well as what the net pension liability would be if it were calculated using a discount rate that is 1 percentage-point lower or 1 percentage-point higher than the current assumption (in thousands):
Lottery Net Pension Liability (Asset) for Year
Ended
1% Decrease
(6.0%)
Current Assumption
(7.0%) 1% Increase
(8.0%)
March 31, 2017 $ 18,771 $ 8,324 $ (502)
Lottery Net Pension
Liability (Asset) for Year Ended
1% Decrease
(6.5%)
Current Assumption
(7.5%) 1% Increase
(8.5%) March 31, 2016 $ 12,552 $ 1,883 $ (7,124)
For the years ended March 31, 2017 and 2016, the Lottery recognized a net pension liability of $8,324,434 and $1,883,161, respectively, for its proportionate share of the ERS net pension liability. For the year ended March 31, 2017 and 2016, the Lottery recognized pension expense of $2,983,218 and $1,704,279, respectively, related to ERS, Deferred outflows of resources and deferred inflows of resources related to ERS are summarized from the following sources (in thousands): Deferred Outflows of Resources 2017 2016
Difference expected and actual experience 42$ 60$ Changes in assumptions 2,220 - Net difference between projected and actual
investment earnings on pension plan investments 4,939 327 Changes in proportion and differences between
employer contributions and proportionate shareof contributions 53 55
Contributions made subsequent to measurement date 1,936 -
Total Deferred Outflows of Resources 9,190$ 442$
Deferred Inflows of Resources 2017 2016
Difference expected and actual experience 987$ -$ Changes in proportion and differences between
employer contributions and proportionate shareof contributions 28 -
Total Deferred Inflows of Resources 1,015$ -$
NEW YORK STATE LOTTERY Notes to Financial Statements Years Ended March 31, 2017 and 2016
29
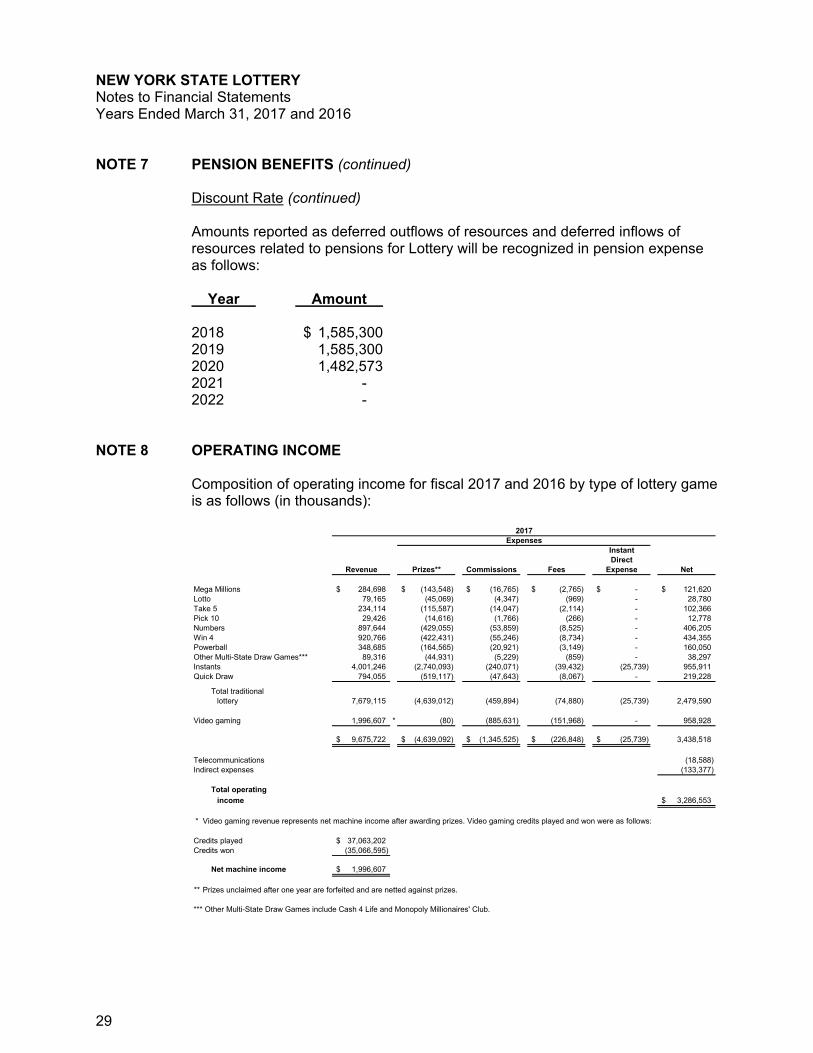
NOTE 7 PENSION BENEFITS (continued) Discount Rate (continued) Amounts reported as deferred outflows of resources and deferred inflows of resources related to pensions for Lottery will be recognized in pension expense as follows: Year Amount 2018 $ 1,585,300 2019 1,585,300 2020 1,482,573 2021 - 2022 -
NOTE 8 OPERATING INCOME
Composition of operating income for fiscal 2017 and 2016 by type of lottery game is as follows (in thousands):
2017Expenses
InstantDirect
Revenue Prizes** Commissions Fees Expense Net
Mega Millions 284,698$ (143,548)$ (16,765)$ (2,765)$ -$ 121,620$ Lotto 79,165 (45,069) (4,347) (969) - 28,780 Take 5 234,114 (115,587) (14,047) (2,114) - 102,366 Pick 10 29,426 (14,616) (1,766) (266) - 12,778 Numbers 897,644 (429,055) (53,859) (8,525) - 406,205 Win 4 920,766 (422,431) (55,246) (8,734) - 434,355 Powerball 348,685 (164,565) (20,921) (3,149) - 160,050 Other Multi-State Draw Games*** 89,316 (44,931) (5,229) (859) - 38,297 Instants 4,001,246 (2,740,093) (240,071) (39,432) (25,739) 955,911 Quick Draw 794,055 (519,117) (47,643) (8,067) - 219,228
Total traditionallottery 7,679,115 (4,639,012) (459,894) (74,880) (25,739) 2,479,590
Video gaming 1,996,607 * (80) (885,631) (151,968) - 958,928
9,675,722$ (4,639,092)$ (1,345,525)$ (226,848)$ (25,739)$ 3,438,518
Telecommunications (18,588) Indirect expenses (133,377)
Total operating
income 3,286,553$
* Video gaming revenue represents net machine income after awarding prizes. Video gaming credits played and won were as follows:
Credits played 37,063,202$ Credits won (35,066,595)
Net machine income 1,996,607$
** Prizes unclaimed after one year are forfeited and are netted against prizes.
*** Other Multi-State Draw Games include Cash 4 Life and Monopoly Millionaires' Club.
NEW YORK STATE LOTTERY Notes to Financial Statements Years Ended March 31, 2017 and 2016
30
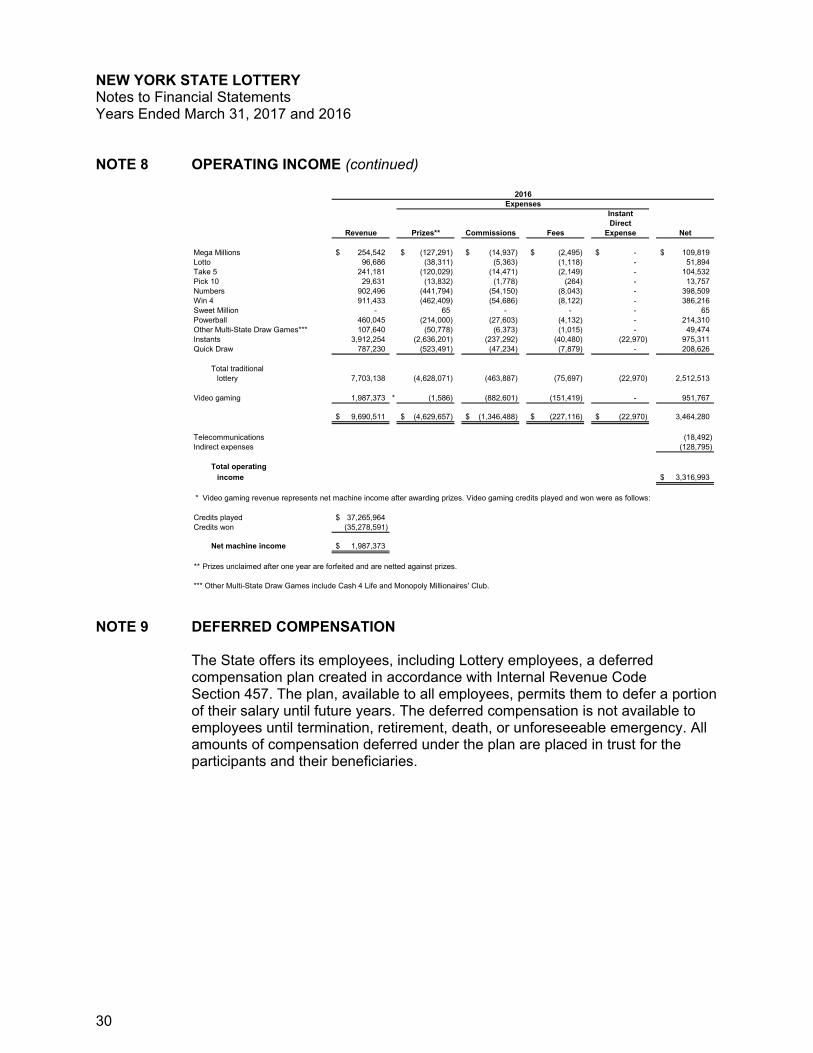
NOTE 8 OPERATING INCOME (continued)
2016Expenses
InstantDirect
Revenue Prizes** Commissions Fees Expense Net
Mega Millions 254,542$ (127,291)$ (14,937)$ (2,495)$ -$ 109,819$ Lotto 96,686 (38,311) (5,363) (1,118) - 51,894 Take 5 241,181 (120,029) (14,471) (2,149) - 104,532 Pick 10 29,631 (13,832) (1,778) (264) - 13,757 Numbers 902,496 (441,794) (54,150) (8,043) - 398,509 Win 4 911,433 (462,409) (54,686) (8,122) - 386,216 Sweet Million - 65 - - - 65 Powerball 460,045 (214,000) (27,603) (4,132) - 214,310 Other Multi-State Draw Games*** 107,640 (50,778) (6,373) (1,015) - 49,474 Instants 3,912,254 (2,636,201) (237,292) (40,480) (22,970) 975,311 Quick Draw 787,230 (523,491) (47,234) (7,879) - 208,626
Total traditionallottery 7,703,138 (4,628,071) (463,887) (75,697) (22,970) 2,512,513
Video gaming 1,987,373 * (1,586) (882,601) (151,419) - 951,767
9,690,511$ (4,629,657)$ (1,346,488)$ (227,116)$ (22,970)$ 3,464,280
Telecommunications (18,492) Indirect expenses (128,795)
Total operating
income 3,316,993$
* Video gaming revenue represents net machine income after awarding prizes. Video gaming credits played and won were as follows:
Credits played 37,265,964$ Credits won (35,278,591)
Net machine income 1,987,373$
** Prizes unclaimed after one year are forfeited and are netted against prizes.
*** Other Multi-State Draw Games include Cash 4 Life and Monopoly Millionaires' Club.
NOTE 9 DEFERRED COMPENSATION
The State offers its employees, including Lottery employees, a deferred compensation plan created in accordance with Internal Revenue Code Section 457. The plan, available to all employees, permits them to defer a portion of their salary until future years. The deferred compensation is not available to employees until termination, retirement, death, or unforeseeable emergency. All amounts of compensation deferred under the plan are placed in trust for the participants and their beneficiaries.
NEW YORK STATE LOTTERY Notes to Financial Statements Years Ended March 31, 2017 and 2016
31
NOTE 10 POSTRETIREMENT BENEFITS
As a New York State (State) agency, the Lottery participates in the New York State Health Insurance Program (NYSHIP), which is administered by the State as an agent multiple employer defined benefit plan. Under the plan, the State provides certain healthcare for eligible retired employees and their dependents. In order to qualify, retirees must meet certain age requirements and minimum service periods that vary based on the time they last entered benefits-eligible service. Retirees generally contribute a percent of the cost of single and dependent coverage for health insurance benefits. The percent varies based on when the employee retired. The percent also varies based on salary grade for those retiring on or after January 1, 2012. The State covers 100% of the cost of single coverage for employees retired prior to January 1, 1983 who are enrolled in the Empire Plan or another plan of equal or lower cost. NYSHIP does not issue a stand-alone financial report and NYSHIP’s agent activities are included within the financial statements of the State.
During the fiscal years ended March 31, 2017 and 2016, NYSHIP provided health insurance coverage through the Empire Plan, an indemnity health insurance plan with managed care components; various Health Maintenance Organizations (HMOs); and through the Student Employee Health Plan (SEHP). Generally, these include hospital, medical, mental health and substance abuse benefits, and prescription drug benefits. The Lottery’s policy regarding retiree healthcare benefits is to pay the amounts billed through the State’s fringe benefit rate on a pay-as-you-go basis. The Lottery has no obligation beyond the payment of the State’s fringe benefit rate for retiree healthcare benefits. The State’s policy is that the State is responsible for recording the annual required contribution and the actuarial accrued liability under GASB Statement No. 45, Accounting and Financial Reporting by Employers for Postemployment Benefits Other Than Pensions for the Lottery’s retiree health care benefits in the State’s governmental-wide financial statements. At March 31, 2017 and 2016, the Lottery had between 219 and 196 retired and/or spouses of retired employees receiving these benefits, with an annual pay-as-you-go cost of approximately $2,358,927 and $2,015,000, respectively. Employee costs were approximately $507,648 and $433,000, as of March 31, 2017 and 2016.
NOTE 11 EMPLOYEES’ COMPENSATED ABSENCES
Under the terms of the Lottery’s personnel policies and its union agreements, vacation pay benefits may be paid upon termination up to a maximum of 225 hours. The Lottery recognizes employees’ compensated absence benefits when earned. The liability for employees’ compensated absences was approximately $1,344,000 and $1,291,000 as of March 31, 2017 and 2016, respectively, and is recorded as a liability in the statements of net position.
NEW YORK STATE LOTTERY Notes to Financial Statements Years Ended March 31, 2017 and 2016
32
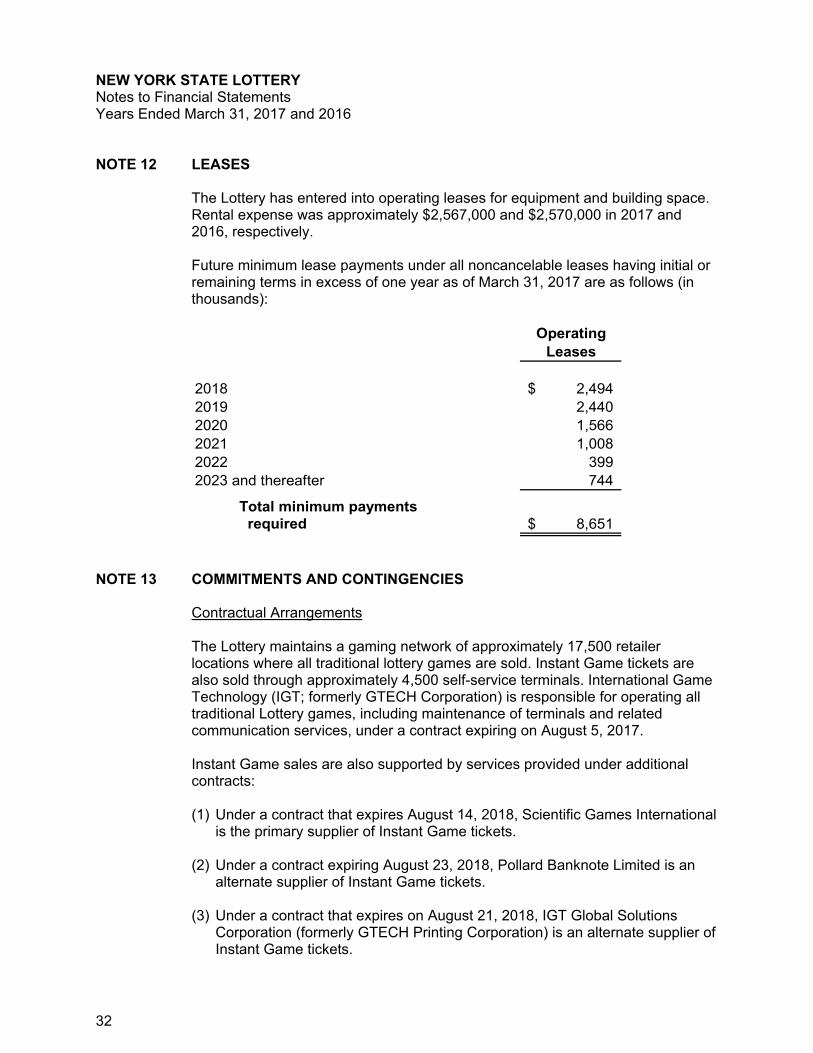
NOTE 12 LEASES The Lottery has entered into operating leases for equipment and building space. Rental expense was approximately $2,567,000 and $2,570,000 in 2017 and 2016, respectively. Future minimum lease payments under all noncancelable leases having initial or remaining terms in excess of one year as of March 31, 2017 are as follows (in thousands):
OperatingLeases
2018 2,494$ 2019 2,440 2020 1,566 2021 1,008 2022 399 2023 and thereafter 744
Total minimum payments required 8,651$
NOTE 13 COMMITMENTS AND CONTINGENCIES Contractual Arrangements The Lottery maintains a gaming network of approximately 17,500 retailer locations where all traditional lottery games are sold. Instant Game tickets are also sold through approximately 4,500 self-service terminals. International Game Technology (IGT; formerly GTECH Corporation) is responsible for operating all traditional Lottery games, including maintenance of terminals and related communication services, under a contract expiring on August 5, 2017. Instant Game sales are also supported by services provided under additional contracts: (1) Under a contract that expires August 14, 2018, Scientific Games International
is the primary supplier of Instant Game tickets. (2) Under a contract expiring August 23, 2018, Pollard Banknote Limited is an
alternate supplier of Instant Game tickets. (3) Under a contract that expires on August 21, 2018, IGT Global Solutions
Corporation (formerly GTECH Printing Corporation) is an alternate supplier of Instant Game tickets.
NEW YORK STATE LOTTERY Notes to Financial Statements Years Ended March 31, 2017 and 2016
33
NOTE 13 COMMITMENTS AND CONTINGENCIES (continued) Contractual Arrangements (continued) Video lottery games are offered on approximately 18,400 video gaming machines spread over 10 video lottery gaming facilities. Everi Games, Inc. (formerly MGAM Systems, Inc.) provides a central processing system for the operation of video lottery games under a contract expiring on December 31, 2017. Video lottery gaming machines are provided under contracts expiring December 31, 2017 with three different companies (Bally Gaming Inc., International Game Technology, and Spielo International USA, Inc.). These contracts are paid based on a contractual percentage of revenue, adjusted for units of service provided. Litigation The Lottery has been named as a defendant in several lawsuits. While the ultimate outcome of these lawsuits cannot be predicted at this time, it is the opinion of management and in-house counsel that the disposition of any litigation in which the Lottery is involved will not have a material adverse effect on the financial position of the Lottery.
REQUIRED SUPPLEMENTARY INFORMATION (UNAUDITED)
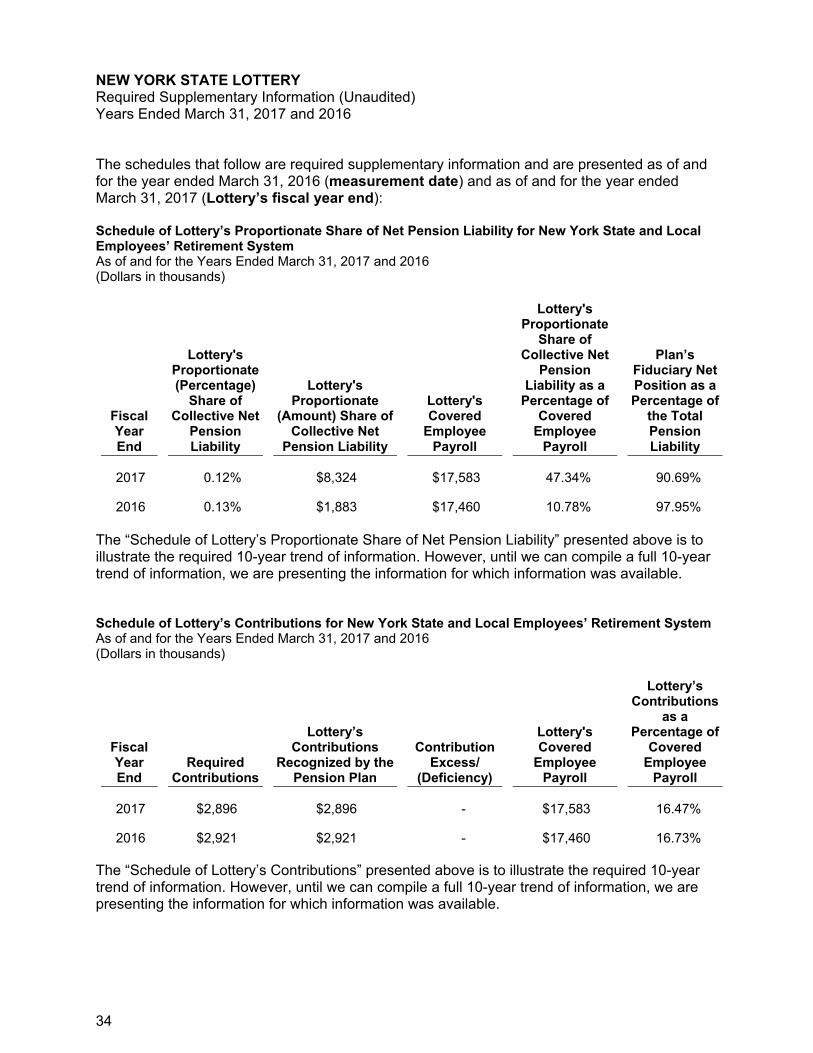
NEW YORK STATE LOTTERY Required Supplementary Information (Unaudited) Years Ended March 31, 2017 and 2016
34
The schedules that follow are required supplementary information and are presented as of and for the year ended March 31, 2016 (measurement date) and as of and for the year ended March 31, 2017 (Lottery’s fiscal year end): Schedule of Lottery’s Proportionate Share of Net Pension Liability for New York State and Local Employees’ Retirement System As of and for the Years Ended March 31, 2017 and 2016 (Dollars in thousands)
Fiscal Year End
Lottery's Proportionate (Percentage)
Share of Collective Net
Pension Liability
Lottery's Proportionate
(Amount) Share of Collective Net
Pension Liability
Lottery's Covered
Employee Payroll
Lottery's Proportionate
Share of Collective Net
Pension Liability as a
Percentage of Covered
Employee Payroll
Plan’s Fiduciary Net Position as a Percentage of
the Total Pension Liability
2017 0.12% $8,324 $17,583 47.34% 90.69%
2016 0.13% $1,883 $17,460 10.78% 97.95%
The “Schedule of Lottery’s Proportionate Share of Net Pension Liability” presented above is to illustrate the required 10-year trend of information. However, until we can compile a full 10-year trend of information, we are presenting the information for which information was available. Schedule of Lottery’s Contributions for New York State and Local Employees’ Retirement System As of and for the Years Ended March 31, 2017 and 2016 (Dollars in thousands)
Fiscal Year End
Required Contributions
Lottery’s Contributions
Recognized by the Pension Plan
Contribution Excess/
(Deficiency)
Lottery's Covered
Employee Payroll
Lottery’s Contributions
as a Percentage of
Covered Employee
Payroll
2017 $2,896 $2,896 - $17,583 16.47%
2016 $2,921 $2,921 - $17,460 16.73%
The “Schedule of Lottery’s Contributions” presented above is to illustrate the required 10-year trend of information. However, until we can compile a full 10-year trend of information, we are presenting the information for which information was available.