Embed Size (px)
Citation preview
NUNA VUT LOTTERY GOVERNMENT OF NUNAVUT
Department of Community and Government Services FINANCIAL STATEMENTS
March 31,2017
T ABLE OF CONTENTS
MANAGEMENT'S RESPONSIBILITY FOR FINANCIAL REPORTING
INDEPENDENT AUDITORS' REPORT
FINANCIAL STATEMENTS
Statement of Financial Position
Statement of Changes in Net Financial Assets
Statement of Operations
Statement of Cash Flows
Notes to Financial Statements
Schedules
Schedule 1 - Calculation of Amounts for Statement of Operations
Schedule 2 - Schedule of Lottery Revenue, Net
Schedule 3 - Calculation of Amounts for Schedule of Lottery Revenue, Net
Schedule 4 - Continuity of Monthly Sales and Percentages
Page
1
2
3
4
5-9
10
11
12
13
NWT & Nunavut Lotteries
PH Box 16'/6 480B-48tll Stree~
YeJlov!klllfe. NT XIA 2P3
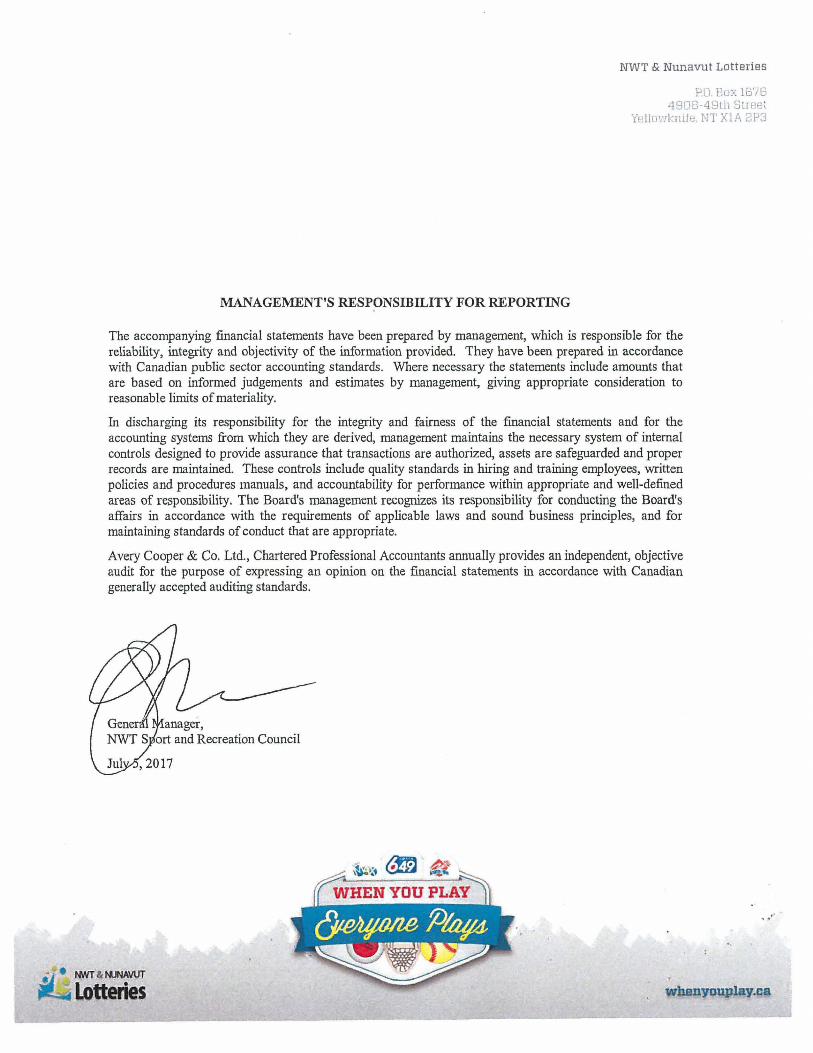
MANAGEMENT'S RESPONSIBILITY FOR REPORTING
The accompanying financial statements have been prepared by management, which is responsible for the reliability, integrity and objectivity of the information provided. They have been prepared in accordance with Canadian public sector accounting standards. Where necessary the statements include amounts that are based on informed judgements and estimates by management, giving appropriate consideration to reasonable limits of materiality.
In discharging its responsibility for the integrity and fairness of the financial statements and for the accounting systems from which they are derived, management maintains the necessary system of internal controls designed to provide assurance that transactions are authorized, assets are safeguarded and proper records are maintained. These controls include quality standards in hiring and training employees, written policies and procedures manuals, and accountability for performance within appropriate and well-defined areas of responsibility. The Board's management recognizes its responsibility for conducting the Board's affairs in accordance with the requirements of applicable laws and sound business principles, and for maintaining standards of conduct that are appropriate.
Avery Cooper & Co. Ltd., Chartered Professional Accountants annually provides an independent, objective audit for the purpose of expressing an opinion on the financial statements in accordance with Canadian generally accepted auditing standards.
".'"'
ii .... ~.4~VVT. ~Lotteries whenYouplay.ca
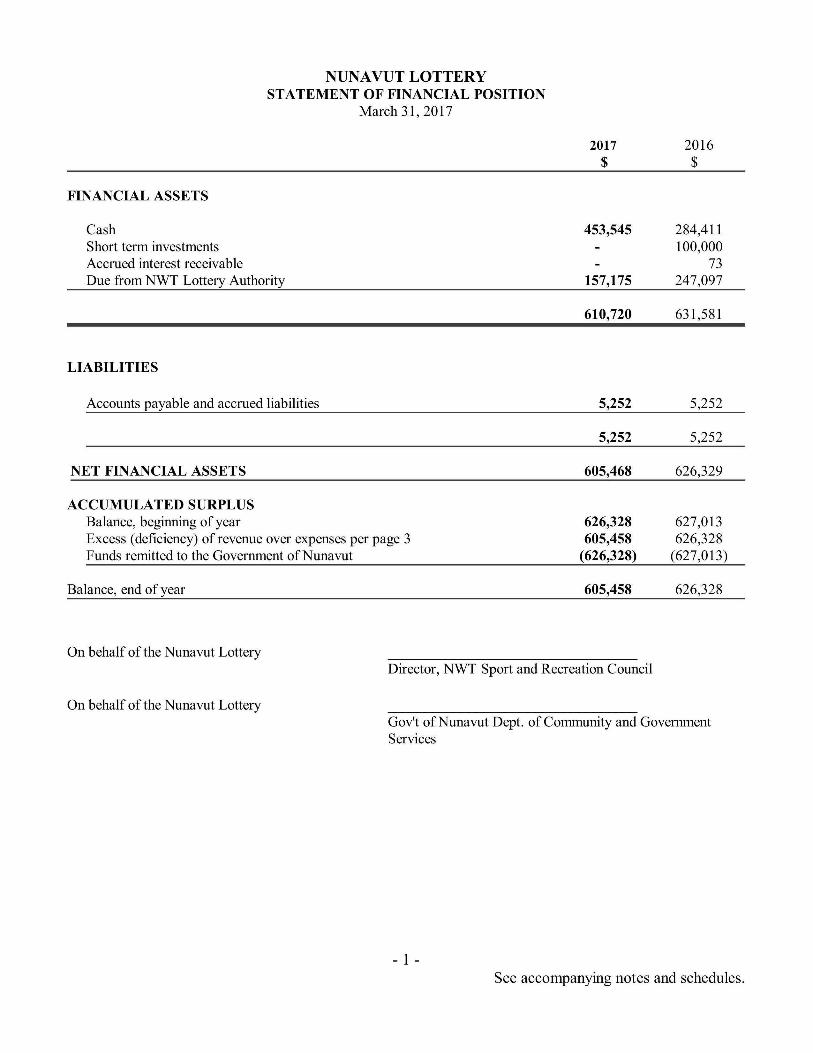
FINANCIAL ASSETS
Cash Short term investments Accrued interest receivable
NUNA VUT LOTTERY STATEMENT OF FINANCIAL POSITION
March 31,2017
Due from NWT Lottery Authority
LIABILITIES
Accounts payable and accrued liabilities
NET FINANCIAL ASSETS
ACCUMULATED SURPLUS Balance, beginning of year Excess ( deficiency) of revenue over expenses per page 3 Funds remitted to the Government of Nunavut
Balance, end of year
On behalf of the Nunavut Lottery
2017 2016 $ $
453,545 284,411 100,000
73 157,175 247,097
610,720 631 ,581
5,252 5,252
5,252 5,252
605,468 626,329
626,328 627,013 605,458 626,328
(626,328) (627,013)
605,458 626,328
Director, NWT Sport and Recreation Council
On behalf of the Nunavut Lottery Gov't ofNunavut Dept. of Community and Government Services
- 1 -See accompanying notes and schedules.
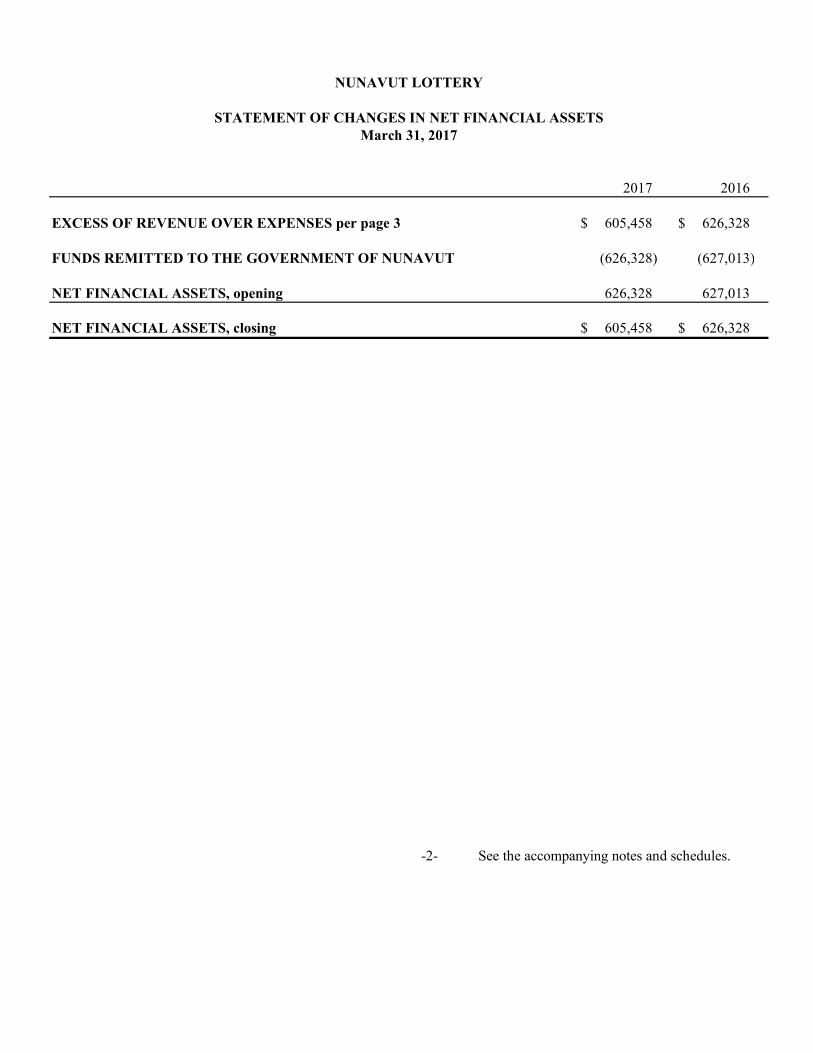
2017 2016
EXCESS OF REVENUE OVER EXPENSES per page 3 605,458$ 626,328$
FUNDS REMITTED TO THE GOVERNMENT OF NUNAVUT (626,328) (627,013)
NET FINANCIAL ASSETS, opening 626,328 627,013
NET FINANCIAL ASSETS, closing 605,458$ 626,328$
-2- See the accompanying notes and schedules.
March 31, 2017
NUNAVUT LOTTERY
STATEMENT OF CHANGES IN NET FINANCIAL ASSETS
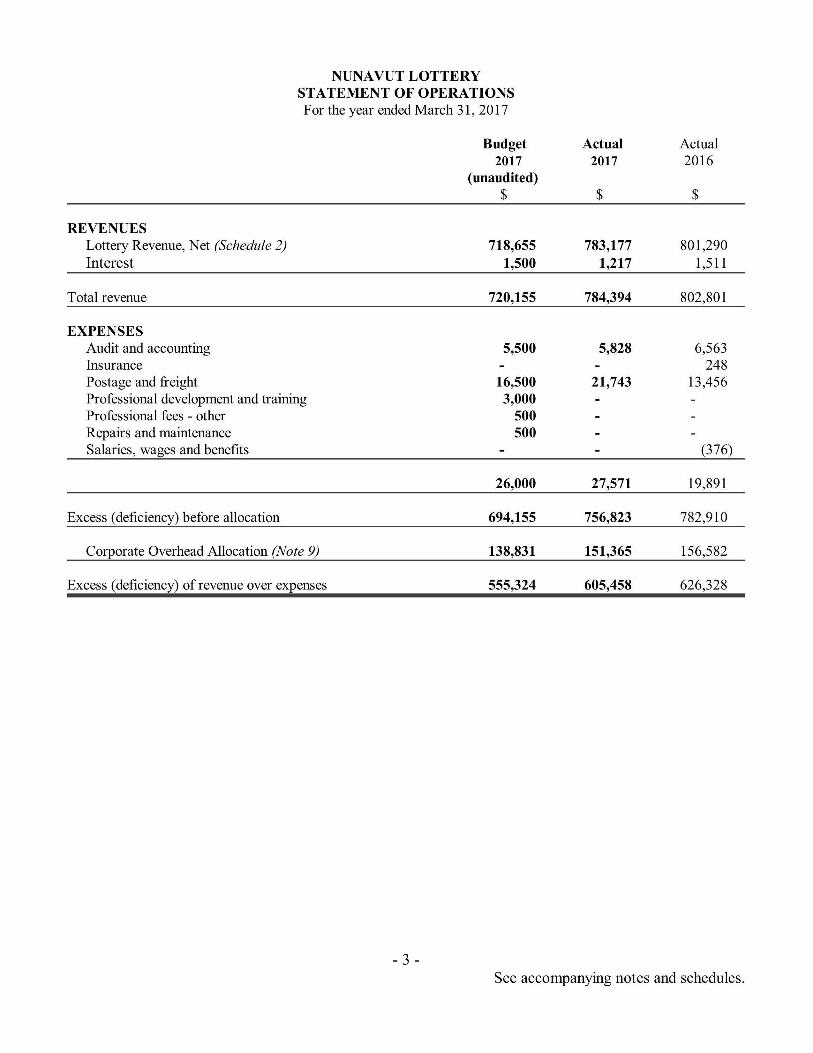
NUNAVUT LOTTERY STATEMENT OF OPERATIONS F or the year ended March 31, 2017
Budget Actual Actual 2017 2017 2016
(unaudited) $ $ $
REVENUES Lottery Revenue, Net (Schedule 2) 718,655 783,177 801,290 Interest 1,500 1,217 1,511
Total revenue 720,155 784,394 802,801
EXPENSES Audit and accounting 5,500 5,828 6,563 Insurance 248 Postage and freight 16,500 21,743 13,456 Professional development and training 3,000 Professional fees - other 500 Repairs and maintenance 500 Salaries, wages and benefits (376)
26,000 27,571 19,891
Excess (deficiency) before allocation 694,155 756,823 782,910
Corporate Overhead Allocation (Note 9) 138,831 151,365 156,582
Excess (deficiency) of revenue over expenses 555,324 605,458 626,328
- 3 -See accompanying notes and schedules.
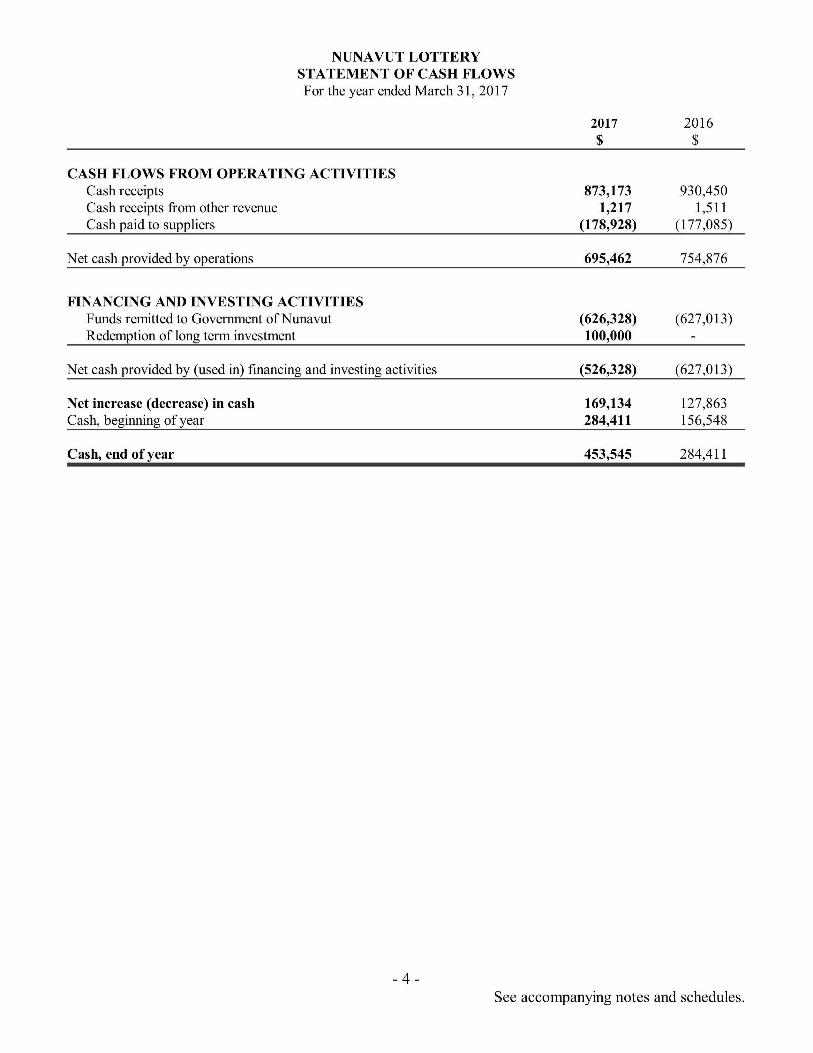
NUNA VUT LOTTERY STATEMENT OF CASH FLOWS For the year ended March 31, 2017
CASH FLOWS FROM OPERATING ACTIVITIES Cash receipts Cash receipts from other revenue Cash paid to suppliers
N et cash provided by operations
FINANCING AND INVESTING ACTIVITIES Funds remitted to Government of Nunavut Redemption of long term investment
Net cash provided by (used in) financing and investing activities
N et increase (decrease) in cash Cash, beginning of year
Cash, end of year
- 4 -
2017 2016 $ $
873,173 930,450 1,217 1,511
(178,928) (177,085)
695,462 754,876
(626,328) (627,013) 100,000
(526,328) (627,013)
169,134 127,863 284,411 156,548
453,545 284,411
See accompanying notes and schedules.
NUNA VUT LOTTERY NOTES TO FINANCIAL STATEMENTS
For the year ended March 31, 2017
NOTE 1 NATURE OF OPERATIONS
The NWT Sport and Recreation Council (NWTSRC) has agreements with the Western Canada Lottery Corporation (Western Canada Lottery Corporation Agreement, signed Apri11, 2009) and the Government ofNunavut (Nunavut Lottery Agreement, signed April 1 ,2009) for the purpose of conducting and managing the sale of Western Canada Lottery products. The NWTSRC was appointed to assist in the joint marketing of the Western Canada Lottery (the "Lottery") in the Territory ofNunavut. This agreement was updated on April 1, 2015 and expires March 31, 2020 unless terminated earlier in accordance with the Agreement or renewed by mutual parties.
NOTE 2 SIGNIFICANT ACCOUNTING POLICIES
These fInancial statements are prepared in accordance with Canadian public sector accounting standards in accordance with the Public Sector Accounting Board (PSAB). The signifIcant accounting polices used are as follows:
a) Funds received from Western Canada Lottery Corporation are recognized as revenue only when the draw has been completed.
b) Cash equivalents are considered all investments with maturities of three months or less and bank loans with no fIxed terms of repayment.
c) The fInancial instruments consist of cash, accounts payable and due to a related party. Unless otherwise noted, it is management's opinion, that the Nunavut Lottery is not exposed to signifIcant interest, currency or credit risk.
d) Financial assets, consisting of cash, accounts receivable and due from related parties, are assets that could be used to discharge existing liabilities or fmance future operations and are not for consumption in the normal course of operations.
e) Non-fmancial assets, consisting of prepaid expenses, are not available to discharge existing liabilities and are held for use in the provision of services in future periods. They have useful lives extending beyond the current year and are not intended for sale in the ordinary course of operations.
f) Net debt is measured as the difference between the Organization's liabilities and fmancial assets. This difference bears directly on the Organization's future revenue requirements and on its ability to finance its activities and meet its liabilities and contractual obligations.
- 5 -
NUNA VUT LOTTERY NOTES TO FINANCIAL STATEMENTS
For the year ended March 31, 2017
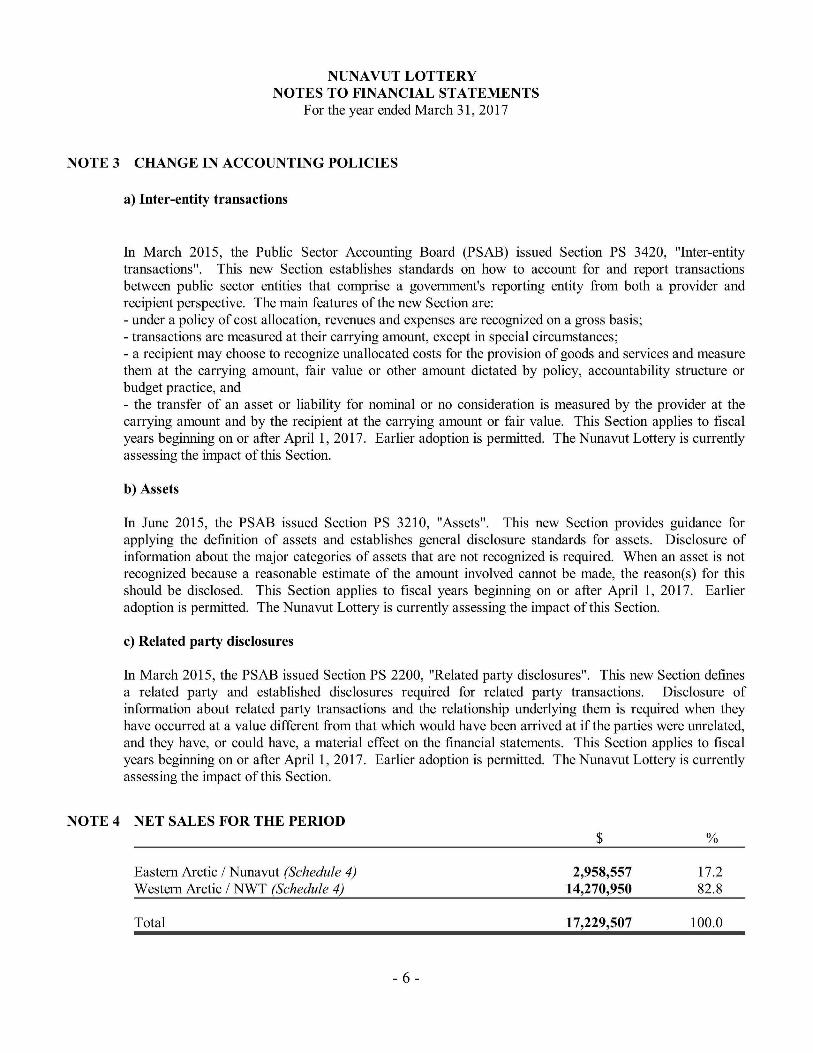
NOTE 3 CHANGE IN ACCOUNTING POLICIES
a) Inter-entity transactions
In March 2015, the Public Sector Accounting Board (pSAB) issued Section PS 3420, "Inter-entity transactions". This new Section establishes standards on how to account for and report transactions between public sector entities that comprise a government's reporting entity from both a provider and recipient perspective. The main features of the new Section are: - under a policy of cost allocation, revenues and expenses are recognized on a gross basis; - transactions are measured at their carrying amount, except in special circumstances; - a recipient may choose to recognize unallocated costs for the provision of goods and services and measure them at the carrying amount, fair value or other amount dictated by policy, accountability structure or budget practice, and - the transfer of an asset or liability for nominal or no consideration is measured by the provider at the carrying amount and by the recipient at the carrying amount or fair value. This Section applies to fiscal years beginning on or after Apri11 , 2017. Earlier adoption is permitted. The Nunavut Lottery is currently assessing the impact of this Section.
b) Assets
In June 2015, the PSAB issued Section PS 3210, "Assets". This new Section provides guidance for applying the definition of assets and establishes general disclosure standards for assets. Disclosure of information about the major categories of assets that are not recognized is required. When an asset is not recognized because a reasonable estimate of the amount involved cannot be made, the reason(s) for this should be disclosed. This Section applies to fiscal years beginning on or after April 1, 2017. Earlier adoption is permitted. The Nunavut Lottery is currently assessing the impact of this Section.
c) Related party disclosures
In March 2015, the PSAB issued Section PS 2200, "Related party disclosures". This new Section defines a related party and established disclosures required for related party transactions. Disclosure of information about related party transactions and the relationship underlying them is required when they have occurred at a value different from that which would have been arrived at if the parties were unrelated, and they have, or could have, a material effect on the financial statements. This Section applies to fiscal years beginning on or after April 1, 2017. Earlier adoption is permitted. The Nunavut Lottery is currently assessing the impact of this Section.
NOTE 4 NET SALES FOR THE PERIOD
Eastern Arctic / Nunavut (Schedule 4) Western Arctic / NWT (Schedule 4)
Total
- 6 -
$
2,958,557 14,270,950
17,229,507
%
17.2 82.8
100.0
NUNA VUT LOTTERY NOTES TO FINANCIAL STATEMENTS
For the year ended March 31, 2017
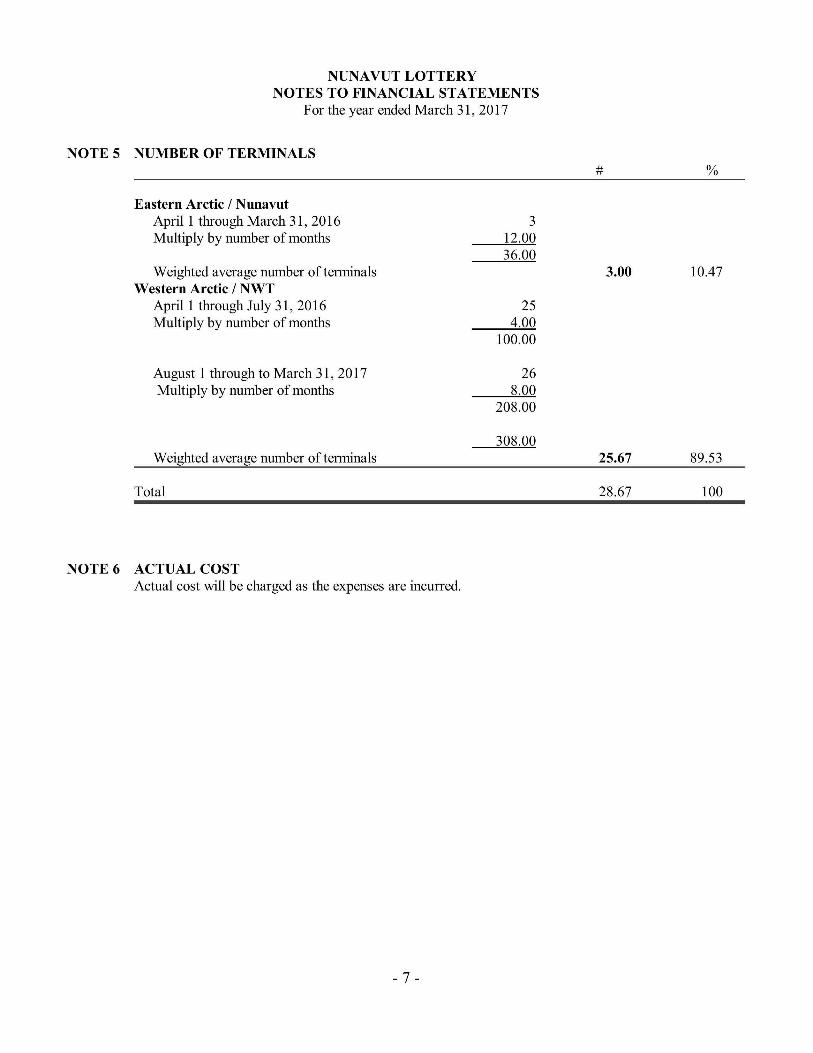
NOTE 5 NUMBER OF TERMINALS
Eastern Arctic / N unavut April 1 through March 31, 2016 Multiply by number of months
Weighted average number of terminals Western Arctic / NWT
April 1 through July 31, 2016 Multiply by number of months
August 1 through to March 31, 2017 Multiply by number of months
Weighted average number of terminals
Total
NOTE 6 ACTUAL COST Actual cost will be charged as the expenses are incurred.
- 7 -
3 12.00 36.00
25 4.00
100.00
26 8.00
208.00
308.00
# %
3.00 10.47
25.67 89.53
28.67 100
NUNA VUT LOTTERY NOTES TO FINANCIAL STATEMENTS
For the year ended March 31, 2017
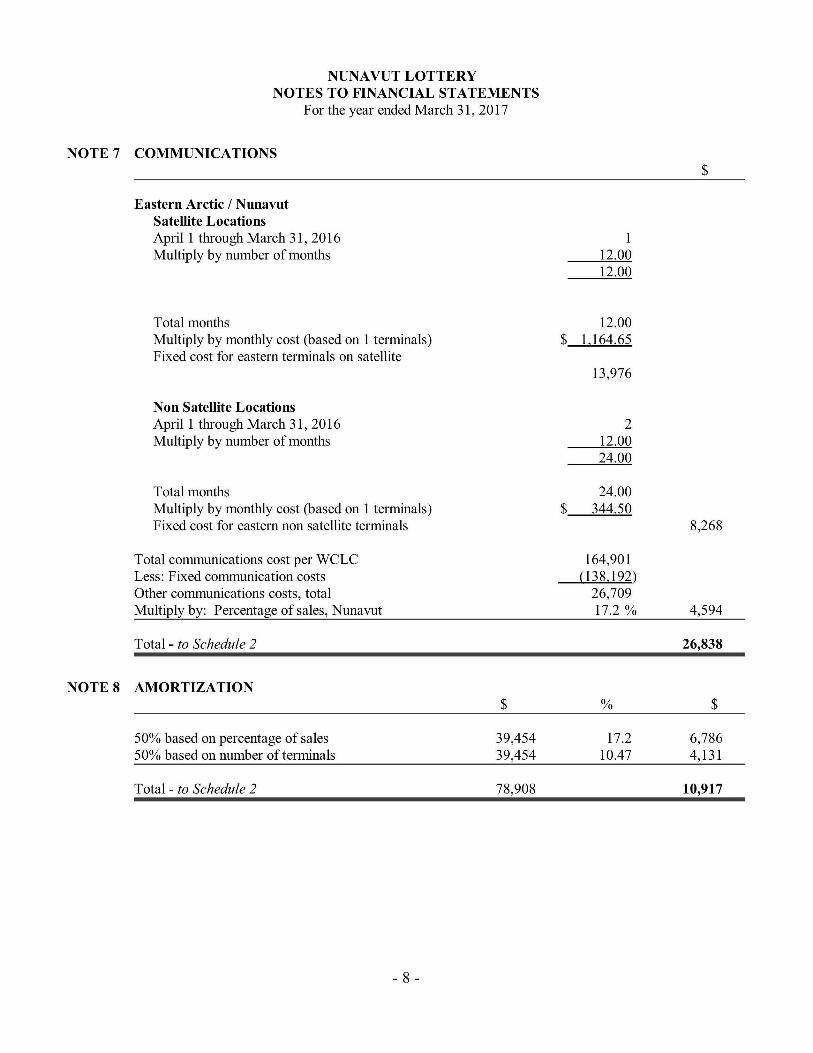
NOTE 7 COMMUNICATIONS
Eastern Arctic / N unavut Satellite Locations April 1 through March 31, 2016 Multiply by number of months
Total months Multiply by monthly cost (based on 1 terminals) Fixed cost for eastern terminals on satellite
Non Satellite Locations April 1 through March 31, 2016 Multiply by number of months
Total months Multiply by monthly cost (based on 1 terminals) Fixed cost for eastern non satellite terminals
Total communications cost per WCLC Less: Fixed communication costs Other communications costs, total Multiply by: Percentage of sales, Nunavut
Total- to Schedule 2
NOTE 8 AMORTIZATION
50% based on percentage of sales 50% based on number of terminals
Total - to Schedule 2
- 8 -
$
39,454 39,454
78,908
$
$
1 12.00 12.00
12.00 1,164.65
13,976
2 12.00 24.00
24.00 344.50
164,901 (138,192)
26,709 17.2 %
%
17.2 10.47
$
8,268
4,594
26,838
$
6,786 4,131
10,917
NUNA VUT LOTTERY NOTES TO FINANCIAL STATEMENTS
For the year ended March 31, 2017
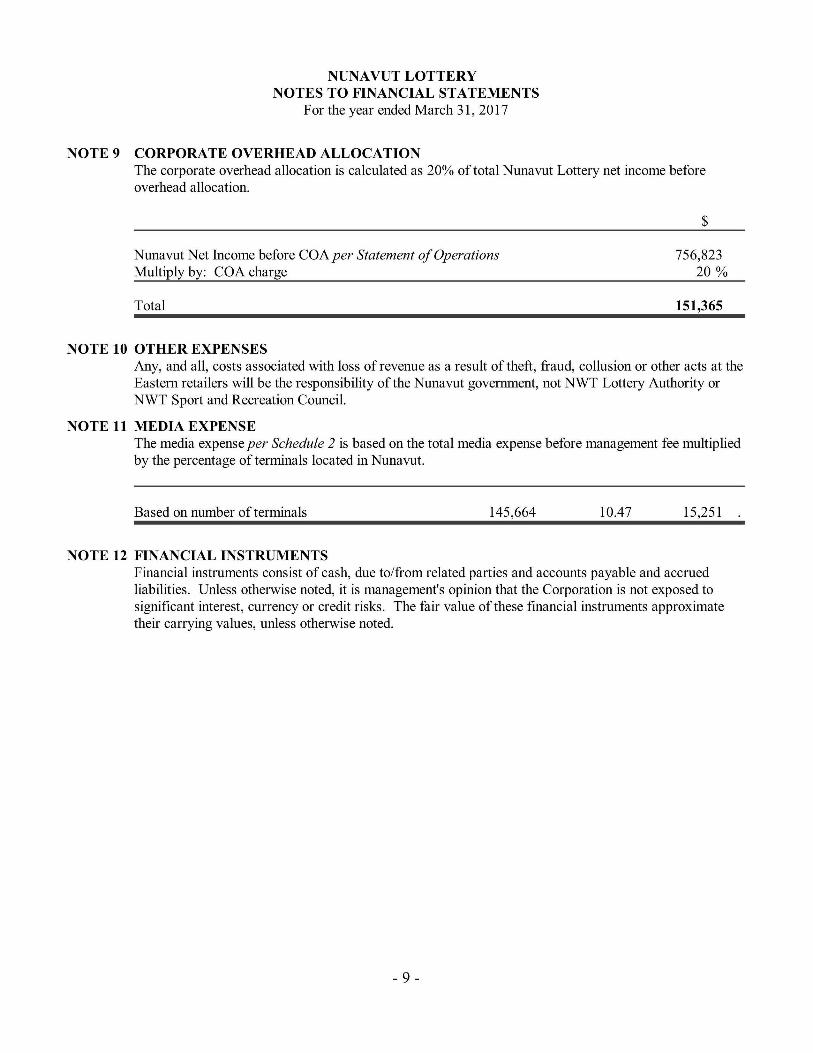
NOTE 9 CORPORATE OVERHEAD ALLOCATION The corporate overhead allocation is calculated as 20% of total Nunavut Lottery net income before overhead allocation.
Nunavut Net Income before COA per Statement of Operations Multiply by: COA charge
Total
NOTE 10 OTHER EXPENSES
$
756,823 20 %
151,365
Any, and all, costs associated with loss of revenue as a result of theft, fraud, collusion or other acts at the Eastern retailers will be the responsibility of the Nunavut government, not NWT Lottery Authority or NWT Sport and Recreation Council.
NOTE 11 MEDIA EXPENSE The media expense per Schedule 2 is based on the total media expense before management fee multiplied by the percentage of terminals located in Nunavut.
Based on number of terminals 145,664 10.47 15,251
NOTE 12 FINANCIAL INSTRUMENTS Financial instruments consist of cash, due to/from related parties and accounts payable and accrued liabilities. Unless otherwise noted, it is management's opinion that the Corporation is not exposed to significant interest, currency or credit risks. The fair value of these financial instruments approximate their carrying values, unless otherwise noted.
- 9 -
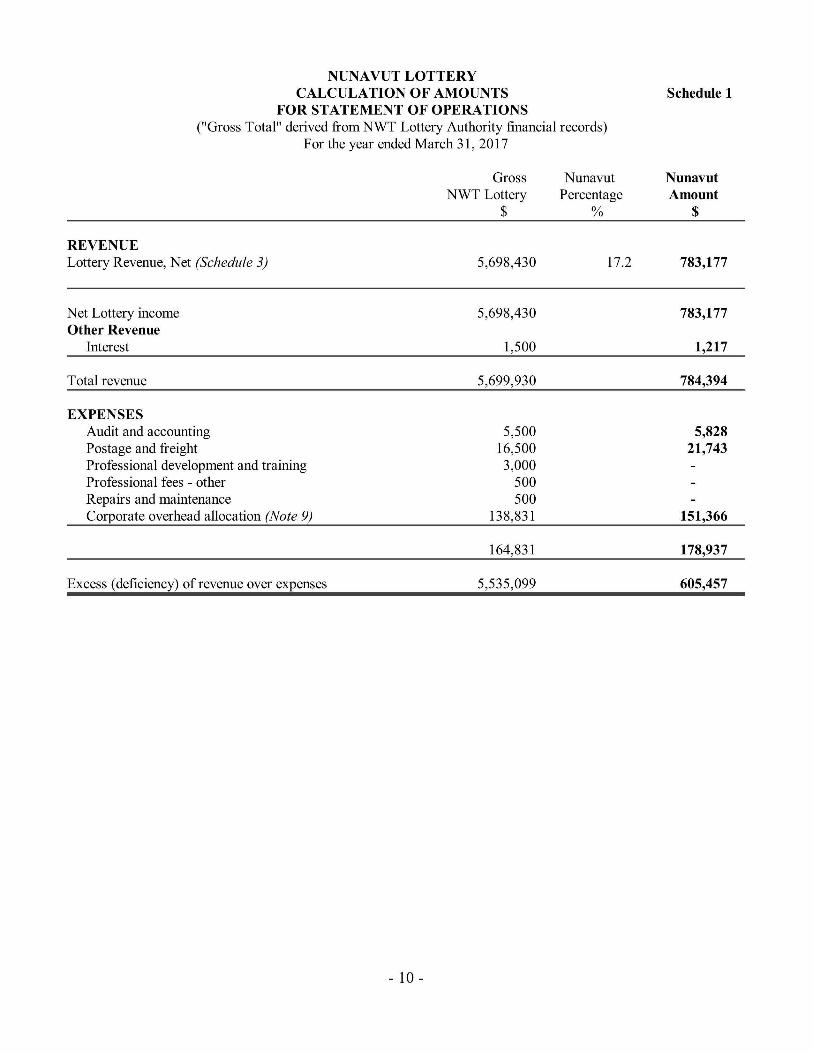
NUNA VUT LOTTERY CALCULATION OF AMOUNTS
FOR STATEMENT OF OPERATIONS ("Gross Total" derived from NWT Lottery Authority financial records)
F or the year ended March 31 , 2017
REVENUE Lottery Revenue, Net (Schedule 3)
N et Lottery income Other Revenue
Interest
Total revenue
EXPENSES Audit and accounting Postage and freight Professional development and training Professional fees - other Repairs and maintenance Corporate overhead allocation (Note 9)
Excess ( deficiency) of revenue over expenses
- 10 -
Gross NWT Lottery
$
5,698,430
5,698,430
1,500
5,699,930
5,500 16,500 3,000
500 500
138,831
164,831
5,535,099
Nunavut Percentage
%
17.2
Schedule 1
Nunavut Amount
$
783,177
783,177
1,217
784,394
5,828 21,743
151,366
178,937
605,457
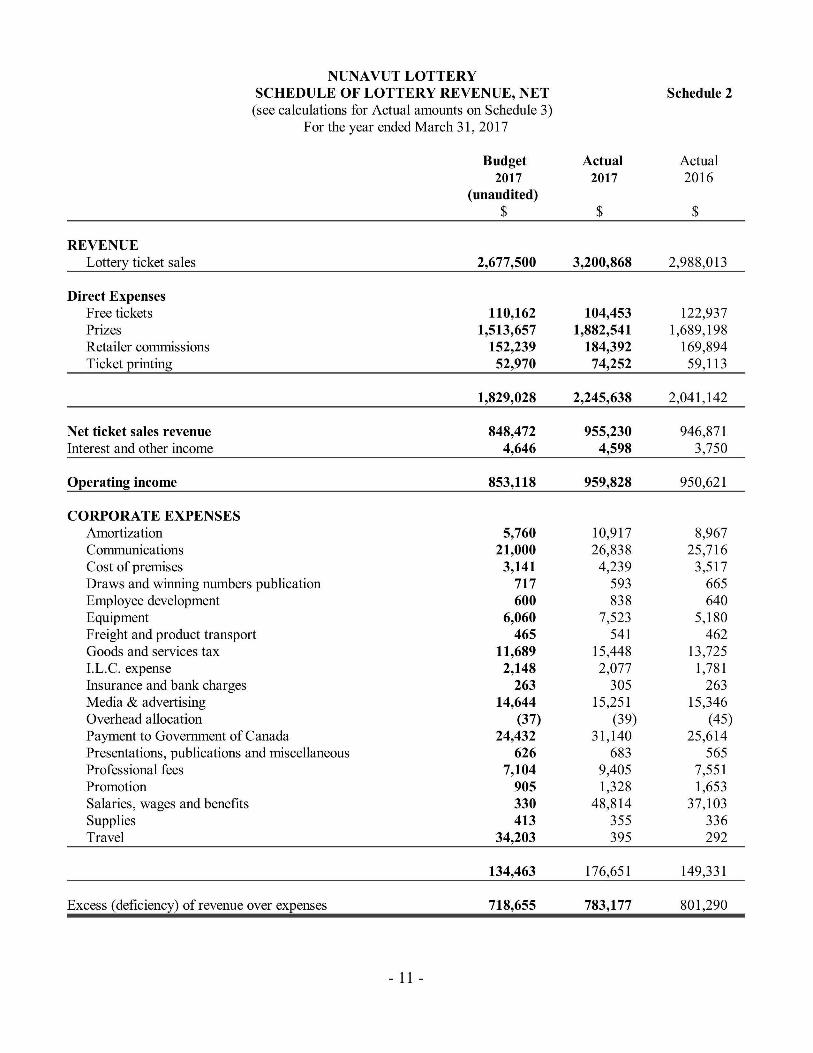
NUNA VUT LOTTERY SCHEDULE OF LOTTERY REVENUE, NET Schedule 2 (see calculations for Actual amounts on Schedule 3)
F or the year ended March 31 , 2017
Budget Actual Actual 2017 2017 2016
(unaudited) $ $ $
REVENUE Lottery ticket sales 2,677,500 3,200,868 2,988,013
Direct Expenses Free tickets 110,162 104,453 122,937 Prizes 1,513,657 1,882,541 1,689,198 Retailer commissions 152,239 184,392 169,894 Ticket printing 52,970 74,252 59,113
1,829,028 2,245,638 2,041,142
Net ticket sales revenue 848,472 955,230 946,871 Interest and other income 4,646 4,598 3,750
Operating income 853,118 959,828 950,621
CORPORATE EXPENSES Amortization 5,760 10,917 8,967 Communications 21,000 26,838 25 ,716 Cost of premises 3,141 4,239 3,517 Draws and winning numbers publication 717 593 665 Employee development 600 838 640 Equipment 6,060 7,523 5,180 Freight and product transport 465 541 462 Goods and services tax 11,689 15,448 13,725 I.L.c. expense 2,148 2,077 1,781 Insurance and bank charges 263 305 263 Media & advertising 14,644 15,251 15,346 Overhead allocation (37) (39) (45) Payment to Government of Canada 24,432 31 ,140 25 ,614 Presentations, publications and miscellaneous 626 683 565 Professional fees 7,104 9,405 7,551 Promotion 905 1,328 1,653 Salaries, wages and benefits 330 48,814 37,103 Supplies 413 355 336 Travel 34,203 395 292
134,463 176,651 149,331
Excess (deficiency) of revenue over expenses 718,655 783,177 801 ,290
- 11 -
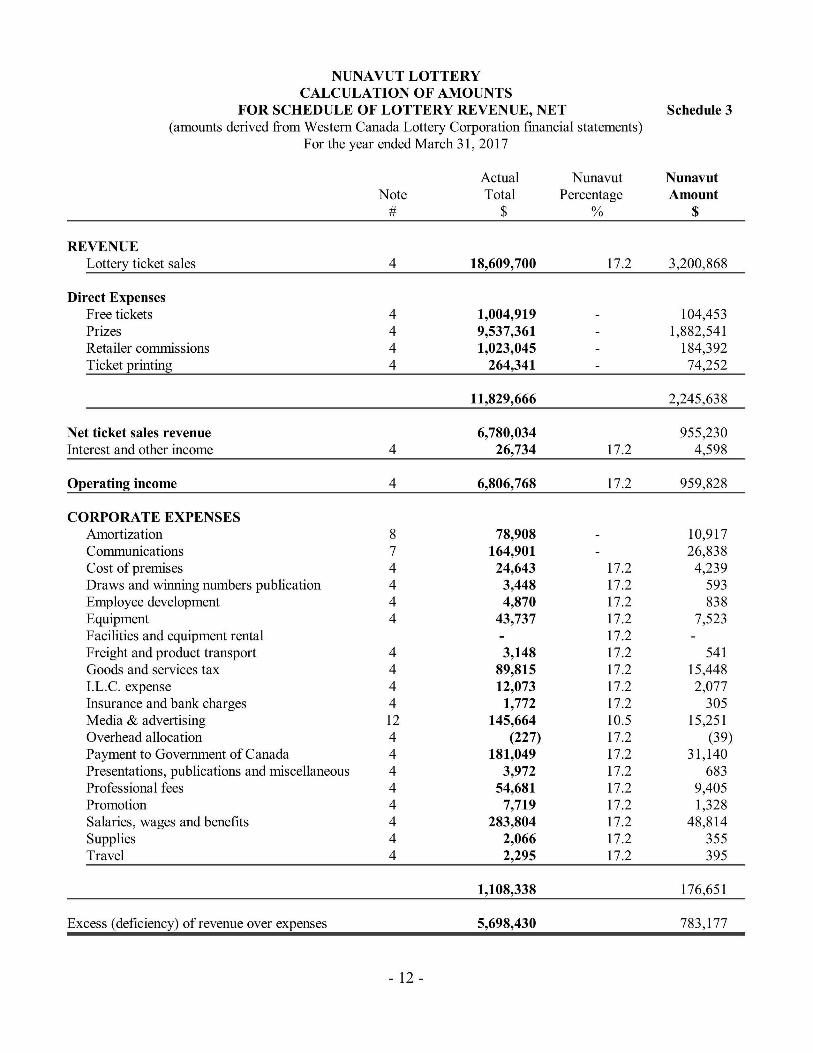
NUNAVUT LOTTERY CALCULATION OF AMOUNTS
FOR SCHEDULE OF LOTTERY REVENUE, NET Schedule 3 (amounts derived from Western Canada Lottery Corporation fmancial statements)
F or the year ended March 31, 2017
Actual Nunavut Nunavut Note Total Percentage Amount
# $ % $
REVENUE Lottery ticket sales 4 18,609,700 17.2 3,200,868
Direct Expenses Free tickets 4 1,004,919 104,453 Prizes 4 9,537,361 1,882,541 Retailer commissions 4 1,023,045 184,392 Ticket printing 4 264,341 74,252
11,829,666 2,245,638
Net ticket sales revenue 6,780,034 955,230 Interest and other income 4 26,734 17.2 4,598
Operating income 4 6,806,768 17.2 959,828
CORPORATE EXPENSES Amortization 8 78,908 10,917 Communications 7 164,901 26,838 Cost of premises 4 24,643 17.2 4,239 Draws and winning numbers publication 4 3,448 17.2 593 Employee development 4 4,870 17.2 838 Equipment 4 43,737 17.2 7,523 Facilities and equipment rental 17.2 Freight and product transport 4 3,148 17.2 541 Goods and services tax 4 89,815 17.2 15,448 I.L.c. expense 4 12,073 17.2 2,077 Insurance and bank charges 4 1,772 17.2 305 Media & advertising 12 145,664 10.5 15,251 Overhead allocation 4 (227) 17.2 (39) Payment to Government of Canada 4 181,049 17.2 31,140 Presentations, publications and miscellaneous 4 3,972 17.2 683 Professional fees 4 54,681 17.2 9,405 Promotion 4 7,719 17.2 1,328 Salaries, wages and benefits 4 283,804 17.2 48,814 Supplies 4 2,066 17.2 355 Travel 4 2,295 17.2 395
1,108,338 176,651
Excess (deficiency) of revenue over expenses 5,698,430 783,177
- 12 -
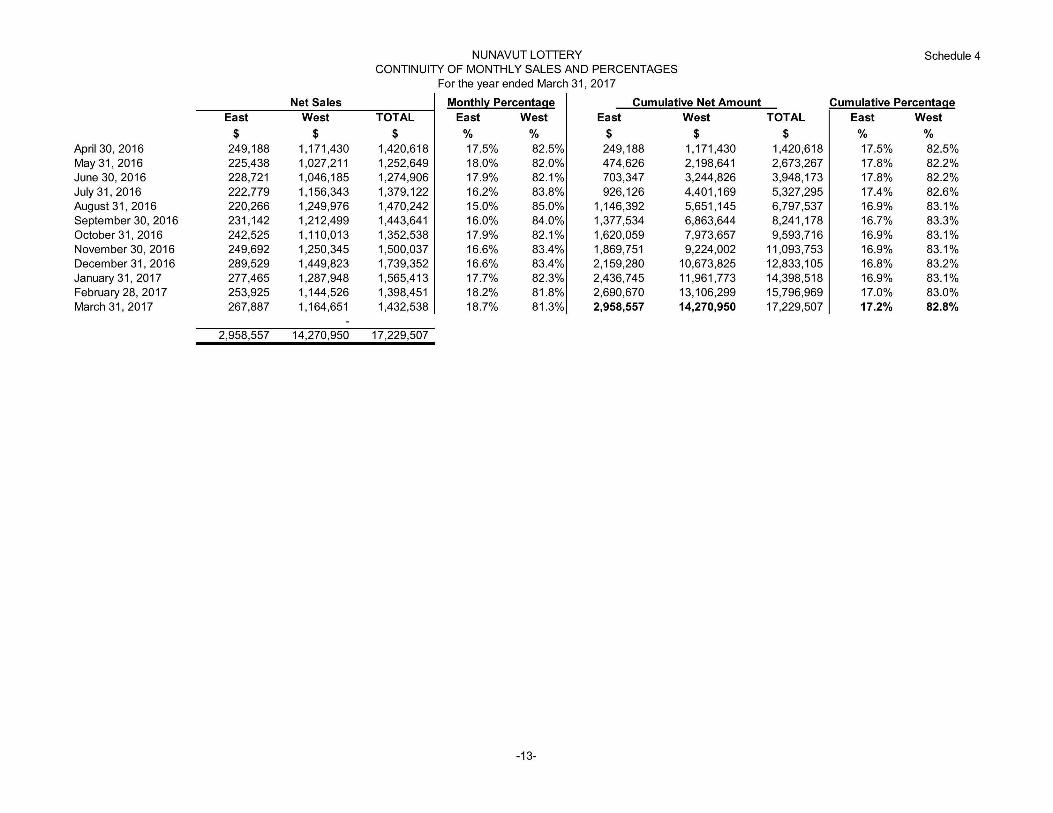
NUNAVUT LOTIERY Schedule 4 CONTINUITY OF MONTHLY SALES AND PERCENTAGES
For the year ended March 31 , 2017
Net Sales Monthl~ Percentage Cumulative Net Amount Cumulative Percentage East West TOTAL East West East West TOTAL East West
$ $ $ % % $ $ $ % % April 30, 2016 249,188 1,171,430 1,420,618 17.5% 82.5% 249,188 1,171,430 1,420,618 17.5% 82.5% May31 , 2016 225,438 1,027,211 1,252,649 18.0% 82.0% 474,626 2,198,641 2,673,267 17.8% 82.2% June 30, 2016 228,721 1,046,185 1,274,906 17.9% 82.1% 703,347 3,244,826 3,948,173 17.8% 82.2% July 31 , 2016 222,779 1,156,343 1,379,122 16.2% 83.8% 926,126 4,401 ,169 5,327,295 17.4% 82.6% August 31 , 2016 220,266 1,249,976 1,470,242 15.0% 85.0% 1,146,392 5,651 ,145 6,797,537 16.9% 83.1% September 30, 2016 231 ,142 1,212,499 1,443,641 16.0% 84.0% 1,377,534 6,863,644 8,241 ,178 16.7% 83.3% October 31 , 2016 242,525 1,110,013 1,352,538 17.9% 82.1 % 1,620,059 7,973,657 9,593,716 16.9% 83.1 % November 30, 2016 249,692 1,250,345 1,500,037 16.6% 83.4% 1,869,751 9,224,002 11 ,093,753 16.9% 83.1% December 31 , 2016 289,529 1,449,823 1,739,352 16.6% 83.4% 2,159,280 10,673,825 12,833,105 16.8% 83.2% January 31 , 2017 277,465 1,287,948 1,565,413 17.7% 82.3% 2,436,745 11 ,961 ,773 14,398,518 16.9% 83.1% February 28, 2017 253,925 1,144,526 1,398,451 18.2% 81 .8% 2,690,670 13,106,299 15,796,969 17.0% 83.0% March 31 , 2017 267,887 1,164,651 1,432,538 18.7% 81 .3% 2,958,557 14,270,950 17,229,507 17.2% 82.8%
2,958,557 14,270,950 17,229,507
-13-