Embed Size (px)
Citation preview

New York CityJanuary 23, 2007
The U.S. Wine Market – Consumer Trends and AnalysisKennewick, WA – February 6, 2008

Wine Market Council Key Facts:
All Tiers of the Industry Involved
Promotion of Imported and Domestic Wines
Focus on Expanding U.S. Consumer Market for Wine
Wine Market Council Mission Statement:
“…to establish the
widespread acceptance of wine as a
rewarding part of American culture
and to encourage the responsible
enjoyment of wine by current and
future generations of adults in the
United States.”
Ongoing Consumer Research Quantitative studies Focus groups and Internet studies
National Public Relations Campaign Target marginal wine consumers Mainstream consumer media Raise comfort level with wine
Wine Market Council Initiatives

New York CityJanuary 23, 2007
2007: “Tipping Point Year”

Core
Marginal
Consumption Frequency Segmentation, 2007
Source: Merrill Research
45%55%
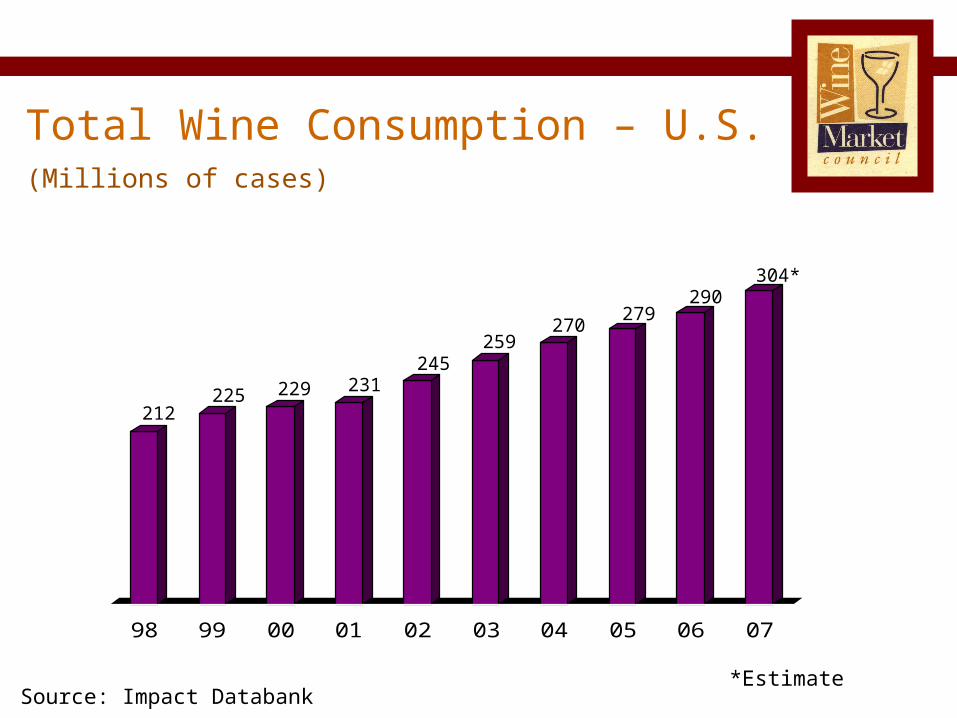
98 99 00 01 02 03 04 05 06 07
Total Wine Consumption – U.S. (Millions of cases)
Source: Impact Databank
212225 229 231
245259
270279
290304*
*Estimate

1970 1975 1980 1985 1990 1995 2000 2005 2007
U.S. Adult Per Capita Table Wine Consumption v. Population Growth
Adult Population
Gallons per Adult
134 147 154 164 173 184 194
1.05
1.78
2.582.29
1.96 2.132.46
2.81
211
Source: U.S. Census Bureau, Adams Beverage Group *Estimate
216*
3.02*

Male
Female
Male v. Female Ratio of Wine Drinkers, 2007
5050 50 50 4753
Millennial Gen X Boomer
Source: Merrill Research
(Percent by segment and generation)

Male Female
Net Gain in Wine Consumption, 2007
Source: Merrill Research
(Net gain “Drinking more wine” vs. year or two ago, by gender)
22%
25%
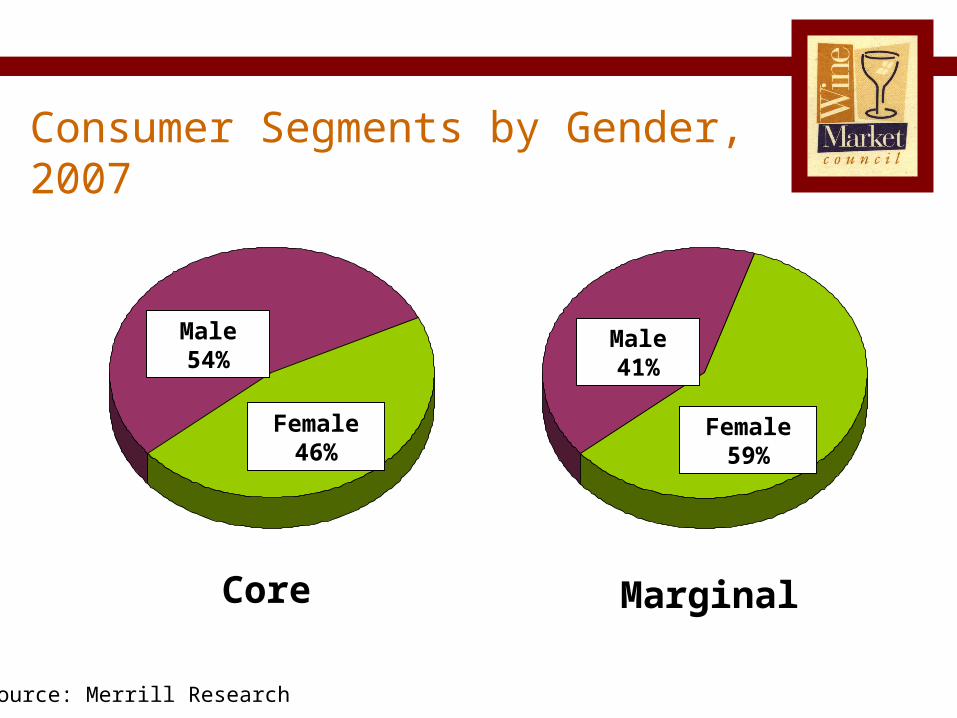
Consumer Segments by Gender, 2007
Core Marginal
Source: Merrill Research
Male 54%
Female 46%
Male 41%
Female 59%

Segments by Age, 2007(Mean)
Core
Marginal
45.6 46.9
Source: Merrill Research

Younger Generations Drive New Growth, 2007(Net percent “drinking more wine” by generation)
Millennial
Gen X
Boomer
Source: Merrill Research
47
37
10
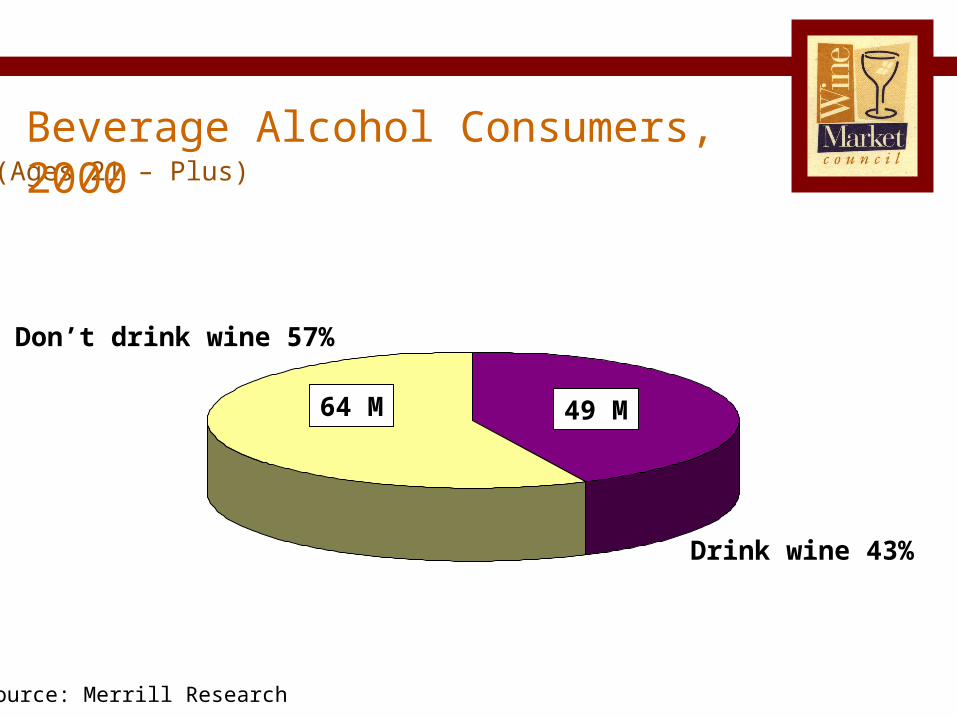
Don’t drink wine 57%
Drink wine 43%
(Ages 21 – Plus)Beverage Alcohol Consumers, 2000
Source: Merrill Research
49 M64 M

Don’t drink wine 43%
Drink wine 57%
(Ages 21 – Plus)Beverage Alcohol Consumers, 2007
Source: Merrill Research
75 M56 M
New York CityJanuary 23, 2007
Consumer Segmentation

Beer/Spirits 25.8%
Core 17.8%
Marginal 17.2%
Non-Drinkers 39.2%
(Ages 21 – Plus)Consumer Segments U.S. Adults, 2007
Source: Merrill Research

0102030405060708090
100
Beer
Spirits
Wine
100
70
82 8680
100
Wine Drinker Consumption of Beer and Spirits, 2007
Core Marginal
Source: Merrill Research
(Percent by segment)

Net Gain/Loss in Beverage Alcohol Consumption, 2007
Source: Merrill Research
(Percentage gain or loss by beverage type)
-15%
23%
-7%
Wine
Beer
Spirits
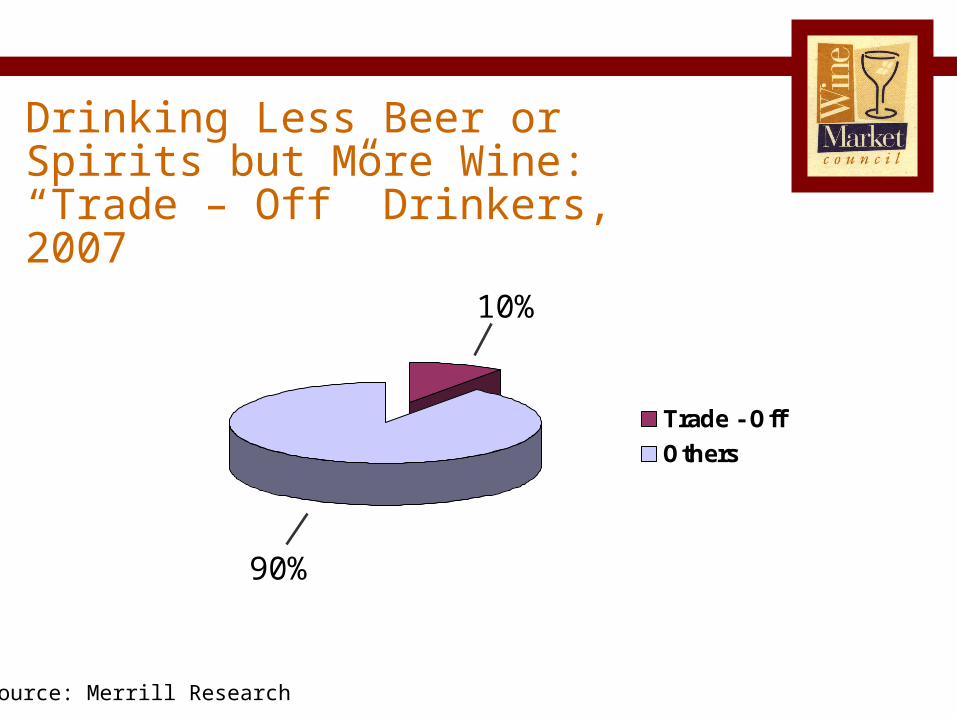
Trade - Off
Others
Drinking Less Beer or Spirits but More Wine: “Trade – Off” Drinkers, 2007
Source: Merrill Research
90%
10%

0
10
20
30
40
50
60
70
Trade - Off
Total
“Trade-Off” Consumers Skew Younger, 2007
1924
34
2427
39
Millennial Gen X Boomer
Source: Merrill Research
1518
Aged 62+
(Percentages by generation)

Core
Marginal
17
28
37
57
26
34
Reasons for Increased Wine Consumption, 2007
More occasions
More per occasion
Both
Source: Merrill Research
(Percentage by statement)

Core
Marginal
2627
3332
17
21
“I would drink more wine if…” 2007
Less $ in restaurant
More affordable
Spouse drank wine
Source: Merrill Research
(Percentage by statement – drinking same or less than year or two ago)
No small children
7
13

New York CityJanuary 23, 2007
Purchase and Usage Behaviors
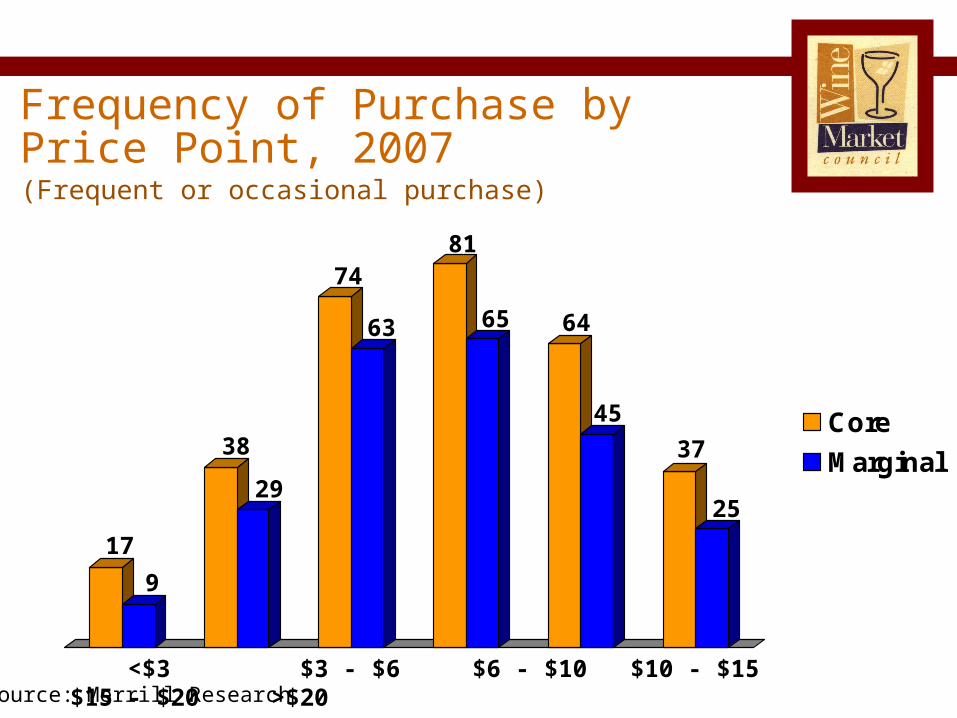
Core
Marginal
Frequency of Purchase by Price Point, 2007(Frequent or occasional purchase)
17
9
38
29
74
63
81
65 64
45
37
25
<$3 $3 - $6 $6 - $10 $10 - $15 $15 - $20 >$20Source: Merrill Research

Color Mix by Segment, 2007
46%
35%
19%
36%
36%
28%
Blush
White
Red
Core Marginal
Source: Merrill Research

Appellation Mix Consumed by Segment, 2007
68%
32%
74%
26%
Imported
Domestic
Core Marginal
Source: Merrill Research

It Fr Aus Gr Sp Nz Ch Ar Sa
Core Marginal
Imported Wine Purchases by Country, 2007(Percent have purchased wine by country in past 3 months)
23
Source: Merrill Research
32
44
26
41
52
26
18
26
1622
12
23
9
18
6
14
6
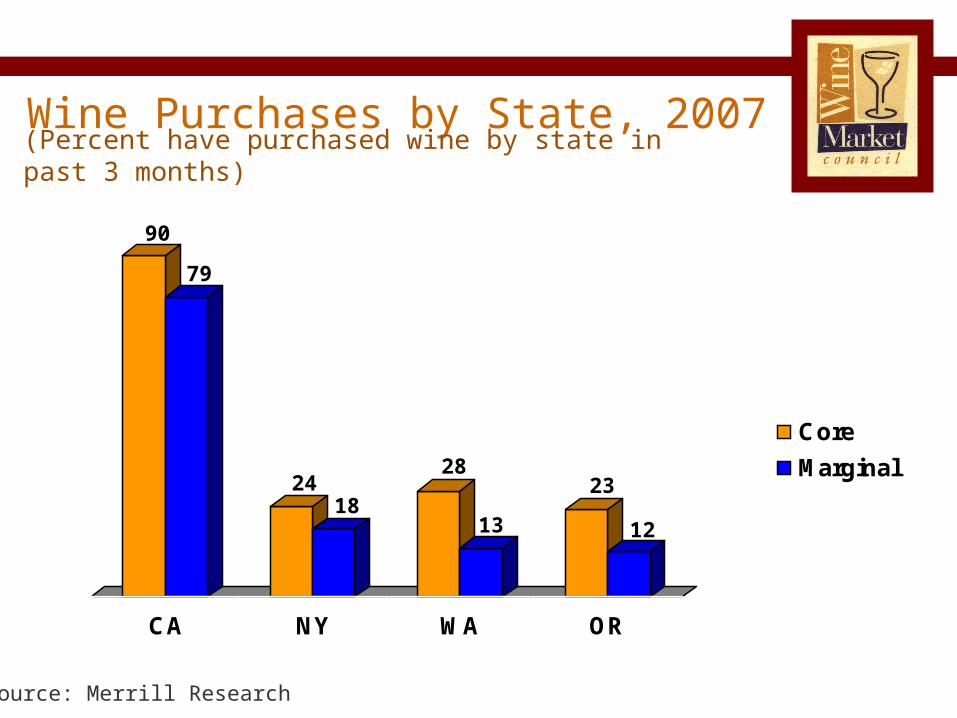
Wine Purchases by State, 2007
CA NY WA OR
Core
Marginal
(Percent have purchased wine by state in past 3 months)
90
79
2418
28
13
23
12
Source: Merrill Research

New York CityJanuary 23, 2007
Winery and Internet Direct Markets
Core
Marginal
135
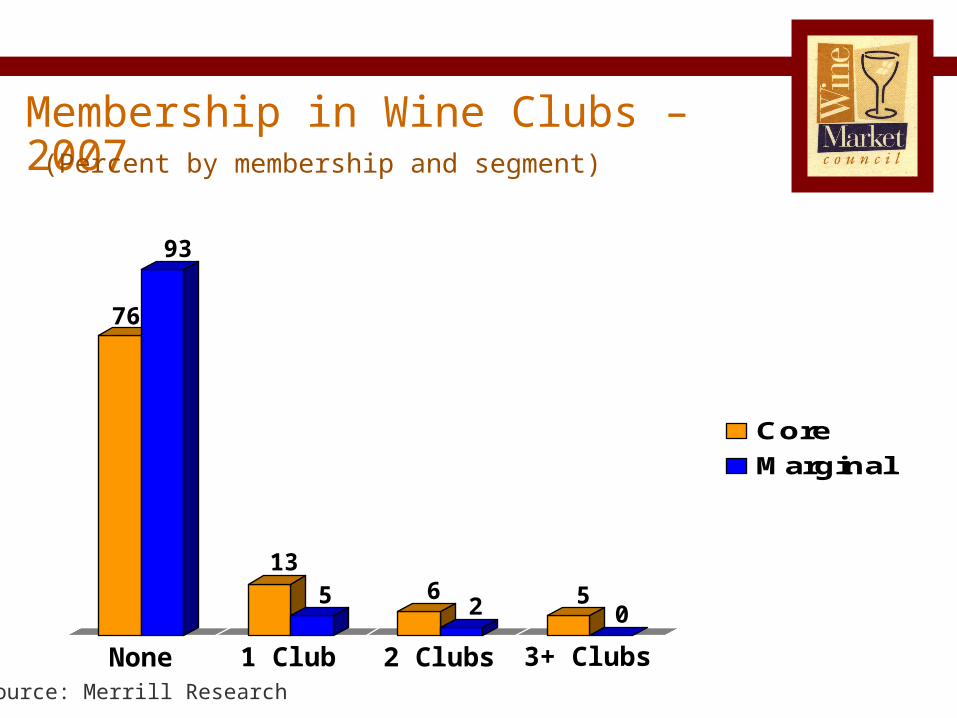
76
93
62
Membership in Wine Clubs – 2007(Percent by membership and segment)
50
None 1 Club 2 Clubs 3+ ClubsSource: Merrill Research

2007 - Ever Purchased Wine Directly from a Winery?(Percent by channel and segment)
Source: Merrill Research
At Winery Mail Order Web Site
Core
Marginal
59
44
15
6
15
7

2007 - Ever Purchased Wine Over the Internet?
0
10
20
30
40
50
Core
Marginal18
9
Source: Merrill Research
(Percent by segment)

Internet Wine Purchases by Channel, 2007(Percent purchase by channel)
Source: Merrill Research
Winery
Retail
Auction
Other
38
35
64

2003
2005
2007
Increase in Winery Online Sales, 2003 - 2007(Percent “ever purchased from winery site”)
Core Marginal
6
1
6
17
Source: Merrill Research
11
5

New York CityJanuary 23, 2007
Millennial Generation

American Generations
WW II (76 and over) 32 Million
Swing (63 - 75) 30 Million
Boomer (44 - 62) 77 Million
Generation X (32 - 44) 44 Million
Millennial (14 - 31) 70 Million
Source: American Generations
(Age ranges in 2008)
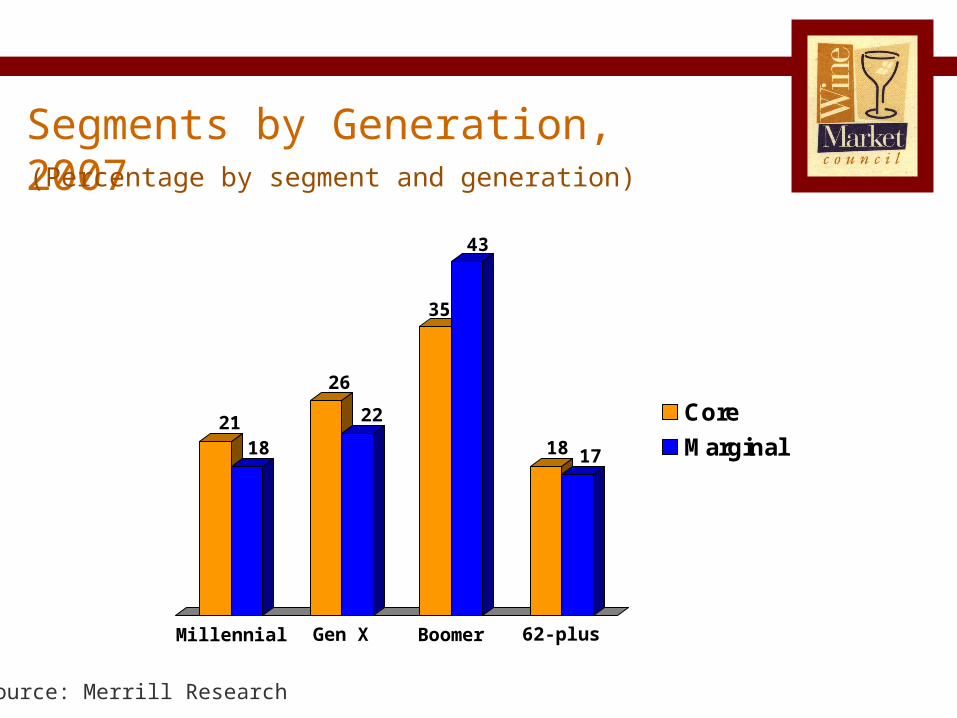
Core
Marginal
26
35
2118
Segments by Generation, 2007
Millennial Gen X Boomer
Source: Merrill Research
(Percentage by segment and generation)
62-plus
18 17
22
43

Wine Consumed Most Often – Imports vs. Domestic - by Generation, 2007
60%
40%
68%
32%
74%
26%
Imported
Domestic
Millennial Gen X
Source: Merrill Research
Boomer

Imported Wine Purchases by Country, 2007
0
10
20
30
40
50
60
70
80
It Fr Au Gr Sp Nz Ch Ar Sa
Millennials
All Respondents
(Percent have purchased wine by country in past 3 months)
43
57
36
50
3336
2322 2422
Source: Merrill Research
27
18 18 17 1513 1310
05
101520253035404550
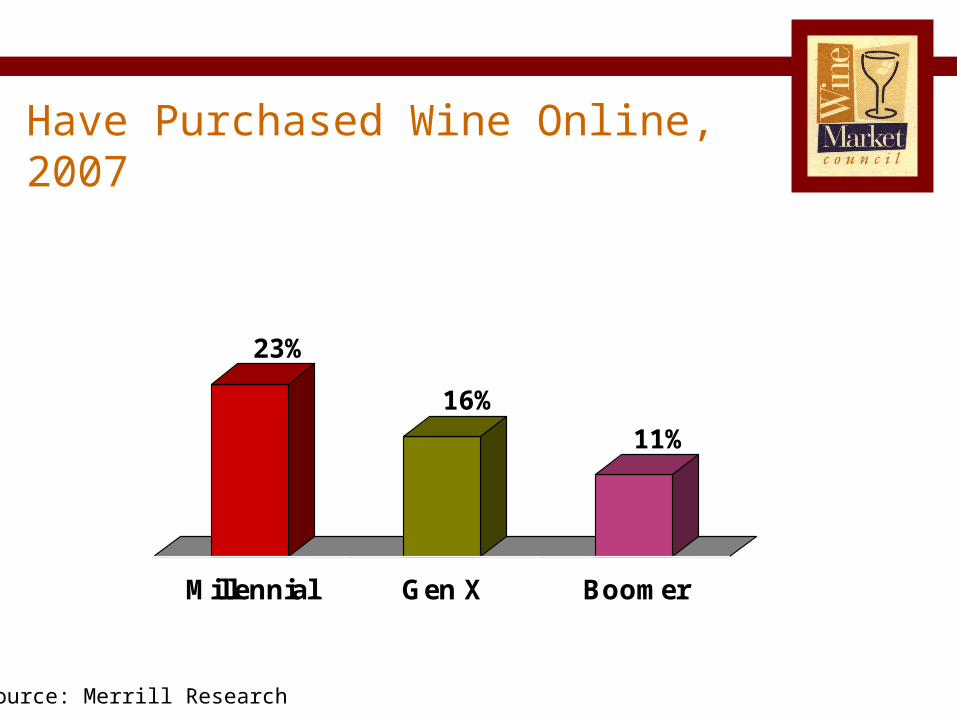
Millennial Gen X Boomer
Have Purchased Wine Online, 2007
23%
16%
11%
Source: Merrill Research

Millennial Gen X Boomer
Importance of Information from the Internet when purchasing Wine, 2007(Top 3 box)
49%
36%
21%
Source: Merrill Research

New York CityJanuary 23, 2007
The U.S. Wine Market – Consumer Trends and AnalysisKennewick, WA – February 6, 2008