Embed Size (px)
Citation preview
Munich Personal RePEc Archive
New Wars in Numbers. An exploration
of various datasets on intra-state
violence.
Rigterink, Anouk S.
London School of Economics and Political Science; Security in
Transition Research Programme
2012
Online at https://mpra.ub.uni-muenchen.de/45264/
MPRA Paper No. 45264, posted 20 Mar 2013 14:46 UTC
New Wars in numbers An exploration of various datasets on intra-state violence
Anouk S. Rigterink
Abstract
This paper investigates to what extent various data sources on violent conflict support the ‘New War’ thesis put forward by Mary Kaldor (2006). It presents two
interpretations of the ‘New War’ thesis: (1) ‘New War’ characteristics are becoming relatively more prevalent in modern warfare; (2) measuring war in terms of ‘New War’ as opposed to ‘Old War’ characteristics matters for which variables are correlated to
war. In concurrence with the ‘New War’ thesis, currently available data suggests that the ratio of civilian to military deaths from battle has increased significantly over the
period 1946-2010, as has the violence against civilians over the period 1989-2010. Evidence on the participation of non-state combatants is mixed, although some
evidence favouring the ‘New War’ thesis is found. Overall, the data supports the idea that the character of war has changed since 1946, on at least one aspect. There is no
indication that these trends have intensified after the end of the Cold War. With
regard to the second interpretation of the ‘New War’ thesis, a number of variables conventionally used to explain conflict are more strongly correlated to certain types of
wars than others, but convincing patterns remain limited to a handful of variables.
Introduction
Has the character of warfare changed since the end of the Second World War? Proponents of the ‘New War’ thesis argue that it has, and/or that the changing nature of war has become more pronounced
since the end of the Cold War in 1989. A number of variations to this argument exist (see (Melander, Öberg, and Hall 2009) for an overview). However, having coined the term, Mary Kaldor’s book on ‘New and Old Wars’ is often held up as emblematic of the ‘New War’ thesis (Kaldor 2006). Mary Kaldor describes ‘New Wars’ as being increasingly fought over identities rather than ideologies by non-state combatants rather than regular state armies, engaging in attacks on the civilian population rather than direct military encounters, and
undermining rather than building the State, among other characteristics. The idea of ‘New War’ has been criticized on numerous points. The afterword of the newest (third)
edition of the book summarizes a large proportion of these as: “New Wars are not new” and “New Wars are not war”. The first strand of critique highlights that many of the aspects of so-called ‘New War’ can be seen in wars much older than the Second World War and in some cases coins the idea ahistorical (see for example
(Newman 2004)). “New Wars are not war” refers to the debate surrounding the difference between war and crime and the argument that violence needs to have a political agenda to be called ‘war’. A third category of
criticism concerns the data used to support the ‘New War’ argument. Especially the claim that the ratio of military to civilian casualties has been reversed from 8 military deaths to 1 civilian dead in the early 1900s to 8
civilian deaths for each military casualty in the late 1990s has come under fire (Roberts 2011). This paper will
speak to this third category of criticism.
This paper will investigate whether there is evidence for the ‘New War’ thesis in a number of existing
datasets, notably the Correlates of War (CoW), the Armed Conflict Location and Event Dataset (ACLED) and numerous datasets produced by the Uppsala Conflict Data Programme (UCDP). In order to do so, it will
present two possible interpretations of the ‘New War’ thesis and derive hypotheses accordingly. The first follows Kaldor’s original interpretation, stating that conflict worldwide has increasingly displayed ‘New War’ characteristics relative to ‘Old War’ characteristics. This trend supposedly started after the Second World
War, picking up speed after 1989. Accompanying hypotheses predict that the military to civilian casualty ratio has increased over this period, and that violence against civilians as well as fighting by non-state combatants
has become more common relative to other war activities. The second interpretation follows from the preface of the third edition of ‘New and Old Wars’. Herein, Kaldor argues that even if ‘New Wars’ are neither ‘new’ nor ‘war’, the concept still has value because “the preoccupation with old war […] prevents us from
developing policy relevant analysis”. Translating this into a hypothesis, this paper investigates whether measuring war by ‘Old War’ or ‘New War’ characteristics matters for what we think are the determinants of
conflict onset, prevalence and intensity. These hypotheses by no means exhaustively cover the ‘New War’ thesis, but are designed such that they can be tested with currently available data.
There is certainly no shortage of literature investigating trends in global conflict; the Human Security Report does this on a yearly basis, as do the papers accompanying the release of each updated version of
various datasets. Although these analyses have some implications for the ‘New War’ thesis, they often consider trends in conflict in absolute terms (e.g. is the overall number of wars, casualties, etc. increasing or decreasing?), whilst the ‘New War’ thesis is a relative statement (‘New Wars’ become more common relative to
other types of war). One relative trend that has gotten considerable attention is the percentage of all wars that is categorized as ‘intra-state conflict’. Although increasing by most accounts (Human Security Report Project
2012; Themnér and Wallensteen 2011), this is a rather rough test of the ‘New War’ thesis. Furthermore, more
‘event-based’ conflict data has become available over the last years, making it possible to research trends within various violent conflicts, rather than between broad categories of war. Therefore, this paper makes use
newly available data to investigate relative trends, within various forms of violence classified as intra-state. The paper concludes that overall, currently available data provides evidence for the idea that the
character of war has changed since 1945 on at least one aspect. Data suggests that the ratio of civilian to
military deaths from battle has increased significantly over the period 1946-2010. Furthermore, a relative increase in violence against civilians is found over the period 1989-2010. Evidence regarding the participation
of non-state combatants in conflict is mixed, with some datasets supporting the ‘New War’ thesis while others do not. Despite this upward relative trend in most ‘New War’ characteristics, no evidence is found
suggesting that these trends have become more pronounced after the end of the Cold War. With regard to
the correlates of war onset, prevalence and intensity, there is some tentative evidence that different sets of variables are related to different types of war. However, the difference is not as large as the ‘New War’ thesis might lead us to expect and remains limited to a small number of variables. The remainder of this paper is organized as follows. Section two considers existing literature. Section
three sets out the two interpretations of the ‘New War’ thesis, hypotheses to be tested and data used in more
detail. Sections four and five present results for the two interpretations of the ‘New War’ thesis. The final section concludes.
Literature
For the purpose of this section, I distinguish four strands of related literature: papers setting up a direct quantitative test of one or more ‘New War’ hypotheses, the debate surrounding the military to civilian casualty ratio, the debate on whether war is becoming more or less prevalent globally, and papers examining
the differences between various datasets on war.
A number of papers explicitly set up a test of the ‘New War’ thesis. Chojnacki (2006) for example, equates ‘New War’ with ‘Sub-State War’ and aims to find out whether this is now the dominant form of
violence. Sub-state war is defined as ‘violence between non-state actors within or across national borders’. Chojnacki proposes to add this new category of war to common war typologies (see next section). To be categorized as such, any type of war commonly has to cause more than 1000 deaths. Taking into account the
‘New War’ argument that civilians are often targets of violence, Chojnacki proposes that deaths as a result of deliberate civilian victimization should ‘count’ towards this threshold. Recoding and integrating several
datasets on war using these criteria, he recognizes 166 wars over the period 1946-2003, 16 of which are sub-
state wars. Chojnacki therefore rejects the hypothesis that ‘New War’ is now the dominant form of violence, although he recognizes that sub-state wars have grown in relative importance (from constituting 5% of all
wars in the ‘70s to 25% of wars post 2000) (Chojnacki 2006). Using another formulation of the ‘New War’ thesis, Melander, Öberg and Hall (2009) investigate
whether the human impact of war has worsened since the end of the Cold War. The authors propose four
indicators for the human impact of war: the average number of battle-related deaths per conflict-year, the average number of civilians killed in genocide or politicide per conflict-year, the average number of civilians
displaced per conflict-year, and the ratio of civilian to military casualties. They conclude that conflict-years after 1989 were on average associated with fewer rather than more battle-related and civilians deaths. The
authors furthermore find no evidence to support that the average number of displaced people was systematically higher over the post-Cold War period as a whole. Lastly, the authors argue that the hypothesis
regarding the military to civilian casualty ratio can be tentatively dismissed, in light of the fact that the number
of civilian casualties is not systematically higher post 1989, even when controlling for the number of battle-related deaths (Melander, Öberg, and Hall 2009). Although the last idea has some intuitive merit, I ultimately
find it unconvincing. The battle-related deaths dataset used includes civilian deaths from battle (very broadly defined), so changes in who is targeted by war may already be hidden in this single number. Furthermore, the
approach assumes that controlling for battle-related deaths captures completely the downward trend in
overall violence, leaving a dummy for a post 1989 to pick up any changes in the military to civilian casualty ratio. In practice however, the overall downward trend is very strong and correlated to both the number of
battle-related deaths and the dummy, which could easily prevent the dummy from picking up even very substantial changes in the military to civilian casualty ratio.
These papers illustrate that there is a lack of clarity about what is and what is not claimed by
individual proponents of the ‘New War’ thesis. The illustrated papers formulate the ‘New War’ thesis mostly in an absolute sense: the absolute number of casualties or displaced must have increased, or the absolute
number of sub-state wars must be highest. Some ‘New War’ authors indeed seem to take this line of argument, for example by stating that current wars are “nasty, brutish and long”(Holsti 1996). However, a
close reading of the book ‘New and Old Wars’ and a conversation with the author indicate that Mary Kaldor
does not employ this absolute argument, but poses instead that ‘New War’ is becoming relatively more

important compared to other forms of war.1 This does not exclude the possibility of an absolute decrease in
the ‘human cost of war’, as the following example will illustrate. Imagine the global number of battle-related deaths per year has decreased ten-fold over some period, from 400 to 40. Battle-related deaths used to consist
of 75% combatant deaths versus 25% civilian deaths, but the ratio has since been reversed. These numbers both show a marked decline in the absolute number of civilians killed in battle (100 in the past versus 30
now) and a clear increase in the relative importance of civilian death in battle (from 25% of total deaths in the
past to 75% now). A different expression of this preference for the absolute is evident when Chojnacki only considers wars fought exclusively between non-state parties as ‘New War’. However, it is entirely possible that
‘New War’ elements, such as targeting of civilians or fighting by irregular forces, have become more common within more traditional categories of war.
In the wider literature, the global (absolute) trend in violent conflict has also received a lot of
attention. The debate has centered on whether the world is now more or less war-prone or violent than it was in the past. Without fully doing justice to this literature, we can discern that around 2003, there was a
tendency to say that the world was becoming more violent. Often quoted are Sarkees, Wayman and Singer 2003, stating that “risk of death in battle trended neither up or down since the date of Napoleon’s exile” and that “we are living through one of the worst decades in human history”, as the 1990s ranked number two on the list of decades with the highest number of war onsets (Sarkees, Wayman, and Singer 2003). In addition,
Fearon (2004) noted an alarming increase in the average duration of war (Fearon 2004). In later years
however, the trend has been to say that the world is becoming more peaceful. Lacina, Gleditch and Russet (2006) for example, present an article on the “declining risk of death in battle”, arguing that earlier
conclusions on this risk being constant were an artifact of the outliers formed by the World Wars and inconsistently gathered data (Lacina, Gleditsch, and Russet 2006). The latest Human Security Report aims to
disabuse us of the notion that wars last increasingly long (Human Security Report Project 2012). The
sentiment is put forward most boldly by Steven Pinker, who states that mankind has become progressively less violent since its inception (Pinker 2011). In my assessment, this turnaround is partly due to a
disagreement on how to collect and interpret data on wars and partly a consequence of data on wars in the years late 1990s and 2000s becoming available. Lower numbers of wars in these years have altered our
outlook on the overall trend.
Overall, I would say that according to the current state of knowledge, the number of wars and the number of battle-related casualties is decreasing globally. However, this conclusion may again change, as
datasets continue to expand in the future. Furthermore, an increasing percentage of the remaining wars are civil wars (Human Security Report Project 2012; Themnér and Wallensteen 2011). Again, I would like to
point out that most of the debate concerns absolute trends in violence and rarely looks at relative trends within
broad categories of war.
The military to civilian casualty ratio is the subject of another debate. Kaldor states in her book that this ratio reversed from 8 military deaths to 1 civilian dead at the beginning of the 20th century, to a ratio of
1:8 in the 1990s. Although this number has often been repeated, a consensus emerged that it is not based on
any reliable source (see for example (Roberts 2011) for an investigation of the origin and spread of this particular ‘fact’). Whether it is therefore untrue, and if so, what the true military to civilian casualty ratio is remains unclear, and the issue will likely not be resolved in the foreseeable future given the unreliable reporting of civilian casualties. We do have some estimates for individual wars. Roberts (2011) estimates that
civilians make up 40% of violent deaths in Bosnia and Herzegovina, and anywhere between 66% and 90% in
1 Informal conversation, Mary Kaldor, 27 November 2012.
Iraq. Lacina and Gleditsch (2005) consider the percentage of total war deaths that is not battle-related in ten
civil wars and present numbers in the range of 70-97%, although they have doubts on the accuracy of the data on total war deaths (Lacina and Gleditsch 2005). Investigation into the development of this ratio over
time has remained limited. Exceptions are Eckhardt (1989), who argues that the ratio has remained stable at 50% of the last three centuries, but who is unclear about the source of his data and in need of updating
(Eckhardt 1989) and the earlier mentioned assertion by Melander, Öberg and Hall (2009).
Confusion arises when it is unclear what exact death number is used. ‘Battle-related deaths’ is often rephrased as deaths of combatants in battle, while most battle-related death numbers include civilian deaths
due to battle. The definition of battle is furthermore not the same across different datasets. A term such as ‘war casualties’ is often taken to mean ‘deaths in war through violence’, but could also include deaths in war due to starvation or disease.
Overall, studies exist investigating whether current data support the ‘New War’ thesis and (more
commonly) overall trends in global violence. These studies have overall been critical of the ‘New War’ thesis, although it is common to see the thesis interpreted in ways that are not supported by ‘New War’ authors themselves. Unlike these studies however, the current paper investigates the relative importance of ‘New War’ over time. Furthermore, it will look at trends within intra-state war, which is made possible by the publication
of new datasets on conflict events such as ACLED or the UCDP Geo-referenced Event Database (UCDP-
GED). Using and comparing the results from different datasets, this study bears some resemblance to
studies comparing the merits of different datasets, for example ACLED and UCDP-GED (Eck 2012) or the event dataset collected by the Colombian organization CERAC and various cross-country datasets (Restrepo,
Spagat, and Vargas 2006). These studies however, aim to see to what extent differences between these
datasets can be explained by different coding rules. Rather than attempting to remove differences between datasets, the current paper will exploit these them. Lastly, by analyzing whether conclusions on what variables
are related to war change when we change the measure of war, this paper is strongly influenced by Sambanis (2005), who points out that minor differences in coding rules can have large consequences for which variables
are thought to be related to war (Sambanis 2004).
Data and hypotheses
The ‘New War’ thesis
The aim of this section is to translate the ‘New War’ thesis into a number of hypotheses that can be tested using currently available data. In order to do so, I will first briefly present a number of characteristics
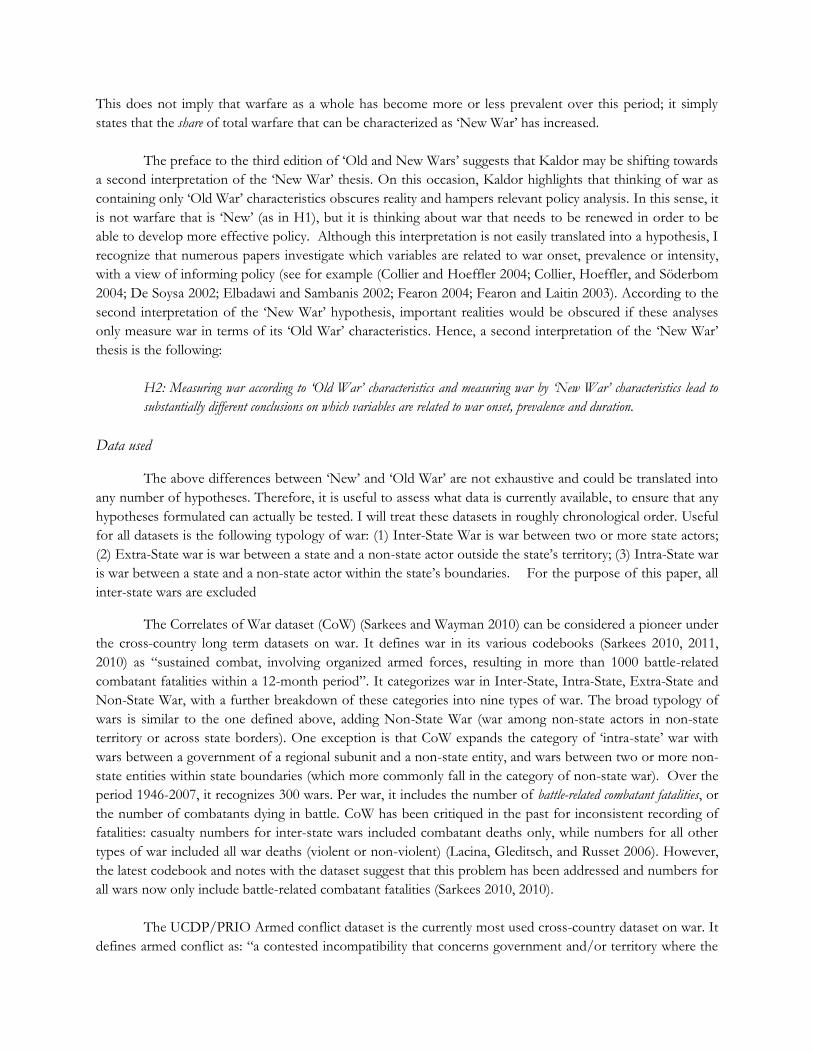
of ‘Old War’ and ‘New War’, as described in Mary Kaldor’s book. Table 1 summarizes these differences.
‘New Wars’ differ from ‘Old Wars’ in who fights, who is targeted and how fighting occurs. ‘Old Wars’, Kaldor argues, are fought between states employing regular uniformed combatants, making who fights whom abundantly clear. ‘New Wars’ by contrast, are fought by a myriad of not easily recognizable armed
groups; these groups may fight the state army, they may fight each other, they may fight with covert or not so covert state support, or any combination of these at any particular time.
With regard to who is targeted: ‘Old War’ is won through weakening (read: killing a large proportion of) the enemy’s military forces, hence engaging these directly in battle is the main form of warfare. As long as civilians do not stand in the way of this ‘military necessity’, they are not targeted. In ‘New War’ it is argued,
armed groups attempt to control territory through controlling the population. This resonates with the
argument that ‘New Wars’ are fought along identity, rather than ideological lines. Instead of defeating the state with a competing ideology, it becomes a tactic of war to remove individuals with a different identity or
ethnicity from a particular territory and to instill fear of retribution by this other group, through forced displacement, rape and ethnic cleansing. This by definition means that civilians are the main targets of
violence.
The above characteristics have implications for what warfare looks like. Clear groups of combatants having battles over territory implies a war with clear front lines, whilst disparate armed groups targeting
civilians result in a ‘leopard skin’ pattern of enclaves held by different groups. In the war in Bosnia Herzegovina for example, Bosnian groups controlled most population centers, with Serbian and Croat groups
holding most power in the country side. Lastly, there is a large and influential literature on the state-building
effect of taxing the population to build an army protecting against an outside military threat; an effect that Kaldor argues is limited to ‘Old Wars’. ‘New Wars’, she poses, undermine rather than build the state, as
looting, illegal trade and diaspora financing create revenue flows that bypass the central government.
Table 1: some characteristics of Old and New War Old War New war
Fought between states. Fought by numerous non-state groups.
Distinction combatant – non-combatant clear Combatants not easily recognizable; blurring
distinction combatant - criminal.
‘Military necessity permitting’ civilians are not targeted
Civilians are main victims
Controlling territory through direct military engagement with opposing groups (i.e. battle)
Controlling territory through controlling population (displacement, rape, ethnic
cleansing weapons of war). Avoidance of direct
military encounters.
Clear front line Patchwork of enclaves controlled by different groups
State-building effect of war financing Violence financed by looting, hostage taking,
illegal trade, diaspora; international networks tied into conflict
The above table sketches an ideal type; in practice it is likely that all wars display both ‘Old War’ and
‘New War’ characteristics to a certain extent. Keeping this in mind, one interpretation of the ‘New War’ thesis is the following:
H1: Warfare globally has increasingly displayed ‘New War’ characteristics relative to ‘Old War’ characteristics since
1946. This development accelerated after 1989.
This does not imply that warfare as a whole has become more or less prevalent over this period; it simply
states that the share of total warfare that can be characterized as ‘New War’ has increased.
The preface to the third edition of ‘Old and New Wars’ suggests that Kaldor may be shifting towards a second interpretation of the ‘New War’ thesis. On this occasion, Kaldor highlights that thinking of war as
containing only ‘Old War’ characteristics obscures reality and hampers relevant policy analysis. In this sense, it
is not warfare that is ‘New’ (as in H1), but it is thinking about war that needs to be renewed in order to be able to develop more effective policy. Although this interpretation is not easily translated into a hypothesis, I
recognize that numerous papers investigate which variables are related to war onset, prevalence or intensity, with a view of informing policy (see for example (Collier and Hoeffler 2004; Collier, Hoeffler, and Söderbom
2004; De Soysa 2002; Elbadawi and Sambanis 2002; Fearon 2004; Fearon and Laitin 2003). According to the
second interpretation of the ‘New War’ hypothesis, important realities would be obscured if these analyses only measure war in terms of its ‘Old War’ characteristics. Hence, a second interpretation of the ‘New War’ thesis is the following:
H2: Measuring war according to ‘Old War’ characteristics and measuring war by ‘New War’ characteristics lead to substantially different conclusions on which variables are related to war onset, prevalence and duration.
Data used
The above differences between ‘New’ and ‘Old War’ are not exhaustive and could be translated into any number of hypotheses. Therefore, it is useful to assess what data is currently available, to ensure that any
hypotheses formulated can actually be tested. I will treat these datasets in roughly chronological order. Useful for all datasets is the following typology of war: (1) Inter-State War is war between two or more state actors;
(2) Extra-State war is war between a state and a non-state actor outside the state’s territory; (3) Intra-State war is war between a state and a non-state actor within the state’s boundaries. For the purpose of this paper, all
inter-state wars are excluded
The Correlates of War dataset (CoW) (Sarkees and Wayman 2010) can be considered a pioneer under the cross-country long term datasets on war. It defines war in its various codebooks (Sarkees 2010, 2011,
2010) as “sustained combat, involving organized armed forces, resulting in more than 1000 battle-related
combatant fatalities within a 12-month period”. It categorizes war in Inter-State, Intra-State, Extra-State and Non-State War, with a further breakdown of these categories into nine types of war. The broad typology of
wars is similar to the one defined above, adding Non-State War (war among non-state actors in non-state territory or across state borders). One exception is that CoW expands the category of ‘intra-state’ war with wars between a government of a regional subunit and a non-state entity, and wars between two or more non-
state entities within state boundaries (which more commonly fall in the category of non-state war). Over the period 1946-2007, it recognizes 300 wars. Per war, it includes the number of battle-related combatant fatalities, or
the number of combatants dying in battle. CoW has been critiqued in the past for inconsistent recording of fatalities: casualty numbers for inter-state wars included combatant deaths only, while numbers for all other
types of war included all war deaths (violent or non-violent) (Lacina, Gleditsch, and Russet 2006). However,
the latest codebook and notes with the dataset suggest that this problem has been addressed and numbers for all wars now only include battle-related combatant fatalities (Sarkees 2010, 2010).
The UCDP/PRIO Armed conflict dataset is the currently most used cross-country dataset on war. It
defines armed conflict as: “a contested incompatibility that concerns government and/or territory where the
use of armed force between two parties, at least one of which is the government of a state results in at least
25 battle-related deaths [for minor armed conflict and at least 1000 battle-related deaths for war]”. It recognizes Extra-Systemic (Extra-State) War, Inter-State War and Intra-State War, and distinguishes
‘Internationalized Intra-State War’ (Intra-State war with a second government intervening militarily) as a fourth category (Themnér 2011). Where CoW takes the war as the unit of analysis, UCDP/PRIO records
conflict-country-years, i.e. each year that a particular country is experiencing particular conflict is a separate
entry in the dataset. This implies that a particular country can experience more than one conflict in a given year. Over the period 1946-2010 the dataset includes 2022 conflict-country-years and 245 unique conflicts.
For the period 1989-2010, UCDP provides data on battle-related deaths for all conflict-country-years in the main dataset. The UCDP Battle-Related Deaths Dataset defines its core variable as “those deaths that can be directly related to combat over the contested incompatibility”. Including both military and civilian
deaths, this definition is considerably broader than that of CoW. Although combat is not explicitly defined, it is stated to include battle-field activity, guerilla activity, bombing and urban warfare, in as far these target the
military forces or other “representatives” of the parties to the conflict (Sundberg 2011). Possibly in response to critiques that the UCDP datasets are exclusively state-based, UCDP has
recently started producing two more datasets, on ‘Non-State Conflict’ (Sundberg, Eck, and Kreutz 2012) and ‘One-Sided Violence’ (Eck and Hultman 2007). The former is defined as “the use of armed force between
two organized armed groups, neither of which is the government of a state, which results in at least 25 battle-
related deaths in a year” (Sundberg 2010) and the latter as “the use of armed force by the government of a state or by a formally organized group against civilians which results in at least 25 deaths a year” (Kreutz
2008). The structure of both datasets is very similar to the larger Armed Conflict Dataset. Both cover the period 1989-2010, recognizing 601 country-years in non-state conflict (392 unique non-state conflicts) and
680 country-years with one-sided violence respectively. It is worth noting that fatalities are only included in
the one-sided violence dataset if the killing of civilians was intentional and a direct result of the use of armed force.
Lacina and Gleditsh (2005) (L&G) provide an alternative dataset on battle-related fatalities. It covers
all conflict-country-years included in the UCDP/PRIO Armed Conflict Dataset, up to 2008. The definition
of ‘battle-related death’ is on first glance very similar to that employed by UCDP, essentially deaths resulting from direct combat. In practice however, ‘combat’ for Lacina and Gleditsch seems to encompass more than for UCDP, as combat can be violence against both military and civilian targets with the only requirement that the perpetrator faces an immediate threat of lethal force from the opposing forces. By this reasoning, terrorist
attacks such as those on 9/11 constitute combat and casualties from it are battle-related deaths. Massacre also
constitutes combat, as long as there is a possibility that the perpetrator will face a reciprocal threat.
The Armed Location Conflict and Event Dataset (ACLED) has pioneered a new form of cross-country dataset, in which the unit of analysis is not the conflict or the conflict-country-year, but the conflict
event (Raleigh and Hegre 2005). Although not explicitly defined, events appear to be actions by organized political groups over issues of political authority. Individual events are taken from news reports and their
type, geo-coded location and date is subsequently coded. ACLED recognizes ‘violence against civilians’ and ‘battle’ as necessarily violent event types, where the latter is defined as violence between two armed groups,
not necessarily including a government, and subcategorized according to whether changes in territory result.
In addition, ACLED also includes ‘riots and protests’, ‘headquarters or base established’, ‘non-violent conflict event’ and ‘non-violent transfer of location control’ (Raleigh, Linke, and Dowd 2012). These events are
excluded for the purpose of this paper, as they are not necessarily violent. ACLED covers only African
countries for the period 1997-2012 and includes 53.053 individual events.
Lastly, in 2012 UCDP published its own event-based dataset, the UCDP Geo-referenced Event Dataset (UCDP-GED). This explicitly defines an event as: “The incidence of the use of armed force by an
organized actor against another organized actor, or against civilians, resulting in at least 1 direct death in either the best, low or high estimate categories at a specific location and for a specific temporal duration”
(Sundberg, Lindgren, and Padskocimaite 2010). It covers African countries over the period 1989-2010 and includes 21.860 events.
UCDP-GED, unlike ACLED, only covers events in country-years that are included in the UCDP
Armed Conflict, Non-State Conflict or One-Sided Violence datasets, i.e. years in which a country experiences some type of conflict according to UCDP’s definitions above. Furthermore, it does not code individual
events according to some typology, but indicates which type of conflict the event is considered to be associated with. Further differences between ACLED and UCDP-GED are the following: (1) UCDP-GED
records only ‘deadly events’ i.e. events with at least one casualty, while ACLED has no such requirement; (2) ACLED codes events as happening on a single day and appears to record every new day of fighting as a new event, whereas UCDP-GED records violence stretching out over multiple days as a single ‘continuous event’; (3) UCDP-GED includes ‘summary events’, multiple instances of violence for which no disaggregate information is available (e.g. when the news report reads: “in the past month, X people were killed in violence”), ACLED does not; (4) UCDP-GED requires the organized actor perpetrating the violence to be
known, whereas a non-negligible proportion of ACLED’s events are coded as involving an ‘Unidentified Armed Group’ (Eck 2012).
Hypotheses to be tested It is now possible to combine the two interpretations of the ‘New War’ thesis and the information about available data to formulate testable hypotheses. Please note once more that this paper concentrates on
trends within intra-state and other ‘non-traditional’ warfare, and hence excludes interstate war from all analyses.
The first interpretation of the ‘New War’ thesis suggests that ‘New War’ characteristics are becoming
relatively more important in global warfare. Not all of these characteristics are covered by existing datasets
and some, such as the state-building effect of war finance, may not be susceptible to measurement at all. As we do have information on various categories of war casualties, the targeting of civilians and the participation
of non-state combatants, I will focus on these three characteristics. With regard to war casualties, these hypotheses follow:
H1.1a: The yearly ratio of civilian to military casualties from ‘battle’ has increased over the period 1946-2010 and the
period 1989-2010.
H1.1b: The yearly ratio of civilian to military casualties from ‘battle’ has increased more steeply over the period 1989-
2010 than over the period 1946-1989.
Although no single dataset includes the military to civilian casualty ratio, it is possible to exploit different
definitions of ‘battle deaths’ to approximate the concept. More specifically, the CoW dataset includes only combatant deaths from battle, whereas the UCDP Battle-Related Deaths dataset and the L&G battle-related
deaths dataset both include civilian deaths from battle. If it were indeed true that progressively more civilians
die in battle, the ratio of UCDP or L&G battle-related deaths to CoW combatant battle deaths should be increasing over time. If this trend has become more pronounced after the Cold War, it should be possible to
recognize a structural break in the trend around that time.
Another prediction of the ‘New War’ thesis is that civilians are becoming a relatively more common target for violence. Because some datasets define a conflict as a whole as ‘one-sided violence’ and others categorize individual events within a conflict, we can add two more hypotheses:
H1.2a: The percentage of conflicts classified as ‘one-sided violence’ has increased over the period 1989-2010.
H1.2b: The percentage of violent events coded as ‘violence against civilians’ or constituting a part of ‘one-sided violence’ has increased over the period 1989-2010.
The reader may notice that the period under investigation is shorter, as event-based datasets and the dataset
on one-sided violence do not cover years before 1989. Also note that the period covered by ACLED is even shorter than this. This also precludes the possibility to test for a structural break after the Cold War.
Similar hypotheses can be formulated with regard to the participation of non-state combatants in conflict.
H1.3a: The percentage of conflicts classified as ‘non-state conflict’ has increased over the period 1989-2010.
H1.3b: The percentage of violent events coded as not involving a state army or constituting a part of ‘non-state conflict’ has increased over the period 1989-2010.
The second interpretation of the ‘New War’ thesis states that whether we measure war in terms of its
‘Old War’ or its ‘New War’ characteristics matters in terms of which variables we think are related to war.
Analyses aiming to determine this often translate the available datasets into the dependent variables ‘conflict onset’, ‘conflict prevalence’ and ‘conflict intensity’. ‘Conflict onset’ is commonly a dummy equaling 1 if some
conflict started in a particular country in a particular year. ‘Conflict prevalence’ is dummy equaling 1 in each year that a country experiences a conflict, irrespective of whether it is new or ongoing. The distinction
between conflict and no conflict is made using a casualty threshold, as explained above. ‘Conflict intensity’ is commonly measured by the number of casualties a particular conflict causes in a given year. Given the available data, there are numerous ways to arrive at each of the three dependent variables, leading to the
following hypotheses:
H2.1: Measuring conflict according to:
(1) the number of casualties from ‘state-based conflict’ or the event ‘battle involving a state army’; (2) the number of casualties from ‘one-sided violence’ or the event ‘violence against civilians’; (3) the number of casualties from ‘non-state conflict’ or the event ‘battle not involving a state army’;
leads to a substantially different set of variables to be correlated with:
H2.1a: conflict onset
H2.1b: conflict prevalence
H2.1c: conflict intensity
I use what has become somewhat of a ‘standard’ set of explanatory variables in analyses of violent conflict, first introduced by Fearon and Laitin (2003) (Sambanis 2005). Bazzi and Blattman (2011) provide a dataset
including this set of variables for the period 1989-2007 (Bazzi and Blattman 2011).
Results: has ‘New War’ become relatively more prevalent?
This section describes the results from the first interpretation of the ‘New War’ thesis, stating that ‘New War’ characteristics, such as the targeting of civilians and the participation of non-state combatants,
have become relatively more prevalent over the period 1946-2010, especially since the end of the Cold War. This is covered by hypothesis H1.1a – H1.3b.
Ratio of civilian to military casualties from ‘battle’ H1.1 concerns the ratio of civilian to military deaths from battle. Only two datasets on war casualties
cover the whole period 1946-2010; CoW provides numbers on the battle-related combatant deaths and the
L&G dataset on battle-related deaths, including civilian casualties. Remember that the latter dataset defines ‘battle’ broadly to include military attacks on civilians (in the presence of a threat of reciprocal violence), so a
comparison between these two datasets may actually approximate the ratio of civilian to military deaths through violence in state-based warfare.
As the units of analysis differ between the two datasets, some work is needed before they can be
compared. I manually match the wars in CoW to those in L&G by comparing the location, start and end date, and participants to the conflict. Almost all (93%) of extra-state and civil wars recognized by CoW are also in
the L&G dataset. Those only recognized by CoW often appear to be short-lasting instances of violence (for example the overthrow of the Shah of Iran or ‘Black September’ in Jordan). Conflicts classified by CoW as
‘Intercommunal’ or ‘Non-State’ are rarely matched, as can be expected since the L&G dataset does not cover
these types of war. However, these make up only a small (8%) percentage of the total number of wars in CoW. I aggregate the number of deaths for all parties to a conflict, treating missing values as zero, to arrive at
the number of known combatant battle deaths per conflict. Then, I expand the CoW dataset to include an entry for each year the conflict is recorded to be ongoing, and average the total number of deaths over the
number of conflict years.2 In both datasets, all interstate wars are dropped.
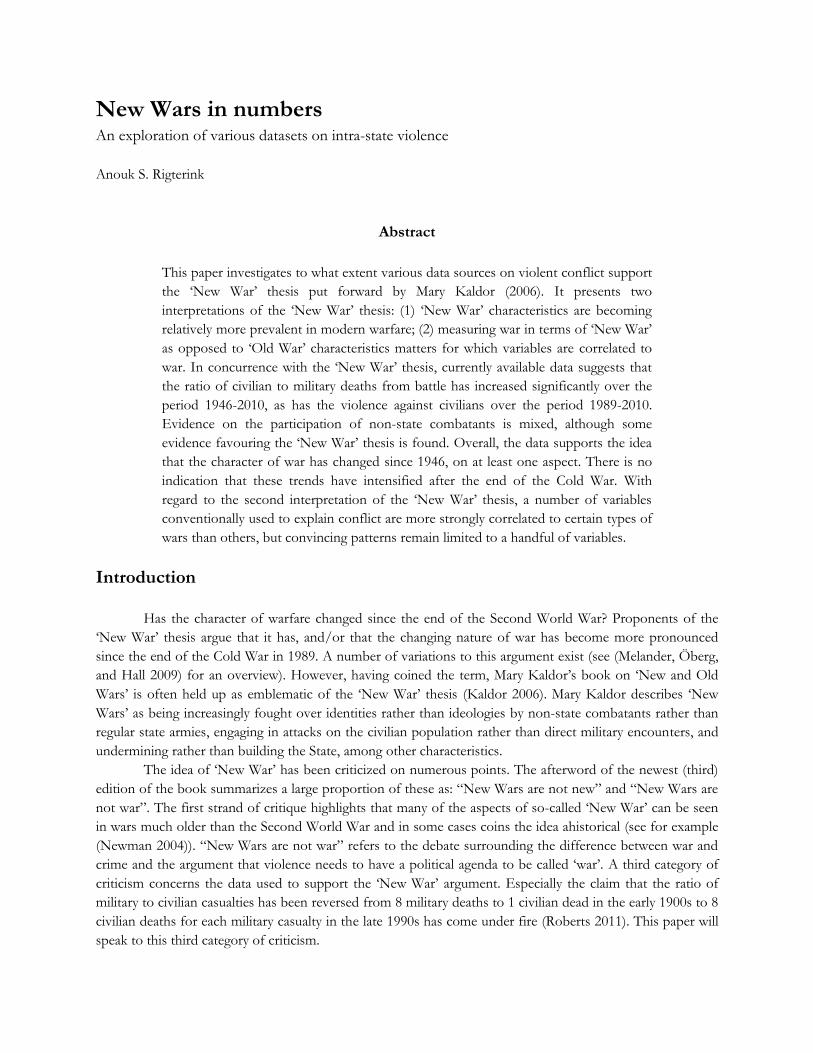
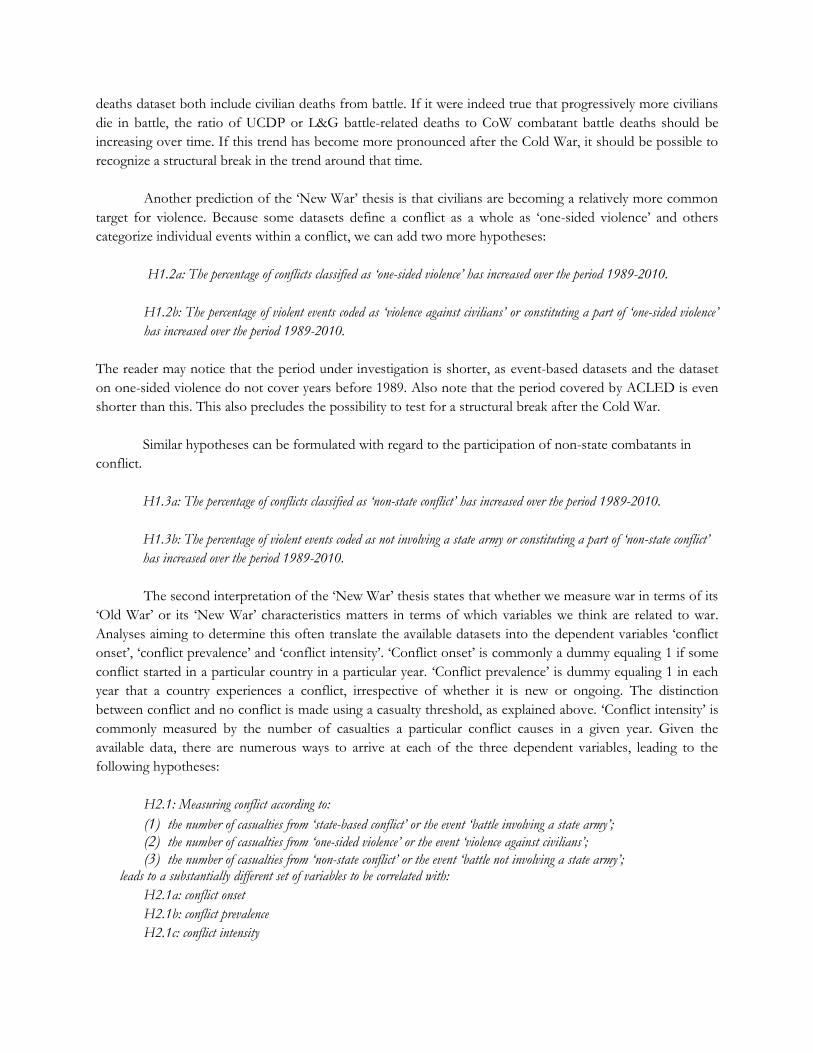
Graph 1 displays the total number of known deaths per year for both datasets. Overall, both seem to
display a downward absolute trend, although this is more pronounced for combatant battle deaths than battle-related deaths. As can be seen, the number of combatant battle deaths and the number of battle-related
deaths track each other relatively closely until the late 1970s. Hereafter, they diverge, with the difference
between the number of battle-related deaths and combatant battle deaths growing, although this gap appears to be growing smaller again in the 1990s and 2000s.
2 It is possible from CoW to calculate the exact number of days that a conflict has lasted, use this to determine the
average number of deaths per day and extrapolate to find the average number of deaths per year. However, this has the effect of creating extremely high numbers of average deaths for conflicts that created a substantial number of deaths but only lasted a few days.
Graph 1: Battle Related Deaths versus Combatant Battle Deaths 1946-2010
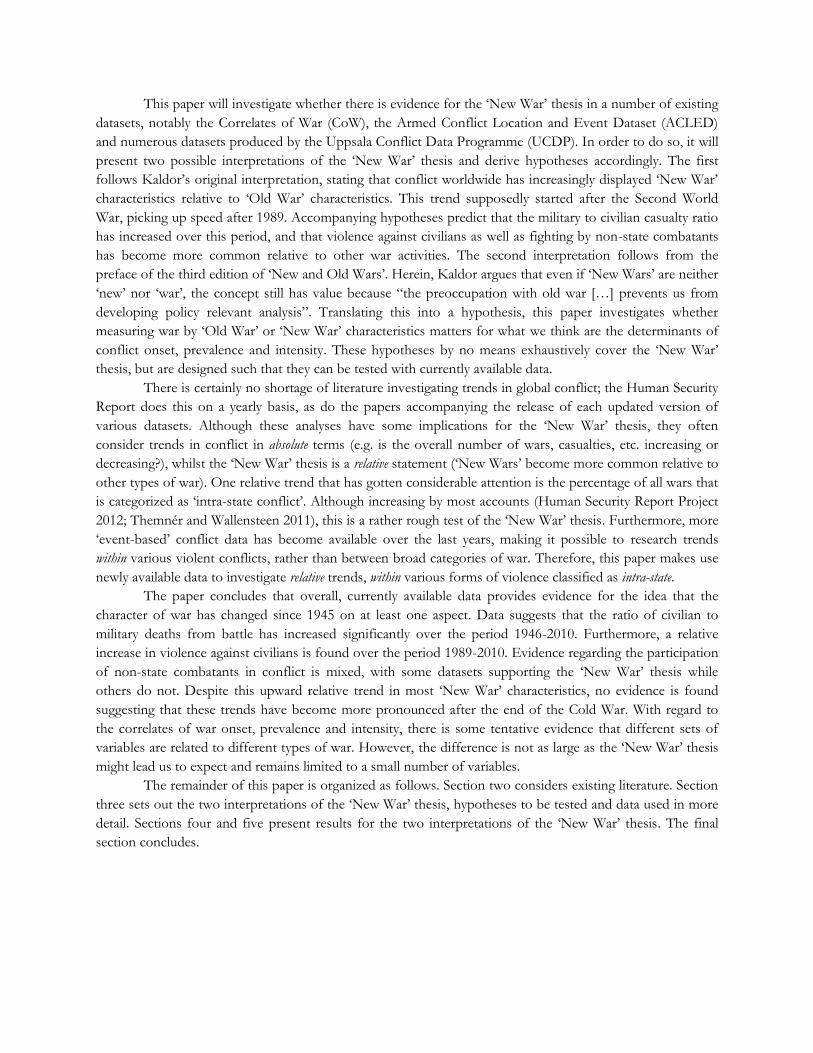
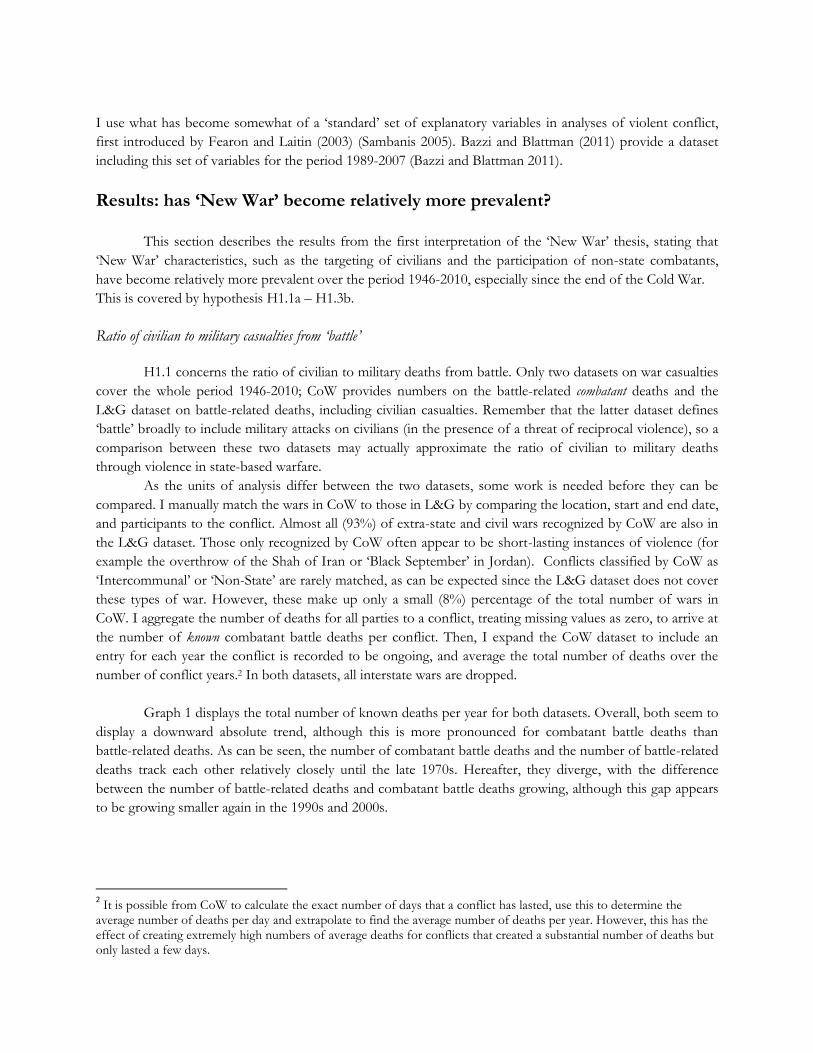
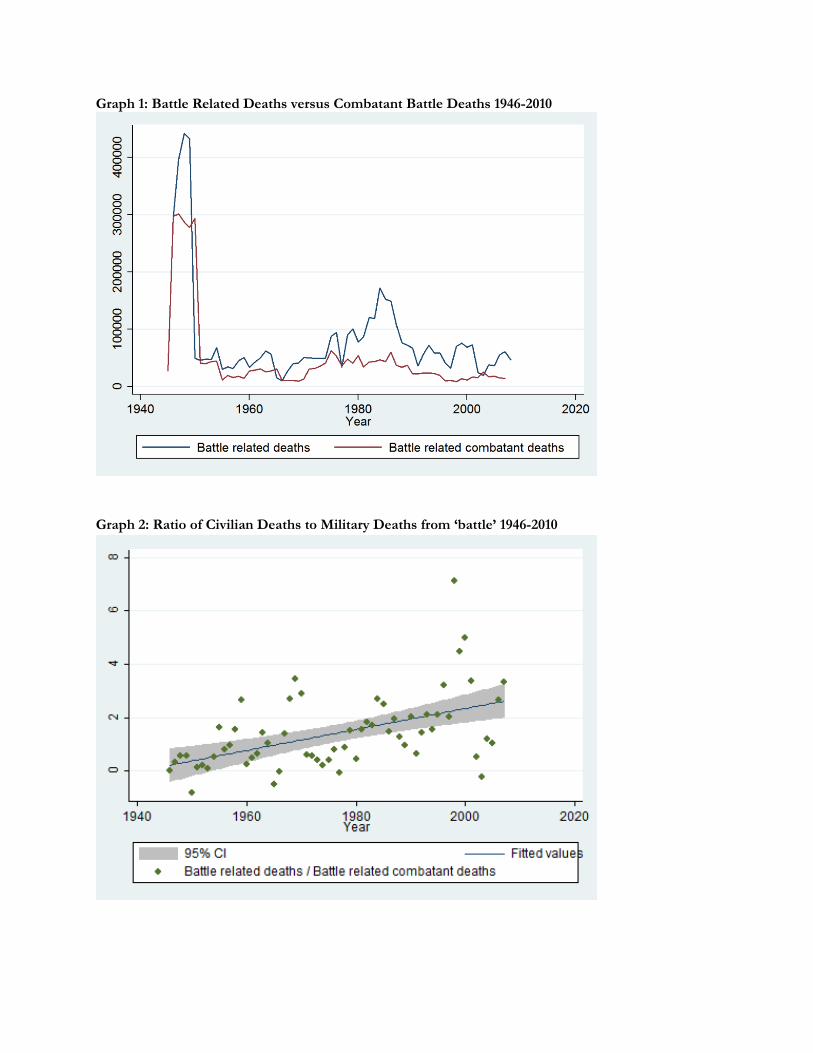
Graph 2: Ratio of Civilian Deaths to Military Deaths from ‘battle’ 1946-2010
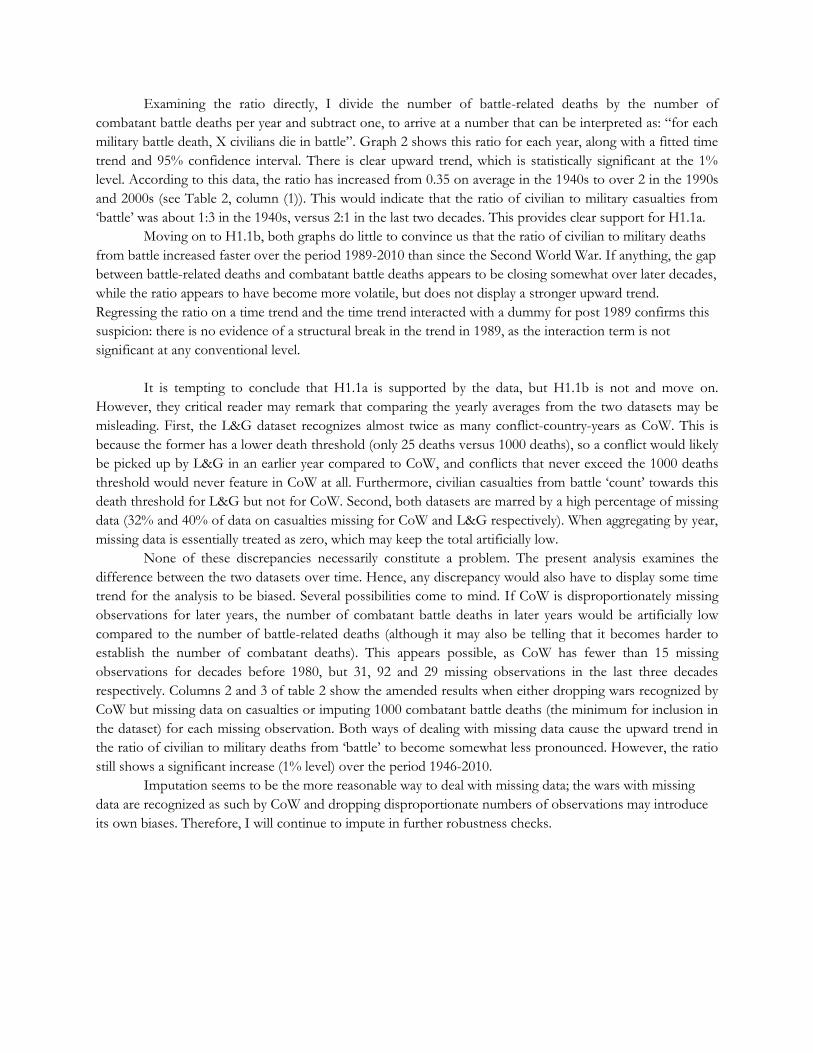
Examining the ratio directly, I divide the number of battle-related deaths by the number of
combatant battle deaths per year and subtract one, to arrive at a number that can be interpreted as: “for each military battle death, X civilians die in battle”. Graph 2 shows this ratio for each year, along with a fitted time
trend and 95% confidence interval. There is clear upward trend, which is statistically significant at the 1% level. According to this data, the ratio has increased from 0.35 on average in the 1940s to over 2 in the 1990s
and 2000s (see Table 2, column (1)). This would indicate that the ratio of civilian to military casualties from
‘battle’ was about 1:3 in the 1940s, versus 2:1 in the last two decades. This provides clear support for H1.1a. Moving on to H1.1b, both graphs do little to convince us that the ratio of civilian to military deaths
from battle increased faster over the period 1989-2010 than since the Second World War. If anything, the gap between battle-related deaths and combatant battle deaths appears to be closing somewhat over later decades,
while the ratio appears to have become more volatile, but does not display a stronger upward trend.
Regressing the ratio on a time trend and the time trend interacted with a dummy for post 1989 confirms this suspicion: there is no evidence of a structural break in the trend in 1989, as the interaction term is not
significant at any conventional level.
It is tempting to conclude that H1.1a is supported by the data, but H1.1b is not and move on. However, they critical reader may remark that comparing the yearly averages from the two datasets may be
misleading. First, the L&G dataset recognizes almost twice as many conflict-country-years as CoW. This is
because the former has a lower death threshold (only 25 deaths versus 1000 deaths), so a conflict would likely be picked up by L&G in an earlier year compared to CoW, and conflicts that never exceed the 1000 deaths
threshold would never feature in CoW at all. Furthermore, civilian casualties from battle ‘count’ towards this death threshold for L&G but not for CoW. Second, both datasets are marred by a high percentage of missing
data (32% and 40% of data on casualties missing for CoW and L&G respectively). When aggregating by year,
missing data is essentially treated as zero, which may keep the total artificially low. None of these discrepancies necessarily constitute a problem. The present analysis examines the
difference between the two datasets over time. Hence, any discrepancy would also have to display some time trend for the analysis to be biased. Several possibilities come to mind. If CoW is disproportionately missing
observations for later years, the number of combatant battle deaths in later years would be artificially low
compared to the number of battle-related deaths (although it may also be telling that it becomes harder to establish the number of combatant deaths). This appears possible, as CoW has fewer than 15 missing
observations for decades before 1980, but 31, 92 and 29 missing observations in the last three decades respectively. Columns 2 and 3 of table 2 show the amended results when either dropping wars recognized by
CoW but missing data on casualties or imputing 1000 combatant battle deaths (the minimum for inclusion in
the dataset) for each missing observation. Both ways of dealing with missing data cause the upward trend in the ratio of civilian to military deaths from ‘battle’ to become somewhat less pronounced. However, the ratio
still shows a significant increase (1% level) over the period 1946-2010. Imputation seems to be the more reasonable way to deal with missing data; the wars with missing
data are recognized as such by CoW and dropping disproportionate numbers of observations may introduce
its own biases. Therefore, I will continue to impute in further robustness checks.
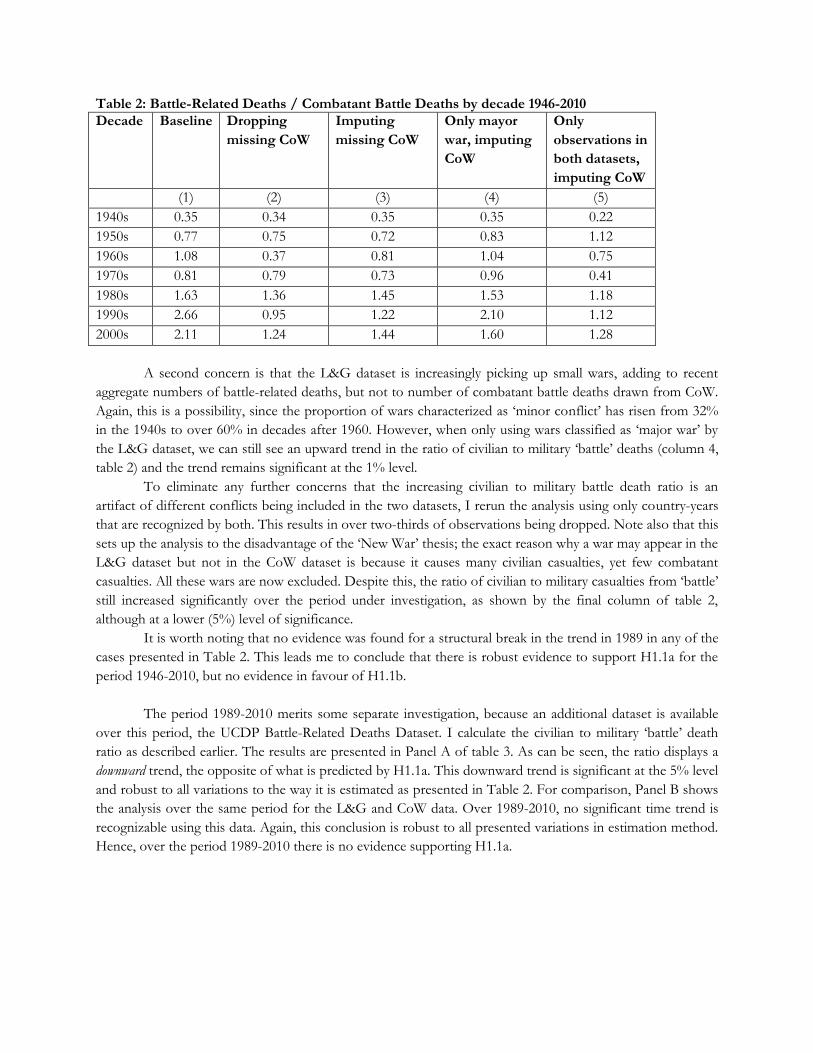
Table 2: Battle-Related Deaths / Combatant Battle Deaths by decade 1946-2010 Decade Baseline Dropping
missing CoW
Imputing
missing CoW
Only mayor
war, imputing
CoW
Only
observations in
both datasets,
imputing CoW
(1) (2) (3) (4) (5)
1940s 0.35 0.34 0.35 0.35 0.22
1950s 0.77 0.75 0.72 0.83 1.12
1960s 1.08 0.37 0.81 1.04 0.75
1970s 0.81 0.79 0.73 0.96 0.41
1980s 1.63 1.36 1.45 1.53 1.18
1990s 2.66 0.95 1.22 2.10 1.12
2000s 2.11 1.24 1.44 1.60 1.28
A second concern is that the L&G dataset is increasingly picking up small wars, adding to recent aggregate numbers of battle-related deaths, but not to number of combatant battle deaths drawn from CoW.
Again, this is a possibility, since the proportion of wars characterized as ‘minor conflict’ has risen from 32% in the 1940s to over 60% in decades after 1960. However, when only using wars classified as ‘major war’ by the L&G dataset, we can still see an upward trend in the ratio of civilian to military ‘battle’ deaths (column 4, table 2) and the trend remains significant at the 1% level.
To eliminate any further concerns that the increasing civilian to military battle death ratio is an
artifact of different conflicts being included in the two datasets, I rerun the analysis using only country-years that are recognized by both. This results in over two-thirds of observations being dropped. Note also that this
sets up the analysis to the disadvantage of the ‘New War’ thesis; the exact reason why a war may appear in the L&G dataset but not in the CoW dataset is because it causes many civilian casualties, yet few combatant
casualties. All these wars are now excluded. Despite this, the ratio of civilian to military casualties from ‘battle’ still increased significantly over the period under investigation, as shown by the final column of table 2, although at a lower (5%) level of significance.
It is worth noting that no evidence was found for a structural break in the trend in 1989 in any of the cases presented in Table 2. This leads me to conclude that there is robust evidence to support H1.1a for the
period 1946-2010, but no evidence in favour of H1.1b.
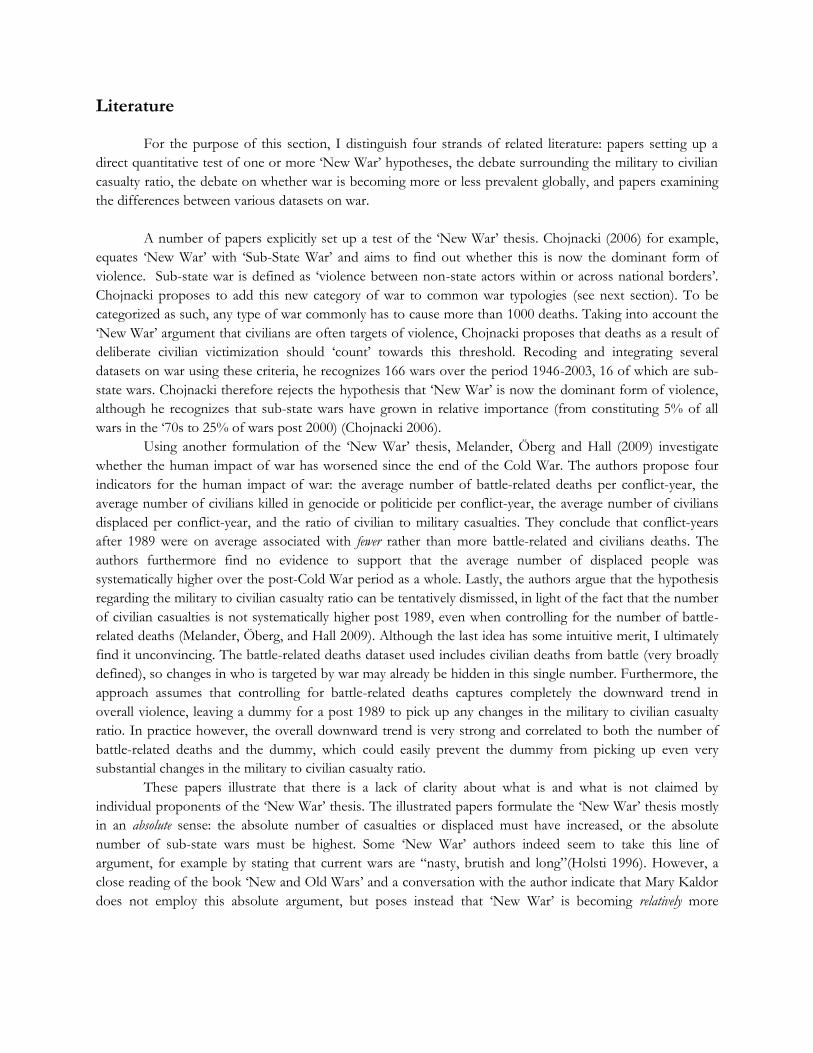
The period 1989-2010 merits some separate investigation, because an additional dataset is available
over this period, the UCDP Battle-Related Deaths Dataset. I calculate the civilian to military ‘battle’ death ratio as described earlier. The results are presented in Panel A of table 3. As can be seen, the ratio displays a
downward trend, the opposite of what is predicted by H1.1a. This downward trend is significant at the 5% level
and robust to all variations to the way it is estimated as presented in Table 2. For comparison, Panel B shows the analysis over the same period for the L&G and CoW data. Over 1989-2010, no significant time trend is
recognizable using this data. Again, this conclusion is robust to all presented variations in estimation method. Hence, over the period 1989-2010 there is no evidence supporting H1.1a.
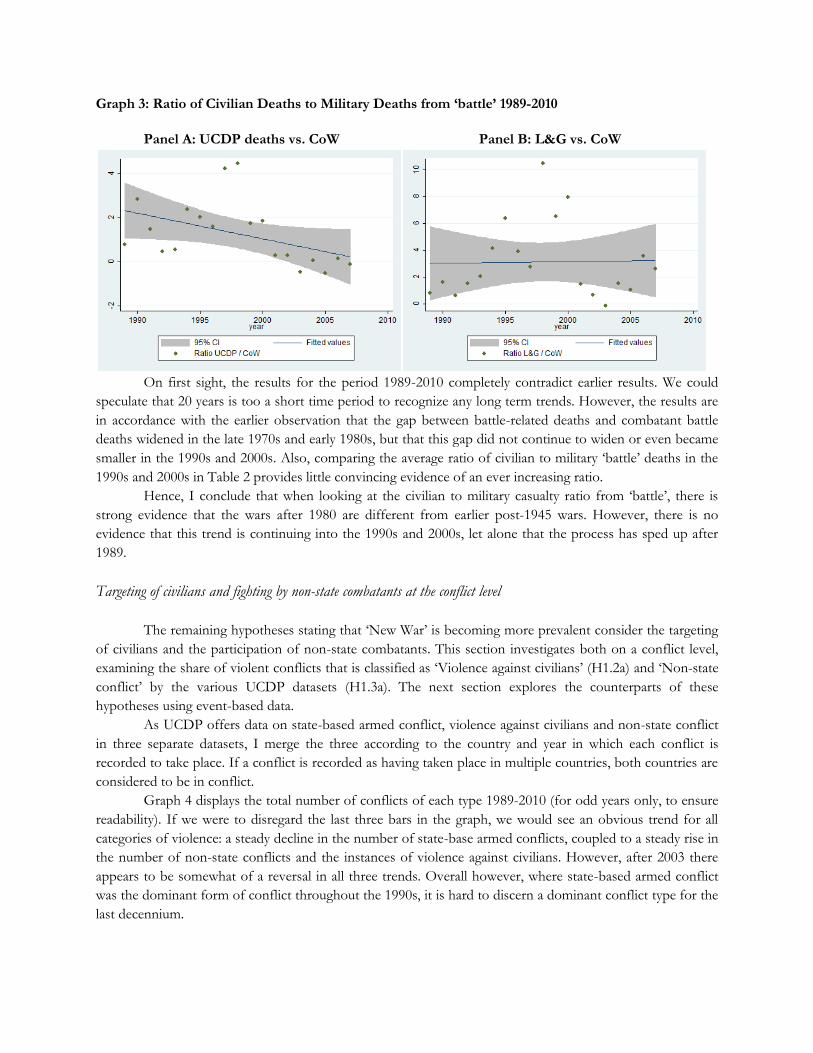
Graph 3: Ratio of Civilian Deaths to Military Deaths from ‘battle’ 1989-2010
Panel A: UCDP deaths vs. CoW Panel B: L&G vs. CoW
On first sight, the results for the period 1989-2010 completely contradict earlier results. We could
speculate that 20 years is too a short time period to recognize any long term trends. However, the results are
in accordance with the earlier observation that the gap between battle-related deaths and combatant battle deaths widened in the late 1970s and early 1980s, but that this gap did not continue to widen or even became
smaller in the 1990s and 2000s. Also, comparing the average ratio of civilian to military ‘battle’ deaths in the 1990s and 2000s in Table 2 provides little convincing evidence of an ever increasing ratio.
Hence, I conclude that when looking at the civilian to military casualty ratio from ‘battle’, there is strong evidence that the wars after 1980 are different from earlier post-1945 wars. However, there is no evidence that this trend is continuing into the 1990s and 2000s, let alone that the process has sped up after
1989.
Targeting of civilians and fighting by non-state combatants at the conflict level
The remaining hypotheses stating that ‘New War’ is becoming more prevalent consider the targeting of civilians and the participation of non-state combatants. This section investigates both on a conflict level, examining the share of violent conflicts that is classified as ‘Violence against civilians’ (H1.2a) and ‘Non-state
conflict’ by the various UCDP datasets (H1.3a). The next section explores the counterparts of these hypotheses using event-based data.
As UCDP offers data on state-based armed conflict, violence against civilians and non-state conflict
in three separate datasets, I merge the three according to the country and year in which each conflict is recorded to take place. If a conflict is recorded as having taken place in multiple countries, both countries are
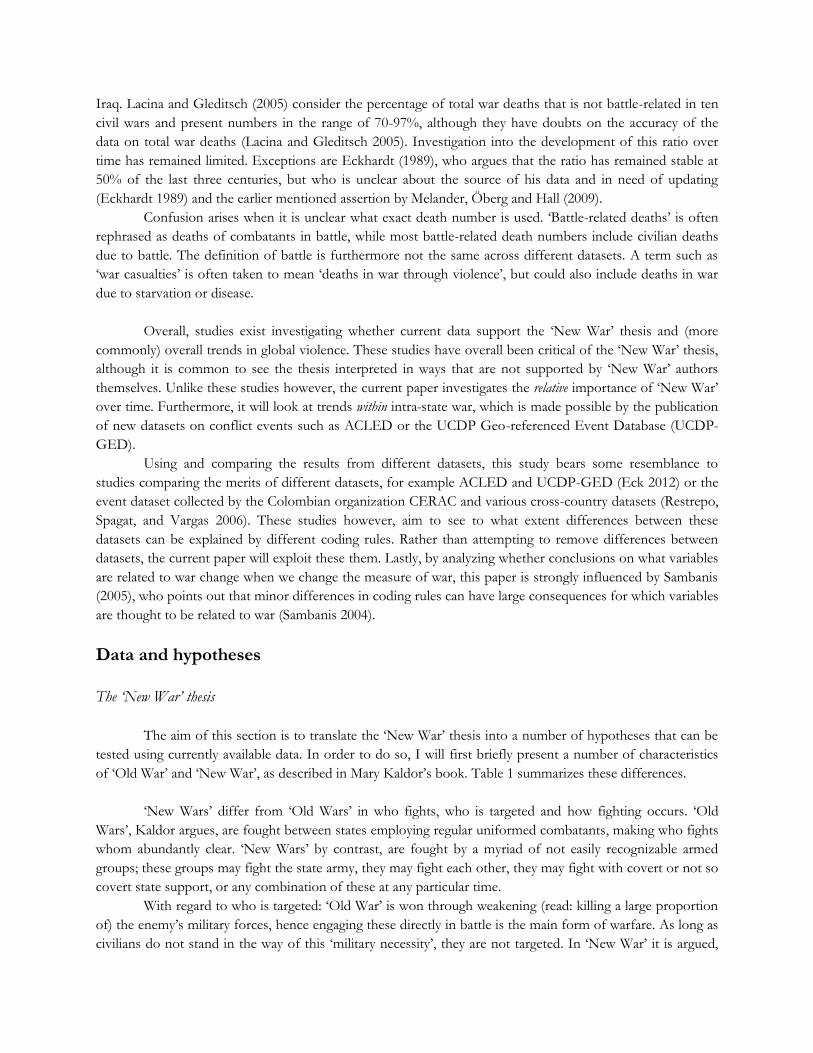
considered to be in conflict. Graph 4 displays the total number of conflicts of each type 1989-2010 (for odd years only, to ensure
readability). If we were to disregard the last three bars in the graph, we would see an obvious trend for all
categories of violence: a steady decline in the number of state-base armed conflicts, coupled to a steady rise in the number of non-state conflicts and the instances of violence against civilians. However, after 2003 there
appears to be somewhat of a reversal in all three trends. Overall however, where state-based armed conflict was the dominant form of conflict throughout the 1990s, it is hard to discern a dominant conflict type for the
last decennium.
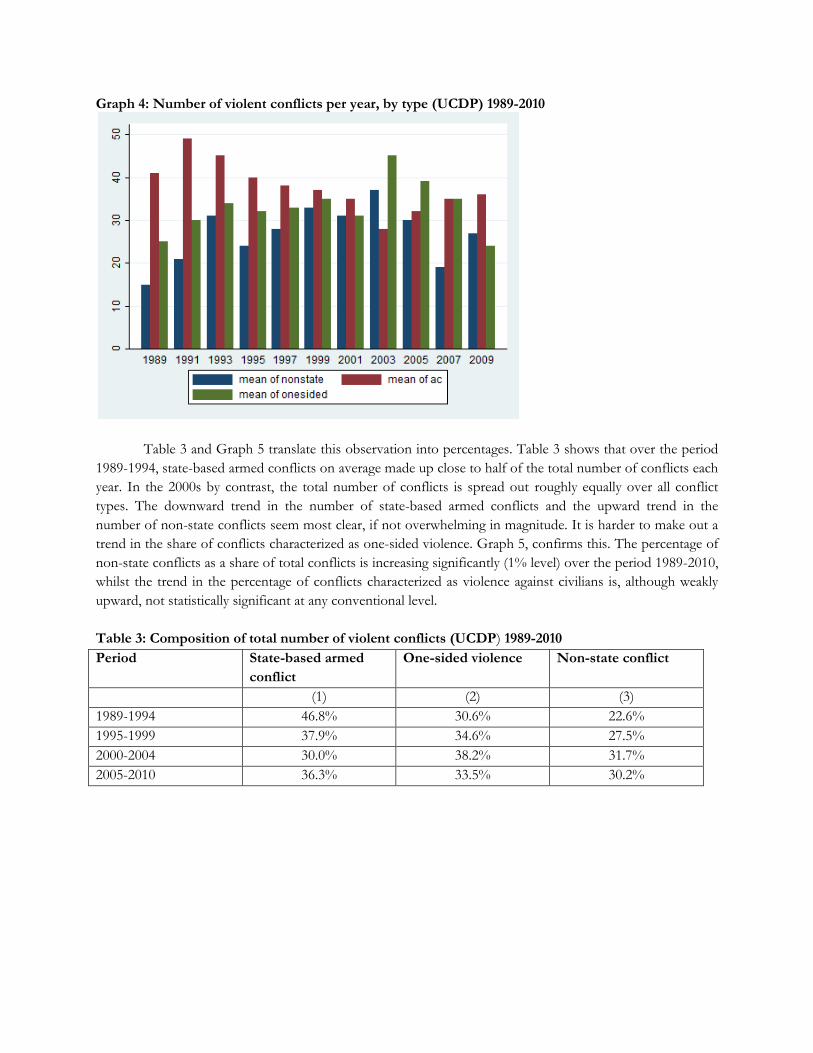
Graph 4: Number of violent conflicts per year, by type (UCDP) 1989-2010
Table 3 and Graph 5 translate this observation into percentages. Table 3 shows that over the period
1989-1994, state-based armed conflicts on average made up close to half of the total number of conflicts each year. In the 2000s by contrast, the total number of conflicts is spread out roughly equally over all conflict
types. The downward trend in the number of state-based armed conflicts and the upward trend in the
number of non-state conflicts seem most clear, if not overwhelming in magnitude. It is harder to make out a trend in the share of conflicts characterized as one-sided violence. Graph 5, confirms this. The percentage of
non-state conflicts as a share of total conflicts is increasing significantly (1% level) over the period 1989-2010, whilst the trend in the percentage of conflicts characterized as violence against civilians is, although weakly
upward, not statistically significant at any conventional level.
Table 3: Composition of total number of violent conflicts (UCDP) 1989-2010
Period State-based armed
conflict
One-sided violence Non-state conflict
(1) (2) (3)
1989-1994 46.8% 30.6% 22.6%
1995-1999 37.9% 34.6% 27.5%
2000-2004 30.0% 38.2% 31.7%
2005-2010 36.3% 33.5% 30.2%
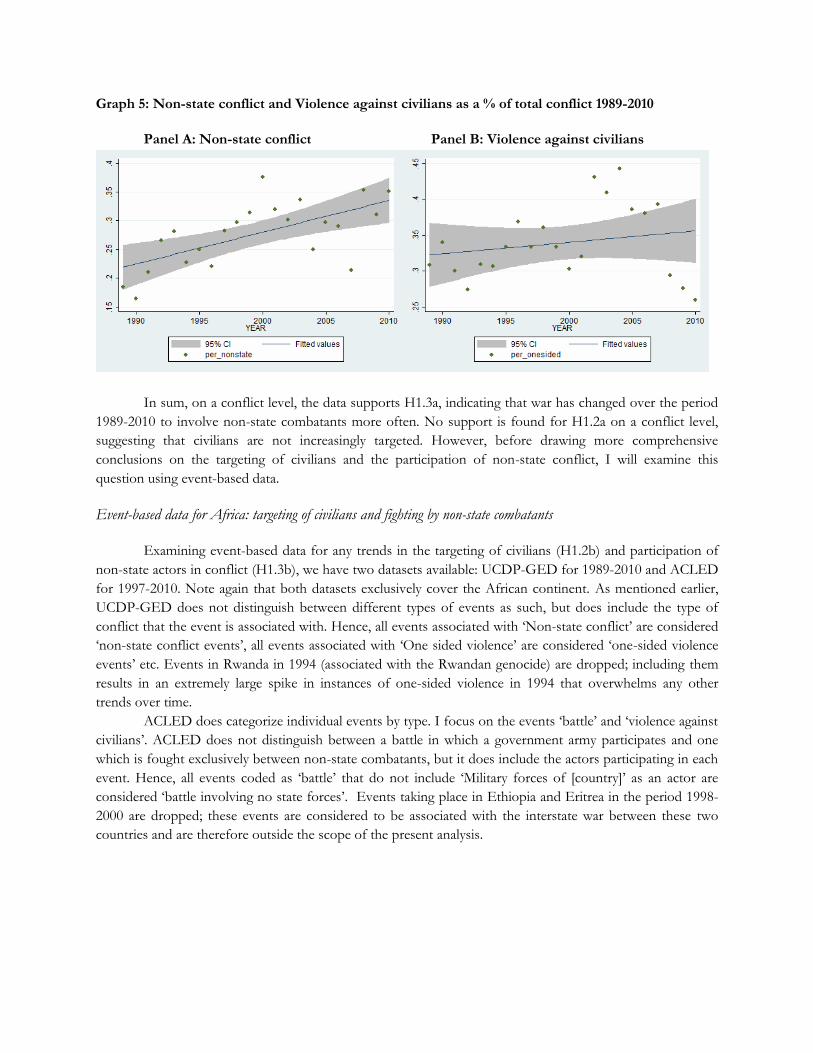
Graph 5: Non-state conflict and Violence against civilians as a % of total conflict 1989-2010
Panel A: Non-state conflict Panel B: Violence against civilians
In sum, on a conflict level, the data supports H1.3a, indicating that war has changed over the period
1989-2010 to involve non-state combatants more often. No support is found for H1.2a on a conflict level, suggesting that civilians are not increasingly targeted. However, before drawing more comprehensive
conclusions on the targeting of civilians and the participation of non-state conflict, I will examine this
question using event-based data. Event-based data for Africa: targeting of civilians and fighting by non-state combatants
Examining event-based data for any trends in the targeting of civilians (H1.2b) and participation of
non-state actors in conflict (H1.3b), we have two datasets available: UCDP-GED for 1989-2010 and ACLED
for 1997-2010. Note again that both datasets exclusively cover the African continent. As mentioned earlier, UCDP-GED does not distinguish between different types of events as such, but does include the type of
conflict that the event is associated with. Hence, all events associated with ‘Non-state conflict’ are considered ‘non-state conflict events’, all events associated with ‘One sided violence’ are considered ‘one-sided violence
events’ etc. Events in Rwanda in 1994 (associated with the Rwandan genocide) are dropped; including them
results in an extremely large spike in instances of one-sided violence in 1994 that overwhelms any other trends over time.
ACLED does categorize individual events by type. I focus on the events ‘battle’ and ‘violence against civilians’. ACLED does not distinguish between a battle in which a government army participates and one
which is fought exclusively between non-state combatants, but it does include the actors participating in each
event. Hence, all events coded as ‘battle’ that do not include ‘Military forces of [country]’ as an actor are considered ‘battle involving no state forces’. Events taking place in Ethiopia and Eritrea in the period 1998-
2000 are dropped; these events are considered to be associated with the interstate war between these two countries and are therefore outside the scope of the present analysis.
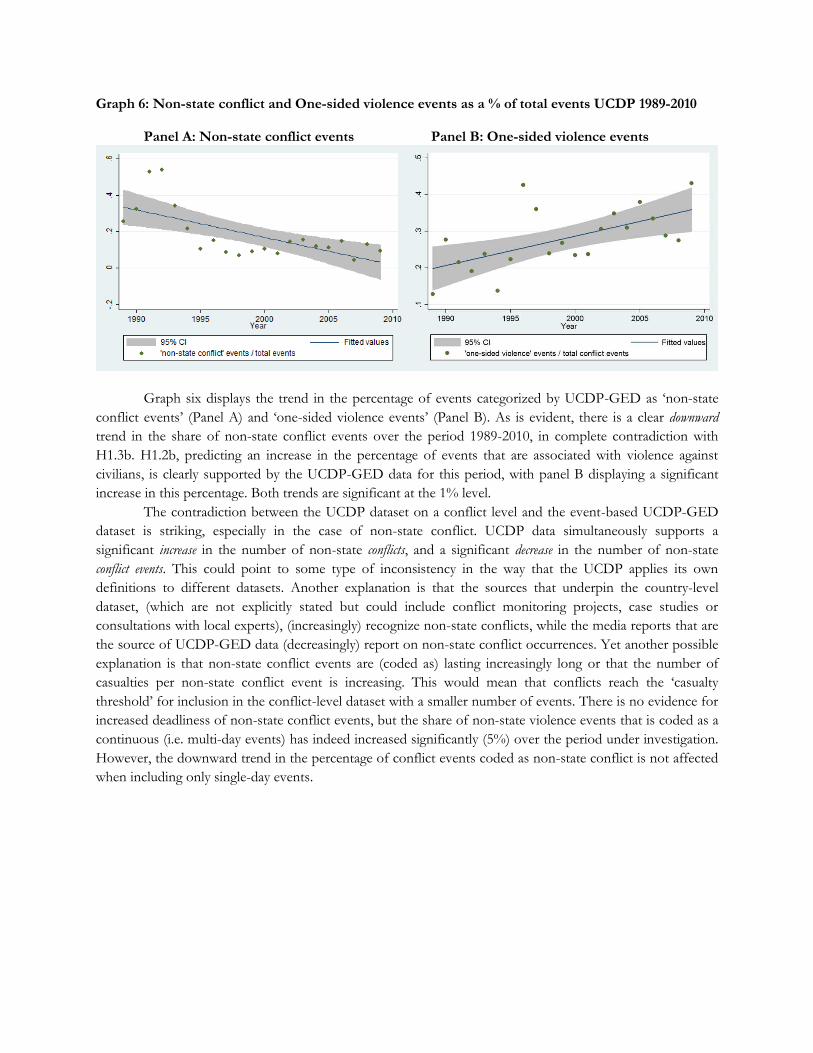
Graph 6: Non-state conflict and One-sided violence events as a % of total events UCDP 1989-2010
Panel A: Non-state conflict events Panel B: One-sided violence events
Graph six displays the trend in the percentage of events categorized by UCDP-GED as ‘non-state
conflict events’ (Panel A) and ‘one-sided violence events’ (Panel B). As is evident, there is a clear downward trend in the share of non-state conflict events over the period 1989-2010, in complete contradiction with
H1.3b. H1.2b, predicting an increase in the percentage of events that are associated with violence against
civilians, is clearly supported by the UCDP-GED data for this period, with panel B displaying a significant increase in this percentage. Both trends are significant at the 1% level.
The contradiction between the UCDP dataset on a conflict level and the event-based UCDP-GED dataset is striking, especially in the case of non-state conflict. UCDP data simultaneously supports a
significant increase in the number of non-state conflicts, and a significant decrease in the number of non-state
conflict events. This could point to some type of inconsistency in the way that the UCDP applies its own definitions to different datasets. Another explanation is that the sources that underpin the country-level
dataset, (which are not explicitly stated but could include conflict monitoring projects, case studies or consultations with local experts), (increasingly) recognize non-state conflicts, while the media reports that are
the source of UCDP-GED data (decreasingly) report on non-state conflict occurrences. Yet another possible
explanation is that non-state conflict events are (coded as) lasting increasingly long or that the number of casualties per non-state conflict event is increasing. This would mean that conflicts reach the ‘casualty threshold’ for inclusion in the conflict-level dataset with a smaller number of events. There is no evidence for increased deadliness of non-state conflict events, but the share of non-state violence events that is coded as a
continuous (i.e. multi-day events) has indeed increased significantly (5%) over the period under investigation.
However, the downward trend in the percentage of conflict events coded as non-state conflict is not affected when including only single-day events.
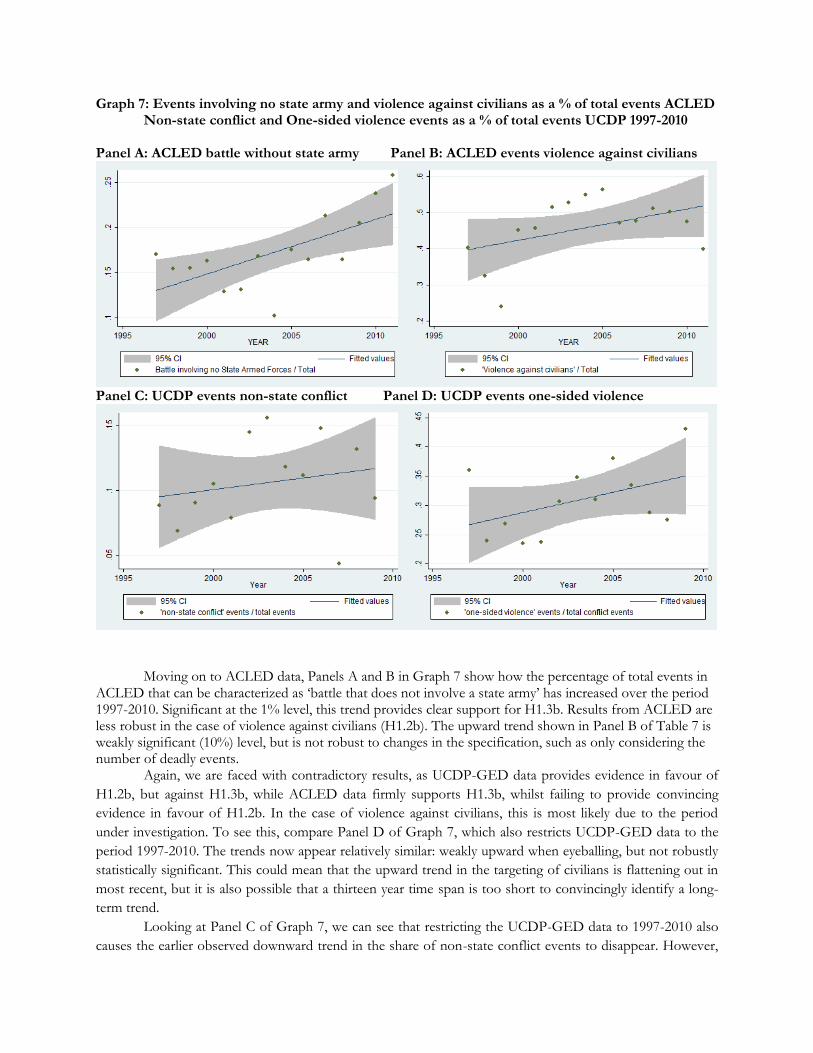
Graph 7: Events involving no state army and violence against civilians as a % of total events ACLED Non-state conflict and One-sided violence events as a % of total events UCDP 1997-2010
Panel A: ACLED battle without state army Panel B: ACLED events violence against civilians
Panel C: UCDP events non-state conflict Panel D: UCDP events one-sided violence
Moving on to ACLED data, Panels A and B in Graph 7 show how the percentage of total events in
ACLED that can be characterized as ‘battle that does not involve a state army’ has increased over the period 1997-2010. Significant at the 1% level, this trend provides clear support for H1.3b. Results from ACLED are less robust in the case of violence against civilians (H1.2b). The upward trend shown in Panel B of Table 7 is weakly significant (10%) level, but is not robust to changes in the specification, such as only considering the number of deadly events. Again, we are faced with contradictory results, as UCDP-GED data provides evidence in favour of
H1.2b, but against H1.3b, while ACLED data firmly supports H1.3b, whilst failing to provide convincing evidence in favour of H1.2b. In the case of violence against civilians, this is most likely due to the period
under investigation. To see this, compare Panel D of Graph 7, which also restricts UCDP-GED data to the
period 1997-2010. The trends now appear relatively similar: weakly upward when eyeballing, but not robustly statistically significant. This could mean that the upward trend in the targeting of civilians is flattening out in
most recent, but it is also possible that a thirteen year time span is too short to convincingly identify a long-term trend.
Looking at Panel C of Graph 7, we can see that restricting the UCDP-GED data to 1997-2010 also
causes the earlier observed downward trend in the share of non-state conflict events to disappear. However,
as may be apparent by the very wide confidence interval, it does not approximate the significant upward trend
that ACLED shows in Panel A. A priori, it seems plausible that this difference is somehow and artifact of the differences in the ways that ACLED and UCDP-GED record events. However, the upward trend in the
share of events classified as battle with no state army involvement is remarkably robust to changes that we would expect to make the data more similar. The trend is still significant when including only deadly events
(5% level), when including only country-years in which ACLED records at least 25 deaths from battle (1%),
when dropping all events with a conflict actor unknown, missing or specified as unidentified (5%) and when including only country-years that are also recognized as being in some conflict by UCDP (5%). However, it is
not robust to dropping all country-years that are not recognized by UCDP as in ‘non-state conflict’. A possible reason is that conflicts that are classified overall as state-based conflicts because the government is
an actor in them, increasingly consist of battles that do not involve state actors. This would be picked up by
ACLED because it codes each event individually, but not by UCDP. This remains speculative however.
Summarizing, I conclude that there is support, if not definitive evidence, for the notion that civilians have been increasingly targeted in war over the period 1989-2010. This evidence is stronger on the event level
than on the conflict level and stronger for the period 1989-2010 than for 1997-2010. Estimated trends in all datasets are positive, although not (strongly) statistically significant in a number of cases.
With regard to the participation of non-state combatants the picture is mixed. Different UCDP
datasets predict opposite trends in non-state conflict, while ACLED does show a clear increase in the share of conflict events that are coded as battle not involving a state army. This precludes a clear conclusion on this
point.
Results: does ‘New War’ suggest different variables related to conflict?
This section concerns the second interpretation of the ‘New War’ thesis: measuring war by its ‘Old War’ or ‘New War’ characteristics leads to a substantially different set of variables correlated to war onset,
prevalence and intensity.
In order to investigate this, I construct measures of war onset, prevalence and intensity, for three
types of conflict: state-based conflicts, non-state conflicts and one-sided violence. I use the UCDP Armed Conflict Dataset, Non-State Conflict Dataset and One-Sided Violence datasets, and ACLED for this purpose.
UCDP-GED is disregarded because it would lead to the same variables measuring conflict, as casualty
numbers in the other UCDP datasets are designed to be drawn from UCDP-GED. For UCDP data, prevalence of a particular type of conflict is a dummy variable equalling 1 if the
relevant UCDP datasets records such a conflict in a given country in a given year. Conflict onset is a dummy variable indicating the start of a new conflict; it equals 1 if UCDP records a war of a given type in one year,
but not in the year previous. One country can experience two (or more) wars of one type; each additional war
is coded as a new war start. Conflict intensity is the number of fatalities recorded for each conflict type per country per year.
In the case of ACLED, I use the number of fatalities per country per year, from events coded as ‘violence against civilians’, ‘battle including a state army’ and ‘battle not including a state army’. This is the ACLED indicator for conflict intensity. With regard to prevalence: a particular conflict type is coded to have
occurred if the total number of fatalities per year from the associated event type exceeds 25 in some country. This mimics the casualty threshold employed by UCDP. As before, conflict onset is a dummy variable
indicating that ACLED records a particular country to be in some conflict in one year, but not the year
previous. As ACLED codes only events and not the conflict these are considered to be associated with, a
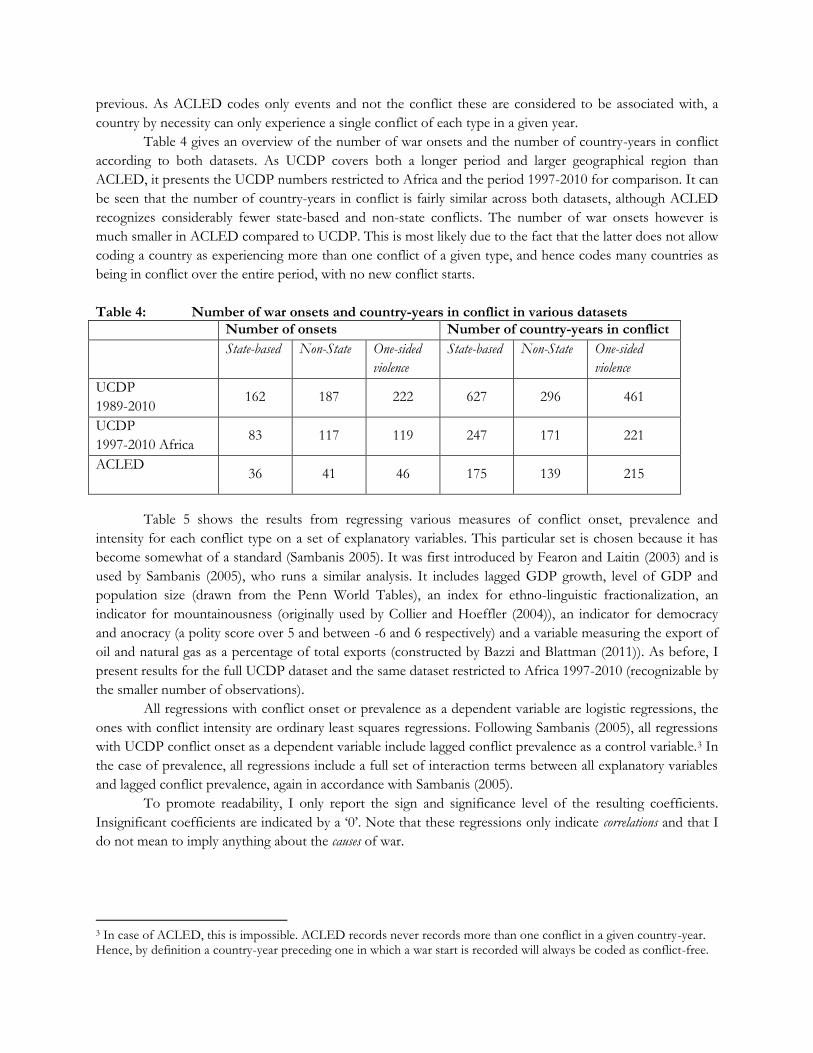
country by necessity can only experience a single conflict of each type in a given year. Table 4 gives an overview of the number of war onsets and the number of country-years in conflict
according to both datasets. As UCDP covers both a longer period and larger geographical region than ACLED, it presents the UCDP numbers restricted to Africa and the period 1997-2010 for comparison. It can
be seen that the number of country-years in conflict is fairly similar across both datasets, although ACLED
recognizes considerably fewer state-based and non-state conflicts. The number of war onsets however is much smaller in ACLED compared to UCDP. This is most likely due to the fact that the latter does not allow
coding a country as experiencing more than one conflict of a given type, and hence codes many countries as being in conflict over the entire period, with no new conflict starts.
Table 4: Number of war onsets and country-years in conflict in various datasets Number of onsets Number of country-years in conflict
State-based Non-State One-sided
violence
State-based Non-State One-sided
violence
UCDP
1989-2010 162 187 222 627 296 461
UCDP
1997-2010 Africa 83 117 119 247 171 221
ACLED
36 41 46 175 139 215
Table 5 shows the results from regressing various measures of conflict onset, prevalence and
intensity for each conflict type on a set of explanatory variables. This particular set is chosen because it has become somewhat of a standard (Sambanis 2005). It was first introduced by Fearon and Laitin (2003) and is
used by Sambanis (2005), who runs a similar analysis. It includes lagged GDP growth, level of GDP and population size (drawn from the Penn World Tables), an index for ethno-linguistic fractionalization, an
indicator for mountainousness (originally used by Collier and Hoeffler (2004)), an indicator for democracy
and anocracy (a polity score over 5 and between -6 and 6 respectively) and a variable measuring the export of oil and natural gas as a percentage of total exports (constructed by Bazzi and Blattman (2011)). As before, I
present results for the full UCDP dataset and the same dataset restricted to Africa 1997-2010 (recognizable by the smaller number of observations).
All regressions with conflict onset or prevalence as a dependent variable are logistic regressions, the
ones with conflict intensity are ordinary least squares regressions. Following Sambanis (2005), all regressions with UCDP conflict onset as a dependent variable include lagged conflict prevalence as a control variable.3 In
the case of prevalence, all regressions include a full set of interaction terms between all explanatory variables and lagged conflict prevalence, again in accordance with Sambanis (2005).
To promote readability, I only report the sign and significance level of the resulting coefficients.
Insignificant coefficients are indicated by a ‘0’. Note that these regressions only indicate correlations and that I do not mean to imply anything about the causes of war.
3 In case of ACLED, this is impossible. ACLED records never records more than one conflict in a given country-year. Hence, by definition a country-year preceding one in which a war start is recorded will always be coded as conflict-free.
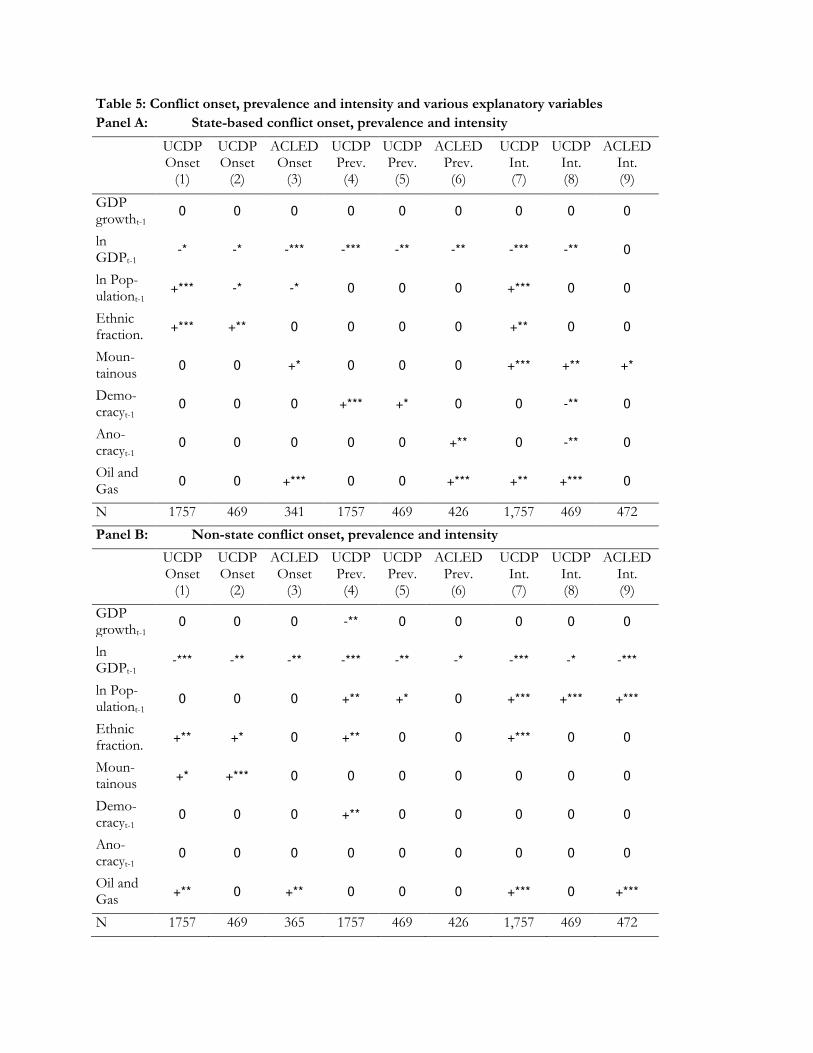
Table 5: Conflict onset, prevalence and intensity and various explanatory variables
Panel A: State-based conflict onset, prevalence and intensity
UCDP Onset
(1)
UCDP Onset
(2)
ACLED Onset
(3)
UCDP Prev. (4)
UCDP Prev. (5)
ACLED Prev. (6)
UCDP Int. (7)
UCDP Int. (8)
ACLED Int. (9)
GDP growtht-1
0 0 0 0 0 0 0 0 0
ln GDPt-1
-* -* -*** -*** -** -** -*** -** 0
ln Pop-ulationt-1
+*** -* -* 0 0 0 +*** 0 0
Ethnic fraction.
+*** +** 0 0 0 0 +** 0 0
Moun-tainous
0 0 +* 0 0 0 +*** +** +*
Demo-cracyt-1
0 0 0 +*** +* 0 0 -** 0
Ano- cracyt-1
0 0 0 0 0 +** 0 -** 0
Oil and Gas
0 0 +*** 0 0 +*** +** +*** 0
N 1757 469 341 1757 469 426 1,757 469 472
Panel B: Non-state conflict onset, prevalence and intensity
UCDP Onset
(1)
UCDP Onset
(2)
ACLED Onset
(3)
UCDP Prev. (4)
UCDP Prev. (5)
ACLED Prev. (6)
UCDP Int. (7)
UCDP Int. (8)
ACLED Int. (9)
GDP growtht-1
0 0 0 -** 0 0 0 0 0
ln GDPt-1
-*** -** -** -*** -** -* -*** -* -***
ln Pop-ulationt-1
0 0 0 +** +* 0 +*** +*** +***
Ethnic fraction.
+** +* 0 +** 0 0 +*** 0 0
Moun-tainous
+* +*** 0 0 0 0 0 0 0
Demo-cracyt-1
0 0 0 +** 0 0 0 0 0
Ano- cracyt-1
0 0 0 0 0 0 0 0 0
Oil and Gas
+** 0 +** 0 0 0 +*** 0 +***
N 1757 469 365 1757 469 426 1,757 469 472
Panel C: One-sided violence onset, prevalence and intensity
UCDP Onset
(1)
UCDP Onset
(2)
ACLED Onset
(3)
UCDP Prev. (4)
UCDP Prev. (5)
ACLED Prev. (6)
UCDP Int. (7)
UCDP Int. (8)
ACLED Int. (9)
GDP growtht-1
0 0 0 0 0 0 -** 0 0
ln GDPt-1
-*** -* -** -*** -** -*** 0 -*** 0
ln Pop-ulationt-1
+*** 0 0 0 0 0 0 0 0
Ethnic fraction.
+** +* 0 0 0 0 0 0 0
Moun-tainous
0 +** 0 0 0 0 0 +** +***
Demo-cracyt-1
0 0 0 0 0 0 0 -*** 0
Ano- cracyt-1
0 0 0 0 +* 0 0 -*** 0
Oil and Gas
0 0 0 0 +** +** 0 +*** +**
N 1757 469 317 1757 469 426 1,757 469 472
Significance levels: *** p<0.01, ** p<0.05, * p<0.1
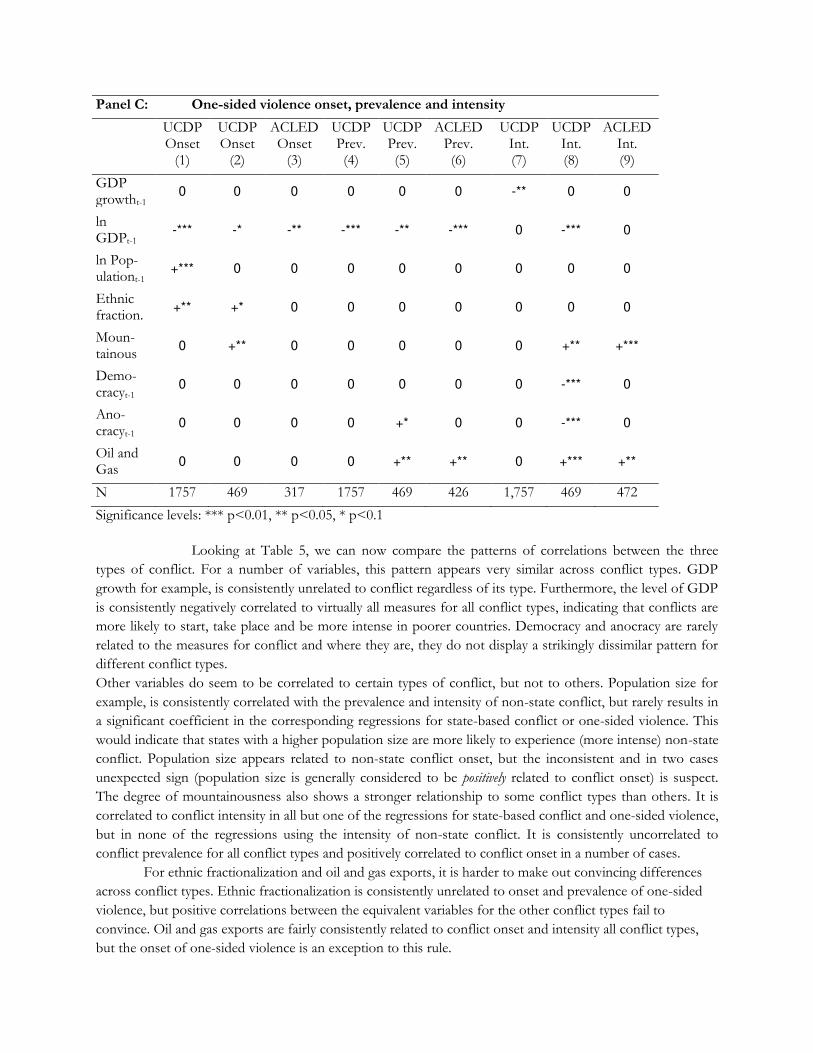
Looking at Table 5, we can now compare the patterns of correlations between the three types of conflict. For a number of variables, this pattern appears very similar across conflict types. GDP
growth for example, is consistently unrelated to conflict regardless of its type. Furthermore, the level of GDP
is consistently negatively correlated to virtually all measures for all conflict types, indicating that conflicts are more likely to start, take place and be more intense in poorer countries. Democracy and anocracy are rarely
related to the measures for conflict and where they are, they do not display a strikingly dissimilar pattern for different conflict types.
Other variables do seem to be correlated to certain types of conflict, but not to others. Population size for
example, is consistently correlated with the prevalence and intensity of non-state conflict, but rarely results in a significant coefficient in the corresponding regressions for state-based conflict or one-sided violence. This
would indicate that states with a higher population size are more likely to experience (more intense) non-state conflict. Population size appears related to non-state conflict onset, but the inconsistent and in two cases
unexpected sign (population size is generally considered to be positively related to conflict onset) is suspect. The degree of mountainousness also shows a stronger relationship to some conflict types than others. It is
correlated to conflict intensity in all but one of the regressions for state-based conflict and one-sided violence,
but in none of the regressions using the intensity of non-state conflict. It is consistently uncorrelated to conflict prevalence for all conflict types and positively correlated to conflict onset in a number of cases.
For ethnic fractionalization and oil and gas exports, it is harder to make out convincing differences across conflict types. Ethnic fractionalization is consistently unrelated to onset and prevalence of one-sided
violence, but positive correlations between the equivalent variables for the other conflict types fail to
convince. Oil and gas exports are fairly consistently related to conflict onset and intensity all conflict types, but the onset of one-sided violence is an exception to this rule.
Overall then, whether one measures war in terms of ‘Old War’ and ‘New War’ characteristics matters somewhat for our understanding of which variables are correlated to war. Especially population size and the
degree of mountainousness, and to a lesser extent ethnic fractionalization and oil and gas exports, are more strongly related to some types of war than to others. However, it is not possible to observe the land slide
difference that one might expect; convincing differences across war types remain limited to two variables.
Hence, I conclude that there is only weak evidence for the three variations of H2.1.
Conclusions This paper has investigated whether the ‘New War’ thesis is supported by a number of commonly used datasets on violent conflict. It distinguished two interpretations of the ‘New War’ thesis. First, the ‘New War’ thesis was interpreted as a relative statement about the character of war, suggesting that ‘New War’ characteristics have made up an increasing share of total warfare (regardless of whether the overall absolute
level of warfare has increased or decreased). Results have shown that current data support the idea that the character of war has changed since 1946, on at least one aspect. Data shows a significant increase in the
civilian to military casualty ratio from ‘battle’ over the period 1946-2010. This trend is robust to various methods of estimation, mitigating concerns that it is somehow an artefact of combining two datasets. Two
other ‘New War’ characteristics are the targeting of civilians in situations other than ‘battle’ and the participation of non-state combatants. Systematic data on these characteristics is limited to the period 1989-2010, making harder to identify long-term trends. Available data nevertheless provides support for the notion
that civilians have increasingly become targets of war over the period 1989-2010, although this trend is not (strongly) significant in all datasets. Furthermore, various datasets disagree on the trend in participation of
non-state combatants, with two showing a significant increase over the period 1989-2010 and 1997-2010
respectively and one showing a significant decrease (1989-2010). Although there is support for the character of war changing after the Second World War, none of the
datasets under investigation suggest that this trend has sped up after the end of the Cold War. In fact, some suggest that this trend has become less pronounced in later decades.
A second interpretation of the ‘New War’ thesis states that whether war is measured by ‘New War’ or ‘Old War’ characteristics matters for which variables are correlated to war. To a certain extent, the present analysis has supported this statement, showing that a number of variables are more consistently related to
certain types of conflict than others. However, patterns are hard to recognize and remain limited to a handful of variables.
On balance, the final conclusion of this paper is the following. Although not equally strong for all
characteristics, there is evidence that war today is different from war in 1946 in the way set out in the ‘New War’ thesis. There is no evidence that the end of the Cold War was a turning point in this. Lastly, measuring war by its ‘New War’ characteristics as compared to its ‘Old War’ characteristics would impact analyses of the correlates of war with respect to at least some variables, although it is unclear that is would lead to a radically
different pattern of correlations.
References
Bazzi, Samuel, and Christopher Blattman. 2011. Economic Shocks and Conflict. The (Absence of?) Evidence from Commodity Prices. UCSD, Yale University.
Chojnacki, Sven. 2006. Anything new or more of the same? Wars and military interventions in the international system, 1946-2003. Global Society 20 (1):25-46.
Collier, Paul, and Anke Hoeffler. 2004. Greed and grievance in civil war. Oxford Economic Papers 56:563-595. Collier, Paul, Anke Hoeffler, and Måns Söderbom. 2004. On the duration of civil war. Journal of Peace Research
41 (3):253-273. De Soysa, Indra. 2002. Paradise is a bazaar? Greed, creed and governance in civil war, 1989-1999. Journal of
Peace Research 39 (4):395-416. Eck, Kristine. 2012. In Data we Trust? A Comparison of UCDP GED and ACLED Conflict Events
Datasets. Cooperation and Conflict 47 (1):124-141. Eck, Kristine, and Lisa Hultman. 2007. One-Sided Violence Against Civilians in War: Insights from New
Fatality Data. Journal of Peace Research 44 (2):233-246. Eckhardt, William. 1989. Civilian Deaths in Wartime. Bulletin of Peace Proposals 20 (1):89-98. Elbadawi, Ibrahim, and Nicholas Sambanis. 2002. How much war will we see? Explaining the prevalence of
civil war. Journal of Conflict Resolution 46 (3):307-334. Fearon, James. 2004. Why do some civil wars last so much longer than oters. Journal of Peace Research 41
(3):275-301. Fearon, James, and David Laitin. 2003. Ethnicity, insurgency and civil war. American Political Science Review 97
(1):75-90. Holsti, Kalevi J. . 1996. The State, War and the State of War. Cambridge: Cambridge University Press. Human Security Report Project. 2012. Human Security Report 2012. Sexual violence, education and war: beyond the
mainstream narrative. Vancouver: Human Security Press. Kaldor, Mary H. . 2006. New and old wars. Organized violence in a global era. Stanford: Stanford University Press. Kreutz, Joakim. 2008. UCDP One-sided Violence Codebook. Version 1.3. Uppsala Conflict Data Program
(UCDP). Lacina, Bethany, and Nils Petter Gleditsch. 2005. Monitoring trends in global combat: A new dataset of battle
deaths. European Journal of Population 21:146-166. Lacina, Bethany, Nils Petterson Gleditsch, and Bruce Russet. 2006. The Declining Risk of Death in Battle.
International Studies Quarterly 50 (3):673-680. Melander, Erik, Magnus Öberg, and Jonathan Hall. 2009. Are 'New Wars' More Atrocious? Battle Severity,
Civilians Killed and Forced Migration Before and After the End of the Cold War. European Journal of International Relations 15:505-536.
Newman, Edward. 2004. The 'New Wars' debate: A Historical Perspective is Needed. Security Dialogue 35 (2):173-189.
Pinker, Steven. 2011. The better angels of our nature. The decline of violence in history and its causes. . London: Penguin. Raleigh, Clionadh, and Håvard Hegre. 2005. Introducing ACLED: An armed conflict location and event
dataset. In Conference on "Disaggregating the study of civil war and transnational violence". University of California Institute of Global Conflict and Cooperation, San Diego.
Raleigh, Clionadh, Andrew Linke, and Caitriona Dowd. 2012. Armed Conflict Location and Event Dataset (ACLED) Codebook. Version 2. Trinity College Dublin, University of Colorado and Centre for the Study of Civil War, PRIO.
Restrepo, Jorge A , Michael Spagat, and Juan F Vargas. 2006. The Severity of the Colombian Conflict: Cross-Country Datasets Versus New Micro-Data. Journal of Peace Research 43 (1):99-115.
Roberts, Adam. 2011. Lives and Statistics: Are 90% of War Victims Civilians? Survival 52 (3):115-136. Sambanis, Nicholas. 2004. What is civil war? Conceptual and empirical complexities of an operational
definition. Journal of Conflict Resolution 48 (6):814-858. Sarkees, Meredith Reid. 2010. Codebook for Intra-State Wars V4.0. Definitions and Variables. Correlates of
War Project.
Sarkees, Meredith Reid. 2010. The COW Typology of War: Defining and Categorizing Wars (Version 4 of the Data) In Note with version 4 of the Correlates of War Data: Correlates of War Project.
Sarkees, Meredith Reid. 2010. Non-State Wars (Version 4.0). Definitions and Variables. Correlates of War Project.
Sarkees, Meredith Reid. 2011. Extra-State Wars (Version 4.0). Definitions and Variables. Correlates of War Project.
Sarkees, Meredith Reid, and Frank Whelon Wayman. 2010. Resort to War: 1816-2007: CQ Press. Sarkees, Meredith Reid, Frank Whelon Wayman, and David J. Singer. 2003. Inter-State, Intra-State, and
Extra-State Wars: A Comprehensive Look at Their Distribution over Time, 1816-1997. International Studies Quarterly 47:49-70.
Sundberg, Ralph. 2010. UCDP Non-State Conflict Codebook. Version 2.3-2011. Yppsala Conflict Data Progam (UCDP).
Sundberg, Ralph. 2011. UCDP Battle-Related Deaths Dataset Codebook: Definitions, sources and methods for the UCDP Battle-related death estimates. Version 5.0. Uppsala Conflict Data Program (UCDP).
Sundberg, Ralph, Kristine Eck, and Joakim Kreutz. 2012. Introducing the UCDP Non-State Conflict Dataset. Journal of Peace Research 49 (2):351-362.
Sundberg, Ralph, Mathilda Lindgren, and Ausra Padskocimaite. 2010. UCDP GED Codebook version 1.0-2011. Department of Peace and Conflict Research, Uppsala University.
Themnér, Lotta. 2011. UCDP/PRIO Armed Conflict Dataset Codebook. Version 4-2011. Uppsala Conflict Data Program (UCDP) and Centre for the Study of Civil Wars, International Peace Research Institute (PRIO).
Themnér, Lotta, and Peter Wallensteen. 2011. Armed conflict, 1946-2010. Journal of Peace Research 48 (3):525-536.