Embed Size (px)
Citation preview
ACARP PROJECT
NUMBER C21011
DEVELOPMENT OF NEW TESTING PROCEDURE FOR THE
ASSESSMENT OF RESIN PERFORMANCE FOR IMPROVED
ENCAPSULATED ROOF BOLT INSTALLATION IN COAL MINES
END OF PROJECT REPORT
INVESTIGATORS
NAJ AZIZ
JAN NEMCIK
PETER CRAIG
ROBERT HAWKER
Research team:
1. School of Civil, Mining and Environmental Engineering, University of Wollongong-
Naj Aziz, Jan Nemcik, Colin Devenish, Ali Mirza, Arash Moselmi and Hooman Ghojavand
2. Jennmar Australia Pty Ltd- Peter Craig, Mark Bedford and Tim Gaudry,
3. Orica Pty Ltd- Rob Hawker and David Joyce
October2014
Participating organisations:

1
Enquiries should be addressed to: Professor Naj Aziz Honorary Professorial Fellow School of Civil, Mining and Environmental Engineering Faculty of Engineering and Information Sciences University of Wollongong (UOW) NSW 2522 Australia Ph: +61 2 42 213 449 Email: [email protected] Important disclaimer UOW advises that the information contained in this publication comprises general statements based on scientific
research. The reader is advised and needs to be aware that such information may be incomplete or unable to be
used in any specific situation. No reliance or actions must therefore be made on that information without seeking
prior expert professional, scientific and technical advice. To the extent permitted by law, UOW (including its
employees and consultants) excludes all liability to any person for any consequences, including but not limited to
all losses, damages, costs, expenses and any other compensation, arising directly or indirectly from using this
publication (in part or in whole) and any information or material contained in it.

2
Table of Content
EXECUTIVE SUMMARY ............................................................................. Error! Bookmark not defined.
1. INTRODUCTION................................................................................................................................. 3
2. PAST STUDIES ................................................................................................................................... 5
3. STUDY PROGRAMME ......................................................................................................................... 5
3.1. FIELD STUDY .............................................................................................................................. 5
3.1.1. Baal Bone Colliery ................................................................................................................... 5
3.1.2. Tahmoor Colliery .................................................................................................................... 11
3.1.3. Gujarat NRE No.1 Colliery ....................................................................................................... 15
3.2. SUMMARY OF FIELD STUDY ..................................................................................................... 18
4. LABORATORY STUDIES ................................................................................................................... 20
4.1. Push testing of the sectionalised fully-encapsulated threaded tubes ...................................... 20
4.2. Bolt pull testing in an overhead sandstone/concrete block...................................................... 25
4.3. Resin Strength Properties ......................................................................................................... 29
4.3.1 Uni-axial Compressive Strength ................................................................................................ 36
4.3.2 Elastic Modulus of Elasticity ...................................................................................................... 37
4.3.3 Punch shear test ..................................................................................................................... 37
4.3.4 Rheological Properties (Creep) ................................................................................................. 39
Experimental Study .......................................................................................................................... 39
4.4.1. Sample Preparation ............................................................................................................... 39
4.4.2. Uni-axial Compression Strength and E-values test results .......................................................... 43
4.4.3. Punch Shear Test Results: ......................................................... Error! Bookmark not defined.
4.4.4. Creep tests ............................................................................... Error! Bookmark not defined.
5. CONCLUSIONS AND RECOMMENDATIONS ....................................................................................... 67
ACKNOWLEDGEMENTS ......................................................................................................................... 68
REFERENCES ....................................................................................................................................... 68
APPENDICES......................................................................................................................................... 73

3
EXECUTIVE SUMMARY
In underground coal mining, the resin bond between the rock bolt and the strata is one of the critical elements of a roof
bolting system, yet the Australian coal industry does not have an agreed standard for bolting system evaluation. A program
of field and laboratory study was undertaken to examine various factors influencing the load transfer mechanism between
the bolt, resin and rock. As per ACARP project requirement, the entire study used M24, 21.7 mm diameter X-grade Jennmar
JBX bolts (APPENDIX B) and the standard Orica fast setting resin (APPENDIX Figure C). A series of Short Encapsulation
Pull Tests (SEPTs) were carried out in three mines with different geological conditions. These mines were Baal Bone,
Tahmoor and Gujarat NRE No.1. Additional studies included the evaluation of the anchorage performance along sections
of bolts installed in steel tubes and variations in the strength properties of resin depending on sample dimensions.
Furthermore, laboratory SEPTs were carried out on bolts installed in an overhead sandstone block mounted on a drill rig
under environmentally controlled conditions. Factors of importance considered to affect bolt installation in strata include;
borehole diameter, resin annulus thickness, installation time (including bolt spin to back and spin at back), the effect of
gloving and its impact on installation quality and load transfer variation along the length of the installed bolt. 24 bolts were
installed at each of Baal Bone and Tahmoor mines, and 16 bolts installed at Gujarat NRE No.1 mine. Installation of bolts in
steel tubes was carried out at Springvale Colliery and subsequently tested in the Wollongong University Laboratory. The
summary of the field studies found that:
bolts installed in holes over-drilled by 50 mm resulted in relatively higher load transfer capacity for the given installation
time,
bolts installed in 27 mm diameter holes performed relatively better than those installed in 28 mm holes,
in some cases over-spinning was detrimental to the load transfer capacity of the installed bolt,
the influence of gloving was reduced with over-drilling,
strength properties of resin tested at different length to diameter ratios did not vary considerably. In general, the length
to diameter ratio of one was found to be a convenient dimension, and
consistency of the strength values obtained from testing resin samples was dependent on the methodology of resin
mixing and casting.
Various laboratory procedures for testing resins and grouts properties were evaluated as suggested by British and South
African standards. Special emphasis was directed to the determination of the following resin /grout properties;
Uniaxial Compressive Strength
Young modules of elasticity
Shear strength
Creep tests.
The results from this evaluation revealed that some aspects of the British standards have shortcomings in sample
preparation, testing and presentation of the results. Therefore, a new sampling and testing procedure have been developed
as part of this study. Laboratory tests indicated that the proposed testing method is reliable, repeatable, easy to conduct and
produces meaningful results when compared to underground tests. The new testing procedure is considered to be
acceptable for testing resins used in Australia.
Because of the changes in emphasis on the project direction, this report is in two parts:
Underground and the laboratory SEPT study findings, and
Development of new testing procedures for the assessment of resin performance and a suggested method for SEPT.
1. INTRODUCTION
Over the past couple of decades, there has been significant interest in the performance of bolting system for strata
stabilisation around openings in Australian underground coal mines. The resin bond between the rock bolt and the strata is
one of the critical elements of a roof bolting system. The in situ installation effectiveness of roof bolting would be varied with
4
changing ground conditions, yet the Australian coal industry does not have an agreed standard for bolting system
competency evaluation and continues to rely on other country’s’ standards, notably British, South African, and American to
evaluate its bolting systems.
With increases in longwall geometry and need for continuity through difficult and challenging ground geology, ground
support must withstand higher loads than ever before. Little work has been carried out on the assessment of the
effectiveness of the encapsulation medium (resin) for bolt installation. The limited number of underground pull tests
undertaken, which are available through various publications are insufficient and are hard to control and standardise.
Therefore, the confidence of drawing definite conclusions about the performance of bolting system that may contribute to
improved strata reinforcement is becoming hard to build up. A study focusing on providing a meaningful and consistent way
of assessing resin/bolt interaction with high degree of confidence will offer significant benefits to both resin manufacturers
and mine operators.
The initial objectives of the project were aimed at developing a standard test method for testing or assessing of different
resins, based on; (a) the correlation of laboratory derived results with the actual performance of a roof bolt in the field
(underground pull-out tests), and (b) development of a correlation index between the test results, which can be used by
industry to select an appropriate resin for specific site conditions. Soon the project commenced, it was realised that the task
of achieving the above objectives was enormous in the given timeframe. Also, there was a concern that a product to product
comparative study may not be in the best interest of the resin manufacturers, which was not conducive to cooperative
research in a healthy competitive marketing environment. Accordingly, new objectives were established during the first
ACARP appointed monitors' meeting on February 15th 2012. These were;
1. Developing standard underground test procedures for SEPT for Australian standard roof bolts in 27-28 mm drill holes.
2. Determining the optimum drilling installation; a) drill rotation speed and b) thrust rates for standard Australian roof bolts
in 27-28 mm drill holes.
3. Developing standard laboratory test procedures for determining resin mechanical properties from the contents of a
finished goods capsule. The four important properties include:
a) UCS,
b) Modulus of Elasticity (E value).
c) Shear Strength, and
d) Creep.
The procedures or methods used should enable resin manufacturers to use them for routine Quality Control (QC) batch
testing, and to allow mines to engage independent laboratories to verify results. On the basis of the above monitors’
directive, a programme of research study was decided to undertake:
a) SEPT conducted at three underground mines in different geological conditions. Selection of the mines were based on
the availability of the appropriate test sites as well as positive management response,
b) Laboratory SEPT of bolts in an overhead sandstone block, paying particular attention to various parameters pertinent
to bolt installation competency, such as drill motor rpm, drill thrust, over drill and bolt spin time.
c) Incremental evaluation of the load transfer capacity of the full length of encapsulated bolt by push testing of the equal
length sections of the bolt,
d) Laboratory methods of testing resin properties from the contents of the finished goods (resin sausage) capsule, with
the aim of defining clearly the changes in the mechanical properties of the resins, thus permitting the establishment of
a standard method that can be used by industry for effective specification of resins, and
e) Preparation of procedures for SEPT and resin strength testing.
With Australian coal mines being fully dependent on the use of bolting technology for strata reinforcement in the vicinity of
the mine workings and heading development, it is logical that mine operators and engineers become fully aware of the
importance of the competency of the selected bolting system (i.e., bolt and resin) and not just rely on supplier’s directives
and advice. The acquisition of such knowledge is relatively simple in comparison with other countries, notably USA, which

5
uses a variety of bolting systems (bolts and resins). The Australian usage of bolting systems is much more homogeneous
with similar diameter bolts and with little diversity in the use of resin application until now. In light of the recent increases in
various resin types application diversifications in Australian coal mines, there is a need for setting up a practical method of
testing, by the end users of various resin properties with easily available testing facilities. Accordingly, this project is aimed
to focus on finding easy ways for testing bolts both in the field and in the laboratory. These newly devised methods should
provide operators an easy way to examine the quality of resins used in bolt installations in different ground formations and
conditions.
2. PAST STUDIES
A number of papers pertinent to the aims and objectives of the project are worth reporting. Notable papers include;
Altounyan et al, (2003) on developments in improving the standard of installation and bond strength of full column resin roof
bolts; Wilkinson and Canbulat (2005) on the performance of bolt installations; Crompton and Oyler (2005) on investigation of
fully grouted roof bolts installed under in situ conditions; Giraldo, et al., (2005) on improved pull out strength of fully grouted
roof bolts through hole geometry modification; Campbell et al., (2004 and 2007) highlighting the importance of better
understanding bolt installation methods and the build-up of the anchorage load along the installed bolt in a variety of ground
conditions; Aziz , et al., (2013, 2006, 2008); Jalalifar and Aziz (2005) Jalalifar, Aziz and Hadi (2006) reported on the
influence of bolt profile configuration on bolt load transfer capacity, under both push and pull testing; Zingano et al., (2008)
on in situ tests and numerical simulation about the effect of annulus thickness on the resin mixture for fully grouted resin
bolt; and most recently, Aziz, et al., (2013) reported on the bolt load transfer capability by push testing and on the simplified
method of casting resin samples for strength property evaluation.
3. STUDY PROGRAMME
The revised project programme was aimed to maximise a possible outcome to the project’s aims and objectives,
notwithstanding of the initial objective, consisting of;
Field SEPT in underground coal mines,
Load transfer capacity study of the bolt sections encapsulated in a steel tube,
Laboratory SEPT in an overhead sandstone block,
Study the strength properties of the resin used for bolt encapsulation,
Deliverables which include ; (a) procedures for undertaking SEPT, both underground and in the laboratory, (b)
suggested methods of determination of UCS, Young modulus, shear strength, and creep, and (c) methods of bolt
installation for improved load bearing capacity.
4. FIELD STUDY
Three mines with different geological conditions were selected to examine the load transfer capacity of the bolt by short
encapsulation tests. The selected mines were Baal Bone, Tahmoor and Gujarat NRE No1.
4.1. Baal Bone Colliery
4.1.1. Bolt installtion and testing
The first SEPT field investigation was carried out at Baal Bone Mine. The mine is located in the Western coalfields of NSW,
32 km north of Lithgow and roughly 130 km from Sydney. The mine owned and operated by Glencore Pty Ltd, ceased
production recently but has been kept open for care and maintenance and training purposes, therefore was readily available
for the study. The mine has a competent roof, as demonstrated from the geological plan, shown in Figure 1. A total of 24
short encapsulation bolts were installed at Baal Bone. All bolts were installed in the Triassic mudstone/shale immediate
formation above the Lithgow seam. All holes were drilled in a competent roof and the borescope survey showed no signs of
fractures or discontinuities. Holes for bolt installation were drilled to a height of 1100 mm, which ensured that all holes
stayed in the immediate mudstone formation below claystone bands. Drilling of holes and subsequent installation of bolts
were carried out using a hand-held and compressed air-driven Alminco Gopher drill machine. The 23.7 mm (21.7 mm core)

6
diameter X-grade bolts were used in the area as shown in Figure 2 a. Figure 2 b shows a typical pull testing setup. Each
drilled hole was checked for diameter consistency within the top 300 mm of the hole using a three prong borehole calliper.
The resin capsules of appropriate lengths were cut and resealed into smaller pieces to suit each installed bolt length.
Figure 3 shows the schematic drawing of the encapsulated bolt and a photo of an in-line reamer.
The first 16 holes were reamed to a standard length of 900 mm of the 1100 long borehole length. Holes 17-20 were not
reamed and holes 21-24 were reamed and 50 mm over-drilled above the bolt top end to allow for the possibility of forcing
the shredded plastic film to accumulate along this length (Figure 3B). Generally, reaming was carried out using a 45 mm
diameter inline reamer as shown in Figure 3C.The first four bolts were installed in 28 mm diameter holes, while the
remaining 20 bolts were installed in 27 mm diameter holes. Orica / Minova RA33025F fast setting resin capsules were used
to install bolts in drill holes. Bolts 17-20, with longer encapsulation length, were pull-tested after three hours of their
installations and the rest of the bolts were pull-tested after one day of installation. It should be noted that the use of inline
reamer is likely to interfere with drilling speed, and the rate of drilling of the main 27 /28 mm drill head, once the 45 mm
second drill head starts reaming of the hole. This obviously will alter the rifling profile pitch along the length of the
encapsulated section of the drilled hole.
Figure 1-Geology of the Baal Bone immediate roof at heading test site

7
A
Figure 3-The schematic drawing of SEPT System; A) 300 mm bolt top encapsulation, B) with over drilling and (C) an
in-line reamer
4.1.2. Results and analyses
Table 1 shows the summary of retrieved data of the bolt pull testing with subsequent analysis. The bond strength (kN/mm)
was determined as the peak (maximum) pull load divided by the encapsulation length. The first eight bolts were installed in
accordance with the standard installation time of ten seconds; however there were some variations in time at the “spin to
back” and “spin at back” as indicated in Table 1. Bolts 9-12 were installed in 5 s total time and bolts 13 to 16 took a much
longer time period of installation, varying between 25 s to 42 s, particularly at the ““spin at back”” for “spin to stall” operation.
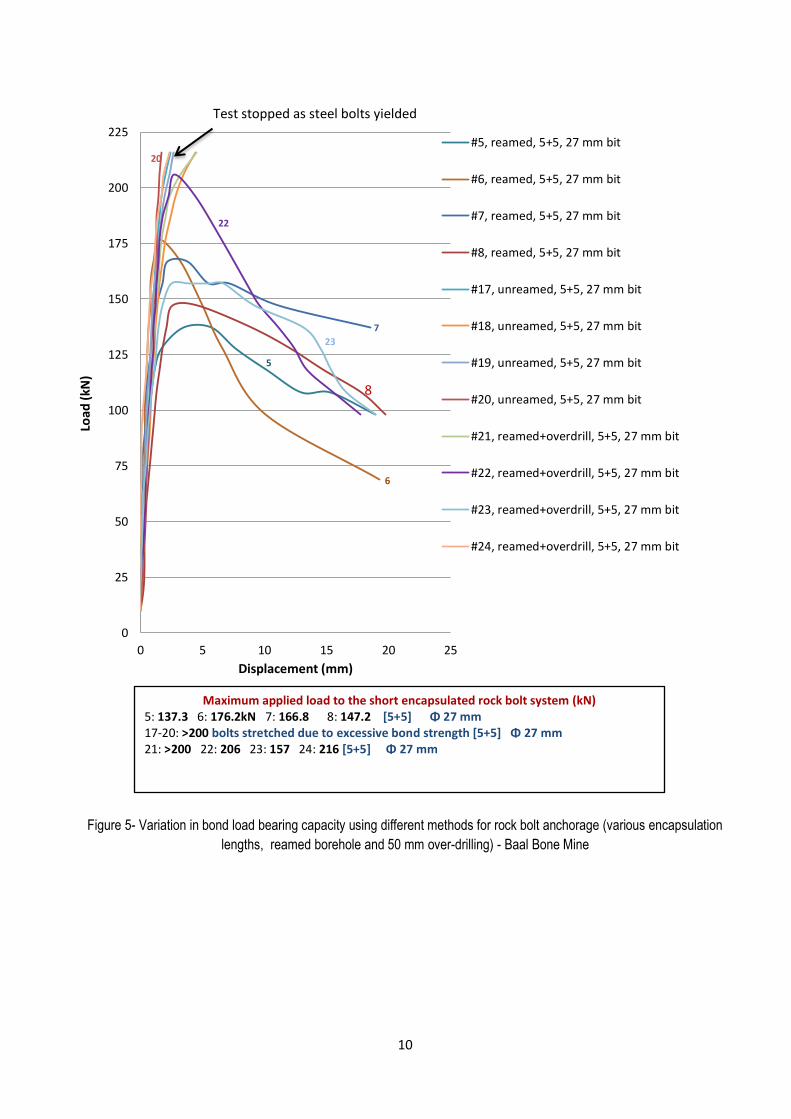
Bolts 17 to 20, had encapsulation lengths greater than 300 mm, with hole diameter of 28 mm. Figure 4 shows the pull test
load-displacement profiles of the first 16 bolts and Figure 5 shows load-displacement profiles of the remaining eight bolts.
The average load-displacement values with respect to (a) installtion time and (b) reamed and un-reamed holes are shown in
Figure 6.
Bolts 5, 6, 7 and 8 installed in smaller diameter holes of 27 mm achieved better load transfer capacity than bolts installed in
28 mm diameter boreholes (1, 2, 3 and 4). Contrary to findings by Wilkinson and Canbulat (2005), extra spin time did not
produce good results. However, over-drilled holes performed better than the rest of the bolt installations. It is that the top
300 mm bond strength of most bolts, was significantly reduced, because of the accumulation of the capsule plastic film
remnants in the over-drilled length. Thus the 50 mm over-drilled space allows shredded resin skin to accumulate in the over
drill space above the bolt end and away from the encapsulated section of the bolt \ above the reamed section of the
borehole. Consequently, the results showed a significant improvement. Thus, it is reasonable to conclude that the current
short encapsulation pull test method used to study bond strength appears to demonstrate the effectiveness of over-drilling in
Figure 2A-Roof bolts installed at Baal Bone Mine Figure 2B-Pull test setup on site
B C
8
Australian mines (Figure 5). Longer length encapsulation pull test results (bolts 17-20) were comparable to over-drilled bolt
(21-24) installation as demonstrated in Table 1 and Figures 4 and 5. All spin times were kept constant at 10 seconds.
4.1.3. Summary
It can be inferred from the pull testing at Baal Bone that:
1. Bolt installation time of around 10 s constitutes an acceptable time for effective bolt installation as is normally
recommended for use with Orica / Minova fast setting resin of 14 s,
2. The results of the over spinning at back was inconclusive, because of the limited bolt encapsulation length,
3. The use of 300 mm long encapsulation length may be the maximum acceptable length for pull testing, but this length
depends on the type of the rock formation, which has some bearing on the load transfer capability of the installation. This
finding is in agreement with the study carried out by Wilkinson and Canbulat (2005),
4. In-line reamer drill rod saved time for drilling reamed holes,
5. Hole over drilling contributed to increased load transfer capacity of the installed bolt, because the top space became the
accumulation zone for the gloving material, thus reducing gloving concentration in the encapsulation length of the bolt,
contributing better bonding of the bolt /resin and the host medium.
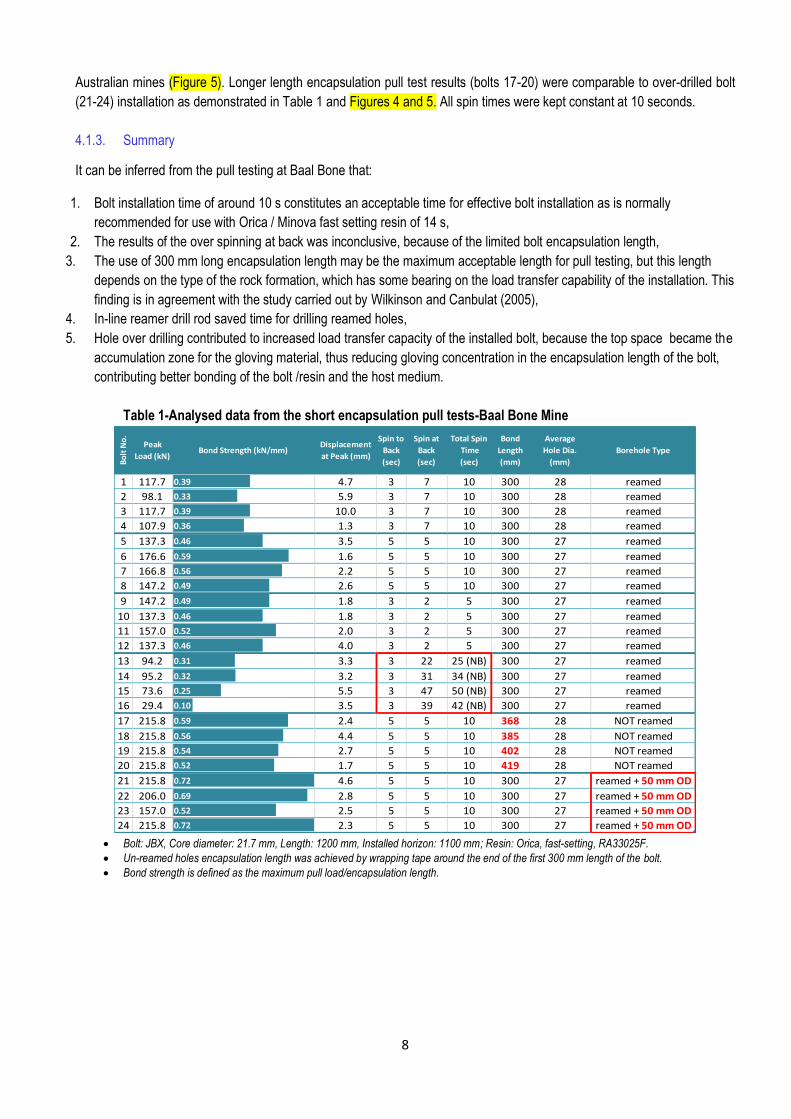
Table 1-Analysed data from the short encapsulation pull tests-Baal Bone Mine
Bolt: JBX, Core diameter: 21.7 mm, Length: 1200 mm, Installed horizon: 1100 mm; Resin: Orica, fast-setting, RA33025F.
Un-reamed holes encapsulation length was achieved by wrapping tape around the end of the first 300 mm length of the bolt.
Bond strength is defined as the maximum pull load/encapsulation length.
Bo
lt N
o.
Peak
Load (kN)Bond Strength (kN/mm)
Displacement
at Peak (mm)
Spin to
Back
(sec)
Spin at
Back
(sec)
Total Spin
Time
(sec)
Bond
Length
(mm)
Average
Hole Dia.
(mm)
Borehole Type
1 117.7 0.39 4.7 3 7 10 300 28 reamed
2 98.1 0.33 5.9 3 7 10 300 28 reamed
3 117.7 0.39 10.0 3 7 10 300 28 reamed
4 107.9 0.36 1.3 3 7 10 300 28 reamed
5 137.3 0.46 3.5 5 5 10 300 27 reamed
6 176.6 0.59 1.6 5 5 10 300 27 reamed
7 166.8 0.56 2.2 5 5 10 300 27 reamed
8 147.2 0.49 2.6 5 5 10 300 27 reamed
9 147.2 0.49 1.8 3 2 5 300 27 reamed
10 137.3 0.46 1.8 3 2 5 300 27 reamed
11 157.0 0.52 2.0 3 2 5 300 27 reamed
12 137.3 0.46 4.0 3 2 5 300 27 reamed
13 94.2 0.31 3.3 3 22 25 (NB) 300 27 reamed
14 95.2 0.32 3.2 3 31 34 (NB) 300 27 reamed
15 73.6 0.25 5.5 3 47 50 (NB) 300 27 reamed
16 29.4 0.10 3.5 3 39 42 (NB) 300 27 reamed
17 215.8 0.59 2.4 5 5 10 368 28 NOT reamed
18 215.8 0.56 4.4 5 5 10 385 28 NOT reamed
19 215.8 0.54 2.7 5 5 10 402 28 NOT reamed
20 215.8 0.52 1.7 5 5 10 419 28 NOT reamed
21 215.8 0.72 4.6 5 5 10 300 27 reamed + 50 mm OD
22 206.0 0.69 2.8 5 5 10 300 27 reamed + 50 mm OD
23 157.0 0.52 2.5 5 5 10 300 27 reamed + 50 mm OD
24 215.8 0.72 2.3 5 5 10 300 27 reamed + 50 mm OD

9
Figure 4- Variation in load transfer capacity at Baal Bone Mine with bolts pull tested with different hole diameters, hole
configuration and bolt spin time
10
Figure 5- Variation in bond load bearing capacity using different methods for rock bolt anchorage (various encapsulation
lengths, reamed borehole and 50 mm over-drilling) - Baal Bone Mine
5
6
7
20
22
23
0
25
50
75
100
125
150
175
200
225
0 5 10 15 20 25
Load
(kN
)
Displacement (mm)
#5, reamed, 5+5, 27 mm bit
#6, reamed, 5+5, 27 mm bit
#7, reamed, 5+5, 27 mm bit
#8, reamed, 5+5, 27 mm bit
#17, unreamed, 5+5, 27 mm bit
#18, unreamed, 5+5, 27 mm bit
#19, unreamed, 5+5, 27 mm bit
#20, unreamed, 5+5, 27 mm bit
#21, reamed+overdrill, 5+5, 27 mm bit
#22, reamed+overdrill, 5+5, 27 mm bit
#23, reamed+overdrill, 5+5, 27 mm bit
#24, reamed+overdrill, 5+5, 27 mm bit
8
Maximum applied load to the short encapsulated rock bolt system (kN) 5: 137.3 6: 176.2kN 7: 166.8 8: 147.2 [5+5] Φ 27 mm 17-20: >200 bolts stretched due to excessive bond strength [5+5] Φ 27 mm 21: >200 22: 206 23: 157 24: 216 [5+5] Φ 27 mm
Test stopped as steel bolts yielded

11
Bond Displacement (mm)
Lo
ad
(k
N)
Various SEPT Installation MethodsBaal Bone Mudstone
0 2 4 6 8 100
10
20
30
40
50
60
70
80
90
100
110
120
130
140
150
160
170
180
190
200
Average: Reamed, spin 5 + 5, 27mm bitAverage : NOT Reamed, spin 5 + 5, 27mm bitAverage: Reamed + overdrill, spin 5 + 5, 27mm bit
Figure 6 – Baal Bone Colliery: Variation in load transfer capacity by SEPT method. Average values (a) installation
time and (b) reamed and no reamed hole
4.2. Tahmoor Colliery
4.2.1 Bolt installtion and pull testing
The next round of pull testing was carried out at Tahmoor Colliery in late November 2012. The mine is situated in the
Southern Highlands region of NSW, approximately 75 km South West of Sydney and in the vicinity of the Tahmoor
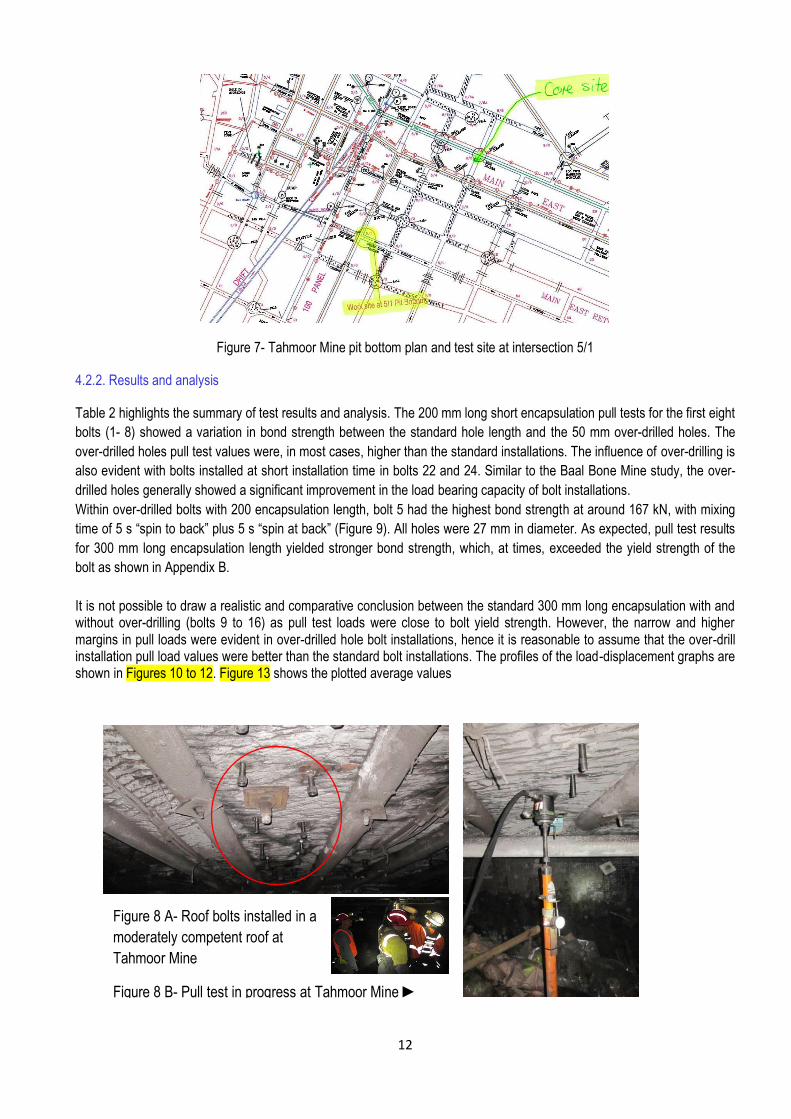
Township. The mine is owned and operated by Glencore Australia. Figure 7 shows the location of the test site at 5/1
intersection near the pit bottom.
Tahmoor mine produces coal from the Bulli Seam at a depth of 400-450 m. The coal seam roof is relatively stronger than
the Lithgow measures of Baal Bone mine and comprises mudstone, shale and sandstone. Therefore, the mine roof at the
test site can be described as moderately competent.
Similar to Baal Bone, a total of 24 bolts were installed in the intersection 5/1 near the pit bottom. The process of drilling and
installation of 24 rock bolts as well as the equipment used was similar to the bolt installtion operation at Baal Bone mine.
Figures 8A and 8B show typical SEPT installation and measuring equipment used in the mine.
During the drilling operation, holes 1-4, 9-12 and 17-20 were reamed as standard holes. Holes 5-8, 13-16 and 21-24 were
not reamed but were over-drilled up to 50 mm. Drilling and reaming was carried out using a combined 27 mm drill bit with an
inline reamer of 45 mm diameter as shown in Figure 3C. As in previous practice at Baal Bone, resin capsules (type:
RA33025F) were used for bolt installation. The bolts used at Tahmoor Mine were the same type as that used at Baal Bone
Mine. The interval between bolt encapsulation and pull test times was around two hours.
Two encapsulation lengths of 200 mm and 300 mm lengths were trialled at Tahmoor, with and without the additional 50 mm
of over drilling. The installation time of the bolts was mostly in accordance with the normal standard time of 10 s; however,
there were some variations, mostly at lower installation times as shown in Table 2.
Bond Displacement (mm)
Lo
ad
(kN
)Various Mix Times & Drill Bit, Reamed SEPT
Baal Bone Mudstone
0 2 4 6 8 100
10
20
30
40
50
60
70
80
90
100
110
120
130
140
150
160
170
180
190
200
Average : Reamed, spin 5 + 5, 28mm bitAverage: Reamed, spin 5 + 5, 27mm bitAverage: Reamed, spin 3 + 2, 27mm bitAverage: Reamed, spin +30s, 27mm bit
(a) (b)
12
Figure 7- Tahmoor Mine pit bottom plan and test site at intersection 5/1
4.2.2. Results and analysis
Table 2 highlights the summary of test results and analysis. The 200 mm long short encapsulation pull tests for the first eight
bolts (1- 8) showed a variation in bond strength between the standard hole length and the 50 mm over-drilled holes. The
over-drilled holes pull test values were, in most cases, higher than the standard installations. The influence of over-drilling is
also evident with bolts installed at short installation time in bolts 22 and 24. Similar to the Baal Bone Mine study, the over-
drilled holes generally showed a significant improvement in the load bearing capacity of bolt installations.
Within over-drilled bolts with 200 encapsulation length, bolt 5 had the highest bond strength at around 167 kN, with mixing
time of 5 s “spin to back” plus 5 s “spin at back” (Figure 9). All holes were 27 mm in diameter. As expected, pull test results
for 300 mm long encapsulation length yielded stronger bond strength, which, at times, exceeded the yield strength of the
bolt as shown in Appendix B.
It is not possible to draw a realistic and comparative conclusion between the standard 300 mm long encapsulation with and without over-drilling (bolts 9 to 16) as pull test loads were close to bolt yield strength. However, the narrow and higher margins in pull loads were evident in over-drilled hole bolt installations, hence it is reasonable to assume that the over-drill installation pull load values were better than the standard bolt installations. The profiles of the load-displacement graphs are shown in Figures 10 to 12. Figure 13 shows the plotted average values
Figure 8 B- Pull test in progress at Tahmoor Mine ►
Figure 8 A- Roof bolts installed in a
moderately competent roof at
Tahmoor Mine

13
Table 2- Processed data from short encapsulation pull tests-Tahmoor Mine
NB: OD – over drill. All encapsulated holes diameter: 27mm. All holes reamed. Bond strength (kN/mm) is the
peak (maximum) pull load divided by the encapsulation length
Figure 9- Variation in load bearing capacity of the first eight bolts (1-8) using different installation methods for rock bolt
anchorage at Tahmoor Mine (reamed hole and 50 mm over drill)
Bolt
No. Peak
Load
(kN)
Bond Strength (kN/mm)Displacement
at Peak (mm)
Spin
to
Back
(sec)
Spin
at
Back
(sec)
Total
Spin
Time
(sec)
Bond
Length
(mm)
Borehole Type
1 98.1 0.49 2.6 5 5 10 200 reamed
2 127.5 0.64 4.3 5 5 10 200 reamed
3 127.5 0.64 2.3 5 5 10 200 reamed
4 127.5 0.64 3.9 5 5 10 200 reamed
5 166.8 0.83 2.6 5 5 10 200 reamed + 50 mm OD
6 137.3 0.69 2.4 5 5 10 200 reamed + 50 mm OD
7 147.2 0.74 3.4 5 5 10 200 reamed + 50 mm OD
8 107.9 0.54 1.8 5 5 10 200 reamed + 50 mm OD
9 235.4 Long encapsulation 4.6 5 5 10 300 reamed
10 201.1 0.67 6.3 5 5 10 300 reamed
11 235.4 Long encapsulation 3.2 5 5 10 300 reamed
12 235.4 Long encapsulation 4.4 5 5 10 300 reamed
13 186.4 0.62 3.2 5 5 10 300 reamed + 50 mm OD
14 225.6 Long encapsulation 4.0 5 5 10 300 reamed + 50 mm OD
15 225.6 0.75 6.5 5 5 10 300 reamed + 50 mm OD
16 215.8 0.72 3.3 5 5 10 300 reamed + 50 mm OD
17 78.5 0.39 1.3 3 2 5 200 reamed
18 63.8 0.32 5.3 3 2 5 200 reamed
19 98.1 0.49 2.0 3 2 5 200 reamed
20 34.3 0.17 2.2 3 2 5 200 reamed
21 107.9 0.54 11.7 3 2 5 200 reamed + 50 mm OD
22 137.3 0.69 2.4 3 2 5 200 reamed + 50 mm OD
23 98.1 0.49 1.5 3 2 5 200 reamed + 50 mm OD
24 147.2 0.74 1.9 3 2 5 200 reamed + 50 mm OD

14
Figure 10- Variation in load bearing capacity of the bolts 9-16 using different methods for roof bolt anchorage at Tahmoor
Mine (reamed hole and 50 mm over drill)
Figure 11- Variation in load bearing capacity of rock bolts 17-24 using different installation methods (reamed borehole and
50 mm over drill)-Tahmoor Mine

15
Bond Displacement (mm)
Lo
ad
(k
N)
Reamed V Reamed OverdrillTahmoor Siltstone
0 2 4 6 8 100
10
20
30
40
50
60
70
80
90
100
110
120
130
140
150
160
170
180
190
200
Average: 200mm bond, reamedAverage: 200mm bond, Reamed with OVERDRILLAverage: 300mm Bond, Reamed and OVERDRILLAverage : 300mm bond, Reamed
Figure 12- Tahmoor (a) 200 mm V 300 mm Bond Length, (b) Reamed V Reamed Over drill. Average values
With regard to short installation times, it is clear that shorter installation spin times less than ten seconds were inadequate
for proper resin mixing to allow effective anchorage and hence a relatively lower peak pull load strength. Again over drilling
appears to yield relatively superior bond strength.
4.2.3. Summary
Thus, it can be inferred from the tests carried out at Tahmoor Colliery that:
bolts installed in over-drilled holes had superior load transfer capacity, irrespective of the anchorage length of either
200 or 250 mm,
as expected, the 300 mm encapsulation length yielded greater load transfer capacity (higher pull force values) leading
to yield strength, and
shorter installation time of less than the standard 10 sec was counter-productive for effective load transfer mechanism.
Prolonged “spin time at back” and shorter “spin time to back” is also counter-productive.
4.3 Gujarat NRE No.1 Colliery
4.3.1 Bolt installtion and pull testing
The third and final round of field tests was carried out in mid-December, 2012 at NRE No.1 Colliery situated in the Southern
Coalfields of NSW, approximately 60 km South of Sydney, 10 km north of Wollongong and in the vicinity of Russell Vale
Township.
Gujarat NRE No.1 Colliery currently mines both the Bulli Seam and the Wongawilli Seam. The test site was located in C
heading, between CT20 and CT21 of the Wongawilli Seam East main headings as shown in the mine plan (Figure 13). The
Bond Displacement (mm)
Lo
ad
(kN
)Various Mix Times and Bond Length, Reamed SEPT
Tahmoor Siltstone
0 2 4 6 8 100
10
20
30
40
50
60
70
80
90
100
110
120
130
140
150
160
170
180
190
200
Average: 200mm bond, reamed, spin 3 + 2Average: 300mm bond, reamed, spin 5 + 5Average: 200mm bond length, reamed, spin 5 + 5
(a) (b)

16
selected stratification above the working headings is as shown in the mine plan. The selected stratification above the
working part of the Wongawilli Seam was a soft formation of mainly coal layers and clay bands as shown in Appendix A 2-4.
Figure 13- Gujarat NRE No.1 mine plan showing the study area in the vicinity of the mine pit bottom
Installation and pull testing
Similar to previous field studies, an even and flat roof area was selected at the CT20 intersection for bolt installation as
shown in Figure 13. A total of 16 bolts, 1200 mm long, were installed in 1100 mm long holes using a handheld and
compressed air operated Alminco Gopher drill. All bolts were installed using Orica / Minova fast setting resin type
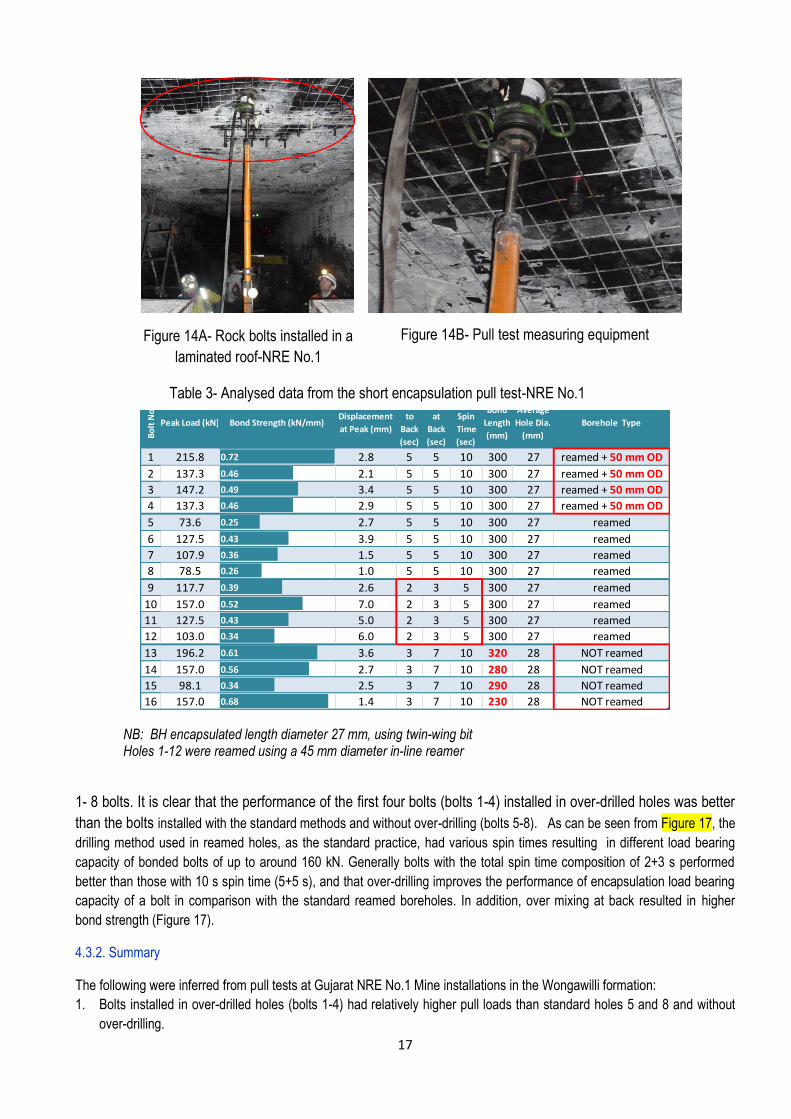
RA33025F. Typical installation of rock bolts and measuring equipment used are shown below (Figures 14A and 14B).
Table 3 shows details of pull testing results. Drilling and reaming of holes were accomplished using an in-line reamer.
All holes were drilled using 27 mm wing bits. Reamed sections were 45 mm in diameter.
Encapsulation length of the first 12 holes was constant at 300 mm and encapsulation lengths of holes 13 to 16 holes
were variable as indicated in Table 3.
Bolts 1 to 4 were installed in 50 mm long over-drilled holes with a reamed 200 mm top section. The installation time
was consistent at standard time of ten seconds (5 s “spin to back” and 5 s “spin at back”).
Bolts in holes 9 to 12 were installed at the total spin time of five seconds (2 s “spin to back and 3 s “spin at back”).
In unreamed holes13-16, the desired anchorage length of holes 13 to 16 were accomplished by wrapping an insulation
tape of sufficient thickness around the bolt to the determined length, thus preventing the resin from spreading down the
length of the bolt.
The time between bolt installation and pull test was nearly three hours for all bolts. The length of resin capsule for each
hole was calculated and the correct length was cut from the longer resin capsule and re-sealed accordingly. The length of
each resin capsule used in 300 mm encapsulation for effective anchorage was 250 mm.
Table 3 shows the current 300 mm short encapsulation pull test for the first 12 rock bolts. As can be seen from Figure 15,
un-reamed holes with variable encapsulation length have better load bearing capacity, up to 196 kN, in comparison with
performance of reamed holes with 300 mm encapsulation length. Figure 16 shows the load-displacement graphs of
17
NB: BH encapsulated length diameter 27 mm, using twin-wing bit Holes 1-12 were reamed using a 45 mm diameter in-line reamer
1- 8 bolts. It is clear that the performance of the first four bolts (bolts 1-4) installed in over-drilled holes was better
than the bolts installed with the standard methods and without over-drilling (bolts 5-8). As can be seen from Figure 17, the
drilling method used in reamed holes, as the standard practice, had various spin times resulting in different load bearing
capacity of bonded bolts of up to around 160 kN. Generally bolts with the total spin time composition of 2+3 s performed
better than those with 10 s spin time (5+5 s), and that over-drilling improves the performance of encapsulation load bearing
capacity of a bolt in comparison with the standard reamed boreholes. In addition, over mixing at back resulted in higher
bond strength (Figure 17).
4.3.2. Summary
The following were inferred from pull tests at Gujarat NRE No.1 Mine installations in the Wongawilli formation:
1. Bolts installed in over-drilled holes (bolts 1-4) had relatively higher pull loads than standard holes 5 and 8 and without
over-drilling.
Bo
lt N
o.
Peak Load (kN) Bond Strength (kN/mm)Displacement
at Peak (mm)
Spin
to
Back
(sec)
Spin
at
Back
(sec)
Total
Spin
Time
(sec)
Bond
Length
(mm)
Average
Hole Dia.
(mm)
Borehole Type
1 215.8 0.72 2.8 5 5 10 300 27 reamed + 50 mm OD
2 137.3 0.46 2.1 5 5 10 300 27 reamed + 50 mm OD
3 147.2 0.49 3.4 5 5 10 300 27 reamed + 50 mm OD
4 137.3 0.46 2.9 5 5 10 300 27 reamed + 50 mm OD
5 73.6 0.25 2.7 5 5 10 300 27 reamed
6 127.5 0.43 3.9 5 5 10 300 27 reamed
7 107.9 0.36 1.5 5 5 10 300 27 reamed
8 78.5 0.26 1.0 5 5 10 300 27 reamed
9 117.7 0.39 2.6 2 3 5 300 27 reamed
10 157.0 0.52 7.0 2 3 5 300 27 reamed
11 127.5 0.43 5.0 2 3 5 300 27 reamed
12 103.0 0.34 6.0 2 3 5 300 27 reamed
13 196.2 0.61 3.6 3 7 10 320 28 NOT reamed
14 157.0 0.56 2.7 3 7 10 280 28 NOT reamed
15 98.1 0.34 2.5 3 7 10 290 28 NOT reamed
16 157.0 0.68 1.4 3 7 10 230 28 NOT reamed
Figure 14A- Rock bolts installed in a
laminated roof-NRE No.1
Figure 14B- Pull test measuring equipment
Table 3- Analysed data from the short encapsulation pull test-NRE No.1

18
2. The pull load of bolts installed at shorter installation spin time was, in general greater that the standard 10 s time.
3. As expected, the bolt installed with anchorage length of 320 mm in length was greater than the 300 mm encapsulation
length. This additional length of 20 mm encapsulation length appears to give readings near the value of the bolts
installed in 50 mm over-drilled holes, in other words the load generated was near the bolt’s yield point.
4.4. SUMMARY OF FIELD STUDY
Given the limited number of bolts installed at three sites of varying geological formations, it is clear that over-drilling of bolts
by 50 mm has resulted into load transfer capacity improvement. This increase in bolt resin rock bonding can be attributed to
the resin sausage skin being pushed upwards and accumulating in the over drill space above the bolt end. The removal of
the shredded skin from the main body of the resin mixture may have permitted an improvement in bonding strength between
the bolt, resin and rock. This finding is further discussed in the analysis of the sectionalised bolts in tube encapsulated
installation analysis, as well as in pull testing of installed bolts in an overhead sandstone/concrete block in the laboratory as
discussed in section (CCC).
Figure 15- Bolt installation times in 27 and 28 mm holes. Holes 5-8 were reamed and holes 13-16 un-reamed,
Gujarat NRE No.1 Mine

19
Figure 16- Variation in load bearing capacity for different installations lengths
(borehole 50 mm over drilling)-NRE No.1 Mine
Figure 17- Variation in load bearing capacity applying different methods to bolt anchorage (various “spin to back”
and at back timings)-NRE No.1

20
5. LABORATORY STUDIES
As a part of the ACARP project, a series of laboratory pull tests were carried out in a favourable and convenient
environment to supplement the findings from the field studies. The laboratory study was a three pronged experimental work
consisting of:
a) Push testing of the sectionalised 100 mm fully-encapsulated bolts in steel tubes brought back from Springvale Colliery,
b) Pull testing of installed bolts in an overhead sandstone/concrete block, and
c) Strength properties of resin used for bolt installation.
5.1. Push Testing of Sectionalised Fully-encapsulated Bolts Installed in Threaded Tubes
5.1.1 First batch
In this test four bolts were installed and encapsulated in steel pipes at Springvale Colliery. A hydraulic drill with 400-500 rpm
motor spin was used to install the bolts in the hollow tubes, inserted in holes drilled into the heading roof. The 1.7 m long
threaded tubes of 28.5 mm internal diameter, and sealed at the top end, were then retrieved from the mine and brought
back to the University of Wollongong Rock Mechanics Laboratory for load transfer capacity push testing. Bolt encapsulation
times (“spin to back” and “spin at back”) were varied as per the requirements for testing in different conditions.. The bolt (X-
grade JBX bolts) and Minova/Orica fast-setting resin type RA33025F, used in the previously test sites, were also used in this
study. During the installation process the resin reached the collar of the tubes on every installation. The breakdown of
mixing time was set as follows:
Bolt 1: “spin to back”= 10 s, “spin at back”= 4 s, total= 14 s
Bolt 2: “spin to back”= 10 s, “spin at back”= 4 s, total= 14 s
Bolt 3: “spin to back”= 6 s, “spin at back”= 2 s, total= 8 s
Bolt 4: “spin to back”= 12 s, “spin at back”= 18 s, total= 30 s
After retrieving tubes from the mine, the samples were cut into 100 mm sections and push tested using a 50 tonnes capacity
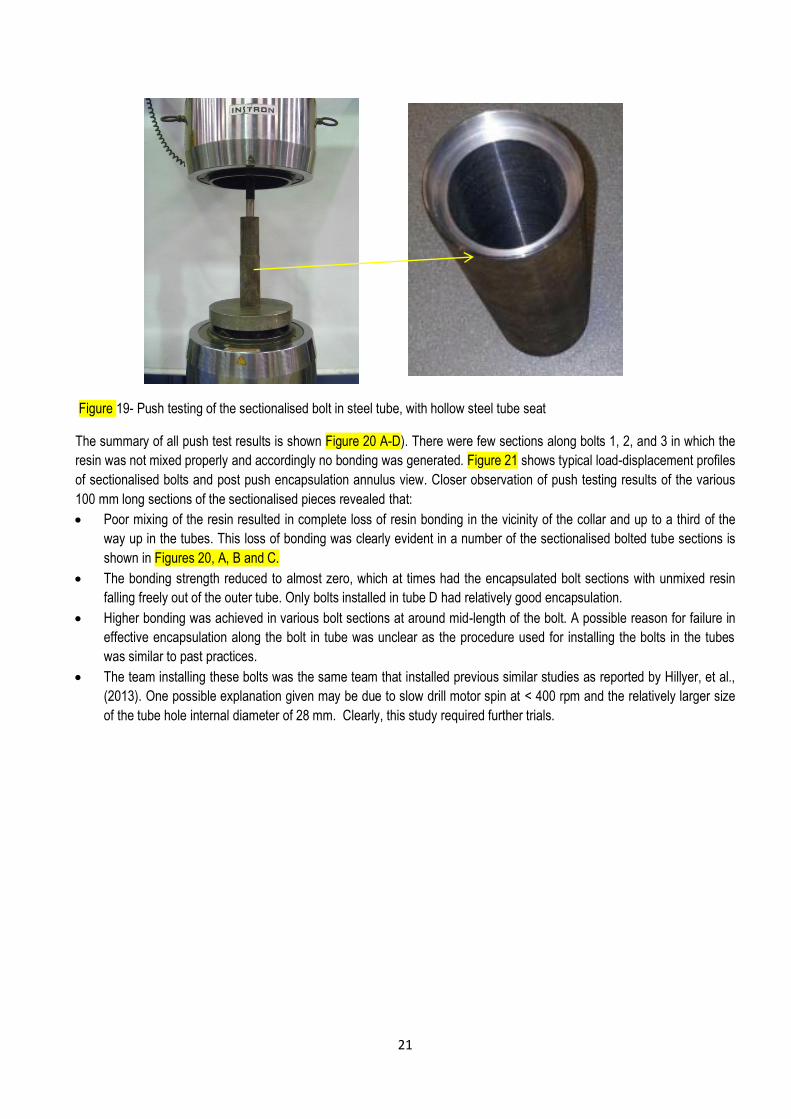
Instron Universal Testing Tachine. Figure18 shows a typical sectionalised encapsulated bolt used in the study.
The methodology of push testing of the bolt from the steel tube was similar to the test procedure reported by Hillyer, et al.,
(2013). Using a hollow steel tube of a suitable diameter, the tube was machined at one end to produce a seat so that the
encapsulated section of the tube can sit on the tube rim thus enabling the bolt section to be pushed out as shown in. A 200
mm hardened steel rod was clamped to the upper jaws of the Instron testing machine was used to push out the bolt as
shown as shown in Figure 19. The rate of pushing the bolt out of the steel was in the order of 1 mm /min.
Figure 19- Sectionalised 100 mm encapsulated bolt tubes
21
Figure 19- Push testing of the sectionalised bolt in steel tube, with hollow steel tube seat
The summary of all push test results is shown Figure 20 A-D). There were few sections along bolts 1, 2, and 3 in which the
resin was not mixed properly and accordingly no bonding was generated. Figure 21 shows typical load-displacement profiles
of sectionalised bolts and post push encapsulation annulus view. Closer observation of push testing results of the various
100 mm long sections of the sectionalised pieces revealed that:
Poor mixing of the resin resulted in complete loss of resin bonding in the vicinity of the collar and up to a third of the
way up in the tubes. This loss of bonding was clearly evident in a number of the sectionalised bolted tube sections is
shown in Figures 20, A, B and C.
The bonding strength reduced to almost zero, which at times had the encapsulated bolt sections with unmixed resin
falling freely out of the outer tube. Only bolts installed in tube D had relatively good encapsulation.
Higher bonding was achieved in various bolt sections at around mid-length of the bolt. A possible reason for failure in
effective encapsulation along the bolt in tube was unclear as the procedure used for installing the bolts in the tubes
was similar to past practices.
The team installing these bolts was the same team that installed previous similar studies as reported by Hillyer, et al.,
(2013). One possible explanation given may be due to slow drill motor spin at < 400 rpm and the relatively larger size
of the tube hole internal diameter of 28 mm. Clearly, this study required further trials.

22
Figure 20- Analysis of sectionalised fully-encapsulated bolts
Figure 21- Typical Load-Displacement profiles of the 100 mm long e encapsulated bolt sections, and general view of the
sections surface

23
5.1.2 Second Batch
A second batch of four new bolts was installed in steel tubes in an underground roadway at Spring Vale Colliery in Lithgow,
NSW. These encapsulated bolts in steel tubes were retrieved from the mine and brought back to the UOW laboratory for
sectionalisation and push testing. Figure 22 shows the retrieved four encapsulated bolts. Each encapsulated tube in the
batch were clearly numbered and painted for identification. Bolt installation time in each tube was as follows:
Bolt 1: “spin to back”= 7 s, “spin at back”= 7 s, total= 14 s
Bolt 2: “spin to back”= 10 s, “spin at back”= 4 s, total= 14 s
Bolt 3: “spin to back”= 7 s, “spin at back”= 7 s, total= 14s [encapsulated tube 50 mm longer than the bolt, to simulate
over drill.
Bolt 4: “pin to back” = 7 s, “spin at back” = 38 s (until pin break).
All four 2.1 m long bolts were encapsulated in 1.8 m long steel tubes using Orica/Minova standard resin capsules. Each
steel tube had an outer diameter of 48 mm and an inner diameter of 30 mm with an internal threading of 2 mm. All bolts
were installed using a constant drill rotational speed of 450 rpm.
Figure 23 shows peak load profiles of the various sections, together with their respective trend lines. The graph colours
depict the peak loads and trend lines of a particular encapsulated tube as identified by similar colours.
Figure 22- Batch 2 encapsulated bolts in steel tubes
Figure 24a shows the 100 mm long sections of bolt 3. This bolt had a top cap of 50 mm as over drill. A length of
approximately 50 mm of resin skin was pulled out of the over drill section as shown in Figure 24b. It is noticeable that, due to
the over drill, the top part of the resin cartridge was not thoroughly mixed, causing weaker encapsulation, leading to much,
nevertheless higher bonding strength in comparison with other three encapsulated bolt ends when tested. This suggests
that the gloving has migrated to the top end cumulating in the top 50 mm of the un-encapsulated and otherwise empty end
of the steel tube, leaving the rest of the lower sections of the bolt with relatively strong bonding strengths as it is evident from
the sectionalised N to S encapsulated sections shown in Figure 22. Figure 24 shows the level of glowing accumulations at
the top end of other bolts (bolts 2, 3 and4). A comparison analysis of the top 700 mm section of the bolt in section O to S,
shows that Bolt No 3 has out-performed the other no over-drilled bolts. The next best performing bolt was Bolt No 2, and

24
least was No 4. Excessive over spinning of the bolt has clearly over weakened and succeeded the strength properties of
the encapsulation resin. Another point of significance is that compliance to the resin manufacturer’s installation time is
desirable as the recommended installation of the resin was 14 s. Thus, it is suffice to suggest at this stage and with limited
test undertaken that over-drilling of holes appears to contribute an improvement in the load transfer capacity characteristics
of the installed bolt. This aspect of the study is the subject of further study undertaken in the laboratory experiments
discussed in the following section (section 4.2).
Figure 23- Analysis of the second batch of sectionalised fully-encapsulated bolts
Figure 24- (a) Sectionalised over-drilled encapsulated bolt in a steel tube No 3 and (b) the 50 mm end over-drilled section
with unmixed resin capsule end excessive shredded gloving
0
50
100
150
200
250
A B C D E F G H I J K L M N O P Q R S
Pea
k Lo
ad
(kN
)
Bolt 1 Bolt 2 Bolt 3 Bolt 4 Poly. (Bolt 1) Poly. (Bolt 2) Poly. (Bolt 3) Poly. (Bolt 4)
Bolt 3= [7s+7s]+ 50 mm OD
Bolt 2 = [10s+4s]
Bolt 1 = [7s +7s]
Bolt 4 = [7s+38s] until pin Breaks
a
b
b

25
Figure 26- Top ends cut-off from encapsulated steel tubes of four bolts
5.2. Bolt Pull Testing in an Overhead Sandstone/Concrete Block
The main aim of this study was to test bolting system installed in an overhead sandstone block cast in concrete to verify
testing studies conducted underground. The 0.7 m³ sandstone block was cast in 40 MPa sand / cements mortar that was
allowed to cure for approximately two months. A total of 36 bolts were pull tested to verify the results of the field studies
carried out in three different mines as well as the bolts installed in streel pipes. Holes in the overhead block were drilled in
the lower half of the sandstone blocks (Figure 25). Holes were drilled using a hydraulic drill rig and a 27 mm diameter drill bit
with 45 mm inline reamer (Figure 3C). Figure 26 shows the schematic drawing of boreholes location arrangement in the
lower half in the overhead sandstone/concrete block.
Holes were drilled 400 and 450 mm in length with some an additional 50 mm over-drill. Minova/Orica Lokset fast-set resin
capsules were used to encapsulate bolts in 200/250 mm length of holes. The resin capsules were cut into 200 mm long
pieces and re-sealed. The 50 mm over drilling was used to evaluate the influence over drilling on bolt anchorage
performance and to confirm the results of over drilling from field studies.
A correct bolt encapsulation length was necessary, as each extra centimetre of the encapsulation length was found to
increase the bond force of the installed bolt by up to 10 kN (1 t). Accordingly, the drill steel rod was marked at the
appropriate length to ensure a correct depth being drilled. The 1200 mm long as supplied JBX bolts were cut to a length of
900 mm to accommodate both the bolting length in the sandstone block and allow mounting of the testing equipment to the
protruding length of the tested bolt for monitoring as shown in Figure 25. The holes were appropriately designated for
specific purpose of pull testing with different bolt installation times to mimic tests in underground, including 50 mm over drill.
Bolt 1
Bolt 4 Bolt 3
Bolt 2

26
Figure 27- Drilling holes in an overhead sandstone/concrete block and pull test assembly
Figure 28- Schematic drawings of boreholes arrangement
(A): bottom plan view, (B): side view
5.2.1 Batch 1: installation and pull testing
Table 4 shows the details of the first 14 bolts installed and pull tested in sandstone block. It was not possible to install a bolt
in Hole E3, as the process of installing the bolt with spin to stall was impossible to achieve with short encapsulation length
of 200 mm. This is because the resin was overspinned and lost strength due to the high drill speed of 600 rpm that was
used in this particular installtion. Subsequently, the drill speed was adjusted to 500 rpm for the remainder of bolt installtions.
Figure 29 shows the load displacement of 12 bolts out of 14 bolts listed in Table 4. The peak loads are varied because of
varying bolt installation conditions. Figure 30 shows bar charts of the peak pull loads.
(A)
Borehole collars
80 MPa sandstone
50 mm over drill
Reamed
(B)

27
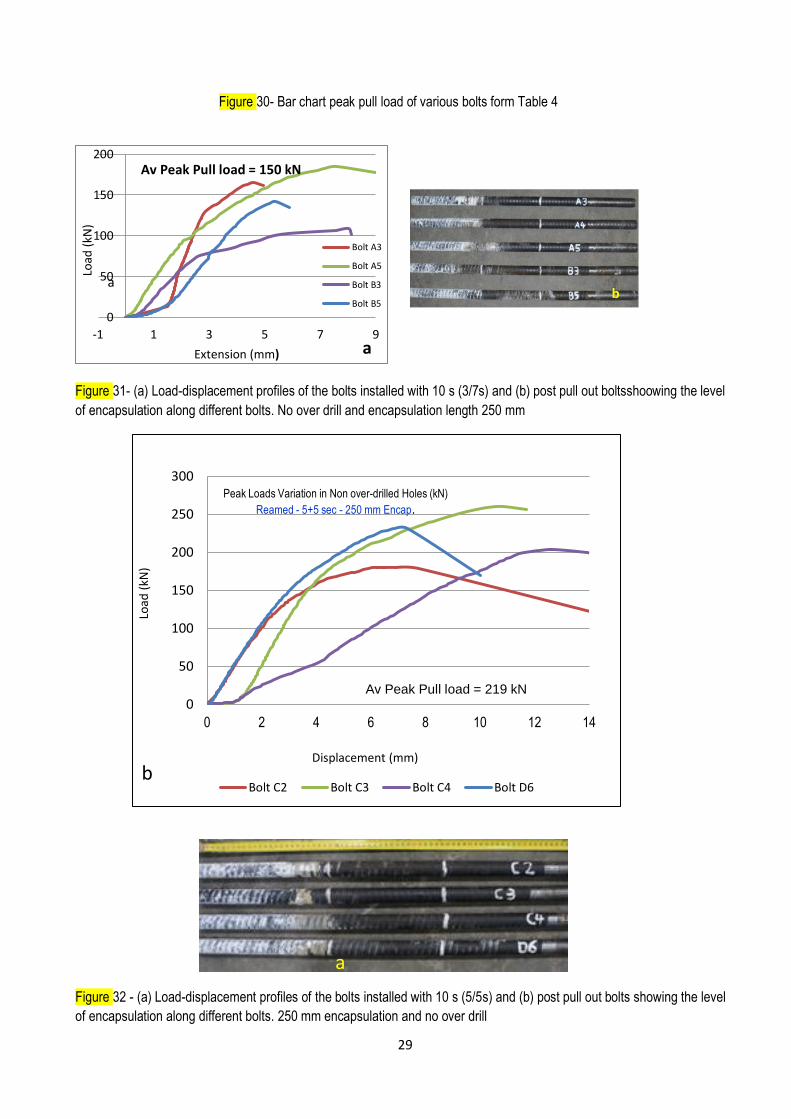
Figure 31 shows the load displacement of the first batch of four bolts, which were over drilled by 50 mm leaving a length of
250 mm of bolt installation encapsulation. The installtion time was maintained at 10 sec (5 sec spin to back and 5 sec at
back). The pull force of the four bolts varied between 84 and 100 kN, with an average pull force values (bond strength) of
92.75 kN (0.46 kN/mm) The second batch of five bolts ( C2, C3, C4, D6) were installed with encapsulation length of 250
mm and no over drill. The installation time was maintained at 10 s, the pull out force was varied between 180 and 203 kN
with an average pull load of 218.5 kN as shown in Figure 32. This being equal to average bond strength of 1.14 kN/mm.
Only three bolts were successfully pull tested from batch three of five bolts (A3, A4, A5, B3 and B5) with 250 mm
encapsulation at 3/7 sec installation time. The average pull load of only three bolts, discarding bolts B3 and A4, was 174 kN
(0.696 kN/mm) as shown in Figure 33, If one include all five bolts in the batch, then the average pull load will be in the order
of 0.57 mm/sec. All holes were reamed for the first 200 mm lower length section.
Closer examination of the test results in Table 4 indicated that;
1) The first batch of the over drilled yielded poor results because of the significant resin quantity was accumulated in the
over drill space and the remaining resin was insufficient to encapsulate fully the 200 mm length of the designated bolt
length, hence poor anchorage performance. In another way the sausage length of 200 mm was not sufficient to
effectively encapsulate the bolt in the hole.
2) 3/7 s installation time combination appears to be inferior to 5/5 sec. This is in agreement with that achieved form the
field study.
Figure 34 shows the accumulation of the encapsulation shredding in the over drilled 50 mm length of a hole, photographed
by a bore hole camera in the laboratory overhead sandstone block
Figure 29- Variation in load bearing capacity of bolts using the same spin time during installation in the overhead block (3 s
“to back”+7 s “at back”)
0
50
100
150
200
250
300
0 2 4 6 8 10 12 14
Load
(kN
)
Extension (mm)
Bolt D2
Bolt D3
Bolt D4
Bolt C6
Bolt C2
Bolt C3
Bolt C4
Bolt D6
Bolt A3
Bolt A5
Bolt B3
Bolt B5

28
Table 4- Details of the first 14 bolt pull out tests
Test Bolt Encapsulation length and time Installation status Pull load (KN)
1 E3 Spin/stall Unsuccessful
2 D4 over-drilled 50 mm, encapsulation 250 mm. Good installation
Reamed lower 200 mm section 89
3 C6 over-drilled by 50 mm, 10 s spin time
Bolt outer section slightly bent due to being pushed aside by the drill rig.
Reamed
98
4 D2 over-drilled 50 mm (250 mm encapsulation) Good installation Reamed
100
5 D3 over-drilled 50 mm (250 mm encapsulation) Good Installtion. Reamed
84
6 D6 250 mm encapsulation and no over drill, 10 s spin
Reamed 231
7 C2 250 mm encapsulation and no over drill, 10 s spin
Reamed 180
8 C3 250 mm encapsulation and no over drill, 10 s spin
Reamed 260
9 C4 250 mm encapsulation and no drill, 10 s spin Reamed 203
10 B3 3 s to back, 7 s at back Problems with installation, Reamed 120
11 B5 3 s to back, 7 s at back Good installation, reamed 153
12 A5 3 s to back, 7 s at back Good installation, reamed 197
13 A4 3 s to back, 7 s at back Bent protruding bolt end, reamed 73
14 A3 3 s to back, 7 s at back Good installation, reamed 173
0
50
100
150
200
250
300
D2 D3 D4 C6 C2 C3 C4 C6 A3 A4 A5 B3 B5
Load
(kN
)
29
Figure 30- Bar chart peak pull load of various bolts form Table 4
Figure 31- (a) Load-displacement profiles of the bolts installed with 10 s (3/7s) and (b) post pull out boltsshoowing the level
of encapsulation along different bolts. No over drill and encapsulation length 250 mm
Figure 32 - (a) Load-displacement profiles of the bolts installed with 10 s (5/5s) and (b) post pull out bolts showing the level
of encapsulation along different bolts. 250 mm encapsulation and no over drill
0
50
100
150
200
-1 1 3 5 7 9
Load
(kN
)
Extension (mm)
Bolt A3
Bolt A5
Bolt B3
Bolt B5
Av Peak Pull load = 150 kN
a
a
0
50
100
150
200
250
300
0 2 4 6 8 10 12 14
Load
(kN
)
Displacement (mm)
Peak Loads Variation in Non over-drilled Holes (kN)
Reamed - 5+5 sec - 250 mm Encap.
Bolt C2 Bolt C3 Bolt C4 Bolt D6
Av Peak Pull load = 219 kN
b
b
a

30
Figure 33- (a) Load-displacement profiles of the bolts installed in 10 s (5/5s) and (b) post pull out bolts showing the level of
encapsulation along different bolts. Over drilled holes with 200 mm encapsulation length
Figure 34- accumulation of the encapsulation shredding in the over drilled 50 mm length of a hole, photographed by a bore
hole camera in the laboratory overhead sandstone block
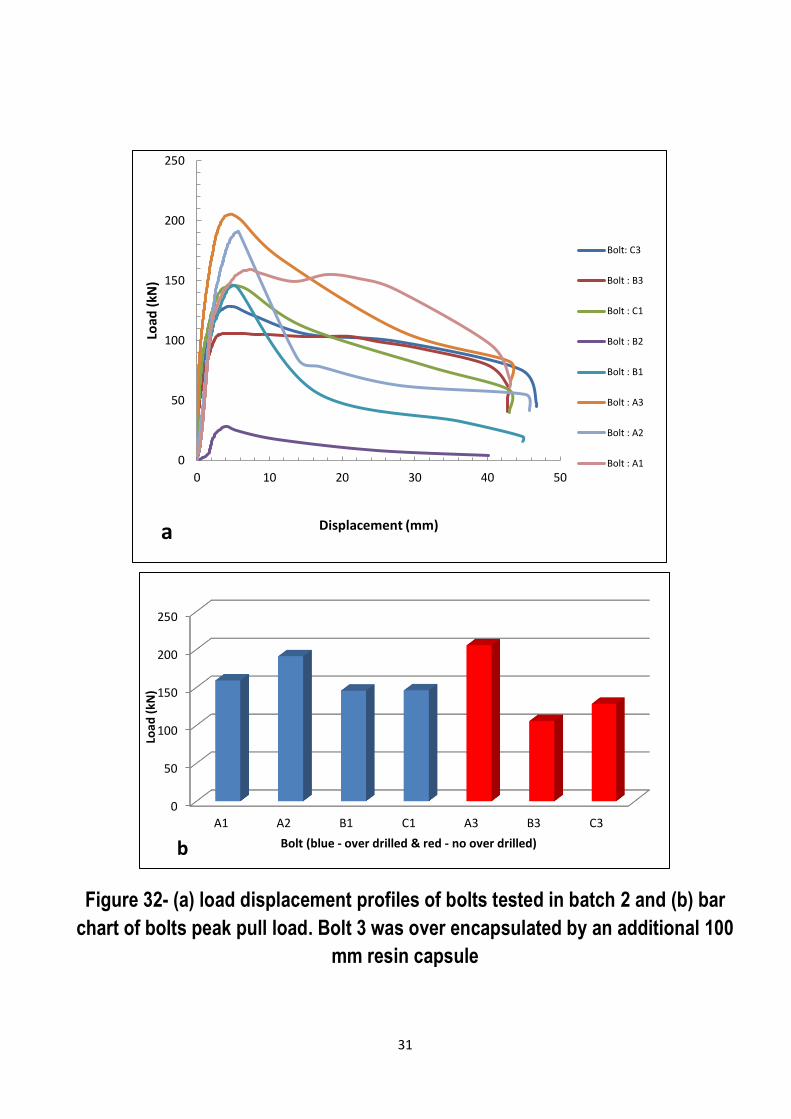
5.2.2. Batch 2: installtion and pull testing
Table 5, shows details of the second batch of nine bolts installed with 250 mm long Orica resin cartridges. All bolts had
encapsulation length of 250 mm. One bolt installation “A3” was over encapsulated with 300 mm cartridge, thus yielding
higher pull load. The remainder eight bolts were installed with four being over drilled by 50 mm. As can be seen from graphs
in Figure 32a and bar chart in Figure 32 b, the performance of the over drilled bolts were marginally better than no over-drill
bolts. Figure 33 shows the photos of the bolts with varying encapsulation lengths. No comparison could be made about the
installtion timing because of the limited number of tests and other variables such as over drill.
Table 5- Batch 2 bolts installation and pull out peak loads
0
20
40
60
80
100
120
0 2 4 6 8
Load
(kN
)
Displacement (mm)
Peak Loads Variation in Over-drilled Holes (kN)
Reamed - 50 mm OD - 5+5 sec - 250 mm Encap.
Bolt D2
Bolt D3
Bolt D4
Bolt C6
a
No Bolt/Hole Encapsulation length and over drill
Installtion time Failure load(kN)
1 A1 200 mm, 50 mm over drill 10 s (5/5) 159.16
2 A2 200 mm, 50 mm over drill 10 s (5/5) 191.04
3 A3 300, no over drill 10 s (5/5) 205.46
4 B1 200 mm, 50 mm over drill 10 s (5/5) 145.75
5 B2 300, no over drill 10 s (5/5) 28.25
6 B3 200, no over drill 3s /10 s stall 105.79
7 C1 200 mm, 50 mm over drill 10 s (5/5) 146.12
8 C2 200, no over drill 5 s to back, 13s to stall Unsuccessful
9 C3 Encapsulation 200, no over drill 5s /13 s pin break 128.48
b
31
Figure 32- (a) load displacement profiles of bolts tested in batch 2 and (b) bar
chart of bolts peak pull load. Bolt 3 was over encapsulated by an additional 100
mm resin capsule
0
50
100
150
200
250
0 10 20 30 40 50
Load
(kN
)
Displacement (mm)
Bolt: C3
Bolt : B3
Bolt : C1
Bolt : B2
Bolt : B1
Bolt : A3
Bolt : A2
Bolt : A1
a
0
50
100
150
200
250
A1 A2 B1 C1 A3 B3 C3
Loa
d (
kN)
Bolt (blue - over drilled & red - no over drilled) b

32
Figure 33 – pulled out bolts of batch 2 test.
5.2.3. Batch 3: installtion and pull testing
Table 6 shows performance of nine bolts installed with 250 mm long resin capsuled with five bolts being 50 mm over drill
and the other four with no over drill. All the bolts were installed with 5/5 sec installation time. It is clear from Figure 34 that
the quantity of resin was sufficient to allow the bolts to be installed effectively in both installed types (over drill and no over
drill holes). Upon inspection of the installed bolts in the holes, it was clear that there was a significant over spilt resin in the
reamed section of the holes, which might contributed to additional length of bonding between the bolt and the rock/concrete
hole wall; however, the length of reamed section encapsulation was less in over drilled holes in comparison with no over drill
holes. This level of over spill is also clear in post pulled out bolts as shown in Figure 35.
Table 6- Batch 3 installations details
No. Code Over drill Encapsulation length
Ream length
Resin encapsule length
Peak load
Drill dia.
Ream dia.
1 C4 no 230 200 230 109 28 45
2 B4 no 230 200 230 206 28 45
3 A4 no 230 200 230 208 28 45
4 D4 no 230 200 230 132 28 45
5 D3 no 230 200 230 116 28 45
6 C3 yes 230 200 300 149 28 45
7 B3 yes 230 200 300 63 28 45
8 A3 yes 230 200 300 181 28 45
9 C2 yes 230 200 300 115 28 45
10 between B&C, 2&3
yes 230 200 300 86 28 45
OD

33
Figure 34 a – Load displacement of bolts from Batch three bolts
Figure 34b - Bar chart of peak pull loads of batch three bolts
Figure 35 - Post pull test batch three bolts. Yellow arrow indicate over drilled bolts
0
50
100
150
200
250
0 10 20 30 40 50 60
Loa
d (
kN)
Displacement (mm)
A3
A4
B2
B3
B4
C2
C3
C4
D3
D4
0
50
100
150
200
250
A3 B2 B3 C2 C3 A4 B4 C4 D3 D4
Load
(kN
)

34
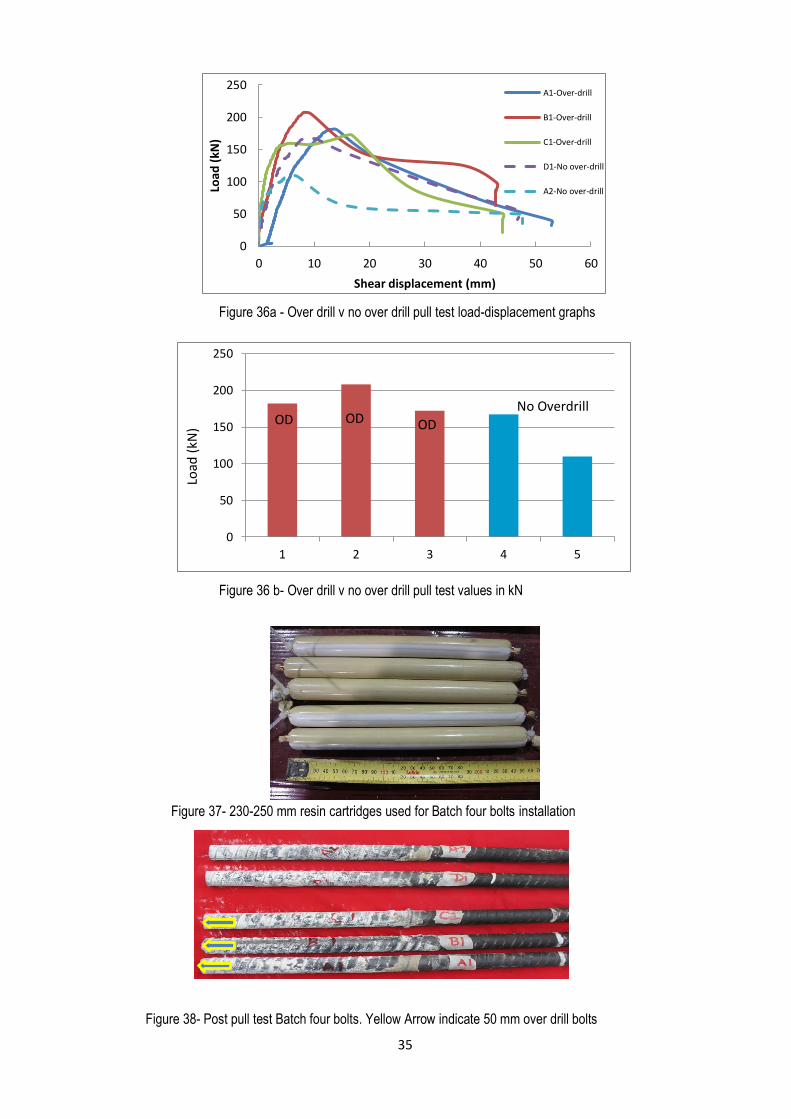
5.2.4. Batch 4: installtion and pull testing
Figure 36 shows the results of the fourth installation of five bolts with four 250 mm long resin capsules and one 230 mm.
Three holes were over drilled by 50 mm and the other two holes were not over drilled. The encapsulated length of the bolt in
no over drilled holes was longer as is clearly shown. Prior to pull testing, the encapsulated resin sections, providing
additional anchorage from the reamed section of the holes were chipped away and removed, ensuring that the bolt
anchorage did not extend beyond the mouth of the encapsulation in the hole. The length of the resin sausages used for bolt
installations shown in Figure 37 were between 230 and 250 mm.
In maintaining the encapsulation length on the five bolts constant, the results of the pull tests demonstrated that over dri lling
had significant impact on the anchorage performance of the installed bolts. Figure 38 shows the photographs of the post pull
test bolts, which showed variations between the lengths of resin encapsulation marks along the bolts. It is clear from this
batch of pull testing that over drilling improves the performance of the bolt anchorage.
5.3. Summary of the Laboratory SEPT
The laboratory overhead pull testing study has demonstrated that over drilled bolts performance were better than those bolts
installed in bore holes with no over drilling. By maintaining the bolt anchorage length constant, the effectiveness of the over
drilling, in housing excessive resin shredding above the bolt becomes obvious and this finding is in agreement with what
was achieved from underground studies reported previously. Thus, consistent results can be achieved only by ensuring that
the length of the resin encapsulations of the installed bolt is maintained constant. Also, 3/7 s installation time
combination appears to be inferior to 5/5 sec.
35
Figure 36a - Over drill v no over drill pull test load-displacement graphs
Figure 36 b- Over drill v no over drill pull test values in kN
Figure 37- 230-250 mm resin cartridges used for Batch four bolts installation
Figure 38- Post pull test Batch four bolts. Yellow Arrow indicate 50 mm over drill bolts
0
50
100
150
200
250
0 10 20 30 40 50 60
Loa
d (
kN)
Shear displacement (mm)
A1-Over-drill
B1-Over-drill
C1-Over-drill
D1-No over-drill
A2-No over-drill
0
50
100
150
200
250
1 2 3 4 5
Load
(kN
)
No Overdrill OD OD OD

36
6. RESIN STRENGTH PROPERTIES
There is no Australian standard for evaluating mechanical properties of resins or cementitious grouts used for bolt or cable
installtions. Therefore, there is no uniform method for testing resins for strength. Depending on the country of origin, Based
on various standards, manufacturers invariably use different specimen shapes and sizes to determine the strength
properties of the resin or grout. Currently three known standards available and are likely to be used in Australia for strata
reinforcement system components evaluations, and in particular for resin and grout strength. They are:
1) The British Standard BS 7861: Strata Reinforcement support system components used in Coal Mines-Part 1.
Specification for rock bolting (1996) and Part 2: Specification for Flexible systems for roof reinforcement;
2) American Standard for Testing Materials (ASTM) F 432- 10: Standard Specification for Roof and Rock Bolts and
Accessories; and
3) South African Standard SANS1534.
There appears to be a divided loyalty and preferred practices in testing or determining the strength of resin with regard to
sample shape and size. Irrespective of the resin setting time (fast, medium and slow set), the Uniaxial Compressive
Strength (UCS) property is determined either by using 40 and 50 mm cubes, or cylindrically shaped samples, with varying
diameters of 20, 30, 42 and 54 mm. In general, 40 mm cubes and 20 mm diameter cylindrical size appears to be the most
desirable sizes for testing resins, depending on the resin setting time. The 40 mm cube is used for both fast and slow-setting
resins, however, the 20 mm diameter cylindrical shapes of length to diameter ratio of 2 was used for fast-set resin testing.
This ratio is generally used for testing composite material such as concrete, although at much larger diameters. Normally the
length to diameter ratio of between 2.5 -3.0 is recommended for testing rocks in compliance with the suggested method for
determining the UCS and deformability of rock material of International Society of Rock Mechanics (1979). While this is true
for rock sample preparation by coring, nevertheless, this may not be a desirable shape for preparation of samples for
composite materials.
The shape of the sample is not a major issue for resin and grout samples preparation using slow setting resin. Both
cube/prism and cylindrical shapes can be prepared and tested individually by mixing mastic and /catalyst hardener at a
leisurely pace. The situation becomes more difficult, when preparing samples from fast setting resins, which typically have a
setting time of 15-20 s. Accordingly, a new approach as proposed in this report should allow several samples to be cast
simultaneously from one fast setting resin mix batch, thus reducing sample property variability.
Based on suggested methods by various standards (British standard- BS 7861: Part 1: (1996), American Standards (ASTM-
C579) (1991), (ASTM – D7012-13), South African Standard (SANS1534) (2004), and ISRM (International Society of Rock
Mechanics (2007)), the evaluation of the resin properties normally include the determination of:
Uni-axial compressive Strength,
Modulus of Elasticity in compression
Shear Strength,
Creep or Rheological Properties
6.1. Uni-axial Compressive Strength
Traditionally resins are tested for compressive strength, using cube prism samples. The British standard BS 7861- part 1
Annex (M) and part 2 Annex (G) for testing resin grout uses prisms 12.5x12.5x50 mm in size with respect to the resin set
time. Opinions vary with respect to the shape and size of the samples tested. According to BS 1881: part 4: 1970, the
strength of a cylinder is equal to four fifth of the strength of a cube, however experiments have shown that there is no simple
relation between the strengths of the specimens of the two shapes. Generally resin manufacturers tend to determine the
UCS vales of the resin by testing 40 mm cubes, similar to the recommended methods for testing composite materials. It is a
well-known fact that the strength values obtained by testing cube samples tend to be on the higher values than the
cylindrical samples. Also, the strength values tend to vary significantly, irrespective of the sample shape and size as the
samples are generally cast individually.

37
The recent approach in sample preparation as reported by Aziz, et al., (2013) has demonstrated that the consistency of the
UCS values can be improved if prepared samples are obtained from one mix (discussed later). Therefore, it is easier to test
resins of different setting speeds in a unified selected manner.
6.2 Elastic Modulus of Elasticity
The modulus of elasticity determination of the resin as prescribed in BS 7861: part 1: 1996, recommends that a prism of L/D
of 4 be subjected to a controlled compressive load. The axial and lateral strain to be monitored by four strain gauges
mounted on the samples, or by using other means of monitoring the axial and later deformation of the tested sample, such
as linear variable differential transformers LVDTs, compressometers, optical devices or other suitable measuring devices.
The tested sample is subjected to cyclic loading /unloading and the elastic modulus is the mean of the three-secant moduli
measure between two levels of the applied load. This method of determining the E value of resin can also be obtained from
the straight line extrapolation of the 20-60 kN or 40-80 kN range of the load-displacement profile range (Figure 25).
However, E values by this method may not yield E values comparable to the recognised values as suggested by various
standards for resins, grouts and rocks as the value of E for the 40 kN Load range will be equivalent to the sample
compression. However the calculated value from this approach is markedly outside the values obtained from other more
credited methods. The E-values were determined using the following mathematical relationships as:
*
*
uEt
(1a)
*
*
uEs
(1b)
/
1
duEr (1c)
Where;
Et: tangent elastic modulus, σ*: half of the peak stress value u*: displacement at half of the peak stress Et: tangent elastic modulus Er: 40 kN range elastic modulus Du/ : displacement at 40 kN load range (i.e. between 20 kN and 60 kN).
6.3. Punch shear test
Table 7 lists various apparatus used for testing of resins and composite material in shear (Aziz, et al., 2014). The testing for shear falls into two categories, direct and indirect methods. All listed methods are applicable for testing resins, but the resin characteristics, time and effort restrict their selection for any particular resin type. Punch shear test method is most suited for testing resin. The punch shear box apparatus is shown in Figure 39. This
methodology of shear strength determination is currently advocated by the South African Standard for testing of resins and
grouts (SANS 1534:2004), and it has currently been used by various resin manufacturers in Australia.
Experience has shown that punch shear test is most suited for testing of resin particularly the fast setting resins. The test is
carried out using a thin (3mm) disc-shaped specimen, which is slotted in the middle of the punch shear box (40 mm in
diameter and 30 mm high) fitted with a hollow slot of the same diameter as the 12 .5 mm diameter punch as shown in Figure
26. Full circle discs or a quarter circle segments can be used with this punch test apparatus.
The shearing strength is determined using:
the shear strength of the tested sample F: failure load T: disc thickness D: Punched disc diameter

38
Based on experiences, the punch shear box test appears to be superior to other tests because of:
1. The ability to prepare a number of samples in very short period of time and produce a number of samples form one
resin mix, thus allowing repetition of the test results for confirmation.
2. It requires a small amount of resin preparation for testing, hence mixing time is not a problem.
3. It gives consistent results for different period of times, and
4. It is fast testing method.
The punch shear box can be used as a suitable tool to assess the consistency and quality of theresin samples prepared for
various strength properties (UCS, E). This can be achieved by a simple comparison of the shear strength values obtained
from testing of 3 mm thick samples
Table 7 - Laboratory methods of testing of shear strength of resin and grout
Method Type Procedure Comments Apparatus
Direct Direct shear
test
Resin sample in plaster or cement and shear the
sample to failure peak and residual shear strength
Difficult to match
resin strength with the cast medium and
testing is a slow process.
Direct Single shear
The sample is clamped on the specimen holder and a
shear force is applied perpendicular to the curved
surface through a sharp edged platen. The shear strength is the force at
failure divided by the area of cross-section of the failure
surface
Not commonly used
Indirect Triaxial test
The specimen is enclosed in an airtight flexible
membrane; confining pressure is applied and held constant during the test by means of a cell fluid. Apply axial load/hence stress until the sample fails. Test yields,
UCS, Angle of Friction, Shear angle, failure angle
Good method of determining the
shear strength of rock/resin; Requires
expensive equipment,
Difficult to do the test, slow, and time
consuming
Indirect Double shear
test
Lateral shearing of the
sample with the samples ends supported. The
specimen is sheared along two parallel planes.
Shear strength = sheared failure load divided by twice
the sample cross section area
Can be used for shear testing of 90
mm long and 30 mm diameter samples. Yields good results but require great quantity of resin
samples cast
Indirect Punch shear Shear strength carried out over a very short period of
time
Easy to cast discs for testing. Several
punch tests can be carried out from one
large disk. Allows testing for shear
strength over several weeks.

39
Figure 39- Punch shear apparatus for testing 3 mm thick discs with casting mould in the inset
6.4. Rheological Properties (Creep)
Creep study was carried out to investigate the strain time dependency. The recommended approach to determine resin
creep properties is similar to that used for determining E values. According to BS 7861-1 (1996), the sample is usually
loaded at a stress rate of 0.75±0.25 (N/mm2)/s to a load of 5 kN for fast and medium set resins or 20 kN for slow set resin
and the load is maintained constant for a duration of 15 min. The resin strain is monitored between 0.5 min and 15 min.
After 15 min, the load is removed completely. The resin creep must not be more than 0.12 %, when the sample is tested
after 24 hours of casting.
7. Experimental Procedure
7.1. Sample Preparation
Chemical resin samples tested for strength properties evaluation were prepared from Orica resin mastic and hardener
(catalyst) scraped from the mine supplied sheathed capsules. Figure 40 shows a mine supplies resin capsule having its
mastic and catalyst being collected for strength testing. Preparation of competent samples is an important aspect of testing
resin samples. The consistency of the testing results was dependent on the quality of the cast resin. Resin setting time was
the deciding factor in preparing competent and uniform textured resin.
The methodology of preparing resin samples was by manually mixing and casting of samples individually, particularly for
fast setting resins. This method is inevitably leads to less uniform sample composition and wider scatter of results.
Additional drawback of casting sample by manual mixing and pouring include:
the difficulty of removing the air bubbles from the sample, unless the sample is mechanically vibrated,
Non-uniform composition of the sample mixtures as each sample has to be mixed and poured separately.
One side of the cube sample remaining rough, which could eventually influence the test results, and
Mixing of the resin in the mould may not be uniform, unless the mixer is skilled.
Mould for casting discs
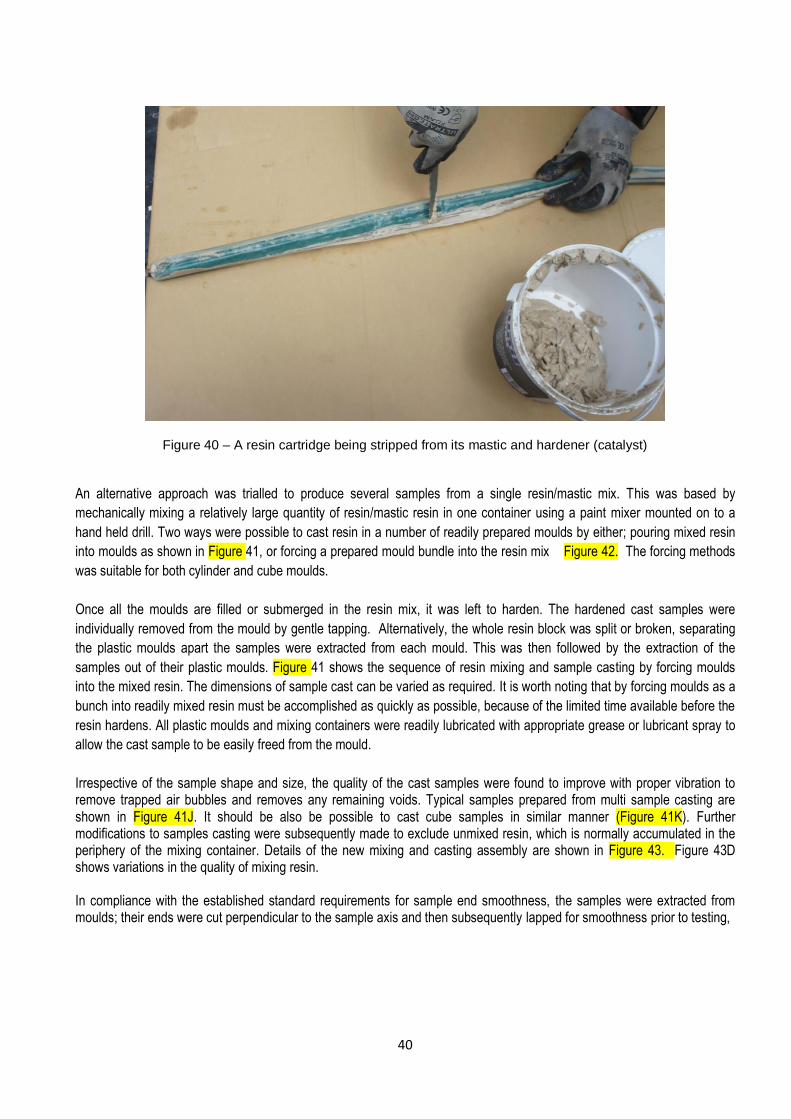
40
Figure 40 – A resin cartridge being stripped from its mastic and hardener (catalyst)
An alternative approach was trialled to produce several samples from a single resin/mastic mix. This was based by
mechanically mixing a relatively large quantity of resin/mastic resin in one container using a paint mixer mounted on to a
hand held drill. Two ways were possible to cast resin in a number of readily prepared moulds by either; pouring mixed resin
into moulds as shown in Figure 41, or forcing a prepared mould bundle into the resin mix Figure 42. The forcing methods
was suitable for both cylinder and cube moulds.
Once all the moulds are filled or submerged in the resin mix, it was left to harden. The hardened cast samples were
individually removed from the mould by gentle tapping. Alternatively, the whole resin block was split or broken, separating
the plastic moulds apart the samples were extracted from each mould. This was then followed by the extraction of the
samples out of their plastic moulds. Figure 41 shows the sequence of resin mixing and sample casting by forcing moulds
into the mixed resin. The dimensions of sample cast can be varied as required. It is worth noting that by forcing moulds as a
bunch into readily mixed resin must be accomplished as quickly as possible, because of the limited time available before the
resin hardens. All plastic moulds and mixing containers were readily lubricated with appropriate grease or lubricant spray to
allow the cast sample to be easily freed from the mould.
Irrespective of the sample shape and size, the quality of the cast samples were found to improve with proper vibration to remove trapped air bubbles and removes any remaining voids. Typical samples prepared from multi sample casting are shown in Figure 41J. It should be also be possible to cast cube samples in similar manner (Figure 41K). Further modifications to samples casting were subsequently made to exclude unmixed resin, which is normally accumulated in the periphery of the mixing container. Details of the new mixing and casting assembly are shown in Figure 43. Figure 43D shows variations in the quality of mixing resin. In compliance with the established standard requirements for sample end smoothness, the samples were extracted from moulds; their ends were cut perpendicular to the sample axis and then subsequently lapped for smoothness prior to testing,

41
Figure 41- casting resin samples in bulk by pouring mixed resin into moulds
A B C
D E F
G
K
H
J
I

42
Figure 42- The alternative method of forcing mould bunch into the mixed resin container
Figure 43 - Double layered container for mixing chemical resin mechanically and variations in resin quality due to differing mixing techniques
A B C
E D F

43
7.2 Uni-axial Compression Strength
Table 8 shows the UCS results of seven 30 mm diameter resin samples from one batch. It is clear that the quality of the samples and the test results have demonstrated the credibility of the new method of preparing resin samples. The average UCS value of the seven tested samples was 53.16 MPa, with a standard deviation of 0.47 and a coefficient of variation of 0.88%. 44.
Table 8- The UCS test of fast-setting resin cast 30 mm diameter samples
Sample Sample Age (days old) Sample Length (mm) Failure Load (kN) UCS (MPa)
1 4 78.52 36.8 53.88
2 4 78.56 36.1 53.08
3 4 78.29 35.6 52.41
4 4 78.48 36.7 53.38
5 4 78.55 36.3 52.99
6 4 78.12 36.2 53.45
7 4 78.29 36.0 52.91
Average: 53.16, SD: 0.43 and CV: 0.8
A round 100 chemical resin samples of various shapes, sizes, set time, cure time and age were tested for UCS values. Figure 45 shows the load-compression displacement profiles of various shaped samples prepared from the same set time resin (90 sec gel time resin and catalyst removed from a capsule). The samples tested were one day old. Variations in samples shape and sizes are clearly shown in the figure. Figure 46 shows bar charts of the variation in average UCS values with changing sample shape and size of one day old cast samples. The ratio between cube strength and cylinder strength varied from 1.10 to 1.30. The high cube UCS value is attributed to friction between the platens of the compression machine and the specimen ends creating relatively higher confinement (triaxial compression) than cylindrical specimens of the H/D ratio 2 as demonstrated in Figure 47. The comparatively high values for cubes compared to cylinders were also reported with cementitious grouts (Minders, et al., 2002). Figure 48 shows the changes in resin strength withage, which is expected. Figure 49 shows the variation in resin strength with respect to sample H/D ratio for cylindrical samples. As expected, the strength of the sample was influenced by the sample size and this is similar to rocks and cement grouts (Neville, 2069; Minders, et al., 2002). The comparison between samples strength made from new resin that from stored resin (2 month old resin) is shown in Figure 50. It is observed that a higher uniaxial compressive strength was obtained by using fresh resin in comparison to stored resin. The strength values of the resin used in bolt encapsulation was influenced by the shape and size of the samples for both 20 mm and 30 mm diameter samples, L/D=2. The procedure for sample preparation and testing for UCS is described in section 4.5

44
Figure 44 - Casting cube samples in cubical mould
Figure 45 - Load /compression profiles of various shaped samples prepared from one day old resin mix
Figure 46 - Bar charts of the UCS values with changing sample shape and size for one day old cast samples
40 mm cubes

45
Figure 47 - Variations in UCS values between cube and cylinder resin samples (Orica slow setting resin - 90 secs setting time). Note the consistency of the test results
Figure 48 - Variation in resin strength with sample cure time for 30 mm diameter 2:1 ratio cylinder samples
L/D: 2
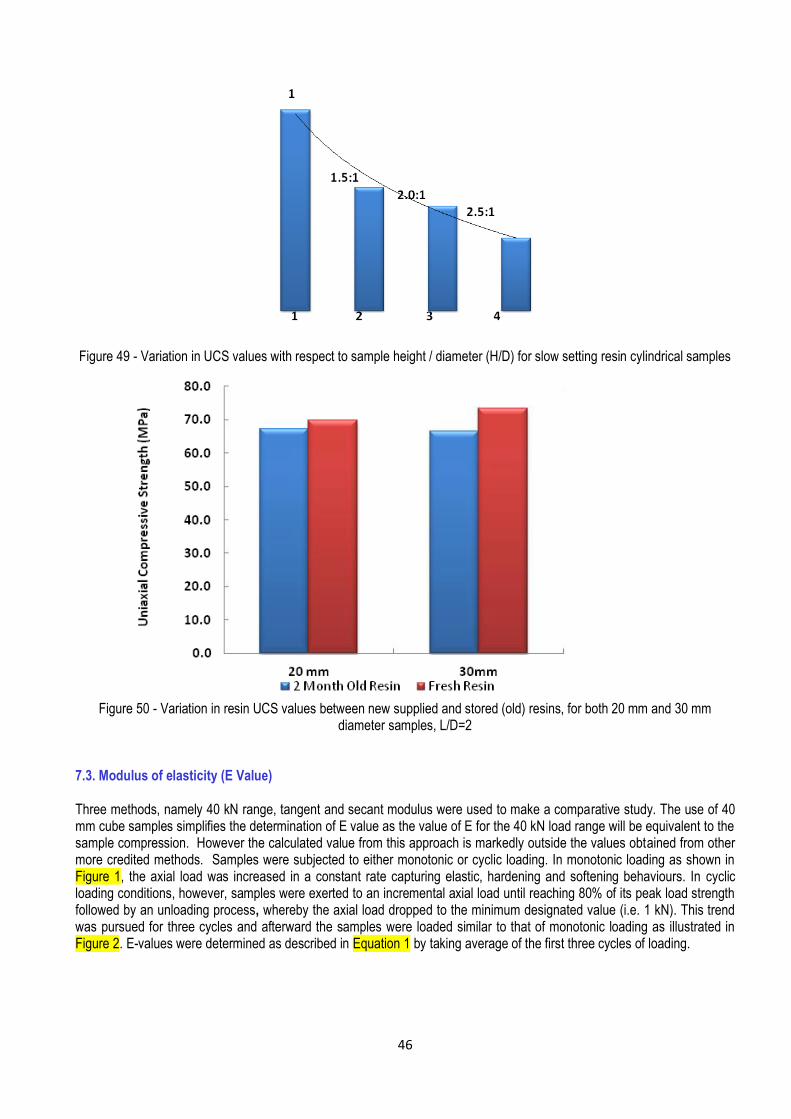
46
Figure 49 - Variation in UCS values with respect to sample height / diameter (H/D) for slow setting resin cylindrical samples
Figure 50 - Variation in resin UCS values between new supplied and stored (old) resins, for both 20 mm and 30 mm
diameter samples, L/D=2
7.3. Modulus of elasticity (E Value) Three methods, namely 40 kN range, tangent and secant modulus were used to make a comparative study. The use of 40 mm cube samples simplifies the determination of E value as the value of E for the 40 kN load range will be equivalent to the sample compression. However the calculated value from this approach is markedly outside the values obtained from other more credited methods. Samples were subjected to either monotonic or cyclic loading. In monotonic loading as shown in Figure 1, the axial load was increased in a constant rate capturing elastic, hardening and softening behaviours. In cyclic loading conditions, however, samples were exerted to an incremental axial load until reaching 80% of its peak load strength followed by an unloading process, whereby the axial load dropped to the minimum designated value (i.e. 1 kN). This trend was pursued for three cycles and afterward the samples were loaded similar to that of monotonic loading as illustrated in Figure 2. E-values were determined as described in Equation 1 by taking average of the first three cycles of loading.

47
Figure 51 – A typical monotonic loading scheme subjected to the sample
Figure 52 – A typical cyclic loading scheme subjected to the sample
Figure 13 shows the comparison between E-values obtained through different ways for resin cubic samples with various
curing time ranging from 7 to 21 days. E-values determined by the 40 kN range (manufacturer recommended) are generally
higher than those obtained from ISRM (International Society of Rock Mechanics) recommended methods such as tangent
and secant modulus for various curing intervals. Also, E-values increased as the resin curing time increased from 7 to 21
days.
Figure 14 compares the E-values determined from the strained gauged samples and specimens without strain gauges. It is
observed that the data extracted from strained gauged samples provide higher Elastic modulus when compared to samples
without strain gauges. It should be noted that the E values obtained using strain gauges are restricted to the middle section
of the tested sample and not the entire length of the sample under compression, hence the variation in E values reflects on
the condition of testing and is in line with various test standards indicated previously. Using strain gauged specimens as
0
10
20
30
40
50
60
70
80
0 0.05 0.1 0.15 0.2
Stre
ss (
MP
a)
Strain
0
10
20
30
40
50
60
0 0.01 0.02 0.03 0.04 0.05 0.06 0.07
Stre
ss (
MP
a)
Strain

48
shown in Figure 5, in which the strain gauge is precisely installed in the middle of the tested sample, enables the direct
measurement of the displacement without the end effect.
The comparison between the E- values of cubic and cylindrical samples for different curing time is shown in Figure 15. It is
concluded that the cubic samples exhibit higher elastic modulus values in comparison to cylindrical specimens various
curing time. However, this aspect involves further study. See section 5 for the suggested procedure for testing and
determining E vales of resins samples
Figure 59 - Comparison between the E-values obtained through different ways for resin samples with various curing time
ranging from 7 to 21 days
Figure 60 - Comparison between the E-values determined from the strain gauged samples and specimens without strain gauges
0
0.5
1
1.5
2
2.5
3
3.5
4
4.5
E-40 kN range (GPa) E-Tangent (GPa) E-Secant (GPa)
7 days
14 days
21 days
0
2
4
6
8
10
12
14
16
18
E-Tangent (GPa) E-Secant (GPa)
Without strain gauge
Strain gauged sample

49
Figure 61 – Strain gauge installed in the middle of the rectangular sample
Figure 62 – Comparison between strain gauged and non-strain gauged samples in measurement of stress/displacement
The comparison between E- values of cubic and cylindrical samples for different curing time is shown in Figure 15. It is
concluded that the cubic samples bear more elastic modulus values in comparison to cylindrical specimens for different
curing time.
0
10
20
30
40
50
60
0 0.005 0.01 0.015 0.02 0.025 0.03 0.035 0.04 0.045
Stre
ss (
MP
a)
Strain
Witout stain gauge
With strain gauge

50
Figure 63 - Comparison between the E- values of cubic and cylindrical samples for different curing time
In Figure 8, the influence of sample dimension in the secant elastic modulus is compared. The data trend indicates that the
value of secant stiffness increases with increasing the sample size.
Figure 64 – Effects of sample size on the variation of secant elastic modulus
Figure 9 compares the British standard with the one introduced in this study using strain gauged samples. The British
standard gives a higher value for the secant elastic modulus when compared to the proposed standard.
0
0.5
1
1.5
2
2.5
3
3.5
4
4.5
7 days 14 days 21 days
E va
lue
- 40
kN
ran
ge (
GP
a)
Curing time
Cube
Cylinder
0
1
2
3
4
5
6
1 to 1 2 to 1 4 to 1
Sec
an
t el
asti
c m
od
ulu
s (G
Pa)
Sample dimension

51
Figure 65 – Comparison between the proposed model and British standard in determination of secant elastic modulus
7.3. Punch Shear Test Results
Using the punch shear box shown in Figure 2 a series of punch shear tests were undertaken to study the shear strength of a
particular resin. Each 65 mm diameter, 3 mm thick disc was cast using the new resin casting mould shown in Figure 2. Four
shear tests were obtained from each disc cast. Table 9 shows typical results of punch tests carried out on several segments
of one disc sample of the Orica fast setting resin, which is scraped from the resin capsules supplied to a designated mine. A
number of tests from a single or several large samples prepared using the newly designed casting moulds demonstrated the
ease with which several tests can be carried out over a short time and with consistency of the results. Figure 16 shows the
bar chart of variations in the average values, indicating the increase in average shear values with sample cure time, similar
to UCS values. Figure 17 shows the variation of shear strength values between Mix and Pour and scraped slow setting
resins respectively.
Using the punch shear box a series of punch shear tests were undertaken to study the shear strength of a particular resin.
Table 6 shows typical results of punch test carried out on Minova/Orica fast setting resin, which is scraped from the resin
sausages supplied to a designated mine. The value of shear punch test was determined by using the following equation;
τ = F
3.142 x T x D
The next task is to expand shear testing programme to include a comparative testing of the resin using different tests to
achieve a universal acceptance of the chosen technique by the mining Industry. This programme of study will include
various resin types
0
10
20
30
40
50
60
Brithish standard Proposed standard
Seca
nt
elas
tic
mo
du
lus
(GP
a)
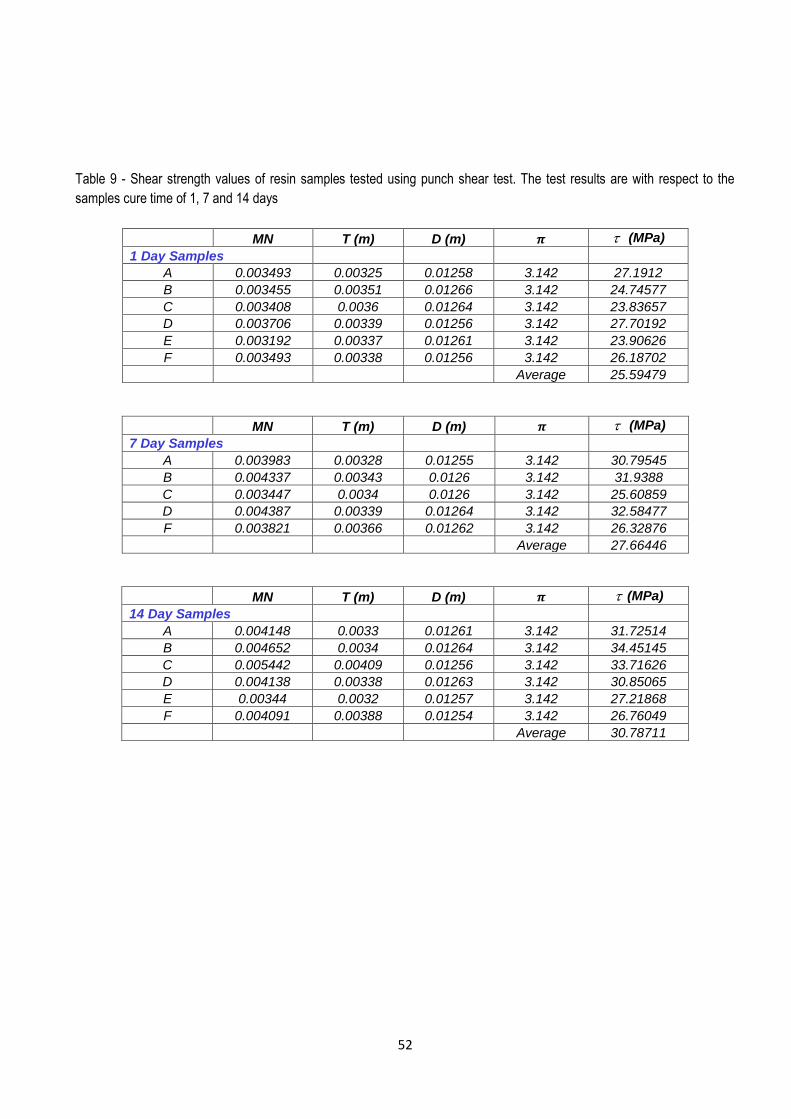
52
Table 9 - Shear strength values of resin samples tested using punch shear test. The test results are with respect to the
samples cure time of 1, 7 and 14 days
MN T (m) D (m) 𝝅 (MPa)
1 Day Samples A 0.003493 0.00325 0.01258 3.142 27.1912
B 0.003455 0.00351 0.01266 3.142 24.74577
C 0.003408 0.0036 0.01264 3.142 23.83657
D 0.003706 0.00339 0.01256 3.142 27.70192
E 0.003192 0.00337 0.01261 3.142 23.90626
F 0.003493 0.00338 0.01256 3.142 26.18702
Average 25.59479
MN T (m) D (m) 𝝅 (MPa)
7 Day Samples A 0.003983 0.00328 0.01255 3.142 30.79545
B 0.004337 0.00343 0.0126 3.142 31.9388
C 0.003447 0.0034 0.0126 3.142 25.60859
D 0.004387 0.00339 0.01264 3.142 32.58477
F 0.003821 0.00366 0.01262 3.142 26.32876
Average 27.66446
MN T (m) D (m) 𝝅 (MPa)
14 Day Samples A 0.004148 0.0033 0.01261 3.142 31.72514
B 0.004652 0.0034 0.01264 3.142 34.45145
C 0.005442 0.00409 0.01256 3.142 33.71626
D 0.004138 0.00338 0.01263 3.142 30.85065
E 0.00344 0.0032 0.01257 3.142 27.21868
F 0.004091 0.00388 0.01254 3.142 26.76049
Average 30.78711

53
Figure 66 - Average shear strength values for various cast samples cure time
Figure 67 - Variation in resin shear strength values between new supplied and scraped resins for various curing periods
1 7 14 21
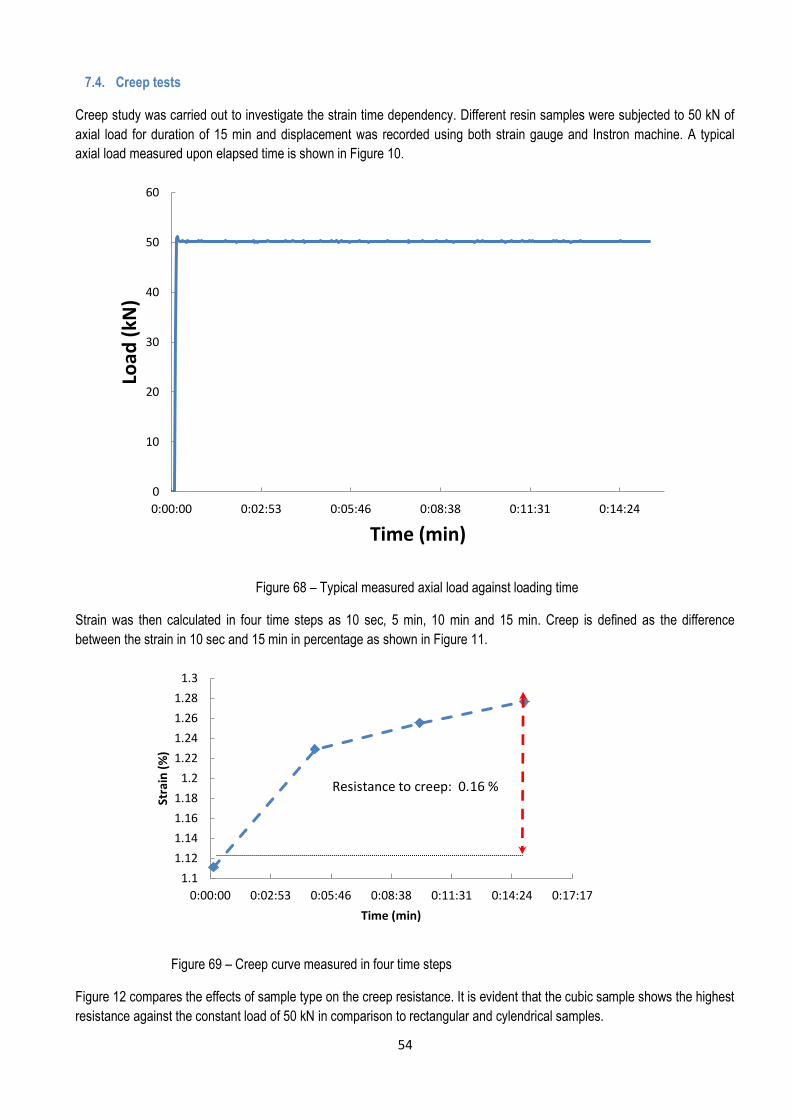
54
7.4. Creep tests
Creep study was carried out to investigate the strain time dependency. Different resin samples were subjected to 50 kN of
axial load for duration of 15 min and displacement was recorded using both strain gauge and Instron machine. A typical
axial load measured upon elapsed time is shown in Figure 10.
Figure 68 – Typical measured axial load against loading time
Strain was then calculated in four time steps as 10 sec, 5 min, 10 min and 15 min. Creep is defined as the difference
between the strain in 10 sec and 15 min in percentage as shown in Figure 11.
Figure 69 – Creep curve measured in four time steps
Figure 12 compares the effects of sample type on the creep resistance. It is evident that the cubic sample shows the highest
resistance against the constant load of 50 kN in comparison to rectangular and cylendrical samples.
0
10
20
30
40
50
60
0:00:00 0:02:53 0:05:46 0:08:38 0:11:31 0:14:24
Loa
d (
kN)
Time (min)
1.1
1.12
1.14
1.16
1.18
1.2
1.22
1.24
1.26
1.28
1.3
0:00:00 0:02:53 0:05:46 0:08:38 0:11:31 0:14:24 0:17:17
Stra
in (
%)
Time (min)
Resistance to creep: 0.16 %

55
Figure 70 – Effects of sample type on creep
As discussed in elastic modulus section, the value of strain and therefore creep are affected by the measurement device
whether strain gauge or Instron machine due to the end effect. Figure 13 shows comparison between the creep values
obtained using samples with strain gauge and without strain gauge.
Figure 71 – Comparison between strain gauged and non-strain gauged samples in creep determination
It is clear from Figure 13 that samples without strain gauges underestimate the creep in comparison to the strain gauged
specimens.
The creep study was further extended according to the British standard. The creep value for a rectangular sample with
dimensions of 12.5*12.5*50 mm3 subjected to 5 kN of axial load was drawn to be 0.41%. This is 0.3% higher than the value
obtained incorporating the proposed standard.
0
0.1
0.2
0.3
0.4
0.5
0.6
0.7
Cube REC CYL
Cre
ep
)%(
Sample type
0.15
0.155
0.16
0.165
0.17
0.175
0.18
Without strain gauge With strain gauge
Cre
ep
%

56
7.5 Summary
The new method of casting multiple samples in bunch represents a convenient method of preparing samples for strength
testing. The prepared samples have been found to be of uniform composition and yielded consistent results. The proposed
method of casting samples is:
fast as no additional time is required for repeated casting;
sample sides are uniform as the moulds are not split axially;
can be applied to cylinder as well as cube sample preparation;
reduces the formation of voids and the composition of the cast sample.
strength values determined for various resins are consistent and repeatable, thus the proposed methodology of resin
casting and samples preparation represent a suitable approach in testing different types of resins, thus allowing the
establishment of a creditable testing procedures and establishment of a credible Australian Standard.

57
8. PROCEDURES FOR TESTING STRENGTH PROPERTIES
8.1 Suggested Method for Determination Uniaxial Compressive Strength of the Resin/Grout Used for Rock Bolting
Installations
1. Scope
This method of test is intended to measure the uniaxial compressive strength of chemical resins or cementitious grouts
used for rock bolting. The test is mainly intended for strength classification and characterisation of resins and grouts.
The test also describes the manner in which how the test results are interpreted with respect to the test sample shape
and size.
2) Apparatus
(a) A refrigerator to store and maintain chemical resin at a temperature 4.0 oC ± 1.0 oC.
(b) A suitable compression testing machine for applying and measuring axial load to the resin and grout specimen.
(c) A spherical seat, to permit axial load application on the tested sample. The spherical seat should be placed on the
upper end of the specimen. It should be highly lubricated with mineral oil so that it locks after the dead weight of the
cross head has been picked up. The specimen, the platens and spherical seat shall be accurately centred with
respect to one another and to the loading machine. The curvature centre of the seat surface should coincide with
the centre of the top end of the specimen.
(d) Steel platens of the same shape as the tested sample. The steel plates should of sufficient strength and a Rockwell
hardness of not less than HRC58, comparable to the strength that is used for normal rock UCS testing. The width
of the steel plates should be + 2mm larger than the specimen side in case the tested sample is a cube. Surfaces
of the discs should be ground and their flatness should be better than 0.005 mm [1]
3) Procedure
a) The following procedure is applied to testing of cylindrical, cube and prism samples. The recommended dimensions
of the samples tested are as follows;
Cube: 40 mm side,
Prism: base 40 mm2 and height 80 mm (H/W=2), and
Cylinder: 40 mm diameter (size BX) and L/D =2.
Irrespective of the sample shape, it is recommended that the ends of the specimen shall be flat to 0.02 mm and shall
not depart from perpendicularity to the axis of the specimen by more than 0.001 radian (about 3.5 min) or 0.05 mm in
50 mm.
b) The sides of the specimen shall be smooth and free of abrupt irregularities and straight to within 0.3 mm over the full
length of the specimen. If cubes are tested it is preferable to load the samples at right angle to the position at which it
is cast, thus avoiding irregularities.
(c) The use of capping or end surface treatment other than machining is not permitted.
(e) The sides of the tested specimen shall be measured to the nearest 0.1 mm.
(f) Load on the specimen shall be applied continuously at a constant stress.
g) Load on the specimen shall be applied continuously at a constant stress such that failure will occur within 5-10 min
of loading, alternatively the stress rate shall be within the limits of 0.5-1.0 MPa /s.
h) The maximum load on the specimen shall be recorded in “N”, KN, or MN to within 1%.

58
(i) The number of samples tested should be determined from practical consideration, but at least six samples are
preferred. Discard the sample which is not in accordance to other samples results.
4) Calculations and Reporting
The Uniaxial compression Strength of the resin/grout specimen shall be calculated by dividing the maximum load by
the specimen original cross-sectional area. The final USC value will be the average value of the number of samples
tested
8.2 Suggested Method for Determination Shear Strength (Punch Shear Test)
1) Scope
This method of test is intended to measure the shear strength of chemical resins or cementitious grouts used for rock
bolting. The test is mainly intended for strength classification and characterisation of resins and grouts. The test
describes the manner in which how the test results are interpreted with respect to the test sample shape and size.
2) Apparatus
(a) A refrigerator to maintain chemical resin at a temperature 4.0 oC ± 1.0 oC.
(b) A suitable resin/grout mixing container.
(c) A suitable apparatus /mould to prepare chemical resin/grout for casting
sample for punch shear test. Details of the sample preparation are as
discussed in the main body of the ACARP report, section 4.3.3 on Punch
Shear test (see opposite Figure). The recommended sample thickness, to
be tested, shall be 3 mm ± 0.01.
(d) A punch shear box, similar to the South African standard apparatus for
testing resins and grouts (SANS 1534:2004) (See figure opposite. This
tool assembly comprises (1) a punch of diameter of 12.5 mm and (2) a die
of diameter of 12.70mm. This is the most practical punch shear box tool
and it has currently been used by various resin manufacturers in Australia.
(e) A suitable compression testing machine for applying and measuring axial load to the resin/ grout specimen.
(f) A precision Vernier, capable of reading down to 0.01 mm resolution. The thickness of the test sample should be
measured at several points to the nearest 0.05 mm
(3) Procedure
(a) Load on the specimen shall be applied continuously at a constant rate of load application at 1.0 mm /min. The rate
of loading should be such that the failure will occur between 20 sec and 45 s.
(b) The maximum load on the specimen shall be recorded in N, kN or MN to within 1%
(c) The number of samples tested shall be a minimum of six samples. Discard the sample with test result not in
agreement with the average value of other tested samples.
(4) Calculations and report of the results
a) The shear strength of the tested sample is calculated from the equation:
Shear strength of the tested sample
Failure load
Disc thickness
Punched disc diameter

59
b) Date of testing
c) Tested sample age (date of casting and testing).
d) Test duration and stress rate
e) Observations on the failed sample (cavities and air bubbles, etc)
8.3- Suggested Method for Determining the Modulus of Elasticity /Young Modulus of the Resin/Grout used for Rock
Bolting Installations
1. Scope and introduction
This method of test us intended to determine stress-strain curves and Young’s Modulus (E) and Poisson’s ratio in uniaxial
compression of a resin or grout specimen of regular geometry.
Two methods are used to determine E value of resin; (a) the fixed 40 kN load range method, and (b) the mid height E value
measured using strain gauges mounted at the mid-height sample. The sample used has height to width ratio of two. Both
methods are described here and the results are compared.
2. Apparatus
(d) A refrigerator to store and maintain chemical resin at a temperature 4.0 oC ± 1.0 oC.
(e) A suitable compression testing machine for applying and measuring axial load to the resin and grout specimen.
(f) A spherical seat, to permit axial load application on the tested sample. The spherical seat should be placed on the
upper end of the specimen. It should be highly lubricated with mineral oil so that it locks after the dead weight of the
cross head has been picked up. The specimen, the platens and spherical seat shall be accurately centred with respect
to one another and to the loading machine. The curvature centre of the seat surface should coincide with the centre of
the top end of the specimen.
(g) Steel platens of the same shape as the tested sample. The steel plates should of sufficient strength and a Rockwell
hardness of not less than HRC58, comparable to the strength that is used for normal rock UCS testing. The width of
the steel plates should be + 2mm larger than the specimen side in case the tested sample is a cube. Surfaces of the
discs should be ground and their flatness should be better than 0.005 mm[1]
(h) Electrical strain gauge, linear variable deferential transducers, compressmeters, optical devices or other suitable
measuring devices. The devices used should have sensitivity of the order of 5 x 10⁻⁶.
(i) Both axial and lateral strains should be determined within an accuracy of 2% of the reading and a precsion of 0.2 % of
full scale. If Electrical strain gauges are used, the length of the strain gauges should not encroach within 0.5 length or
height of the specimen width.
(j) A data logger or any suitable recording devices to record the applied loads and deformations.
3. Procedure
(a) The following procedure is applied to testing of cylindrical, cube and prism samples. The recommended dimensions of
the samples tested are as follows;
Cube: 40 mm side,
Prism: base 40 mm2 and height 80 mm (H/W=2), and
Cylinder: 40 mm diameter (size BX) and L/D =2.
Irrespective of the sample shape, it is recommended that the ends of the specimen shall be flat to 0.02 mm and shall not
depart from perpendicularity to the axis of the specimen by more than 0.001 radian (about 3.5 min) or 0.05 mm in 50 mm [1].

60
b) The sides of the specimen shall be smooth and free of abrupt irregularities and straight to within 0.3 mm over the full
length of the specimen. If cubes are tested it is preferable to load the samples at right angle to the position at which it
is cast, thus avoiding irregularities.
(c) The use of capping or end surface treatment other than machining is not permitted.
(d) The sides of the tested specimen shall be measured to the nearest 0.1 mm.
(e) Load on the specimen shall be applied continuously at a constant stress rate such that failure will occur within 5-10
min of loading, alternately the stress rate shall be within the limits of 0.5 -1.0 MPa/s.
(f) The maximum load on the specimen shall be recorded in “N”, KN, or MN to within 1%.
(g) The number of samples tested should be determined from practical consideration, but at least six samples are
preferred. Discard the sample test results, which is not significantly different the results of others consistent values
4. Calculations
(a) Axial strain εa and lateral strain εd can be recorded directly from strain indicating equipment or calculated from
Deformation readings depending upon the type of instrumentation used.
5. Reporting of the results
5.4: Suggested method of determination creep properties of resin and grouts
1) Scope
This method of test is intended to measure the creep properties of chemical resins or cementitious grouts used for rock
bolting. The test is mainly intended for stiffness classification and characterisation of resins and grouts. The test describes
the manner in which how the test results are interpreted with respect to the test sample shape and size. Tests pieces of a
defined geometry are subjected to a defined compressive force, and deformation is recorded against time.
2) Apparatus
a. A refrigerator, to maintain chemical resin at a temperature 4.0 oC ± 1.0 oC.
b. A suitable resin/grout mixing container.
c. A suitable apparatus /mould to prepare chemical resin/grout for casting sample size as appropriate for testing
the resin/grout type.
d. A suitable compression testing machine for applying and measuring axial load to the resin/ grout specimen.
e. Electrical strain gauge, linear variable deferential transducers, compressmeters, optical devices or other
suitable measuring devices. The design should enable the mean of two axial strain measurements, equally
spaced, to be determined for each increment of load. The devices should be robust and stable, with strain
sensitivity of the order of 5 x 10⁻⁶.
If dial micrometres or LVDTs are used for measuring axial deformation, these devices should be graduated to
read in 0.002 mm units and accurate within 0.002 mm units and accurate within 0.002 mm in any 0.02 mm
range and within 0.005 mm in any 0.25 mm range as recommended by the established standards BS7861:Part
1 (1996), and ASTM. The dial micrometre or LVDTs should not encroach within 15 mm of the specimen ends,
unless measurements are being made indirectly, between the machine platens.
Both axial and lateral strains should be determined within an accuracy of 2% of the reading and a precision of
0.2 % of full scale. If Electrical strain gauges are used, the length of the strain gauges should not encroach
within 0.5 length or height of the specimen width. Alternatively, the length of the gauges over which axial strains

61
are determined needs to be at least 20 mm and the gauge should not encroach within 15 mm of the specimen
ends as recommended by BS7861:Part 1 (1996).
f. A data logger or any suitable recording devices to record the applied loads and deformations.
g. A precision Vernier, capable of reading down to 0.01 mm resolution. The thickness of the test sample should be
measured at several points to the nearest 0.05 mm.
3) Procedure
a) Specimen preparation: prepare the test specimens, including the conditioning, proportioning and mixing of materials and
the conditioning, and filling of the mould in accordance with the appropriate sample pre[parathion and casting moulds.
Samples should be mixed and cast in moulds at a laboratory temperature of 20oC ± 5oC. Take five specimens from the
same mix.
Irrespective of the sample shape, it is recommended that the ends of the specimen shall be flat to ± 0.02 mm and shall not
depart from perpendicularity to the axis of the specimen by more than 0.001 radian (about 3.5 min of arc) or 0.05 mm in 50
mm. The dimensions of the samples used will be dependent on the resin setting/gelling time
b) The sides of the specimen shall be smooth and free of abrupt irregularities and straight to within ± 0.3 mm over the full
length of the specimen. If cubes are tested it is preferable to load the samples at right angle to the position at which it is
cast, thus avoiding irregularities.
c) Wipe clean the bearing surfaces of the testing machine and of any auxiliary platen. Carefully place the test specimen on
the lower machine platen and centre it in such a manner that the load is applied axially.
d) without load being applied record the strain gauge reading. At a strate rate of 0.75 (n/mm2)/s ±0.25 (N/mm2)s apply and
then maintain a load according to the sample size shown in Table 10 and record the change in strain at 0.5, 1.0, 5. 10, and
15 min. After 15 min remove the load completely
Table 10 -Loading levels for determination of creep
Resin Type Applied Load (kN)
Fast Set 5.0
Medium set 5.0
Slow set 20.0
4) Results
From the original (unloaded) gauge length determine the specimen gauge length 30 s after application of the applied load.
Then determine the difference in strain for each subsequent time interval up to and including 15 min. Calculate the
percentage change in strain with time. Minimum number of samples tested should be not less than five (5) samples. Discard
the highest and lowest results. Calculate the mean results from the reaming sets of values and plot a graph of percentage
strain against time.
The resistance to creep is deemed to be the difference in percentage strain determined at 0.5 and 15 min following
application of the load.
5) Calculations and reporting of results

62
SUGGESTED PROCEDURE FOR SHORT ENCAPSULATION PULL TESTING (SEPT) OF BOLTS
1. Scope
This method of test is intended to determine the load bearing capacity of the short length of resin/grout encapsulated bolt
commonly called Short Encapsulation Pull Testing (SEPT) carried out at the desired locations in a mine or in laboratory.
Two methods of SEPT are practiced, and procedures described shall address both alternatives. They are:
a) The conventional approach, and
b) Sacrificial top of bolt approach, which is an alternative method of SEPT that require a specialised bolt preparation as
shown in Figure 72. Known as “Split BOLT SEPT” the method is suitable for testing installations with spin-to stall
installations.
The SEPT test is mainly intended for the performance characterisation of bolt installation in different mediums and
locations where the test conditions vary.
2. Apparatus
1. A suitable drill machine which could be; (i) a hand held roof bolter or (ii) a hydraulically operated bolter mounted on the
heading machine or a self-reticulated roof bolter.
2. Drill tool (bit, rod and reamer). Drill tool should be able to accommodate drilling with and without reamer mounted on the
drill string.
a. Reamed hole method: A combination of drill, rod and a reamer is known as “inline reamer”. The reamed hole
method best guarantees correct bond length for SEPT.
b. Drill and ream: The hole is drilled first to the predetermined depth/height. The hole is then reamed separately to the
given height, leaving the top length for bolt encapsulation.
3. Resin /grout capsule: The capsule should be equal to the non-reamed ‘bond length’ portion of the hole
4. A suitable length of the test bolt. The selected bolt should be of sufficient length to ensure that the encapsulated section
of the bolt shall be installed about 200 -300 mm inside the rock mass or composite medium, and have sufficient length
protruding outside the medium to accommodate load cell, hydraulic ram, nuts and washers. An 800 mm long bolt shall
be of sufficient length to conduct SEPT in rock mass with 200-300 mm encapsulation length anchored 200 mm some
200 mm from the borehole mouth, with the 200 mm reamed lowered end.
5. A hollow load cell of adequate capacity to monitor the pull load,
6. A hydraulic ram for pulling the bolt out.
7. A hydraulic jack to pump the ram. The hydraulic Jack could be a simple manually operated unit or electrically powered
pressure pack, depending on the test environment.
8. A hydraulic pressure monitor. A calibrated force gauge (tonnes or kN) shall be used with the accompanying hydraulic
jack of known ram area, the small increment should not be larger than 1 t. All hydraulic equipment must comply with the
NSW Department of Mines “MDG41” guidelines, and site specifications. Alternatively, approved battery/electrically
powered readout units shall be used, as dictated by the test environment.
9. A displacement measurement tool: This could be one of the following:
A mechanical dial gauge mounted on roof/floor convergence strut or Pogo stick, with the top end attached to the
end of the protruding bolt/extension (Figure 73). This arrangement will allow displacement to be read from the end of
the bolt/ extensions to the floor, directly below the axis of the bolt being pull tested. All practical efforts should be
made to align the displacement measuring device axis with the axis of the bolt. In underground coal a dial gauge
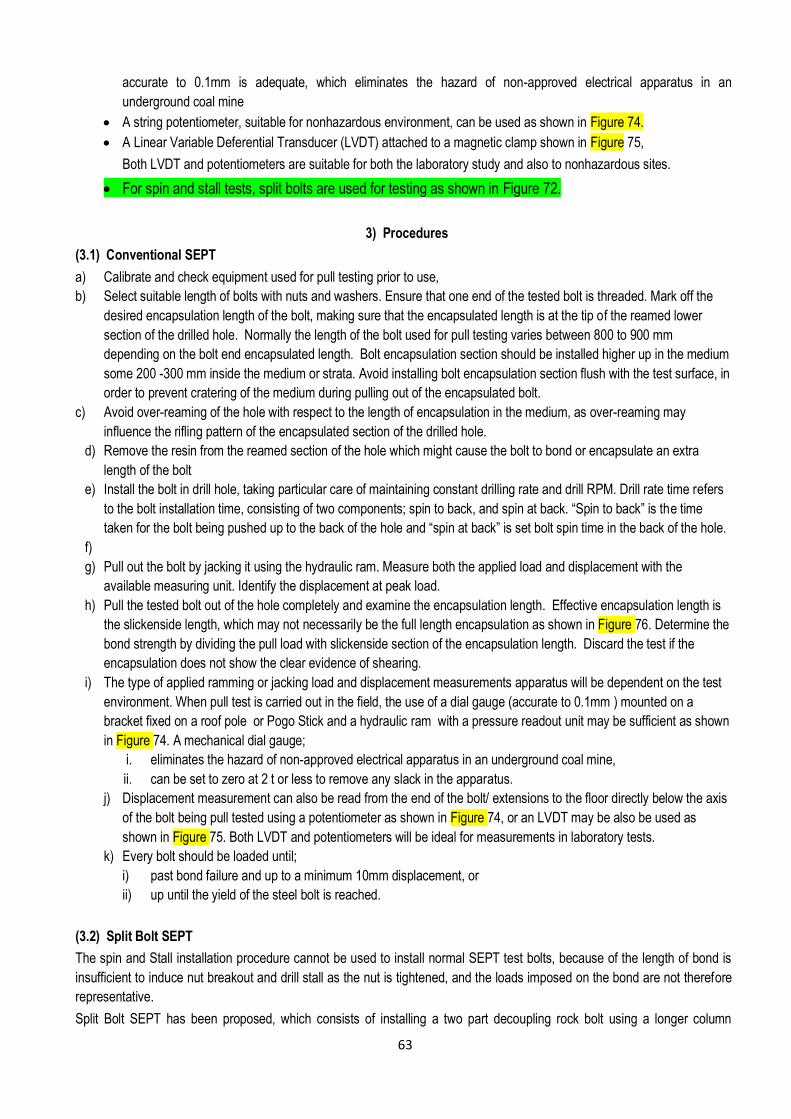
63
accurate to 0.1mm is adequate, which eliminates the hazard of non-approved electrical apparatus in an
underground coal mine
A string potentiometer, suitable for nonhazardous environment, can be used as shown in Figure 74.
A Linear Variable Deferential Transducer (LVDT) attached to a magnetic clamp shown in Figure 75,
Both LVDT and potentiometers are suitable for both the laboratory study and also to nonhazardous sites.
For spin and stall tests, split bolts are used for testing as shown in Figure 72.
3) Procedures
(3.1) Conventional SEPT
a) Calibrate and check equipment used for pull testing prior to use,
b) Select suitable length of bolts with nuts and washers. Ensure that one end of the tested bolt is threaded. Mark off the
desired encapsulation length of the bolt, making sure that the encapsulated length is at the tip of the reamed lower
section of the drilled hole. Normally the length of the bolt used for pull testing varies between 800 to 900 mm
depending on the bolt end encapsulated length. Bolt encapsulation section should be installed higher up in the medium
some 200 -300 mm inside the medium or strata. Avoid installing bolt encapsulation section flush with the test surface, in
order to prevent cratering of the medium during pulling out of the encapsulated bolt.
c) Avoid over-reaming of the hole with respect to the length of encapsulation in the medium, as over-reaming may
influence the rifling pattern of the encapsulated section of the drilled hole.
d) Remove the resin from the reamed section of the hole which might cause the bolt to bond or encapsulate an extra
length of the bolt
e) Install the bolt in drill hole, taking particular care of maintaining constant drilling rate and drill RPM. Drill rate time refers
to the bolt installation time, consisting of two components; spin to back, and spin at back. “Spin to back” is the time
taken for the bolt being pushed up to the back of the hole and “spin at back” is set bolt spin time in the back of the hole.
f)
g) Pull out the bolt by jacking it using the hydraulic ram. Measure both the applied load and displacement with the
available measuring unit. Identify the displacement at peak load.
h) Pull the tested bolt out of the hole completely and examine the encapsulation length. Effective encapsulation length is
the slickenside length, which may not necessarily be the full length encapsulation as shown in Figure 76. Determine the
bond strength by dividing the pull load with slickenside section of the encapsulation length. Discard the test if the
encapsulation does not show the clear evidence of shearing.
i) The type of applied ramming or jacking load and displacement measurements apparatus will be dependent on the test
environment. When pull test is carried out in the field, the use of a dial gauge (accurate to 0.1mm ) mounted on a
bracket fixed on a roof pole or Pogo Stick and a hydraulic ram with a pressure readout unit may be sufficient as shown
in Figure 74. A mechanical dial gauge;
i. eliminates the hazard of non-approved electrical apparatus in an underground coal mine,
ii. can be set to zero at 2 t or less to remove any slack in the apparatus.
j) Displacement measurement can also be read from the end of the bolt/ extensions to the floor directly below the axis
of the bolt being pull tested using a potentiometer as shown in Figure 74, or an LVDT may be also be used as
shown in Figure 75. Both LVDT and potentiometers will be ideal for measurements in laboratory tests.
k) Every bolt should be loaded until;
i) past bond failure and up to a minimum 10mm displacement, or
ii) up until the yield of the steel bolt is reached.
(3.2) Split Bolt SEPT
The spin and Stall installation procedure cannot be used to install normal SEPT test bolts, because of the length of bond is
insufficient to induce nut breakout and drill stall as the nut is tightened, and the loads imposed on the bond are not therefore
representative.
Split Bolt SEPT has been proposed, which consists of installing a two part decoupling rock bolt using a longer column

64
bonding. As shown in Figure 1, the decoupled bolt has two sections connected together by a stepped keyway. The keyway
allows the bolt to be pushed into the hole and installed using the spin and stall installation procedure. When the bolt is
subsequently pull tested, the section below the joint detaches freely, allowing measurements of the bond strength over this
bolt section. Once the bolt is installed in the rock mass the procedure for SEPT is the same as above.
4) Calculations and Data Analysis
The method of graphing load versus bond displacement should be used, which calculates bond displacement as the raw
displacement measurement minus the theoretical elongation of the free bolt length
Further work is required on the best method(s) which describe all features of the resin/bolt performance. Additional
calculations shall include:
i. Peak Load: The maximum load at failure
ii. Residual Load: the minimum load after 25 mm of displacement
iii. Bond Strength: Taken as a gradient of the curve at 20 kN/mm
iv. Stiffness: Determined from the plotted graph
Figure 72- Split bolt short encapsulation pull testing
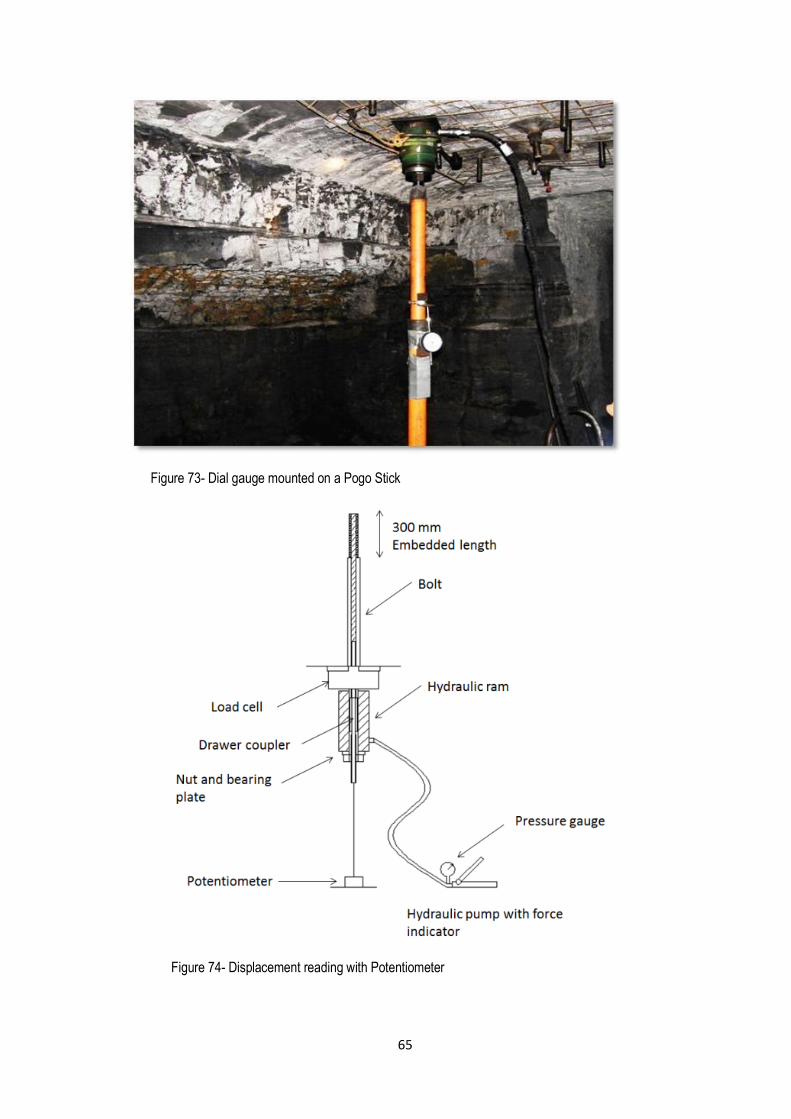
65
Figure 73- Dial gauge mounted on a Pogo Stick
Figure 74- Displacement reading with Potentiometer

66
Figure 75- An LVDT clamped to a magnet holder
Figure 76- An example of pulled-out bolts end encapsulation

67
9. CONCLUSIONS AND RECOMMENDATIONS
Field study and short encapsulation bolt pull testing study
The following conclusions were inferred from filed pull testing study:
Bolt installation time of approximately 10 s constitutes and acceptable time for effective bolt installation as is normally
recommended for use with Minova/Orica fast setting resin of 14 s,
The results of the over spinning at back was inconclusive, because of the limited bolt encapsulation length,
The use of 300 mm long encapsulation length may be the maximum acceptable length for pull testing. This may also
depend on the type of the rock formation, which has some bearing on load transfer capability of the installation. This
finding is in agreement with the study carried out by Willkinson and Canbulat (2005).
Over drilling contributed to increased load transfer capacity of the installed bolt and thus became the accumulation zone
of the gloving material.
Both Baal Bone and Tahmoor test analyses indicated that over drilling shows a significant improvement in load transfer.
With regard to Gujarat NRE No.1 at Wongawilli formation installation it was inferred that all bolts
installed in the 50 mm over-drilled holes (bolts 1-4) had relatively higher pull out loads than the ones installed without
over drilling (5-8).
As expected the bolt installed with anchorage length of 320 mm resulted in pull out loads greater than the pull out loads
of 300 mm anchorage length. This additional length of 20 mm encapsulation length appears to cause pull out loads was
near bolt yield point.
Bolt encapsulation pull testing in steel tube
No conclusions were drawn from the study of the encapsulated bolt in steel tubes because of poor pull loads. Further study
is currently underway with new set of installations at the Springvale mine.
Laboratory overhead pull testing in sandstone
No conclusions were drawn at this stage from pull testing in overhead laboratory sandstone. Issues related to drill machine
interfered with the study programme. The performance of the drill machine is currently been addressed for new programme
of pull testing.
Resin strength properties testing
The new method of casting multiple resin samples in the same bunch represents a convenient method of preparing samples
for strength testing. The prepared samples have been found to be of uniform composition and yielded consistent results.
The proposed method of casting samples is:
faster than the previous methods as no additional time is required for repeated casting;
sample sides are uniform as moulds are not split axially;
can be applied to cylinders as well as cube sample preparation;
reduces the formation of voids and improves the quality of the cast sample.
Accordingly, the strength values determined for various resins are consistent and repeatable, thus the proposed
methodology of resin casting represent a suitable approach which will permit setting up a useful testing procedure for the
establishment of a credible Australian Standard.
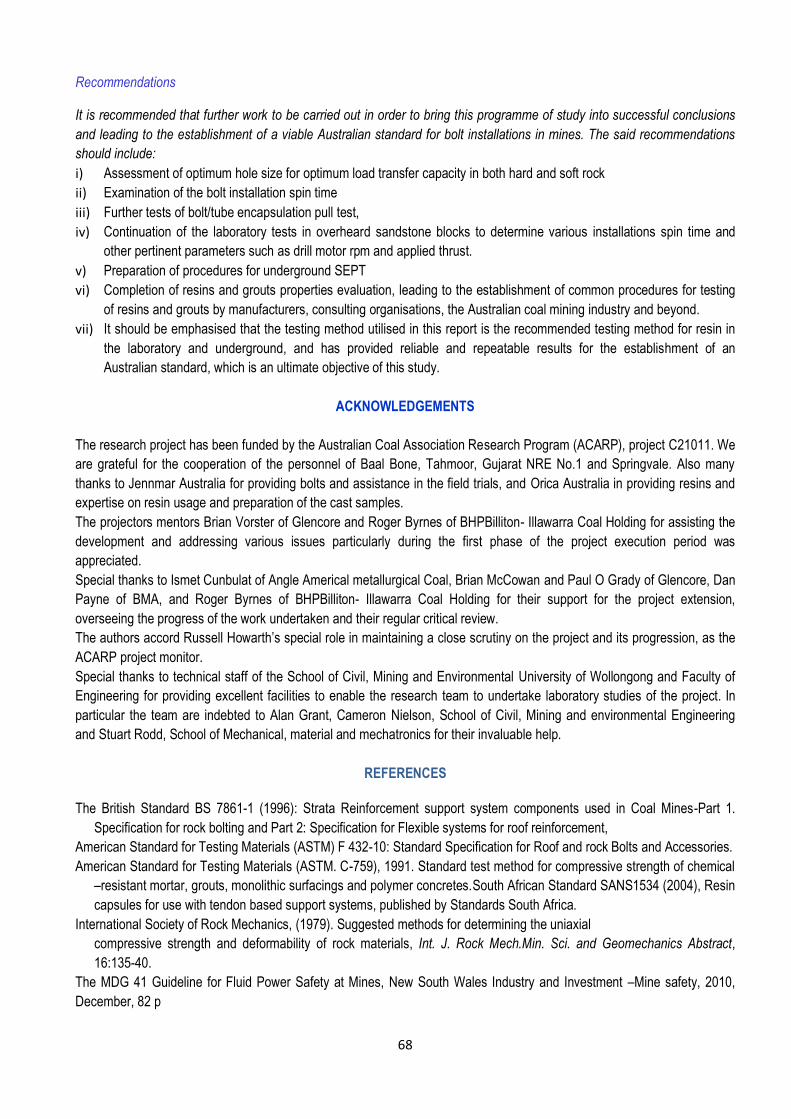
68
Recommendations
It is recommended that further work to be carried out in order to bring this programme of study into successful conclusions
and leading to the establishment of a viable Australian standard for bolt installations in mines. The said recommendations
should include:
i) Assessment of optimum hole size for optimum load transfer capacity in both hard and soft rock
ii) Examination of the bolt installation spin time
iii) Further tests of bolt/tube encapsulation pull test,
iv) Continuation of the laboratory tests in overheard sandstone blocks to determine various installations spin time and
other pertinent parameters such as drill motor rpm and applied thrust.
v) Preparation of procedures for underground SEPT
vi) Completion of resins and grouts properties evaluation, leading to the establishment of common procedures for testing
of resins and grouts by manufacturers, consulting organisations, the Australian coal mining industry and beyond.
vii) It should be emphasised that the testing method utilised in this report is the recommended testing method for resin in
the laboratory and underground, and has provided reliable and repeatable results for the establishment of an
Australian standard, which is an ultimate objective of this study.
ACKNOWLEDGEMENTS
The research project has been funded by the Australian Coal Association Research Program (ACARP), project C21011. We
are grateful for the cooperation of the personnel of Baal Bone, Tahmoor, Gujarat NRE No.1 and Springvale. Also many
thanks to Jennmar Australia for providing bolts and assistance in the field trials, and Orica Australia in providing resins and
expertise on resin usage and preparation of the cast samples.
The projectors mentors Brian Vorster of Glencore and Roger Byrnes of BHPBilliton- Illawarra Coal Holding for assisting the
development and addressing various issues particularly during the first phase of the project execution period was
appreciated.
Special thanks to Ismet Cunbulat of Angle Americal metallurgical Coal, Brian McCowan and Paul O Grady of Glencore, Dan
Payne of BMA, and Roger Byrnes of BHPBilliton- Illawarra Coal Holding for their support for the project extension,
overseeing the progress of the work undertaken and their regular critical review.
The authors accord Russell Howarth’s special role in maintaining a close scrutiny on the project and its progression, as the
ACARP project monitor.
Special thanks to technical staff of the School of Civil, Mining and Environmental University of Wollongong and Faculty of
Engineering for providing excellent facilities to enable the research team to undertake laboratory studies of the project. In
particular the team are indebted to Alan Grant, Cameron Nielson, School of Civil, Mining and environmental Engineering
and Stuart Rodd, School of Mechanical, material and mechatronics for their invaluable help.
REFERENCES
The British Standard BS 7861-1 (1996): Strata Reinforcement support system components used in Coal Mines-Part 1.
Specification for rock bolting and Part 2: Specification for Flexible systems for roof reinforcement,
American Standard for Testing Materials (ASTM) F 432-10: Standard Specification for Roof and rock Bolts and Accessories.
American Standard for Testing Materials (ASTM. C-759), 1991. Standard test method for compressive strength of chemical
–resistant mortar, grouts, monolithic surfacings and polymer concretes.South African Standard SANS1534 (2004), Resin
capsules for use with tendon based support systems, published by Standards South Africa.
International Society of Rock Mechanics, (1979). Suggested methods for determining the uniaxial
compressive strength and deformability of rock materials, Int. J. Rock Mech.Min. Sci. and Geomechanics Abstract,
16:135-40.
The MDG 41 Guideline for Fluid Power Safety at Mines, New South Wales Industry and Investment –Mine safety, 2010,
December, 82 p

69
Wilkinson, A and Canbulat, I, (2005). Investigations into support systems in South African Collieries, in Proceedings, 24rt
International Conference on Ground control in Mining, August 2-5, Morgantown, WV, USA, pp 263-269.
Altounyan, P, Bugden, A, O’Connor, D and Berry, R, (2003). Developments in improving the standard of installation and bond strength of full column resin roof bolts, in Proceedings, 22nd International Conference on Ground Control in Mining, Morgantown, WV, pp 263 -269 http://icgcm.conferenceacademy.com/papers/detail.aspx?subdomain=ICGCM&iid=632
Campbell R, N, and Mould, R. J, (2001). Investigation into the Extent and Mechanisms of Gloving and Unmixed Resin in Fully Encapsulated Roof Bolts, 22nd International Conference on Ground Control in Mining, Morgantown, WV, pp 263 -269 http://icgcm.conferenceacademy.com/papers/detail.aspx?subdomain=ICGCM&iid=6321
Campbell R. N, and Mould, R. J, and MacGregor, S, (2004). Investigation into the extent and mechanisms of gloving un-mixed resin in fully encapsulated roof bolts, in Proceedings, 4th Underground Coal Operators Conference, Coal 2003, February 4-6, Wollongong, (eds: N. Aziz and Kininmonth), pp203-214. http://ro.uow.edu.au/coal/145/
Hillyer, J, (2012). Influence of installation method and resin properties on rock bolt performance in underground coal mines. Undergraduate thesis, UOW, 110p.
Aziz, N, Hillyer, J, Joyce, D, Shuqi Ma, Nemcik, J and Moslemi, A, (2013). New approach to resin sample preparation for strength testing, on Proceedings, 4th Underground Coal Operators Conference, Coal 2013, February 14-15,Wollongong, (eds: N. Aziz and Kininmonth),pp152-155. http://ro.uow.edu.au/coal/449/
Aziz, N, Hillyer, J, Craig, P, Shuqi Ma, , Nemcik, J and Ren, T, (2013). Variation in load transfer along the length of fully encapsulated rock bolts, based on the installation mixing parameters, in proceedings, 4th Underground Coal Operators Conference, Coal 2013, February 14-15,Wollongong, (eds: N. Aziz and Kininmonth), pp137-143. http://ro.uow.edu.au/coal/447/
Jalalifar, J and Aziz, N, (2010). Experimental and 3D Numerical Simulation of Reinforced Shear Joints, Rock Mechanics and
Rock Engineering, Vol 43, Number 1/February, pp 95-103
Aziz, N.I and Jalalifar, H, (2005). Investigation into the transfer mechanism of loads on grouted bolts, Journal and news of
the Australian Geomechanics Society, Vol 40, No 2, pp 99-112.
Aziz, N, Nemcik, J and Jalalifar, H, (2011). Double shearing of rebar and cable bolts for effective strata reinforcement, in
Proceedings 12h ISRM International Congress of Rock Mechanics, Beijing, China, 18-21, October, pp 1457-1460.
Published in Harmonising Rock Engineering and the Environment –Qian and Zhou (Eds), (2012) Taylor and Francis
Group, London, ISBN, 978-0-415-80444-8, pp 1457- 1460.
Aziz, N, Jalalifar, H, Remennikov A, Sinclair, S, and Green, A, (2008). Optimisation of the Bolt Profile Configuration of Load
Transfer Enhancement, in proceedings 8th Australasian Coal Operators’ Conference, 14th/15th February, Wollongong,
NSW, pp 125-131. http://ro.uow.edu.au/coal/11/
Aziz, N, Jalalifar H, and Concalves, J, (2006). Bolt surface configurations and load transfer mechanism, Proc.7th
Underground Coal Operators Conference, Coal 2006, Wollongong, 5-7 July, (Eds, Aziz and Keilich), pp. 236-244.
Jalalifar, H., Aziz, N. I and Hadi, M, (2006). An Assessment of Load Transfer Mechanism Using the Instrumented Bolts,
Proc. 7th Underground Coal Operators Conference, Coal 2006, Wollongong, 5-7 July , (Eds, Aziz and Keilich), pp 255-
265.
Jalalifar, H and Aziz N.I,(2005). Load transfer in bending of bolt, Proc. 20th World Mining Congress and Exp, 7-10 Nov.
Tehran, Iran, pp 285-293,
Giraldo, L, Cotten, S, Farrand, J, Pile, J and Bessinger,S, (2005). Improved Pull out Strength of Fully-Grouted Roof Bolts
through Hole Geometry Modification, In proceedings, 24rt International Conference on Ground control in Mining, August
2-5, Morgantown, WV, USA, pp 279-284.
Zingano, A, Koppe, J, Felipe Costa, J and Peng, S,(2008). In-Situ Tests and Numerical Simulation about the Effect of
Annulus Thickness on the Resin Mixture for Fully Grouted Resin Bolt ,in Proceedings, 27th International Conference on
Ground control in Mining, August 2-5, Morgantown, WV, USA, pp 284-290.
Minders, S, Young, J F, and Darwin D, 2002. Concrete, second Edition, ISBN 0130646326. Neville, Am, 2011. Properties of concrete, 2nd edition, published by Pitman, London, 686 p.

70
APPENDICES
Figure 28- The alternative method of forcing mould bunch into the mixed resin container
A B C
E D F
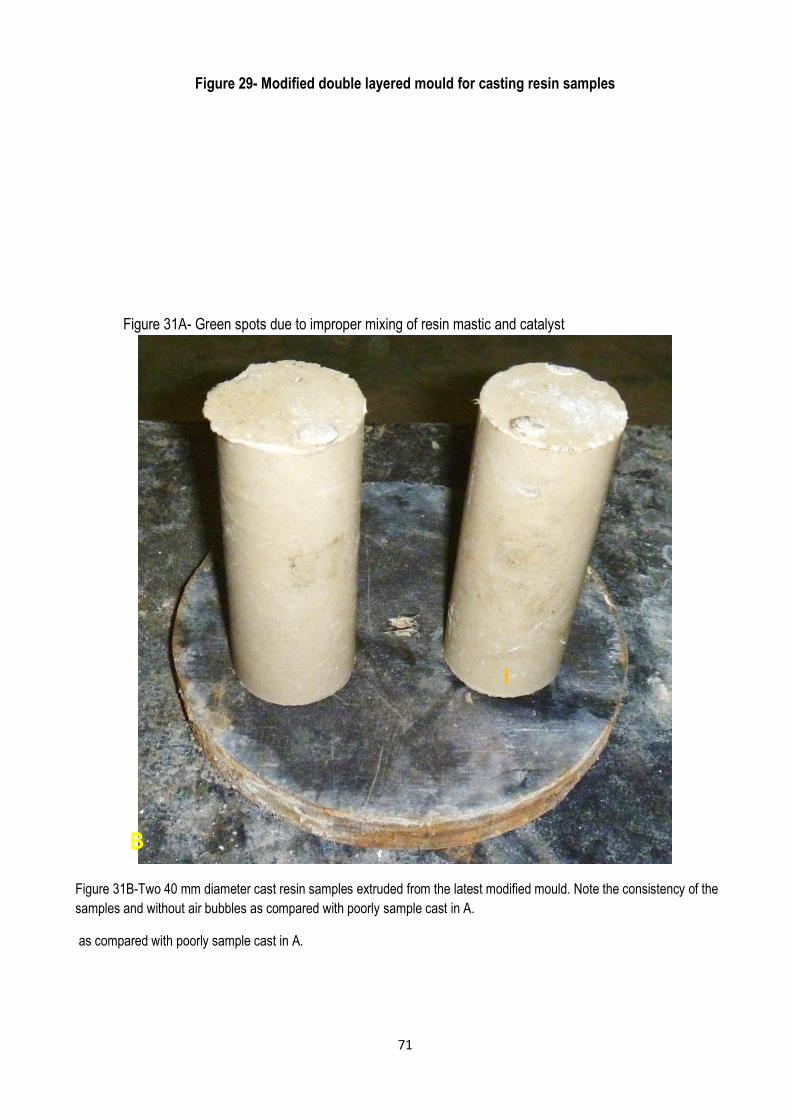
71
Figure 29- Modified double layered mould for casting resin samples
Figure 31A- Green spots due to improper mixing of resin mastic and catalyst
Figure 31B-Two 40 mm diameter cast resin samples extruded from the latest modified mould. Note the consistency of the
samples and without air bubbles as compared with poorly sample cast in A.
as compared with poorly sample cast in A.
I
B

72
Figure 32B- A view of the angle of
failure for a specimen after UCS test
Figure 33- Variation of Minova/Orica resin UCS properties with cure time
Figure 34- Variation of resin UCS changes with sample diameter
58.8 59.8 60.5
67.8 73.5
0
10
20
30
40
50
60
70
80
UC
S (M
Pa)
4 Day7 Day14 Day28 Day46 Day
69.9 73.5 75.4 75.0
0
10
20
30
40
50
60
70
80
UC
S (M
Pa)
20mm Diameter
30mm Diameter
40mm Diameter
54mm Diameter
1 2 3 4 5 6 7
53.88
53.08 52.41
53.38 52.99
53.45 52.91
Figure 32A- UCS of the 4-day old samples

73
Figure 35- Variation in resin UCS properties between 20 mm and 30 mm diameter resin sample size
67.4 66.6 69.9
73.5
0
20
40
60
80
20 mm 30mm
UC
S (M
Pa)
2 Month OldResin
Fresh Resin

74
Figure A1- Stratigraphy of Tahmoor Mine test site

75
Figure A2- Wongawilli test site stratigraphic formation

76
Figure A3- Test site stratigraphic formation in the vicinity of Wongawilli seam

77
Figure A4- Wongawilli seam at NRE No.1 test site

78
Figure B- Specification of JXB Bolt

79

80

81

82

83

84
Figure 32- Pull test peak load values of different bolts installed in sand stone
100.20
83.78
89.07
97.91
Over drill Peak Loads (kN)
Bolt D2 Bolt D3 Bolt D4 Bolt C6
180.22
259.74
203.37 231.24
Reamed Hole Test Peak Loads (kN)
Bolt C2 Bolt C3 Bolt C4 Bolt D6
173.13
72.73
197.29
119.96
152.81
3/7 s Peak Loads (kN)
Bolt A3 Bolt A4 Bolt A5 Bolt B3 Bolt B5