Embed Size (px)
Citation preview
PNNL-14157
New Technology Demonstration of the Whole-Building Diagnostician at the Federal Aviation Administration-Denver Airport R.G. Pratt N. Bauman S. Katipamula December 2002 Prepared for the U.S. Department of Energy Office of Energy Efficiency and Renewable Energy Federal Energy Management Program under Contract DE-AC06-76RL01830
DISCLAIMER This report was prepared as an account of work sponsored by an agency of the United States Government. Neither the United States Government nor any agency thereof, nor Battelle Memorial Institute, nor any of their employees, makes any warranty, express or implied, or assumes any legal liability or responsibility for the accuracy, completeness, or usefulness of any information, apparatus, product, or process disclosed, or represents that its use would not infringe privately owned rights. Reference herein to any specific commercial product, process, or service by trade name, trademark, manufacturer, or otherwise does not necessarily constitute or imply its endorsement, recommendation, or favoring by the United States Government or any agency thereof, or Battelle Memorial Institute. The views and opinions of authors expressed herein do not necessarily state or reflect those of the United States Government or any agency thereof.
PACIFIC NORTHWEST NATIONAL LABORATORY operated by BATTELLE
for the UNITED STATES DEPARTMENT OF ENERGY
under Contract DE-AC06-76RL01830
Printed in the United States of America
Available to DOE and DOE contractors from the Office of Scientific and Technical Information,
P.O. Box 62, Oak Ridge, TN 37831-0062; ph: (865) 576-8401 fax: (865) 576-5728
email: [email protected]
Available to the public from the National Technical Information Service, U.S. Department of Commerce, 5285 Port Royal Rd., Springfield, VA 22161
ph: (800) 553-6847 fax: (703) 605-6900
email: [email protected] online ordering: http://www.ntis.gov/ordering.htm
This document was printed on recycled paper.
(8/00)
New Technology Demonstration of the Whole-Building Diagnostician at the Federal Aviation Administration-Denver Airport R.G. Pratt N. Bauman S. Katipamula December 2002 Prepared for the U.S. Department of Energy Office of Energy Efficiency and Renewable Energy Federal Energy Management Program under Contract DE-AC06-76RL01830 Pacific Northwest National Laboratory Richland, Washington 99352
iii
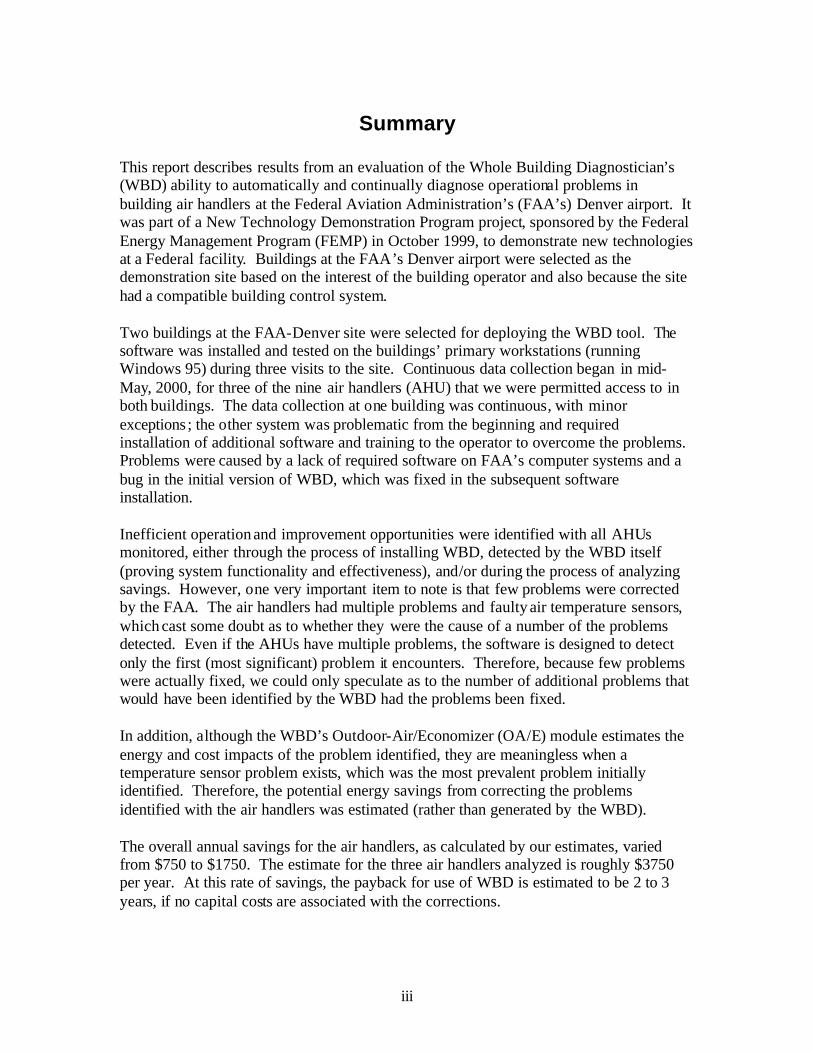
Summary This report describes results from an evaluation of the Whole Building Diagnostician’s (WBD) ability to automatically and continually diagnose operational problems in building air handlers at the Federal Aviation Administration’s (FAA’s) Denver airport. It was part of a New Technology Demonstration Program project, sponsored by the Federal Energy Management Program (FEMP) in October 1999, to demonstrate new technologies at a Federal facility. Buildings at the FAA’s Denver airport were selected as the demonstration site based on the interest of the building operator and also because the site had a compatible building control system. Two buildings at the FAA-Denver site were selected for deploying the WBD tool. The software was installed and tested on the buildings’ primary workstations (running Windows 95) during three visits to the site. Continuous data collection began in mid- May, 2000, for three of the nine air handlers (AHU) that we were permitted access to in both buildings. The data collection at one building was continuous, with minor exceptions ; the other system was problematic from the beginning and required installation of additional software and training to the operator to overcome the problems. Problems were caused by a lack of required software on FAA’s computer systems and a bug in the initial version of WBD, which was fixed in the subsequent software installation. Inefficient operation and improvement opportunities were identified with all AHUs monitored, either through the process of installing WBD, detected by the WBD itself (proving system functionality and effectiveness), and/or during the process of analyzing savings. However, one very important item to note is that few problems were corrected by the FAA. The air handlers had multiple problems and faulty air temperature sensors, which cast some doubt as to whether they were the cause of a number of the problems detected. Even if the AHUs have multiple problems, the software is designed to detect only the first (most significant) problem it encounters. Therefore, because few problems were actually fixed, we could only speculate as to the number of additional problems that would have been identified by the WBD had the problems been fixed. In addition, although the WBD’s Outdoor-Air/Economizer (OA/E) module estimates the energy and cost impacts of the problem identified, they are meaningless when a temperature sensor problem exists, which was the most prevalent problem initially identified. Therefore, the potential energy savings from correcting the problems identified with the air handlers was estimated (rather than generated by the WBD). The overall annual savings for the air handlers, as calculated by our estimates, varied from $750 to $1750. The estimate for the three air handlers analyzed is roughly $3750 per year. At this rate of savings, the payback for use of WBD is estimated to be 2 to 3 years, if no capital costs are associated with the corrections.
iv
The savings are also estimated on the basis of per ft2 of floor area served and per ft3/min of total air handler flow rate. These savings were about $0.065/cfm/yr and $0.095/ft2/yr-floor, respectively. Because savings are generally proportional to flow rate (assuming the outside-air fraction is proportionate), and since floor area is generally proportionate to flow rate, these figures will scale to other projects. Selecting sites with larger air handlers (larger air flow rates) will likely increase savings relative to costs. Involving all air handlers at a site, when their operating control strategies are similar and underlying control system is of the same type should also increase savings relative to costs. Economizers can save large amounts of cooling energy in a climate such as Denver’s, and excess outside air can cause large amounts of extra heating and cooling to be required. The process of installing and utilizing the OA/E diagnostic module identified these and many other problems with the air handlers. The WBD and the OA/E module were shown to successfully identify a number of major problems with the air handlers at FAA. Although the demonstration site was not an ideal site, these finding are consistent with the other field demonstrations of the WBD where OA/E found similar problems that should have been detected at the time of commissioning. The demonstration showed that diagnostic technology is only as good as the fixes to the problems it identifies. That is, it is insufficient to merely identify problems and their impacts and expect operators will fix them as a result. If users are not proficient in using their control systems to correct problems, are too busy with other duties, or lack resources to obtain help from contractors, diagnostic technologies alone will not result in system efficiency improvements. Improvements can only be realized in the buildings where identified problems are corrected. Future demonstrations or broad deployment of the WBD must include a mechanism for ensuring identified problems get fixed. This could come from within an agency or be provided as part of the deployment, but appears necessary if diagnostics are to do more than simply identify problems and actually proceed to deliver energy savings.
v
Contents
Summary.............................................................................................. iii Introduction ...........................................................................................1 The Need for Diagnostics in Building Systems.................................3
The Whole-Building Diagnostician (WBD) ......................................5 The WBD Infrastructure ................................................................................................. 5 Relationship of the Demonstration Project and WBD Developers ............................. 6 Availability of the WBD................................................................................................. 7
The Outside-Air/Economizer (OA/E) Diagnostic Module...............9 Types of Economizer Controls Supported ....................................................................... 9 Types of Air-Handling Systems Supported .................................................................. 10 Metered Data Requirements for the OA/E Module ...................................................... 10 Setup Data Requirements.............................................................................................. 10 Basic Operating Sequence of Air Handler .................................................................... 12 Diagnostic Approach..................................................................................................... 13 Basic OA/E Functionality............................................................................................. 14 Requirements for Using the WBD and OA/E............................................................... 18
Demonstration of the WBD at FAA-Denver Facilities.................. 19 Demonstration Facility Characteristics ......................................................................... 19 Installation..................................................................................................................... 20 Training ......................................................................................................................... 22 Data Collection ............................................................................................................. 23 Problems Detected ........................................................................................................ 24 Problems Fixed ............................................................................................................. 28 Other Problems Discovered .......................................................................................... 28 Savings Potential........................................................................................................... 29 Debriefing with User..................................................................................................... 31
Conclusions and Recommendations ................................................ 33
References .......................................................................................... 35 Appendix A – Savings Estimation Procedure................................A.1
Appendix B – Savings Estimates ....................................................B.1 Appendix C – Memos on Recommended Actions to Fix Problems............................................................................................................C.1 Appendix D – Outside-Air Fraction Requirements.......................D.1
Appendix E – Criteria for Demo Sites............................................E.1 Appendix F – Sample Software License Form .............................. F.1
vi
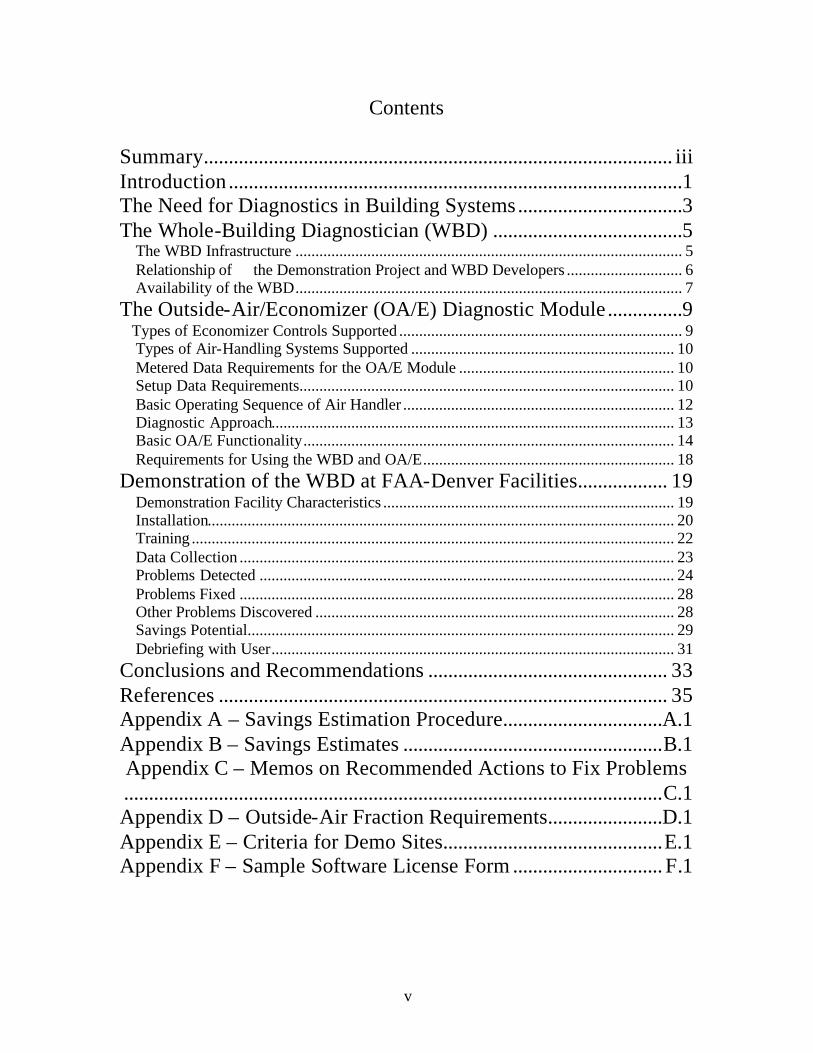
Figures 1 – Schematic Diagram of the WBD Software .............................................................................. 6 2 – Schematic Diagram of an Air Handler Showing the Sensor Locations ................................. 11 3 – Basic Operating Sequence of an Air-Handling Unit.............................................................. 13 4 – Overview of the OA/E Diagnostic Logic Tree Showing Key Decision Processes in Boxes
and Operating States in Ovals ............................................................................................... 15 5 – Diagnostic Results Showing Proper and Faulty Operation for an Air Handler with a Faulty
Outdoor-Air Sensor. The arrow identifies the cell for which more detailed results are given in Figure 4 and Figure 5. ....................................................................................................... 16
6 – Window Showing a Description of the Diagnosis, the Impacts of the Problem Found, Potential Causes of the Problem, and Suggested Corrective Actions................................... 16
7 – "Details" Window Showing a Detailed Description of the Temperature Sensor Problem Identified in Figure 5............................................................................................................. 17
8 – An Example OA/E Color Map is Shown for Air Handler 15 for November 14 through December 11. A high energy consumption problem is clearly evident throughout this time period. ................................................................................................................................... 17
9 – TRACON Administration Building AHU-1 Configuration Screen....................................... 26 10 – TRACON Admin. Bldg. AHU-1 Results: May 5 through June 6, 2000 ............................. 27 11 – TRACON Admin. Bldg. Air Handler-1 Diagnostic Results: January 5 through January 25,
2001....................................................................................................................................... 27 12 – Monthly Electricity Consumption for the ATCT Building................................................... 30
vii
Tables 1 – Characteristics of FAA-Denver Buildings and Air Handlers as Initially Reported by FAA-
Denver ................................................................................................................................... 20 2 – AHU Control Strategies and Characteristics as Designed ..................................................... 20 3 – Problems Found for FAA Air Handlers ................................................................................. 24 4 - Assumptions for Impact Estimates ......................................................................................... 30 5 - Performance Summary of Baseline vs. Ideal Operation......................................................... 31 A.1 - Cooling Load Model (partial)* ...........................................................................................A.2 A.2 - Ideal Air-Handler Operation Performance Algorithm.......................................................A.5 A.3 - Air-Handler Performance with Superimposed Problems .................................................A.10 B.1 - Outside-Air Control Strategy and Problems .......................................................................B.1 B.2 - Additional Control Information for Heating and Cooling ..................................................B.2 B.3 - Sensor Offset Error Problems .............................................................................................B.3 B.4 - Hourly Temperature Sensor Errors.....................................................................................B.3 B.5 - Valve Leak Problems ..........................................................................................................B.3 B.6 - Baseline vs. Ideal Operation for TRACON AHU-1 ...........................................................B.4 B.7 - Baseline vs. Ideal Operation for TRACON AHU-2 ...........................................................B.5 B.8 - Performance Summary of Baseline vs. Ideal Operation.....................................................B.6 D.1 – Space Types and Outside-Air Requirements per Unit Space ............................................D.1 D.2 – Floor Areas and Occupancy for Spaces .............................................................................D.2 D.3 - Outside-Air Fraction Requirement Summary for ATCT AHU-1.......................................D.2 D.4 - Outside-Air Fraction Requirement Summary for TRACON AHU-1.................................D.3 D.5 - Outside-Air Fraction Requirement Summary for TRACON AHU-2.................................D.3 E.1 – Hourly Data Needed by the WBE Module .........................................................................E.1 E.2 – Hourly Data Needed by the OA/E Module for Each Air Handler .....................................E.2
1
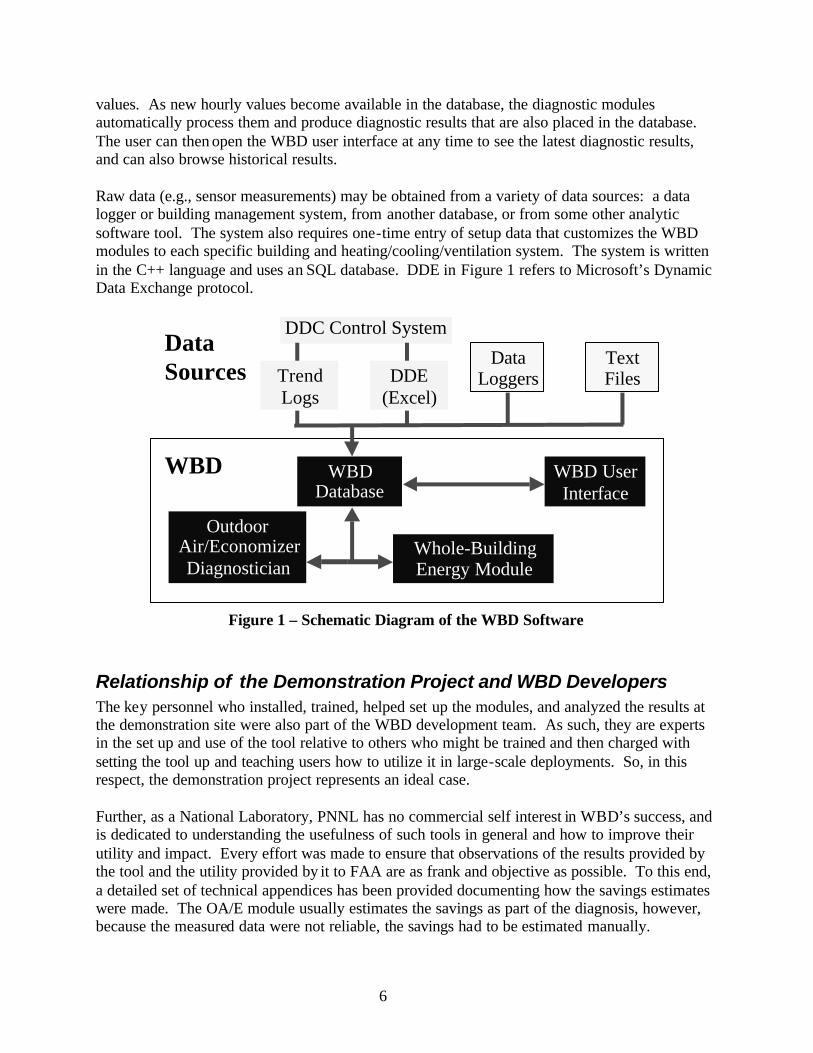
Introduction In October, 1999, the U.S. Department of Energy’s (DOE’s) Federal Energy Management Program (FEMP) initiated a project to evaluate a DOE-developed technology, the Whole-Building Diagnostician (WBD), for automatically and continually diagnosing operational problems in buildings. The Whole-Building Diagnostician is a pre-commercial, production-prototype software package that connects to digital control systems (e.g. energy management systems), utilizing data from the control system’s sensors to analyze overall building and system performance. It currently consists of two diagnostic tools, or modules, with a user interface designed to readily identify problems and provide potential solutions to building operators. The Outdoor-Air/Economizer module (OA/E), the subject of this demonstration, diagnoses whether each air handler in a building is supplying adequate outdoor air for the occupants it is designed to serve, by time of day and day of week. It also determines whether the economizer is providing free cooling with outside air when appropriate, and not wasting energy by supplying excess outside air. Under the purview of FEMP’s New Technology Evaluation Program, a project was developed to test the utility of the Whole-Building Diagnostician’s Outdoor-Air/Economizer module at two Federal Aviation Administration (FAA) buildings at the Denver airport. The intent of the project was to:
• determine its efficacy in automatically detecting energy-efficiency and outdoor-air supply problems in air handlers
• test and demonstrate the ability of users to interpret and act upon the information
provided by the OA/E to correct building operational problems
• develop a case study of the OA/E’s impact in terms of type and number of problems found, and the energy savings and fresh air supply impacts of correcting the problems
• determinewhether and under what conditions broader dissemination of the WBD within
Federal facilities is warranted. The results of the demonstration are presented in this report. Basic information about what the Whole-Building Diagnostician is and how it works is provided. A description of the FAA facilities and how the demonstration opportunity came about is also included. Technical discussions include the installation of WBD and training of the FAA staff, WBD’s operation and the problems identified by the OA/E, the potential and achieved savings, and issues that surfaced that have implications for facilities that might wish to use the WBD. Appendices are included that document the procedures used to estimate potential savings (the OA/E’s estimate of energy savings was not reliable because of problems with sensor measurements), discuss the savings analysis, and itemize criteria for selecting candidate buildings for deploying the tool (both WBD and OA/E).

3
The Need for Diagnostics in Building Systems Automated commissioning and diagnostic technologies are designed to ensure the ongoing performance of buildings at the highest possible levels of efficiency. Evidence of extensive performance problems in buildings shows that an efficient building stock will not result from solely designing efficient buildings and installing efficient equipment in them (Lunneberg 1999; also check the commissioning resources at http://www.peci.org). Utility planning agencies have conducted a comprehensive, top-down analysis of billing data for the population of new commercial buildings. These analyses have shown consumption 10% higher than levels projected based on construction characteristics, even when based on metered end-use loads (Lunneberg 1999; http://www.peci.org). This supports the conclusion that even newly constructed buildings are consuming more energy than they should. These performance problems are not inherent with efficiency technologies themselves, but instead result from errors in installation and operation of complex building heating/cooling systems and their controls. It is also significant that these systems are becoming increasingly more sophisticated to obtain ever higher levels of energy efficiency, adding to the complexity and subtlety of problems that reduce the net efficiency acquired. Such problems are even more common in existing buildings because they arise over time from operational changes and lack of maintenance (Claridge et al. 2000; also check the commissioning resources at http://www.peci.org). They often result in comfort control and indoor-air quality problems that affect occupant health and productivity (Daisey and Angell 1998). The traditional means of assuring efficient performance, commissioning of new buildings followed by regularly-scheduled preventative maintenance, is clearly insufficient to address this issue. Manually commissioning1 buildings is valuable in terms of both finding problems and developing the techniques for doing so. But, it is expensive: 1 to 2% of total construction cost is typical (check the commissioning resources at http://www.peci.org), and the few experts available to provide such services are in high demand. Commissioning is difficult to sell in a low-bid cons truction environment, where variations in the effort allocated to commissioning can be the difference between winning and losing bids and where building owners (rightfully) feel they should not have to pay extra to get buildings to work properly. Further, it is often short-changed because it largely occurs at the end of the construction process, when time-to-occupancy is critical and cost overruns drive last minute budget cuts in remaining items. Effective, on-going maintenance of building systems is notably ineffective, being almost exclusively complaint-driven and “quick fix” oriented. This is especially true for problems affecting air quality and efficiency because they are “silent killers” that go unnoticed until complete system failure occurs.
1 Commissioning is the process of systematically putting a building “through its paces,” checking that it performs as expected in terms of sensor and actuator connectivity and calibration, system modes, control sequences, and equipment capacities and conversion efficiencies. The term derives from the traditional acceptance process for naval ships, which must undergo a shakedown cruise to prove their speed, range, stability, maneuverability, communications, etc., to meet design specifications before they are accepted into service.

4
By embedding the expert oversight required in software tools that leverage existing sensors and control systems, detection and diagnosis can be conducted automatically and comprehensively without the ongoing cost of expensive expertise. Further, this oversight remains as a legacy in buildings after they are constructed, protecting the building systems against slow mechanical degradation, as well as faults inadvertently introduced by operators seeking to resolve complaints without finding root causes. The principal technical challenges are the construction of diagnostic techniques that 1) can be automated, 2) comprehensively diagnose the range and diversity of building systems and equipment, 3) make use of the minimal set of additional sensors beyond those used for control, and 4) are applicable for building commissioning, as well as ongoing diagnostics. Currently, building owners are not aware of the power of automated commissioning and diagnostic technology to provide them more cost effective, comfortable, and productive buildings. Finally, the energy service companies who may eventually offer commissioning and diagnostic services are slow to expand their business practices beyond their current focus on lighting and cooling equipment retrofits.
5
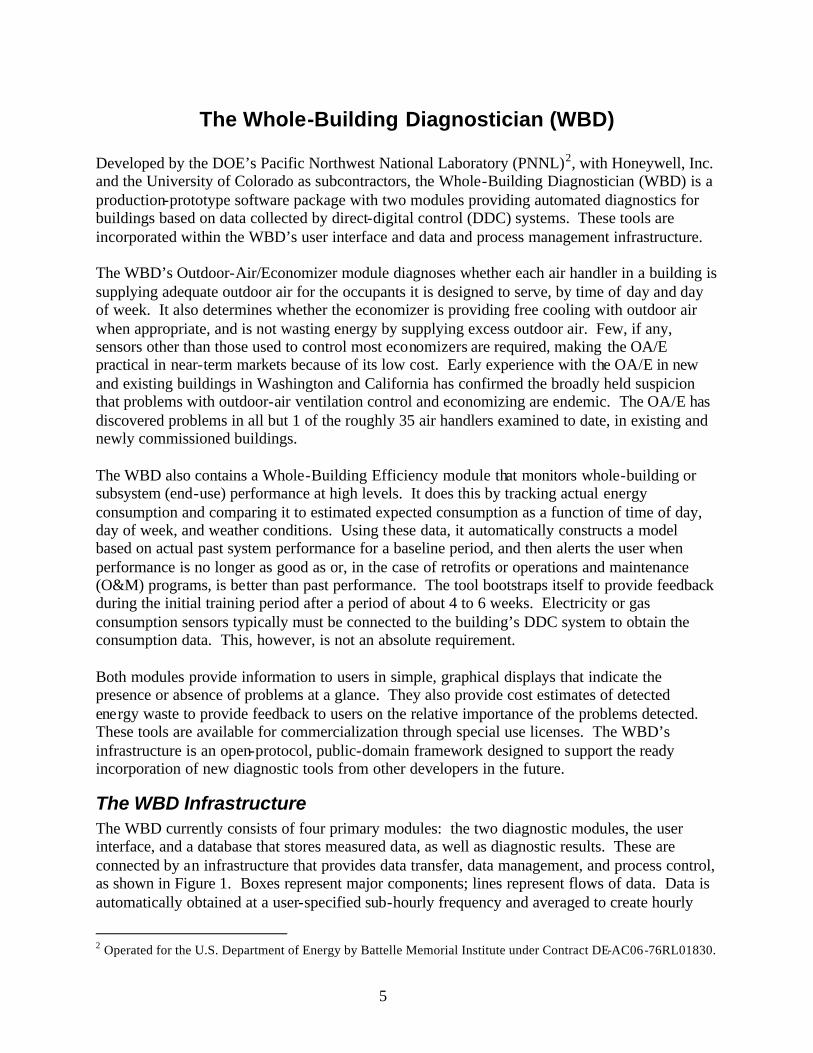
The Whole-Building Diagnostician (WBD) Developed by the DOE’s Pacific Northwest National Laboratory (PNNL)2, with Honeywell, Inc. and the University of Colorado as subcontractors, the Whole-Building Diagnostician (WBD) is a production-prototype software package with two modules providing automated diagnostics for buildings based on data collected by direct-digital control (DDC) systems. These tools are incorporated within the WBD’s user interface and data and process management infrastructure. The WBD’s Outdoor-Air/Economizer module diagnoses whether each air handler in a building is supplying adequate outdoor air for the occupants it is designed to serve, by time of day and day of week. It also determines whether the economizer is providing free cooling with outdoor air when appropriate, and is not wasting energy by supplying excess outdoor air. Few, if any, sensors other than those used to control most economizers are required, making the OA/E practical in near-term markets because of its low cost. Early experience with the OA/E in new and existing buildings in Washington and California has confirmed the broadly held suspicion that problems with outdoor-air ventilation control and economizing are endemic. The OA/E has discovered problems in all but 1 of the roughly 35 air handlers examined to date, in existing and newly commissioned buildings. The WBD also contains a Whole-Building Efficiency module that monitors whole-building or subsystem (end-use) performance at high levels. It does this by tracking actual energy consumption and comparing it to estimated expected consumption as a function of time of day, day of week, and weather conditions. Using these data, it automatically constructs a model based on actual past system performance for a baseline period, and then alerts the user when performance is no longer as good as or, in the case of retrofits or operations and maintenance (O&M) programs, is better than past performance. The tool bootstraps itself to provide feedback during the initial training period after a period of about 4 to 6 weeks. Electricity or gas consumption sensors typically must be connected to the building’s DDC system to obtain the consumption data. This, however, is not an absolute requirement. Both modules provide information to users in simple, graphical displays that indicate the presence or absence of problems at a glance. They also provide cost estimates of detected energy waste to provide feedback to users on the relative importance of the problems detected. These tools are available for commercialization through special use licenses. The WBD’s infrastructure is an open-protocol, public-domain framework designed to support the ready incorporation of new diagnostic tools from other developers in the future.
The WBD Infrastructure The WBD currently consists of four primary modules: the two diagnostic modules, the user interface, and a database that stores measured data, as well as diagnostic results. These are connected by an infrastructure that provides data transfer, data management, and process control, as shown in Figure 1. Boxes represent major components; lines represent flows of data. Data is automatically obtained at a user-specified sub-hourly frequency and averaged to create hourly
2 Operated for the U.S. Department of Energy by Battelle Memorial Institute under Contract DE-AC06-76RL01830.
6
values. As new hourly values become available in the database, the diagnostic modules automatically process them and produce diagnostic results that are also placed in the database. The user can then open the WBD user interface at any time to see the latest diagnostic results, and can also browse historical results. Raw data (e.g., sensor measurements) may be obtained from a variety of data sources: a data logger or building management system, from another database, or from some other analytic software tool. The system also requires one-time entry of setup data that customizes the WBD modules to each specific building and heating/cooling/ventilation system. The system is written in the C++ language and uses an SQL database. DDE in Figure 1 refers to Microsoft’s Dynamic Data Exchange protocol.
TrendLogs
DDE(Excel)
DataLoggers
TextFiles
DDC Control System
OutdoorAir/EconomizerDiagnostician
WBD UserInterface
WBDDatabase
Whole-BuildingEnergy Module
WBD
DataSources
Figure 1 – Schematic Diagram of the WBD Software
Relationship of the Demonstration Project and WBD Developers The key personnel who installed, trained, helped set up the modules, and analyzed the results at the demonstration site were also part of the WBD development team. As such, they are experts in the set up and use of the tool relative to others who might be trained and then charged with setting the tool up and teaching users how to utilize it in large-scale deployments. So, in this respect, the demonstration project represents an ideal case. Further, as a National Laboratory, PNNL has no commercial self interest in WBD’s success, and is dedicated to understanding the usefulness of such tools in general and how to improve their utility and impact. Every effort was made to ensure that observations of the results provided by the tool and the utility provided by it to FAA are as frank and objective as possible. To this end, a detailed set of technical appendices has been provided documenting how the savings estimates were made. The OA/E module usually estimates the savings as part of the diagnosis, however, because the measured data were not reliable, the savings had to be estimated manually.
7
Availability of the WBD The WBD software tool is available for use on Federally-funded projects without license fee (non-Federal users can negotiate access on a case-by-case basis). Potential users are required to complete a software agreement form. The details on the agreement form and the point of contact to obtain the form are provided in Appendix F. Because it is not yet commercialized, buildings or facilities that may want to use the WBD must understand that the usual channels for providing the product support normally expected for a commercial product are not available. No warranty is provided as to its performance or suitability, and installation and user’s manuals have not been developed beyond the presentation materials used in training. So, it is doubtful that a user could successfully deploy the WBD without support. This can be obtained by paying for the travel and personnel costs to provide training, assistance with installation and configuration, and for occasional advice or oversight needed for interpreting diagnostic results that may not be clear to the user at first (see discussion in next section). To minimize the support requirements in a large deployment, a train-the-trainer approach could be utilized to deliver much of this expertise to a project team, an organization, or facility staff.
9
The Outside-Air/Economizer (OA/E) Diagnostic Module This section provides a brief overview of the Outside-Air/Economizer (OA/E) module. Additional information about the WBD and the OA/E can be found in Brambley et al. (1998) and Katipamula et al. (1999). The OA/E continuously monitors the performance of air handlers and can detect basic operation problems or faults with outside-air control and economizer operation. The current version detects about 25 different basic operation problems and over 100 variations of them [for details refer to Brambley et al. (1998) or Katipamula et al. (1999)]. It uses color coding to alert the building operator when problems occur and then provides assistance in identifying the causes of problems and advice for correcting them. It, however, does not detect problems with the water-side or the refrigerant side of the air handler; it only detects problems on the air side, i.e., economizer operation and ventilation. If the air handler does not have an economizer, the OA/E module can still detect problems with the outdoor-air ventilation.
Types of Economizer Controls Supported The OA/E module can diagnose abnormal operations or problems with several different types of economizer controls including: differential dry-bulb temperature-based, differential enthalpy-based, high- limit dry-bulb temperature-based, and high- limit enthalpy-based. With differential control strategies, the outside-air condition is compared with the return-air condition. As long as the outside-air condition is more favorable (for example, with dry-bulb temperature control, the outside-air dry-bulb temperature is less than the return-air temperature), outside air is used to meet all or part of the cooling demand. If the outside air alone cannot satisfy the cooling demand, mechanical cooling is used to provide the remainder of the cooling load. With high- limit control strategies, the outside-air condition is compared to a single or fixed set point (usually referred to as a high limit). If the outside-air condition is below the set point, outside air is used to meet all or part of the cooling demand. Any remaining cooling load is provided by mechanical cooling. In addition to these economizer control strategies, the OA/E supports fault detection with both integrated and nonintegrated economizers. An integrated economizer, as its name implies, is fully integrated with the mechanical cooling system such that it can either provide all of the building’s cooling requirements if outdoor conditions allow, or it can supplement the mechanical cooling when outdoor conditions are not sufficiently favorable to handle the entire cooling load. An economizer often has the ability to throttle outdoor-air intake rates between minimum and maximum levels to prevent the delivered air from being cooler than the supply-air set point. Conversely a nonintegrated economizer does not operate when the mechanical cooling system is operating. If outdoor conditions are not sufficiently favorable to allow 100% economizing, no economizing is used. A two-stage thermostat often controls a nonintegrated economizer. The first stage opens the economizer; the second stage locks out the economizer and turns on the mechanical cooling.
10
Types of Air-Handling Systems Supported The OA/E tool supports the following types of single-duct air handlers:
• Constant-air-volume systems
• Variable-air-volume (VAV) systems with no volume compensation (i.e., outside-air intake is a constant fraction of the supply-air flow rate rather than changing it to maintain a constant outside-air volume).
Air handlers that the OA/E tool does not support include:
• VAV systems that maintain constant outside-air volume flow through volumetric flow measurements (commonly using air-monitoring stations consisting of pitot-tube arrays)
• VAV systems that attempt to approximately provide constant outside-air volumetric flow
by increasing the outside-air fraction (opening the outside-air damper system) as the fan speed decreases
• Systems that utilize CO2-based outside-air control strategies
• Dual-duct air-handling systems.
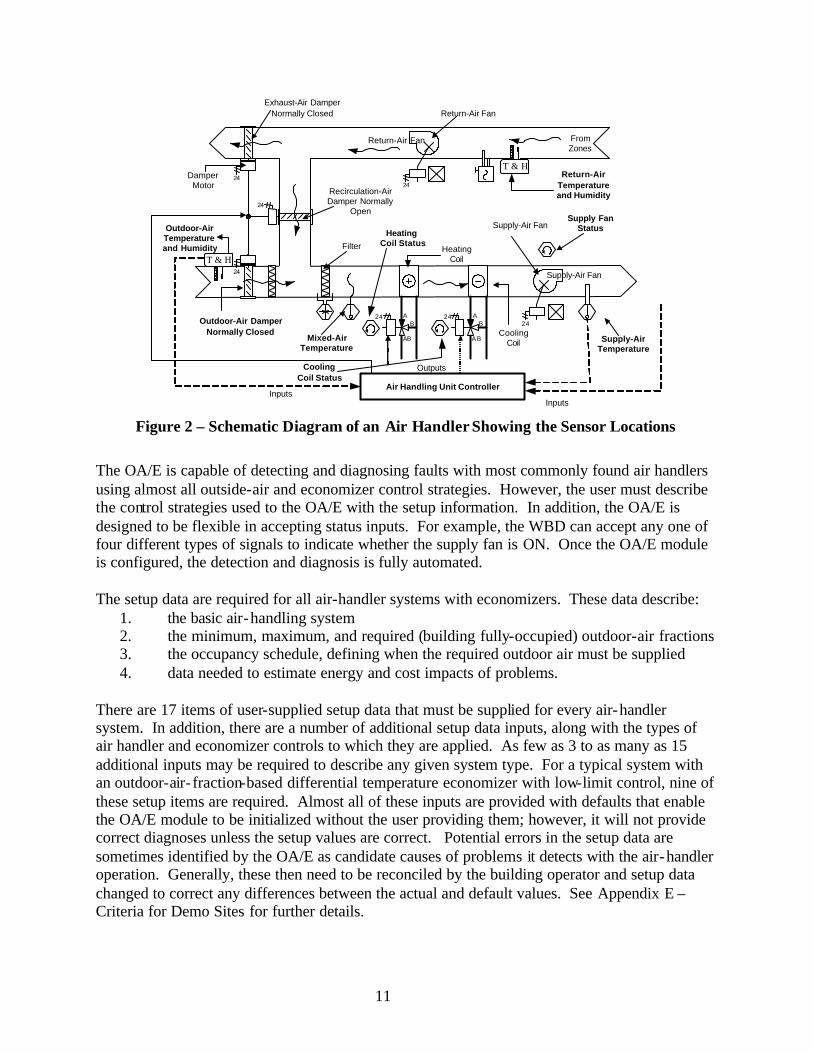
Metered Data Requirements for the OA/E Module The OA/E requires seven periodically measured/collected (currently at hourly increments) variables, as shown in Figure 2 (bold labels in the figure identify required data). In addition to the seven variables, the damper-position signal is also required for air handlers with damper-position signal control, i.e., if the damper-position signal is controlled directly to maintain the ventilation or to control the supply- or mixed-air temperatures when the air handler is economizing. For economizers with enthalpy-based control, outside- and return-air (only for differential enthalpy control) relative humidities or dew-point temperatures are required. If the supply- or mixed-air temperature set point is reset, the reset value at each hour is also needed.
Setup Data Requirements The OA/E module requires several one-time (setup or configuration) data inputs to characterize the existing systems and how they are controlled. In addition to the setup data, the OA/E also requires at least seven metered data points (same as variables called out in Figure 2 above). The engineering units for all inputs (both setup and measured) are assumed to be in Inch-Pound units unless otherwise specified.
11
Supply-Air Fan
AB
AB
AB
AB
24
24 2424
Return-Air Fan
2424
24
Exhaust-Air DamperNormally Closed
Recirculation-AirDamper Normally
Open
Return-Air Fan
Filter
Supply-Air Fan
T & H
Outdoor-Air DamperNormally Closed
DamperMotor
Outdoor-AirTemperatureand Humidity
Return-AirTemperatureand Humidity
T & H
Mixed-AirTemperature
HeatingCoil
CoolingCoil Supply-Air
Temperature
Air Handling Unit Controller
Outputs
Supply FanStatus
FromZones
InputsInputs
CoolingCoil Status
HeatingCoil Status
Figure 2 – Schematic Diagram of an Air Handler Showing the Sensor Locations
The OA/E is capable of detecting and diagnosing faults with most commonly found air handlers using almost all outside-air and economizer control strategies. However, the user must describe the control strategies used to the OA/E with the setup information. In addition, the OA/E is designed to be flexible in accepting status inputs. For example, the WBD can accept any one of four different types of signals to indicate whether the supply fan is ON. Once the OA/E module is configured, the detection and diagnosis is fully automated. The setup data are required for all air-handler systems with economizers. These data describe:
1. the basic air-handling system 2. the minimum, maximum, and required (building fully-occupied) outdoor-air fractions 3. the occupancy schedule, defining when the required outdoor air must be supplied 4. data needed to estimate energy and cost impacts of problems.
There are 17 items of user-supplied setup data that must be supplied for every air-handler system. In addition, there are a number of additional setup data inputs, along with the types of air handler and economizer controls to which they are applied. As few as 3 to as many as 15 additional inputs may be required to describe any given system type. For a typical system with an outdoor-air- fraction-based differential temperature economizer with low-limit control, nine of these setup items are required. Almost all of these inputs are provided with defaults that enable the OA/E module to be initialized without the user providing them; however, it will not provide correct diagnoses unless the setup values are correct. Potential errors in the setup data are sometimes identified by the OA/E as candidate causes of problems it detects with the air-handler operation. Generally, these then need to be reconciled by the building operator and setup data changed to correct any differences between the actual and default values. See Appendix E – Criteria for Demo Sites for further details.
12
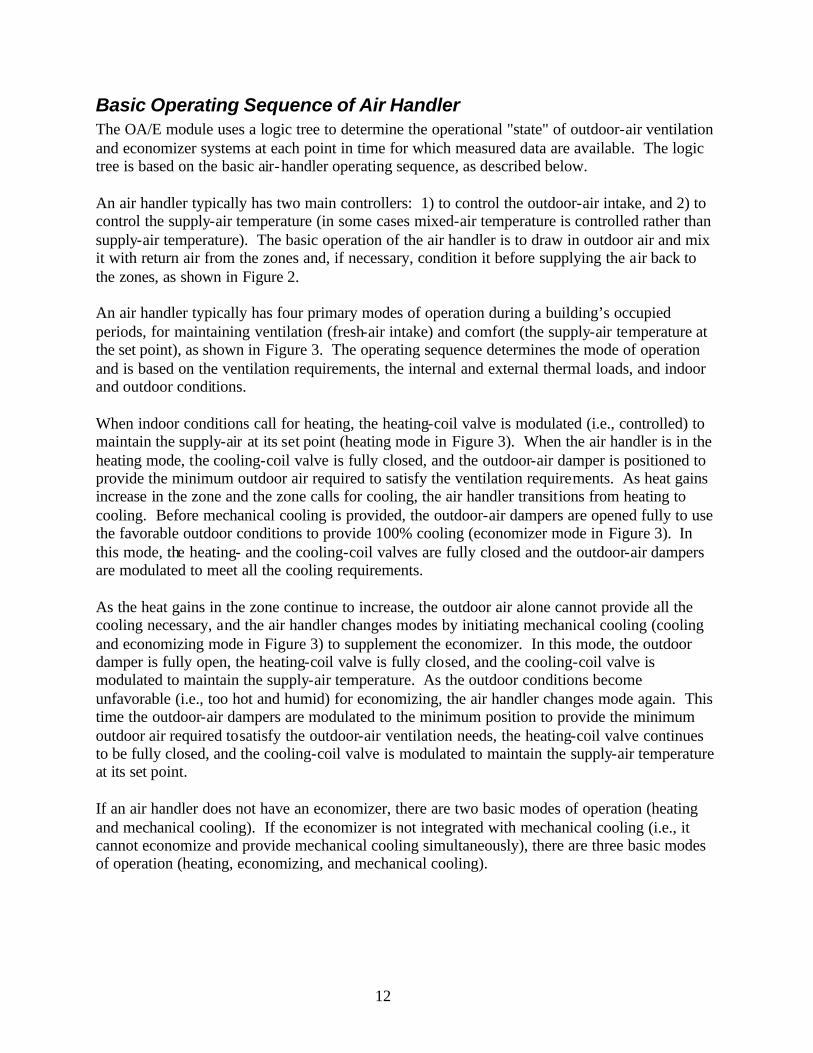
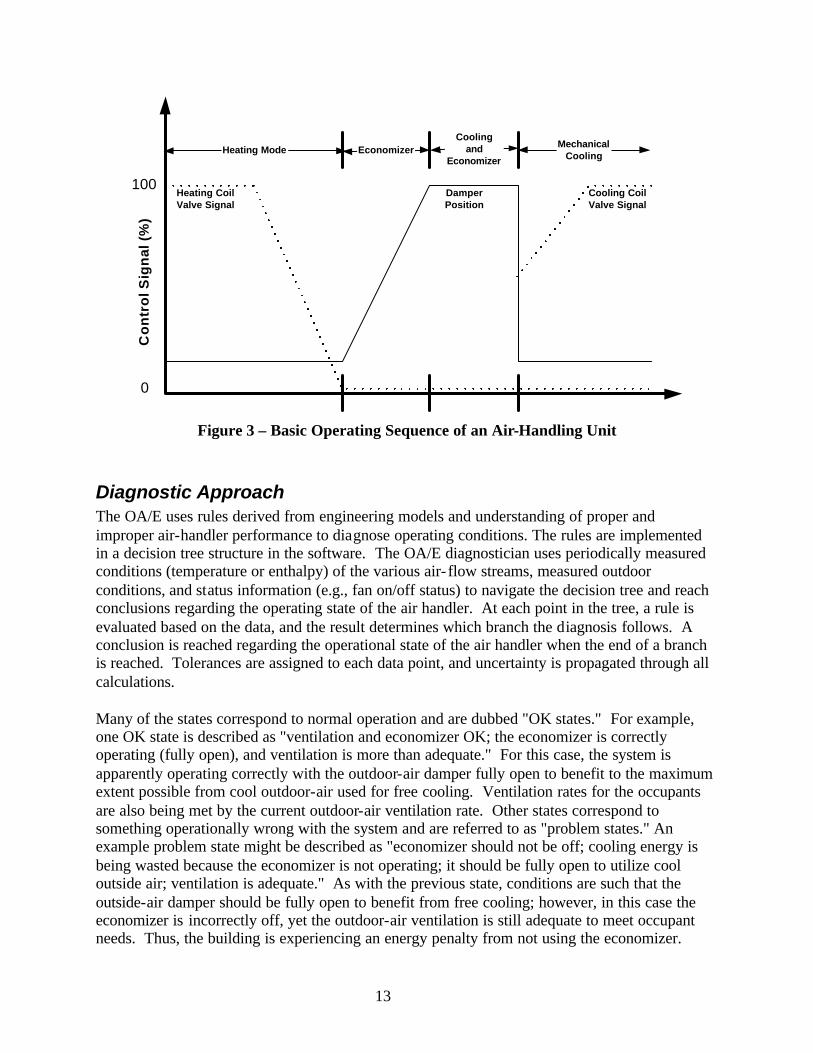
Basic Operating Sequence of Air Handler The OA/E module uses a logic tree to determine the operational "state" of outdoor-air ventilation and economizer systems at each point in time for which measured data are available. The logic tree is based on the basic air-handler operating sequence, as described below. An air handler typically has two main controllers: 1) to control the outdoor-air intake, and 2) to control the supply-air temperature (in some cases mixed-air temperature is controlled rather than supply-air temperature). The basic operation of the air handler is to draw in outdoor air and mix it with return air from the zones and, if necessary, condition it before supplying the air back to the zones, as shown in Figure 2. An air handler typically has four primary modes of operation during a building’s occupied periods, for maintaining ventilation (fresh-air intake) and comfort (the supply-air temperature at the set point), as shown in Figure 3. The operating sequence determines the mode of operation and is based on the ventilation requirements, the internal and external thermal loads, and indoor and outdoor conditions. When indoor conditions call for heating, the heating-coil valve is modulated (i.e., controlled) to maintain the supply-air at its set point (heating mode in Figure 3). When the air handler is in the heating mode, the cooling-coil valve is fully closed, and the outdoor-air damper is positioned to provide the minimum outdoor air required to satisfy the ventilation requirements. As heat gains increase in the zone and the zone calls for cooling, the air handler transitions from heating to cooling. Before mechanical cooling is provided, the outdoor-air dampers are opened fully to use the favorable outdoor conditions to provide 100% cooling (economizer mode in Figure 3). In this mode, the heating- and the cooling-coil valves are fully closed and the outdoor-air dampers are modulated to meet all the cooling requirements. As the heat gains in the zone continue to increase, the outdoor air alone cannot provide all the cooling necessary, and the air handler changes modes by initiating mechanical cooling (cooling and economizing mode in Figure 3) to supplement the economizer. In this mode, the outdoor damper is fully open, the heating-coil valve is fully closed, and the cooling-coil valve is modulated to maintain the supply-air temperature. As the outdoor conditions become unfavorable (i.e., too hot and humid) for economizing, the air handler changes mode again. This time the outdoor-air dampers are modulated to the minimum position to provide the minimum outdoor air required tosatisfy the outdoor-air ventilation needs, the heating-coil valve continues to be fully closed, and the cooling-coil valve is modulated to maintain the supply-air temperature at its set point. If an air handler does not have an economizer, there are two basic modes of operation (heating and mechanical cooling). If the economizer is not integrated with mechanical cooling (i.e., it cannot economize and provide mechanical cooling simultaneously), there are three basic modes of operation (heating, economizing, and mechanical cooling).
13
Heating CoilValve Signal
Cooling CoilValve Signal
DamperPosition
EconomizerCooling
andEconomizer
Heating ModeMechanical
CoolingC
on
tro
l Sig
nal
(%
)
100
0
Figure 3 – Basic Operating Sequence of an Air-Handling Unit
Diagnostic Approach The OA/E uses rules derived from engineering models and understanding of proper and improper air-handler performance to diagnose operating conditions. The rules are implemented in a decision tree structure in the software. The OA/E diagnostician uses periodically measured conditions (temperature or enthalpy) of the various air- flow streams, measured outdoor conditions, and status information (e.g., fan on/off status) to navigate the decision tree and reach conclusions regarding the operating state of the air handler. At each point in the tree, a rule is evaluated based on the data, and the result determines which branch the diagnosis follows. A conclusion is reached regarding the operational state of the air handler when the end of a branch is reached. Tolerances are assigned to each data point, and uncertainty is propagated through all calculations. Many of the states correspond to normal operation and are dubbed "OK states." For example, one OK state is described as "ventilation and economizer OK; the economizer is correctly operating (fully open), and ventilation is more than adequate." For this case, the system is apparently operating correctly with the outdoor-air damper fully open to benefit to the maximum extent possible from cool outdoor-air used for free cooling. Ventilation rates for the occupants are also being met by the current outdoor-air ventilation rate. Other states correspond to something operationally wrong with the system and are referred to as "problem states." An example problem state might be described as "economizer should not be off; cooling energy is being wasted because the economizer is not operating; it should be fully open to utilize cool outside air; ventilation is adequate." As with the previous state, conditions are such that the outside-air damper should be fully open to benefit from free cooling; however, in this case the economizer is incorrectly off, yet the outdoor-air ventilation is still adequate to meet occupant needs. Thus, the building is experiencing an energy penalty from not using the economizer.
14
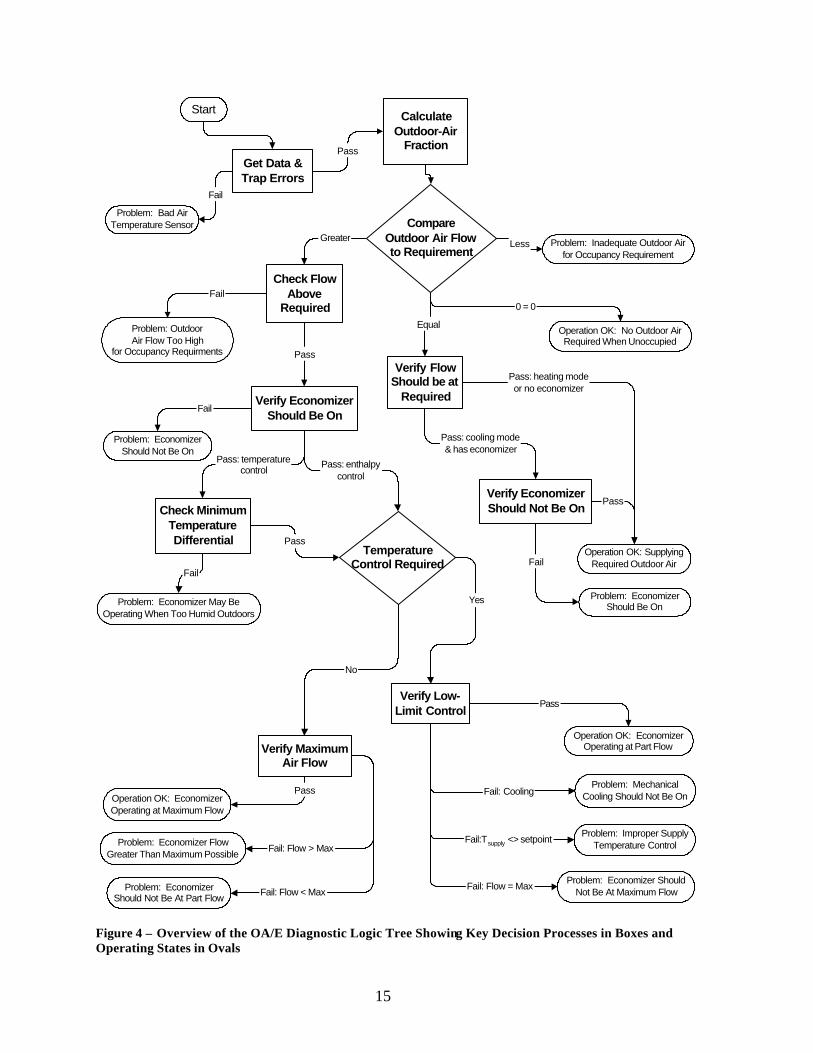
Other states (both OK and problem) may be tagged as incomplete diagnoses, if critical data are missing or results are too uncertain to reasonably reach a conclusion. Each problem state known by the OA/E module has an associated list of possible failures that could have caused the state; these are identified as possible causes. In the example above, a stuck outdoor-air damper, an economizer controller failure, or perhaps a misconfigured setup could cause the economizer to be off. Thus, at each metered time period, a list of possible causes is generated. An overview of the logic tree used to identify operational states and to build the lists of possible failures is illustrated in Figure 4. The boxes represent major sub-processes necessary to determine the operating state of the air handler; diamonds represent tests (decisions), and ovals represent end states and contain brief descriptions of OK and problem states. Only selected end states are shown in this overview, and the details of processes and decisions are excluded because of space constraints.
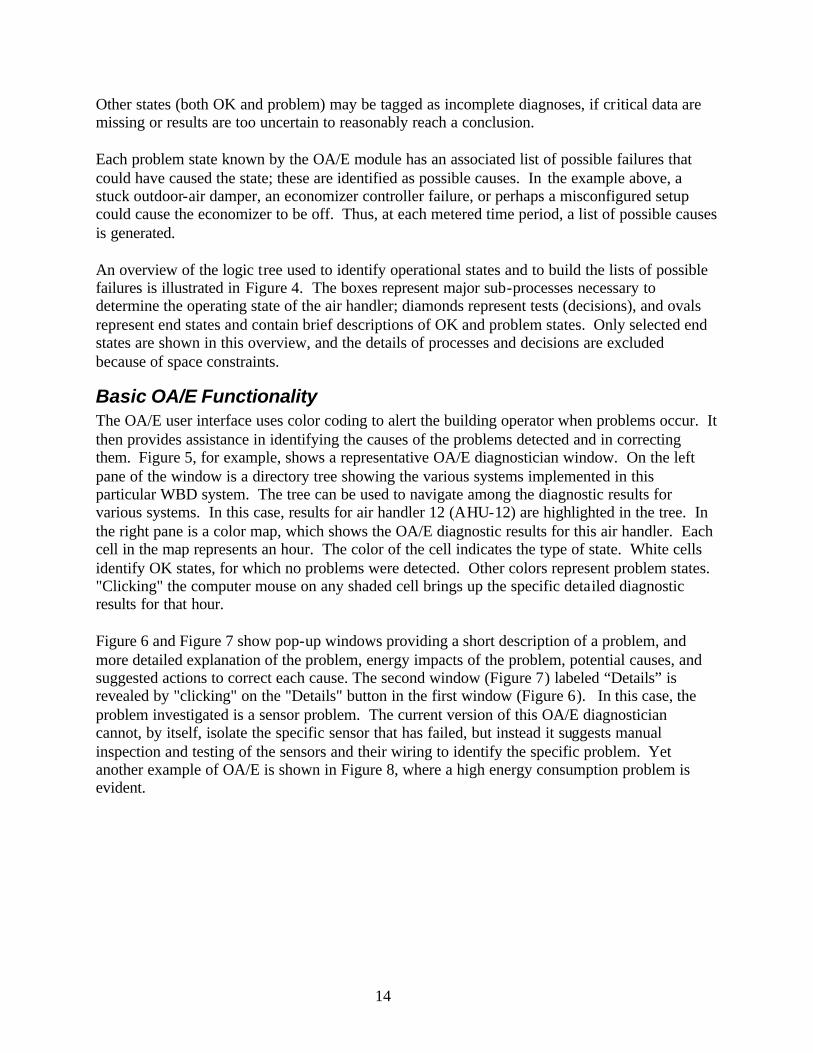
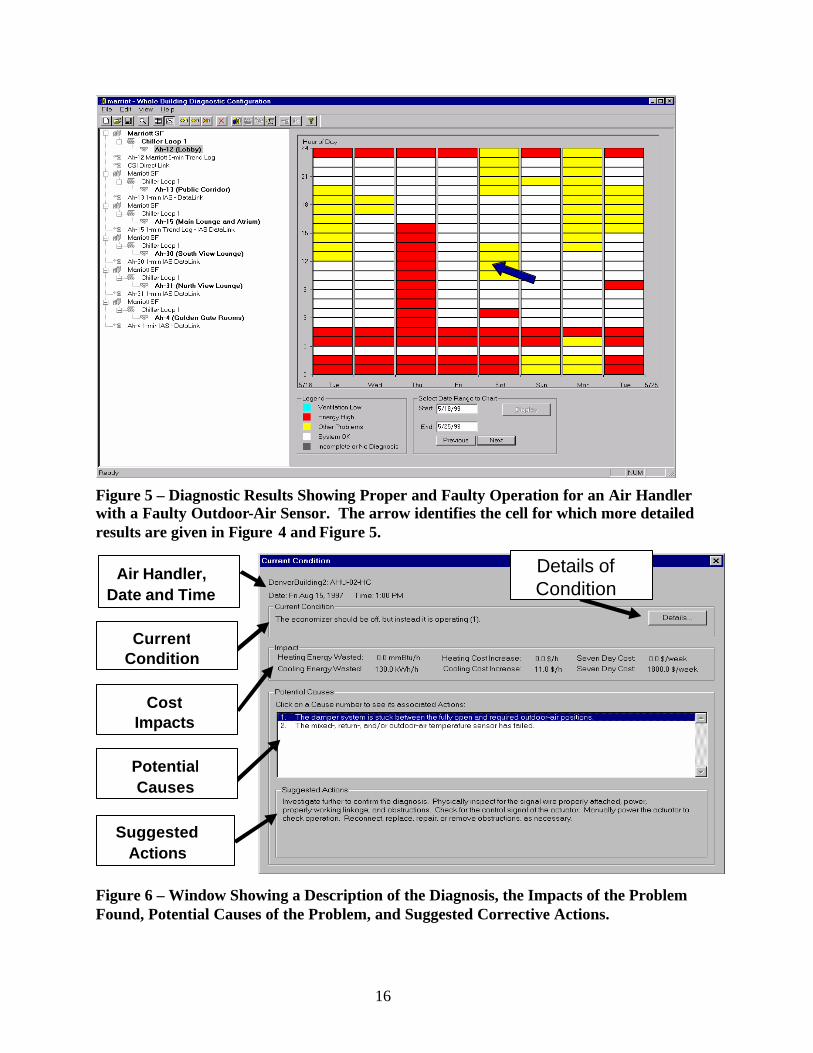
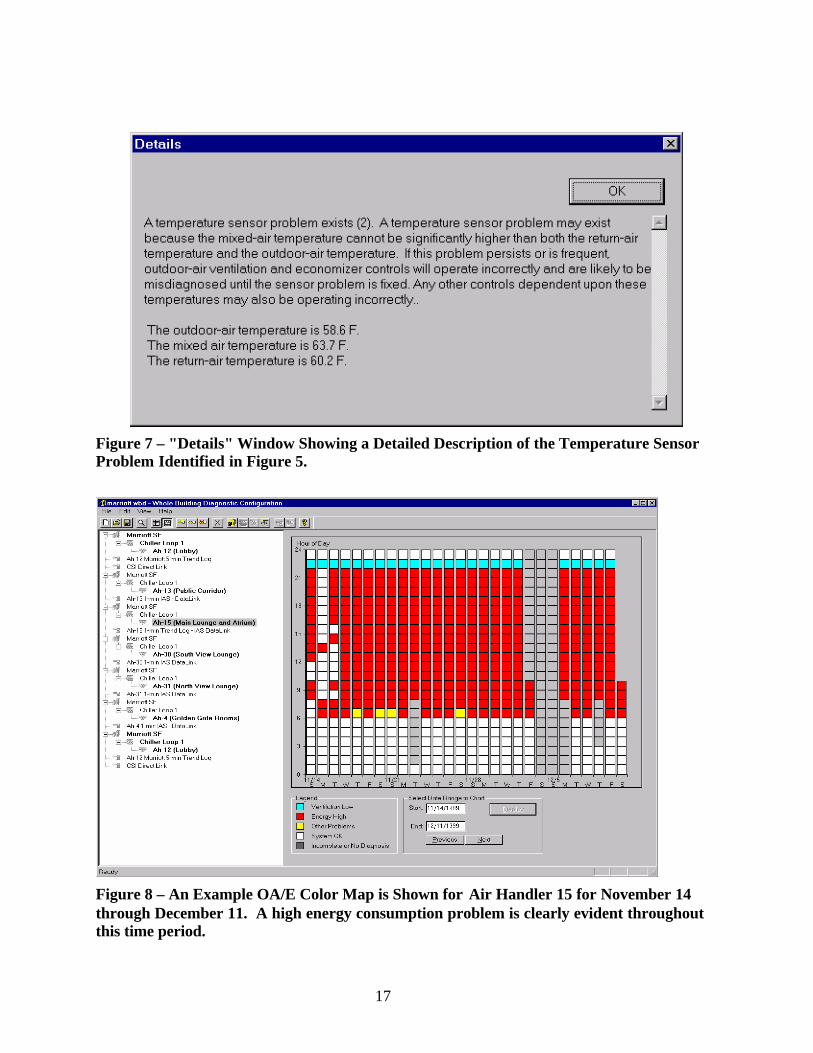
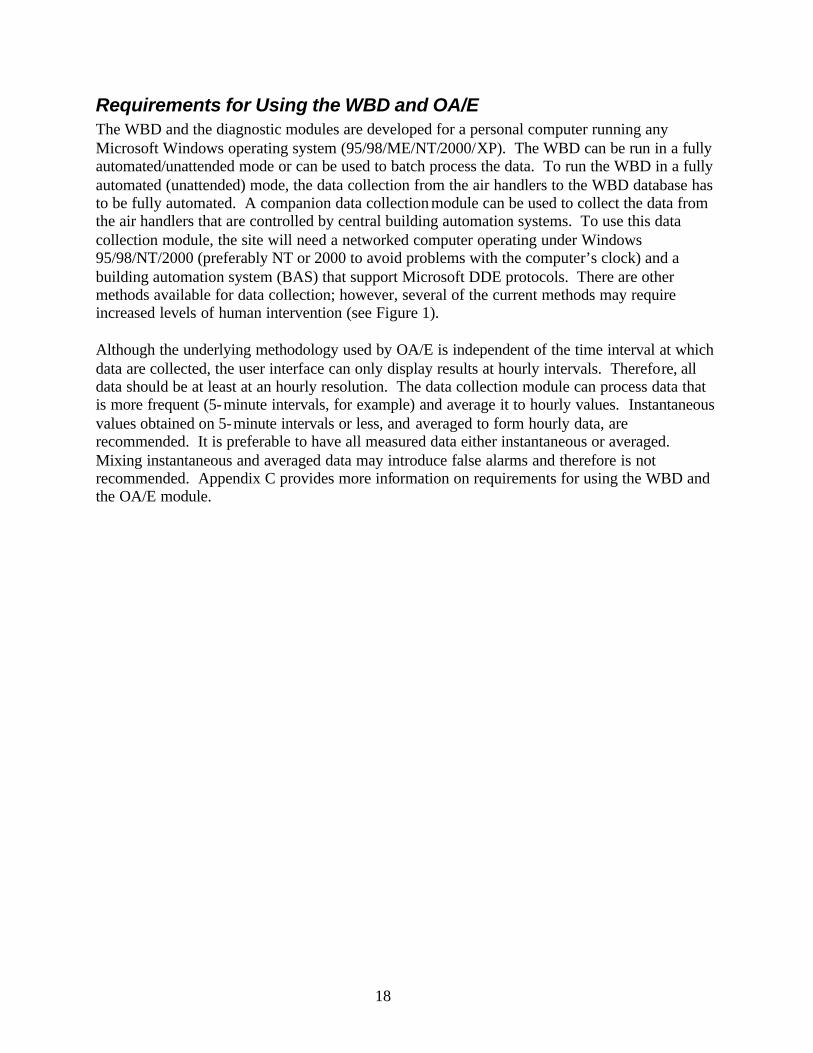
Basic OA/E Functionality The OA/E user interface uses color coding to alert the building operator when problems occur. It then provides assistance in identifying the causes of the problems detected and in correcting them. Figure 5, for example, shows a representative OA/E diagnostician window. On the left pane of the window is a directory tree showing the various systems implemented in this particular WBD system. The tree can be used to navigate among the diagnostic results for various systems. In this case, results for air handler 12 (AHU-12) are highlighted in the tree. In the right pane is a color map, which shows the OA/E diagnostic results for this air handler. Each cell in the map represents an hour. The color of the cell indicates the type of state. White cells identify OK states, for which no problems were detected. Other colors represent problem states. "Clicking" the computer mouse on any shaded cell brings up the specific detailed diagnostic results for that hour. Figure 6 and Figure 7 show pop-up windows providing a short description of a problem, and more detailed explanation of the problem, energy impacts of the problem, potential causes, and suggested actions to correct each cause. The second window (Figure 7) labeled “Details” is revealed by "clicking" on the "Details" button in the first window (Figure 6). In this case, the problem investigated is a sensor problem. The current version of this OA/E diagnostician cannot, by itself, isolate the specific sensor that has failed, but instead it suggests manual inspection and testing of the sensors and their wiring to identify the specific problem. Yet another example of OA/E is shown in Figure 8, where a high energy consumption problem is evident.
15
CalculateOutdoor-Air
FractionGet Data &Trap Errors
Check MinimumTemperatureDifferential
Verify FlowShould be at
Required
Equal
Check FlowAbove
Required
Greater
Verify EconomizerShould Not Be On
Pass
Pass: cooling mode& has economizer
Pass: temperaturecontrol
Pass
Problem: Inadequate Outdoor Airfor Occupancy Requirement
Less
Problem: EconomizerShould Be On
Fail
Problem: EconomizerShould Not Be On
Fail
Pass: heating modeor no economizer
Problem: Economizer May BeOperating When Too Humid Outdoors
Fail
Verify EconomizerShould Be On
Problem: OutdoorAir Flow Too High
for Occupancy Requirments
Fail
TemperatureControl Required
Operation OK: EconomizerOperating at Part Flow
Fail: Flow < Max
Problem: Economizer FlowGreater Than Maximum Possible
Fail: Flow > Max
No
Operation OK: EconomizerOperating at Maximum Flow
Pass
Pass
Yes
Pass
Problem: Economizer ShouldNot Be At Maximum Flow
Fail: Flow = Max
Problem: Improper SupplyTemperature Control
Problem: MechanicalCooling Should Not Be OnFail: Cooling
Fail:Tsupply <> setpoint
Verify Low-Limit Control
Pass
Verify MaximumAir Flow
Start
Problem: Bad AirTemperature Sensor
Fail
Operation OK: No Outdoor AirRequired When Unoccupied
0 = 0
CompareOutdoor Air Flowto Requirement
Operation OK: SupplyingRequired Outdoor Air
Pass: enthalpycontrol
Problem: EconomizerShould Not Be At Part Flow
Figure 4 – Overview of the OA/E Diagnostic Logic Tree Showing Key Decision Processes in Boxes and Operating States in Ovals
16
Figure 5 – Diagnostic Results Showing Proper and Faulty Operation for an Air Handler with a Faulty Outdoor-Air Sensor. The arrow identifies the cell for which more detailed results are given in Figure 4 and Figure 5.
Figure 6 – Window Showing a Description of the Diagnosis, the Impacts of the Problem Found, Potential Causes of the Problem, and Suggested Corrective Actions.
Details of Condition
Current Condition
Air Handler, Date and Time
Potential Causes
Suggested Actions
Cost Impacts
17
Figure 7 – "Details" Window Showing a Detailed Description of the Temperature Sensor Problem Identified in Figure 5.
Figure 8 – An Example OA/E Color Map is Shown for Air Handler 15 for November 14 through December 11. A high energy consumption problem is clearly evident throughout this time period.
18
Requirements for Using the WBD and OA/E The WBD and the diagnostic modules are developed for a personal computer running any Microsoft Windows operating system (95/98/ME/NT/2000/XP). The WBD can be run in a fully automated/unattended mode or can be used to batch process the data. To run the WBD in a fully automated (unattended) mode, the data collection from the air handlers to the WBD database has to be fully automated. A companion data collection module can be used to collect the data from the air handlers that are controlled by central building automation systems. To use this data collection module, the site will need a networked computer operating under Windows 95/98/NT/2000 (preferably NT or 2000 to avoid problems with the computer’s clock) and a building automation system (BAS) that support Microsoft DDE protocols. There are other methods available for data collection; however, several of the current methods may require increased levels of human intervention (see Figure 1). Although the underlying methodology used by OA/E is independent of the time interval at which data are collected, the user interface can only display results at hourly intervals. Therefore, all data should be at least at an hourly resolution. The data collection module can process data that is more frequent (5-minute intervals, for example) and average it to hourly values. Instantaneous values obtained on 5-minute intervals or less, and averaged to form hourly data, are recommended. It is preferable to have all measured data either instantaneous or averaged. Mixing instantaneous and averaged data may introduce false alarms and therefore is not recommended. Appendix C provides more information on requirements for using the WBD and the OA/E module.
19
Demonstration of the WBD at FAA-Denver Facilities The initial exposure of FAA-Denver to the WBD concept occurred at a FEMP conference in Seattle, Washington in August 1998. The newly-developed WBD was the subject of a poster-session, at which its capabilities were explained and demonstrated. Mr. Ed Whalen, Systems Specialist and FAA’s Energy Coordinator for its Denver International Airport facilities, expressed interest in trying out the WBD. Pacific Northwest National Laboratory (PNNL) completed testing of the WBD in the fall of 1998 and DOE began actively seeking a few demonstration sites in January 1999. A New Technology Demonstration Program project to demonstrate the WBD at a Federal facility was approved by FEMP in October 1999, after which contact was reestablished with Mr. Whalen. Discussions were begun with FAA about a demonstration project, and the general suitability of several air handlers at FAA-Denver buildings was established by January 2000. Normally, a sample of sensor data collected using a site’s control system trend logging capability is obtained prior to installation to verify that the control strategies and sensors are compatible with the WBD’s capabilities. Because the staff at FAA-Denver were unable to collect this data in timely fashion, the decision was made to proceed without this offline test. Installation of the WBD, originally scheduled for late February 2000, was not completed until May. Although the demonstration was limited to three AHUs, this number is sufficient to demonstrate the WBD’s capabilities and also to provide trends on the maintenance practices at the facility.
Demonstration Facility Characteristics The WBD was installed at two building at the demonstration site. The first building that was part of this demonstration project is the three-story administration office at the base of the air traffic control tower (ATCT Base). Although the control tower has four air handlers, security restrictions did not allow for those to be monitored using the WBD because they serve critical functions of air traffic safety. The second building was the traffic control (TRACON) building, which has two large air handlers serving the conditioned space. Security concerns similarly limited that installation to the two air handlers that serve general office space. A summary of general building information and the three air handlers is described in Table 1 below. All air handlers involved are variable-air-volume (inlet vane control) served with chilled water from central chillers. They have heating coils, but these are not used. Heating is provided at the terminal units rather than at the air handlers.
20
Table 1 – Characteristics of FAA-Denver Buildings and Air Handlers as Initially Reported by FAA-Denver
Bldg. Name
Bldg. Floor Area (ft2)
Heating/Cooling System
No. Air Handlers
Total (Demo)
Demo Air Handler
Flow Rate
(ft3/min)
Econo-mizer Type
Control System
ATCT Base 26,000
60-ton reciprocating chillers chilled-water distribution VAV system with terminal gas heat from natural gas
4 (1) 18,000 differential temper-ature
Johnson MetaSys
TRACON 67,000
200-ton centrifugal chillers chilled-water distribution VAV system with terminal heat from natural gas
5 (2) 18,800 18,600
differential temper-ature
Johnson MetaSys
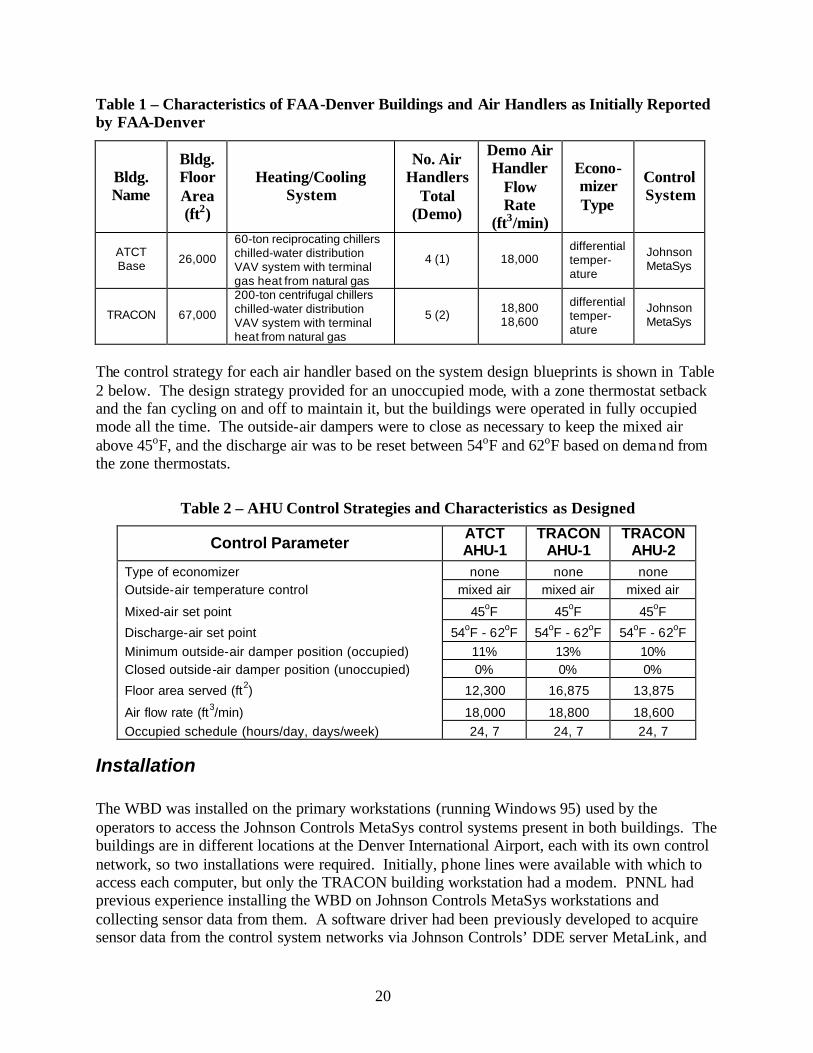
The control strategy for each air handler based on the system design blueprints is shown in Table 2 below. The design strategy provided for an unoccupied mode, with a zone thermostat setback and the fan cycling on and off to maintain it, but the buildings were operated in fully occupied mode all the time. The outside-air dampers were to close as necessary to keep the mixed air above 45oF, and the discharge air was to be reset between 54oF and 62oF based on demand from the zone thermostats.
Table 2 – AHU Control Strategies and Characteristics as Designed
Control Parameter ATCT AHU-1
TRACON AHU-1
TRACON AHU-2
Type of economizer none none none Outside-air temperature control mixed air mixed air mixed air
Mixed-air set point 45oF 45oF 45oF
Discharge-air set point 54oF - 62oF 54oF - 62oF 54oF - 62oF Minimum outside-air damper position (occupied) 11% 13% 10% Closed outside-air damper position (unoccupied) 0% 0% 0%
Floor area served (ft2) 12,300 16,875 13,875
Air flow rate (ft3/min) 18,000 18,800 18,600 Occupied schedule (hours/day, days/week) 24, 7 24, 7 24, 7
Installation The WBD was installed on the primary workstations (running Windows 95) used by the operators to access the Johnson Controls MetaSys control systems present in both buildings. The buildings are in different locations at the Denver International Airport, each with its own control network, so two installations were required. Initially, phone lines were available with which to access each computer, but only the TRACON building workstation had a modem. PNNL had previous experience installing the WBD on Johnson Controls MetaSys workstations and collecting sensor data from them. A software driver had been previously developed to acquire sensor data from the control system networks via Johnson Controls’ DDE server MetaLink, and
21
had been employed successfully at three office buildings for a period of about 1 year. This eliminated the need to write and test a new data access driver as part of the project, reducing both the expense and risk associated with obtaining data directly from the sensors/controllers. (It generally takes up to 2 weeks of labor to create a new driver, and there are sometimes ongoing issues with making them work reliably with some control systems.) By installing the WBD on the operator’s control workstations, the WBD results were available in a relatively familiar environment. Operators needed to exit the MetaSys display system to get to the computer’s Windows “desktop,” where the icons for the WBD, MetaLink, and the drivers Baslink and Baslinkd were all available. They could access the WBD user interface by simply clicking on the icon or the job on the Windows taskbar. They also could restart MetaLink or the drivers by simply clicking on them (all needed to be running for data to be collected into the WBD database), or check the status of each by clicking the respective jobs on the taskbar. These processes were added to the computers’ startup procedure so they always were restarted when computer was booted. Exiting the MetaSys display was not a common procedure; however, the MetaSys display was normally always on and some operators were not familiar with the concept of the desktop because the computers were not used for anything other than MetaSys before the WBD was installed. The FAA did not report any interference by the WBD with control system operations, although some system clock drift was subsequently noted in later WBD installations with Windows 95 and 98 operating systems. Installation of the WBD was initiated with a 1/2-day site visit in late February 2000, but the installation was not completed because a key driver for general database access (Data Object Access) was not present on the host computers. It was subsequently added to the WBD installation CD-ROM for the next site visit. Because FAA had not yet been able to purchase and install remote access software for its workstations, a second site visit was required to complete the installation. In addition, it was established during the first site visit that four critical sensor points required by the OA/E diagnostician were not available via MetaLink: the fan speed, the outside-air damper position, and the chilled and hot water valve positions. Using MetaSys to browse the control system, these points were found as computed variables but were not defined as control points, so MetaLink did not know of their existence. An experienced Johnson Controls user from PNNL facilities demonstrated how to map a computed variable as a control point, and this change was made to both MetaSys control systems during the second site visit. The second site visit occurred May 18-20, 2000, when a newer version of the WBD was reinstalled. This site visit required about 2 days of on-site labor. The OA/E diagnostician was set up for all three air handlers and data collection initiated. This involved:
• obtaining blueprints and other documentation of the control strategies and air flows intended by the system designer
• interviewing Mr. Whalen on the control strategies and the schedule of outside-air supply
22
• entering this information into the OA/E configuration for each air handler
• obtaining current electricity and gas costs and entering them into the WBD
• finding and entering network IP addresses for the workstations and entering them
• mapping and testing each of the OA/E’s sensor data inputs from the control system. The first installation required about 1 day of labor because some difficulty was encountered in establishing complete data flow at the ATCT building. As has been typical at other WBD installations, the subsequent air handlers took less than half a day because they were essentially clones of the first, using nearly identical control strategies, so the WBD configuration file could be copied and only needed minor changes. One of the three configuration screens is shown in Figure 9. Mr. Whalen subsequently reported by telephone that data collection had halted for the ATCT installation on May 27. A third site visit took place on June 1, 2000. During the third visit, an external modem had been installed for the ATCT workstation, and PNNL added PCAnywhere software allowing remote access to both installations (this is ordinarily expected of the demonstration site, but FAA could not do this readily). This software sets up the workstation to allow the operator to give permission for another computer to connect, view the display, and manipulate it with keyboard and mouse as if actually present. To maintain security, the telephone line was left unconnected except during a remote session when the software was manually enabled temporarily to host it. The burden of the installation effort, in particular when it involves travel by PNNL staff, is perhaps the most significant barrier to more widespread deployment of the WBD. Establishing data flow is particularly vexing in many instances, often requiring a return visit. This adds considerable cost, but until a broad set of solutions are worked out, similar difficulties should be anticipated. However, once effective data processing and an example OA/E configuration have been established for a given building or facility, deployment to additional air handlers has been shown to proceed rapidly. To date, no facility has yet undertaken this with one of their own staff; this seems possible if the person is a relatively savvy computer user. Widespread deployments of the WBD within a Federal agency suggest that either a centralized expertise be developed in the form of a qualified, trained and motivated employee charged with helping sites with installation and configuration, or that this function might be provided by a contractor with control system expertise.
Training WBD training for the FAA Denver site staff occurred on June 2, 2000 as part of the third site visit, and included Mr. Whalen and three other system operators. Their supervisor also attended part of the training to become familiar with the project. The training included a PowerPoint overview of the WBD components, operational relationships and interactions, basic instructions on the setup control system data used by the OA/E diagnostic module, examples of the results, and possible corrective actions that are suggested by the WBD. Included was a “guided tour” of how to use the software, employing the user interface to browse diagnostic results and drill for
23
more detailed information, and how to interpret common OA/E messages describing problems. A copy of one of the FAA databases was used to view the actual FAA configuration and the problems that had already been discovered for the air handlers at FAA. Training and discussion lasted about 2 hours. Mr. Whalen was provided additional hands-on training, lasting about 2 hours, using the ATCT workstation. This included instruction on how to change the control strategy descriptions entered in the OA/E configuration, how to determine if data collection and OA/E diagnostic processes were proceeding normally, and how to restart them if they were not. Because no user’s manual or on-line help has been developed for the WBD, this presentation served as the only written user instructions.
Data Collection Continuous data collection began on May 18, 2000, for both air handlers in the TRACON building and on May 20, 2000, for the ATCT building. Data collection at the TRACON building was consistent and continuous, with minor exceptions. For one air handler (AHU-1) minor gaps in data collection occurred from August 18-21, 2000, and again from September 9 through 25, 2000. For the second air handler (AHU-2), a single larger data gap occurred from November 12, 2000, through January 4, 2001. The data collection at the ATCT building was problematic from the beginning. The first data gap occurred as a result of a corruption in the database on May 27, 2000, and was corrected during the site visit on June 1, 2000. The second and most significant gap in data collection began June 28, 2000, and was not corrected until January 4, 2001. The issue with the ATCT installation involved the WBD database “locking up” and halting data flow. This was presumably caused by a sharing violation that occurred when two of the WBD’s processes tried to access the database at the same time (the current version of the software doesn’t have the problem). This was supposedly prevented by the database access software itself, but there were circumstances with the ATCT’s workstation or control system (and was observed in some other WBD installations elsewhere) that allowed such a conflict to occur occasionally. When it did, it prevented writing new data to the database. At the time of the FAA demonstration, this problem was not understood, and provision for the WBD software to unlock databases had not been made yet. The only way to fix the problem was to use a Microsoft Access database software to read and restore the integrity of the database. Because the FAA workstations did not yet have Access software, the only way to unlock databases was to access the installation with PCAnywhere, download the entire database to a PNNL computer, open and repair them, and load them back to the FAA computer. Microsoft Access was installed by PNNL on the FAA computers for this purpose during a fourth site visit in January, 2001, and Mr. Whalen was shown how to use it to repair and unlock corrupted databases. However, such repairs did not occur except when PNNL staff would dial in remotely to check data processing and discover processing at ATCT had halted. Fortunately, sufficient data was collected for the ATCT air handler for its problems to be clearly diagnosed by the OA/E diagnostic module.
24
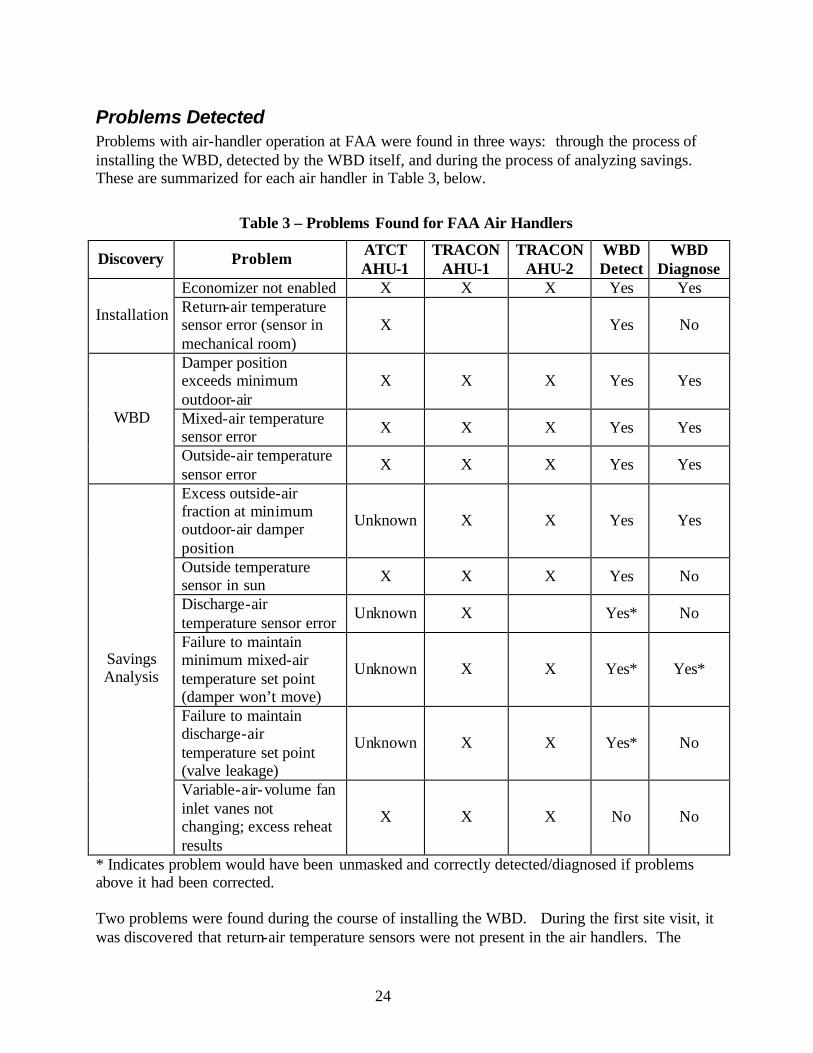
Problems Detected Problems with air-handler operation at FAA were found in three ways: through the process of installing the WBD, detected by the WBD itself, and during the process of analyzing savings. These are summarized for each air handler in Table 3, below.
Table 3 – Problems Found for FAA Air Handlers
Discovery Problem ATCT AHU-1
TRACON AHU-1
TRACON AHU-2
WBD Detect
WBD Diagnose
Economizer not enabled X X X Yes Yes
Installation Return-air temperature sensor error (sensor in mechanical room)
X Yes No
Damper position exceeds minimum outdoor-air
X X X Yes Yes
Mixed-air temperature sensor error X X X Yes Yes
WBD
Outside-air temperature sensor error
X X X Yes Yes
Excess outside-air fraction at minimum outdoor-air damper position
Unknown X X Yes Yes
Outside temperature sensor in sun X X X Yes No
Discharge-air temperature sensor error
Unknown X Yes* No
Failure to maintain minimum mixed-air temperature set point (damper won’t move)
Unknown X X Yes* Yes*
Failure to maintain discharge-air temperature set point (valve leakage)
Unknown X X Yes* No
Savings Analysis
Variable-air-volume fan inlet vanes not changing; excess reheat results
X X X No No
* Indicates problem would have been unmasked and correctly detected/diagnosed if problems above it had been corrected. Two problems were found during the course of installing the WBD. During the first site visit, it was discovered that return-air temperature sensors were not present in the air handlers. The
25
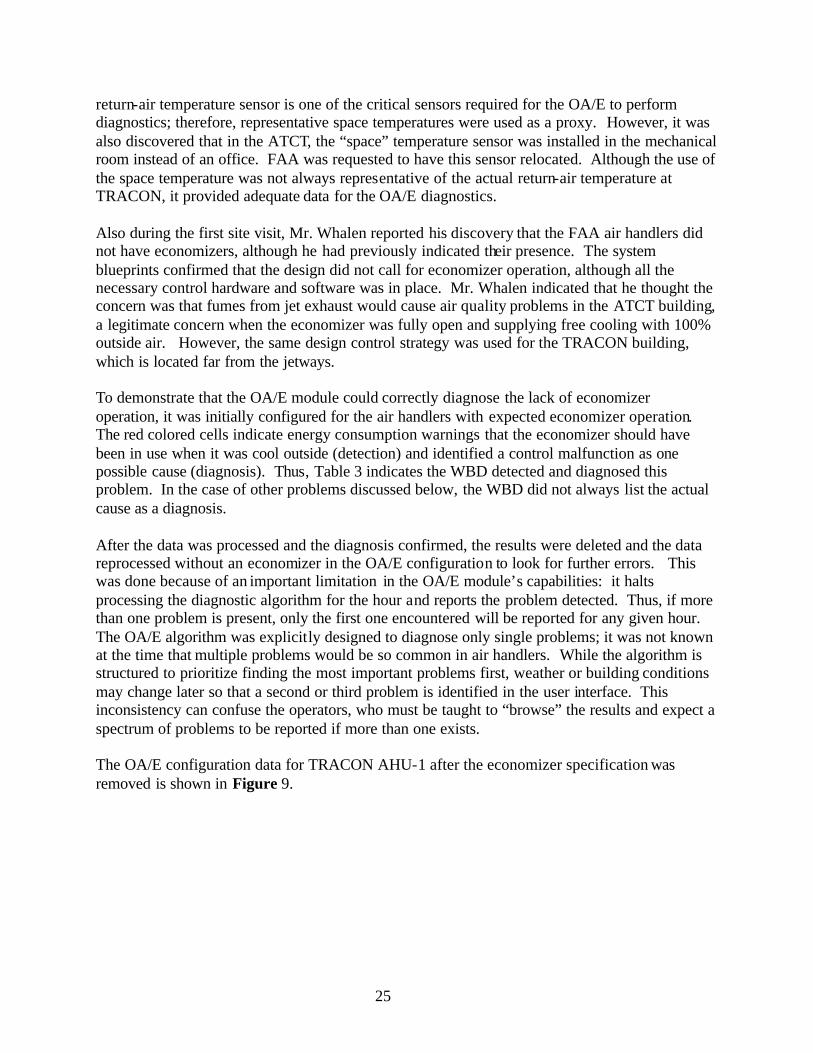
return-air temperature sensor is one of the critical sensors required for the OA/E to perform diagnostics; therefore, representative space temperatures were used as a proxy. However, it was also discovered that in the ATCT, the “space” temperature sensor was installed in the mechanical room instead of an office. FAA was requested to have this sensor relocated. Although the use of the space temperature was not always representative of the actual return-air temperature at TRACON, it provided adequate data for the OA/E diagnostics. Also during the first site visit, Mr. Whalen reported his discovery that the FAA air handlers did not have economizers, although he had previously indicated their presence. The system blueprints confirmed that the design did not call for economizer operation, although all the necessary control hardware and software was in place. Mr. Whalen indicated that he thought the concern was that fumes from jet exhaust would cause air quality problems in the ATCT building, a legitimate concern when the economizer was fully open and supplying free cooling with 100% outside air. However, the same design control strategy was used for the TRACON building, which is located far from the jetways. To demonstrate that the OA/E module could correctly diagnose the lack of economizer operation, it was initially configured for the air handlers with expected economizer operation. The red colored cells indicate energy consumption warnings that the economizer should have been in use when it was cool outside (detection) and identified a control malfunction as one possible cause (diagnosis). Thus, Table 3 indicates the WBD detected and diagnosed this problem. In the case of other problems discussed below, the WBD did not always list the actual cause as a diagnosis. After the data was processed and the diagnosis confirmed, the results were deleted and the data reprocessed without an economizer in the OA/E configuration to look for further errors. This was done because of an important limitation in the OA/E module’s capabilities: it halts processing the diagnostic algorithm for the hour and reports the problem detected. Thus, if more than one problem is present, only the first one encountered will be reported for any given hour. The OA/E algorithm was explicitly designed to diagnose only single problems; it was not known at the time that multiple problems would be so common in air handlers. While the algorithm is structured to prioritize finding the most important problems first, weather or building conditions may change later so that a second or third problem is identified in the user interface. This inconsistency can confuse the operators, who must be taught to “browse” the results and expect a spectrum of problems to be reported if more than one exists. The OA/E configuration data for TRACON AHU-1 after the economizer specification was removed is shown in Figure 9.
26
Figure 9 – TRACON Administration Building AHU-1 Configuration Screen
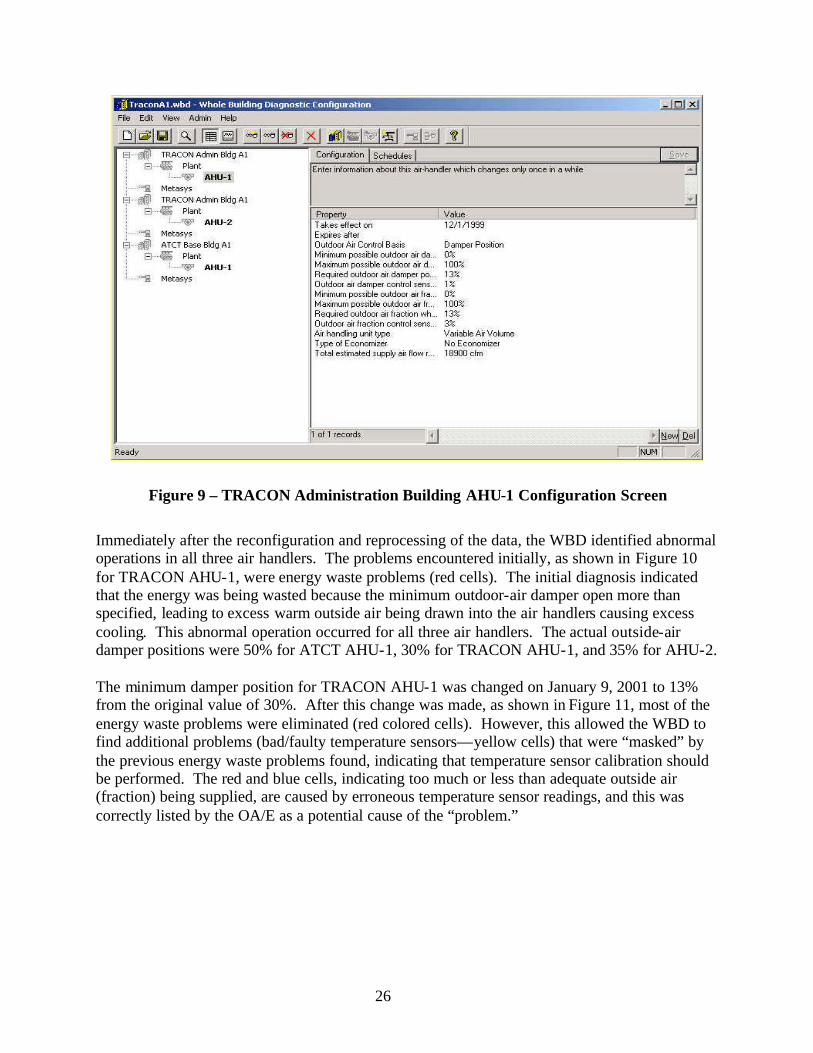
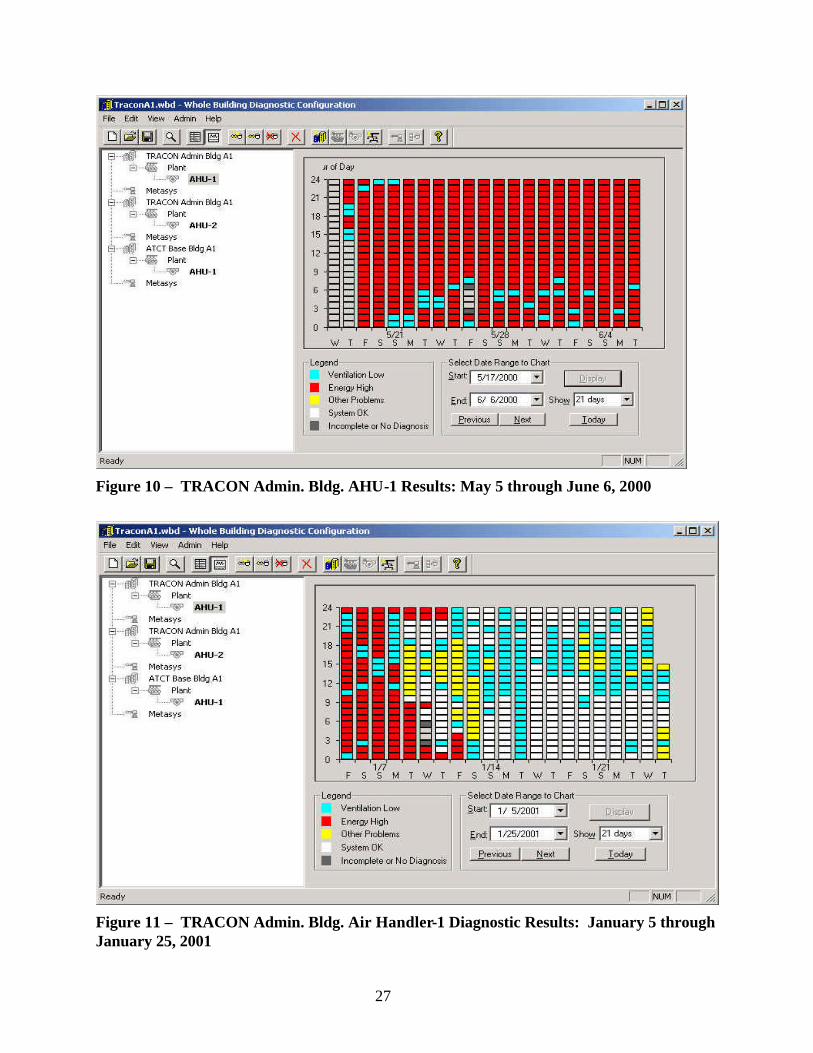
Immediately after the reconfiguration and reprocessing of the data, the WBD identified abnormal operations in all three air handlers. The problems encountered initially, as shown in Figure 10 for TRACON AHU-1, were energy waste problems (red cells). The initial diagnosis indicated that the energy was being wasted because the minimum outdoor-air damper open more than specified, leading to excess warm outside air being drawn into the air handlers causing excess cooling. This abnormal operation occurred for all three air handlers. The actual outside-air damper positions were 50% for ATCT AHU-1, 30% for TRACON AHU-1, and 35% for AHU-2. The minimum damper position for TRACON AHU-1 was changed on January 9, 2001 to 13% from the original value of 30%. After this change was made, as shown in Figure 11, most of the energy waste problems were eliminated (red colored cells). However, this allowed the WBD to find additional problems (bad/faulty temperature sensors—yellow cells) that were “masked” by the previous energy waste problems found, indicating that temperature sensor calibration should be performed. The red and blue cells, indicating too much or less than adequate outside air (fraction) being supplied, are caused by erroneous temperature sensor readings, and this was correctly listed by the OA/E as a potential cause of the “problem.”
27
Figure 10 – TRACON Admin. Bldg. AHU-1 Results: May 5 through June 6, 2000
Figure 11 – TRACON Admin. Bldg. Air Handler-1 Diagnostic Results: January 5 through January 25, 2001
28
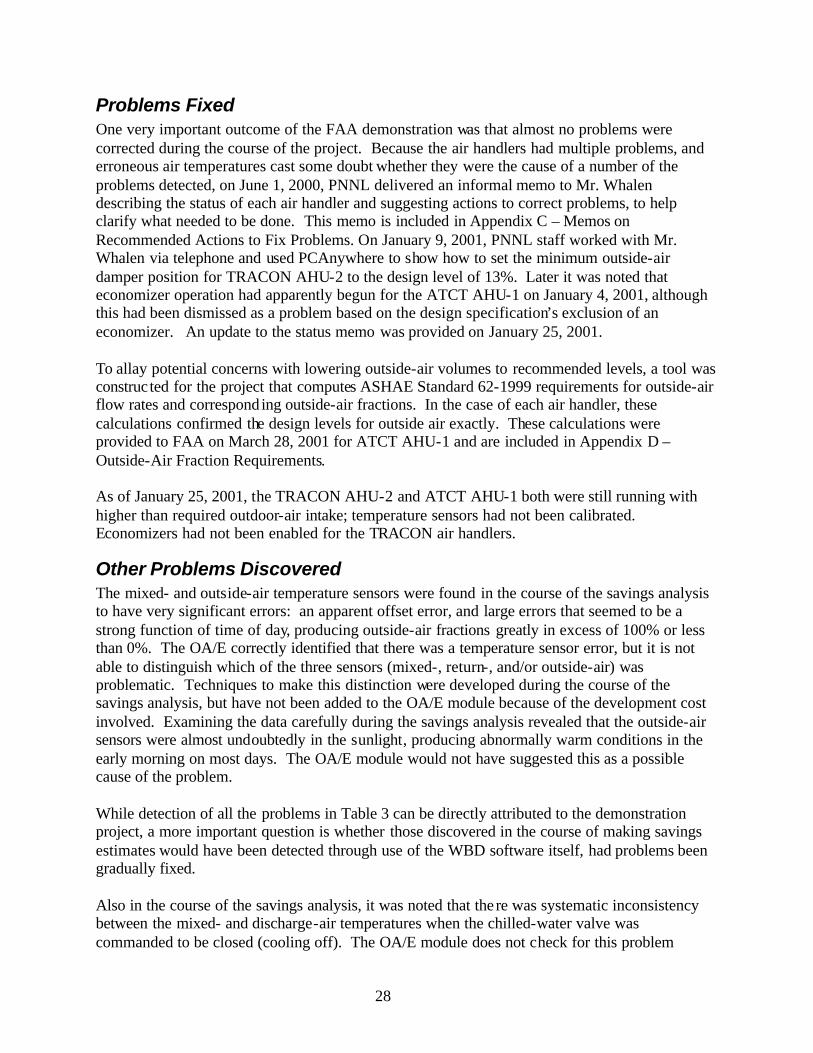
Problems Fixed One very important outcome of the FAA demonstration was that almost no problems were corrected during the course of the project. Because the air handlers had multiple problems, and erroneous air temperatures cast some doubt whether they were the cause of a number of the problems detected, on June 1, 2000, PNNL delivered an informal memo to Mr. Whalen describing the status of each air handler and suggesting actions to correct problems, to help clarify what needed to be done. This memo is included in Appendix C – Memos on Recommended Actions to Fix Problems. On January 9, 2001, PNNL staff worked with Mr. Whalen via telephone and used PCAnywhere to show how to set the minimum outside-air damper position for TRACON AHU-2 to the design level of 13%. Later it was noted that economizer operation had apparently begun for the ATCT AHU-1 on January 4, 2001, although this had been dismissed as a problem based on the design specification’s exclusion of an economizer. An update to the status memo was provided on January 25, 2001. To allay potential concerns with lowering outside-air volumes to recommended levels, a tool was construc ted for the project that computes ASHAE Standard 62-1999 requirements for outside-air flow rates and correspond ing outside-air fractions. In the case of each air handler, these calculations confirmed the design levels for outside air exactly. These calculations were provided to FAA on March 28, 2001 for ATCT AHU-1 and are included in Appendix D – Outside-Air Fraction Requirements. As of January 25, 2001, the TRACON AHU-2 and ATCT AHU-1 both were still running with higher than required outdoor-air intake; temperature sensors had not been calibrated. Economizers had not been enabled for the TRACON air handlers.
Other Problems Discovered The mixed- and outside-air temperature sensors were found in the course of the savings analysis to have very significant errors: an apparent offset error, and large errors that seemed to be a strong function of time of day, producing outside-air fractions greatly in excess of 100% or less than 0%. The OA/E correctly identified that there was a temperature sensor error, but it is not able to distinguish which of the three sensors (mixed-, return-, and/or outside-air) was problematic. Techniques to make this distinction were developed during the course of the savings analysis, but have not been added to the OA/E module because of the development cost involved. Examining the data carefully during the savings analysis revealed that the outside-air sensors were almost undoubtedly in the sunlight, producing abnormally warm conditions in the early morning on most days. The OA/E module would not have suggested this as a possible cause of the problem. While detection of all the problems in Table 3 can be directly attributed to the demonstration project, a more important question is whether those discovered in the course of making savings estimates would have been detected through use of the WBD software itself, had problems been gradually fixed. Also in the course of the savings analysis, it was noted that the re was systematic inconsistency between the mixed- and discharge-air temperatures when the chilled-water valve was commanded to be closed (cooling off). The OA/E module does not check for this problem
29
directly, but when it is configured to diagnose an economizer, it verifies that the discharge air is maintained at the set point temperature when the economizer is supplying all the cooling. The OA/E module has successfully identified this problem in this way at other installations, and undoubtedly would have done so here if problems had gradually been fixed. It does not correctly identify the cause, however. For TRACON AHU-2, it was noted that some of the red cells indicated that excess outside-air (fraction) being supplied (~60% consistently, at night), even though the damper position was only 35% (see Appendix C – Memos on Recommended Actions to Fix Problems), but this was noted by browsing the data rather than from the OA/E user interface. This same problem was noted for TRACON AHU-1; after the damper position was reduced to 13%, the outside-air fraction remained around 20%. The OA/E module checks the outside-air fraction after verifying the damper position is correct, and caught this error. However, the temperature sensor errors that were occurring made it hard to put faith in these results (because most of the diagnostics were based on the temperature sensors, any diagnostics other than temperature sensor error may not be reliable). If the sensor errors had been corrected, the problem would have been unequivocally evident from the OA/E user interface. A cold snap on November 11, 2000, evidently caused control system alarms to warn of a coil freeze-up because as mixed-air temperatures in TRACON AHU-2 approached 35oF and the outdoor-air damper did not close. Again, the OA/E module reported the damper position as open more than required and did not detect the malfunction in the mixed-air temperature control. It has done so in other situations, so it is projected that it would have done so here, as well. In fact, examining the data from all the air handlers shows the damper position starting to close when mixed-air temperatures dropped below about 40oF, but the outside-air fraction remains constant. It is strongly suspected that the dampers stuck or the damper actuators had been disconnected or had malfunctioned. These are all causes the OA/E module suggests when this problem is detected. Examination of the data also showed another problem with the air handlers – each of them had the variable-air-volume fan inlet vanes stay at a position near 45% nearly all the time except for very hot days. This suggests that the fans are probably oversized and therefore supply more air than is needed almost all the time. In systems like those at FAA, the terminal reheat coils will come on to compensate for this, wasting heating and cooling energy when an economizer is not employed. This conclusion is supported by the fact that the electric bills for ATCT were virtually constant year round (see Figure 12), and the gas bills were one-third of their peak winter level during the summer.
Savings Potential The estimation of savings potential from fixing the problems identified with the air handlers was calculated using a procedure documented in Appendix A – Savings Estimation Procedure. The details of this procedure are generally described as:
1. Analyze and correct temperature sensor errors in the measured sensor data.
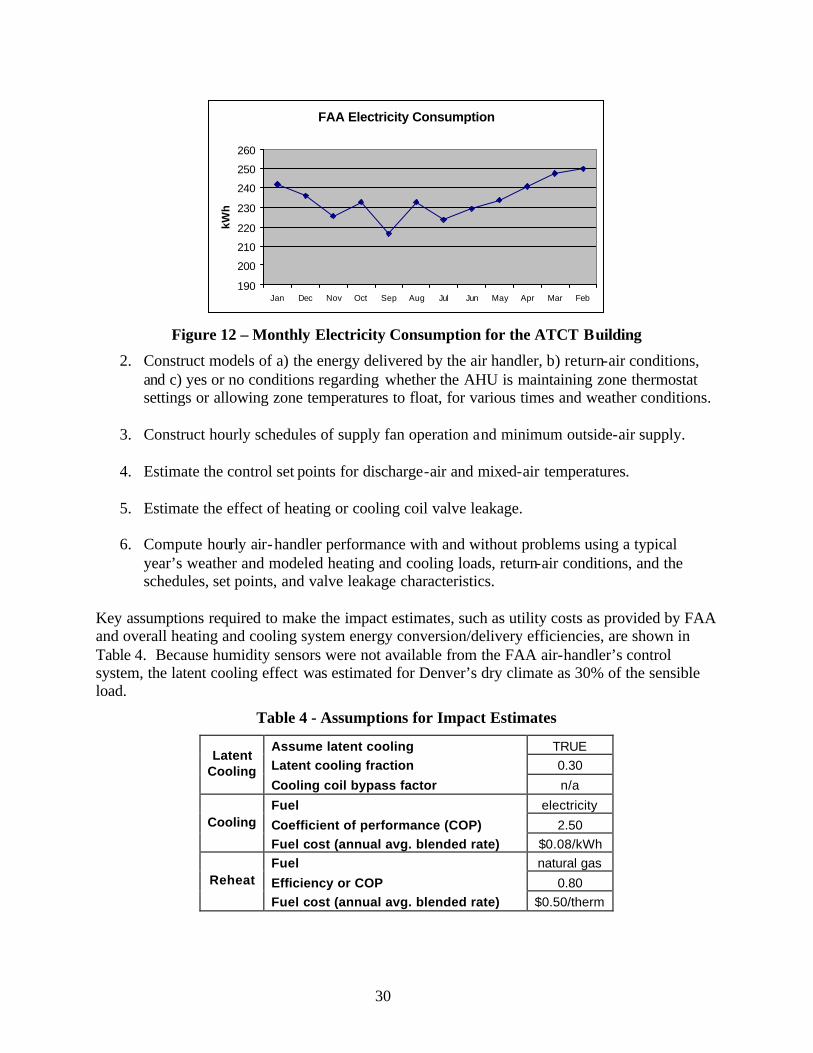
30
FAA Electricity Consumption
190
200
210
220
230
240
250
260
Jan Dec Nov Oct Sep Aug Jul Jun May Apr Mar Feb
kWh
Figure 12 – Monthly Electricity Consumption for the ATCT Building
2. Construct models of a) the energy delivered by the air handler, b) return-air conditions, and c) yes or no conditions regarding whether the AHU is maintaining zone thermostat settings or allowing zone temperatures to float, for various times and weather conditions.
3. Construct hourly schedules of supply fan operation and minimum outside-air supply.
4. Estimate the control set points for discharge-air and mixed-air temperatures.
5. Estimate the effect of heating or cooling coil valve leakage.
6. Compute hourly air-handler performance with and without problems using a typical year’s weather and modeled heating and cooling loads, return-air conditions, and the schedules, set points, and valve leakage characteristics.
Key assumptions required to make the impact estimates, such as utility costs as provided by FAA and overall heating and cooling system energy conversion/delivery efficiencies, are shown in Table 4. Because humidity sensors were not available from the FAA air-handler’s control system, the latent cooling effect was estimated for Denver’s dry climate as 30% of the sensible load.
Table 4 - Assumptions for Impact Estimates
Assume latent cooling TRUE Latent cooling fraction 0.30
Latent Cooling
Cooling coil bypass factor n/a
Fuel electricity
Coefficient of performance (COP) 2.50 Cooling
Fuel cost (annual avg. blended rate) $0.08/kWh Fuel natural gas
Efficiency or COP 0.80 Reheat
Fuel cost (annual avg. blended rate) $0.50/therm
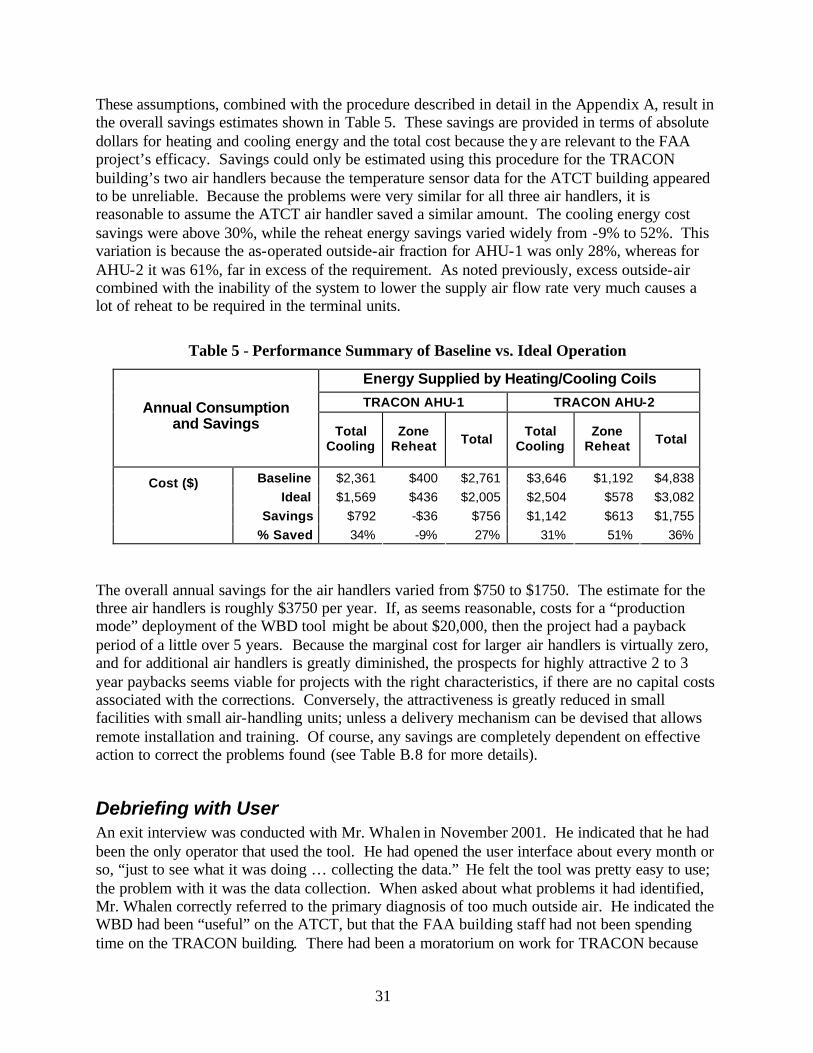
31
These assumptions, combined with the procedure described in detail in the Appendix A, result in the overall savings estimates shown in Table 5. These savings are provided in terms of absolute dollars for heating and cooling energy and the total cost because they are relevant to the FAA project’s efficacy. Savings could only be estimated using this procedure for the TRACON building’s two air handlers because the temperature sensor data for the ATCT building appeared to be unreliable. Because the problems were very similar for all three air handlers, it is reasonable to assume the ATCT air handler saved a similar amount. The cooling energy cost savings were above 30%, while the reheat energy savings varied widely from -9% to 52%. This variation is because the as-operated outside-air fraction for AHU-1 was only 28%, whereas for AHU-2 it was 61%, far in excess of the requirement. As noted previously, excess outside-air combined with the inability of the system to lower the supply air flow rate very much causes a lot of reheat to be required in the terminal units.
Table 5 - Performance Summary of Baseline vs. Ideal Operation
Energy Supplied by Heating/Cooling Coils
TRACON AHU-1 TRACON AHU-2 Annual Consumption and Savings Total
Cooling Zone
Reheat Total Total
Cooling Zone
Reheat Total
Baseline $2,361 $400 $2,761 $3,646 $1,192 $4,838 Ideal $1,569 $436 $2,005 $2,504 $578 $3,082
Savings $792 -$36 $756 $1,142 $613 $1,755
Cost ($)
% Saved 34% -9% 27% 31% 51% 36% The overall annual savings for the air handlers varied from $750 to $1750. The estimate for the three air handlers is roughly $3750 per year. If, as seems reasonable, costs for a “production mode” deployment of the WBD tool might be about $20,000, then the project had a payback period of a little over 5 years. Because the marginal cost for larger air handlers is virtually zero, and for additional air handlers is greatly diminished, the prospects for highly attractive 2 to 3 year paybacks seems viable for projects with the right characteristics, if there are no capital costs associated with the corrections. Conversely, the attractiveness is greatly reduced in small facilities with small air-handling units; unless a delivery mechanism can be devised that allows remote installation and training. Of course, any savings are completely dependent on effective action to correct the problems found (see Table B.8 for more details).
Debriefing with User An exit interview was conducted with Mr. Whalen in November 2001. He indicated that he had been the only operator that used the tool. He had opened the user interface about every month or so, “just to see what it was doing … collecting the data.” He felt the tool was pretty easy to use; the problem with it was the data collection. When asked about what problems it had identified, Mr. Whalen correctly referred to the primary diagnosis of too much outside air. He indicated the WBD had been “useful” on the ATCT, but that the FAA building staff had not been spending time on the TRACON building. There had been a moratorium on work for TRACON because

32
they were not sure they’d continue occupying that building. He indicated they had enabled the economizer at the ATCT but had not done so at TRACON. He mentioned that the controls contractor was coming in to do some work on their systems, and this contractor could add the economizer and fix the outside-air fractions. This suggests that perhaps the FAA staff did not feel confident manipulating the control strategy themselves, or that perhaps they were expecting the FEMP Shared Savings Energy Performance contract to make such repairs. When asked about recommendations for changes or improvements to the WBD, Mr. Whalen indicated that he thought it was presenting too much data – that hourly results were too frequent to be useful. One interpretation of this comment relates to the issue of how the OA/E module does not readily distinguish multiple problems, as discussed in a previous section. In terms of future projects of this nature, he felt it would be good to include getting the problems fixed as an inherent part of the project.
33
Conclusions and Recommendations A few of the recommended corrective actions for all three air handlers at FAA are:
• install return-air temperature sensors instead of using the zone-air temperature sensors
• calibrate all temperature sensors
• modify the minimum outdoor-air damper set point in the control systems to ASHRAE Standard 62 levels
• check the damper actuators and make sure the dampers are working properly
• check the chilled water valves for leakage
• consider smaller air flow rates (or modulate the flow as needed) to make the VAV system more effective at saving cooling and to reduce reheat requirements
• before the economizer cycle is enabled for the air handlers, the air sample should be analyzed at the outdoor-air duct at peak airport traffic to make sure the quality of the air is within the limits
• enable economizer control algorithm in building automation system and modify the air-handler component configuration in the WBD to include the economizer.
The WBD and the OA/E module were shown to successfully identify a number of major problems with the air handlers at FAA. Although the demonstration site was not an ideal site because the air handlers did not have a functioning economizer and lacked the return-air temperature sensor, the OA/E found problems with all three air handlers. These finding are consistent with the other field demonstrations of the WBD, where OA/E found similar problems that should have been detected at the time of commissioning. Economizers can save large amounts of cooling energy cost in a climate such as Denver’s, and excess outside air can cause large amounts of extra heating and cooling to be required. The process of installing and utilizing the OA/E diagnostic module identified these and many other problems with the functioning of FAA’s air handlers. However, the design of the OA/E module’s user interface and diagnostic algorithm both proved to make the results hard for inexperienced users to interpret when several problems are superimposed. A simpler user interface that produces an action item or problem list based on an overview of the data for a block of time may be preferable to users overwhelmed by the hourly results. The installations and collection of data from the air handlers were relatively smooth after some initial problems at this demonstration site because the data collections module within the WBD was extensively tested at other field sites with similar controls system. The automated processing of the data proceeded very well for two of the three air handlers, and with little or no
34
attention paid to it. Data collection for the third air handler was frequently interrupted, but was sufficient to identify problems (although insufficient to support a detailed savings analysis). The demonstration showed that diagnostic technology results in savings only when the identified problems are fixed. That is, it is insufficient to merely identify problems and their impacts and expect operators will fix them as a result. If users are not experts in using their control systems to correct problems, are too busy with other duties, or lack resources to obtain help from contractors, the impact of diagnostic technologies will only affect the few buildings where this is not the case. The time and cost of installation is a significant component to implementing diagnostic technologies, especially when it includes travel. Labor costs to set up tools like the WBD (~1 week) will likely exceed the purchase cost of commercialized software. If contracted labor is used to utilize the tool and make the fixes, then these three cost components of deploying the technology might be estimated as approximately equal thirds3. Selecting sites with larger air handlers (larger air flow rates) will likely increase savings relative to costs. So will involving all air handlers at a site, when their operating control strategies are similar and their underlying control system is of the same type. Including a mechanism for ensuring identified problems get fixed is essential for future demonstrations or broad deployment of the WBD. This could come from within an agency or be provided as part of the deployment, but appears necessary if diagnostics are to do more than simply identify problems and actually proceed to deliver energy savings.
3 If a new data driver is needed, 1 to 2 weeks of additional labor is required and some risk of failure is incurred.
35
References Brambley, M.R., R.G. Pratt, D.P. Chassin, and S. Katipamula. 1998. Automated Diagnostics for Outdoor Air Ventilation and Economizers. ASHRAE Journal, 40(10):49-55, October 1998.
Claridge, D.E., C.H. Culp, M. Lui, S. Deng, W.D. Turner, and J.S. Haberl. 2000. "Campus-Wide Continuous CommissioningSM of University Buildings." In Proc. of ACEEE 2000 Summer Study on Energy Efficiency in Buildings, Pacific Grove, California, Aug. 20-25, pp. 3.101-3.112.
Daisey, J.M. and W.J. Angell. 1998. A Survey and Critical Review of the Literature on Indoor Air Quality, Ventilation and Health Symptoms in Schools. LBNL-41517, Lawrence Berkeley National Laboratory, Berkeley, California.
Katipamula, S., R.G. Pratt, D.P. Chassin, Z.T. Taylor, K. Gowri, and M.R. Brambley. 1999. “Automated Fault Detection and Diagnostics for Outdoor-Air Ventilation Systems and Economizers: Methodology and Results from Field Testing.” ASHRAE Transactions, Vol. 105 Pt. 1.
Lunneberg, T. 1999. “When Good Economizers Go Bad.” E Source Report ER-99-14, E Source, Boulder, Colorado.
http://www.peci.org. Portland Energy Conservation Inc., November 2002.
APPENDIX A
Savings Estimation Procedure
A.1
Appendix A – Savings Estimation Procedure
The savings estimates are made by a process of modeling the performance of the air-handling units under ideal operating conditions (without problems) and operation with superimposed multiple control strategy, sensor, and damper movement problems. The savings estimation process consists of the following sub-processes:
1. Analyze and correct temperature sensor errors while simultaneously estimating the outside-air fraction under various operating regimes.
2. Construct models of the energy delivered by the air-handler unit for various times and
weather conditions; the energy delivered is presumably demanded by the zone loads interacting with the remainder of the heating/cooling system equipment and controls.
3. Construct similar models of other conditions exogenous to the air-handler operation: the
return-air temperature, humidity (if measured), and whether the air handler is maintaining zone thermostat settings or allowing zone temperatures to float up or down. (Also estimate the fan speed, although this is only used as an initializing assumption for each hourly calculation.)
4. Construct hourly schedules of supply fan operation and minimum outside-air supply by
clustering days of the week into day types with similar schedules.
5. Estimate the control set points for discharge-air temperature and mixed-air temperature.
6. Estimate the effect of heating or cooling coil valve leakage on discharge-air temperatures when the control system has demanded the valves to close.
7. Compute hourly air-handler performance with and without superimposed problems for a
typical year’s weather, modeled heating and cooling loads, return-air conditions, and the determined schedules, set points, and valve leakage characteristics.
The modeling computations were performed for each hour of a typical meteorological year for Boulder, Colorado (the nearest such weather file for Denver). Like the weather, the heating or cooling loads demanded of the air-handling unit, the schedules of outside-air supply, and the return-air temperature are required inputs to the algorithm, and are independent of the air-handling unit performance. However, these can be estimated from the sensor data obtained by the WBD. To account for variations caused by building schedule and internal and solar heat gains, these are modeled as simple averages of observed conditions :
• by time-of-day • by day type (weekday or weekend days for the FAA buildings)
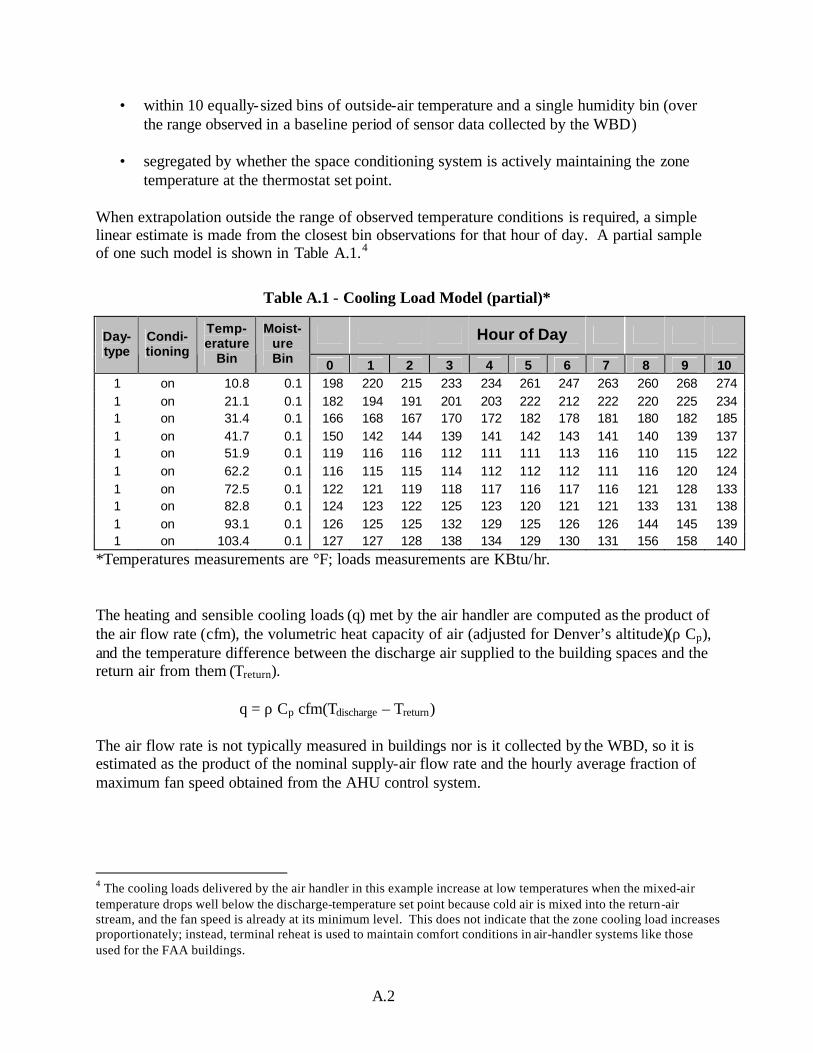
A.2
• within 10 equally-sized bins of outside-air temperature and a single humidity bin (over the range observed in a baseline period of sensor data collected by the WBD)
• segregated by whether the space conditioning system is actively maintaining the zone
temperature at the thermostat set point. When extrapolation outside the range of observed temperature conditions is required, a simple linear estimate is made from the closest bin observations for that hour of day. A partial sample of one such model is shown in Table A.1.4
Table A.1 - Cooling Load Model (partial)*
Hour of Day Day-type
Condi- tioning
Temp-erature
Bin
Moist-ure Bin 0 1 2 3 4 5 6 7 8 9 10
1 on 10.8 0.1 198 220 215 233 234 261 247 263 260 268 274 1 on 21.1 0.1 182 194 191 201 203 222 212 222 220 225 234 1 on 31.4 0.1 166 168 167 170 172 182 178 181 180 182 185 1 on 41.7 0.1 150 142 144 139 141 142 143 141 140 139 137 1 on 51.9 0.1 119 116 116 112 111 111 113 116 110 115 122 1 on 62.2 0.1 116 115 115 114 112 112 112 111 116 120 124 1 on 72.5 0.1 122 121 119 118 117 116 117 116 121 128 133 1 on 82.8 0.1 124 123 122 125 123 120 121 121 133 131 138 1 on 93.1 0.1 126 125 125 132 129 125 126 126 144 145 139 1 on 103.4 0.1 127 127 128 138 134 129 130 131 156 158 140
*Temperatures measurements are °F; loads measurements are KBtu/hr. The heating and sensible cooling loads (q) met by the air handler are computed as the product of the air flow rate (cfm), the volumetric heat capacity of air (adjusted for Denver’s altitude)(ρ Cp), and the temperature difference between the discharge air supplied to the building spaces and the return air from them (Treturn). q = ρ Cp cfm(Tdischarge – Treturn) The air flow rate is not typically measured in buildings nor is it collected by the WBD, so it is estimated as the product of the nominal supply-air flow rate and the hourly average fraction of maximum fan speed obtained from the AHU control system.
4 The cooling loads delivered by the air handler in this example increase at low temperatures when the mixed-air temperature drops well below the discharge-temperature set point because cold air is mixed into the return-air stream, and the fan speed is already at its minimum level. This does not indicate that the zone cooling load increases proportionately; instead, terminal reheat is used to maintain comfort conditions in air-handler systems like those used for the FAA buildings.
A.3
Before such models can be constructed and applied, the temperature sensor data from the control system obtained by the WBD must be corrected for measurement errors. Three basic principles are applied to estimate these errors:
1. the mixed-air temperature must be between the return- and outside-air temperatures
2. the outside-air fraction should be nearly constant when the system is operating with the outside-air damper in a known position – either closed, at minimum required outside-air, or fully open (this also determines the actual outside-air fractions in these conditions – themselves key assumptions for the savings estimation analysis)
3. when the cooling and heating coils are off, the mixed- and discharge-air temperatures should be equal (except for differences caused by heat given off by the fan).
Two types of temperature sensor errors were considered in the analysis of these errors (both were observed in the FAA sensor data):
1. constant offset errors
2. errors related to time-of-day presumed to be the result of exposure of the outside-air temperature sensor to heat from the sun.
An iterative process was used to estimate these errors because each detection principle applied involves different but overlapping sets of two or three of the four different sensors involved. The error estimates are adjusted until the readings satisfy each principle as nearly as possible. Readings from hours with time-of-day errors are gradually excluded in this process to avoid biasing the estimates of the offset errors. Outside-air temperatures for these hours are reconstructed to maintain self-consistent outside-air fractions and correct the data for the model estimation process. The algorithm for ideal air-handler operation performance is listed in the form of “pseudo-code” in Table A.2. Two generic types of air-handler control are incorporated, mode control and set point control. In mode control, the heating and cooling coils are cycled on and off in response to a zone thermostat, like a residential heating/cooling system. This is commonly used for unitary single-zone packaged units common to rooftops in small commercial buildings. In set point control, the air handler modulates the heating and cooling coils to maintain a fixed supply-air temperature (that may be reset based on outside-air temperature). This style of control is common to built-up heating/cooling systems with central chillers, like those in the FAA buildings. In the performance algorithm, items in italics are comments to clarify intent or reasoning. The “pseudo-code” consists of a set of if/then-else- if statements, a set of variable names that are intended to be self-documenting, and commonly used symbols for mathematical operators. Variables that are constant inputs to the algorithm generally contain one or more underscores, except in a few cases where they are a single word such as “Reset.” All input variables are

A.4
undefined in the algorithm, and appear in the assumptions, control strategies, and problems tables illustrated in the section of the report Demonstration Facility Characteristics. The algorithm for air-handler performance with superimposed problems is listed in Table A.3. In some steps the algorithm is noted as being identical to the ideal case, and not repeated.
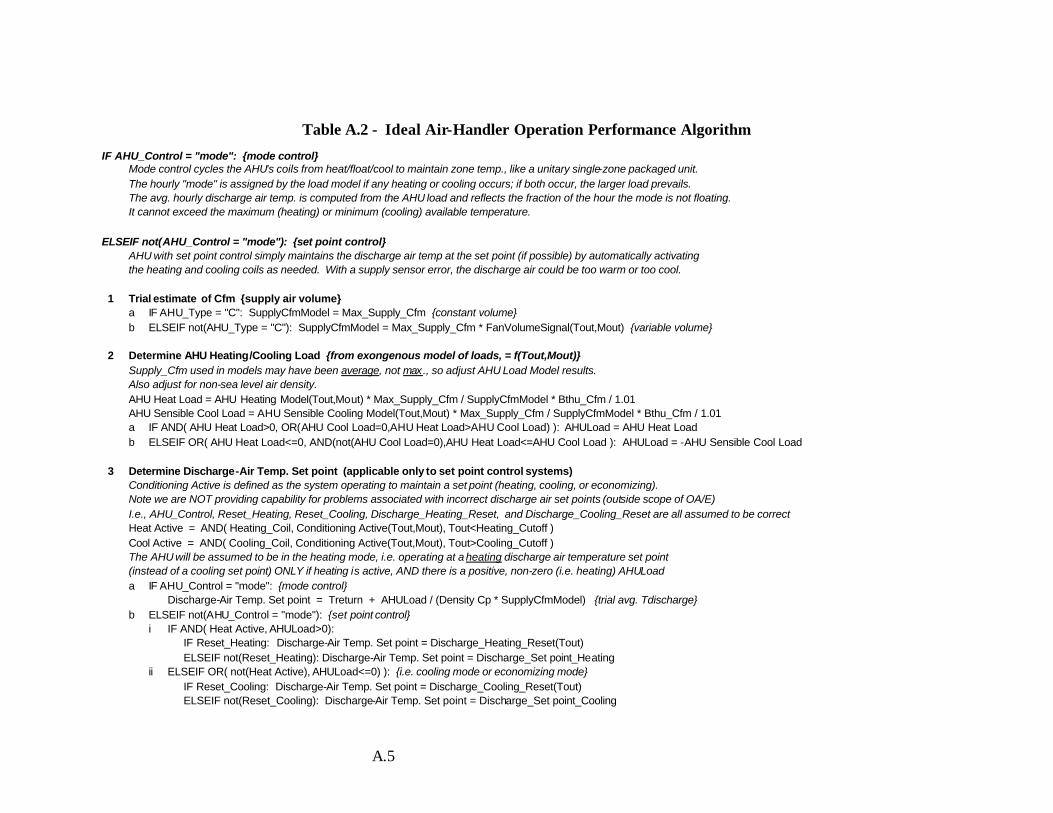
A.5
Table A.2 - Ideal Air-Handler Operation Performance Algorithm
IF AHU_Control = "mode": {mode control} Mode control cycles the AHU's coils from heat/float/cool to maintain zone temp., like a unitary single-zone packaged unit. The hourly "mode" is assigned by the load model if any heating or cooling occurs; if both occur, the larger load prevails. The avg. hourly discharge air temp. is computed from the AHU load and reflects the fraction of the hour the mode is not floating. It cannot exceed the maximum (heating) or minimum (cooling) available temperature. ELSEIF not(AHU_Control = "mode"): {set point control} AHU with set point control simply maintains the discharge air temp at the set point (if possible) by automatically activating the heating and cooling coils as needed. With a supply sensor error, the discharge air could be too warm or too cool. 1 Trial estimate of Cfm {supply air volume}
a IF AHU_Type = "C": SupplyCfmModel = Max_Supply_Cfm {constant volume} b ELSEIF not(AHU_Type = "C"): SupplyCfmModel = Max_Supply_Cfm * FanVolumeSignal(Tout,Mout) {variable volume} 2 Determine AHU Heating/Cooling Load {from exongenous model of loads, = f(Tout,Mout)}
Supply_Cfm used in models may have been average, not max., so adjust AHU Load Model results. Also adjust for non-sea level air density. AHU Heat Load = AHU Heating Model(Tout,Mout) * Max_Supply_Cfm / SupplyCfmModel * Bthu_Cfm / 1.01 AHU Sensible Cool Load = AHU Sensible Cooling Model(Tout,Mout) * Max_Supply_Cfm / SupplyCfmModel * Bthu_Cfm / 1.01 a IF AND( AHU Heat Load>0, OR(AHU Cool Load=0,AHU Heat Load>AHU Cool Load) ): AHULoad = AHU Heat Load b ELSEIF OR( AHU Heat Load<=0, AND(not(AHU Cool Load=0),AHU Heat Load<=AHU Cool Load ): AHULoad = -AHU Sensible Cool Load 3 Determine Discharge-Air Temp. Set point (applicable only to set point control systems)
Conditioning Active is defined as the system operating to maintain a set point (heating, cooling, or economizing). Note we are NOT providing capability for problems associated with incorrect discharge air set points (outside scope of OA/E) I.e., AHU_Control, Reset_Heating, Reset_Cooling, Discharge_Heating_Reset, and Discharge_Cooling_Reset are all assumed to be correct Heat Active = AND( Heating_Coil, Conditioning Active(Tout,Mout), Tout<Heating_Cutoff ) Cool Active = AND( Cooling_Coil, Conditioning Active(Tout,Mout), Tout>Cooling_Cutoff ) The AHU will be assumed to be in the heating mode, i.e. operating at a heating discharge air temperature set point (instead of a cooling set point) ONLY if heating is active, AND there is a positive, non-zero (i.e. heating) AHULoad a IF AHU_Control = "mode": {mode control} Discharge-Air Temp. Set point = Treturn + AHULoad / (Density Cp * SupplyCfmModel) {trial avg. Tdischarge} b ELSEIF not(AHU_Control = "mode"): {set point control} i IF AND( Heat Active, AHULoad>0): IF Reset_Heating: Discharge-Air Temp. Set point = Discharge_Heating_Reset(Tout) ELSEIF not(Reset_Heating): Discharge-Air Temp. Set point = Discharge_Set point_Heating ii ELSEIF OR( not(Heat Active), AHULoad<=0) ): {i.e. cooling mode or economizing mode} IF Reset_Cooling: Discharge-Air Temp. Set point = Discharge_Cooling_Reset(Tout) ELSEIF not(Reset_Cooling): Discharge-Air Temp. Set point = Discharge_Set point_Cooling
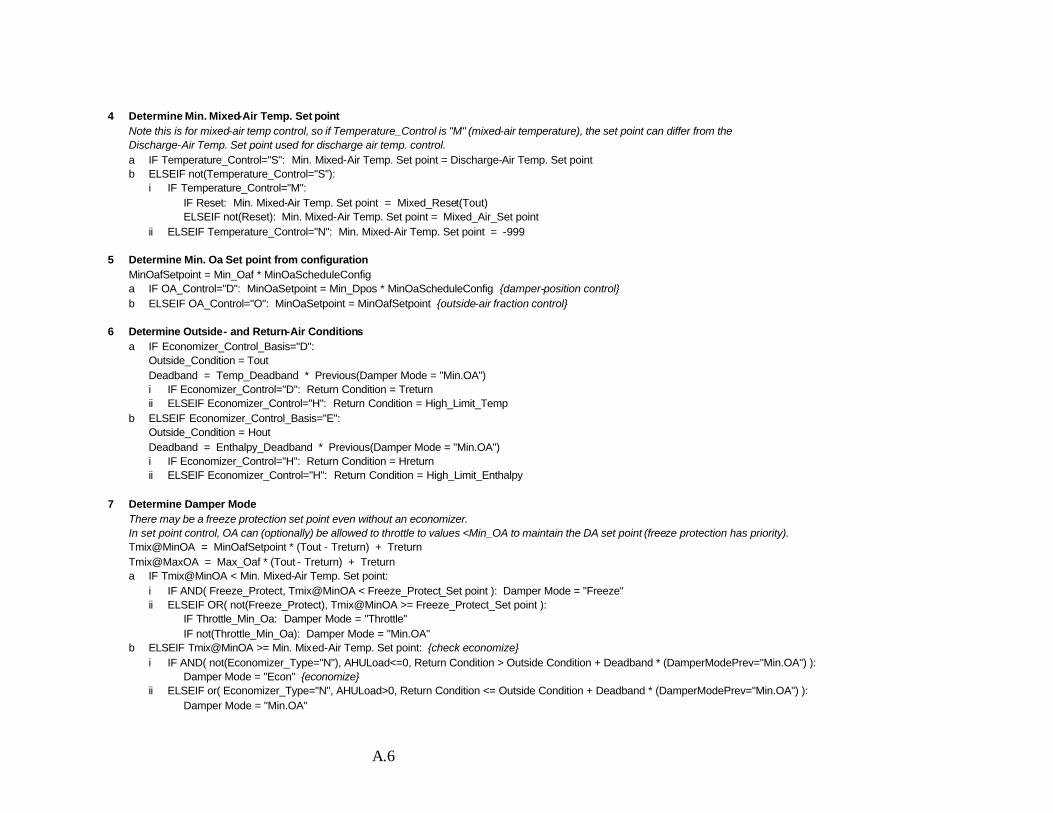
A.6
4 Determine Min. Mixed-Air Temp. Set point
Note this is for mixed-air temp control, so if Temperature_Control is "M" (mixed-air temperature), the set point can differ from the Discharge-Air Temp. Set point used for discharge air temp. control. a IF Temperature_Control="S": Min. Mixed-Air Temp. Set point = Discharge-Air Temp. Set point b ELSEIF not(Temperature_Control="S"): i IF Temperature_Control="M": IF Reset: Min. Mixed-Air Temp. Set point = Mixed_Reset(Tout) ELSEIF not(Reset): Min. Mixed-Air Temp. Set point = Mixed_Air_Set point ii ELSEIF Temperature_Control="N": Min. Mixed-Air Temp. Set point = -999 5 Determine Min. Oa Set point from configuration
MinOafSetpoint = Min_Oaf * MinOaScheduleConfig a IF OA_Control="D": MinOaSetpoint = Min_Dpos * MinOaScheduleConfig {damper-position control} b ELSEIF OA_Control="O": MinOaSetpoint = MinOafSetpoint {outside-air fraction control} 6 Determine Outside- and Return-Air Conditions
a IF Economizer_Control_Basis="D": Outside_Condition = Tout Deadband = Temp_Deadband * Previous(Damper Mode = "Min.OA") i IF Economizer_Control="D": Return Condition = Treturn ii ELSEIF Economizer_Control="H": Return Condition = High_Limit_Temp b ELSEIF Economizer_Control_Basis="E": Outside_Condition = Hout Deadband = Enthalpy_Deadband * Previous(Damper Mode = "Min.OA") i IF Economizer_Control="H": Return Condition = Hreturn ii ELSEIF Economizer_Control="H": Return Condition = High_Limit_Enthalpy 7 Determine Damper Mode
There may be a freeze protection set point even without an economizer. In set point control, OA can (optionally) be allowed to throttle to values <Min_OA to maintain the DA set point (freeze protection has priority). Tmix@MinOA = MinOafSetpoint * (Tout - Treturn) + Treturn Tmix@MaxOA = Max_Oaf * (Tout - Treturn) + Treturn a IF Tmix@MinOA < Min. Mixed-Air Temp. Set point: i IF AND( Freeze_Protect, Tmix@MinOA < Freeze_Protect_Set point ): Damper Mode = "Freeze" ii ELSEIF OR( not(Freeze_Protect), Tmix@MinOA >= Freeze_Protect_Set point ): IF Throttle_Min_Oa: Damper Mode = "Throttle" IF not(Throttle_Min_Oa): Damper Mode = "Min.OA" b ELSEIF Tmix@MinOA >= Min. Mixed-Air Temp. Set point: {check economize} i IF AND( not(Economizer_Type="N"), AHULoad<=0, Return Condition > Outside Condition + Deadband * (DamperModePrev="Min.OA") ): Damper Mode = "Econ" {economize} ii ELSEIF or( Economizer_Type="N", AHULoad>0, Return Condition <= Outside Condition + Deadband * (DamperModePrev="Min.OA") ): Damper Mode = "Min.OA"
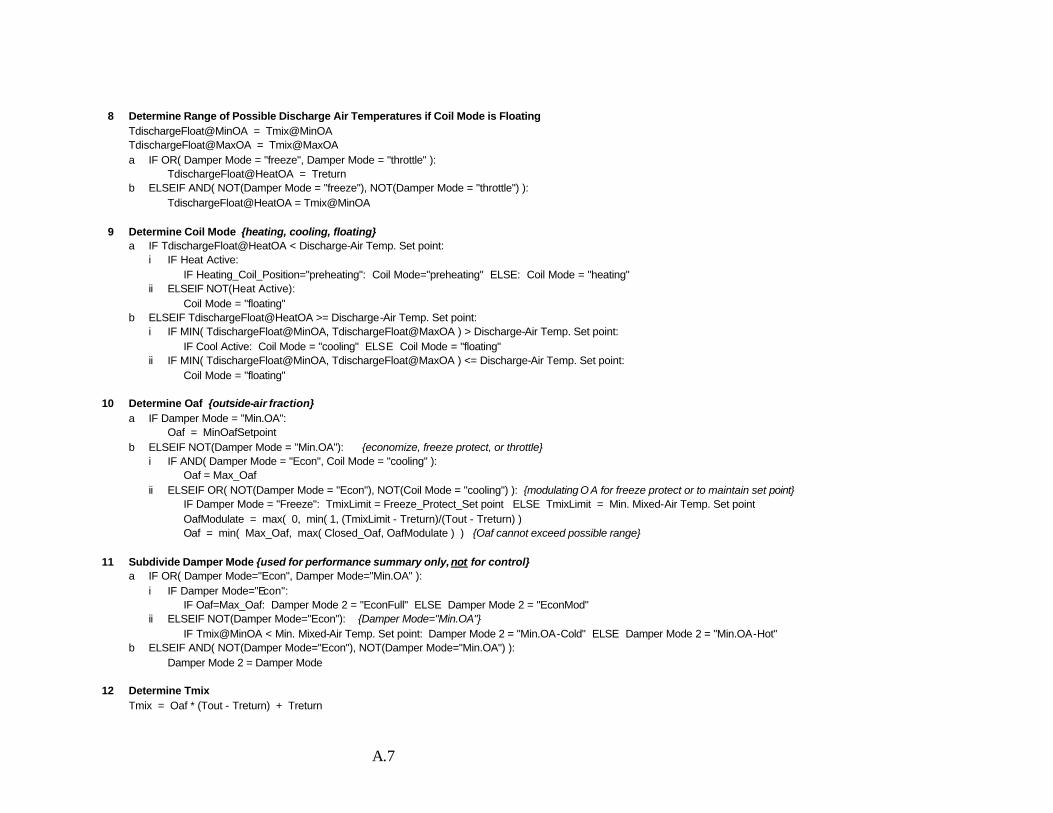
A.7
8 Determine Range of Possible Discharge Air Temperatures if Coil Mode is Floating
TdischargeFloat@MinOA = Tmix@MinOA TdischargeFloat@MaxOA = Tmix@MaxOA a IF OR( Damper Mode = "freeze", Damper Mode = "throttle" ): TdischargeFloat@HeatOA = Treturn b ELSEIF AND( NOT(Damper Mode = "freeze"), NOT(Damper Mode = "throttle") ): TdischargeFloat@HeatOA = Tmix@MinOA 9 Determine Coil Mode {heating, cooling, floating}
a IF TdischargeFloat@HeatOA < Discharge-Air Temp. Set point: i IF Heat Active: IF Heating_Coil_Position="preheating": Coil Mode="preheating" ELSE: Coil Mode = "heating" ii ELSEIF NOT(Heat Active): Coil Mode = "floating" b ELSEIF TdischargeFloat@HeatOA >= Discharge-Air Temp. Set point: i IF MIN( TdischargeFloat@MinOA, TdischargeFloat@MaxOA ) > Discharge-Air Temp. Set point: IF Cool Active: Coil Mode = "cooling" ELSE Coil Mode = "floating" ii IF MIN( TdischargeFloat@MinOA, TdischargeFloat@MaxOA ) <= Discharge-Air Temp. Set point: Coil Mode = "floating" 10 Determine Oaf {outside-air fraction} a IF Damper Mode = "Min.OA": Oaf = MinOafSetpoint b ELSEIF NOT(Damper Mode = "Min.OA"): {economize, freeze protect, or throttle} i IF AND( Damper Mode = "Econ", Coil Mode = "cooling" ): Oaf = Max_Oaf ii ELSEIF OR( NOT(Damper Mode = "Econ"), NOT(Coil Mode = "cooling") ): {modulating O A for freeze protect or to maintain set point} IF Damper Mode = "Freeze": TmixLimit = Freeze_Protect_Set point ELSE TmixLimit = Min. Mixed-Air Temp. Set point OafModulate = max( 0, min( 1, (TmixLimit - Treturn)/(Tout - Treturn) ) Oaf = min( Max_Oaf, max( Closed_Oaf, OafModulate ) ) {Oaf cannot exceed possible range} 11 Subdivide Damper Mode {used for performance summary only, not for control} a IF OR( Damper Mode="Econ", Damper Mode="Min.OA" ): i IF Damper Mode="Econ": IF Oaf=Max_Oaf: Damper Mode 2 = "EconFull" ELSE Damper Mode 2 = "EconMod" ii ELSEIF NOT(Damper Mode="Econ"): {Damper Mode="Min.OA"} IF Tmix@MinOA < Min. Mixed-Air Temp. Set point: Damper Mode 2 = "Min.OA-Cold" ELSE Damper Mode 2 = "Min.OA-Hot" b ELSEIF AND( NOT(Damper Mode="Econ"), NOT(Damper Mode="Min.OA") ): Damper Mode 2 = Damper Mode 12 Determine Tmix Tmix = Oaf * (Tout - Treturn) + Treturn
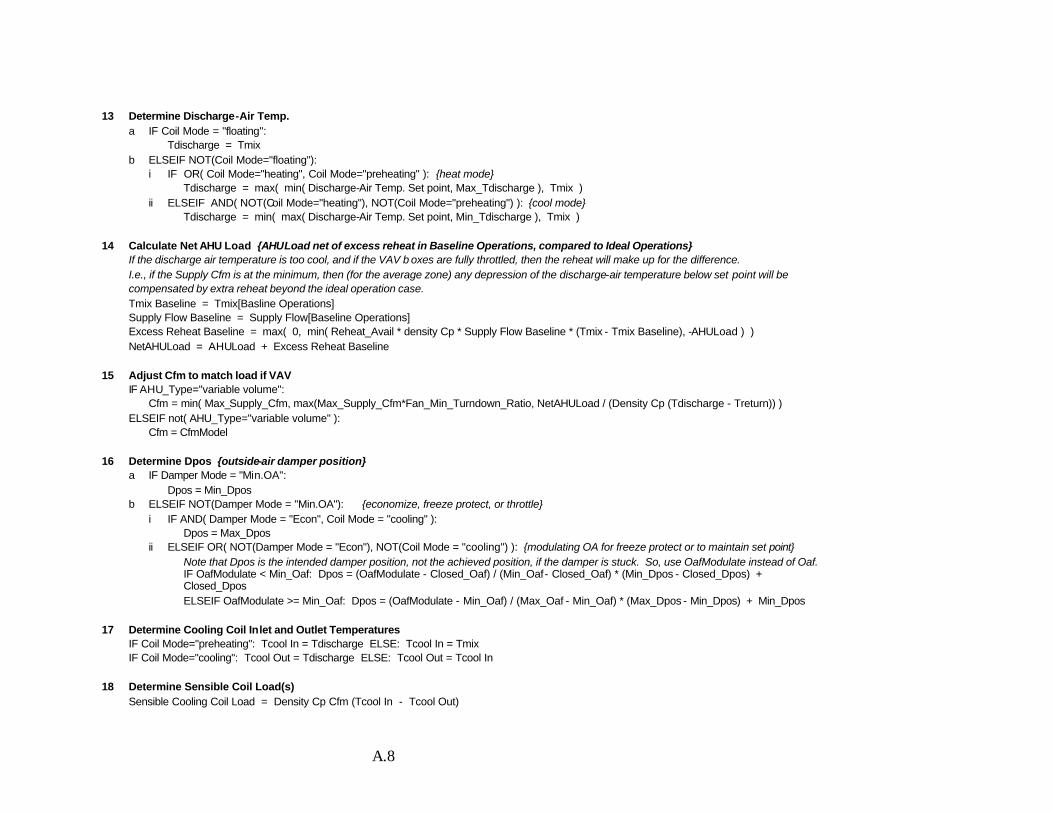
A.8
13 Determine Discharge-Air Temp. a IF Coil Mode = "floating": Tdischarge = Tmix b ELSEIF NOT(Coil Mode="floating"): i IF OR( Coil Mode="heating", Coil Mode="preheating" ): {heat mode} Tdischarge = max( min( Discharge-Air Temp. Set point, Max_Tdischarge ), Tmix ) ii ELSEIF AND( NOT(Coil Mode="heating"), NOT(Coil Mode="preheating") ): {cool mode} Tdischarge = min( max( Discharge-Air Temp. Set point, Min_Tdischarge ), Tmix ) 14 Calculate Net AHU Load {AHULoad net of excess reheat in Baseline Operations, compared to Ideal Operations} If the discharge air temperature is too cool, and if the VAV b oxes are fully throttled, then the reheat will make up for the difference. I.e., if the Supply Cfm is at the minimum, then (for the average zone) any depression of the discharge-air temperature below set point will be compensated by extra reheat beyond the ideal operation case. Tmix Baseline = Tmix[Basline Operations] Supply Flow Baseline = Supply Flow[Baseline Operations] Excess Reheat Baseline = max( 0, min( Reheat_Avail * density Cp * Supply Flow Baseline * (Tmix - Tmix Baseline), -AHULoad ) ) NetAHULoad = AHULoad + Excess Reheat Baseline 15 Adjust Cfm to match load if VAV IF AHU_Type="variable volume": Cfm = min( Max_Supply_Cfm, max(Max_Supply_Cfm*Fan_Min_Turndown_Ratio, NetAHULoad / (Density Cp (Tdischarge - Treturn)) ) ELSEIF not( AHU_Type="variable volume" ): Cfm = CfmModel 16 Determine Dpos {outside-air damper position} a IF Damper Mode = "Min.OA": Dpos = Min_Dpos b ELSEIF NOT(Damper Mode = "Min.OA"): {economize, freeze protect, or throttle} i IF AND( Damper Mode = "Econ", Coil Mode = "cooling" ): Dpos = Max_Dpos ii ELSEIF OR( NOT(Damper Mode = "Econ"), NOT(Coil Mode = "cooling") ): {modulating OA for freeze protect or to maintain set point} Note that Dpos is the intended damper position, not the achieved position, if the damper is stuck. So, use OafModulate instead of Oaf.
IF OafModulate < Min_Oaf: Dpos = (OafModulate - Closed_Oaf) / (Min_Oaf - Closed_Oaf) * (Min_Dpos - Closed_Dpos) + Closed_Dpos
ELSEIF OafModulate >= Min_Oaf: Dpos = (OafModulate - Min_Oaf) / (Max_Oaf - Min_Oaf) * (Max_Dpos - Min_Dpos) + Min_Dpos 17 Determine Cooling Coil Inlet and Outlet Temperatures IF Coil Mode="preheating": Tcool In = Tdischarge ELSE: Tcool In = Tmix IF Coil Mode="cooling": Tcool Out = Tdischarge ELSE: Tcool Out = Tcool In 18 Determine Sensible Coil Load(s) Sensible Cooling Coil Load = Density Cp Cfm (Tcool In - Tcool Out)
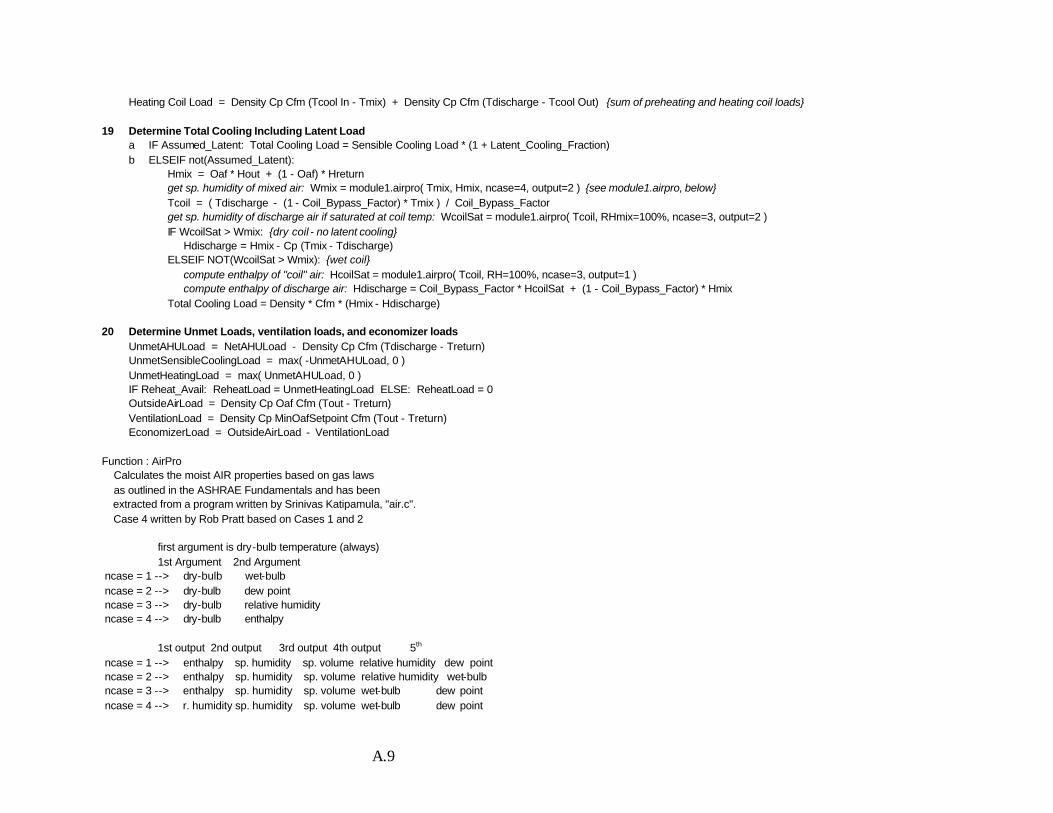
A.9
Heating Coil Load = Density Cp Cfm (Tcool In - Tmix) + Density Cp Cfm (Tdischarge - Tcool Out) {sum of preheating and heating coil loads} 19 Determine Total Cooling Including Latent Load a IF Assumed_Latent: Total Cooling Load = Sensible Cooling Load * (1 + Latent_Cooling_Fraction) b ELSEIF not(Assumed_Latent): Hmix = Oaf * Hout + (1 - Oaf) * Hreturn get sp. humidity of mixed air: Wmix = module1.airpro( Tmix, Hmix, ncase=4, output=2 ) {see module1.airpro, below} Tcoil = ( Tdischarge - (1 - Coil_Bypass_Factor) * Tmix ) / Coil_Bypass_Factor get sp. humidity of discharge air if saturated at coil temp: WcoilSat = module1.airpro( Tcoil, RHmix=100%, ncase=3, output=2 ) IF WcoilSat > Wmix: {dry coil - no latent cooling} Hdischarge = Hmix - Cp (Tmix - Tdischarge) ELSEIF NOT(WcoilSat > Wmix): {wet coil} compute enthalpy of "coil" air: HcoilSat = module1.airpro( Tcoil, RH=100%, ncase=3, output=1 ) compute enthalpy of discharge air: Hdischarge = Coil_Bypass_Factor * HcoilSat + (1 - Coil_Bypass_Factor) * Hmix Total Cooling Load = Density * Cfm * (Hmix - Hdischarge) 20 Determine Unmet Loads, ventilation loads, and economizer loads UnmetAHULoad = NetAHULoad - Density Cp Cfm (Tdischarge - Treturn) UnmetSensibleCoolingLoad = max( -UnmetAHULoad, 0 ) UnmetHeatingLoad = max( UnmetAHULoad, 0 ) IF Reheat_Avail: ReheatLoad = UnmetHeatingLoad ELSE: ReheatLoad = 0 OutsideAirLoad = Density Cp Oaf Cfm (Tout - Treturn) VentilationLoad = Density Cp MinOafSetpoint Cfm (Tout - Treturn) EconomizerLoad = OutsideAirLoad - VentilationLoad Function : AirPro Calculates the moist AIR properties based on gas laws as outlined in the ASHRAE Fundamentals and has been extracted from a program written by Srinivas Katipamula, "air.c". Case 4 written by Rob Pratt based on Cases 1 and 2 first argument is dry-bulb temperature (always) 1st Argument 2nd Argument ncase = 1 --> dry-bulb wet-bulb ncase = 2 --> dry-bulb dew point ncase = 3 --> dry-bulb relative humidity ncase = 4 --> dry-bulb enthalpy 1st output 2nd output 3rd output 4th output 5th ncase = 1 --> enthalpy sp. humidity sp. volume relative humidity dew point ncase = 2 --> enthalpy sp. humidity sp. volume relative humidity wet-bulb ncase = 3 --> enthalpy sp. humidity sp. volume wet-bulb dew point ncase = 4 --> r. humidity sp. humidity sp. volume wet-bulb dew point
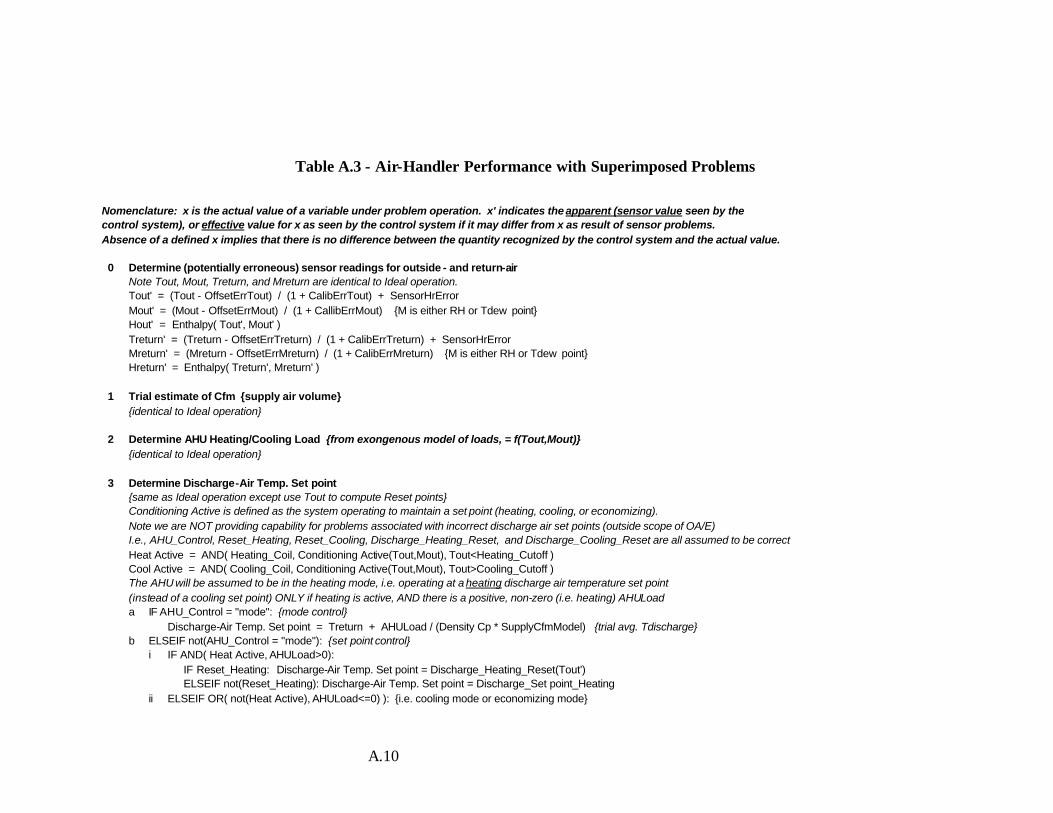
A.10
Table A.3 - Air-Handler Performance with Superimposed Problems
Nomenclature: x is the actual value of a variable under problem operation. x' indicates the apparent (sensor value seen by the control system), or effective value for x as seen by the control system if it may differ from x as result of sensor problems. Absence of a defined x implies that there is no difference between the quantity recognized by the control system and the actual value. 0 Determine (potentially erroneous) sensor readings for outside - and return-air
Note Tout, Mout, Treturn, and Mreturn are identical to Ideal operation. Tout' = (Tout - OffsetErrTout) / (1 + CalibErrTout) + SensorHrError Mout' = (Mout - OffsetErrMout) / (1 + CallibErrMout) {M is either RH or Tdew point} Hout' = Enthalpy( Tout', Mout' ) Treturn' = (Treturn - OffsetErrTreturn) / (1 + CalibErrTreturn) + SensorHrError Mreturn' = (Mreturn - OffsetErrMreturn) / (1 + CalibErrMreturn) {M is either RH or Tdew point} Hreturn' = Enthalpy( Treturn', Mreturn' ) 1 Trial estimate of Cfm {supply air volume}
{identical to Ideal operation} 2 Determine AHU Heating/Cooling Load {from exongenous model of loads, = f(Tout,Mout)}
{identical to Ideal operation} 3 Determine Discharge-Air Temp. Set point
{same as Ideal operation except use Tout to compute Reset points} Conditioning Active is defined as the system operating to maintain a set point (heating, cooling, or economizing). Note we are NOT providing capability for problems associated with incorrect discharge air set points (outside scope of OA/E) I.e., AHU_Control, Reset_Heating, Reset_Cooling, Discharge_Heating_Reset, and Discharge_Cooling_Reset are all assumed to be correct Heat Active = AND( Heating_Coil, Conditioning Active(Tout,Mout), Tout<Heating_Cutoff ) Cool Active = AND( Cooling_Coil, Conditioning Active(Tout,Mout), Tout>Cooling_Cutoff ) The AHU will be assumed to be in the heating mode, i.e. operating at a heating discharge air temperature set point (instead of a cooling set point) ONLY if heating is active, AND there is a positive, non-zero (i.e. heating) AHULoad a IF AHU_Control = "mode": {mode control} Discharge-Air Temp. Set point = Treturn + AHULoad / (Density Cp * SupplyCfmModel) {trial avg. Tdischarge} b ELSEIF not(AHU_Control = "mode"): {set point control} i IF AND( Heat Active, AHULoad>0): IF Reset_Heating: Discharge-Air Temp. Set point = Discharge_Heating_Reset(Tout') ELSEIF not(Reset_Heating): Discharge-Air Temp. Set point = Discharge_Set point_Heating ii ELSEIF OR( not(Heat Active), AHULoad<=0) ): {i.e. cooling mode or economizing mode}
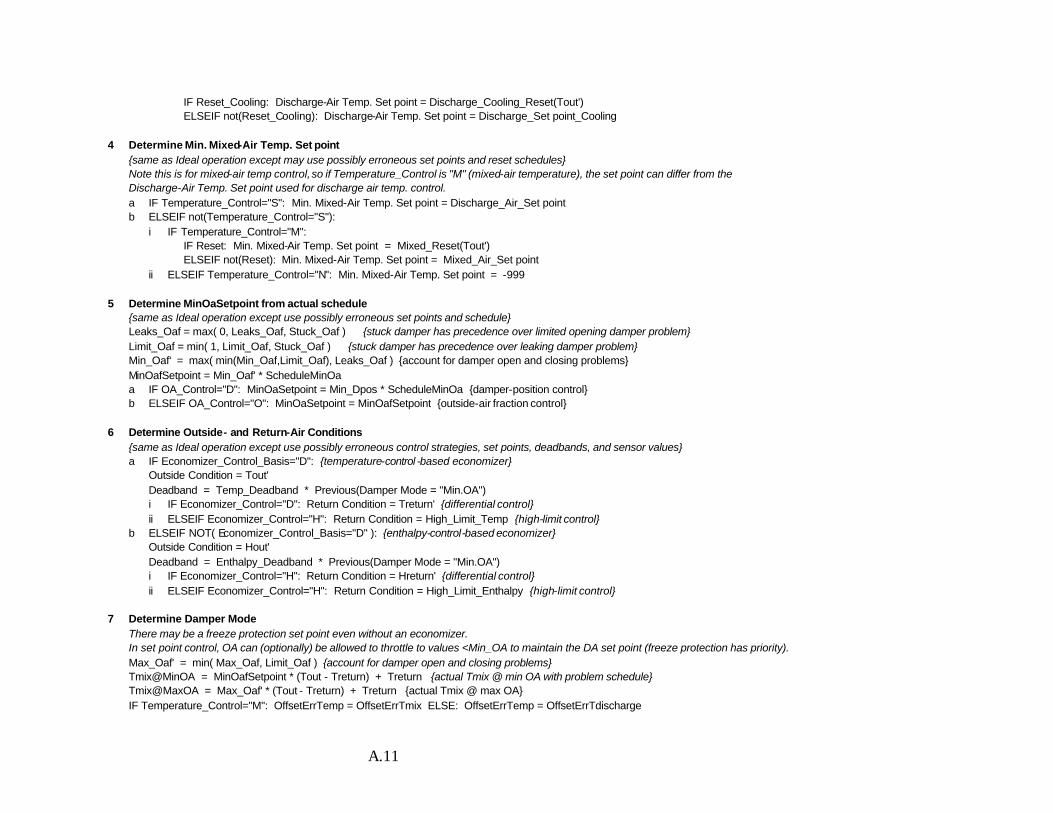
A.11
IF Reset_Cooling: Discharge-Air Temp. Set point = Discharge_Cooling_Reset(Tout') ELSEIF not(Reset_Cooling): Discharge-Air Temp. Set point = Discharge_Set point_Cooling 4 Determine Min. Mixed-Air Temp. Set point
{same as Ideal operation except may use possibly erroneous set points and reset schedules} Note this is for mixed-air temp control, so if Temperature_Control is "M" (mixed-air temperature), the set point can differ from the Discharge-Air Temp. Set point used for discharge air temp. control. a IF Temperature_Control="S": Min. Mixed-Air Temp. Set point = Discharge_Air_Set point b ELSEIF not(Temperature_Control="S"): i IF Temperature_Control="M": IF Reset: Min. Mixed-Air Temp. Set point = Mixed_Reset(Tout') ELSEIF not(Reset): Min. Mixed-Air Temp. Set point = Mixed_Air_Set point ii ELSEIF Temperature_Control="N": Min. Mixed-Air Temp. Set point = -999 5 Determine MinOaSetpoint from actual schedule
{same as Ideal operation except use possibly erroneous set points and schedule} Leaks_Oaf = max( 0, Leaks_Oaf, Stuck_Oaf ) {stuck damper has precedence over limited opening damper problem} Limit_Oaf = min( 1, Limit_Oaf, Stuck_Oaf ) {stuck damper has precedence over leaking damper problem} Min_Oaf' = max( min(Min_Oaf,Limit_Oaf), Leaks_Oaf ) {account for damper open and closing problems} MinOafSetpoint = Min_Oaf' * ScheduleMinOa a IF OA_Control="D": MinOaSetpoint = Min_Dpos * ScheduleMinOa {damper-position control} b ELSEIF OA_Control="O": MinOaSetpoint = MinOafSetpoint {outside-air fraction control} 6 Determine Outside- and Return-Air Conditions
{same as Ideal operation except use possibly erroneous control strategies, set points, deadbands, and sensor values} a IF Economizer_Control_Basis="D": {temperature-control -based economizer} Outside Condition = Tout' Deadband = Temp_Deadband * Previous(Damper Mode = "Min.OA") i IF Economizer_Control="D": Return Condition = Treturn' {differential control} ii ELSEIF Economizer_Control="H": Return Condition = High_Limit_Temp {high-limit control} b ELSEIF NOT( Economizer_Control_Basis="D" ): {enthalpy-control-based economizer} Outside Condition = Hout' Deadband = Enthalpy_Deadband * Previous(Damper Mode = "Min.OA") i IF Economizer_Control="H": Return Condition = Hreturn' {differential control} ii ELSEIF Economizer_Control="H": Return Condition = High_Limit_Enthalpy {high-limit control} 7 Determine Damper Mode
There may be a freeze protection set point even without an economizer. In set point control, OA can (optionally) be allowed to throttle to values <Min_OA to maintain the DA set point (freeze protection has priority). Max_Oaf' = min( Max_Oaf, Limit_Oaf ) {account for damper open and closing problems} Tmix@MinOA = MinOafSetpoint * (Tout - Treturn) + Treturn {actual Tmix @ min OA with problem schedule} Tmix@MaxOA = Max_Oaf' * (Tout - Treturn) + Treturn {actual Tmix @ max OA} IF Temperature_Control="M": OffsetErrTemp = OffsetErrTmix ELSE: OffsetErrTemp = OffsetErrTdischarge
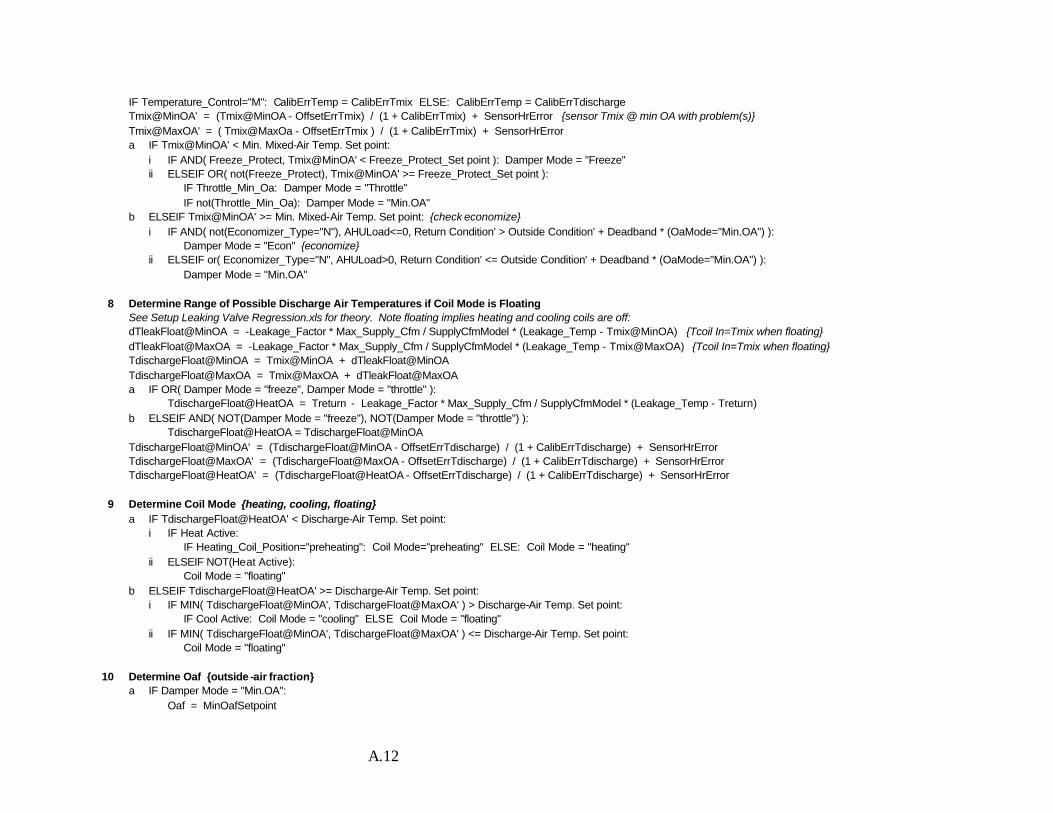
A.12
IF Temperature_Control="M": CalibErrTemp = CalibErrTmix ELSE: CalibErrTemp = CalibErrTdischarge Tmix@MinOA' = (Tmix@MinOA - OffsetErrTmix) / (1 + CalibErrTmix) + SensorHrError {sensor Tmix @ min OA with problem(s)} Tmix@MaxOA' = ( Tmix@MaxOa - OffsetErrTmix ) / (1 + CalibErrTmix) + SensorHrError a IF Tmix@MinOA' < Min. Mixed-Air Temp. Set point: i IF AND( Freeze_Protect, Tmix@MinOA' < Freeze_Protect_Set point ): Damper Mode = "Freeze" ii ELSEIF OR( not(Freeze_Protect), Tmix@MinOA' >= Freeze_Protect_Set point ): IF Throttle_Min_Oa: Damper Mode = "Throttle" IF not(Throttle_Min_Oa): Damper Mode = "Min.OA" b ELSEIF Tmix@MinOA' >= Min. Mixed-Air Temp. Set point: {check economize} i IF AND( not(Economizer_Type="N"), AHULoad<=0, Return Condition' > Outside Condition' + Deadband * (OaMode="Min.OA") ): Damper Mode = "Econ" {economize} ii ELSEIF or( Economizer_Type="N", AHULoad>0, Return Condition' <= Outside Condition' + Deadband * (OaMode="Min.OA") ): Damper Mode = "Min.OA" 8 Determine Range of Possible Discharge Air Temperatures if Coil Mode is Floating See Setup Leaking Valve Regression.xls for theory. Note floating implies heating and cooling coils are off:
dTleakFloat@MinOA = -Leakage_Factor * Max_Supply_Cfm / SupplyCfmModel * (Leakage_Temp - Tmix@MinOA) {Tcoil In=Tmix when floating} dTleakFloat@MaxOA = -Leakage_Factor * Max_Supply_Cfm / SupplyCfmModel * (Leakage_Temp - Tmix@MaxOA) {Tcoil In=Tmix when floating} TdischargeFloat@MinOA = Tmix@MinOA + dTleakFloat@MinOA TdischargeFloat@MaxOA = Tmix@MaxOA + dTleakFloat@MaxOA a IF OR( Damper Mode = "freeze", Damper Mode = "throttle" ): TdischargeFloat@HeatOA = Treturn - Leakage_Factor * Max_Supply_Cfm / SupplyCfmModel * (Leakage_Temp - Treturn) b ELSEIF AND( NOT(Damper Mode = "freeze"), NOT(Damper Mode = "throttle") ): TdischargeFloat@HeatOA = TdischargeFloat@MinOA TdischargeFloat@MinOA' = (TdischargeFloat@MinOA - OffsetErrTdischarge) / (1 + CalibErrTdischarge) + SensorHrError TdischargeFloat@MaxOA' = (TdischargeFloat@MaxOA - OffsetErrTdischarge) / (1 + CalibErrTdischarge) + SensorHrError TdischargeFloat@HeatOA' = (TdischargeFloat@HeatOA - OffsetErrTdischarge) / (1 + CalibErrTdischarge) + SensorHrError 9 Determine Coil Mode {heating, cooling, floating}
a IF TdischargeFloat@HeatOA' < Discharge-Air Temp. Set point: i IF Heat Active: IF Heating_Coil_Position="preheating": Coil Mode="preheating" ELSE: Coil Mode = "heating" ii ELSEIF NOT(Heat Active): Coil Mode = "floating" b ELSEIF TdischargeFloat@HeatOA' >= Discharge-Air Temp. Set point: i IF MIN( TdischargeFloat@MinOA', TdischargeFloat@MaxOA' ) > Discharge-Air Temp. Set point: IF Cool Active: Coil Mode = "cooling" ELSE Coil Mode = "floating" ii IF MIN( TdischargeFloat@MinOA', TdischargeFloat@MaxOA' ) <= Discharge-Air Temp. Set point: Coil Mode = "floating" 10 Determine Oaf {outside -air fraction} a IF Damper Mode = "Min.OA": Oaf = MinOafSetpoint
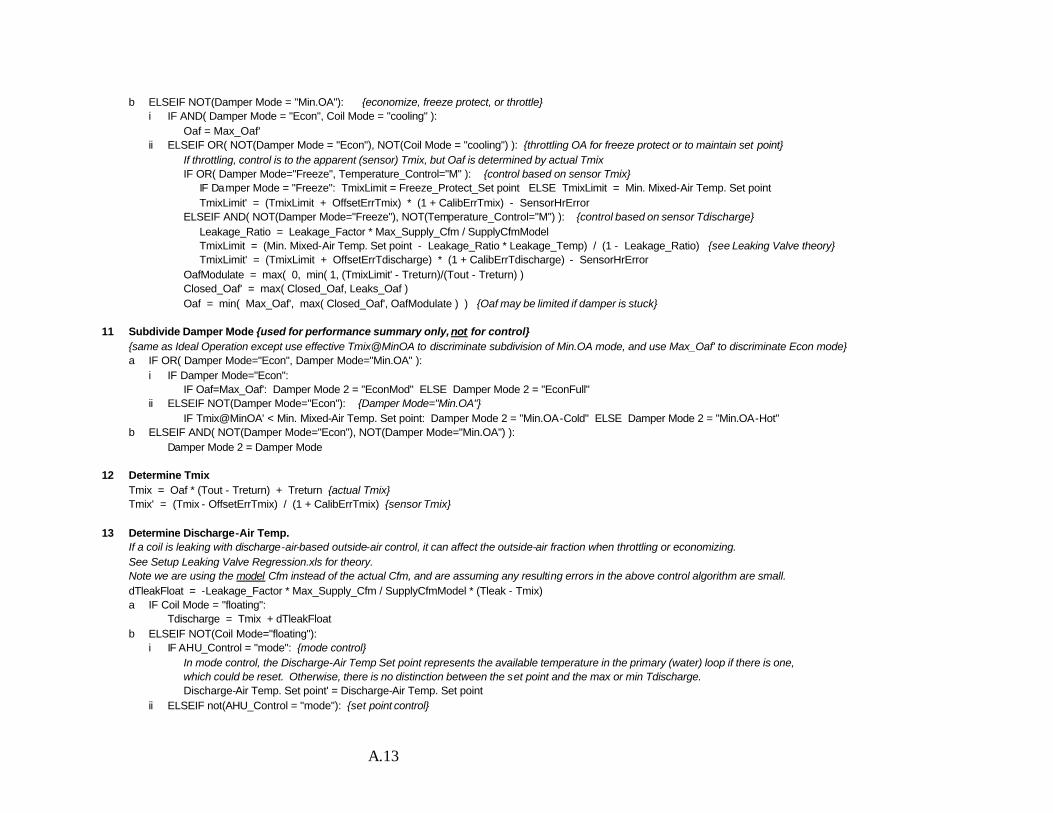
A.13
b ELSEIF NOT(Damper Mode = "Min.OA"): {economize, freeze protect, or throttle} i IF AND( Damper Mode = "Econ", Coil Mode = "cooling" ): Oaf = Max_Oaf' ii ELSEIF OR( NOT(Damper Mode = "Econ"), NOT(Coil Mode = "cooling") ): {throttling OA for freeze protect or to maintain set point} If throttling, control is to the apparent (sensor) Tmix, but Oaf is determined by actual Tmix IF OR( Damper Mode="Freeze", Temperature_Control="M" ): {control based on sensor Tmix} IF Damper Mode = "Freeze": TmixLimit = Freeze_Protect_Set point ELSE TmixLimit = Min. Mixed-Air Temp. Set point TmixLimit' = (TmixLimit + OffsetErrTmix) * (1 + CalibErrTmix) - SensorHrError ELSEIF AND( NOT(Damper Mode="Freeze"), NOT(Temperature_Control="M") ): {control based on sensor Tdischarge} Leakage_Ratio = Leakage_Factor * Max_Supply_Cfm / SupplyCfmModel TmixLimit = (Min. Mixed-Air Temp. Set point - Leakage_Ratio * Leakage_Temp) / (1 - Leakage_Ratio) {see Leaking Valve theory} TmixLimit' = (TmixLimit + OffsetErrTdischarge) * (1 + CalibErrTdischarge) - SensorHrError OafModulate = max( 0, min( 1, (TmixLimit' - Treturn)/(Tout - Treturn) ) Closed_Oaf' = max( Closed_Oaf, Leaks_Oaf ) Oaf = min( Max_Oaf', max( Closed_Oaf', OafModulate ) ) {Oaf may be limited if damper is stuck} 11 Subdivide Damper Mode {used for performance summary only, not for control} {same as Ideal Operation except use effective Tmix@MinOA to discriminate subdivision of Min.OA mode, and use Max_Oaf' to discriminate Econ mode} a IF OR( Damper Mode="Econ", Damper Mode="Min.OA" ): i IF Damper Mode="Econ": IF Oaf=Max_Oaf': Damper Mode 2 = "EconMod" ELSE Damper Mode 2 = "EconFull" ii ELSEIF NOT(Damper Mode="Econ"): {Damper Mode="Min.OA"} IF Tmix@MinOA' < Min. Mixed-Air Temp. Set point: Damper Mode 2 = "Min.OA-Cold" ELSE Damper Mode 2 = "Min.OA-Hot" b ELSEIF AND( NOT(Damper Mode="Econ"), NOT(Damper Mode="Min.OA") ): Damper Mode 2 = Damper Mode 12 Determine Tmix Tmix = Oaf * (Tout - Treturn) + Treturn {actual Tmix} Tmix' = (Tmix - OffsetErrTmix) / (1 + CalibErrTmix) {sensor Tmix} 13 Determine Discharge-Air Temp. If a coil is leaking with discharge-air-based outside-air control, it can affect the outside-air fraction when throttling or economizing. See Setup Leaking Valve Regression.xls for theory. Note we are using the model Cfm instead of the actual Cfm, and are assuming any resulting errors in the above control algorithm are small. dTleakFloat = -Leakage_Factor * Max_Supply_Cfm / SupplyCfmModel * (Tleak - Tmix) a IF Coil Mode = "floating": Tdischarge = Tmix + dTleakFloat b ELSEIF NOT(Coil Mode="floating"): i IF AHU_Control = "mode": {mode control} In mode control, the Discharge-Air Temp Set point represents the available temperature in the primary (water) loop if there is one, which could be reset. Otherwise, there is no distinction between the set point and the max or min Tdischarge. Discharge-Air Temp. Set point' = Discharge-Air Temp. Set point ii ELSEIF not(AHU_Control = "mode"): {set point control}
A.14
In set point control, the AHU will attempt to provide air at a potentially erroneous (due to sensor error) effective Tdischarge' instead of Tdischarge. But, the actual Tdischarge is limited by the max and min Tdischarge available (hot and chilled water temps). Discharge-Air Temp. Set point' = (Discharge-Air Temp. Set point + OffsetErrTdischarge) * (1 + CalibErrTdischarge) - SensorHrError i IF OR( Coil Mode="heating", Coil Mode="preheating" ): {heat mode} Tdischarge = max( min( Discharge-Air Temp. Set point', Max_Tdischarge ), Tmix + dTleakFloat ) ii ELSEIF AND( NOT(Coil Mode="heating"), NOT(Coil Mode="preheating") ): {cool mode} Tdischarge = min( max( Discharge-Air Temp. Set point', Min_Tdischarge ), Tmix + dTleakFloat ) Tdischarge' = (Tdischarge' - OffsetErrTdischarge) / (1 + CalibErrTdischarge) + SensorHrError 14 Calculate Net AHU Load {AHULoad net of excess reheat in Baseline Operations, compared to Ideal Operations} Excess Reheat Baseline = Excess Reheat Baseline[Ideal Operations] Note: for Operations Baseline, compute conditions based on full AHULoad from model. For Operations Problems, take out Excess Reheat in NetAHULoad and let the required reheat be computed from the AHU performance. {If Operations Baseline}: NetAHULoad = AHULoad ELSE NetAHULoad = AHULoad + Excess Reheat Baseline 15 Adjust Cfm if VAV and if necessary to meet load {identical to Ideal Operation} 16 Determine Dpos {outside-air damper position} {identical to Ideal Operation} 17 Determine Cooling Coil Inlet and Outlet Temperatures a IF OR( AND(Leakage_Coil="cooling",Coil Mode="preheating"), AND(Leakage_Coil="heating",Coil Mode="cooling") ): UaCoil = -Leakage_Factor * density Cp * Max_Supply_Cfm Tcoil In = Tdischarge + UaCoil * (Tdischarge - Tleak) / (density Cp * SupplyCfmModel - UaCoil) b ELSEIF AND( NOT(AND(Leakage_Coil="cooling",Coil Mode="preheating")), NOT(AND(Leakage_Coil="heating",Coil Mode="cooling")) ): Tcoil In = Tmix dTleak = -Leakage_Factor * Max_Supply_Cfm / SupplyCfmModel * (Tleak - Tcoil In) c IF AND( NOT(Coil Mode="heating"), NOT(Coil Mode="preheating") ): {not heating/preheating} i IF OR( NOT(Leakage_Problem), Leakage_Coil="cooling" ): {no leak, or cooling coil leak} Tcool In = Tmix Tcool Out = Tdischarge ii ELSEIF AND( Leakage_Problem, NOT(Leakage_Coil="cooling") ): {heating or preheating coil leak} IF Leakage_Coil="heating": {heating coil leak} Tcool In = Tmix Tcool Out = Tcoil In ELSEIF NOT(Leakage_Coil="heating"): {preheating coil leak} Tcool In = Tmix + dTleak Tcool Out = Tdischarge d ELSEIF OR( Coil Mode="heating", Coil Mode="preheating" ): {heating or preheating} i IF OR( NOT(Leakage_Problem), Leakage_Coil="cooling" ): {no leak, or cooling coil leak} IF Heating_Coil_Position="heating": {heat coil position is "heating"} TCool In = Tmix
A.15
TCool Out = Tmix + dTleak ELSEIF NOT( Heating_Coil_Position="heating" ): {heat coil position is "preheating" or "none"} TCool In = Tcoil In TCool Out = Tdischarge ii ELSEIF AND( Leakage_Problem, NOT(Leakage_Coil="cooling") ): {heating or preheating coil leak} IF Heating_Coil_Position="heating": {heat coil position is "heating"} TCool In = Tmix TCool Out = Tmix ELSEIF NOT( Heating_Coil_Position="heating" ): {heat coil position is "preheating" or "none"} TCool In = Tmix + dTleak TCool Out = Tdischarge 18 Determine Coil Load(s) {identical to Ideal Operation} Total Sensible Cooling Coil Load = Density Cp Cfm (Tcool In - Tcool Out) Total Heating Coil Load = Density Cp Cfm (Tcool In - Tmix) + Density Cp Cfm (Tdischarge - Tcool Out) {sum of preheating and heating coil loads} Sensible Cooling Coil Load = max( 0, Total Sensible Cooling Coil Load ) Free Heat ChWValve Leak = max( 0, -Total Sensible Cooling Coil Load ) Heating Coil Load = max( 0, Total Heating Coil Load ) Free Cool HwValve Leak = max( 0, -Total Heating Coil Load ) 19 Determine Total Cooling Including Latent Load {identical to Ideal operation} 20 Determine Unmet Loads, ventilation loads, and economizer loads {same as Ideal Operation except reheat calculation is … } Total Sensible Cooling Coil Load = Density Cp Cfm (Tcool In - Tcool Out) Total Heating Coil Load = Density Cp Cfm (Tcool In - Tmix) + Density Cp Cfm (Tdischarge - Tcool Out) {sum of preheating and heating coil loads} Sensible Cooling Coil Load = max( 0, Total Sensible Cooling Coil Load ) Free Heat ChWValve Leak = max( 0, -Total Sensible Cooling Coil Load ) Heating Coil Load = max( 0, Total Heating Coil Load ) Free Cool HwValve Leak = max( 0, -Total Heating Coil Load ) If the discharge air temperature is too cool, and if the VAV b oxes are fully throttled, then the reheat will make up for the difference. I.e., if the fan rpm is at the minimum rpm, then (for the average zone) any depression of the discharge-air temperature below set point will be compensated by extra reheat beyond the ideal operation case.
So, any depressed DAT due to sensor or control error that results in a delta-T ratio less than the turn-down ratio will result in reheat.
APPENDIX B
Savings Estimates
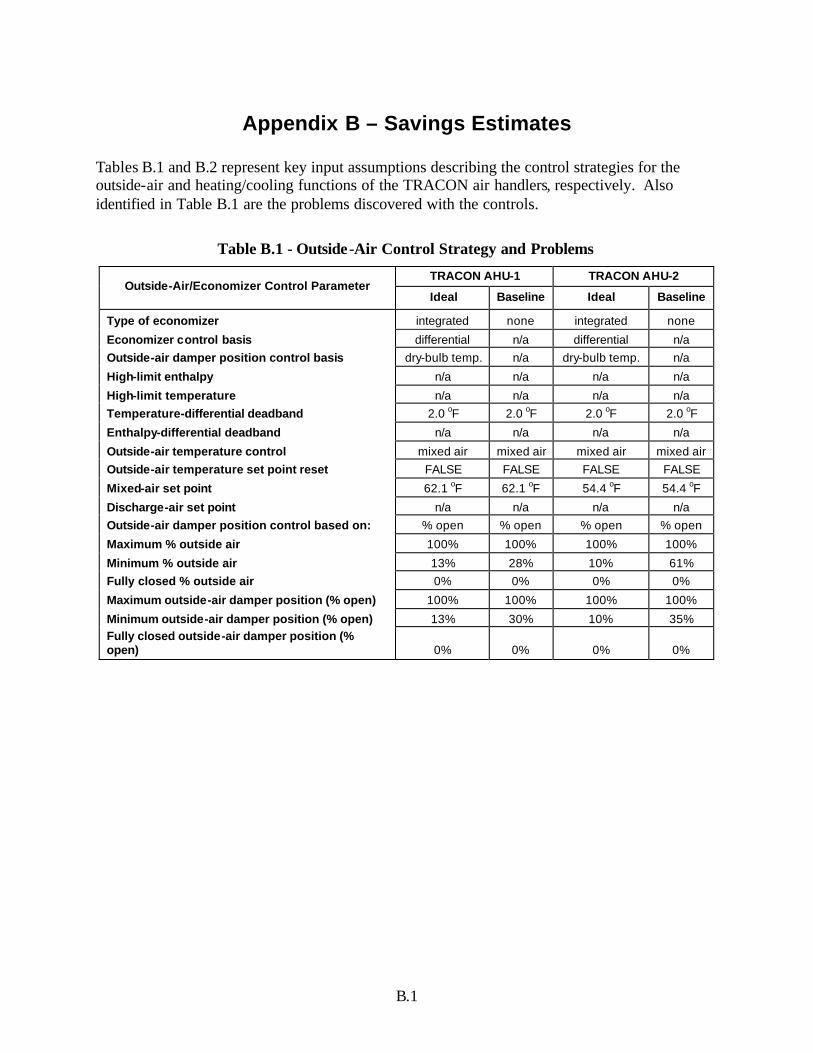
B.1
Appendix B – Savings Estimates Tables B.1 and B.2 represent key input assumptions describing the control strategies for the outside-air and heating/cooling functions of the TRACON air handlers, respectively. Also identified in Table B.1 are the problems discovered with the controls.
Table B.1 - Outside-Air Control Strategy and Problems
TRACON AHU-1 TRACON AHU-2 Outside-Air/Economizer Control Parameter
Ideal Baseline Ideal Baseline
Type of economizer integrated none integrated none
Economizer control basis differential n/a differential n/a Outside-air damper position control basis dry-bulb temp. n/a dry-bulb temp. n/a
High-limit enthalpy n/a n/a n/a n/a
High-limit temperature n/a n/a n/a n/a Temperature-differential deadband 2.0 oF 2.0 oF 2.0 oF 2.0 oF
Enthalpy-differential deadband n/a n/a n/a n/a
Outside-air temperature control mixed air mixed air mixed air mixed air Outside-air temperature set point reset FALSE FALSE FALSE FALSE
Mixed-air set point 62.1 oF 62.1 oF 54.4 oF 54.4 oF
Discharge-air set point n/a n/a n/a n/a Outside-air damper position control based on: % open % open % open % open
Maximum % outside air 100% 100% 100% 100%
Minimum % outside air 13% 28% 10% 61% Fully closed % outside air 0% 0% 0% 0%
Maximum outside-air damper position (% open) 100% 100% 100% 100%
Minimum outside-air damper position (% open) 13% 30% 10% 35% Fully closed outside-air damper position (% open) 0% 0% 0% 0%
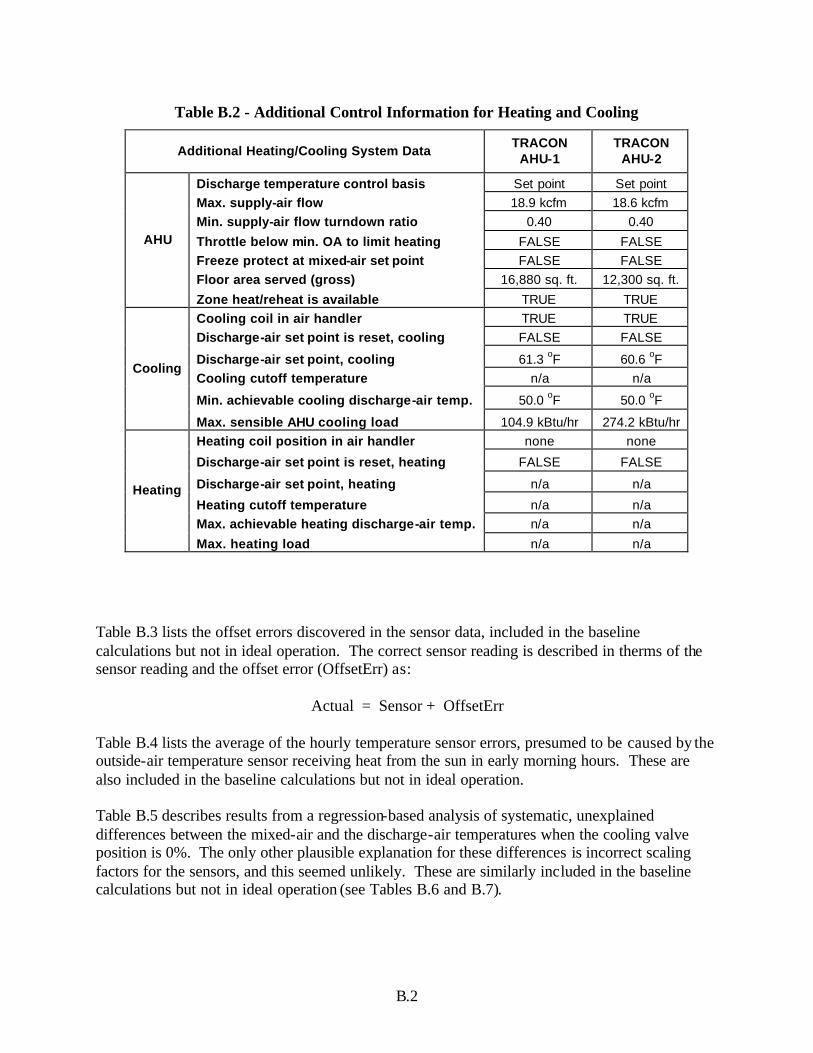
B.2
Table B.2 - Additional Control Information for Heating and Cooling
Additional Heating/Cooling System Data TRACON
AHU-1 TRACON
AHU-2
Discharge temperature control basis Set point Set point Max. supply-air flow 18.9 kcfm 18.6 kcfm Min. supply-air flow turndown ratio 0.40 0.40
Throttle below min. OA to limit heating FALSE FALSE Freeze protect at mixed-air set point FALSE FALSE Floor area served (gross) 16,880 sq. ft. 12,300 sq. ft.
AHU
Zone heat/reheat is available TRUE TRUE Cooling coil in air handler TRUE TRUE Discharge-air set point is reset, cooling FALSE FALSE
Discharge-air set point, cooling 61.3 oF 60.6 oF Cooling cutoff temperature n/a n/a
Min. achievable cooling discharge-air temp. 50.0 oF 50.0 oF
Cooling
Max. sensible AHU cooling load 104.9 kBtu/hr 274.2 kBtu/hr Heating coil position in air handler none none
Discharge-air set point is reset, heating FALSE FALSE
Discharge-air set point, heating n/a n/a
Heating cutoff temperature n/a n/a Max. achievable heating discharge-air temp. n/a n/a
Heating
Max. heating load n/a n/a
Table B.3 lists the offset errors discovered in the sensor data, included in the baseline calculations but not in ideal operation. The correct sensor reading is described in therms of the sensor reading and the offset error (OffsetErr) as:
Actual = Sensor + OffsetErr Table B.4 lists the average of the hourly temperature sensor errors, presumed to be caused by the outside-air temperature sensor receiving heat from the sun in early morning hours. These are also included in the baseline calculations but not in ideal operation. Table B.5 describes results from a regression-based analysis of systematic, unexplained differences between the mixed-air and the discharge-air temperatures when the cooling valve position is 0%. The only other plausible explanation for these differences is incorrect scaling factors for the sensors, and this seemed unlikely. These are similarly included in the baseline calculations but not in ideal operation (see Tables B.6 and B.7).
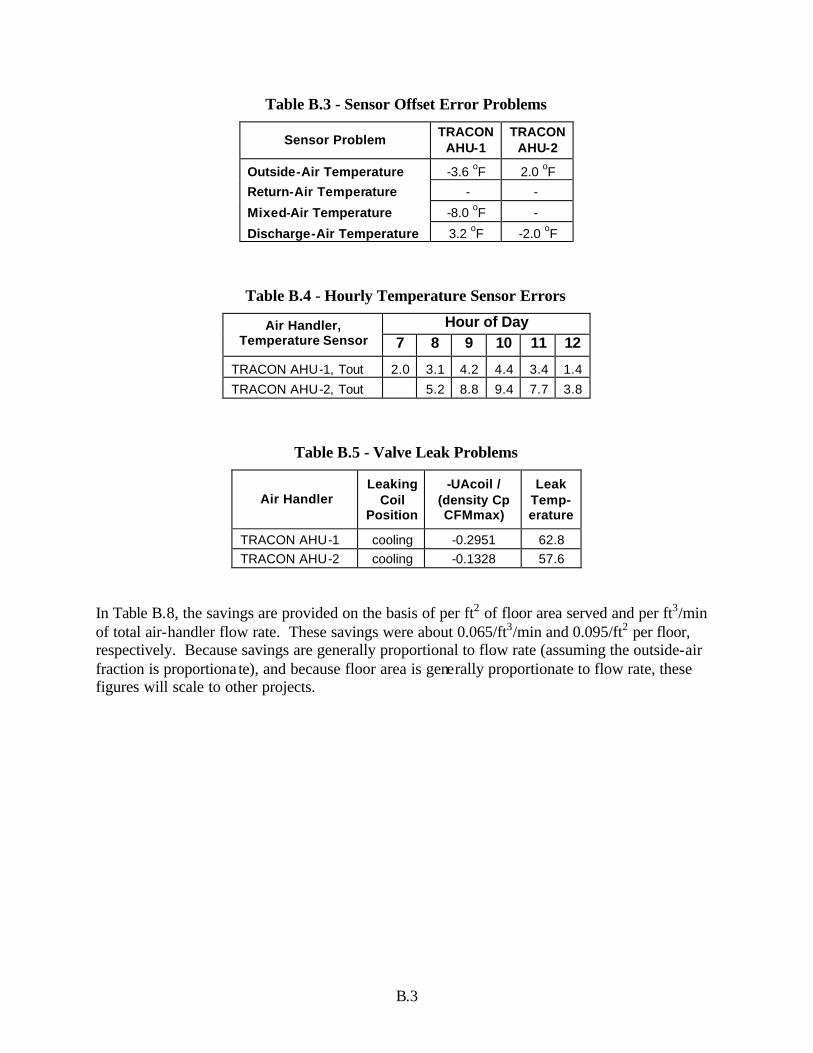
B.3
Table B.3 - Sensor Offset Error Problems
Sensor Problem TRACON
AHU-1 TRACON
AHU-2
Outside-Air Temperature -3.6 oF 2.0 oF
Return-Air Temperature - -
Mixed-Air Temperature -8.0 oF -
Discharge-Air Temperature 3.2 oF -2.0 oF
Table B.4 - Hourly Temperature Sensor Errors
Hour of Day Air Handler, Temperature Sensor 7 8 9 10 11 12
TRACON AHU-1, Tout 2.0 3.1 4.2 4.4 3.4 1.4
TRACON AHU-2, Tout 5.2 8.8 9.4 7.7 3.8
Table B.5 - Valve Leak Problems
Air Handler Leaking
Coil Position
-UAcoil / (density Cp CFMmax)
Leak Temp-erature
TRACON AHU-1 cooling -0.2951 62.8 TRACON AHU-2 cooling -0.1328 57.6
In Table B.8, the savings are provided on the basis of per ft2 of floor area served and per ft3/min of total air-handler flow rate. These savings were about 0.065/ft3/min and 0.095/ft2 per floor, respectively. Because savings are generally proportional to flow rate (assuming the outside-air fraction is proportiona te), and because floor area is generally proportionate to flow rate, these figures will scale to other projects.
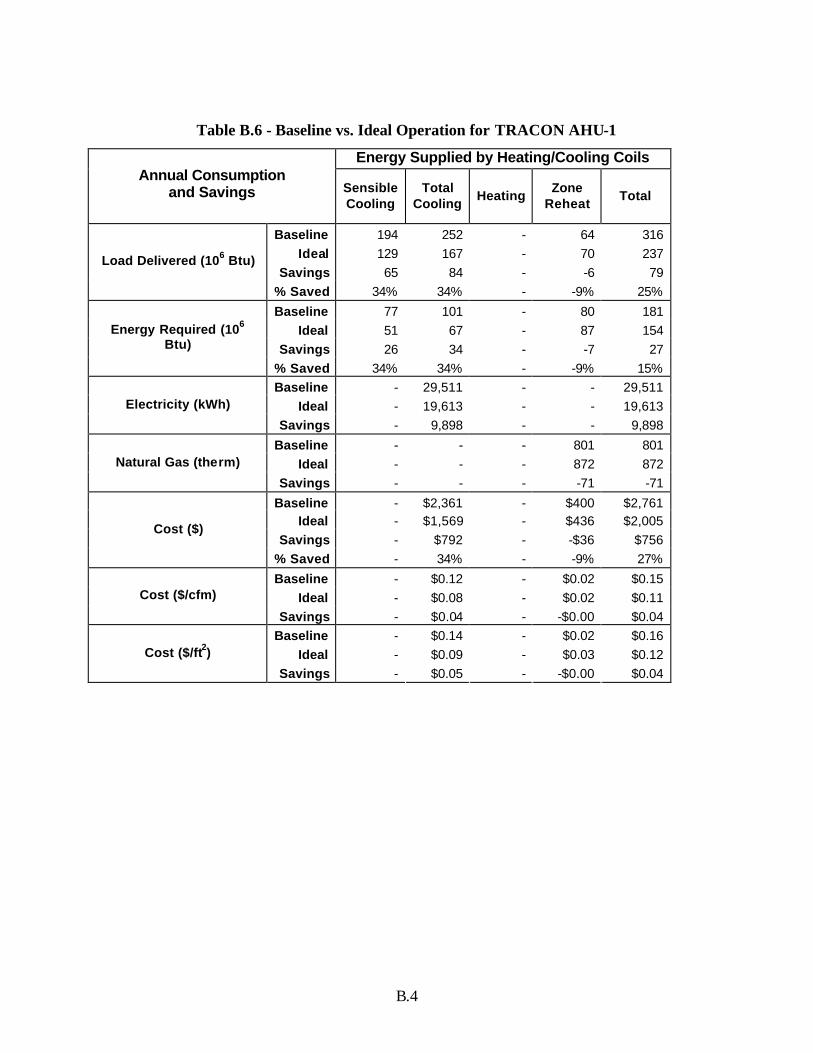
B.4
Table B.6 - Baseline vs. Ideal Operation for TRACON AHU-1
Energy Supplied by Heating/Cooling Coils Annual Consumption
and Savings Sensible Cooling
Total Cooling
Heating Zone
Reheat Total
Baseline 194 252 - 64 316 Ideal 129 167 - 70 237
Savings 65 84 - -6 79 Load Delivered (106 Btu)
% Saved 34% 34% - -9% 25%
Baseline 77 101 - 80 181 Ideal 51 67 - 87 154
Savings 26 34 - -7 27
Energy Required (106 Btu)
% Saved 34% 34% - -9% 15% Baseline - 29,511 - - 29,511
Ideal - 19,613 - - 19,613 Electricity (kWh)
Savings - 9,898 - - 9,898
Baseline - - - 801 801 Ideal - - - 872 872 Natural Gas (therm)
Savings - - - -71 -71
Baseline - $2,361 - $400 $2,761 Ideal - $1,569 - $436 $2,005
Savings - $792 - -$36 $756 Cost ($)
% Saved - 34% - -9% 27%
Baseline - $0.12 - $0.02 $0.15 Ideal - $0.08 - $0.02 $0.11 Cost ($/cfm)
Savings - $0.04 - -$0.00 $0.04 Baseline - $0.14 - $0.02 $0.16
Ideal - $0.09 - $0.03 $0.12 Cost ($/ft2)
Savings - $0.05 - -$0.00 $0.04
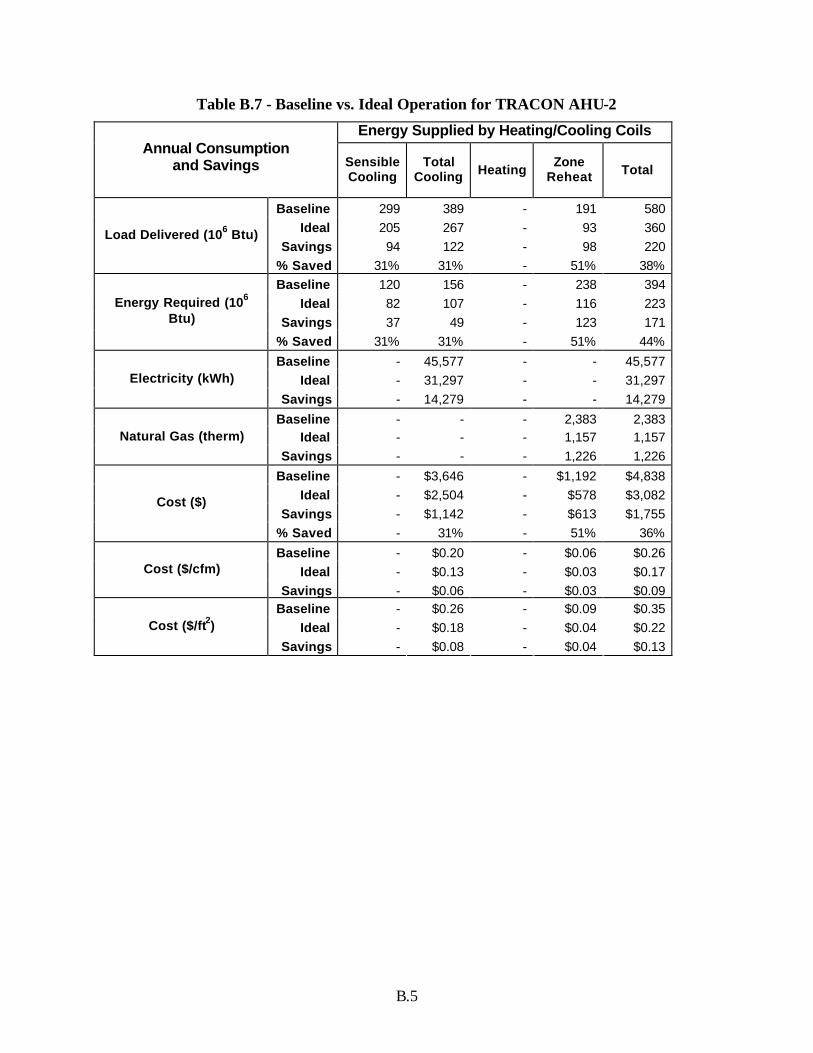
B.5
Table B.7 - Baseline vs. Ideal Operation for TRACON AHU-2
Energy Supplied by Heating/Cooling Coils Annual Consumption
and Savings Sensible Cooling
Total Cooling Heating
Zone Reheat Total
Baseline 299 389 - 191 580 Ideal 205 267 - 93 360
Savings 94 122 - 98 220 Load Delivered (106 Btu)
% Saved 31% 31% - 51% 38% Baseline 120 156 - 238 394
Ideal 82 107 - 116 223 Savings 37 49 - 123 171
Energy Required (106 Btu)
% Saved 31% 31% - 51% 44%
Baseline - 45,577 - - 45,577 Ideal - 31,297 - - 31,297 Electricity (kWh)
Savings - 14,279 - - 14,279
Baseline - - - 2,383 2,383 Ideal - - - 1,157 1,157 Natural Gas (therm)
Savings - - - 1,226 1,226
Baseline - $3,646 - $1,192 $4,838 Ideal - $2,504 - $578 $3,082
Savings - $1,142 - $613 $1,755 Cost ($)
% Saved - 31% - 51% 36%
Baseline - $0.20 - $0.06 $0.26 Ideal - $0.13 - $0.03 $0.17 Cost ($/cfm)
Savings - $0.06 - $0.03 $0.09 Baseline - $0.26 - $0.09 $0.35
Ideal - $0.18 - $0.04 $0.22 Cost ($/ft2)
Savings - $0.08 - $0.04 $0.13
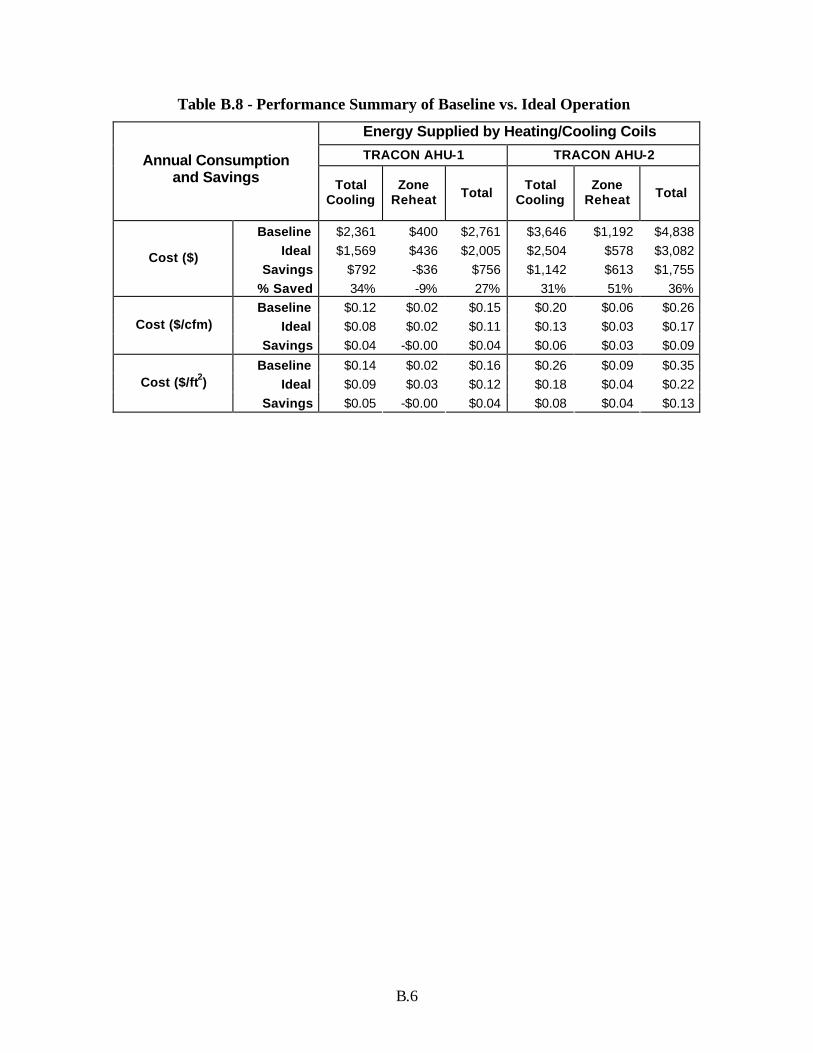
B.6
Table B.8 - Performance Summary of Baseline vs. Ideal Operation6
Energy Supplied by Heating/Cooling Coils
TRACON AHU-1 TRACON AHU-2 Annual Consumption and Savings Total
Cooling Zone
Reheat Total Total
Cooling Zone
Reheat Total
Baseline $2,361 $400 $2,761 $3,646 $1,192 $4,838 Ideal $1,569 $436 $2,005 $2,504 $578 $3,082
Savings $792 -$36 $756 $1,142 $613 $1,755 Cost ($)
% Saved 34% -9% 27% 31% 51% 36% Baseline $0.12 $0.02 $0.15 $0.20 $0.06 $0.26
Ideal $0.08 $0.02 $0.11 $0.13 $0.03 $0.17 Cost ($/cfm)
Savings $0.04 -$0.00 $0.04 $0.06 $0.03 $0.09
Baseline $0.14 $0.02 $0.16 $0.26 $0.09 $0.35 Ideal $0.09 $0.03 $0.12 $0.18 $0.04 $0.22 Cost ($/ft2)
Savings $0.05 -$0.00 $0.04 $0.08 $0.04 $0.13

B.7
APPENDIX C
Memos on Recommended Actions to Fix Problems
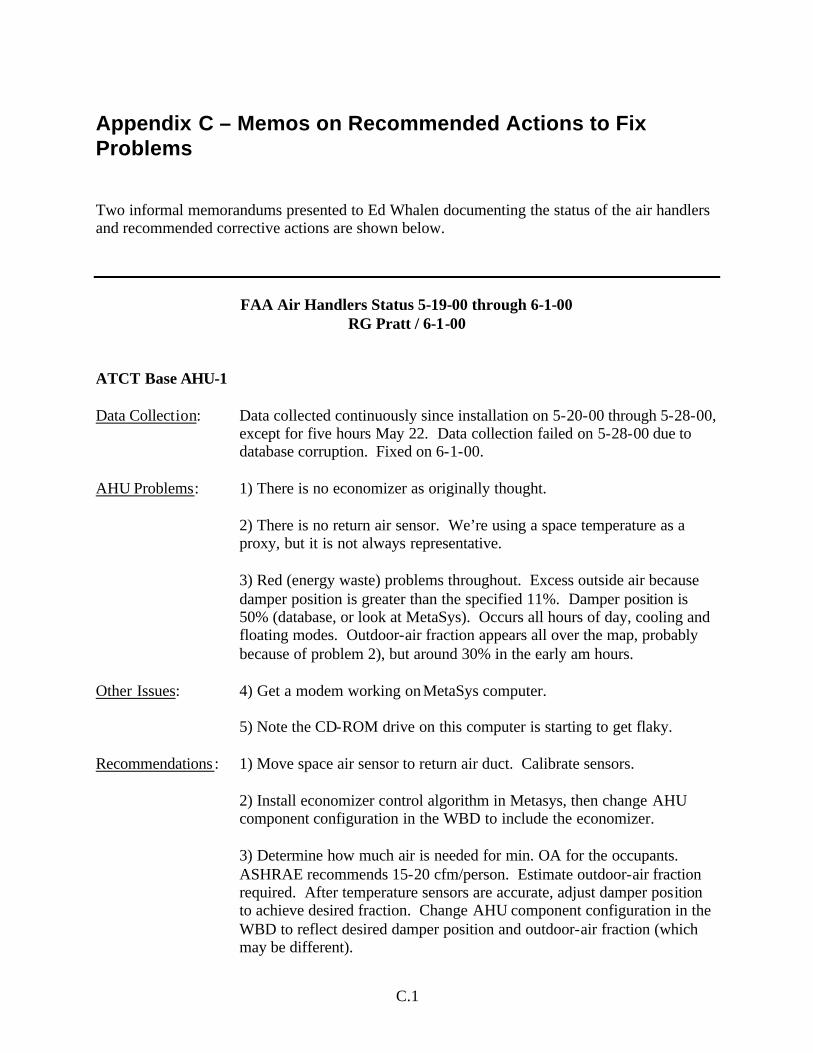
C.1
Appendix C – Memos on Recommended Actions to Fix Problems Two informal memorandums presented to Ed Whalen documenting the status of the air handlers and recommended corrective actions are shown below.
FAA Air Handlers Status 5-19-00 through 6-1-00 RG Pratt / 6-1-00
ATCT Base AHU-1 Data Collection: Data collected continuously since installation on 5-20-00 through 5-28-00,
except for five hours May 22. Data collection failed on 5-28-00 due to database corruption. Fixed on 6-1-00.
AHU Problems: 1) There is no economizer as originally thought. 2) There is no return air sensor. We’re using a space temperature as a
proxy, but it is not always representative. 3) Red (energy waste) problems throughout. Excess outside air because
damper position is greater than the specified 11%. Damper position is 50% (database, or look at MetaSys). Occurs all hours of day, cooling and floating modes. Outdoor-air fraction appears all over the map, probably because of problem 2), but around 30% in the early am hours.
Other Issues: 4) Get a modem working on MetaSys computer. 5) Note the CD-ROM drive on this computer is starting to get flaky. Recommendations : 1) Move space air sensor to return air duct. Calibrate sensors. 2) Install economizer control algorithm in Metasys, then change AHU
component configuration in the WBD to include the economizer. 3) Determine how much air is needed for min. OA for the occupants.
ASHRAE recommends 15-20 cfm/person. Estimate outdoor-air fraction required. After temperature sensors are accurate, adjust damper position to achieve desired fraction. Change AHU component configuration in the WBD to reflect desired damper position and outdoor-air fraction (which may be different).
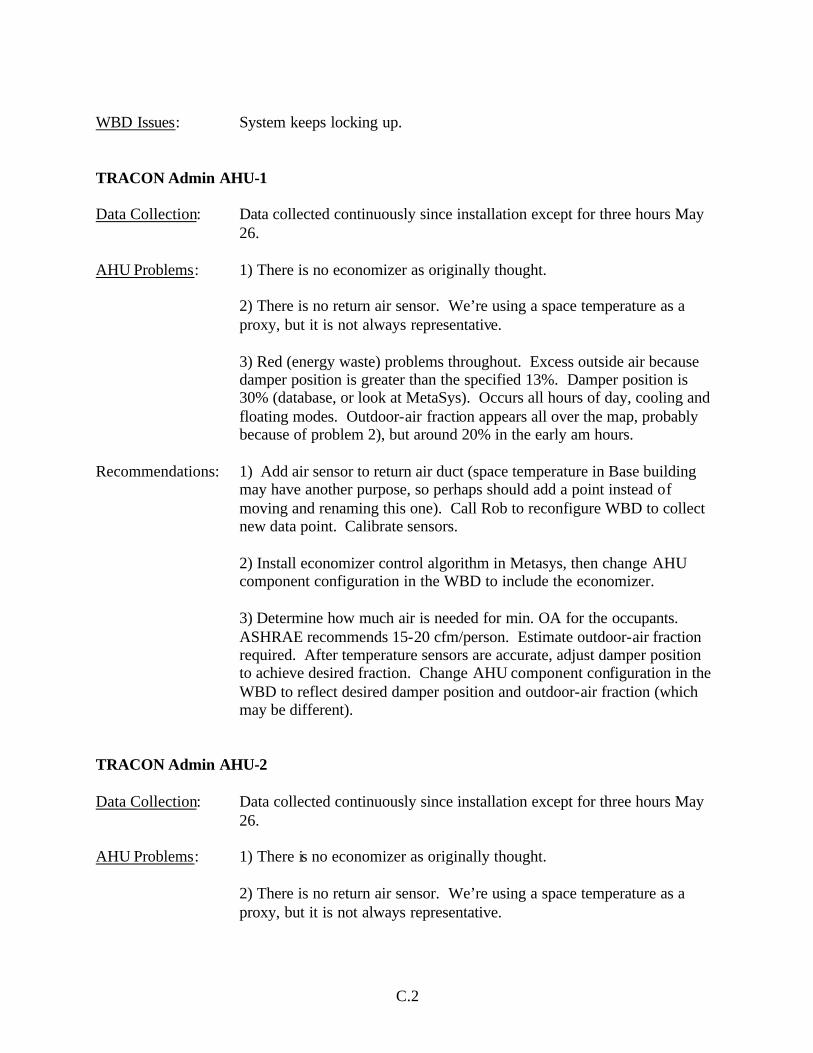
C.2
WBD Issues: System keeps locking up. TRACON Admin AHU-1 Data Collection: Data collected continuously since installation except for three hours May
26. AHU Problems: 1) There is no economizer as originally thought. 2) There is no return air sensor. We’re using a space temperature as a
proxy, but it is not always representative. 3) Red (energy waste) problems throughout. Excess outside air because
damper position is greater than the specified 13%. Damper position is 30% (database, or look at MetaSys). Occurs all hours of day, cooling and floating modes. Outdoor-air fraction appears all over the map, probably because of problem 2), but around 20% in the early am hours.
Recommendations: 1) Add air sensor to return air duct (space temperature in Base building
may have another purpose, so perhaps should add a point instead of moving and renaming this one). Call Rob to reconfigure WBD to collect new data point. Calibrate sensors.
2) Install economizer control algorithm in Metasys, then change AHU
component configuration in the WBD to include the economizer. 3) Determine how much air is needed for min. OA for the occupants.
ASHRAE recommends 15-20 cfm/person. Estimate outdoor-air fraction required. After temperature sensors are accurate, adjust damper position to achieve desired fraction. Change AHU component configuration in the WBD to reflect desired damper position and outdoor-air fraction (which may be different).
TRACON Admin AHU-2 Data Collection: Data collected continuously since installation except for three hours May
26. AHU Problems: 1) There is no economizer as originally thought. 2) There is no return air sensor. We’re using a space temperature as a
proxy, but it is not always representative.
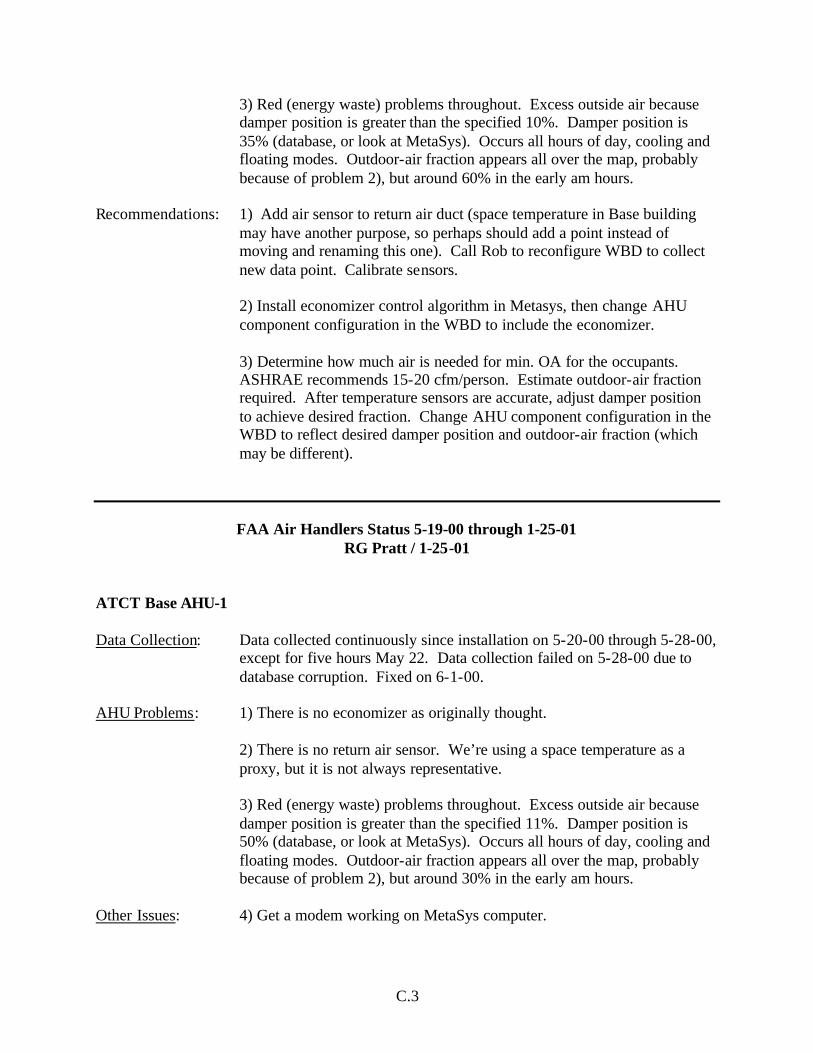
C.3
3) Red (energy waste) problems throughout. Excess outside air because damper position is greater than the specified 10%. Damper position is 35% (database, or look at MetaSys). Occurs all hours of day, cooling and floating modes. Outdoor-air fraction appears all over the map, probably because of problem 2), but around 60% in the early am hours.
Recommendations: 1) Add air sensor to return air duct (space temperature in Base building
may have another purpose, so perhaps should add a point instead of moving and renaming this one). Call Rob to reconfigure WBD to collect new data point. Calibrate sensors.
2) Install economizer control algorithm in Metasys, then change AHU
component configuration in the WBD to include the economizer. 3) Determine how much air is needed for min. OA for the occupants.
ASHRAE recommends 15-20 cfm/person. Estimate outdoor-air fraction required. After temperature sensors are accurate, adjust damper position to achieve desired fraction. Change AHU component configuration in the WBD to reflect desired damper position and outdoor-air fraction (which may be different).
FAA Air Handlers Status 5-19-00 through 1-25-01 RG Pratt / 1-25-01
ATCT Base AHU-1 Data Collection: Data collected continuously since installation on 5-20-00 through 5-28-00,
except for five hours May 22. Data collection failed on 5-28-00 due to database corruption. Fixed on 6-1-00.
AHU Problems: 1) There is no economizer as originally thought. 2) There is no return air sensor. We’re using a space temperature as a
proxy, but it is not always representative. 3) Red (energy waste) problems throughout. Excess outside air because
damper position is greater than the specified 11%. Damper position is 50% (database, or look at MetaSys). Occurs all hours of day, cooling and floating modes. Outdoor-air fraction appears all over the map, probably because of problem 2), but around 30% in the early am hours.
Other Issues: 4) Get a modem working on MetaSys computer.
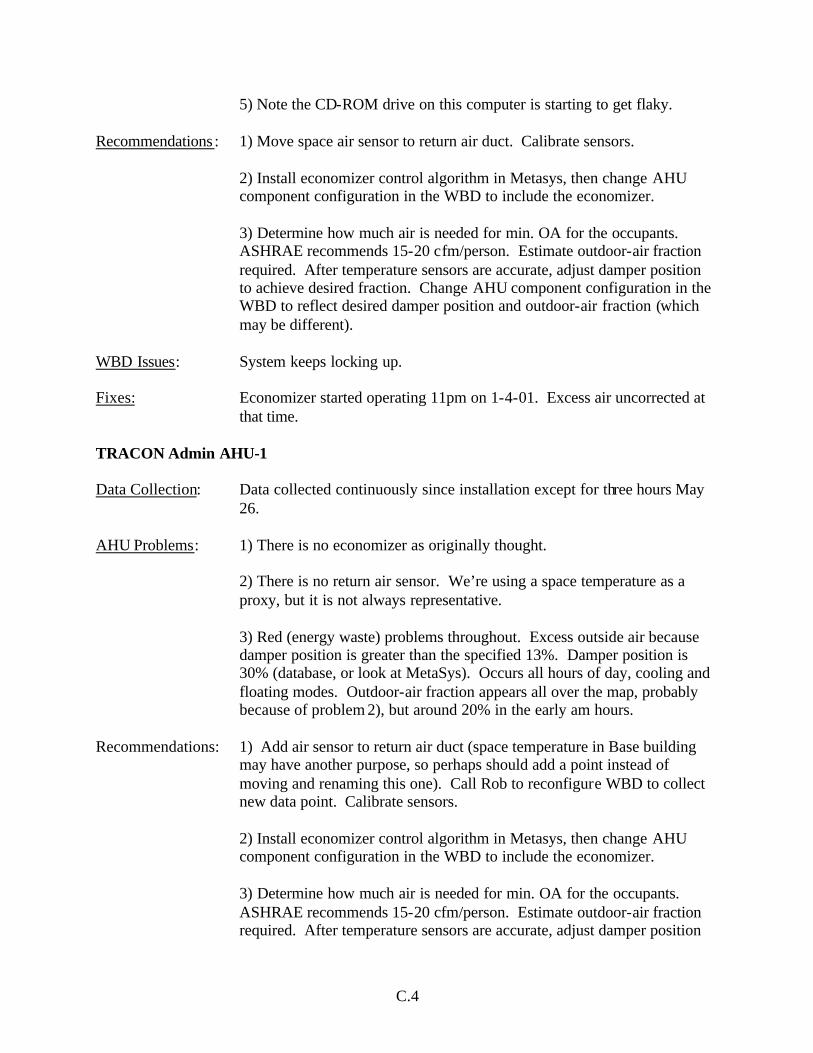
C.4
5) Note the CD-ROM drive on this computer is starting to get flaky. Recommendations : 1) Move space air sensor to return air duct. Calibrate sensors. 2) Install economizer control algorithm in Metasys, then change AHU
component configuration in the WBD to include the economizer. 3) Determine how much air is needed for min. OA for the occupants.
ASHRAE recommends 15-20 cfm/person. Estimate outdoor-air fraction required. After temperature sensors are accurate, adjust damper position to achieve desired fraction. Change AHU component configuration in the WBD to reflect desired damper position and outdoor-air fraction (which may be different).
WBD Issues: System keeps locking up. Fixes: Economizer started operating 11pm on 1-4-01. Excess air uncorrected at
that time. TRACON Admin AHU-1 Data Collection: Data collected continuously since installation except for three hours May
26. AHU Problems: 1) There is no economizer as originally thought. 2) There is no return air sensor. We’re using a space temperature as a
proxy, but it is not always representative. 3) Red (energy waste) problems throughout. Excess outside air because
damper position is greater than the specified 13%. Damper position is 30% (database, or look at MetaSys). Occurs all hours of day, cooling and floating modes. Outdoor-air fraction appears all over the map, probably because of problem 2), but around 20% in the early am hours.
Recommendations: 1) Add air sensor to return air duct (space temperature in Base building
may have another purpose, so perhaps should add a point instead of moving and renaming this one). Call Rob to reconfigure WBD to collect new data point. Calibrate sensors.
2) Install economizer control algorithm in Metasys, then change AHU
component configuration in the WBD to include the economizer. 3) Determine how much air is needed for min. OA for the occupants.
ASHRAE recommends 15-20 cfm/person. Estimate outdoor-air fraction required. After temperature sensors are accurate, adjust damper position
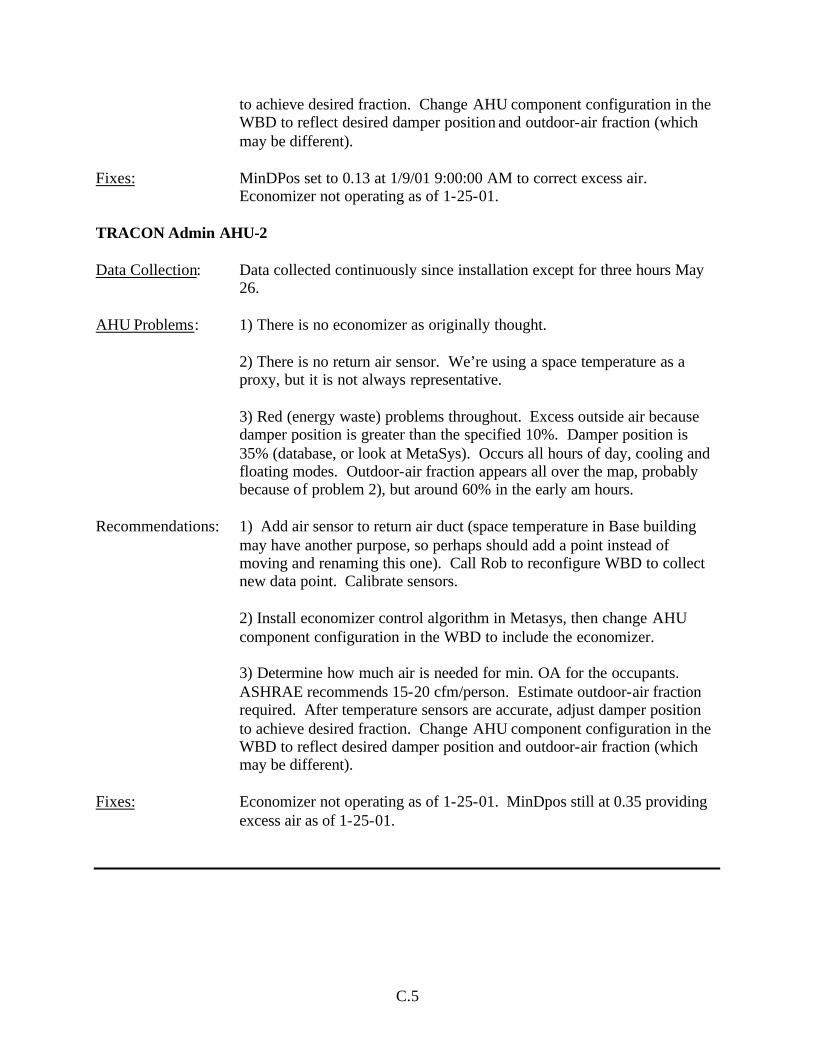
C.5
to achieve desired fraction. Change AHU component configuration in the WBD to reflect desired damper position and outdoor-air fraction (which may be different).
Fixes: MinDPos set to 0.13 at 1/9/01 9:00:00 AM to correct excess air.
Economizer not operating as of 1-25-01. TRACON Admin AHU-2 Data Collection: Data collected continuously since installation except for three hours May
26. AHU Problems: 1) There is no economizer as originally thought. 2) There is no return air sensor. We’re using a space temperature as a
proxy, but it is not always representative. 3) Red (energy waste) problems throughout. Excess outside air because
damper position is greater than the specified 10%. Damper position is 35% (database, or look at MetaSys). Occurs all hours of day, cooling and floating modes. Outdoor-air fraction appears all over the map, probably because of problem 2), but around 60% in the early am hours.
Recommendations: 1) Add air sensor to return air duct (space temperature in Base building
may have another purpose, so perhaps should add a point instead of moving and renaming this one). Call Rob to reconfigure WBD to collect new data point. Calibrate sensors.
2) Install economizer control algorithm in Metasys, then change AHU
component configuration in the WBD to include the economizer. 3) Determine how much air is needed for min. OA for the occupants.
ASHRAE recommends 15-20 cfm/person. Estimate outdoor-air fraction required. After temperature sensors are accurate, adjust damper position to achieve desired fraction. Change AHU component configuration in the WBD to reflect desired damper position and outdoor-air fraction (which may be different).
Fixes: Economizer not operating as of 1-25-01. MinDpos still at 0.35 providing
excess air as of 1-25-01.
APPENDIX D
Outside-Air Fraction Requirements
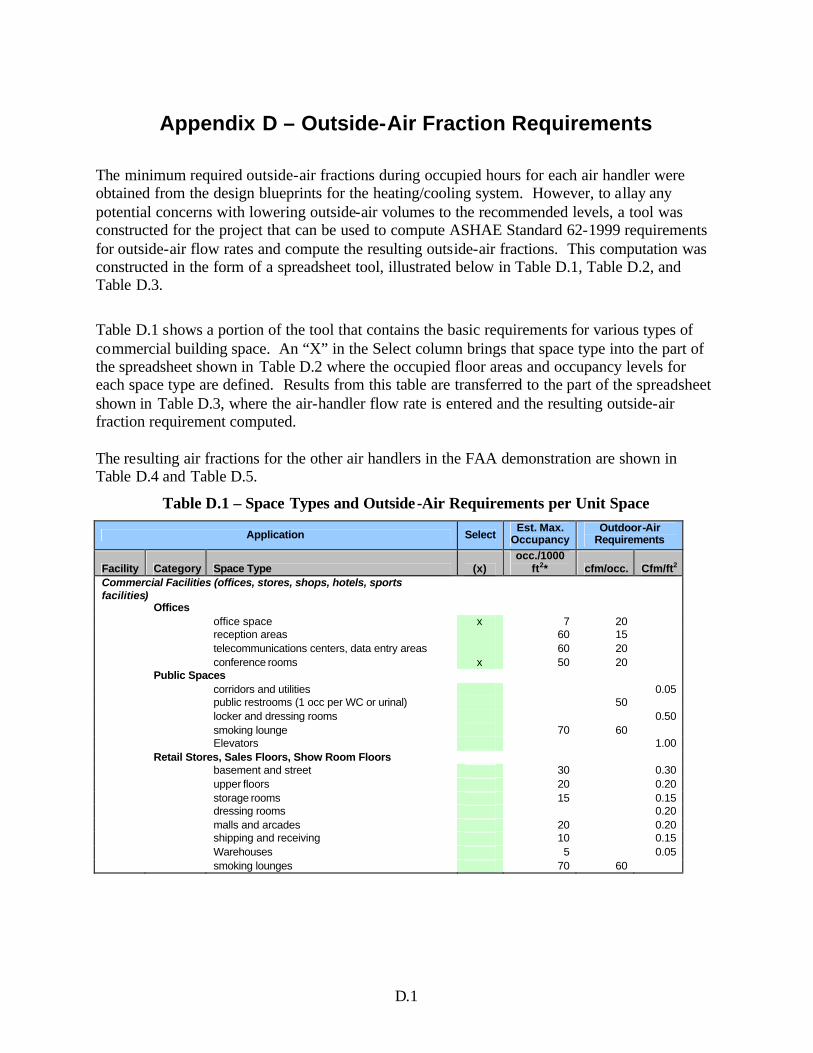
D.1
Appendix D – Outside-Air Fraction Requirements
The minimum required outside-air fractions during occupied hours for each air handler were obtained from the design blueprints for the heating/cooling system. However, to allay any potential concerns with lowering outside-air volumes to the recommended levels, a tool was constructed for the project that can be used to compute ASHAE Standard 62-1999 requirements for outside-air flow rates and compute the resulting outside-air fractions. This computation was constructed in the form of a spreadsheet tool, illustrated below in Table D.1, Table D.2, and Table D.3.
Table D.1 shows a portion of the tool that contains the basic requirements for various types of commercial building space. An “X” in the Select column brings that space type into the part of the spreadsheet shown in Table D.2 where the occupied floor areas and occupancy levels for each space type are defined. Results from this table are transferred to the part of the spreadsheet shown in Table D.3, where the air-handler flow rate is entered and the resulting outside-air fraction requirement computed. The resulting air fractions for the other air handlers in the FAA demonstration are shown in Table D.4 and Table D.5.
Table D.1 – Space Types and Outside-Air Requirements per Unit Space
Application Select Est. Max.
Occupancy Outdoor-Air
Requirements
Facility Category Space Type (x) occ./1000
ft2* cfm/occ. Cfm/ft2 Commercial Facilities (offices, stores, shops, hotels, sports facilities) Offices office space x 7 20 reception areas 60 15 telecommunications centers, data entry areas 60 20 conference rooms x 50 20 Public Spaces corridors and utilities 0.05 public restrooms (1 occ per WC or urinal) 50 locker and dressing rooms 0.50 smoking lounge 70 60 Elevators 1.00 Retail Stores, Sales Floors, Show Room Floors basement and street 30 0.30 upper floors 20 0.20 storage rooms 15 0.15 dressing rooms 0.20 malls and arcades 20 0.20 shipping and receiving 10 0.15 Warehouses 5 0.05 smoking lounges 70 60
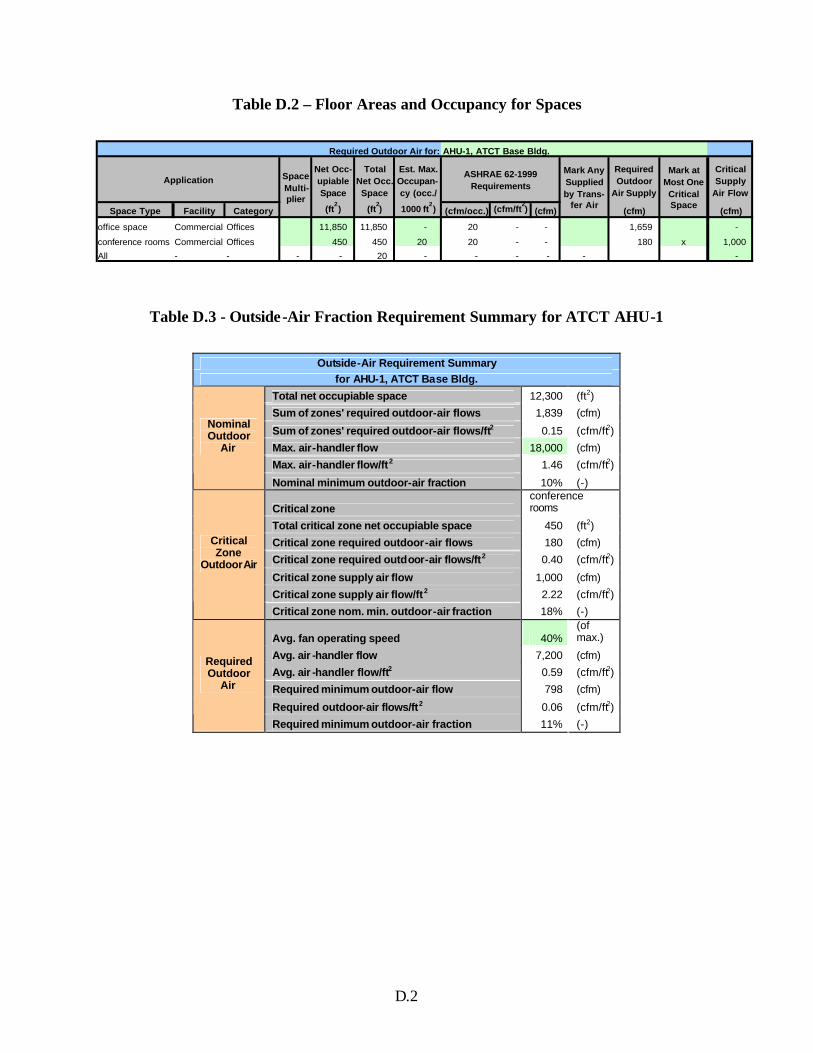
D.2
Table D.2 – Floor Areas and Occupancy for Spaces
Required Outdoor Air for: AHU-1, ATCT Base Bldg.
Net Occ-upiable Space
Total Net Occ. Space
Est. Max. Occupan-cy (occ./
Required Outdoor
Air Supply
Critical Supply
Air Flow
Space Type Facility Category (ft2) (ft
2) 1000 ft
2) (cfm/occ.) (cfm/ft
2) (cfm) (cfm) (cfm)
office space Commercial Facilities (offices, stores, shops, hotels, sports facilities)Offices 11,850 11,850 - 20 - - 1,659 -
conference rooms Commercial Facilities (offices, stores, shops, hotels, sports facilities)Offices 450 450 20 20 - - 180 x 1,000
All - - - - 20 - - - - - -
Mark at Most One Critical Space
Application Space Multi-plier
ASHRAE 62-1999 Requirements
Mark Any Supplied by Trans-
fer Air
Table D.3 - Outside-Air Fraction Requirement Summary for ATCT AHU-1
Outside-Air Requirement Summary
for AHU-1, ATCT Base Bldg.
Total net occupiable space 12,300 (ft2)
Sum of zones' required outdoor-air flows 1,839 (cfm)
Sum of zones' required outdoor-air flows/ft2 0.15 (cfm/ft2)
Max. air-handler flow 18,000 (cfm)
Max. air-handler flow/ft2 1.46 (cfm/ft2)
Nominal Outdoor
Air
Nominal minimum outdoor-air fraction 10% (-)
Critical zone conference rooms
Total critical zone net occupiable space 450 (ft2)
Critical zone required outdoor-air flows 180 (cfm)
Critical zone required outdoor-air flows/ft2 0.40 (cfm/ft2)
Critical zone supply air flow 1,000 (cfm)
Critical zone supply air flow/ft2 2.22 (cfm/ft2)
Critical Zone
OutdoorAir
Critical zone nom. min. outdoor-air fraction 18% (-)
Avg. fan operating speed 40% (of max.)
Avg. air -handler flow 7,200 (cfm)
Avg. air -handler flow/ft2 0.59 (cfm/ft2)
Required minimum outdoor-air flow 798 (cfm)
Required outdoor-air flows/ft2 0.06 (cfm/ft2)
Required Outdoor
Air
Required minimum outdoor-air fraction 11% (-)
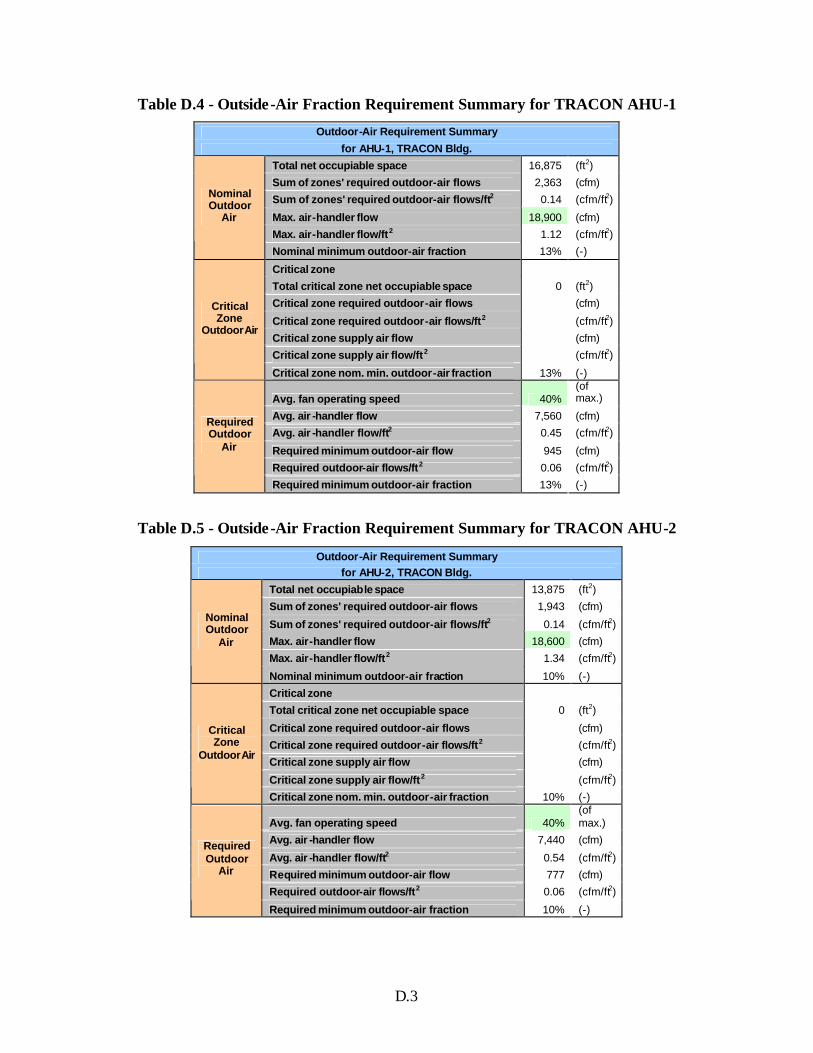
D.3
Table D.4 - Outside-Air Fraction Requirement Summary for TRACON AHU-1 Outdoor-Air Requirement Summary
for AHU-1, TRACON Bldg.
Total net occupiable space 16,875 (ft2)
Sum of zones' required outdoor-air flows 2,363 (cfm)
Sum of zones' required outdoor-air flows/ft2 0.14 (cfm/ft2)
Max. air-handler flow 18,900 (cfm)
Max. air-handler flow/ft2 1.12 (cfm/ft2)
Nominal Outdoor
Air
Nominal minimum outdoor-air fraction 13% (-)
Critical zone
Total critical zone net occupiable space 0 (ft2)
Critical zone required outdoor-air flows (cfm)
Critical zone required outdoor-air flows/ft2 (cfm/ft2)
Critical zone supply air flow (cfm)
Critical zone supply air flow/ft2 (cfm/ft2)
Critical Zone
OutdoorAir
Critical zone nom. min. outdoor-air fraction 13% (-)
Avg. fan operating speed 40% (of max.)
Avg. air -handler flow 7,560 (cfm)
Avg. air -handler flow/ft2 0.45 (cfm/ft2)
Required minimum outdoor-air flow 945 (cfm)
Required outdoor-air flows/ft2 0.06 (cfm/ft2)
Required Outdoor
Air
Required minimum outdoor-air fraction 13% (-)
Table D.5 - Outside-Air Fraction Requirement Summary for TRACON AHU-2 Outdoor-Air Requirement Summary
for AHU-2, TRACON Bldg.
Total net occupiable space 13,875 (ft2)
Sum of zones' required outdoor-air flows 1,943 (cfm)
Sum of zones' required outdoor-air flows/ft2 0.14 (cfm/ft2)
Max. air-handler flow 18,600 (cfm)
Max. air-handler flow/ft2 1.34 (cfm/ft2)
Nominal Outdoor
Air
Nominal minimum outdoor-air fraction 10% (-)
Critical zone
Total critical zone net occupiable space 0 (ft2)
Critical zone required outdoor-air flows (cfm)
Critical zone required outdoor-air flows/ft2 (cfm/ft2)
Critical zone supply air flow (cfm)
Critical zone supply air flow/ft2 (cfm/ft2)
Critical Zone
OutdoorAir
Critical zone nom. min. outdoor-air fraction 10% (-)
Avg. fan operating speed 40% (of max.)
Avg. air -handler flow 7,440 (cfm)
Avg. air -handler flow/ft2 0.54 (cfm/ft2)
Required minimum outdoor-air flow 777 (cfm)
Required outdoor-air flows/ft2 0.06 (cfm/ft2)
Required Outdoor
Air
Required minimum outdoor-air fraction 10% (-)

APPENDIX E
Criteria for Demo Sites
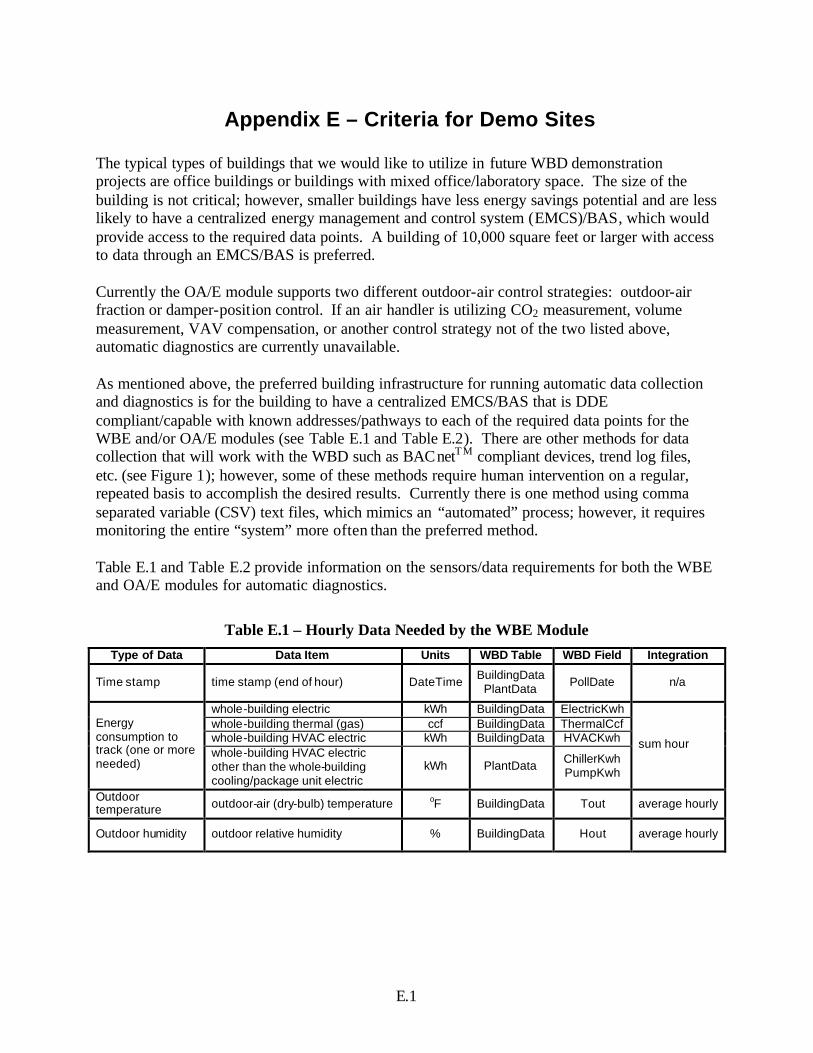
E.1
Appendix E – Criteria for Demo Sites
The typical types of buildings that we would like to utilize in future WBD demonstration projects are office buildings or buildings with mixed office/laboratory space. The size of the building is not critical; however, smaller buildings have less energy savings potential and are less likely to have a centralized energy management and control system (EMCS)/BAS, which would provide access to the required data points. A building of 10,000 square feet or larger with access to data through an EMCS/BAS is preferred. Currently the OA/E module supports two different outdoor-air control strategies: outdoor-air fraction or damper-position control. If an air handler is utilizing CO2 measurement, volume measurement, VAV compensation, or another control strategy not of the two listed above, automatic diagnostics are currently unavailable. As mentioned above, the preferred building infrastructure for running automatic data collection and diagnostics is for the building to have a centralized EMCS/BAS that is DDE compliant/capable with known addresses/pathways to each of the required data points for the WBE and/or OA/E modules (see Table E.1 and Table E.2). There are other methods for data collection that will work with the WBD such as BACnetTM compliant devices, trend log files, etc. (see Figure 1); however, some of these methods require human intervention on a regular, repeated basis to accomplish the desired results. Currently there is one method using comma separated variable (CSV) text files, which mimics an “automated” process; however, it requires monitoring the entire “system” more often than the preferred method. Table E.1 and Table E.2 provide information on the sensors/data requirements for both the WBE and OA/E modules for automatic diagnostics.
Table E.1 – Hourly Data Needed by the WBE Module Type of Data Data Item Units WBD Table WBD Field Integration
Time stamp time stamp (end of hour) DateTime BuildingData PlantData PollDate n/a
whole-building electric kWh BuildingData ElectricKwh whole-building thermal (gas) ccf BuildingData ThermalCcf whole-building HVAC electric kWh BuildingData HVACKwh
Energy consumption to track (one or more needed)
whole-building HVAC electric other than the whole-building cooling/package unit electric
kWh PlantData ChillerKwh PumpKwh
sum hour
Outdoor temperature outdoor-air (dry-bulb) temperature oF BuildingData Tout average hourly
Outdoor humidity outdoor relative humidity % BuildingData Hout average hourly
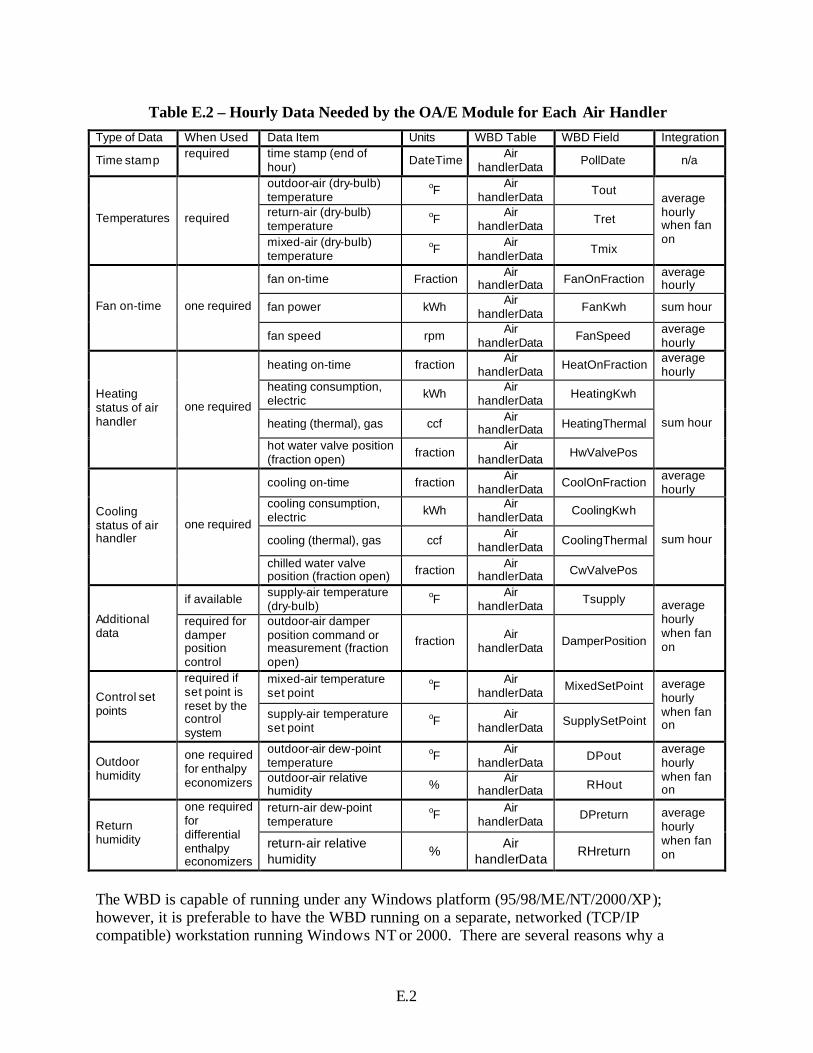
E.2
Table E.2 – Hourly Data Needed by the OA/E Module for Each Air Handler Type of Data When Used Data Item Units WBD Table WBD Field Integration
Time stamp required time stamp (end of hour) DateTime Air
handlerData PollDate n/a
outdoor-air (dry-bulb) temperature
oF Air handlerData Tout
return-air (dry-bulb) temperature
oF Air handlerData Tret Temperatures required
mixed-air (dry-bulb) temperature
oF Air handlerData Tmix
average hourly when fan on
fan on-time Fraction Air handlerData FanOnFraction average
hourly
fan power kWh Air handlerData FanKwh sum hour Fan on-time one required
fan speed rpm Air handlerData FanSpeed average
hourly
heating on-time fraction Air handlerData HeatOnFraction average
hourly heating consumption, electric kWh Air
handlerData HeatingKwh
heating (thermal), gas ccf Air handlerData HeatingThermal
Heating status of air handler
one required
hot water valve position (fraction open) fraction Air
handlerData HwValvePos
sum hour
cooling on-time fraction Air handlerData CoolOnFraction average
hourly cooling consumption, electric kWh Air
handlerData CoolingKwh
cooling (thermal), gas ccf Air handlerData CoolingThermal
Cooling status of air handler
one required
chilled water valve position (fraction open) fraction Air
handlerData CwValvePos
sum hour
if available supply-air temperature (dry-bulb)
oF Air handlerData Tsupply
Additional data
required for damper position control
outdoor-air damper position command or measurement (fraction open)
fraction Air handlerData DamperPosition
average hourly when fan on
mixed-air temperature set point
oF Air handlerData MixedSetPoint
Control set points
required if set point is reset by the control system
supply-air temperature set point
oF Air handlerData SupplySetPoint
average hourly when fan on
outdoor-air dew-point temperature
oF Air handlerData DPout Outdoor
humidity
one required for enthalpy economizers outdoor-air relative
humidity % Air handlerData RHout
average hourly when fan on
return-air dew-point temperature
oF Air handlerData DPreturn
Return humidity
one required for differential enthalpy economizers
return-air relative humidity
% Air
handlerData RHreturn
average hourly when fan on
The WBD is capable of running under any Windows platform (95/98/ME/NT/2000/XP); however, it is preferable to have the WBD running on a separate, networked (TCP/IP compatible) workstation running Windows NT or 2000. There are several reasons why a
E.3
separate workstation is recommended, foremost is to ensure that the WBD processes are not interfering with other user programs. Minimum requirements for the WBD workstation would be the same as those of the operating system; additionally, it is recommended that there be 10 MB of free disk space per air handler per year of data collection and diagnostics. The staffing needs for the demonstrations depend on the type of building automation system at the site and the ability of PNNL staff to access the operator’s workstation remotely for problem solving. If the demonstration site has a building automation system that supports Microsoft’s DDE protocol, the WBD software can be configured in less than 1 day to collect data for a single AHU. Subsequent AHUs will take an hour or two to configure. In the case that the building does not have a suitable/compatible building automation system, the configuration may take longer and also may not be fully automated. If a new driver has to developed, it generally takes about 2 weeks of labor for the development. Processing of the data by the diagnostic modules is fully automated, irrespective of the method of data collection. The review of the initial diagnostic results generally takes longer because most AHUs will have (based on past experience) problems; it gets more complicated if the AHUs have multiple problems. Once the initial problems are identified and corrected, the subsequent reviews take 4 to 6 hours per week.
APPENDIX F
Sample License Agreement

F.1
Appendix F – Sample Software License Form
SCHEDULE A (Starlight Government Use)
1. Individual Requesting Software (User): (Please type or print Name, Title) User’s Mailing Address Delivery Location (if different from mailing address) Telephone No.: Telefax
No.: 3 e-mail:
2.
Software:
Whole Building Diagnostician v. 2.1
Documentation:
Installation and configuration for the Whole Building Diagnostician software
3. Designated User:
4. Special Provisions:
U.S. Government Use Only. This Software is provided for use on Federally funded projects only. If User desires to utilize the software in any other capacity, User must acquire a commercial license from Battelle Memorial Institute (BMI), Attention Sr. License Associate, MSIN K1-53, P.O. Box 999, Richland, Washington 99352. The U.S. Government has "Limited Rights" in this Software, in accordance with FAR Part 52 227-14, Alternate II (June 1987), but BMI has retained all non-U.S. Government rights.
5 Sponsoring Agency: Federal Contract Number: The undersigned has read and agreed to the terms of this Software User Agreement. User’s Agency or Contractor: National Institute of Standards and Technology
Signed By:
Print Name:
Title:
Date:
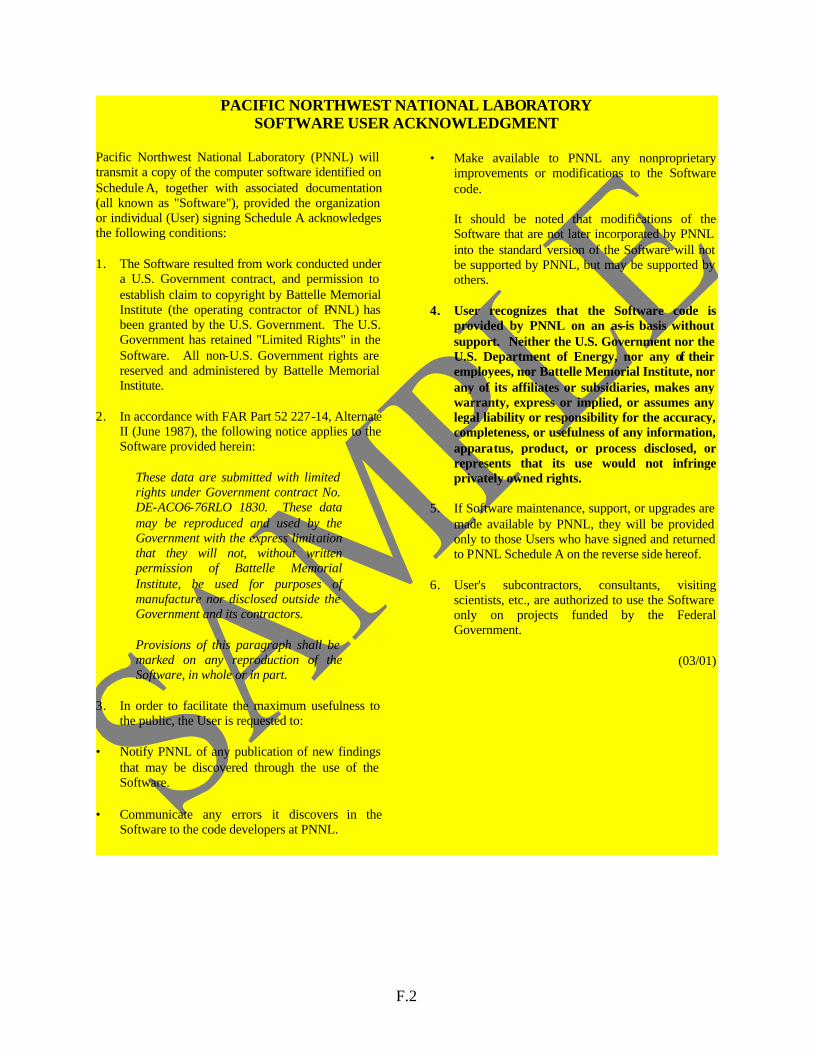
F.2
PACIFIC NORTHWEST NATIONAL LABORATORY SOFTWARE USER ACKNOWLEDGMENT Pacific Northwest National Laboratory (PNNL) will transmit a copy of the computer software identified on Schedule A, together with associated documentation (all known as "Software"), provided the organization or individual (User) signing Schedule A acknowledges the following conditions: 1. The Software resulted from work conducted under
a U.S. Government contract, and permission to establish claim to copyright by Battelle Memorial Institute (the operating contractor of PNNL) has been granted by the U.S. Government. The U.S. Government has retained "Limited Rights" in the Software. All non-U.S. Government rights are reserved and administered by Battelle Memorial Institute.
2. In accordance with FAR Part 52 227-14, Alternate
II (June 1987), the following notice applies to the Software provided herein:
These data are submitted with limited
rights under Government contract No. DE-ACO6-76RLO 1830. These data may be reproduced and used by the Government with the express limitation that they will not, without written permission of Battelle Memorial Institute, be used for purposes of manufacture nor disclosed outside the Government and its contractors.
Provisions of this paragraph shall be
marked on any reproduction of the Software, in whole or in part.
3. In order to facilitate the maximum usefulness to
the public, the User is requested to:
• Notify PNNL of any publication of new findings that may be discovered through the use of the Software.
• Communicate any errors it discovers in the
Software to the code developers at PNNL.
• Make available to PNNL any nonproprietary improvements or modifications to the Software code.
It should be noted that modifications of the Software that are not later incorporated by PNNL into the standard version of the Software will not be supported by PNNL, but may be supported by others.
4. User recognizes that the Software code is
provided by PNNL on an as-is basis without support. Neither the U.S. Government nor the U.S. Department of Energy, nor any of their employees, nor Battelle Memorial Institute, nor any of its affiliates or subsidiaries, makes any warranty, express or implied, or assumes any legal liability or responsibility for the accuracy, completeness, or usefulness of any information, apparatus, product, or process disclosed, or represents that its use would not infringe privately owned rights.
5. If Software maintenance, support, or upgrades are
made available by PNNL, they will be provided only to those Users who have signed and returned to PNNL Schedule A on the reverse side hereof.
6. User's subcontractors, consultants, visiting
scientists, etc., are authorized to use the Software only on projects funded by the Federal Government.
(03/01)

F.3