Embed Size (px)
Citation preview
New particle formation in anthropogenic plumes advecting from Asia
observed during TRACE-P
R. J. Weber,1 S. Lee,1 G. Chen,2 B. Wang,1 V. Kapustin,3 K. Moore,3 A. D. Clarke,3
L. Mauldin,4 E. Kosciuch,4 C. Cantrell,4 F. Eisele,1,4 D. C. Thornton,5 A. R. Bandy,5
G. W. Sachse,2 and H. E. Fuelberg6
Received 31 October 2002; revised 6 March 2003; accepted 19 March 2003; published 11 November 2003.
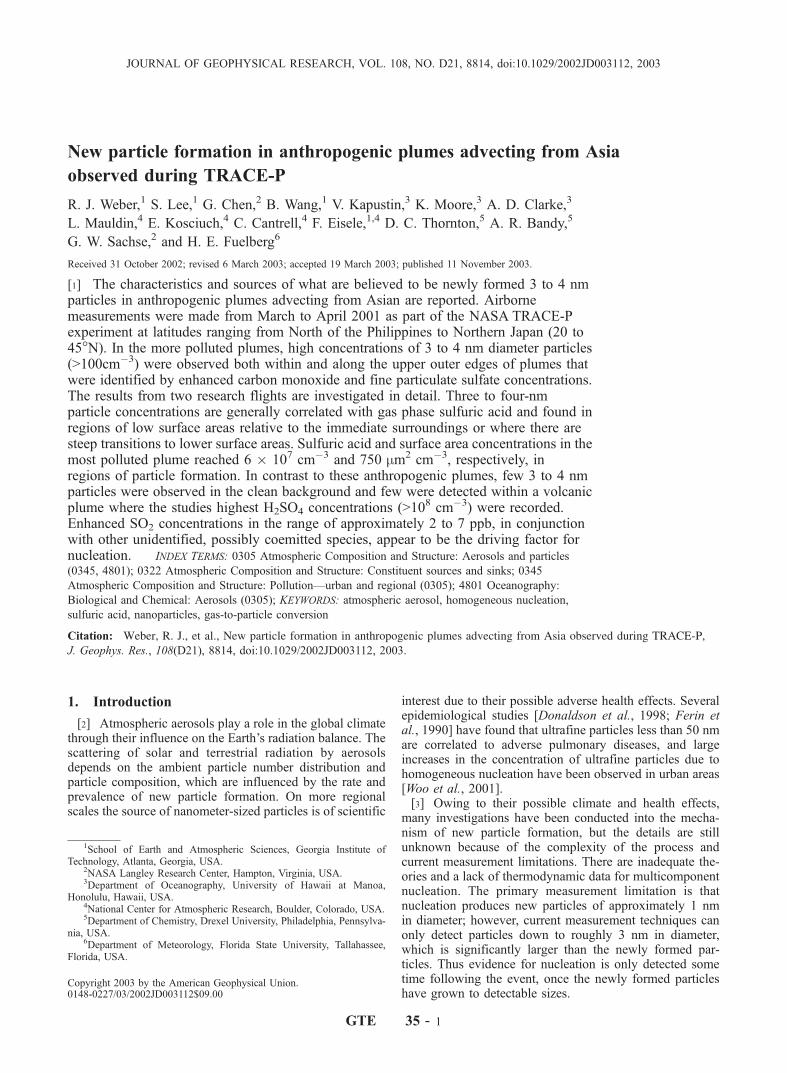
[1] The characteristics and sources of what are believed to be newly formed 3 to 4 nmparticles in anthropogenic plumes advecting from Asian are reported. Airbornemeasurements were made from March to April 2001 as part of the NASA TRACE-Pexperiment at latitudes ranging from North of the Philippines to Northern Japan (20 to45�N). In the more polluted plumes, high concentrations of 3 to 4 nm diameter particles(>100cm�3) were observed both within and along the upper outer edges of plumes thatwere identified by enhanced carbon monoxide and fine particulate sulfate concentrations.The results from two research flights are investigated in detail. Three to four-nmparticle concentrations are generally correlated with gas phase sulfuric acid and found inregions of low surface areas relative to the immediate surroundings or where there aresteep transitions to lower surface areas. Sulfuric acid and surface area concentrations in themost polluted plume reached 6 � 107 cm�3 and 750 mm2 cm�3, respectively, inregions of particle formation. In contrast to these anthropogenic plumes, few 3 to 4 nmparticles were observed in the clean background and few were detected within a volcanicplume where the studies highest H2SO4 concentrations (>10
8 cm�3) were recorded.Enhanced SO2 concentrations in the range of approximately 2 to 7 ppb, in conjunctionwith other unidentified, possibly coemitted species, appear to be the driving factor fornucleation. INDEX TERMS: 0305 Atmospheric Composition and Structure: Aerosols and particles
(0345, 4801); 0322 Atmospheric Composition and Structure: Constituent sources and sinks; 0345
Atmospheric Composition and Structure: Pollution—urban and regional (0305); 4801 Oceanography:
Biological and Chemical: Aerosols (0305); KEYWORDS: atmospheric aerosol, homogeneous nucleation,
sulfuric acid, nanoparticles, gas-to-particle conversion
Citation: Weber, R. J., et al., New particle formation in anthropogenic plumes advecting from Asia observed during TRACE-P,
J. Geophys. Res., 108(D21), 8814, doi:10.1029/2002JD003112, 2003.
1. Introduction
[2] Atmospheric aerosols play a role in the global climatethrough their influence on the Earth’s radiation balance. Thescattering of solar and terrestrial radiation by aerosolsdepends on the ambient particle number distribution andparticle composition, which are influenced by the rate andprevalence of new particle formation. On more regionalscales the source of nanometer-sized particles is of scientific
interest due to their possible adverse health effects. Severalepidemiological studies [Donaldson et al., 1998; Ferin etal., 1990] have found that ultrafine particles less than 50 nmare correlated to adverse pulmonary diseases, and largeincreases in the concentration of ultrafine particles due tohomogeneous nucleation have been observed in urban areas[Woo et al., 2001].[3] Owing to their possible climate and health effects,
many investigations have been conducted into the mecha-nism of new particle formation, but the details are stillunknown because of the complexity of the process andcurrent measurement limitations. There are inadequate the-ories and a lack of thermodynamic data for multicomponentnucleation. The primary measurement limitation is thatnucleation produces new particles of approximately 1 nmin diameter; however, current measurement techniques canonly detect particles down to roughly 3 nm in diameter,which is significantly larger than the newly formed par-ticles. Thus evidence for nucleation is only detected sometime following the event, once the newly formed particleshave grown to detectable sizes.
JOURNAL OF GEOPHYSICAL RESEARCH, VOL. 108, NO. D21, 8814, doi:10.1029/2002JD003112, 2003
1School of Earth and Atmospheric Sciences, Georgia Institute ofTechnology, Atlanta, Georgia, USA.
2NASA Langley Research Center, Hampton, Virginia, USA.3Department of Oceanography, University of Hawaii at Manoa,
Honolulu, Hawaii, USA.4National Center for Atmospheric Research, Boulder, Colorado, USA.5Department of Chemistry, Drexel University, Philadelphia, Pennsylva-
nia, USA.6Department of Meteorology, Florida State University, Tallahassee,
Florida, USA.
Copyright 2003 by the American Geophysical Union.0148-0227/03/2002JD003112$09.00
GTE 35 - 1
[4] Previous work suggests that H2SO4 often is a nucle-ation precursor, since nucleation events, indicated byunusually high concentrations of 3–4 nm or concentrationsof 3–10 nm diameter particles, is correlated with H2SO4
concentrations. In the past, binary H2SO4-H2O homoge-neous nucleation has been considered as the most likelynucleation mechanism. However, previous studies, in whichH2SO4 and nm-sized particles were measured, find thatobserved particle formation rates cannot be explained byclassical binary nucleation theory [Birmili et al., 2000;Birmili and Wiedensohler, 2000; Weber et al., 1995, 1996,1997, 1998a, 1999].[5] Ternary nucleation [Coffman and Hegg, 1995;
Korhonen et al., 1999] has been proposed as a mechanismthat may explain the observations. Experiments show thatadding NH3 to the binary H2SO4-H2O system can increasethe rate of new particle formation [Ball et al., 1999]. Someworkers have found new particle formation where NH3 isexpected to play a role [Birmili et al., 2000; Weber et al.,1998a]. An ion-mediated nucleation mechanism is also apossible route for particle formation [Yu and Turco, 2001].[6] Although many studies have focused on nucleation in
remote regions, evidence for nucleation under pollutedconditions has also been observed. Increased particle con-centrations have been detected at the edges of power plantand smelter plumes [Brock et al., 2003; Wilson, 1978;Williams et al., 1981]. In some cases, the newly formedparticles are often found at the edges of relatively freshplumes (<2 hours old) [Brock et al., 2003] where photo-chemical models predict highest hydroxyl radical (OH)concentrations and enhanced production of H2SO4 byoxidation of SO2. New particle formation has been observedin urban settings, such as Atlanta, Georgia [McMurry et al.,2000]. In this case, evidence for nucleation was based onevents when the sub 10-nm size distribution tailed off tohigher concentrations as sizes approached the detectionlimit of 3 nm. McMurry et al. [2000] suggest that nucleationin Atlanta may be explained by a collision-controlledprocess involving H2SO4.[7] One objective of the National Atmospheric and Space
Administration (NASA) Transport and Chemical Evolutionover Pacific (TRACE-P) mission was to investigate themechanisms and conditions of particle production associ-ated with Asian plumes emanating from the densely popu-late regions of China, Korea, and Japan. Jacob et al. [2003]provides an overview of the TRACE-P experiment. Thismission provided an opportunity to sample plumes withvarying characteristics, including biomass, volcanic, andurban pollution plumes. We find that high concentrationsof 3 to 4nm particles are only associated with the pollutionplumes. This paper describes the conditions where evidencefor recent nucleation was observed from two research flightsand briefly investigates the nucleation mechanism by con-trasting the various observations.
2. Instrumentation
[8] The intensive measurement component of TRACE-Pran from February through April 2001. The aim of thismultiinvestigator experiment was to characterize air massesadvected from Asia to gain insights into the physical andchemical processing of gases and aerosol particles in Asian
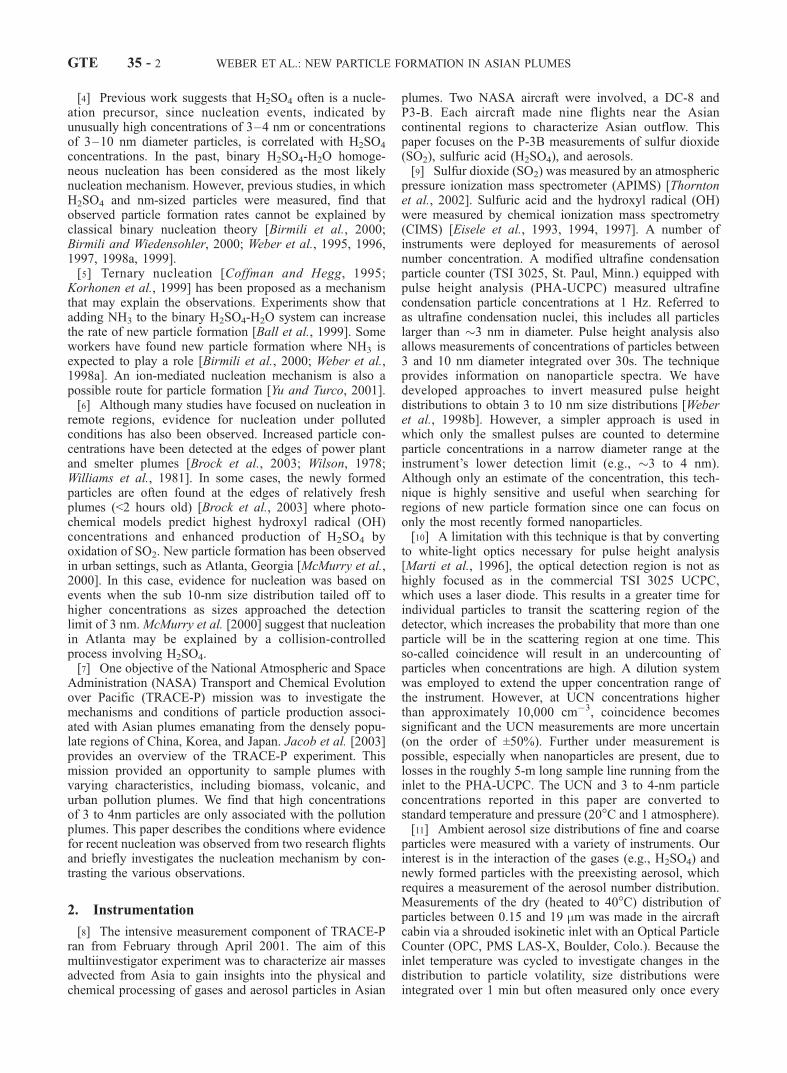
plumes. Two NASA aircraft were involved, a DC-8 andP3-B. Each aircraft made nine flights near the Asiancontinental regions to characterize Asian outflow. Thispaper focuses on the P-3B measurements of sulfur dioxide(SO2), sulfuric acid (H2SO4), and aerosols.[9] Sulfur dioxide (SO2) was measured by an atmospheric
pressure ionization mass spectrometer (APIMS) [Thorntonet al., 2002]. Sulfuric acid and the hydroxyl radical (OH)were measured by chemical ionization mass spectrometry(CIMS) [Eisele et al., 1993, 1994, 1997]. A number ofinstruments were deployed for measurements of aerosolnumber concentration. A modified ultrafine condensationparticle counter (TSI 3025, St. Paul, Minn.) equipped withpulse height analysis (PHA-UCPC) measured ultrafinecondensation particle concentrations at 1 Hz. Referred toas ultrafine condensation nuclei, this includes all particleslarger than �3 nm in diameter. Pulse height analysis alsoallows measurements of concentrations of particles between3 and 10 nm diameter integrated over 30s. The techniqueprovides information on nanoparticle spectra. We havedeveloped approaches to invert measured pulse heightdistributions to obtain 3 to 10 nm size distributions [Weberet al., 1998b]. However, a simpler approach is used inwhich only the smallest pulses are counted to determineparticle concentrations in a narrow diameter range at theinstrument’s lower detection limit (e.g., �3 to 4 nm).Although only an estimate of the concentration, this tech-nique is highly sensitive and useful when searching forregions of new particle formation since one can focus ononly the most recently formed nanoparticles.[10] A limitation with this technique is that by converting
to white-light optics necessary for pulse height analysis[Marti et al., 1996], the optical detection region is not ashighly focused as in the commercial TSI 3025 UCPC,which uses a laser diode. This results in a greater time forindividual particles to transit the scattering region of thedetector, which increases the probability that more than oneparticle will be in the scattering region at one time. Thisso-called coincidence will result in an undercounting ofparticles when concentrations are high. A dilution systemwas employed to extend the upper concentration range ofthe instrument. However, at UCN concentrations higherthan approximately 10,000 cm�3, coincidence becomessignificant and the UCN measurements are more uncertain(on the order of ±50%). Further under measurement ispossible, especially when nanoparticles are present, due tolosses in the roughly 5-m long sample line running from theinlet to the PHA-UCPC. The UCN and 3 to 4-nm particleconcentrations reported in this paper are converted tostandard temperature and pressure (20�C and 1 atmosphere).[11] Ambient aerosol size distributions of fine and coarse
particles were measured with a variety of instruments. Ourinterest is in the interaction of the gases (e.g., H2SO4) andnewly formed particles with the preexisting aerosol, whichrequires a measurement of the aerosol number distribution.Measurements of the dry (heated to 40�C) distribution ofparticles between 0.15 and 19 mm was made in the aircraftcabin via a shrouded isokinetic inlet with an Optical ParticleCounter (OPC, PMS LAS-X, Boulder, Colo.). Because theinlet temperature was cycled to investigate changes in thedistribution to particle volatility, size distributions wereintegrated over 1 min but often measured only once every
GTE 35 - 2 WEBER ET AL.: NEW PARTICLE FORMATION IN ASIAN PLUMES
3 min. Ambient wet particle size distributions are estimatedby assuming accumulation mode particles (diameters lessthan 0.6 mm diameter) absorb water as a generic marineaerosol [Swietlicki et al., 2000], and coarse mode particlesbehave as dust and do not absorb water. The measuredsurface areas are uncertain for a number of reasons: (1) Inletand sampling losses of particles with diameters larger thanapproximately 3 mm. (2) Losses of semivolatile material,other than water, on heating the particles to 40�C.(3) Uncertainties associated with converting the dry distri-bution to ambient size distributions by calculating theaerosol particle uptake of water.[12] A wing-mounted Forward Scattering Spectrometer
Probe 300 (FSSP; 0.3 � 20 mm diameter) provided particleliquid water content data, which was used to identifyspurious UCN data due to sampling artifacts associatedwith droplet shatter on the aerosol sampling inlet [Weber etal., 1998c]. Evidence of shatter has been removed from thedata set for this analysis.[13] The bulk ionic composition of fine particles was
measured continuously and in near real-time with a ParticleInto Liquid Sampler, PILS [Orsini et al., 2003; Weber et al.,2001b]. The anions (chloride, nitrate, and sulfate) andcations (sodium, ammonium, potassium, magnesium, andcalcium) were measured at a rate of every 4 min. Table 1summarizes the main gaseous and particle components usedin this analysis along with the measurement technique,institution, and principle investigator.
3. Theory
[14] In the following discussion, a number of factors arecalculated to aid in the analysis. This includes the sulfuricrelative acidity, the loss of H2SO4, and newly formed1.5-nm-diameter particles by preexisting particle scaveng-ing, and the production rate of H2SO4 and its predictedsteady state concentration.
3.1. Sulfuric Relative Acidity
[15] Classical nucleation theory predicts that nucleationrates depend on the degree of vapor saturation [e.g.,Wilemski, 1984]. A measure of H2SO4 vapor saturation isthe sulfuric relative acidity (RA). RA is calculated from themeasured H2SO4 concentration (this includes all monoacidhydrates), divided by the saturation concentration of pureacid over a flat surface, given as the partial pressure inatmospheres ( p) by Ayers et al. [1980] as:
p ¼ exp �10156=Tþ 16:259ð Þ ð1Þ
where T is the absolute temperature.
3.2. Scavenging of H2SO4 and 1.5 nm DiameterParticle
[16] The rates of H2SO4 and 1.5-nm particle loss byabsorption onto the preexisting aerosol particles is calcu-lated using the method of Fuchs and Sutugin [1970] as wehave done in other studies [Eisele and Tanner, 1993;Jefferson et al., 1998; Weber et al., 2001a; Weber et al.,1997]. For the calculation of H2SO4 scavenging, an accom-modation coefficient of 0.72 is assumed [Jefferson et al.,1997] and the hydrated H2SO4 molecule diffusivity of0.08 cm2 s�1 [Roedel, 1979] is used. The effect of ambienttemperature and RH on monomer mass is estimated frombulk properties [Gmitro and Vermeulen, 1963] and used tocalculate the monomer average thermal speed.[17] Scavenging losses of newly formed particles are
estimated by calculating the loss of a 1.5 nm diameterparticle, as a surrogate for particles between 1 and 3 nm indiameter, using the same method as that for H2SO4. In thiscase, we assume an accommodation coefficient of 1, and the1.5 nm-particle thermal speed is calculated as a function oftemperature and a constant relative humidity of 50%, and acalculated diffusivity. In both calculations, the inverse of theFuchs-Sutugin first order loss rate constant (k0, units 1/s) isthe characteristic (e-folding) scavenging time.
3.3. H2SO4 Production Rates and Calculated SteadyState Concentrations
[18] The rate at which H2SO4 vapor is produced iscalculated by:
R ¼ k OH½ SO2½ ð2Þ
where the rate constant, k depends on ambient temperatureand pressure and ranges from 7 to 9 � 10�13 cm�3 s�1
[DeMore et al., 1992]. Since the H2SO4 scavenging rates(k0) are high in these plumes, H2SO4 is likely in a steadystate balance between production and loss. This is a goodapproximation since typical H2SO4 lifetimes are in therange of less than one minute to four minutes (see Table 2).The calculated steady state acid concentration is then:
H2SO4½ c¼ R=k0: ð3Þ
In the following analysis, consistency between SO2, H2SO4
and the preexisting ambient aerosol distribution is assessedby comparing measured H2SO4 concentrations to [H2SO4]c.
4. Observations
[19] TRACE-P was conducted from March to mid-Aprilfrom two bases of operation. Flights were first made from
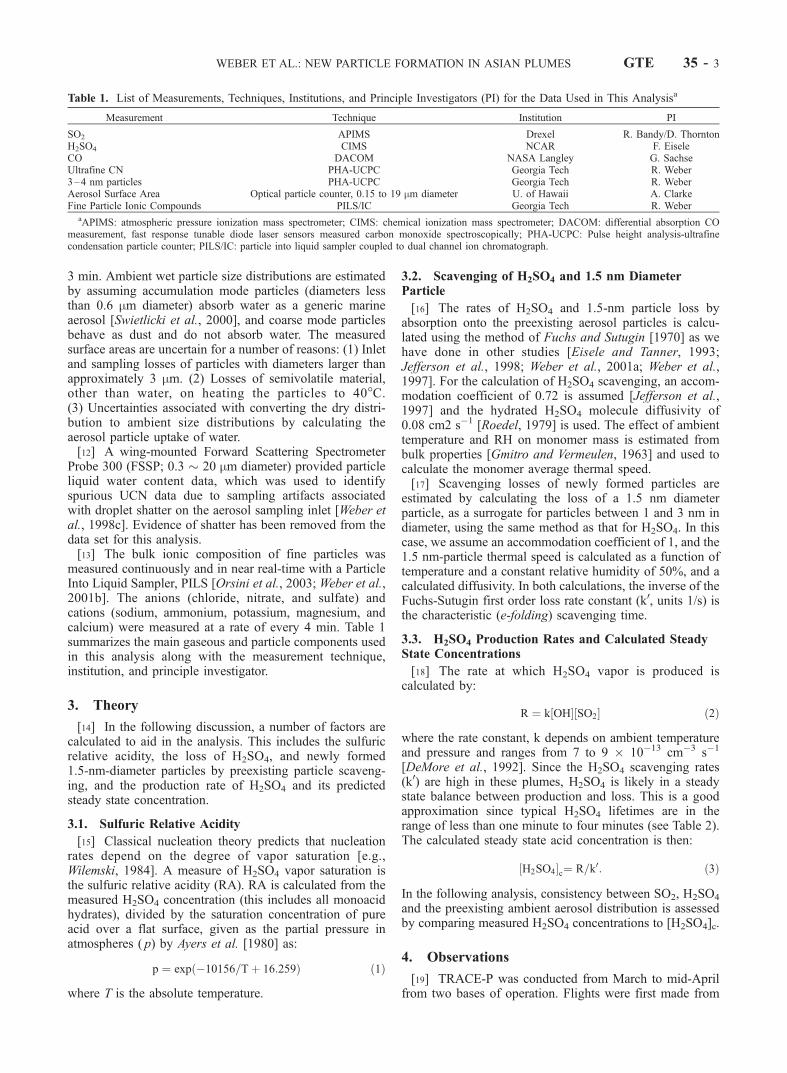
Table 1. List of Measurements, Techniques, Institutions, and Principle Investigators (PI) for the Data Used in This Analysisa
Measurement Technique Institution PI
SO2 APIMS Drexel R. Bandy/D. ThorntonH2SO4 CIMS NCAR F. EiseleCO DACOM NASA Langley G. SachseUltrafine CN PHA-UCPC Georgia Tech R. Weber3–4 nm particles PHA-UCPC Georgia Tech R. WeberAerosol Surface Area Optical particle counter, 0.15 to 19 mm diameter U. of Hawaii A. ClarkeFine Particle Ionic Compounds PILS/IC Georgia Tech R. Weber
aAPIMS: atmospheric pressure ionization mass spectrometer; CIMS: chemical ionization mass spectrometer; DACOM: differential absorption COmeasurement, fast response tunable diode laser sensors measured carbon monoxide spectroscopically; PHA-UCPC: Pulse height analysis-ultrafinecondensation particle counter; PILS/IC: particle into liquid sampler coupled to dual channel ion chromatograph.
WEBER ET AL.: NEW PARTICLE FORMATION IN ASIAN PLUMES GTE 35 - 3
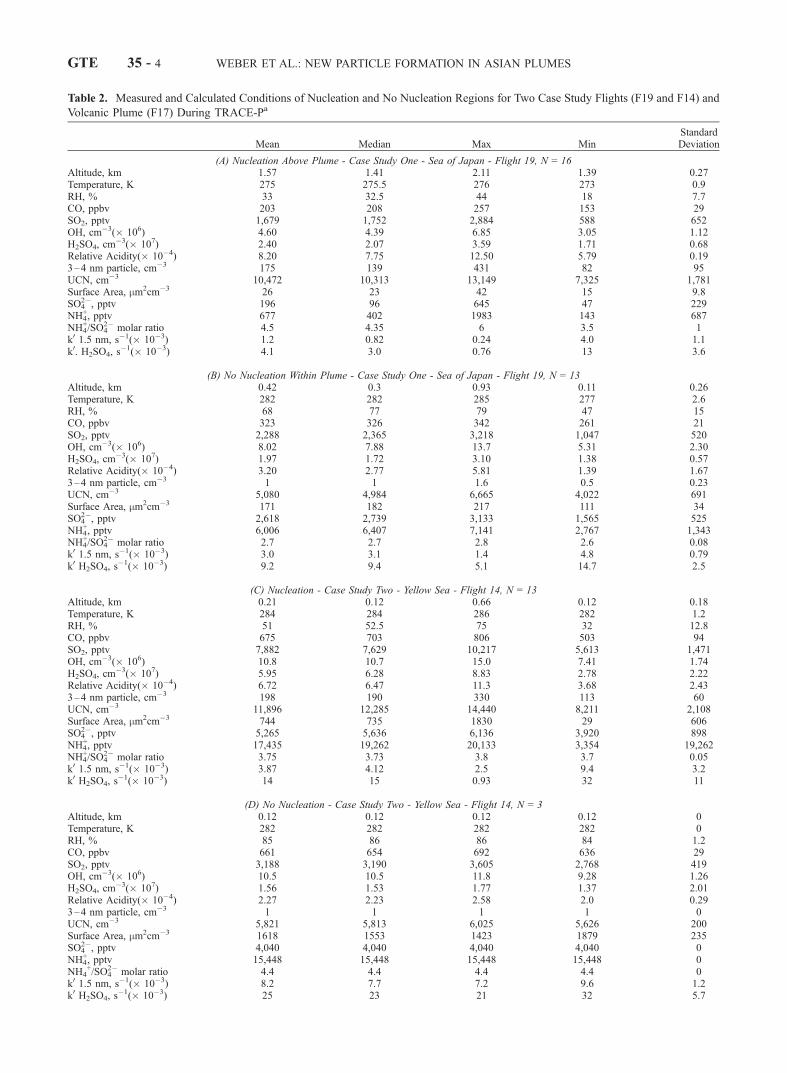
Table 2. Measured and Calculated Conditions of Nucleation and No Nucleation Regions for Two Case Study Flights (F19 and F14) and
Volcanic Plume (F17) During TRACE-Pa
Mean Median Max MinStandardDeviation
(A) Nucleation Above Plume - Case Study One - Sea of Japan - Flight 19, N = 16Altitude, km 1.57 1.41 2.11 1.39 0.27Temperature, K 275 275.5 276 273 0.9RH, % 33 32.5 44 18 7.7CO, ppbv 203 208 257 153 29SO2, pptv 1,679 1,752 2,884 588 652OH, cm�3(� 106) 4.60 4.39 6.85 3.05 1.12H2SO4, cm
�3(� 107) 2.40 2.07 3.59 1.71 0.68Relative Acidity(� 10�4) 8.20 7.75 12.50 5.79 0.193–4 nm particle, cm�3 175 139 431 82 95UCN, cm�3 10,472 10,313 13,149 7,325 1,781Surface Area, mm2cm�3 26 23 42 15 9.8SO4
2�, pptv 196 96 645 47 229NH4
+, pptv 677 402 1983 143 687NH4
+/SO42� molar ratio 4.5 4.35 6 3.5 1
k0 1.5 nm, s�1(� 10�3) 1.2 0.82 0.24 4.0 1.1k0. H2SO4, s
�1(� 10�3) 4.1 3.0 0.76 13 3.6
(B) No Nucleation Within Plume - Case Study One - Sea of Japan - Flight 19, N = 13Altitude, km 0.42 0.3 0.93 0.11 0.26Temperature, K 282 282 285 277 2.6RH, % 68 77 79 47 15CO, ppbv 323 326 342 261 21SO2, pptv 2,288 2,365 3,218 1,047 520OH, cm�3(� 106) 8.02 7.88 13.7 5.31 2.30H2SO4, cm
�3(� 107) 1.97 1.72 3.10 1.38 0.57Relative Acidity(� 10�4) 3.20 2.77 5.81 1.39 1.673–4 nm particle, cm�3 1 1 1.6 0.5 0.23UCN, cm�3 5,080 4,984 6,665 4,022 691Surface Area, mm2cm�3 171 182 217 111 34SO4
2�, pptv 2,618 2,739 3,133 1,565 525NH4
+, pptv 6,006 6,407 7,141 2,767 1,343NH4
+/SO42� molar ratio 2.7 2.7 2.8 2.6 0.08
k0 1.5 nm, s�1(� 10�3) 3.0 3.1 1.4 4.8 0.79k0 H2SO4, s
�1(� 10�3) 9.2 9.4 5.1 14.7 2.5
(C) Nucleation - Case Study Two - Yellow Sea - Flight 14, N = 13Altitude, km 0.21 0.12 0.66 0.12 0.18Temperature, K 284 284 286 282 1.2RH, % 51 52.5 75 32 12.8CO, ppbv 675 703 806 503 94SO2, pptv 7,882 7,629 10,217 5,613 1,471OH, cm�3(� 106) 10.8 10.7 15.0 7.41 1.74H2SO4, cm
�3(� 107) 5.95 6.28 8.83 2.78 2.22Relative Acidity(� 10�4) 6.72 6.47 11.3 3.68 2.433–4 nm particle, cm�3 198 190 330 113 60UCN, cm�3 11,896 12,285 14,440 8,211 2,108Surface Area, mm2cm�3 744 735 1830 29 606SO4
2�, pptv 5,265 5,636 6,136 3,920 898NH4
+, pptv 17,435 19,262 20,133 3,354 19,262NH4
+/SO42� molar ratio 3.75 3.73 3.8 3.7 0.05
k0 1.5 nm, s�1(� 10�3) 3.87 4.12 2.5 9.4 3.2k0 H2SO4, s
�1(� 10�3) 14 15 0.93 32 11
(D) No Nucleation - Case Study Two - Yellow Sea - Flight 14, N = 3Altitude, km 0.12 0.12 0.12 0.12 0Temperature, K 282 282 282 282 0RH, % 85 86 86 84 1.2CO, ppbv 661 654 692 636 29SO2, pptv 3,188 3,190 3,605 2,768 419OH, cm�3(� 106) 10.5 10.5 11.8 9.28 1.26H2SO4, cm
�3(� 107) 1.56 1.53 1.77 1.37 2.01Relative Acidity(� 10�4) 2.27 2.23 2.58 2.0 0.293–4 nm particle, cm�3 1 1 1 1 0UCN, cm�3 5,821 5,813 6,025 5,626 200Surface Area, mm2cm�3 1618 1553 1423 1879 235SO4
2�, pptv 4,040 4,040 4,040 4,040 0NH4
+, pptv 15,448 15,448 15,448 15,448 0NH4
+/SO42� molar ratio 4.4 4.4 4.4 4.4 0
k0 1.5 nm, s�1(� 10�3) 8.2 7.7 7.2 9.6 1.2k0 H2SO4, s
�1(� 10�3) 25 23 21 32 5.7
GTE 35 - 4 WEBER ET AL.: NEW PARTICLE FORMATION IN ASIAN PLUMES
Hong Kong, China from 5 to 16 March 2001. The aircraftwas then based out of Yokota Air Force Base near Tokyo,Japan between 17 March and 3 April 2001. The geograph-ical region investigated is shown in Figure 1. A variety ofplumes were sampled during the study and identified by thegaseous and fine particle chemical components. High CO,SO2, and fine particle sulfate (SO4
2�) concentrations iden-tify anthropogenic plumes. CO and SO2 indicate combus-tion sources. SO4
2� is from gas-to-particle conversion ofanthropogenic SO2 and provides a measure of the aerosolloading, assuming that the biogenic SO2 sources in thisregion are small in comparison to the anthropogenic emis-sions. There is also a volcanic SO2 source from Miyaka-Jima, in southern Japan, which is identified by high SO2
concentrations and a lack of CO. This was a major source ofSO2 during the TRACE-P experiment [Tang et al., 2003].
Fine particle potassium and CO, along with other species,identified biomass burning emissions. The role of biomassburning on fine particle composition is discussed by Ma etal. [2003].[20] Several flights with plumes of unique characteristics
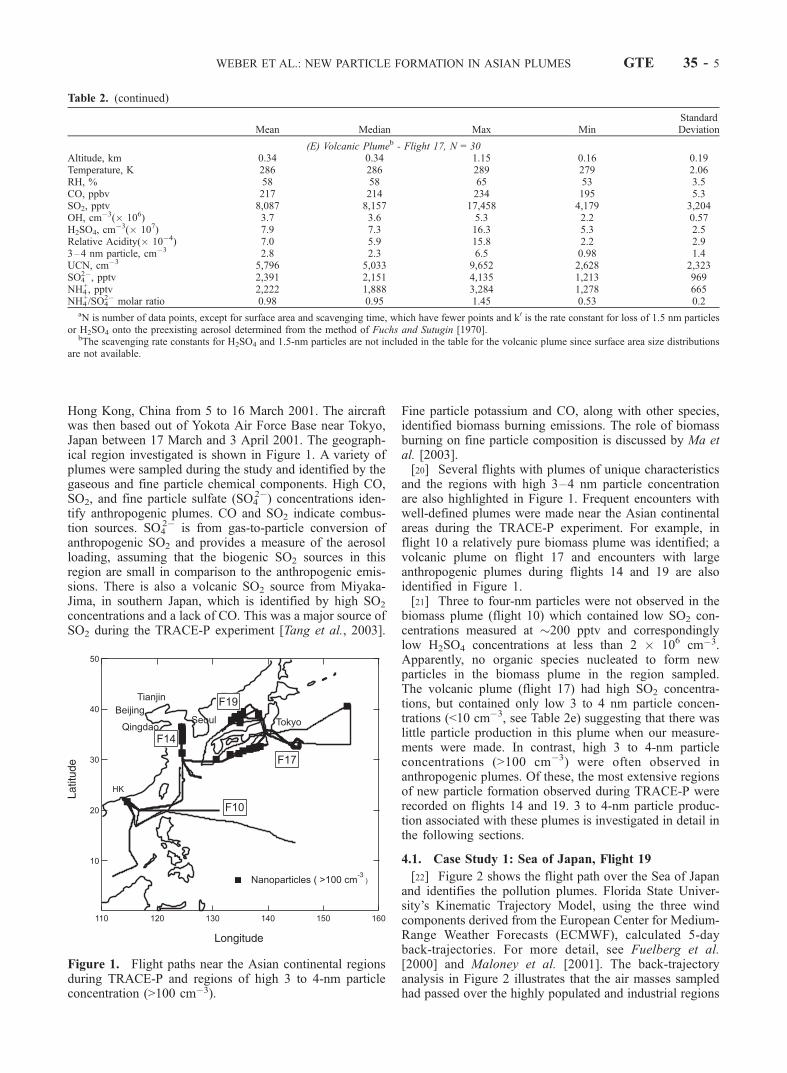
and the regions with high 3–4 nm particle concentrationare also highlighted in Figure 1. Frequent encounters withwell-defined plumes were made near the Asian continentalareas during the TRACE-P experiment. For example, inflight 10 a relatively pure biomass plume was identified; avolcanic plume on flight 17 and encounters with largeanthropogenic plumes during flights 14 and 19 are alsoidentified in Figure 1.[21] Three to four-nm particles were not observed in the
biomass plume (flight 10) which contained low SO2 con-centrations measured at �200 pptv and correspondinglylow H2SO4 concentrations at less than 2 � 106 cm�3.Apparently, no organic species nucleated to form newparticles in the biomass plume in the region sampled.The volcanic plume (flight 17) had high SO2 concentra-tions, but contained only low 3 to 4 nm particle concen-trations (<10 cm�3, see Table 2e) suggesting that there waslittle particle production in this plume when our measure-ments were made. In contrast, high 3 to 4-nm particleconcentrations (>100 cm�3) were often observed inanthropogenic plumes. Of these, the most extensive regionsof new particle formation observed during TRACE-P wererecorded on flights 14 and 19. 3 to 4-nm particle produc-tion associated with these plumes is investigated in detail inthe following sections.
4.1. Case Study 1: Sea of Japan, Flight 19
[22] Figure 2 shows the flight path over the Sea of Japanand identifies the pollution plumes. Florida State Univer-sity’s Kinematic Trajectory Model, using the three windcomponents derived from the European Center for Medium-Range Weather Forecasts (ECMWF), calculated 5-dayback-trajectories. For more detail, see Fuelberg et al.[2000] and Maloney et al. [2001]. The back-trajectoryanalysis in Figure 2 illustrates that the air masses sampledhad passed over the highly populated and industrial regions
Table 2. (continued)
Mean Median Max MinStandardDeviation
(E) Volcanic Plumeb - Flight 17, N = 30Altitude, km 0.34 0.34 1.15 0.16 0.19Temperature, K 286 286 289 279 2.06RH, % 58 58 65 53 3.5CO, ppbv 217 214 234 195 5.3SO2, pptv 8,087 8,157 17,458 4,179 3,204OH, cm�3(� 106) 3.7 3.6 5.3 2.2 0.57H2SO4, cm
�3(� 107) 7.9 7.3 16.3 5.3 2.5Relative Acidity(� 10�4) 7.0 5.9 15.8 2.2 2.93–4 nm particle, cm�3 2.8 2.3 6.5 0.98 1.4UCN, cm�3 5,796 5,033 9,652 2,628 2,323SO4
2�, pptv 2,391 2,151 4,135 1,213 969NH4
+, pptv 2,222 1,888 3,284 1,278 665NH4
+/SO42� molar ratio 0.98 0.95 1.45 0.53 0.2
aN is number of data points, except for surface area and scavenging time, which have fewer points and k0 is the rate constant for loss of 1.5 nm particlesor H2SO4 onto the preexisting aerosol determined from the method of Fuchs and Sutugin [1970].
bThe scavenging rate constants for H2SO4 and 1.5-nm particles are not included in the table for the volcanic plume since surface area size distributionsare not available.
Figure 1. Flight paths near the Asian continental regionsduring TRACE-P and regions of high 3 to 4-nm particleconcentration (>100 cm�3).
WEBER ET AL.: NEW PARTICLE FORMATION IN ASIAN PLUMES GTE 35 - 5
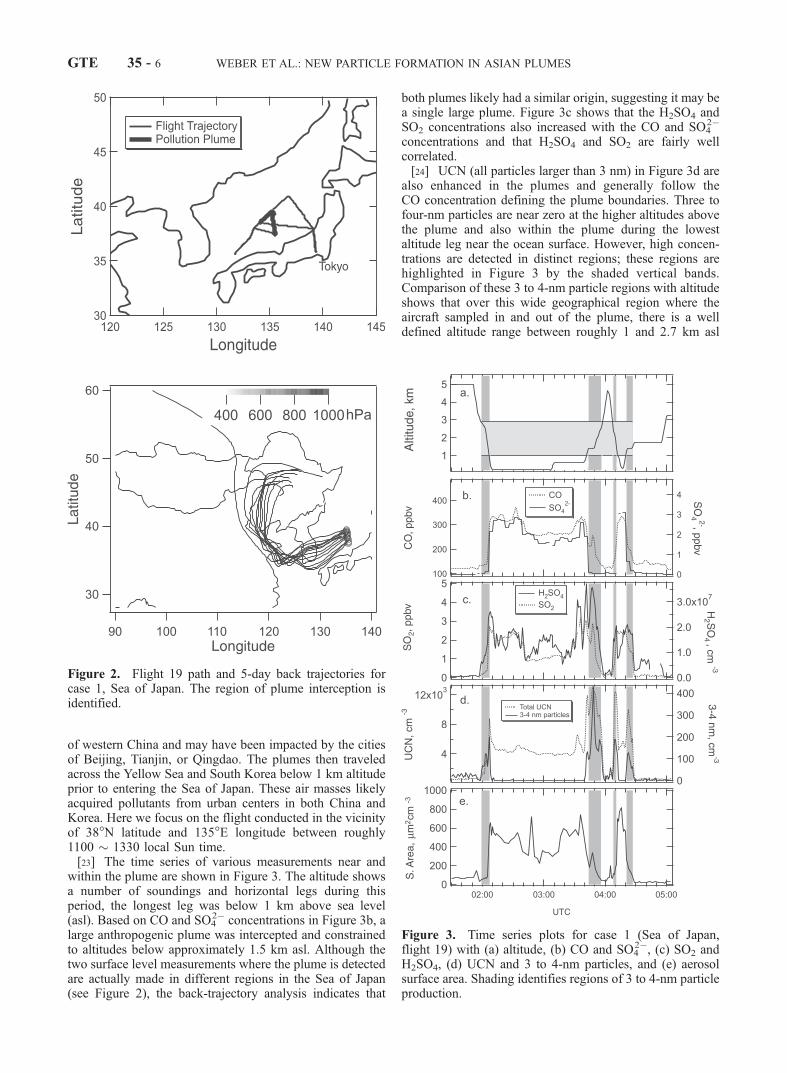
of western China and may have been impacted by the citiesof Beijing, Tianjin, or Qingdao. The plumes then traveledacross the Yellow Sea and South Korea below 1 km altitudeprior to entering the Sea of Japan. These air masses likelyacquired pollutants from urban centers in both China andKorea. Here we focus on the flight conducted in the vicinityof 38�N latitude and 135�E longitude between roughly1100 � 1330 local Sun time.[23] The time series of various measurements near and
within the plume are shown in Figure 3. The altitude showsa number of soundings and horizontal legs during thisperiod, the longest leg was below 1 km above sea level(asl). Based on CO and SO4
2� concentrations in Figure 3b, alarge anthropogenic plume was intercepted and constrainedto altitudes below approximately 1.5 km asl. Although thetwo surface level measurements where the plume is detectedare actually made in different regions in the Sea of Japan(see Figure 2), the back-trajectory analysis indicates that
both plumes likely had a similar origin, suggesting it may bea single large plume. Figure 3c shows that the H2SO4 andSO2 concentrations also increased with the CO and SO4
2�
concentrations and that H2SO4 and SO2 are fairly wellcorrelated.[24] UCN (all particles larger than 3 nm) in Figure 3d are
also enhanced in the plumes and generally follow theCO concentration defining the plume boundaries. Three tofour-nm particles are near zero at the higher altitudes abovethe plume and also within the plume during the lowestaltitude leg near the ocean surface. However, high concen-trations are detected in distinct regions; these regions arehighlighted in Figure 3 by the shaded vertical bands.Comparison of these 3 to 4-nm particle regions with altitudeshows that over this wide geographical region where theaircraft sampled in and out of the plume, there is a welldefined altitude range between roughly 1 and 2.7 km asl
Figure 2. Flight 19 path and 5-day back trajectories forcase 1, Sea of Japan. The region of plume interception isidentified.
Figure 3. Time series plots for case 1 (Sea of Japan,flight 19) with (a) altitude, (b) CO and SO4
2�, (c) SO2 andH2SO4, (d) UCN and 3 to 4-nm particles, and (e) aerosolsurface area. Shading identifies regions of 3 to 4-nm particleproduction.
GTE 35 - 6 WEBER ET AL.: NEW PARTICLE FORMATION IN ASIAN PLUMES
where 3 to 4-nm particles are always detected. The cross-hatched box in Figure 3a identifies the altitude of thisregion.[25] High 3 to 4-nm and UCN particles (shaded areas in
Figure 3) appear to be associated with the high H2SO4
concentrations and suggests that H2SO4 may have partici-pated in new particle production in these regions. However,note that there are regions within the plume near the oceansurface where concentrations of H2SO4 are similar to the 3to 4-nm particle regions but where 3 to 4-nm particleconcentrations are very low. These regions have muchhigher aerosol surface area concentrations, whereas the 3to 4-nm particle regions are found where surface areas arelowest. On average, the characteristic lifetime of a 1.5 nmparticle (1/k0) within the plumes is about 6 min, comparedwith 14 min in the 3 to 4-nm regions. These and variousother measurements in the 3–4 nm particle regions andwithin the plume that lacked nucleation are summarized inTables 2a and 2b, respectively.[26] The unique 3–4 nm particle regions associated with
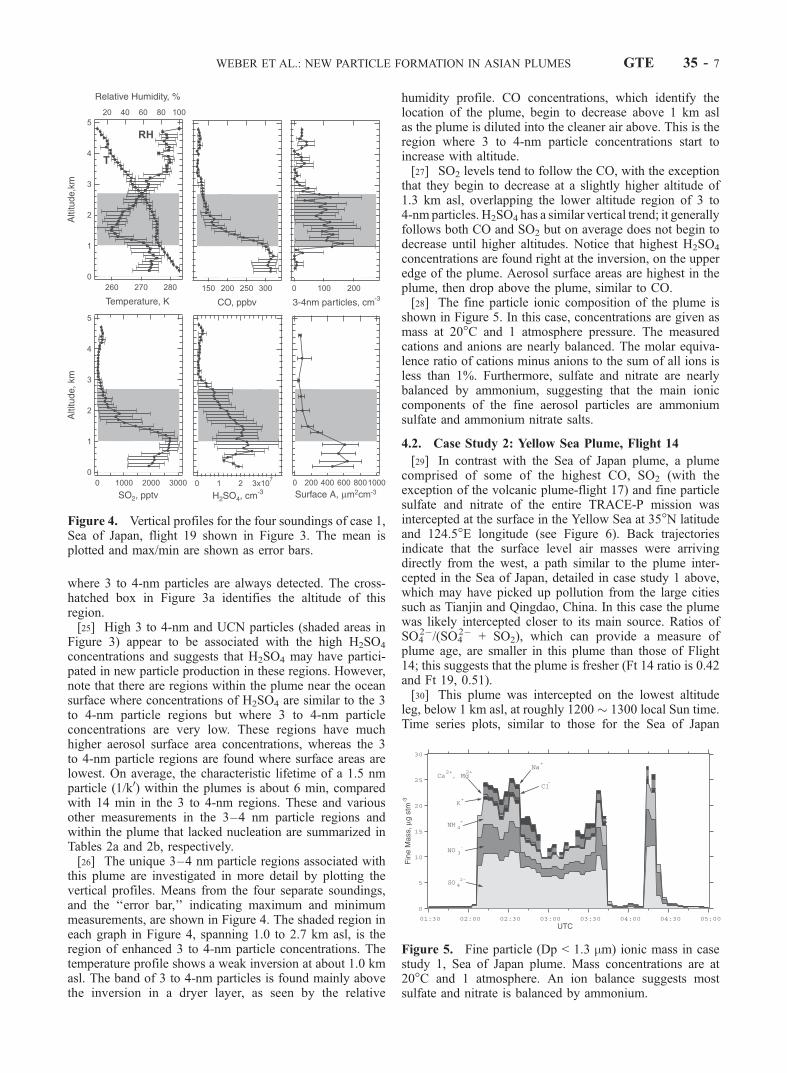
this plume are investigated in more detail by plotting thevertical profiles. Means from the four separate soundings,and the ‘‘error bar,’’ indicating maximum and minimummeasurements, are shown in Figure 4. The shaded region ineach graph in Figure 4, spanning 1.0 to 2.7 km asl, is theregion of enhanced 3 to 4-nm particle concentrations. Thetemperature profile shows a weak inversion at about 1.0 kmasl. The band of 3 to 4-nm particles is found mainly abovethe inversion in a dryer layer, as seen by the relative
humidity profile. CO concentrations, which identify thelocation of the plume, begin to decrease above 1 km aslas the plume is diluted into the cleaner air above. This is theregion where 3 to 4-nm particle concentrations start toincrease with altitude.[27] SO2 levels tend to follow the CO, with the exception
that they begin to decrease at a slightly higher altitude of1.3 km asl, overlapping the lower altitude region of 3 to4-nm particles. H2SO4 has a similar vertical trend; it generallyfollows both CO and SO2 but on average does not begin todecrease until higher altitudes. Notice that highest H2SO4
concentrations are found right at the inversion, on the upperedge of the plume. Aerosol surface areas are highest in theplume, then drop above the plume, similar to CO.[28] The fine particle ionic composition of the plume is
shown in Figure 5. In this case, concentrations are given asmass at 20�C and 1 atmosphere pressure. The measuredcations and anions are nearly balanced. The molar equiva-lence ratio of cations minus anions to the sum of all ions isless than 1%. Furthermore, sulfate and nitrate are nearlybalanced by ammonium, suggesting that the main ioniccomponents of the fine aerosol particles are ammoniumsulfate and ammonium nitrate salts.
4.2. Case Study 2: Yellow Sea Plume, Flight 14
[29] In contrast with the Sea of Japan plume, a plumecomprised of some of the highest CO, SO2 (with theexception of the volcanic plume-flight 17) and fine particlesulfate and nitrate of the entire TRACE-P mission wasintercepted at the surface in the Yellow Sea at 35�N latitudeand 124.5�E longitude (see Figure 6). Back trajectoriesindicate that the surface level air masses were arrivingdirectly from the west, a path similar to the plume inter-cepted in the Sea of Japan, detailed in case study 1 above,which may have picked up pollution from the large citiessuch as Tianjin and Qingdao, China. In this case the plumewas likely intercepted closer to its main source. Ratios ofSO4
2�/(SO42� + SO2), which can provide a measure of
plume age, are smaller in this plume than those of Flight14; this suggests that the plume is fresher (Ft 14 ratio is 0.42and Ft 19, 0.51).[30] This plume was intercepted on the lowest altitude
leg, below 1 km asl, at roughly 1200 � 1300 local Sun time.Time series plots, similar to those for the Sea of Japan
Figure 4. Vertical profiles for the four soundings of case 1,Sea of Japan, flight 19 shown in Figure 3. The mean isplotted and max/min are shown as error bars.
Figure 5. Fine particle (Dp < 1.3 mm) ionic mass in casestudy 1, Sea of Japan plume. Mass concentrations are at20�C and 1 atmosphere. An ion balance suggests mostsulfate and nitrate is balanced by ammonium.
WEBER ET AL.: NEW PARTICLE FORMATION IN ASIAN PLUMES GTE 35 - 7
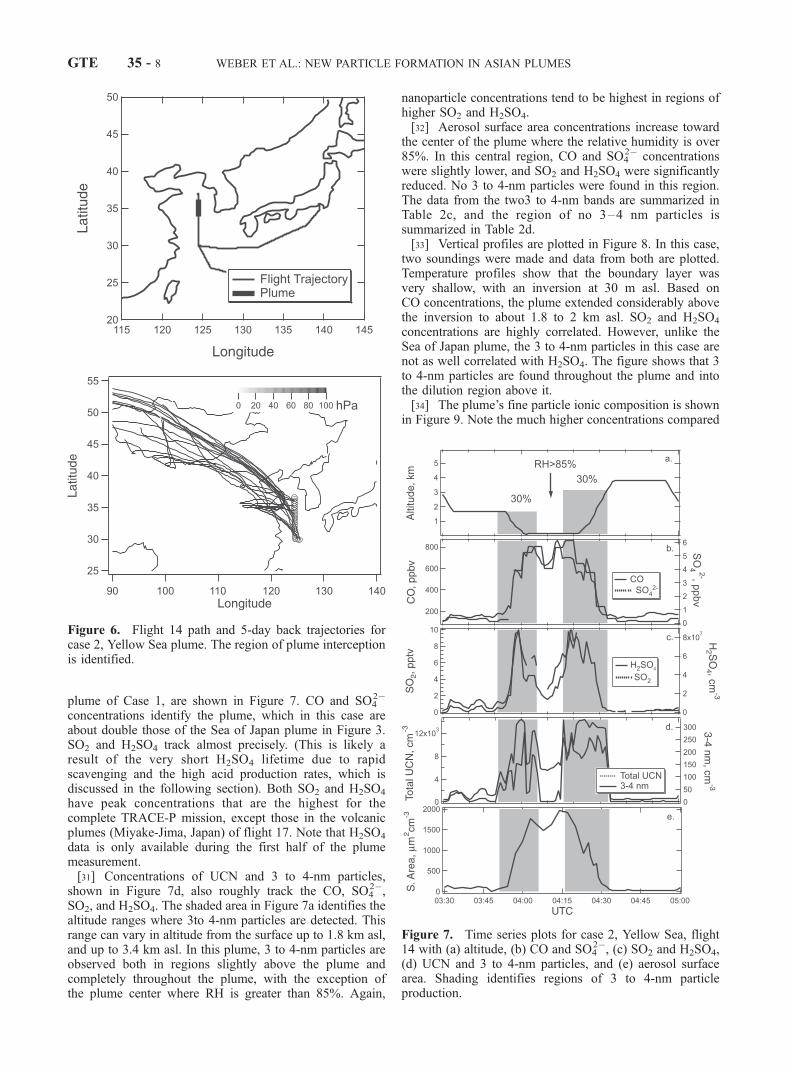
plume of Case 1, are shown in Figure 7. CO and SO42�
concentrations identify the plume, which in this case areabout double those of the Sea of Japan plume in Figure 3.SO2 and H2SO4 track almost precisely. (This is likely aresult of the very short H2SO4 lifetime due to rapidscavenging and the high acid production rates, which isdiscussed in the following section). Both SO2 and H2SO4
have peak concentrations that are the highest for thecomplete TRACE-P mission, except those in the volcanicplumes (Miyake-Jima, Japan) of flight 17. Note that H2SO4
data is only available during the first half of the plumemeasurement.[31] Concentrations of UCN and 3 to 4-nm particles,
shown in Figure 7d, also roughly track the CO, SO42�,
SO2, and H2SO4. The shaded area in Figure 7a identifies thealtitude ranges where 3to 4-nm particles are detected. Thisrange can vary in altitude from the surface up to 1.8 km asl,and up to 3.4 km asl. In this plume, 3 to 4-nm particles areobserved both in regions slightly above the plume andcompletely throughout the plume, with the exception ofthe plume center where RH is greater than 85%. Again,
nanoparticle concentrations tend to be highest in regions ofhigher SO2 and H2SO4.[32] Aerosol surface area concentrations increase toward
the center of the plume where the relative humidity is over85%. In this central region, CO and SO4
2� concentrationswere slightly lower, and SO2 and H2SO4 were significantlyreduced. No 3 to 4-nm particles were found in this region.The data from the two3 to 4-nm bands are summarized inTable 2c, and the region of no 3–4 nm particles issummarized in Table 2d.[33] Vertical profiles are plotted in Figure 8. In this case,
two soundings were made and data from both are plotted.Temperature profiles show that the boundary layer wasvery shallow, with an inversion at 30 m asl. Based onCO concentrations, the plume extended considerably abovethe inversion to about 1.8 to 2 km asl. SO2 and H2SO4
concentrations are highly correlated. However, unlike theSea of Japan plume, the 3 to 4-nm particles in this case arenot as well correlated with H2SO4. The figure shows that 3to 4-nm particles are found throughout the plume and intothe dilution region above it.[34] The plume’s fine particle ionic composition is shown
in Figure 9. Note the much higher concentrations compared
Figure 6. Flight 14 path and 5-day back trajectories forcase 2, Yellow Sea plume. The region of plume interceptionis identified.
Figure 7. Time series plots for case 2, Yellow Sea, flight14 with (a) altitude, (b) CO and SO4
2�, (c) SO2 and H2SO4,(d) UCN and 3 to 4-nm particles, and (e) aerosol surfacearea. Shading identifies regions of 3 to 4-nm particleproduction.
GTE 35 - 8 WEBER ET AL.: NEW PARTICLE FORMATION IN ASIAN PLUMES
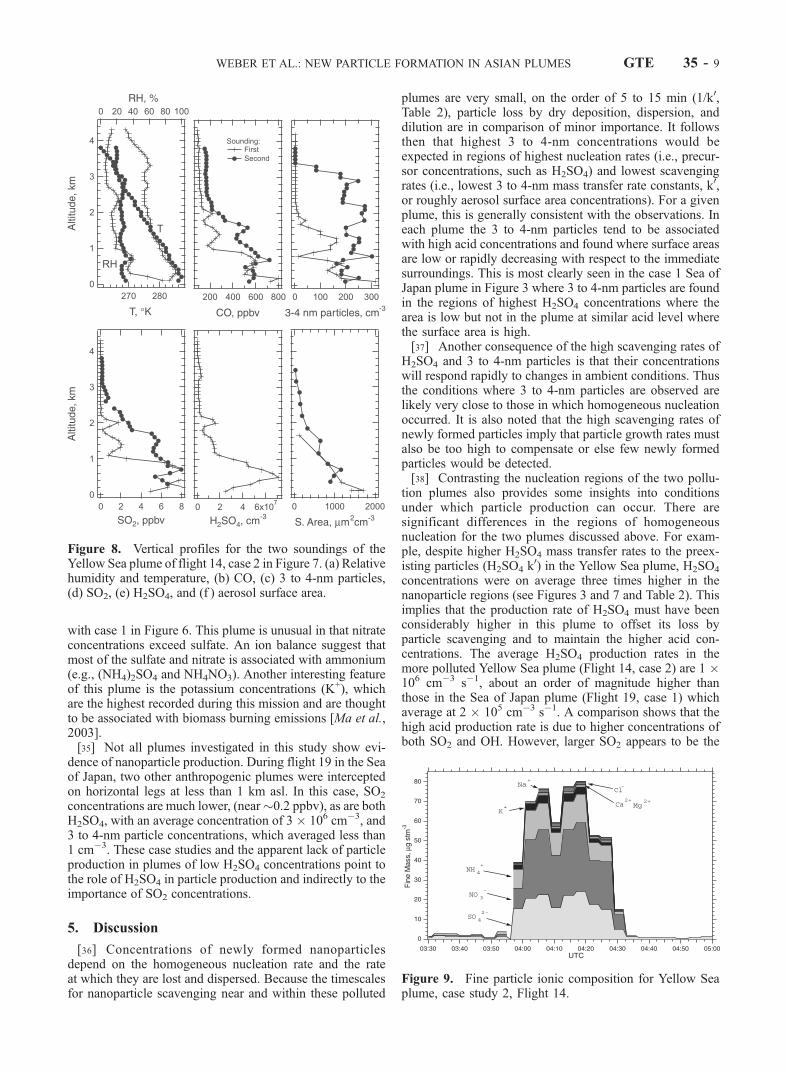
with case 1 in Figure 6. This plume is unusual in that nitrateconcentrations exceed sulfate. An ion balance suggest thatmost of the sulfate and nitrate is associated with ammonium(e.g., (NH4)2SO4 and NH4NO3). Another interesting featureof this plume is the potassium concentrations (K+), whichare the highest recorded during this mission and are thoughtto be associated with biomass burning emissions [Ma et al.,2003].[35] Not all plumes investigated in this study show evi-
dence of nanoparticle production. During flight 19 in the Seaof Japan, two other anthropogenic plumes were interceptedon horizontal legs at less than 1 km asl. In this case, SO2
concentrations are much lower, (near�0.2 ppbv), as are bothH2SO4, with an average concentration of 3 � 106 cm�3, and3 to 4-nm particle concentrations, which averaged less than1 cm�3. These case studies and the apparent lack of particleproduction in plumes of low H2SO4 concentrations point tothe role of H2SO4 in particle production and indirectly to theimportance of SO2 concentrations.
5. Discussion
[36] Concentrations of newly formed nanoparticlesdepend on the homogeneous nucleation rate and the rateat which they are lost and dispersed. Because the timescalesfor nanoparticle scavenging near and within these polluted
plumes are very small, on the order of 5 to 15 min (1/k0,Table 2), particle loss by dry deposition, dispersion, anddilution are in comparison of minor importance. It followsthen that highest 3 to 4-nm concentrations would beexpected in regions of highest nucleation rates (i.e., precur-sor concentrations, such as H2SO4) and lowest scavengingrates (i.e., lowest 3 to 4-nm mass transfer rate constants, k0,or roughly aerosol surface area concentrations). For a givenplume, this is generally consistent with the observations. Ineach plume the 3 to 4-nm particles tend to be associatedwith high acid concentrations and found where surface areasare low or rapidly decreasing with respect to the immediatesurroundings. This is most clearly seen in the case 1 Sea ofJapan plume in Figure 3 where 3 to 4-nm particles are foundin the regions of highest H2SO4 concentrations where thearea is low but not in the plume at similar acid level wherethe surface area is high.[37] Another consequence of the high scavenging rates of
H2SO4 and 3 to 4-nm particles is that their concentrationswill respond rapidly to changes in ambient conditions. Thusthe conditions where 3 to 4-nm particles are observed arelikely very close to those in which homogeneous nucleationoccurred. It is also noted that the high scavenging rates ofnewly formed particles imply that particle growth rates mustalso be too high to compensate or else few newly formedparticles would be detected.[38] Contrasting the nucleation regions of the two pollu-
tion plumes also provides some insights into conditionsunder which particle production can occur. There aresignificant differences in the regions of homogeneousnucleation for the two plumes discussed above. For exam-ple, despite higher H2SO4 mass transfer rates to the preex-isting particles (H2SO4 k
0) in the Yellow Sea plume, H2SO4
concentrations were on average three times higher in thenanoparticle regions (see Figures 3 and 7 and Table 2). Thisimplies that the production rate of H2SO4 must have beenconsiderably higher in this plume to offset its loss byparticle scavenging and to maintain the higher acid con-centrations. The average H2SO4 production rates in themore polluted Yellow Sea plume (Flight 14, case 2) are 1 �106 cm�3 s�1, about an order of magnitude higher thanthose in the Sea of Japan plume (Flight 19, case 1) whichaverage at 2 � 105 cm�3 s�1. A comparison shows that thehigh acid production rate is due to higher concentrations ofboth SO2 and OH. However, larger SO2 appears to be the
Figure 8. Vertical profiles for the two soundings of theYellow Sea plume of flight 14, case 2 in Figure 7. (a) Relativehumidity and temperature, (b) CO, (c) 3 to 4-nm particles,(d) SO2, (e) H2SO4, and (f ) aerosol surface area.
Figure 9. Fine particle ionic composition for Yellow Seaplume, case study 2, Flight 14.
WEBER ET AL.: NEW PARTICLE FORMATION IN ASIAN PLUMES GTE 35 - 9
more dominant factor; OH concentrations in the Yellow Seaplume are a factor of 2 larger and SO2 a factor of 4 larger.[39] The interaction between H2SO4 production and loss
by scavenging can be used to predict ambient H2SO4
concentrations. The consistency between the measurementsof SO2, H2SO4, and the preexisting aerosol is investigatedby comparing observed and calculated steady state H2SO4
concentrations.
5.1. Continuity Between SO2, H2SO4, and thePreexisting Particles
[40] Because SO2, through the production of H2SO4, andthe preexisting particles appear to play major roles indetermining the production of nanoparticles near and withinthese plumes, the continuity between these measurements isinvestigated. Ambient H2SO4 concentrations are calculatedby equation (3), which assumes a steady state between theacid source via OH-SO2 reaction, equation (2), and sink bypreexisting particle scavenging. This is likely a goodassumption since the acid production and loss rates in theseplumes are high (e.g., 105 to 106 cm�3 s�1), and thus theconcentrations respond rapidly to changes in production andscavenging rates. A similar analysis for measurements inclean remote regions show that calculated and measuredconcentrations of H2SO4 are typically in good agreement[Eisele and Tanner, 1993; Weber et al., 1997].[41] The results of this calculation for the measurements
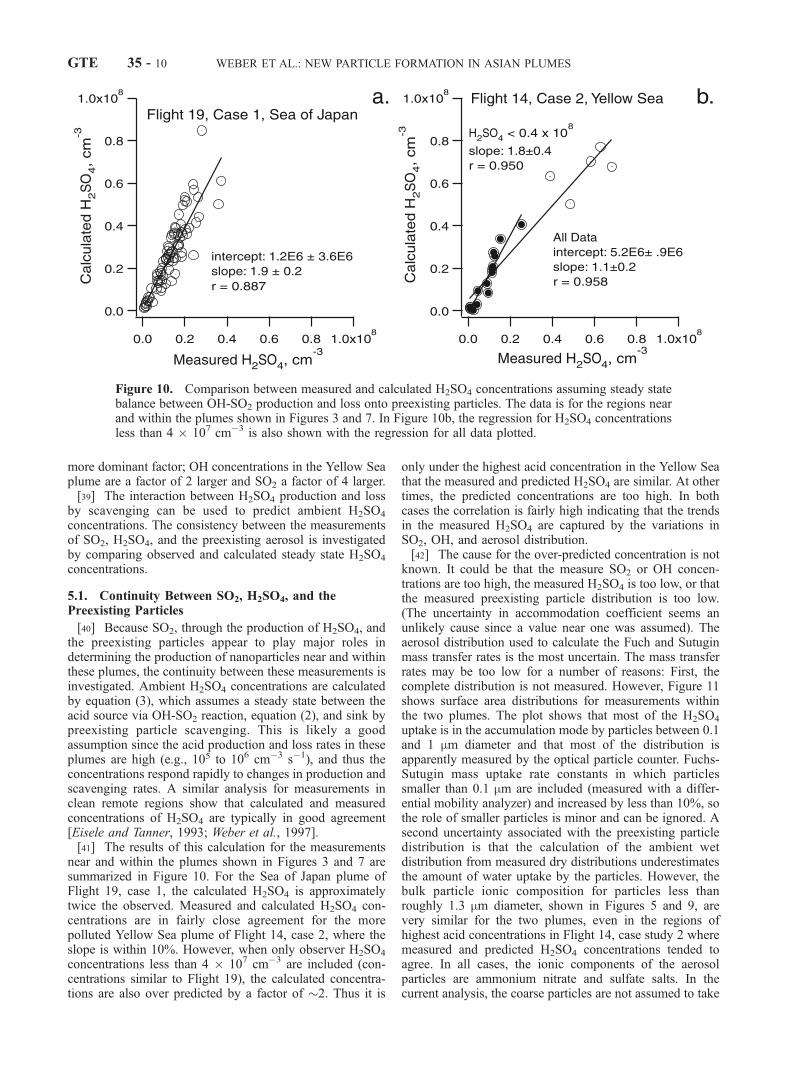
near and within the plumes shown in Figures 3 and 7 aresummarized in Figure 10. For the Sea of Japan plume ofFlight 19, case 1, the calculated H2SO4 is approximatelytwice the observed. Measured and calculated H2SO4 con-centrations are in fairly close agreement for the morepolluted Yellow Sea plume of Flight 14, case 2, where theslope is within 10%. However, when only observer H2SO4
concentrations less than 4 � 107 cm�3 are included (con-centrations similar to Flight 19), the calculated concentra-tions are also over predicted by a factor of �2. Thus it is
only under the highest acid concentration in the Yellow Seathat the measured and predicted H2SO4 are similar. At othertimes, the predicted concentrations are too high. In bothcases the correlation is fairly high indicating that the trendsin the measured H2SO4 are captured by the variations inSO2, OH, and aerosol distribution.[42] The cause for the over-predicted concentration is not
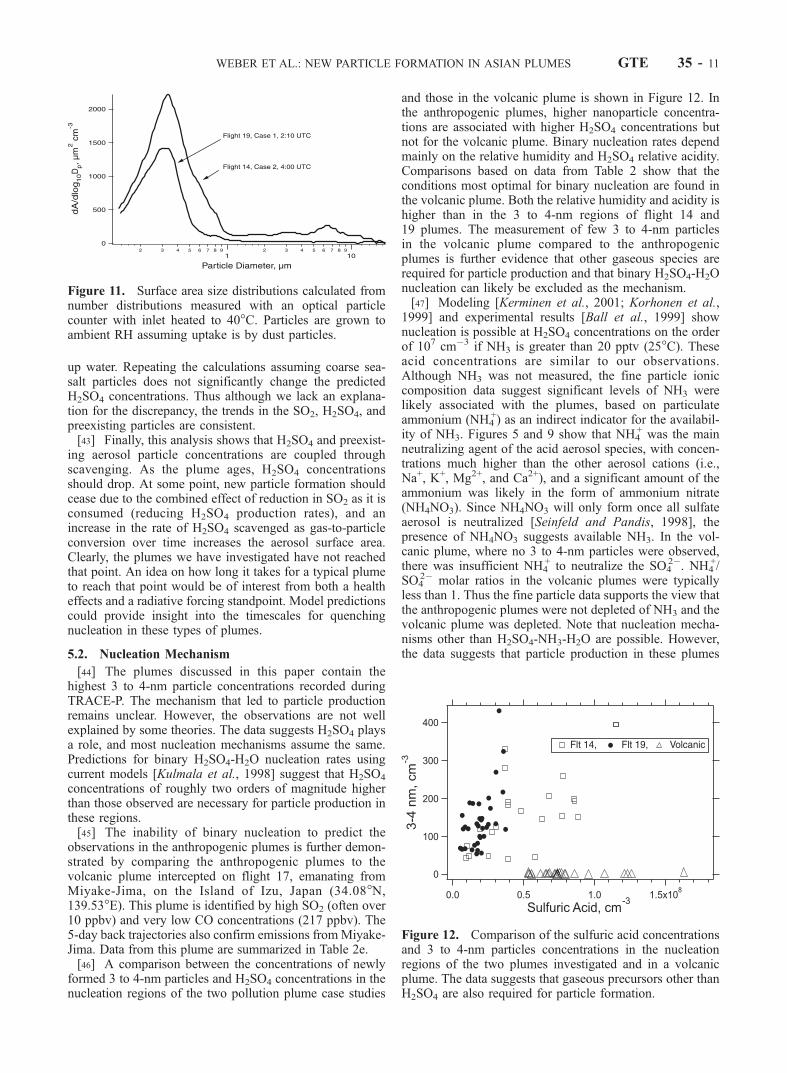
known. It could be that the measure SO2 or OH concen-trations are too high, the measured H2SO4 is too low, or thatthe measured preexisting particle distribution is too low.(The uncertainty in accommodation coefficient seems anunlikely cause since a value near one was assumed). Theaerosol distribution used to calculate the Fuch and Sutuginmass transfer rates is the most uncertain. The mass transferrates may be too low for a number of reasons: First, thecomplete distribution is not measured. However, Figure 11shows surface area distributions for measurements withinthe two plumes. The plot shows that most of the H2SO4
uptake is in the accumulation mode by particles between 0.1and 1 mm diameter and that most of the distribution isapparently measured by the optical particle counter. Fuchs-Sutugin mass uptake rate constants in which particlessmaller than 0.1 mm are included (measured with a differ-ential mobility analyzer) and increased by less than 10%, sothe role of smaller particles is minor and can be ignored. Asecond uncertainty associated with the preexisting particledistribution is that the calculation of the ambient wetdistribution from measured dry distributions underestimatesthe amount of water uptake by the particles. However, thebulk particle ionic composition for particles less thanroughly 1.3 mm diameter, shown in Figures 5 and 9, arevery similar for the two plumes, even in the regions ofhighest acid concentrations in Flight 14, case study 2 wheremeasured and predicted H2SO4 concentrations tended toagree. In all cases, the ionic components of the aerosolparticles are ammonium nitrate and sulfate salts. In thecurrent analysis, the coarse particles are not assumed to take
Figure 10. Comparison between measured and calculated H2SO4 concentrations assuming steady statebalance between OH-SO2 production and loss onto preexisting particles. The data is for the regions nearand within the plumes shown in Figures 3 and 7. In Figure 10b, the regression for H2SO4 concentrationsless than 4 � 107 cm�3 is also shown with the regression for all data plotted.
GTE 35 - 10 WEBER ET AL.: NEW PARTICLE FORMATION IN ASIAN PLUMES
up water. Repeating the calculations assuming coarse sea-salt particles does not significantly change the predictedH2SO4 concentrations. Thus although we lack an explana-tion for the discrepancy, the trends in the SO2, H2SO4, andpreexisting particles are consistent.[43] Finally, this analysis shows that H2SO4 and preexist-
ing aerosol particle concentrations are coupled throughscavenging. As the plume ages, H2SO4 concentrationsshould drop. At some point, new particle formation shouldcease due to the combined effect of reduction in SO2 as it isconsumed (reducing H2SO4 production rates), and anincrease in the rate of H2SO4 scavenged as gas-to-particleconversion over time increases the aerosol surface area.Clearly, the plumes we have investigated have not reachedthat point. An idea on how long it takes for a typical plumeto reach that point would be of interest from both a healtheffects and a radiative forcing standpoint. Model predictionscould provide insight into the timescales for quenchingnucleation in these types of plumes.
5.2. Nucleation Mechanism
[44] The plumes discussed in this paper contain thehighest 3 to 4-nm particle concentrations recorded duringTRACE-P. The mechanism that led to particle productionremains unclear. However, the observations are not wellexplained by some theories. The data suggests H2SO4 playsa role, and most nucleation mechanisms assume the same.Predictions for binary H2SO4-H2O nucleation rates usingcurrent models [Kulmala et al., 1998] suggest that H2SO4
concentrations of roughly two orders of magnitude higherthan those observed are necessary for particle production inthese regions.[45] The inability of binary nucleation to predict the
observations in the anthropogenic plumes is further demon-strated by comparing the anthropogenic plumes to thevolcanic plume intercepted on flight 17, emanating fromMiyake-Jima, on the Island of Izu, Japan (34.08�N,139.53�E). This plume is identified by high SO2 (often over10 ppbv) and very low CO concentrations (217 ppbv). The5-day back trajectories also confirm emissions fromMiyake-Jima. Data from this plume are summarized in Table 2e.[46] A comparison between the concentrations of newly
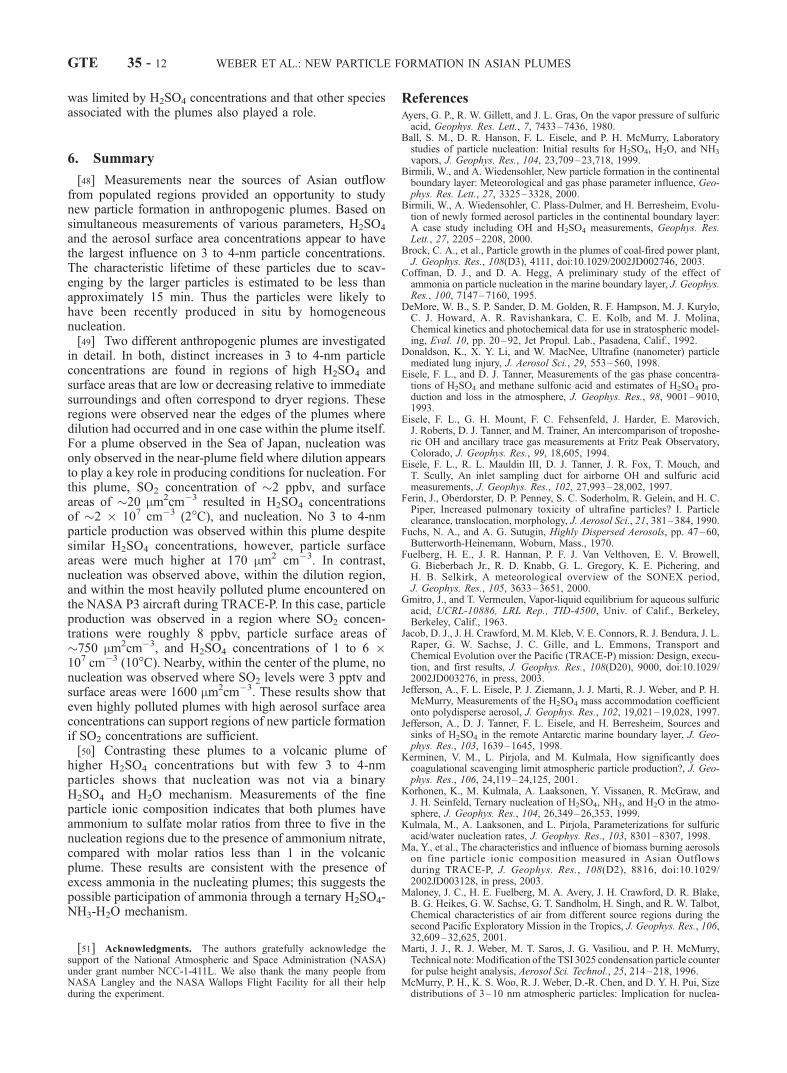
formed 3 to 4-nm particles and H2SO4 concentrations in thenucleation regions of the two pollution plume case studies
and those in the volcanic plume is shown in Figure 12. Inthe anthropogenic plumes, higher nanoparticle concentra-tions are associated with higher H2SO4 concentrations butnot for the volcanic plume. Binary nucleation rates dependmainly on the relative humidity and H2SO4 relative acidity.Comparisons based on data from Table 2 show that theconditions most optimal for binary nucleation are found inthe volcanic plume. Both the relative humidity and acidity ishigher than in the 3 to 4-nm regions of flight 14 and19 plumes. The measurement of few 3 to 4-nm particlesin the volcanic plume compared to the anthropogenicplumes is further evidence that other gaseous species arerequired for particle production and that binary H2SO4-H2Onucleation can likely be excluded as the mechanism.[47] Modeling [Kerminen et al., 2001; Korhonen et al.,
1999] and experimental results [Ball et al., 1999] shownucleation is possible at H2SO4 concentrations on the orderof 107 cm�3 if NH3 is greater than 20 pptv (25�C). Theseacid concentrations are similar to our observations.Although NH3 was not measured, the fine particle ioniccomposition data suggest significant levels of NH3 werelikely associated with the plumes, based on particulateammonium (NH4
+) as an indirect indicator for the availabil-ity of NH3. Figures 5 and 9 show that NH4
+ was the mainneutralizing agent of the acid aerosol species, with concen-trations much higher than the other aerosol cations (i.e.,Na+, K+, Mg2+, and Ca2+), and a significant amount of theammonium was likely in the form of ammonium nitrate(NH4NO3). Since NH4NO3 will only form once all sulfateaerosol is neutralized [Seinfeld and Pandis, 1998], thepresence of NH4NO3 suggests available NH3. In the vol-canic plume, where no 3 to 4-nm particles were observed,there was insufficient NH4
+ to neutralize the SO42�. NH4
+/SO4
2� molar ratios in the volcanic plumes were typicallyless than 1. Thus the fine particle data supports the view thatthe anthropogenic plumes were not depleted of NH3 and thevolcanic plume was depleted. Note that nucleation mecha-nisms other than H2SO4-NH3-H2O are possible. However,the data suggests that particle production in these plumes
Figure 11. Surface area size distributions calculated fromnumber distributions measured with an optical particlecounter with inlet heated to 40�C. Particles are grown toambient RH assuming uptake is by dust particles.
Figure 12. Comparison of the sulfuric acid concentrationsand 3 to 4-nm particles concentrations in the nucleationregions of the two plumes investigated and in a volcanicplume. The data suggests that gaseous precursors other thanH2SO4 are also required for particle formation.
WEBER ET AL.: NEW PARTICLE FORMATION IN ASIAN PLUMES GTE 35 - 11
was limited by H2SO4 concentrations and that other speciesassociated with the plumes also played a role.
6. Summary
[48] Measurements near the sources of Asian outflowfrom populated regions provided an opportunity to studynew particle formation in anthropogenic plumes. Based onsimultaneous measurements of various parameters, H2SO4
and the aerosol surface area concentrations appear to havethe largest influence on 3 to 4-nm particle concentrations.The characteristic lifetime of these particles due to scav-enging by the larger particles is estimated to be less thanapproximately 15 min. Thus the particles were likely tohave been recently produced in situ by homogeneousnucleation.[49] Two different anthropogenic plumes are investigated
in detail. In both, distinct increases in 3 to 4-nm particleconcentrations are found in regions of high H2SO4 andsurface areas that are low or decreasing relative to immediatesurroundings and often correspond to dryer regions. Theseregions were observed near the edges of the plumes wheredilution had occurred and in one case within the plume itself.For a plume observed in the Sea of Japan, nucleation wasonly observed in the near-plume field where dilution appearsto play a key role in producing conditions for nucleation. Forthis plume, SO2 concentration of �2 ppbv, and surfaceareas of �20 mm2cm�3 resulted in H2SO4 concentrationsof �2 � 107 cm�3 (2�C), and nucleation. No 3 to 4-nmparticle production was observed within this plume despitesimilar H2SO4 concentrations, however, particle surfaceareas were much higher at 170 mm2 cm�3. In contrast,nucleation was observed above, within the dilution region,and within the most heavily polluted plume encountered onthe NASA P3 aircraft during TRACE-P. In this case, particleproduction was observed in a region where SO2 concen-trations were roughly 8 ppbv, particle surface areas of�750 mm2cm�3, and H2SO4 concentrations of 1 to 6 �107 cm�3 (10�C). Nearby, within the center of the plume, nonucleation was observed where SO2 levels were 3 pptv andsurface areas were 1600 mm2cm�3. These results show thateven highly polluted plumes with high aerosol surface areaconcentrations can support regions of new particle formationif SO2 concentrations are sufficient.[50] Contrasting these plumes to a volcanic plume of
higher H2SO4 concentrations but with few 3 to 4-nmparticles shows that nucleation was not via a binaryH2SO4 and H2O mechanism. Measurements of the fineparticle ionic composition indicates that both plumes haveammonium to sulfate molar ratios from three to five in thenucleation regions due to the presence of ammonium nitrate,compared with molar ratios less than 1 in the volcanicplume. These results are consistent with the presence ofexcess ammonia in the nucleating plumes; this suggests thepossible participation of ammonia through a ternary H2SO4-NH3-H2O mechanism.
[51] Acknowledgments. The authors gratefully acknowledge thesupport of the National Atmospheric and Space Administration (NASA)under grant number NCC-1-411L. We also thank the many people fromNASA Langley and the NASA Wallops Flight Facility for all their helpduring the experiment.
ReferencesAyers, G. P., R. W. Gillett, and J. L. Gras, On the vapor pressure of sulfuricacid, Geophys. Res. Lett., 7, 7433–7436, 1980.
Ball, S. M., D. R. Hanson, F. L. Eisele, and P. H. McMurry, Laboratorystudies of particle nucleation: Initial results for H2SO4, H2O, and NH3
vapors, J. Geophys. Res., 104, 23,709–23,718, 1999.Birmili, W., and A. Wiedensohler, New particle formation in the continentalboundary layer: Meteorological and gas phase parameter influence, Geo-phys. Res. Lett., 27, 3325–3328, 2000.
Birmili, W., A. Wiedensohler, C. Plass-Dulmer, and H. Berresheim, Evolu-tion of newly formed aerosol particles in the continental boundary layer:A case study including OH and H2SO4 measurements, Geophys. Res.Lett., 27, 2205–2208, 2000.
Brock, C. A., et al., Particle growth in the plumes of coal-fired power plant,J. Geophys. Res., 108(D3), 4111, doi:10.1029/2002JD002746, 2003.
Coffman, D. J., and D. A. Hegg, A preliminary study of the effect ofammonia on particle nucleation in the marine boundary layer, J. Geophys.Res., 100, 7147–7160, 1995.
DeMore, W. B., S. P. Sander, D. M. Golden, R. F. Hampson, M. J. Kurylo,C. J. Howard, A. R. Ravishankara, C. E. Kolb, and M. J. Molina,Chemical kinetics and photochemical data for use in stratospheric model-ing, Eval. 10, pp. 20–92, Jet Propul. Lab., Pasadena, Calif., 1992.
Donaldson, K., X. Y. Li, and W. MacNee, Ultrafine (nanometer) particlemediated lung injury, J. Aerosol Sci., 29, 553–560, 1998.
Eisele, F. L., and D. J. Tanner, Measurements of the gas phase concentra-tions of H2SO4 and methane sulfonic acid and estimates of H2SO4 pro-duction and loss in the atmosphere, J. Geophys. Res., 98, 9001–9010,1993.
Eisele, F. L., G. H. Mount, F. C. Fehsenfeld, J. Harder, E. Marovich,J. Roberts, D. J. Tanner, and M. Trainer, An intercomparison of troposhe-ric OH and ancillary trace gas measurements at Fritz Peak Observatory,Colorado, J. Geophys. Res., 99, 18,605, 1994.
Eisele, F. L., R. L. Mauldin III, D. J. Tanner, J. R. Fox, T. Mouch, andT. Scully, An inlet sampling duct for airborne OH and sulfuric acidmeasurements, J. Geophys. Res., 102, 27,993–28,002, 1997.
Ferin, J., Oberdorster, D. P. Penney, S. C. Soderholm, R. Gelein, and H. C.Piper, Increased pulmonary toxicity of ultrafine particles? I. Particleclearance, translocation, morphology, J. Aerosol Sci., 21, 381–384, 1990.
Fuchs, N. A., and A. G. Sutugin, Highly Dispersed Aerosols, pp. 47–60,Butterworth-Heinemann, Woburn, Mass., 1970.
Fuelberg, H. E., J. R. Hannan, P. F. J. Van Velthoven, E. V. Browell,G. Bieberbach Jr., R. D. Knabb, G. L. Gregory, K. E. Pichering, andH. B. Selkirk, A meteorological overview of the SONEX period,J. Geophys. Res., 105, 3633–3651, 2000.
Gmitro, J., and T. Vermeulen, Vapor-liquid equilibrium for aqueous sulfuricacid, UCRL-10886, LRL Rep., TID-4500, Univ. of Calif., Berkeley,Berkeley, Calif., 1963.
Jacob, D. J., J. H. Crawford, M. M. Kleb, V. E. Connors, R. J. Bendura, J. L.Raper, G. W. Sachse, J. C. Gille, and L. Emmons, Transport andChemical Evolution over the Pacific (TRACE-P) mission: Design, execu-tion, and first results, J. Geophys. Res., 108(D20), 9000, doi:10.1029/2002JD003276, in press, 2003.
Jefferson, A., F. L. Eisele, P. J. Ziemann, J. J. Marti, R. J. Weber, and P. H.McMurry, Measurements of the H2SO4 mass accommodation coefficientonto polydisperse aerosol, J. Geophys. Res., 102, 19,021–19,028, 1997.
Jefferson, A., D. J. Tanner, F. L. Eisele, and H. Berresheim, Sources andsinks of H2SO4 in the remote Antarctic marine boundary layer, J. Geo-phys. Res., 103, 1639–1645, 1998.
Kerminen, V. M., L. Pirjola, and M. Kulmala, How significantly doescoagulational scavenging limit atmospheric particle production?, J. Geo-phys. Res., 106, 24,119–24,125, 2001.
Korhonen, K., M. Kulmala, A. Laaksonen, Y. Vissanen, R. McGraw, andJ. H. Seinfeld, Ternary nucleation of H2SO4, NH3, and H2O in the atmo-sphere, J. Geophys. Res., 104, 26,349–26,353, 1999.
Kulmala, M., A. Laaksonen, and L. Pirjola, Parameterizations for sulfuricacid/water nucleation rates, J. Geophys. Res., 103, 8301–8307, 1998.
Ma, Y., et al., The characteristics and influence of biomass burning aerosolson fine particle ionic composition measured in Asian Outflowsduring TRACE-P, J. Geophys. Res., 108(D2), 8816, doi:10.1029/2002JD003128, in press, 2003.
Maloney, J. C., H. E. Fuelberg, M. A. Avery, J. H. Crawford, D. R. Blake,B. G. Heikes, G. W. Sachse, G. T. Sandholm, H. Singh, and R. W. Talbot,Chemical characteristics of air from different source regions during thesecond Pacific Exploratory Mission in the Tropics, J. Geophys. Res., 106,32,609–32,625, 2001.
Marti, J. J., R. J. Weber, M. T. Saros, J. G. Vasiliou, and P. H. McMurry,Technical note:Modification of the TSI 3025 condensation particle counterfor pulse height analysis, Aerosol Sci. Technol., 25, 214–218, 1996.
McMurry, P. H., K. S. Woo, R. J. Weber, D.-R. Chen, and D. Y. H. Pui, Sizedistributions of 3–10 nm atmospheric particles: Implication for nuclea-
GTE 35 - 12 WEBER ET AL.: NEW PARTICLE FORMATION IN ASIAN PLUMES
tion mechanisms, Phil. Trans. R. Soc. London, Ser. A, 358, 2625–2642,2000.
Orsini, D., Y. Ma, A. Sullivan, B. Sierau, K. Baumann, and R. J. Weber,Refinements to the particle-into-liquid sampler (Pils) for ground and air-borne measurements of water soluble aerosol composition, Atmos.Environ., 37, 1243–1259, 2003.
Roedel, W., Measurement of sulfuric acid saturation vapor pressure;Implications for aerosol formation by heteromolecular nucleation, J. Aero-sol Sci., 10, 375–386, 1979.
Seinfeld, J. H., and S. N. Pandis, Atmospheric Chemistry and Physics:From Air Pollution to Climate Change, John Wiley, Hoboken, N. J.,1998.
Swietlicki, E., et al., Hygroscopic properties of aerosol particles in thenorth-eastern Atlantic during ACE-2, Tellus, Ser. B, 52, 201–227, 2000.
Tang, Y., et al., Impacts of aerosols and clouds on photolysis frequenciesand photochemistry during TRACE-P: 2. Three-dimensional study usinga regional chemical transport model, J. Geophys. Res., 108(D21), 8822,doi:10.1029/2002JD003100, in press, 2003.
Thornton, D. C., A. R. Bandy, F. H. Tu, B. W. Blomquist, G. M. Mitchell,W. Nadler, and D. H. Lenschow, Fast airborne sulfur dioxide measure-ments by atmospheric pressure ionization mass spectrometry (APIMS),J. Geophys. Res., 107(D22), 4632, doi:10.1029/2002JD002289, 2002.
Weber, R. J., J. J. Marti, P. H. McMurry, F. L. Eisele, D. J. Tanner, andA. Jefferson, Measurements of expected nucleation precursor species and3 to 500 nm diameter particles at Mauna Loa Observatory, Hawaii,J. Geophys. Res., 101, 14,767–14,775, 1995.
Weber, R. J., J. J. Marti, P. H. McMurry, F. L. Eisele, D. J. Tanner, andA. Jefferson, Measured atmospheric new particle formation rates: Impli-cations for nucleation mechanisms, Chem. Eng. Commun., 151, 53–64,1996.
Weber, R. J., J. J. Marti, P. H. McMurry, F. L. Eisele, D. J. Tanner, andA. Jefferson, Measurements of new particle formation and ultrafine par-ticle growth rates at a clean continental site, J. Geophys. Res., 102,4375–4385, 1997.
Weber, R. J., P. H. McMurry, L. Mauldin, D. J. Tanner, F. L. Eisele, F. J.Brechtel, S. M. Kreidenweis, G. L. Kok, R. D. Schillawski, andD. Baumgardner, A study of new particle formation and growth involvingbiogenic and trace gas species measured during ACE 1, J. Geophys. Res.,103, 16,385–16,396, 1998a.
Weber, R. J., M. Stolsenburg, S. Pandis, and P. H. McMurry, Inversion ofUCNC pulse height distributions to obtain ultrafine (�3 to 10 nm) par-ticle size distributions, J. Aerosol. Sci., 29, 601–615, 1998b.
Weber, R. J., A. D. Clarke, M. Litchy, J. Li, G. Kok, R. D. Schillawski, andP. H. McMurry, Spurious aerosol measurements when sampling fromaircraft in the vicinity of clouds, J. Geophys. Res., 103, 28,337 –28,346, 1998c.
Weber, R. J., P. H. McMurry, R. L. Mauldin III, D. J. Tanner, F. L. Eisele,A. D. Clarke, and V. N. Kapustin, New particle formation in the remote
troposphere: A comparison of observations at various sites, Geophys.Res. Lett., 26, 307–310, 1999.
Weber, R. J., G. Chen, D. D. Davis, R. L. Mauldin, D. J. Tanner, F. L.Eisele, A. D. Clarke, D. C. Thornton, and A. R. Bandy, Measurements ofenhanced H2SO4 and 3–4 nm particles near a frontal cloud during ACE 1,J. Geophys. Res., 106, 24,107–24,117, 2001a.
Weber, R. J., D. Orsini, Y. Daun, Y. N. Lee, P. J. Klotz, and F. Brechtel, Aparticle-into-liquid collector for rapid measurements of aerosol bulkchemical composition, Aerosol Sci. Technol., 35, 718–727, 2001b.
Wilemski, G., Composition of the critical nucleus in multicomponent vapornucleation, J. Chem. Phys., 80, 1370–1372, 1984.
Williams, D. J., J. N. Carras, J. W. Milne, and A. C. Heggie, The oxidationand long-range transport of sulphur dioxide in a remote region, Atmos.Environ., 15, 2255–2262, 1981.
Wilson, W. E., Sulfates in the atmosphere: A progress report on projectMISTT, Atmos. Environ., 12, 537–547, 1978.
Woo, K. S., D. R. Chen, D. Y. H. Pui, and P. H. McMurry, Measurement ofAtlanta aerosol size distributions: Observations of ultrafine particleevents, Aerosol Sci. Technol., 34, 75–87, 2001.
Yu, F., and R. P. Turco, From molecular clusters to nanoparticles: Role ofambient ionization in troposperic aerosol formation, J. Geophys. Res.,106, 4797–4814, 2001.
�����������������������A. R. Bandy and D. C. Thornton, Department of Chemistry, Drexel
University, Philadelphia, PA 19104, USA. ([email protected];[email protected])C. Cantrell, F. Eisele, E. Kosciuch, and L. Mauldin, National Center for
Atmospheric Research, 1850 Table Mesa, Boulder, CO 80303, USA.([email protected]; [email protected]; [email protected]; [email protected])A. D. Clarke, V. Kapustin, and K. Moore, Department of Oceanography,
University of Hawaii at Manoa, 1000 Pope Road, Honolulu, HI 96822,USA. ([email protected]; [email protected]; [email protected])G. Chen and G. W. Sachse, NASA Langley Research Center, Mail Stop
401B, Hampton, VA 23681, USA. ([email protected];[email protected])H. E. Fuelberg, Department of Meteorology, Florida State University,
Tallahassee, FL 32306, USA. ([email protected])S. Lee and R. J. Weber, School of Earth and Atmospheric Sciences,
Georgia Institute of Technology, 311 Ferst Dr., Atlanta, GA 30332-0340,USA. ([email protected]; [email protected])B. Wang, QuadraMed Corporation, 12110 Sunset Hills Road, #600,
Reston, VA 20190, USA. ([email protected])
WEBER ET AL.: NEW PARTICLE FORMATION IN ASIAN PLUMES GTE 35 - 13