Embed Size (px)
Citation preview

New Oriental Education & Technology Group Inc. (EDU US) China Education Sector
1
New Oriental (EDU US) Company Report
Leading player in the after-school education market
Aug 7, 2020
Rating: BUY
TP: US$ 176.0 The Group is a leading national player in the after-school education industry; enrollment in
language training and test preparation courses reach 10,590k in FY20
According to MOE, total enrollment in primary school, G7-9, and high school increased to
105.6mn, 48.3mn, and 39.9mn in 2019; due to intense competition, admission rate at
higher education institutions remained lower than other levels of education in China; under
such context, we believe demand for after-school tutoring education services would rise
Our projected FY20A-23E revenue CAGR is 27.7%
Initiate with BUY; current TP represents 59.58x/41.14x 21E/22E P/E, or 8.70x/7.18x
21E/22E P/B
Analyst: Paul Pan
Tel: (852) 2147 8829 Email: [email protected]
A leading national player in the after-school education industry. As of May 31, 2020, the Group’s network of schools and learning centers reached 104 and 1,465. Enrollment in language training and test preparation courses also grew over the years and reached 10,590.1k in FY20. The Group's main programs are test preparation courses, K-12 after-school tutoring courses, and language training courses. More room for growth. According to MOE, total enrollment in primary school, G7-9, and high school increased by 2.3% YoY, 3.9% YoY, and 1.5% YoY to 105.6mn, 48.3mn, and 39.9mn in 2019, which indicates a growing pool of potential customers. Admission rate at higher education institutions remained lower than other school levels in China, signifying intense competition. Under such context, we believe demand for after-school education would remain strong. Moreover, the market space is becoming less crowded post COVID-19 outbreak, giving the leading players more opportunities to seize market shares. Successful development over the years. The Group has been able to develop its K-12 after-school tutoring programs over the years. In FY20, enrollment in such programs reached 9,741k, representing 92.0% of total enrollment in the Group’s language training and test preparation courses. In addition, it has been developing an industry-leading OMO system and online learning platform – Koolearn (1797 HK). Expect FY20A-23E revenue CAGR to be 27.7%. Our revenue forecasts are based on the assumption that language training and test preparation courses would remain as the primary revenue contributors, and student enrollment would continue to rise. We expect GPM and NPM (to shareholders of the Company) to reach 57.1% and 12.3% in FY23E. Initiate with BUY, TP at US$ 176.0/ADS. We believe the Group’s leading position in after-school education would render it more flexible and efficient than the smaller players. A strong track record over the years convinces us of its ability to deliver growth. Our DCF-derived TP represents 59.58x/41.14x 21E/22E P/E, or 8.70x/7.18x 21E/22E P/B. Risk factors: 1) Macroeconomic risk; 2) Regulatory risk; 3) Pandemic risk; 4) Demographic risk; 5) Rapidly changing industry; 6) Education quality risk; 7) Expansion risk; 8) Seasonality of business; 9) Concentration risk; 10) Non-GAAP financial metrics; 11) Lack of dividend payout. Results and Valuation
As of May 31 FY19A FY20A FY21E FY22E FY23E Revenue (US$ mn) 3,096 3,579 4,342 5,669 7,454 Chg (YoY %) 26.52 15.57 21.33 30.57 31.48 Net Profit (to shareholders of the Company ) (US$ mn)
238 413 468 678 925
Chg (%,YoY) (19.61) 73.62 13.24 44.83 36.44 Basic net profit per common share/ADS (US$) 1.50 2.61 2.95 4.28 5.84 Change (YoY %) (19.79) 74.00 13.20 44.83 36.44 P/E (x) 98.40 56.55 49.96 34.49 25.28 BV per common share/ADS (US$) 14.91 17.28 20.23 24.51 30.35 P/B (x) 9.90 8.54 7.30 6.02 4.86 Dividend per common share/ADS (US$) 0 0 0 0 0 Dividend yield (%) 0 0 0 0 0 ROAA (%) 5.28 6.33 6.46 7.71 8.43 ROAE (%) 10.94 16.22 15.76 19.13 21.29
Note: Each ADS represents one common share
Source(s): The Group, ABCI Securities estimates
Share price (HK$) 147.60
52WK H/L (HK$) 153.02/98.54
Est. share price return 19.27%
Est. dividend yield 0.00%
Est. total returns 19.27%
Previous rating &TP N/A
Previous report date N/A
Source(s): Bloomberg, ABCI Securities estimates
Key data
Issued shares (mn) 158.43
Mkt cap (US$ mn) 23,384.13
3-mth avg ADT (US$mn) 160.33
Major shareholders (%)
Minhong Yu 12.77
Source(s): Bloomberg, the Group, ABCI Securities
Price performance (%)
Absolute Relative*
1-mth 7.24 0.62
3-mth 19.30 2.51
6-mth 9.81 8.16
Note: Relative to S&P 500 Index
Source(s): Bloomberg
1-yr price performance
Source(s):Bloomberg, ABCI Securities
Note: market data as of Aug 6, 2020
2,000
2,250
2,500
2,750
3,000
3,250
3,500
90
100
110
120
130
140
150
160
08
/19
08
/19
09
/19
10
/19
11
/19
12
/19
12
/19
01
/20
02
/20
03
/20
03
/20
04
/20
05
/20
06
/20
06
/20
07
/20
Price (LHS) SPX Index (RHS)

New Oriental Education & Technology Group Inc. (EDU US) China Education Sector
2
Investment highlights
1. A leading national player in the after-school education industry
The Group is a leading national player in the after-school education industry. As of May 31, 2020,
the Group’s network of schools and learning centers reached 104 and 1,465. Student enrollment in
language training and test preparation courses also grew over the years and reached 10,590.1k in
FY20. We believe the Group’s leading position gives it more flexibility and efficiency over smaller
competitors.
Exhibit 1: Number of schools and learning centers of the Group
Note: FY ends on May 31
Source(s): The Group, ABCI Securities
Exhibit 2: Student enrollment of the Group (k ppl)
Note. FY ends on May 31
Source(s): The Group, ABCI Securities
While the Group provides a wide range of educational programs, services, and products, it mainly
offers test preparation courses, K-12 after-school tutoring courses, and language training courses.
0
20
40
60
80
100
120
0
200
400
600
800
1,000
1,200
1,400
FY
06
FY
07
FY
08
FY
09
FY
10
FY
11
FY
12
FY
13
FY
14
FY
15
FY
16
FY
17
FY
18
FY
19
FY
20
Learning centers Schools (RHS)
0
2,000
4,000
6,000
8,000
10,000
12,000
FY
06
FY
07
FY
08
FY
09
FY
10
FY
11
FY
12
FY
13
FY
14
FY
15
FY
16
FY
17
FY
18
FY
19
FY
20
New Oriental Education & Technology Group Inc. (EDU US) China Education Sector
3
Exhibit 3: Educational programs offered by the Group
Education program Description
K-12 all-subjects
training
“New Oriental U-Can All Subjects” training program
1) The program targets middle and high school Chinese students from ages 13 to 18 who are preparing for the
high school entrance examination in China, known as the “Zhongkao” and the college entrance examination,
known as the “Gaokao”;
2) Typical U-Can All Subjects after-school tutoring courses for middle school and high school students
last for 8 to 16 weeks with classroom instruction one to four times per week for 1.5 to 4 hours per
visit; the Group also offers more intensive and condensed versions of the courses, in particular during
the summer months when many academic institutions are on summer break, and the sizes of these
courses typically range from 12 to ~50 students per class
“Pop Kids All Subjects” training program
1) Offers after-school tutoring courses in English, Chinese, math, writing, music, and arts for children in
kindergarten and primary schools;
2) The program is typically divided into classes of 8 to approximately 24 students per class. Students
attend class about two times per week for 2 to 3 hours per class; students are tested to measure their
progress and make sure they are progressing as needed to advance to the next book and
class level without jeopardizing the fundamentals that will allow them to excel in the future
Test preparation
courses
Specifically designed to prepare students for the major exams used by educational institutions in China
and abroad
Focus on quality instruction and test-taking techniques to help students achieve high scores on the most
widely used admissions and assessments tests
Classes range from 6 to 50 students, depending on the level of instruction and student demand, and
programs range from 20 to 160 hours with classes one to four times per week; intensive versions of the
courses are also available, which can be completed in a shorter time period
Examples of major overseas and domestic exams targeted by the program
International
exams
SAT; ACT; GRE; LSAT; GMAT; IELTS; BEC; TOEFL;
TOEIC
Domestic
exams
- CET4; CET6
- National English Test for Entrance into Master’s
Degree programs
- National Math Test for Entrance of Master’s Degree
Programs
- Professional Title English Test
- Public English Test System
Language training
programs
Provide various types of English language training courses and training courses for other foreign languages,
including German, Japanese, French, Korean, Italian, and Spanish
Source(s): The Group, ABCI Securities
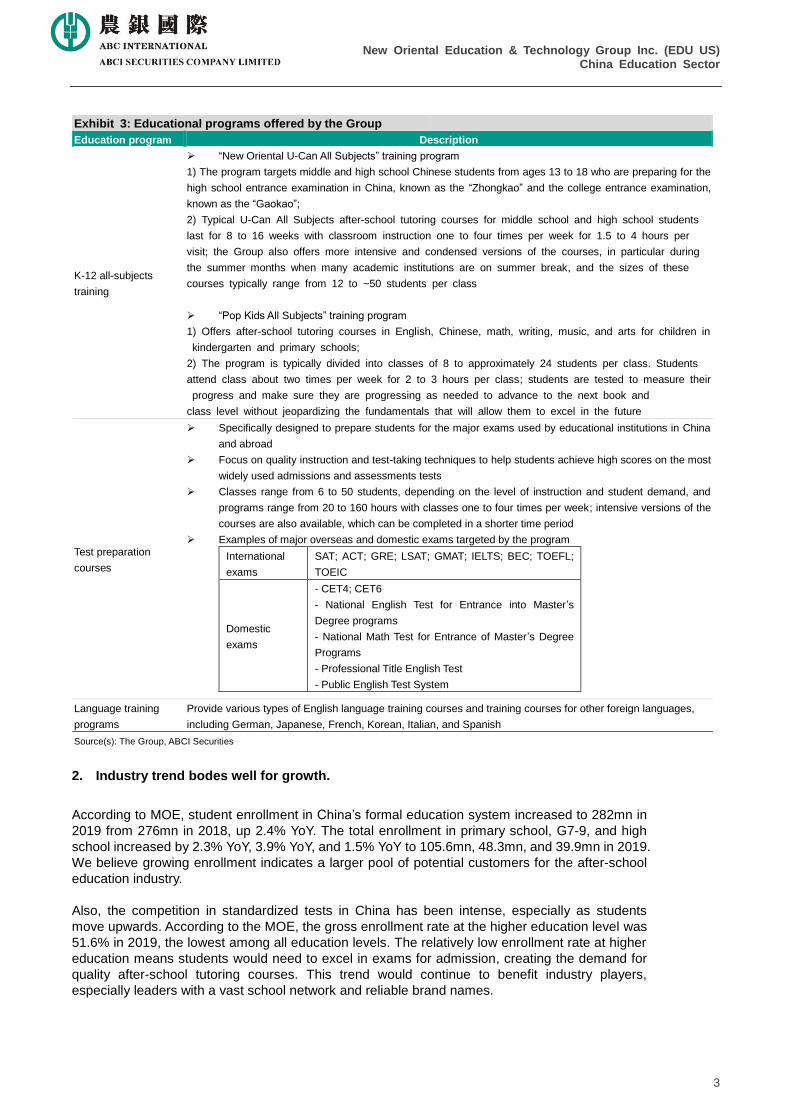
2. Industry trend bodes well for growth.
According to MOE, student enrollment in China’s formal education system increased to 282mn in
2019 from 276mn in 2018, up 2.4% YoY. The total enrollment in primary school, G7-9, and high
school increased by 2.3% YoY, 3.9% YoY, and 1.5% YoY to 105.6mn, 48.3mn, and 39.9mn in 2019.
We believe growing enrollment indicates a larger pool of potential customers for the after-school
education industry.
Also, the competition in standardized tests in China has been intense, especially as students
move upwards. According to the MOE, the gross enrollment rate at the higher education level was
51.6% in 2019, the lowest among all education levels. The relatively low enrollment rate at higher
education means students would need to excel in exams for admission, creating the demand for
quality after-school tutoring courses. This trend would continue to benefit industry players,
especially leaders with a vast school network and reliable brand names.

New Oriental Education & Technology Group Inc. (EDU US) China Education Sector
4
Exhibit 4: Admission rate of different levels of education in China
2014 2015 2016 2017 2018 2019
Higher education 37.5 40.0 42.7 45.7 48.1 51.6
High school (G10-12) 86.5 87.0 87.5 88.3 88.8 89.5
Middle school (G7-9) 103.5 104.0 104.0 103.5 100.9 102.6
Primary school (G1-6) 99.81 99.88 99.92 99.91 99.95 99.94
Preschool 70.5 75.0 77.4 79.6 81.7 83.4
Note: Primary school uses a net rate, others use gross rate
Source(s): MOE, ABCI Securities
Moreover, the after-school education market is likely to face consolidation post COVID-19
outbreak. As many players are likely to run into challenges during and after the outbreak, such as
liquidity issues and student dropouts, the market has become less crowded. We believe that the
leading players would be able to acquire more market shares by acquiring the struggling players or
penetrating into previously unreached markets.
3. Successful development solidifies leadership
Due to the large student and potential customer population, increasing demand for quality
after-school education, and the diversified needs for after-school education across subjects and
regions, the after-school education market is able to provide opportunities for players of different
sizes or niche to thrive.
TAL Education (TAL US), which also focuses on after-school tutoring education, has emerged as a
major competitor for the Group. The following table compares the Group with TAL Education by
financial metric, market cap, and business scope.
Exhibit 5: Competitive landscape overview
New Oriental (EDU US) TAL (TAL US)
Market Cap: US$ 23.38bn Market Cap: US$ 48.81bn
FY18A FY19A FY20A FY18A FY19A FY20A
Net revenue size (US$ mn) 2,447 3,096 3,579 1,715 2,563 3,273
GPM (%) 56.5 55.6 55.6 48.6 54.6 55.1
OPM (%) 10.7 9.9 11.1 12.2 13.3 4.2
NPM (to shareholders of the Company) (%) 12.1 7.4 9.9 11.6 14.3 (3.4)
ROAA (%) 8.6 5.3 6.3 8.0 10.7 (2.7)
ROAE (%) 16.1 10.9 16.2 17.5 17.9 (4.4)
Scope of business
Offers a wide range of educational programs,
services and products, consisting primarily of
language training and test preparation,
preschool, primary and secondary school
education, online education, content
development and distribution, overseas study
consulting services, and study tour.
Offers comprehensive tutoring services to K-12
students covering core academic subjects;
provides consulting services for overseas studies
and preparation courses for major standardized
tests; operates several online community
platforms; supports educational institutions and
public schools in China.
Note. 1) New Oriental’s FY ends on May 31; TAL’s FY ends on Feb 28; 2) Market cap data is as of Aug 6, 2020
Source(s): Companies, ABCI Securities
The Group has been maintaining a relatively stable margin and return profile. The Group’s
revenue growth in FY18A, FY19A, and FY20A were 36.0% YoY, 26.5% YoY, and 15.6% YoY;
student enrollment in the same periods grew 30.3% YoY, 32.4% YoY, and 26.3% YoY. We believe
the Group’s ability to sustain growth and maintain market leadership can be attributed to its
success in program development and operation model.
One key milestone for the Group was capturing the opportunities in K-12 after-school tutoring
education market. Historically, the Group’s core businesses have been English language training
for adults and test preparation programs; however, the focus has shifted to K-12 after-school
tutoring program since 2013. In FY20, enrollment in K-12 after-school tutoring program reached
9,741.0k, representing 92.0% of total enrollment in the Group’s language training and test
preparation courses.

New Oriental Education & Technology Group Inc. (EDU US) China Education Sector
5
Exhibit 6: Student enrollment of language training and test preparation courses offered by the Group (k ppl)
Note. FY ends on May 31
Source(s): The Group, ABCI Securities
In terms of the operation model, we believe the Group’s dual-teacher classes and online learning
platform have offered critical competitive advantages.
The dual-teacher class model was initiated in 2015. In a typical dual-teacher class, a lecturing
teacher delivers the course remotely in a host classroom online via live-streaming, while another
teacher serves as teaching assistant in the guest classroom where students participate in the
course. According to the 4Q20 earnings release, the Group stated it would add four new
dual-teacher model schools in four new cities. We believe the dual-teacher model classes enable
the Group to further penetrate into cities where its network is less established.
According to the Group, it currently has an industry-leading OMO ecosystem (online-merge-offline)
that integrates online and offline learning. Besides, enrollment of after-school education for the
Group’s online learning platform, Koolearn (1797 HK), increased by 12.3% YoY to 2,179k in FY19;
average spending per enrollment also increased by 17.3% YoY to RMB 434 in FY19. We believe
the development of the OMO ecosystem and online learning platform enhances learning
experience by breaking the limitation of traditional classroom setting, offering students more
educational contents, and providing a more interactive and flexible learning experience for
students.
Exhibit 7: Operating data of Koolearn Technology (1797 HK)
FY16A FY17A FY18A FY19A
Student enrollment (k)
College education 538 829 1,158 1,293
K-12 education 60 75 185 572
Preschool education 55 106 597 314
Avg. spending per enrollment (RMB)
College education 718 621 682 715
K-12 education 581 784 991 959
Preschool education 12 40 44 203
Subtotal average 627 558 462 646
Entry courses 6 9 11 21
Total average 488 457 370 434
Note. 1) FY ends on May 31; 2) Koolearn has not released FY20 results as of report date
Source(s): The Group, ABCI Securities
0
2,000
4,000
6,000
8,000
10,000
12,000
FY06 FY07 FY08 FY09 FY10 FY11 FY12 FY13 FY14 FY15 FY16 FY17 FY18 FY19 FY20
K-12 after-school tutoring courses Test preparation English language training programs for adults
New Oriental Education & Technology Group Inc. (EDU US) China Education Sector
6
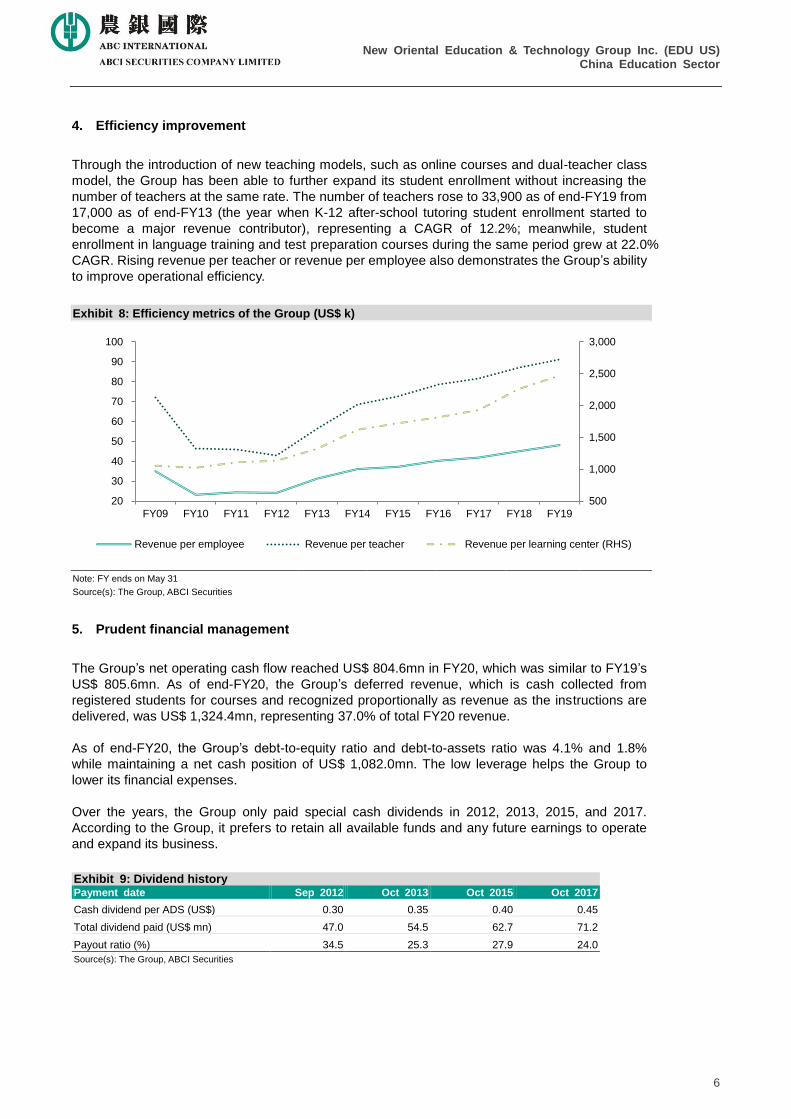
4. Efficiency improvement
Through the introduction of new teaching models, such as online courses and dual-teacher class
model, the Group has been able to further expand its student enrollment without increasing the
number of teachers at the same rate. The number of teachers rose to 33,900 as of end-FY19 from
17,000 as of end-FY13 (the year when K-12 after-school tutoring student enrollment started to
become a major revenue contributor), representing a CAGR of 12.2%; meanwhile, student
enrollment in language training and test preparation courses during the same period grew at 22.0%
CAGR. Rising revenue per teacher or revenue per employee also demonstrates the Group’s ability
to improve operational efficiency.
Exhibit 8: Efficiency metrics of the Group (US$ k)
Note: FY ends on May 31
Source(s): The Group, ABCI Securities
5. Prudent financial management
The Group’s net operating cash flow reached US$ 804.6mn in FY20, which was similar to FY19’s
US$ 805.6mn. As of end-FY20, the Group’s deferred revenue, which is cash collected from
registered students for courses and recognized proportionally as revenue as the instructions are
delivered, was US$ 1,324.4mn, representing 37.0% of total FY20 revenue.
As of end-FY20, the Group’s debt-to-equity ratio and debt-to-assets ratio was 4.1% and 1.8%
while maintaining a net cash position of US$ 1,082.0mn. The low leverage helps the Group to
lower its financial expenses.
Over the years, the Group only paid special cash dividends in 2012, 2013, 2015, and 2017.
According to the Group, it prefers to retain all available funds and any future earnings to operate
and expand its business.
Exhibit 9: Dividend history Payment date Sep 2012 Oct 2013 Oct 2015 Oct 2017
Cash dividend per ADS (US$) 0.30 0.35 0.40 0.45
Total dividend paid (US$ mn) 47.0 54.5 62.7 71.2
Payout ratio (%) 34.5 25.3 27.9 24.0
Source(s): The Group, ABCI Securities
500
1,000
1,500
2,000
2,500
3,000
20
30
40
50
60
70
80
90
100
FY09 FY10 FY11 FY12 FY13 FY14 FY15 FY16 FY17 FY18 FY19
Revenue per employee Revenue per teacher Revenue per learning center (RHS)

New Oriental Education & Technology Group Inc. (EDU US) China Education Sector
7
Growth and profitability outlook
FY20A-23E total net revenue CAGR to reach 27.7%
We estimate FY20A-23E total net revenue CAGR to be 27.7%. Our revenue projection is based on
the assumptions: 1) language training and test preparation courses would continue to be a major
revenue contributor and its contribution to total revenue would be relatively stable; 2) the Group’s
20%-25% capacity expansion plan for FY21 would be achieved, 3) the Group’s expansion in
school/learning center network would continue to translate into higher enrollment in language
training and test preparation courses.
For language training and test preparation programs, we project FY20A-23E revenue would grow
at 28.5% CAGR; student enrollment and average revenue per enrollment would expand at 26.4%
and 1.6% CAGRs for the same period; FY21E average revenue per enrollment, however, would
stay flat YoY due to the promotions and discounts provided during the COVID-19 outbreak.
Exhibit 10: Revenue projections and assumptions – language training and test preparation courses
As of May 31 FY19A FY20A FY21E FY22E FY23E
Student enrollment (k) 8,383 10,590 13,051 16,753 21,403
Revenue per enrollment (US$ k) 0.31 0.28 0.28 0.29 0.30
Revenue (US$ mn) 2,606 3,010 3,625 4,801 6,381
Total revenue contribution (%) 84.2 84.1 83.5 84.7 85.6
Source(s): The Group, ABCI Securities estimates
Steady margin improvement started in FY22E
We expect that FY21E would face certain margin pressure due to the COVID-19 outbreak, but
improvements would come in FY22E and FY23E. We project GPM, OPM, and NPM (to
shareholders of the Company) to increase from 55.6%, 11.1%, and 9.9% in FY20 to 57.1%, 14.3%,
and 12.3% in FY23E, thanks to increased efficiency and economies of scale as the Group
expands its network. We expect non-GAAP OPM and non-GAAP NPM (to shareholders of the
Company) to reach 15.8% and 13.9% in FY23E.
Exhibit 11: Margin projections (%)
As of May 31 FY19A FY20A FY21E FY22E FY23E
GPM 55.6 55.6 55.7 56.7 57.1
OPM 9.9 11.1 11.9 13.6 14.3
NPM (to shareholders of the Company) 7.4 9.9 10.7 11.8 12.3
Non-GAAP OPM 12.2 12.9 13.6 15.2 15.8
Non-GAAP NPM (to shareholders of the Company) 13.3 13.5 12.5 13.6 13.9
Note: Non-GAAP measures exclude the impact of share-based compensation expenses on operating costs and expenses
Source(s): The Group, ABCI Securities estimates

New Oriental Education & Technology Group Inc. (EDU US) China Education Sector
8
Valuation
TP at US$ 176.0; initiate with BUY
We adopt the DCF method to conduct valuation for the Group. The assumptions of our DCF model
include: 1) a beta of 0.93; a risk-free rate of 2.98%; an expected market return of 11.21%; a target
debt/asset ratio of 0.50%; a terminal growth rate of 5%. Based on the above assumptions, we
derived a WACC of 10.59%.
Our DCF model yields a valuation at US$ 176.0/ADS, which represents 59.58x/41.14x 21E/22E
P/E, or 8.70x/7.18x 21E/22E P/B. Initiate with BUY.
Peer valuation analysis
The Group has only a few comparable peers, and they are mostly US-listed. We picked TAL
Education and GSX Techedu as peers, as they are in similar market segment. However, in terms
of business model and size, TAL Education is more comparable to the Group. According to
Bloomberg, the three peers we chose had an average valuation of 103.37x/69.14x 21E/22E P/E
as of Aug 6, 2020, which was much higher than the Group’s. Considering the Group’s leading
position in China’s after-school education industry, we believe the counter is an undervalued
bargain.
Exhibit 12: Peer valuation comparison
Ticker Name FY end P/E (x) P/B (x) Yield (%) ROAA (%) ROAE (%)
2021 2022 2021 2022 2021 2022 2021 2022 2021 2022
EDU US New Oriental May-31 49.96 34.49 7.30 6.02 0.0 0.0 6.5 7.7 15.8 19.1
TAL US TAL Education Feb-28 99.75 57.17 16.58 13.03 0.0 0.0 7.2 12.3 15.2 22.4
GSX US GSX Techedu Dec-31 160.40 115.77 58.42 38.47 0.0 0.0 13.5 15.7 44.7 43.0
Average
103.37 69.14 27.43 19.17 0.00 0.00 9.1 11.9 25.2 28.2
Note: Data as of Aug 6, 2020
Source(s): Bloomberg, ABCI Securities

New Oriental Education & Technology Group Inc. (EDU US) China Education Sector
9
Risk factors
Macroeconomic risk
China’s economy suffered from the impact of the COVID-19 pandemic. According to the NBS, the
1H20 median/average personal disposable incomes were RMB 13,347/RMB 15,666, up only by
0.5%/2.4% YoY. In terms of consumption category, spending on “Education, cultural, &
entertainment services” declined by 35.7% in 1H20 vs. 36.1% in 1Q20, showing that consumers are
still cautious.
Exhibit 13: Per capita average spending on “Education, cultural, & entertainment services”
1Q19 1H19 2019 1Q20 1H20
Average spending (RMB) 548 1,033 2,513 350 664
Change (YoY %) 20.6 10.9 12.9 (36.1) (35.7)
Source(s): NBS, ABCI Securities
Regulatory risk
The after-school education industry is facing an increasingly stringent regulatory environment. The
authorities in 2018 issued several new policies to regulate the after-school education business. In
Feb 2018, MOE released the “Circular on Special Enforcement Campaign concerning After-school
Training Institutions to Alleviate Extracurricular Burden on Students of Primary Schools and Middle
School” (《关于切实减轻中小学生课外负担开展校外培训机构专项治理行动的通知》) that aims to
alleviate after-school burden on primary and middle school students through inspection and
rectification on after-school tutoring institutions.
In Aug 2018, the State Council released the “Opinion on Regulating the Tutoring Industry” (the
Opinion) (《国务院办公厅关于规范校外培训机构发展的意见》). The Opinion states that 1) course
information should be filed with the local education authorities and made publicly available; 2)
contents of tutorial courses should not surpass the national guideline; students should be placed in
courses that match their grade levels; 3) course schedule should not be in conflict with regular
school time; 4) tutorial centers should not offer tutoring courses after 8:30 p.m. and instructors
should not assign homework for students; 5) no examination, competition, and any related rankings
should be conducted for the courses of primary school and secondary school subjects; 6) tutorial
centers cannot receive students' tuition payments for more than three months in advance; 7)
instructors who teach Chinese, mathematics, foreign language, physics, chemistry and other
subjects in the compulsory education system shall obtain teacher qualifications; 8) avg. floor space
per student during one tutorial session should be no less than three sqm.; 9) public school teachers
should not be employed by after-school tutoring institutions.
Pandemic risk
The COVID-19 outbreak has led to the suspension of classes for both the formal and informal
education industry in China. Resurgence of the outbreak would mean that certain regions may have
to endure more social distancing measures. According to the MOE, resumption of offline courses for
after-school education providers would depend on the full-reopening of local formal education
schools.
Demographic risk
China is facing a demographic challenge. The birth rate and the number of newborns in China hit
new lows at 10.84‰ and 14.65mn in 2019. Meanwhile, the Chinese population is aging. The
percentage of population aged 65 or above trended up to 12.6% in 2019, while the percentage of
those aged between 15-64 has been steadily declining to 69.6%. The declining birth rate and
growing aged population may mean the downtrend in newborns would continue, which may

New Oriental Education & Technology Group Inc. (EDU US) China Education Sector
10
negatively impact the future growth of students population and potential customers for the
after-school tutoring industry.
Exhibit 14: Demographics in China
Birth rate and number of newborns in China Age distribution in China (%)
Source(s): NBS, ABCI Securities
Rapidly changing industry
The after-school education industry is undergoing rapid changes due to a slew of factors, including
the regulatory ones. As social distancing measures were implemented due to the COVID-19
outbreak, teaching has shifted from offline to online, meaning that education providers that are less
equipped with online teaching capability and IT support may be disadvantaged. Besides, the
pandemic also led to changes in the entire application process for overseas educational institutions
and potential postponement of overseas study plans for Chinese students. Therefore, revenue from
overseas test preparation courses may drop at least in the coming fiscal year for the Group. Social,
political, and economic changes in the domestic and overseas markets mean it is crucial to remain
flexible.
Education quality risk
The Group’s education quality is crucial for student retention and new student recruitment. If the
Group is unable to maintain the education quality of the courses offered, its existing students would
terminate subscription and potential students would prefer courses offered by competitors.
Expansion risk
The Group has been increasing the number of schools and learning centers to expand its
geographical coverage. If the Group is unable to launch programs that can successfully cater to the
local demand or compete with the local players, it may have to withdraw from the specific market.
Also, the Group has been expanding its business through acquisition. However, if the targets fail to
perform as expected or synergize with the Group’s operation, the disposal of such targets may
result in impairment charges.
Seasonality of business
The Group’s business is subject to seasonal patterns and these seasonal patterns have been
changing. However, the Group’s expenses may vary or may not correspond with the seasonal
pattern. The mismatch of revenue and expenses would create fluctuation in quarterly margin
performance.
10.0
10.5
11.0
11.5
12.0
12.5
13.0
13.5
-
5,000
10,000
15,000
20,000
2008
2009
2010
2011
2012
2013
2014
2015
2016
2017
2018
2019
# of new borns (k) Birth rate (‰) (RHS)
65
67
69
71
73
75
77
5
10
15
20
25
30
1998
2000
2002
2004
2006
2008
2010
2012
2014
2016
2018
0-14 65 or above 15-64 (RHS)

New Oriental Education & Technology Group Inc. (EDU US) China Education Sector
11
Exhibit 15: Quarterly margins (%)
Note: FY ends on May 31
Source(s): The Group, ABCI Securities
Exhibit 16: Student enrollment contribution by quarter (%)
Note: FY ends on May 31
Source(s): The Group, ABCI Securities
Concentration risk
According to the Group, 30.9% of the FY19 total net revenue came from operations in Beijing,
Hangzhou, Shanghai, and Xi’an, and the Group expected the four cities to continue to be the major
sources of revenue in the future as of end-FY19. If any of these cities experience events that
negatively impact the local economy or the private education industry, the Group’s growth would be
affected.
Non-GAAP financial metrics
The Group also discloses non-GAAP financial metrics, which exclude the impact of share-based
compensation expenses on operating costs and expenses. There are discrepancies between the
reported figures and the non-GAAP figures. We believe investors should exercise caution when
interpreting non-GAAP financial metrics.
Lack of dividend payout
The Group only paid special cash dividend in 2012, 2013, 2015, and 2017 and prefers to retain all
available funds and any future earnings to operate and expand its business. We believe that the
lack of potential dividend payout would lower the total return received by investors, thus reducing
the Group’s attractiveness.
45.0
47.0
49.0
51.0
53.0
55.0
57.0
59.0
61.0
63.0
65.0
(6.0)
(1.0)
4.0
9.0
14.0
19.0
24.0
29.0
34.0
1Q
16
2Q
16
3Q
16
4Q
16
1Q
17
2Q
17
3Q
17
4Q
17
1Q
18
2Q
18
3Q
18
4Q
18
1Q
19
2Q
19
3Q
19
4Q
19
1Q
20
2Q
20
3Q
20
4Q
20
OPM NPM (to shareholders of the Company) GPM (RHS)
0
20
40
60
80
100
FY15 FY16 FY17 FY18 FY19 FY20
1Q 2Q 3Q 4Q

New Oriental Education & Technology Group Inc. (EDU US) China Education Sector
12
Financial statements Consolidated income statement As of May 31 (US$ mn, except per share data) FY19A FY20A FY21E FY22E FY23E
Net revenue 3,096 3,579 4,342 5,669 7,454
Cost of revenue (1,376) (1,589) (1,922) (2,453) (3,195)
Gross profit 1,720 1,990 2,420 3,216 4,259
Selling and marketing expenses (384) (445) (537) (683) (895)
General and admin expenses (1,034) (1,146) (1,366) (1,762) (2,300)
Gain/loss on disposal of subsidiaries 4 0 0 0 0
Operating profit 306 399 517 772 1,064
Other income, net 10 89 121 145 180
Profit before tax provision and gain(loss) from investments 316 316 488 637 917
Tax (86) (134) (171) (243) (329)
Income/(Loss) from equity method investments (2) 1 (2) (2) (2)
Net profit 228 355 465 672 913
- Owners 238 413 468 678 925
- MI (10) (58) (3) (6) (12)
Net profit per common share/ADS (US$) - Basic 1.50 2.61 2.95 4.28 5.84
- Diluted 1.50 2.59 2.93 4.25 5.80
Note: Each ADS represents one common share
Source(s): The Group, ABCI Securities estimates
Consolidated balance sheet As of May 31 (US$ mn) FY19A FY20A FY21E FY22E FY23E
Cash, cash equivalents, and restricted cash 1,414 915 1,398 1,316 2,286
ST investments 1,669 2,318 2,802 3,639 4,470
Others 383 523 616 634 1,139
Current assets 3,466 3,756 4,816 5,589 7,895
PP&E 532 672 609 968 954
LT investments 405 431 574 637 745
Right-of-use assets 0 1,425 1,524 2,033 2,003
Others 244 271 315 360 477
Non-current assets 1,180 2,800 3,022 3,999 4,179
Total assets 4,647 6,557 7,837 9,588 12,073
Deferred revenue 1,301 1,324 2,203 2,288 3,521
Others 705 1,155 926 1,382 1,699
Current liabilities 2,006 2,479 3,129 3,670 5,221
LT borrowing 96 118 123 144 167
Deferred tax liabilities 19 12 31 25 49
Non-current lease liabilities 0 1,078 1,219 1,743 1,717
Non-current liabilities 115 1,208 1,374 1,912 1,933
Shareholders' capital 2,361 2,737 3,205 3,883 4,808
MI 164 133 129 123 111
Total equity 2,525 2,870 3,334 4,006 4,919
Total liabilities and equity 4,647 6,557 7,837 9,588 12,073
Source(s): The Group, ABCI Securities estimates

New Oriental Education & Technology Group Inc. (EDU US) China Education Sector
13
Consolidated cash flow statement As of May 31 (US$ mn) FY19A FY20A FY21E FY22E FY23E
Net profit 228 355 465 672 913
Depreciation and amortization 114 122 149 198 252
Change in working capital 311 298 879 534 1,247
Others 153 30 35 36 42
Cash flow from operating activities 806 805 1,527 1,440 2,454
Change in PP&E and land use right (260) (304) (358) (488) (551)
Change in investments (245) (286) (481) (398) (938)
Others (70) (176) 53 (11) (261)
Cash flow from investing activities (575) (767) (786) (897) (1,751)
Change in borrowing 96 21 5 21 23
Others 170 (107) (734) (563) (688)
Cash flow from financing activities 267 (86) (729) (542) (665)
Effect of foreign exchange rate changes (66) (48) 12 1 39
Net change in cash, cash equivalent, and restricted cash 267 431 (452) 471 (82)
cash, cash equivalent, and restricted cash - end 1,418 919 1,402 1,321 2,294
Source(s): The Group, ABCI Securities estimates
Key operating and financial ratios As of May 31 FY19A FY20A FY21E FY22E FY23E
Growth (YoY %)
Net revenue 26.5 15.6 21.3 30.6 31.5
Gross profit 24.5 15.7 21.6 32.9 32.4
Operating profit 16.2 30.6 29.5 49.3 37.8
Net profit (to shareholders of the Company) (19.6) 73.6 13.2 44.8 36.4
Profitability ratios (%)
GPM 55.6 55.6 55.7 56.7 57.1
OPM 9.9 11.1 11.9 13.6 14.3
NPM (to owners of the Company) 7.4 9.9 10.7 11.8 12.3
Non-GAAP OPM 12.2 12.9 13.6 15.2 15.8
Non-GAAP NPM (to owners of the Company) 13.3 13.5 12.5 13.6 13.9
Return ratios (%)
ROAA 5.3 6.3 6.5 7.7 8.4
ROAE 10.9 16.2 15.8 19.1 21.3
Liquidity ratio (x)
Current ratio 1.7 1.5 1.5 1.5 1.5
Cash ratio 0.8 0.5 0.5 0.4 0.5
Leverage ratios (%)
Total debt to Equity 3.8 4.1 3.7 3.6 3.4
Total debt to Total assets 2.1 1.8 1.6 1.5 1.4
Net debt/(cash) to Equity (56.5) (37.7) (45.2) (35.3) (53.3)
Net debt/(cash) to Total assets (30.7) (16.5) (19.2) (14.8) (21.7)
Source(s): The Group, ABCI Securities estimates

New Oriental Education & Technology Group Inc. (EDU US) China Education Sector
14
Disclosures Analyst Certification I, PAN Hongxing, Paul, being the person primarily responsible for the content of this research report, in whole or in part, hereby certify that all of the views expressed in this report accurately reflect my personal view about the subject company or companies and its or their securities. I also certify that no part of my compensation was, is, or will be, directly or indirectly, related to the specific recommendations or views expressed in this report. I and/or my associates have no financial interests in relation to the listed company (ies) covered in this report, and I and/or my associates do not serve as officer(s) of the listed company (ies) covered in this report. Disclosures of Interests
ABCI Securities Company Limited and/or its affiliates may pursue financial interests to the companies mentioned in the
report.
Definition of equity rating
Rating Definition
Buy Stock return rate≥ Market return rate (10%)
Hold - Market return rate (-10%) ≤ Stock return rate < Market return rate (+10%)
Sell Stock return < - Market return (-10%)
Stock return rate: expected percentage change of share price plus gross dividend yield over the next 12 months
Market return rate: average market return rate since 2008 (HSI total return index 2008-19 CAGR at 10%) Time horizon of share price target: 12-month Stock rating, however, may vary from the stated framework due to factors including but not limited to: corporate governance, market capitalization, historical price volatility relative to corresponding benchmark index, average daily turnover of the stock relative to market capitalization of the stock, competitive advantages in corresponding industry, etc. Disclaimers
This report is for our clients only and is for distribution only under such circumstances as may be permitted by applicable law. It has no regard to the specific investment objectives, financial situation or particular needs of any specific recipient. It is published solely for informational purposes and is not to be construed as a solicitation or an offer to buy or sell any securities or related financial instruments. No representation or warranty, either expresses or implied, is provided in relation to the accuracy, completeness or reliability of the information contained herein. This report should not be regarded by recipients as a substitute for the exercise of their own judgment. Any opinions expressed in this report are subject to change without notice and may differ or be contrary to opinions expressed by other business areas as a result of using different assumptions and criteria. The analysis contained herein is based on numerous assumptions. Different assumptions could result in materially different results. The analyst(s) responsible for the preparation of this report may interact with trading desk personnel, sales personnel and other constituencies for the purpose of gathering, synthesizing and interpreting market information. ABCI Securities Company Limited is under no obligation to update or keep current the information contained herein. ABCI Securities Company Limited relies on information barriers to control the flow of information contained in one or more areas within ABCI Securities Company Limited, into other areas, units, groups or affiliates of ABCI Securities Company Limited. The compensation of the analyst who prepared this report is determined exclusively by research management and senior management (not including investment banking). Analyst compensation is not based on investment banking revenues, however, compensation may relate to the revenues of ABCI Securities Company Limited as a whole, of which investment banking, sales and trading are a part. The securities described herein may not be eligible for sale in all jurisdictions or to certain categories of investors. The price and value of the investments referred to in this research and the income from them may fluctuate. Past performance is not necessarily indicative of future results. Foreign currency rates of exchange may adversely affect the value, price or income of any security or related instrument mentioned in this report. For investment advice, trade execution or other enquiries, clients should contact their local sales representative. Neither ABCI Securities Company Limited nor any of its affiliates, directors, employees or agents accepts any liability for any loss or damage arising out of the use of all or any part of this report. Additional information will be made available upon request.
Copyright 2020 ABCI Securities Company Limited
No part of this material may be (i) copied, photocopied or duplicated in any form by any means or (ii) redistributed without the prior written consent of ABCI Securities Company Limited. Office address: ABCI Securities Company Limited, 13th Floor, Fairmont House, 8 Cotton Tree Drive, Central, Hong Kong. Tel: (852) 2868 2183