Embed Size (px)
Citation preview

N E W O P P O R T U N I T I E S
WORK IT, UKRAINE!New factory opens in the city of Zolotonosha
INVEST
RISE TO THE TOP!Enjoying a 36.6% Group Profit after-tax
MONEY
VIVA MEXICO!DonNachos hits the shelves in 2012
PRODUCTS
ANNUAL REPORT 2012
A NEW PRIDE!Development of 81 Playfair Road
ASSET
ANNUAL REPORT 2012


Food Empire Holdings Limited Annual Report 2012
02INTRODUCTION
VOYAGE OF DISCOVERIESA timeline of discovery from around
the globe.
04CORPORATE PROFILE
EVERYTHING YOU NEED TO KNOW ABOUT FOOD
EMPIRE, AND MORE!Who and what is Food Empire? Let us give you the lowdown on their rise to superiority
throughout the world.
06EXECUTIVE CHAIRMAN’S MESSAGE
FRONTIERWith great power comes great
responsibility.
10CEO’S STATEMENT
PERSPECTIVETaking on a new portfolio and adding
value to a growing empire.
11FINANCIAL HIGHLIGHTS
THE YEAR IN NUMBERSA play-by-play on the year’s top fi nancial
highlights for easy reference.
12OPERATIONS REVIEW
MAGNIFYING STRENGTHSPlotting the next move through research, development and sustainable strategies.
16MARKETING ACTIVITIES
CREATING BUZZSheer hard work does pay off, and the
reward would be to party up and boogie down with the FE crew!
20GLOBAL PRESENCE
COAST TO COASTSetting foot on new territories.
22NEW PRODUCTS
MAKE WAY FOR THESE NEW WINNERS
Lining the shelves with tasty new treats and sweets that will tickle all taste buds!
24BOARD OF DIRECTORS
THE BUSINESS COLLECTIVEShining a light on the movers and makers
of Food Empire.
28STAFF CONTRIBUTION
EXPLORERS’ TALESLive vicariously through the lives of others
as we share our journey of discoveries with all of you.
31CORPORATE INFORMATION
THE ESSENTIALSCall, post or email the Food Empire
parliamentary committees.
MISSION STATEMENTWe aim to be the leading global food and beverage company providing quality products and services. We will achieve this goal as we have the people, the passion and the enterprising spirit to make a difference.
33 Financial Content 143 Shareholders’ Information 146 Notice of Annual General Meeting & Proxy Form
CONTENTS
ALSO IN THIS ISSUE
01

INTRODUCTION
VOYAGE OF
DISCOVERIESWALK LIKE AN EGYPTIAN The Pyramids of Giza were never a discovery, they were always standing on the hot desert sands of the Sahara.
With an innate knack for everything Egyptian, Howard Carter spent over 30 years doing archaeological excavation in the region before he and his team discovered the steps leading to the tomb of King Tutankhamen on 1st November 1922, where the young Pharaoh’s mummifi ed body was fi rst found, the fi rst of many mummies to come.
UNCOVERING THE SECRET ARMYIn 1974, while drilling a well, some local farmers in Xi’an, China, discovered the head of the fi rst terracotta warrior.
Uncovering the burial site of the fi rst Emperor of China, Qin Shi’Huang (259BC – 210BC), who was buried with over 8,000 full-scale fi gurines of warriors, horses, chariots, archers,
PAINTINGS ON THE WALL8 year-old Maria led her father, Marcelino Sanz de Sautuola through the forest and into a cave to fulfi l her childhood wonderment. What they discovered is now a national treasure of Spain.
In 1880, one year after its initial discovery, the Cave Paintings of Altamira were opened for public viewing. Bold images of bison and the hands of men, as well as other mammalian creatures were depicted on the rocky interior of the cave. Declared a World Heritage Site by UNESCO, these early paintings are proof that our ancestors held the mental capacity to produce artistic expression.
acrobats, musicians and court offi cials, had everything needed to serve, amuse and defend him in the afterlife.
This discovery is signifi cant to uncovering the wonders of this period in Chinese history, where under his rule, China was unifi ed and underwent major economic and political reforms, including the abolishment of centuries old tradition of feudalism.
02

FROM LIGHTNING TO LIGHTINGZAP! He fainted and fell to the ground, his kite lying lifeless beside him. Benjamin Franklin had done it. He had proven that lightning produces electricity, and had managed to store it within a metal key.
Although electricity was discovered much earlier, it was a novelty to use. Benjamin Franklin is to be thanked for the creation of the lightning rod, entrapping a natural source of electricity, and acting as a conductor that is to be used in the daily routine of ordinary folks.
LAND OF THE BRAVEIt was all an accident. Christopher Columbus didn’t mean to wash up on the shores of the Americas. A trader by profession, Christopher and his brother, Bartholomew, wanted to gain riches from East Asia. The infamous Silk Road crossing had proven to be dangerous, and a trip around the South African coast would prove too lengthy. So straight across the Atlantic Ocean he went.
In his original calculations, he thought that Asia would be 2,400 miles from Portugal. He was way off. It was actually 10,000 miles away! Not to mention the huge continent in between.
This new world brought new opportunities, and he was the fi rst European explorer to conquer North
America. Known as the father of the new world, on his next visit he introduced horses to the people there, as a mode of transportation and conquest.
MOONWALKER “That’s one small step for Man, one giant leap for Mankind.”
History was made on July 21st, 1969, when Neil Armstrong stepped out from his spacecraft and made the fi rst footprint on the lunar surface. Together with Buzz Aldrin, the second man to walk on the moon, they collected actual moon rocks and spent over 21 hours on the uneven craters of the moon.
Food Empire Holdings Limited Annual Report 2012
r by her,
d
t
urs on the moon.
BEAN RUSH
COFFEE PLANTS OPTIMALLY THRIVE IN THE TROPICS. BETWEEN THE TROPICS OF CANCER AND CAPRICORN, ALL 65 COUNTRIES WHERE COFFEE IS GROWN ARE FOUND ALONG THIS EQUATOR REGION.
COFFEE BEANS DON’T COME IN SHADES OF BROWN; STARTING OUT YELLOW, THEY RIPEN INTO A RED BERRY, WHICH IS THEN HANDPICKED TO HARVEST. A WATER SOAKING PROCESS DE-SHELLS THE RED BERRY, UNVEILING THE FINAL PRODUCT: A RAW GREEN COFFEE BEAN.
COFFEE CAN ACTUALLY BE USED TO FUEL A CAR. THOUGH MAYBE NOT VERY EFFICIENTLY AT THE MOMENT, IT IS NICE TO KNOW THAT THERE IS AN ALTERNATIVE OUT THERE THAT CAN NOT ONLY FUEL OUR BODIES BUT OUR VEHICLES TOO.
COFFEE IS THE SECOND MOST TRADED COMMODITY IN THE WORLD, SECOND ONLY TO OIL, AND NOW THAT WE KNOW IT CAN BE USED AS A SOURCE OF FUEL IT PROBABLY WON’T BE TOO LONG BEFORE IT’S NUMBER 1.
03
CORPORATE PROFILE
SGX Mainboard-listed Food Empire Holdings (Food Empire) is a global branding and manufacturing company in the food and beverage sector. Its products include instant beverage products, frozen convenience food, confectionery and snack food.
Food Empire’s products are exported to over 60 countries, in markets such as Russia, Ukraine, Kazakhstan, Central Asia, China, Indochina, the Middle East, Mongolia and the US. The Group has 19 offi ces (representative and liaison) worldwide. The Group operates fi ve manufacturing facilities in Singapore, Russia, Ukraine, Malaysia and Vietnam.
Food Empire’s products include a wide variety of beverages, such as regular and fl avoured coffee mixes and cappuccinos, chocolate drinks and fl avoured fruit teas. It also markets instant breakfast cereal, potato crisps and assorted frozen convenience foods.
Food Empire’s strength lies in its proprietary brands - including MacCoffee, Petrovskaya Sloboda, Klassno, Hyson, OrienBites and Kracks. MacCoffee - the Group’s fl agship brand - has been consistently ranked as the leading 3-in1 instant coffee brand in the Group’s core market of Russia, Ukraine and Kazakhstan. The Group employs sophisticated brand building activities, localized to match the fl avor of the local markets in which its products are sold.
Since its public listing in 2000, Food Empire has won numerous accolades including being selected as one of the “Most Valuable Singapore Brands”; ranked as one of “The Strongest Singapore Brands”; Forbes Magazine also named Food Empire twice, as one of the “Best under a Billion” companies in Asia.
EVERYTHING
04
YOU NEED TO KNOW
AB UT FOOD EMPIRE
AND MORE!

Food Empire Holdings Limited Annual Report 2012
GEARED UP FOR SUCCESS
Our strong and committed team focuses on maintaining business sustainability by continually seeking new ways to enhance product quality
and new territories to venture into.
05

EXECUTIVE CHAIRMAN’S MESSAGE
IT HAS BEEN AN EXCITING AND REWARDING 12 MONTHS FOR EVERYONE AT FOOD EMPIRE. FINANCIAL YEAR 2012 SAW ANOTHER RECORD REVENUE TOGETHER
WITH A HEALTHY BOOST IN OUR PROFITABILITY.
FRONTIER
• Food Empire products are exported to over 60 countries worldwide.
• Over 200 different types of consumables are marketed under Food Empire brands.
• Biggest market share of 3-in-1 coffee mix brand in Russia, Ukraine and Kazakhstan.
• Over 57% of the Group’s revenue comes from Russia, where fl agship brand MacCoffee is continuously ranked as the leading 3-in-1 coffee mix brand.
• Growing at a rapid pace of 15% a year, China’s annual coffee consumption rate makes it the next big market to penetrate, besides India.
06
MacCoffee GOLDOut of 6 highly reputable contenders for the freeze-dried coffee segment, MacCoffee qualifi ed for the fi nals, coming in top 3 in ‘Control Purchase’, a Channel One Russia TV program, where a panel of viewers, buyers and experts determine which brands serve the fi nest products.

The most signifi cant event throughout the year was the appointment of Mr Sudeep Nair as the Group’s Chief Executive Offi cer. Mr Nair will take over the overall oversight of the Group’s day to day operations, while I, as Executive Chairman will continue to focus on the long term strategic objectives such as developing new markets, exploring opportunities for acquisitions as well as enhancing in-house production capabilities.
Mr Nair has been a vital part of our organisation and is the person responsible for our enormous success in Russia – our largest country market. Together, Mr Nair and I have 50 years of experience in the Group. Our passion for growing and protecting our business is as strong today as it was when we fi rst started.
The separation of the roles of Chief Executive Offi cer and Executive Chairman aligns with the new Code of Corporate Governance of the Singapore Exchange, and is also an important part of our business continuity planning. It allows us to groom the next generation of leaders, so as to provide our Group
with a foundation of strong experienced talent across all its operations.
We achieved strong sales and revenue performance in 2012 because we stayed focused on our key business strategies. First among our strategies, is our commitment to brand building. While we manufacture premium products, it is the intense loyalty our consumers have for our brands – the emotional bond that makes them put our products in their shopping baskets – that underpins the success of our business.
Throughout our key markets, we continued our pattern of innovative and effective marketing activities, from trade shows to sponsorships as well as more traditional direct consumer advertising. Our strong brands give us a powerful position in the market place. They allow us to successfully defend our position against attempts by competitors to erode our market share.
We took great strides during 2012 towards our goal of vertically integrating the upstream elements of our business. We are building a non-dairy creamer plant, a snack manufacturing facility as well as a packing plant in Malaysia. In addition, we are establishing a new instant coffee facility in the state of Andhra Pradesh in India due to come on stream in 2014. When completed, all these facilities will give us greater certainty and control over the supply and prices of our key ingredients.
Food Empire Holdings Limited Annual Report 2012
RADIO GAME ON RUSSIAN RADIOIn line with the APEC 2012 summit held in Vladivostok, Russia, the popular radio station, Lemma Radio, launched a live quiz in conjunction with this international event. Sponsoring the prizes, the contest raised brand awareness on MacCoffee.
Food Empire took part in SIAL Paris 2012
Klassno sampling activity in Hong Kong 2012
07
Mr Sudeep Nair

EXECUTIVE CHAIRMAN’S MESSAGE
In November we offi cially opened our newest manufacturing facility in Zolotonosha, in the Cherkasy region of Ukraine. The opening was attended by His Excellency Mr Simon Tensing de Cruz, Singapore’s non-resident Ambassador to Ukraine; Mr Sergei Tulub, Head of the Cherkasy Regional State Administration; and Mr Vitaly Wojciechowsky, Mayor of Zolotonosha.
Food Empire has been part of the Ukrainian business community for more than 15 years and this new facility will cater to our customers both in Ukraine as well as other parts of Eastern Europe. The ability to manufacture in Ukraine for the local market also has the benefi t of reducing the tariffs we would have to pay if we had imported our products.
While concern continues about the state of the European economy, consumer sentiments and the economic outlook in our major markets remain positive. Russia, Ukraine and Kazakhstan are all expected to record solid single digit GDP growth in 2013. In each of these countries, unemployment appears to be stable. Moreover, all three countries have now completed their presidential elections.
We are also increasingly confi dent that commodity prices will be less volatile than in previous years, allowing us to better plan our purchasing to reduce our
costs and optimize our manufacturing. However, if global growth kicks in, there is a risk that commodity prices may start to rise again.
Outside of our top three country markets, we are looking into Southeast Asia as well as the Middle East and Africa. We will also continue to explore acquisitions within the food and beverage industry.
Our shareholders are the foundation of our Group and I am grateful for their continuing belief and support in what we do. My appreciation extends to the other members of the Food Empire family - our customers, suppliers, partners and associates. And to colleagues who work for our Group all over the world,
I say “Thank You” for your efforts. We certainly achieved a great deal together in 2012.
Finally, I would like to express my gratitude to my fellow board members for their invaluable contributions throughout 2012. It is a great benefi t to be surrounded by people with such deep knowledge and integrity.
Mr Tan Wang CheowExecutive Chairman
Mr and Ms Food Empire Singapore 2012
Food Empire Singapore Christmas event 2012
(from left): Mr Tan Wang Cheow, Executive Chairman, Food Empire Holdings Ltd; Mr Sergei Tulub, Head of the Cherkasy Regional State Administration; His Excellency Mr Simon Tensing de Cruz, Singapore’s non-resident Ambassador to Ukraine; Mr Sudeep Nair, CEO, Food Empire Holdings Ltd.
Mr Sergey Chetverov, General Manger of the FES Ukraine Factory, addresses the media
08

Food Empire Holdings Limited Annual Report 2012
Recognising our strengths and expertise, and fuelled by a passion to discover new opportunities, our growth continues to be defined by our
stable market positioning and strategy.
DETECTING PROGRESS
09

CEO’S STATEMENT
PERSPECTIVE
10
I AM CONFIDENT THAT OUR COMPANY IS ON THE RIGHT TRACK TO ENJOY BOTH ORGANIC AND INORGANIC GROWTH DURING THE NEXT FEW YEARS
“
”
My fellow shareholders,
Food Empire has been my passion since I started working for the company nearly 20 years ago. Today, as Chief Executive Offi cer, I have the opportunity to take our company to the next level of its development.
The next few years will be exciting for our company, as we push into new markets and restructure our operations to give us better returns as well as sustainability.
My focus as CEO will be on three priority areas. The fi rst priority is our drive to develop our business in Asia, Middle East and the African continent. Outside of our top three country markets of Russia, Ukraine and Kazakhstan, we are concentrating our growth efforts in the emerging markets of Myanmar, Philippines, Malaysia, Vietnam, China
and the Middle East. We are also exploring new opportunities in some African countries.
My second priority is to continue exploring merger or acquisition activities which have the potential to strengthen our Group. We will continue to look for targets which will complement our brand and distribution activities within the food and beverage industry. This inorganic path has the potential to complement our organic growth strategy and help Food Empire to keep expanding.
My third priority is to streamline and restructure our operations, in particular, our manufacturing processes which include the establishment and consolidation of several new production facilities around the world.
By focusing on these three priority areas, I am confi dent that our company is on
the right track to enjoy both organic and inorganic growth during the next few years, and I am looking forward to more exciting and rewarding times ahead.
We are fortunate to have a dedicated and proven management team working closely with me on various projects in our key markets, and with support from headquarters, which will allow us to achieve the best for the company in the years to come.
I would like to thank all my colleagues, board members, shareholders and our partners for their faith and continuing support for me and our company.
Mr Sudeep NairChief Executive Offi cer

THE YEAR IN
NUMBER$
Russia
US$136.9million
Eastern Europe & Central Asia
US$74.6million
Other Territories
US$26.2million
Group Revenue (US$’000)
2012 2011 2010 2009
237,663
225,662
175,803 134,842
Group Profi t Before Tax (US$’000)
2012 2011 2010 2009
21,517
16,165
13,601
3,179
Food Empire Holdings Limited Annual Report 2012
2012 2011 2010 2009
(US$’000)
Revenue 237,663 225,662 175,803 134,842 Profi t before taxation and MI 21,517 16,165 13,601 3,179 Profi t after taxation and MI 20,486 14,962 13,659 2,665 Financial Indicators Debt to Equity Ratio 8.0% 9.3% 4.6% 4.7%Working Capital Ratio 3.6 4.3 4.2 4.7 Quick Ratio 2.9 3.6 3.3 4.0 EBITDA Margin 10.4% 8.1% 8.9% 4.0%Diluted EPS (USD cents) 3.85 2.82 2.57 0.50 NAV per share (USD cents) 30.34 27.31 25.36 23.38 Revenue by Geographical Regions (US$’000) Russia 136,875 129,356 100,498 68,156 Eastern Europe & Central Asia 74,563 71,385 55,228 49,223 Others 26,225 24,921 20,077 17,463
237,663 225,662 175,803 134,842 Revenue by Product Group (US$’000) Beverages 224,136 212,365 164,886 122,903 Non-Beverages 13,527 13,297 10,917 11,939
237,663 225,662 175,803 134,842
11
FINANCIAL HIGHLIGHTS

OPERATIONS REVIEW
FINANCIAL PERFORMANCE The Group delivered a strong set of fi nancial results for our shareholders in 2012, both in terms of revenue and profi tability.
Group’s revenue reached a new high of US$237.7 million, an increase of 5.3 per cent over 2011. In terms of profi tability, the Group achieved a 36.6 per cent increase in its profi t after-tax to US$20.2 million, a signifi cant improvement over 2011.
The Group’s revenue grew in all its three geographical regions. Russia, our largest market has recovered strongly since the economic downturn in 2008. Compared to 2011, sales in Russia were up by 5.8 per cent to reach a record high of US$136.9 million.
Sales in our second largest region, Eastern Europe and Central Asia (comprising Ukraine, Kazakhstan and the CIS Countries), rose by 4.5 per cent to US$74.6 million. The Group’s other markets, which comprise mainly the
Middle East and Asia also enjoyed a 5.2 per cent increase in sales to US$26.2 million.
In 2012, the Group recorded a robust profi t after-tax growth of 36.6 per cent to US$20.2 million, compared to US$14.8 million in 2011.
Besides an increase in overall sales volume, several other factors contributed to the strong fi nancial performance. Firstly, the Group achieved better operating margins for its products in key markets due to a combination of better average selling price and lower raw material costs, namely instant coffee,
non-dairy creamer and sugar. Secondly, there was a turnaround in foreign exchange performance with a gain of US$585,000 in 2012, compared to a loss of US$812,000 in the previous year. Thirdly, the Group’s share of profi ts from associates also increased from US$277,000 in 2011 to US$1.3 million in 2012.
In line with the Group’s international expansion, we increased our headcount in 2012, which resulted in a rise in staff costs of 19.2 per cent to US$29.1 million. The increase also refl ected higher salaries as well as increased social contributions paid to staff.
ETHIOPIAN HERDSMAN, KALDI, CAUGHT HIS GOAT BEHAVING EXCITEDLY AFTER CHEWING ON SOME RED BERRIES. THE DISCOVERY OF COFFEE WAS MADE!
ARAB TRADERS TOOK ETHIOPIAN COFFEE BEANS TO ARABIA (MODERN DAY YEMEN) AND CULTIVATED THE FIRST COFFEE PLANTATIONS.
NEW YORK CITY, USA – COFFEE OVERTOOK BEER AS THE BREAKFAST BEVERAGE OF CHOICE, COMPLEMENTING EGGS AND TOAST.
FIRST JAVANESE COFFEE BEANS HARVESTED AND BREWED, THANKS TO THE DUTCH EAST INDIA TRADERS.
A PARISIAN METAL-SMITH, LAURENS, INVENTED THE VERY FIRST COFFEE PERCOLATOR
Kazakhstan University Promotion 2012
MAGNIFYING
STRENGTHS
BEAN THROUGH HISTORY
850AD 1100 1668 1704 1818
Soccer match between Ukraine and Montenegro
12

Other operating expenses were also higher. These operating expenses primarily comprised brand building expenditures such as advertising, promotions and sponsorships.
There were also one-off costs associated with the establishment of a new manufacturing facility in Ukraine, as well as an increase in depreciation expenses for property, plant and equipment due to a larger asset base.
The Group continued to have a strong cash position, with cash and cash equivalents of US$46.6 million as at 31 December 2012, compared to US$35.1 million as at 31 December 2011.
Prepaid operating expenses and other debtors increased noticeably from US$2.2 million as at 31 December 2011 to US$6.7 million as at 31 December 2012. This was due to deposits made for the purchase of land and machinery arising from the Group’s investment in several green-fi eld projects.
Trade receivables fell by US$8.5 million due to the Group’s increased effort to secure timely payment from its debtors, while inventories and trade payables rose due to the acquisition of a Ukraine subsidiary that resulted in an increase in inventories carried. Other payables of US$8.4 million was also primarily due to the Group’s acquisition of its Ukraine subsidiary.
The Group’s cashfl ow performance has improved substantially due to the better overall performance of our Group as well as the diligence of our management team. Net cash from operations was US$27.0 million in 2012 compared to US$5.9 million in 2011.
BRAND BUILDING ACTIVITIESBrand building is Food Empire’s biggest strength. Food Empire’s brands are household favourites in many countries worldwide. Our fl agship brand – MacCoffee continues to dominate the 3-in-1 instant coffee segment in all our key country markets while our other brands such as Klassno, Petrovskaya Sloboda and Kracks all hold good market positions.
Throughout 2012, our Group engaged in numerous brand building activities. Among the highlights were:
PLMA “World of Private Label” Food Empire participated in PLMA, one of the world’s largest international trade shows held in Amsterdam. Food Empire used the trade show to showcase our ability to offer private label manufacturing for different product categories, including instant coffee, tea, beverages as well as a range of potato crisps.
WORLD’S FIRST ESPRESSO MACHINE WAS CREATED BY LOUIS BERNARD RABAUT OF FRANCE.
JAPANESE-AMERICAN CHEMIST, SATORI KATO, CREATED A SOLUBLE BLEND OF COFFEE - INSTANT COFFEE WAS BORN!
ITALIAN INVENTOR, ACHILLE GAGGIA, IMPROVED ON THE ESPRESSO MACHINE, MAKING THE FIRST EVER ‘CAPPUCCINO’.
FOOD EMPIRE PRODUCES OVER 3 BILLION SACHETS OF INSTANT COFFEE A YEAR!
Food Empire Holdings Limited Annual Report 2012
1822 1901 1946 NOW
13

OPERATIONS REVIEW
Chestnut Run in Ukraine MacCoffee sponsored the 20th annual sports and charity Chestnut Run in Ukraine, as part of the celebrations of Kyiv Day on Maidan Nezalezhnosti Square. The MacCoffee promotion was to attract consumers and stimulate trial purchases.
To Victory with MacCoffee MacCoffee became the exclusive partner of the football mini tournament between the State Duma deputies representing two parties - United Russia and the Liberal Democratic Party of Russia.
EURO 2012 MacCoffee launched a large-scale advertising campaign to support the European Football Championship 2012 (UEFA EURO 2012). The brilliant and eye-catching MacCoffee advertisements were posted on billboards, public transport, and aired on major radio stations.
Don’t Slumber Away the Summer MacCoffee’s 2012 advertising campaign “Don’t Slumber Away the Summer!” - a follow-up to 2011’s campaign - was launched during the European summer in Russia. During the two hottest months of the year, the bright and catchy advertisements by MacCoffee were posted on billboards and public transport.
The Red Square Bike Ride MacCoffee was again a partner of the Red Square charity bike ride organized by the Downside Up Foundation with the support of the Moscow and federal authorities. The aim of the Red Square charity bike ride is raising money for the treatment of Down Syndrome children.
PROPERTY DEVELOPMENT AT 81 PLAYFAIR ROAD, SINGAPOREIn 2011, the Group announced the purchase of a piece of land at 81 Playfair Road, adjacent to our Corporate Headquarters. The Group intends to construct a 11-storey industrial building on the site that would seamlessly link the 2 developments. The Group has received approval for its building plans. Construction has commenced in February 2013 and is expected to be completed by end 2014.
UKRAINE FACTORY OPENINGIn November, we offi cially opened our newest manufacturing facility in Zolotonosha, in the Cherkasy region of Ukraine.
Located in Zolotonosha, in the Cherkasy region and occupying 5.4 hectares, the new facility manufactures products for the Ukrainian market, as well as exports to neighbouring countries in Eastern Europe.
Food Empire invested an initial amount of 93 million Hryvnia (US$11.4 million) in the facility. The investment has been warmly welcomed by local authorities due to the jobs and economic activity the factory creates.
14

ON THE GO!
Take a step forward with us. By constantly improving productivity and quality in every aspect of our business, our solid operations and track record,
will remain reflective of the long-term value we aim to deliver to shareholders.
Food Empire Holdings Limited Annual Report 2012
15

MARKETING ACTIVITIES
CREATING BUZZ
Helping others is the modus operandi here at Food Empire. We were proud to be the main sponsor for the maiden mission founded by two medical students, Alexander and Shonda Ng. Together with fellow medical student Kee Aera, and a group of licensed doctors, their goal to bring medical relief to the poor in the Philippines was met.
Their fi rst stop was to the North Cemetery in Metro Manila, the largest cemetery in the city, with a living population of over 10,000 occupants. With no proper sanitation and a lack of running water, a health screening centre in the nearby church, Philadelphia Christcentred Fellowship, was set up. They were able to provide health education and run a medical clinic, on top of distributing gift packs to the families. Basic knowledge on how to create a sustainable income to provide for their growing families was also taught.
Leaving the city, the team headed for the mountainous region of Central Luzon, to spread good cheer and medical attention to the Aetas tribe. Tucked away in a secluded region amidst lush forestry, the Aetas people have little access to healthcare and sanitation, and are heavily discriminated due to their darker skin tones. The team were able to conduct both medical and dental screenings as well as provide
the community with multivitamins and vaccination for children, elderly, ill-stricken and anyone else with ailments. As a parting gift, a distribution of proper meals and gift packs were given prior to their departure from the village.
Cut off from civilization, it took an overnight journey by both van and ferry to reach the island of Mindoro, home to 8 different Mangyan tribes. With minimal accessibility, basic aid and amenities often bypass the people of this region. Surviving on subsistence agriculture, the Mangyan people lived in poor health and hygiene conditions.
Food Empire’s support brought relief to these people in the form of food, vaccines, health screenings and gift packs. Helping to improve the lives of communities in rural Philippines, Food Empire hopes to continue to be a part of this on going mission of medical provision.
16
MEDICAL MISSION TO MANILA

Held at the Sofi tel Hotel in Ho Chi Minh City, Food Empire Vietnam was proud to introduce the new face of MacCoffee – Mr Binh Minh. An actor, model and emcee, he was there to present the fresh new packaging design for the instant coffee brand, the MacCoffee Strong and the MacCoffee Classic, both equally loved by a range of coffee drinkers.
Combining the knowledge of robust Vietnamese coffee and the expertise of instant coffee formulas from Food Empire, the perfect brew was created for the Vietnamese market – a cup of bold strong coffee with rich aromas, suited to the local palate.
INTRODUCING THE NEW FACES OF MACCOFFEE IN VIETNAM – MR BINH MINH AS BRAND AMBASSADOR & UPDATED PACKAGING DESIGN
GREAT ETHIOPIAN RUNTeaming up with the Commercial Bank of Ethiopia, MacCoffee participated in the 2012 CRBC Ring Road Relay, promoting road safety in the city of Addis Ababa. Organized by the Great Ethiopian Run organization, Olympic Gold medallist, Mr Haile Gebrselassie graced the occasion, all whilst enjoying refreshing beverages from MacCoffee.
Food Empire Holdings Limited Annual Report 2012
17

MARKETING ACTIVITIES
RED SQUARE BIKE RIDEOrganized by the Downside Up Foundation, MacCoffee is once again a partner for the Red Square charity bike ride, raising 8 million Rubles for the treatment of Down Syndrome children in Russia.
KLASSNO GOES DOWN UNDER!Held annually, the Royal Melbourne Show brings the best in food and agriculture together in one place. Klassno gladly partook in this year’s show, sharing the rich taste and aroma of our coffee with thousands of festival attendees.
CHARITY WALK 2012 Food Empire was proud to be a part of the ComChest Heartstrings Walk, raising S$1.3million that goes to helping over 300,000 people in Singapore.
SPONSORS WORLD INDOOR SKYDIVING CHAMPIONSHIPS AT IFLY SINGAPOREMacCoffee sponsored the iFly Singapore Indoor World Skydiving Championships, the fi rst indoor skydiving championship in Asia Pacifi c. The competition was held at iFly Singapore, the world’s largest indoor skydiving simulator. To top off the inaugural event, a number of Guinness World Records were set and broken by international teams during the event.
DON’T SLUMBER AWAY THE SUMMER Reaching out to city dwellers and holiday makers alike, MacCoffee’s new summer federal advertising campaign took on a new concept – ‘Don’t Slumber Away the Summer’. The new MacCoffee ad could be seen on billboards, public transportation and other outdoor media channels in over 18 Russian cities.
FESTIVAL OF THE FUNNY AND INVENTIVE (KVN) IN SUZDALMacCoffee and Kracks were proud to be the sponsors for the 4th time at the KVN event in the Vladimir Region in Russia. Answering a range of questions about our products, contestants received goodies and promotional gifts from Food Empire for their participation.
OPENING NIGHT OF GOLD RUSH Increasing the visibility of the Ukrainian culture and lifestyle in Singapore, Food Empire was proud to be the opening night sponsor of ‘Gold Rush: Treasures of Ukraine’ – an exhibition comprising a collection of 260 pieces of jewellery, weapons, coins and artefacts, primarily fashioned from gold – held at the National Museum of Singapore. The event was graced by the Ambassador of Ukraine, Mr Pavlo Sultansky, and Food Empire Directors, Mr Tan Wang Cheow and Mr Sudeep Nair.
18

XL-ACHIEVEMENTS WITH MACCOFFEE XLUniversity students in Kazakhstan were in for a treat this autumn! Sending in photos of their school achievements before and after enjoying their favourite MacCoffee beverage, the most creative pictures chosen were vying to win the latest iPhone and iPad models!
UEFA EURO 2012Unveiled in summer 2012, MacCoffee was proud to be in support of the UEFA EURO 2012. Rolling out a large-scale federal advertising campaign, MacCoffee’s ‘Hot Support’ for the football tournament acted as an excellent opportunity to strengthen our position as an active brand.
2012 FAMILY DAY AT USSHeld at Universal Studios Singapore, this year’s Family Day outing was a big day of fun and enjoyment for all.
SIAL PARIS 2012Showcasing a range of over 200 products, including fl agship brand MacCoffee, at the 2012 SIAL Paris exhibition - a food biennial that sets the trend within the food industry, Food Empire Holdings displays proof that they are a strong contender in the global market of food manufacturing. The 25th edition of this exhibition, held at Paris Nord Villepinte in France, is a unique global food event featuring the world’s leading retail and food service buyers housed in one location.
WOODGROVE SECONDARY SCHOOL 13TH SPEECH DAYAs part of a 5 year sponsorship towards Woodgrove Secondary School’s Performing Arts Awards since 2009, Food Empire was back again this year with our Chief Financial Offi cer (CFO), Mr William Fong, giving out the book prizes.
NEW CEO APPOINTMENT PARTYTo celebrate his new appointment as CEO of Food Empire Holdings, a welcome party was held at the Singapore Headquarters, where colleagues congratulated Mr Sudeep Nair on his new post.
CAMFOOD 2012 GETS A TASTE OF MACCOFFEEBringing our fl agship brand, MacCoffee, to the most prestigious B2B food expo in Phnom Penh, Cambodia, Food Empire was proud to be featured on SEATV Cambodia, highlighting MacCoffee 3-in-1, cereals and snacks at our booth.
KLASSNO IN IRANGiving a taste of premium coffee blends to the people of Tehran, Iran, with Klassno’s mobile sampling booth.
Food Empire Holdings Limited Annual Report 2012
19

GLOBAL PRESENCE
COAST TO COAST
Poland
Ukraine
Nigeria
Iran
UAE
Ethiopia
Iraq
Malaysia
Singapore
Indonesia
Kazakhstan
Bangladesh
Vietnam
Myanmar
Mongolia
China
Uzbekistan
Belgium
Russia
20

Food Empire Holdings Limited Annual Report 2012
With a site area of 998 square metres, Food Empire has purchased a freehold property located adjacent to its Singapore headquarters in December 2011. Development of an 11-storey building to extend the current building while leveraging on the common facilities and area has commenced in February 2013. The surrounding real estate market holds optimistic promise of long-term property performance.
A NEW PRIDE
21

NEW PRODUCTS
NEW WINNERS
MAKE WAY FOR THESE
A rich blend of beans sourced from choice plantations in India, Vietnam and Kenya, MacCoffee Gold allows everyone to creatively enjoy the deep taste of fresh coffee in two new ways: fi ne ground and whole beans.
Now packaged in 250g bags, the MacCoffee Gold Roast & Ground defi nes the fl avour of fresh brews with their gratifying medium-roast fl avour. For those who love the mechanisms of grinding their own coffee, MacCoffee Gold in beans allows true connoisseurs of coffee to partake in their own step-by-step process of creating their own daily brew.
Rich and deliciously creamy, MacCoffee Crème makes the perfect pairing with any gourmet coffee, tea or chocolate drink. Delicate and smooth, this non-dairy creamer has undergone a facelift, designed in a lighter, more refreshing tone, and packaged in a new brick pack style.
The new packaging, set in a light orange hue, will help optimize shelf visibility due to its easily stackable brick pack shape, and with the addition of having both front and back displays emblazoned with the brand design.
Grown in controlled mountainous regions, Arabica beans lead a longer and more vulnerable life cycle, making them a rich commodity in the world of coffee beans.
A distinctive blend of select Arabica beans, this aromatic roast retains the full fl avour of the coffee, leaving a pleasant, less acidic taste on the palate.
MacCoffee Arabica, the most premium blend of freeze dried coffee in the MacCoffee group, now comes in new economy packaging of 75g and 150g respectively.
Put on your sombreros and get crunching! Fashioned in the true taste and tradition of Mexico, DonNachos packs that extra crunch to the mix of high quality corn, broiled over a fi re, to give that authentic warmth of a well-prepared appetizer.
Well loved by all, this snack can be prepared with a host of ingredients, from merely dipping it in salsa or guacamole, slathering the chips with melted cheese, or re-baking it with a topping of meats and beans, DonNachos can accompany any meal or activity and be equally enjoyed.
22
MacCoffee Gold in
beans and MacCoffee
Gold Roast & Ground
MacCoffee Arabica
DonNachos
MacCoffee Crème

Food Empire Holdings Limited Annual Report 2012
23

BOARD OF DIRECTORS
THE BUSINESS COLLECTIVE
MR SUDEEP NAIR Chief Executive Offi cer Mr Nair was appointed as CEO in October 2012 and has been a member of the Board as an Executive Director since July 2005. Mr Nair is responsible for the overall oversight of the Group’s day-to-day operations. His responsibilities also include identifying and developing new business opportunities both in and outside of the Group’s core markets.
Mr Nair has nearly 20 years of experience in managing the Group’s business in Russia and the CIS countries.
MDM TAN GUEK MINGNon-Executive Director
Mdm Tan was appointed to the Board as a Non-Executive Director in April 2000. Mdm Tan brings both fi nancial and business expertise to the Board having held both executive and non-executive directorships in listed companies with interests in property, hospitality and the food and beverage sectors. She holds a Bachelor of Accountancy Degree (Second Class Honours) from the National University of Singapore and has numerous years of leadership experience in the fi elds of accounting and auditing.
MR TAN WANG CHEOWExecutive Chairman
Mr Tan has been providing leadership to the Board of Directors since April 2000. Mr Tan is founder of the Group and has been instrumental in guiding the Group’s business, including taking the company public in 2000. As Executive Chairman, Mr Tan is responsible for the achievement of the Group’s long-term goals. His role includes developing new markets, exploring opportunities for acquisitions as well as enhancing in-house production capabilities.
A passionate believer in the power of brands, Mr Tan is actively involved in the marketing and branding activities across the Group. He holds a Bachelor of Accountancy from the National University of Singapore.
24

Food Empire Holdings Limited Annual Report 2012
MR HARTONO GUNAWANNon-Executive Director
Mr Gunawan was appointed to the Board as a Non-Executive Director in September 2006. Mr Gunawan brings substantial international business experience and expertise to the Board. Since 1990, he has served as an Executive Director of the Salim Group and sits on the Boards of several companies with the Salim Group with responsibility for setting the overall direction and goals of those companies. Mr Gunawan has spearheaded numerous investment projects in Indonesia, Asia Pacifi c and Australia and holds principal directorship in the corporate and other business entities overseeing such investments. He graduated from the University of Indonesia in 1979 with an accounting degree (Sariana Ekonomi-Universitas, Indonesia).
MR KOH YEW HIAPNon-Executive Director
Mr Koh joined the Board as a Non-Executive Director in March 2007. Mr Koh has a distinguished career in business and is the Managing Director of Universal Integrated Corporation Consumer Products Pte Ltd and United Detergent Industries Sdn Bhd. He also sits on the Board of Directors of various companies with the Salim Group. He holds a Bachelor of Arts (Economics) Honours from the University of Manchester.
MR LEW SYN PAUIndependent Director
Mr Lew has served as an Independent Director on the Board since April 2000 and is a member of the Audit Committee. He is currently a Director of Capital Connections Pte Ltd, a fi nancial advisory consultancy fi rm. He is also a Director of several other Singapore listed companies involved in a range of industries including palm oil, logistics, property and precision machining. His previous positions include Managing Director of NTUC Comfort and General Manager and Senior Country Offi cer of Credit Agricole Indosuez. Between 2002 and 2006, Mr Lew was the President of the Singapore Manufacturers Federation.
He was a Member of the Singapore Parliament from 1988 to 2001, and served as the Chairman of the Government Parliamentary Committees for Education, Finance, Trade & Industry and National Development at different times during the course of his tenure. A Singapore Government scholar, Mr Lew holds a Masters Degree in Engineering from the University of Cambridge, UK and a Masters Degree in Business Administration from Stanford University, USA.
25
BOARD OF DIRECTORS
600,000 NUMBER OF BEANS REQUIRED TO FILL ONE SACK OF COFFEE
16 BILLION POUNDS ESTIMATED ANNUAL COFFEE PRODUCTION WORLDWIDE
5 YEARS TIME FOR A COFFEE TREE TO MATURE
13% OF WORLDWIDE COFFEE CONSUMPTION IS INSTANT COFFEE
150 MILLIGRAMS OF COFFEE IN ONE CUP
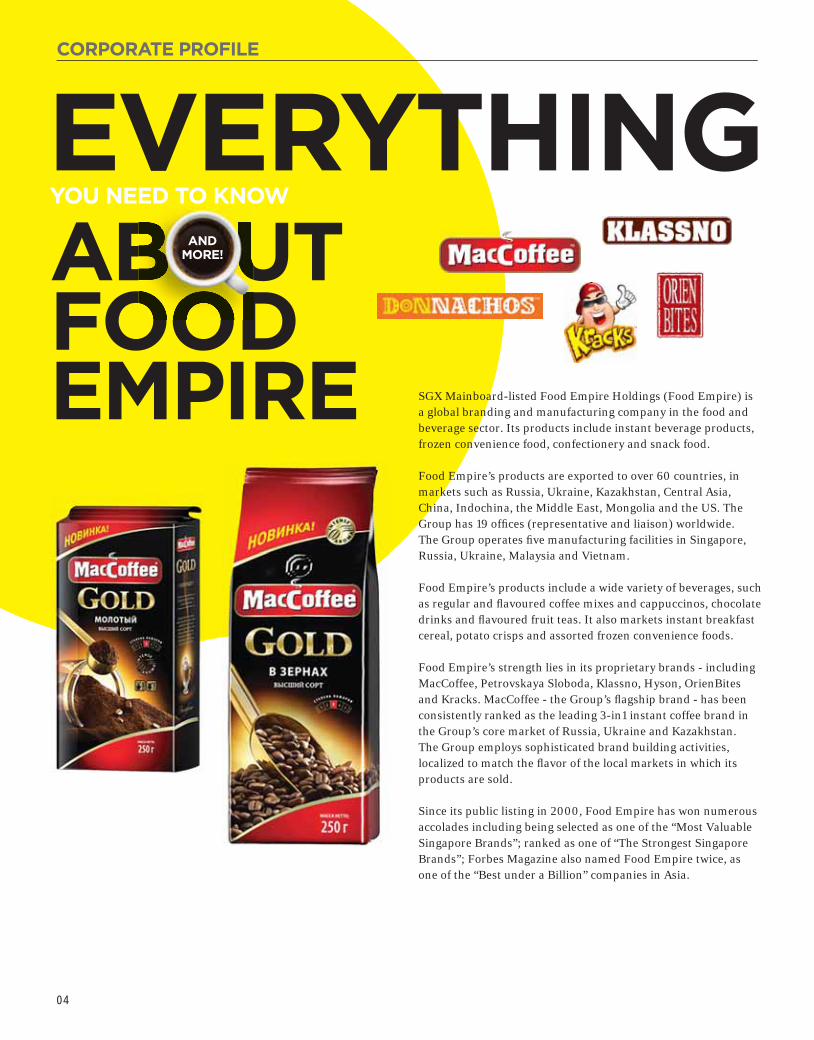
MR ONG KIAN MINIndependent Director
Mr Ong has served on the Board as an Independent Director since April 2000. He is the Chairman of the Audit Committee and a member of the Remuneration and Nominating Committees. As a lawyer and corporate adviser, Mr Ong brings invaluable legal and business experience to the Board. He was called to the Bar of England and Wales in 1988 and to the Singapore Bar the following year. In his more than 20 years of legal practice, he focused on corporate and commercial law such as mergers and acquisitions, joint ventures, restructuring and corporate fi nance. In addition to practicing as a consultant with Drew & Napier LLC, a leading Singapore law fi rm, he is a senior advisor of Alpha Advisory Pte Ltd (a fi nancial and corporate advisory fi rm) and CEO of Kanesaka Sushi Private Limited which invests in and operates Japanese fi ne-dining restaurants
In 1979, Mr Ong was awarded the President’s Scholarship and Police Force Scholarship. He holds a Bachelor of Laws (Hons) external degree from the University of London and a Bachelor of Science (Hons) degree from the Imperial College of Science and Technology in England. Mr Ong was a Member of Parliament of Singapore from January 1997 to April 2011.
MR BOON YOON CHIANGIndependent Director
Mr Boon was appointed to the Board as an Independent Director in December 2005. He is the Country Chairman of the Jardine Matheson Group of Companies in Singapore, and Deputy Chairman of Jardine Cycle & Carriage Limited. He also serves on the Boards of other public companies including MNCs. He is a board member of the Singapore International Chamber of Commerce. He represents the Singapore Business Federation on the Council of ASEAN Chambers of Commerce and Industry (ASEAN-CCI). Mr Boon is a member of the Competition Appeal Board.
DID YOU
KNOW?
26

Food Empire Holdings Limited Annual Report 2012
27

STAFF CONTRIBUTION
EXPLORERS’ TALES
FREDDY OH (Myanmar)
Having lived in various developing countries has really opened my eyes, ears and most importantly, my mind. I cherish the chances of working with teams that have profound geographical, political and cultural diversity. Along the way I have built on the intricacies of communication and delicate weaving of interpersonal skills that have honed my constantly improving management competencies.
Now that I am in Myanmar, in what the corporate world has termed as “Asia’s Last Frontier”, in which I believe will be a real adventure. With the belief of ‘What’s a world without competition?’ MacCoffee has bravely set foot here, where over 20 instant coffee brands are contending for a leading share of the market.
Our fi rst brand building effort kicked off in style in January 2013 – signing up Miss Myanmar who took part in the 2012 Miss International pageant contest held in Osaka, Japan and instantly won 2 accolades for “People’s Choice” and “Miss Internet”. Notably, this is the fi rst time a Myanmar national has represented her country in a world pageant in the past twenty years. In hot pursuit, MacCoffee has sponsored Myanmar’s fi rst International Marathon. In short, MacCoffee strives to build up its international stature clearly and has adopted the motto “OPEN MY WORLD” as its brand positioning statement in Myanmar.
Coincidentally, “OPEN MY WORLD” appropriately sums up my journey of discovery.
Thank You, Food Empire.
AARON CHOO (Iran)
Having the opportunity to represent Food Empire in the Middle East, my posting to the capital of Tehran has been a colourful and exciting discovery of a new culture and lifestyle. What we know of Iran is based on the ‘closed’ news that reports on their multiple economic and political sanctions over these years, however, upon moving here, I’ve discovered a totally opposite outlook on the daily life of Iranians. Although the wages and quality of life are not on par with that of Singapore, due to their limited access to the outside world, the people here live in peace due to their friendly disposition and outlook on life.
Being a representative of Food Empire here, we are hoping to gain business resilience after the second half of 2012, which can only be achieved after the upcoming Presidential elections, estimating the revision of government legislations and control of the country’s economy.
I have discovered that there’s more than meets the eye when you live abroad, especially in ‘unchartered’ territory such as Tehran, Iran, where our perceptions have been fully infl uenced by what we know of them via various news outlets, instead of experiencing fi rst hand ourselves.
SERGEY ANISIMKIN (Russia)
I came to Food Empire knowing that we could collectively take MacCoffee and grow it into a leading brand within a highly competitive market. And I wasn’t wrong.
Upon taking over leadership of the factory, I set my fi rst priorities into motion: to put together a reliable team of managers in order to motivate factory staff and lead them towards a common goal.
Having introduced a new, more effi cient management system, retaining our old practices, the process of training a new employee was reduced, yet it ensured more well-rounded and knowledgeable workers. With the acquisition of the new Food Empire factory in Ukraine, I am proud to say that they had modelled their factory management practices after ours.
I can proudly say that destiny brought the MacCoffee group and I together, alongside Sudeep and Amrish, and a dream team of colleagues both on and off the factory fl oor, opening up more opportunities, and always being ready to give my time, energy and to share my experiences for the continuous improvement of the factory and its products.
28
Food Empire Holdings Limited Annual Report 2012
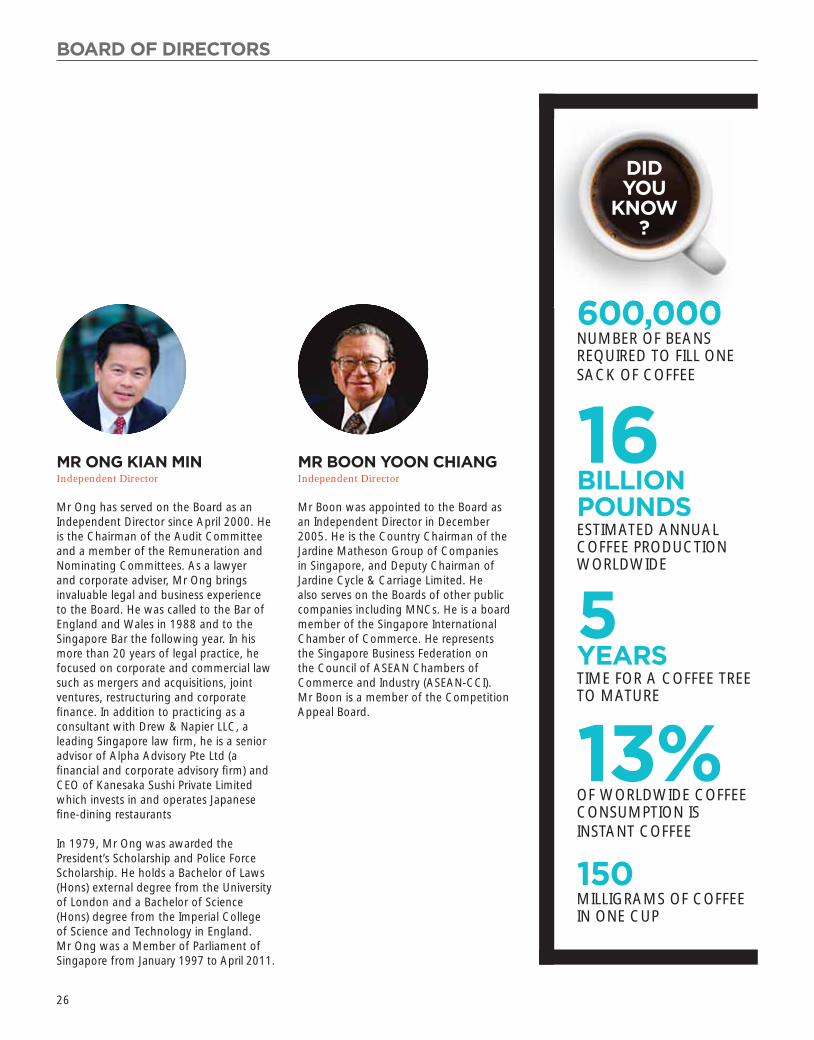
VICENTE LEE (Southern China)
Being posted to the Chinese mainland, I have discovered a new way of living, together with new friends made and new colleagues whom I get to work alongside with. What I’ve discovered from living here in China is that, due to its sheer mass, it is a place that has plenty of untapped potential.
The past two decades has shown dazzling economic growth within China, a leader in the manufacturing of ubiquitous amounts of consumer goods. Although the coffee culture has not yet caught on, we are undeterred, believing that with Klassno we can increase the popularity of the rich aroma and fl avour of coffee for the people of China.
With strong ambition and an eagerness to excel in the coffee business, I am ready to reach out, learn new things, and develop new strategies that will give Food Empire a strong foothold in this emerging market.
Let’s move to the land of opportunity – here’s to the development of the Klassno in China and beyond.
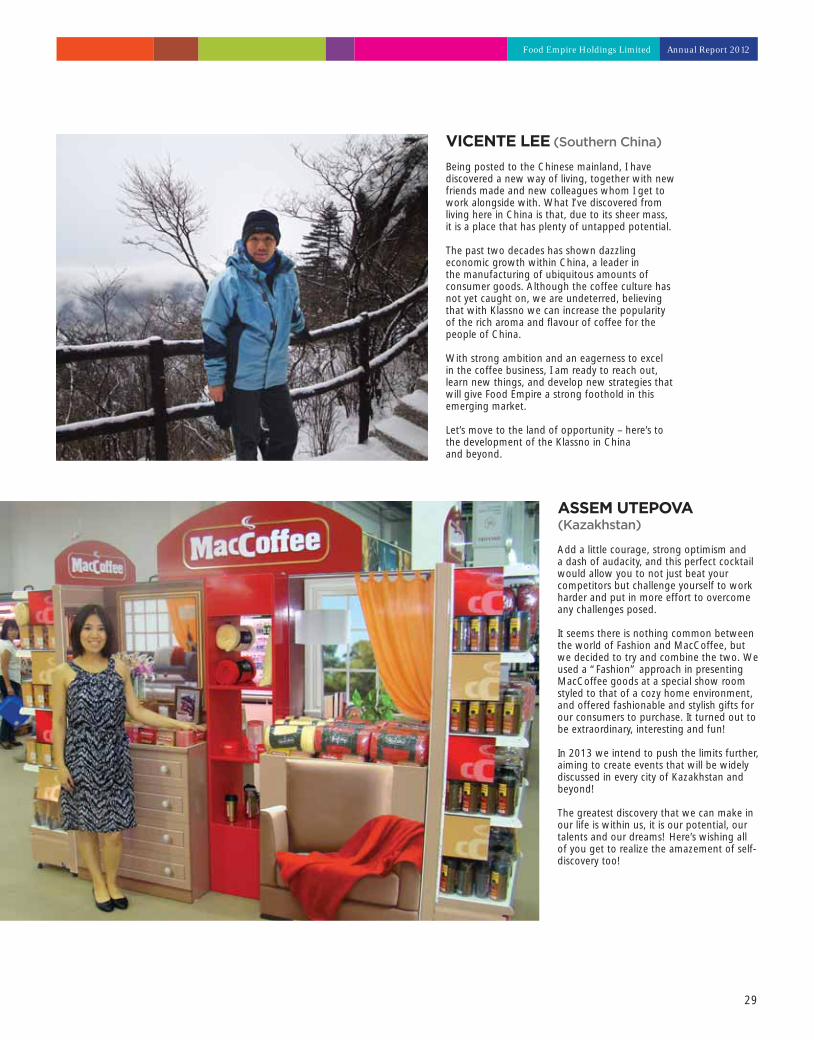
ASSEM UTEPOVA (Kazakhstan)
Add a little courage, strong optimism and a dash of audacity, and this perfect cocktail would allow you to not just beat your competitors but challenge yourself to work harder and put in more effort to overcome any challenges posed.
It seems there is nothing common between the world of Fashion and MacCoffee, but we decided to try and combine the two. We used a “Fashion” approach in presenting MacCoffee goods at a special show room styled to that of a cozy home environment, and offered fashionable and stylish gifts for our consumers to purchase. It turned out to be extraordinary, interesting and fun!
In 2013 we intend to push the limits further, aiming to create events that will be widely discussed in every city of Kazakhstan and beyond!
The greatest discovery that we can make in our life is within us, it is our potential, our talents and our dreams! Here’s wishing all of you get to realize the amazement of self-discovery too!
29

30

BOARD OF DIRECTORSEXECUTIVETan Wang Cheow (Executive Chairman)Sudeep Nair (CEO)
NON-EXECUTIVETan Guek Ming (Non-Independent)Hartono Gunawan (Non-Independent)Koh Yew Hiap (Non-Independent)Lew Syn Pau (Independent)Ong Kian Min (Independent)Boon Yoon Chiang (Independent)
AUDIT COMMITTEEOng Kian Min (Chairman)Lew Syn PauBoon Yoon ChiangTan Guek Ming
NOMINATING COMMITTEELew Syn Pau (Chairman)Ong Kian MinBoon Yoon ChiangTan Wang Cheow
REMUNERATION COMMITTEELew Syn Pau (Chairman)Koh Yew HiapOng Kian MinBoon Yoon ChiangTan Guek Ming
SECRETARIESTan Cher LiangTan San-Ju
REGISTERED OFFICE50 Raffl es Place #32-01Singapore Land TowerSingapore 048623Telephone number: 65-65365355Fax number: 65-65361360
BUSINESS OFFICE31 Harrison Road, #08-01Food Empire Business SuitesSingapore 369649Telephone number: 65-66226900Fax number: 65-67442116
SHARE REGISTRARBoardroom Corporate & Advisory Services Pte. Ltd.50 Raffl es Place #32-01Singapore Land TowerSingapore 048623Telephone number: 65-65365355Fax number: 65-65351360
AUDITORSErnst & Young LLPOne Raffl es QuayNorth Tower Level 18Singapore 048583
AUDIT PARTNER-IN-CHARGEAng Chuen Beng (w.e.f. the fi nancialyear ended 31 December 2010)
PRINCIPAL BANKERSOverseas-Chinese Banking Corporation Limited
United Overseas Bank Limited
Standard Chartered Bank
Citibank Singapore Limited
THE
ESSENTIALSCORPORATE INFORMATION
Food Empire Holdings Limited Annual Report 2012
31

32
CORPORATE GOVERNANCE
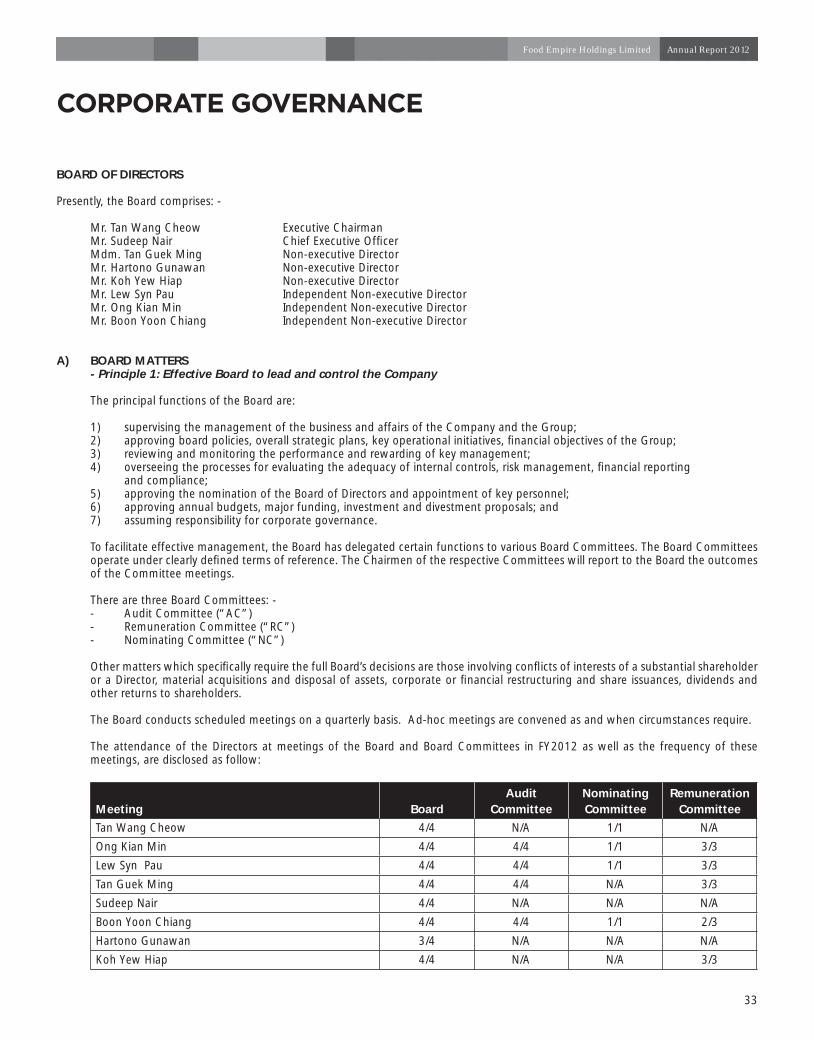
BOARD OF DIRECTORS
Presently, the Board comprises: -
Mr. Tan Wang Cheow Executive ChairmanMr. Sudeep Nair Chief Executive Offi cer Mdm. Tan Guek Ming Non-executive DirectorMr. Hartono Gunawan Non-executive Director Mr. Koh Yew Hiap Non-executive Director Mr. Lew Syn Pau Independent Non-executive DirectorMr. Ong Kian Min Independent Non-executive DirectorMr. Boon Yoon Chiang Independent Non-executive Director
A) BOARD MATTERS- Principle 1: Effective Board to lead and control the Company
The principal functions of the Board are:
1) supervising the management of the business and affairs of the Company and the Group;2) approving board policies, overall strategic plans, key operational initiatives, fi nancial objectives of the Group; 3) reviewing and monitoring the performance and rewarding of key management;4) overseeing the processes for evaluating the adequacy of internal controls, risk management, fi nancial reporting and compliance;5) approving the nomination of the Board of Directors and appointment of key personnel;6) approving annual budgets, major funding, investment and divestment proposals; and7) assuming responsibility for corporate governance.
To facilitate effective management, the Board has delegated certain functions to various Board Committees. The Board Committees operate under clearly defi ned terms of reference. The Chairmen of the respective Committees will report to the Board the outcomes of the Committee meetings.
There are three Board Committees: -- Audit Committee (“AC”)- Remuneration Committee (“RC”)- Nominating Committee (“NC”)
Other matters which specifi cally require the full Board’s decisions are those involving confl icts of interests of a substantial shareholder or a Director, material acquisitions and disposal of assets, corporate or fi nancial restructuring and share issuances, dividends and other returns to shareholders.
The Board conducts scheduled meetings on a quarterly basis. Ad-hoc meetings are convened as and when circumstances require.
The attendance of the Directors at meetings of the Board and Board Committees in FY2012 as well as the frequency of these meetings, are disclosed as follow:
Meeting BoardAudit
CommitteeNominating Committee
Remuneration Committee
Tan Wang Cheow 4/4 N/A 1/1 N/A
Ong Kian Min 4/4 4/4 1/1 3/3
Lew Syn Pau 4/4 4/4 1/1 3/3
Tan Guek Ming 4/4 4/4 N/A 3/3
Sudeep Nair 4/4 N/A N/A N/A
Boon Yoon Chiang 4/4 4/4 1/1 2/3
Hartono Gunawan 3/4 N/A N/A N/A
Koh Yew Hiap 4/4 N/A N/A 3/3
33
Food Empire Holdings Limited Annual Report 2012

CORPORATE GOVERNANCE (cont’d)
A) BOARD MATTERS (cont’d)
The Directors are appointed based on the strength of their experience and potential to contribute to the Company. The current Board is comprised of business leaders and professionals. Profi les of the Directors can be found in pages 24 to 26 of this annual report. The management monitors changes to regulations and accounting standards and the Directors are briefed on the new updates in the requirements of the Singapore Exchange Securities Trading Limited (“SGX-ST”), Companies Act or other regulations/statutory requirements from time to time by the management. If required, the Directors will receive further training.
The Company has adopted a policy that Directors are welcome to request further explanations, briefi ngs or informal discussions on any aspects of the Group’s operations or business issues from management. The Non-executive Directors are briefed and updated on major developments and the progress of the Group at the Board meetings.
B) BOARD COMPOSITION AND BALANCE- Principle 2: Strong and independent element of the Board
The Directors of the Board review the size and composition of the Board on an annual basis. Presently, the Board of Directors comprises eight Directors, three of whom are independent. The Board continues to have a strong and independent element.
The core competencies of the Board members are as follows:
Accounting/ Finance/ Business/ Management Experience
Industry Knowledge
Strategic Planning
Human Resource Law
Tan Wang Cheow √ √ √
Sudeep Nair √ √ √
Tan Guek Ming √ √ √
Lew Syn Pau √ √ √
Ong Kian Min √ √ √
Boon Yoon Chiang √ √ √ √ √
Hartono Gunawan √ √ √
Koh Yew Hiap √ √ √
The Directors are professionals in their own fi elds with industrial, fi nancial, legal and human resource backgrounds. Together they provide the Group with a wealth of knowledge, expertise and experience to ensure the Group remains competitive and competent. The Non-executive Directors contribute their independent views and objective judgments on issues of strategy, business performance, resources and standards of conduct.
The Nominating Committee (“NC”) has assumed the function of reviewing the independence of each Director annually. The NC is of the view that the current Board has the necessary competencies, skills and attributes to meet the Group’s targets and to respond to the demands facing the Group.
The NC is also of the view that the current Board size of eight directors is appropriate, taking into account the nature and scope of the Company’s operations.
C) CHAIRMAN AND CHIEF EXECUTIVE OFFICER- Principle 3: Clear division of responsibilities at the top of the Company
On 2 October 2012, Mr. Tan Wang Cheow, the Executive Chairman, ceased to be the Managing Director and Mr. Sudeep Nair, an Executive Director, was promoted to Chief Executive Offi cer (“CEO”). The Executive Chairman is primarily responsible for formulating of the Group’s strategies, which includes developing new markets, exploring opportunities for acquisitions as well as enhancing in-house production capabilities; while the CEO is responsible for overseeing the overall management, planning and execution of the Group’s business and marketing strategies.
The change is to promote clear division of responsibilities, as well as to ensure an appropriate balance of power, increased accountability and greater capacity for the Board for independent decision making as recommended by the Code of Corporate Governance (“Code”).
34

CORPORATE GOVERNANCE (cont’d)
C) CHAIRMAN AND CHIEF EXECUTIVE OFFICER (cont’d)- Principle 3: Clear division of responsibilities at the top of the Company (cont’d)
In addition, the Executive Chairman has responsibility for the workings of the Board and ensuring the integrity and effectiveness of its governance processes. The Executive Chairman is also responsible for representing the Board to shareholders, ensuring that Board meetings are held when necessary, and setting the Board meeting agendas. Regular meetings are scheduled to enable the Board to perform its duties. Agendas are prepared in consultation with management as well as the Company Secretaries.
The Executive Chairman also ensures that the Board members are provided with adequate and timely information.
D) BOARD MEMBERSHIP- Principle 4: Formal and transparent process of appointment of new Directors
The Nominating Committee (“NC”) was established on 22 August 2001 with written terms of reference on its responsibilities. At the date of this report, the NC comprises:
Mr. Lew Syn Pau (Chairman)Mr. Ong Kian Min Mr. Tan Wang Cheow Mr. Boon Yoon Chiang
The scope and responsibilities of the NC include:
1) identifying candidates and reviewing all nominations for all appointments and reappointments to the Board of Directors, including making recommendations on the composition of the Board and balance between Executive and Non-executive Directors;
2) reviewing the Board structure, size and composition;3) reviewing the strength and attributes of the existing Directors including assessing the effectiveness of the Board as a whole
and the contribution by individual Directors;4) reviewing the independence of Directors annually;5) considering and making recommendations on nominations of Directors retiring by rotation;6) making recommendations to the Board for the continuation (or retirement) of any Director who has reached the age of
seventy; and7) deciding whether or not a Director is able to and has adequately carried out his duties as a Director of the Company,
particularly when they have multiple Board representations.
Last re-election date
Directors Date of last re-election
Ong Kian Min 28 April 2011
Hartono Gunawan 28 April 2011
Koh Yew Hiap 27 April 2012
Tan Guek Ming 27 April 2012
Lew Syn Pau 28 April 2010
Sudeep Nair 28 April 2011
Boon Yoon Chiang 27 April 2012
Tan Wang Cheow 27 April 2012
The NC is responsible for identifying and recommending new Board members, after considering the necessary and desirable competencies. The NC may engage consultants to undertake research on, or to assess a candidate for new positions on the Board. The NC can engage other independent experts if it considers it necessary to help it carry out its duties and responsibilities. Recommendations for new Board members are put to the Board for its consideration.
35
Food Empire Holdings Limited Annual Report 2012

CORPORATE GOVERNANCE (cont’d)
E) BOARD PERFORMANCE- Principle 5: Formal assessment of the effectiveness of the Board and contributions of each Director
The NC has formulated an evaluation process for assessing the effectiveness of the Board and the contributions of each Director. The assessment parameters include:
a) attendance at Board and Committee meetings; b) participation in meetings and special contributions including management’s access to the Director for guidance or exchange
of views outside the formal environment of Board meetings; andc) introducing contacts of strategic benefi t to the Group.
The Board’s evaluation process is performed annually.
The Board is of the view that the fi nancial parameters recommended by the Code as performance criteria for the evaluation of Directors do not fully measure the contributions Directors make to the long-term success of the Company.
F) ACCESS TO INFORMATION- Principle 6: Board members to have complete, adequate and timely information
In order to ensure that the Board is able to fulfi ll its responsibilities, management provides the Board members with periodic updates of the latest developments in the Group, accounts, reports and other fi nancial information. The Directors have been provided with the contact particulars of the Company’s senior management staff and Company Secretaries to facilitate access. The Directors are informed and are aware that they may take independent professional advice at the Company’s expense, where necessary, in furtherance of their duties.
At least one of the Company Secretaries or their representatives will attend all Board meetings. They are responsible for ensuring that Board procedures are followed and that the Company has complied with the requirements of the Singapore Companies Act and the SGX-ST Listing Manual.
G) REMUNERATION MATTERS- Principle 7: Formal and transparent procedure for fi xing remuneration packages of Directors- Principle 8: Remuneration of Directors should be adequate but not excessive- Principle 9: Remuneration policy, level and mix of remuneration and procedure for setting remuneration
The Remuneration Committee (“RC”) was established on 22 August 2001 with written terms of reference on its responsibilities. At the date of this report, the RC comprises:
Mr. Lew Syn Pau (Chairman) Mr. Ong Kian Min Mr. Boon Yoon Chiang Mdm. Tan Guek MingMr. Koh Yew Hiap
The RC’s main responsibility is to review and recommend a framework of remuneration for the Board members and key executives of the Group. The objective is to motivate and retain executives and ensures the Group is able to attract the best talent in order to maximise shareholder value.
The remuneration of the Executive Directors is based on service agreements signed upon their appointments. The service agreements will continue unless otherwise terminated by either party giving not less than three month’s notice in writing. Under the service agreements, the Executive Directors are entitled to a share of profi ts on the Group’s profi t before tax, on top of the monthly salary and bonus. The Non-executive Directors receive directors’ fees, in accordance with their contributions, taking into account factors such as responsibilities, effort and time spent for serving on the Board and Board Committees. The directors’ fees are subject to fi nal approval by the shareholders at the Annual General Meeting.
36

CORPORATE GOVERNANCE (cont’d)
G) REMUNERATION MATTERS (cont’d)- Principle 7: Formal and transparent procedure for fi xing remuneration packages of Directors (cont’d)- Principle 8: Remuneration of Directors should be adequate but not excessive (cont’d)- Principle 9: Remuneration policy, level and mix of remuneration and procedure for setting remuneration (cont’d)
There is no change in the existing remuneration package for the Executive and Non-executive Directors compared to the previous year. All Directors, including Non-executive Directors, who are not the controlling shareholders of the Group or are not appointed by the controlling shareholders of the Group, were eligible for share options under the current Food Empire Holdings Limited Share Option Scheme (“2012 Option Scheme”). Additional information on the Food Empire Holdings Limited Share Option Scheme (the “2002 Option Scheme” and “2012 Option Scheme”) can be found on pages 44 to 47 and 119 to 123 of the annual report.
Although the Code recommends the disclosure of the name of the individual Directors and at least the top fi ve key executives (who are not the Directors of the Group) within the bands of S$250,000 and a breakdown (in percentage terms) of each Directors remuneration, the Board has decided not to adopt this practice because it is of the view that such disclosure may be detrimental to the Group’s interest as it may lead to poaching of executives within a highly competitive industry.
The remuneration for the fi nancial year ended 31 December 2012 is shown below:
Remuneration Bands No. of Directors in Remuneration BandsS$1,000,000 & above 2S$500,000 to S$749,999 -S$250,000 to S$499,999 -Below S$250,000 6 Remuneration Bands Remuneration of top 5 executivesS$750,000 to S$999,999 1S$250,000 to S$499,999 4
To maintain confi dentiality of staff remuneration, the names of the Directors and the top executives are not stated. There are no employees who are immediate family members of a Director.
H) ACCOUNTABILITY AND AUDIT- Principle 10: Accountability of the Board and management
The Board is accountable to the shareholders while the management of the Group is accountable to the Board. The management presents to the Board the Group’s quarterly and full year accounts and the Audit Committee reports on the results for review and approval. The Board approves the results and authorises the release of the results to SGX-ST and the public via SGXNET.
The Board is committed to providing timely information to the shareholders and the public on a quarterly basis.
I) AUDIT COMMITTEE- Principle 11: Establishment of Audit Committee (“AC”) with written terms of reference
The Audit Committee (“AC”) comprises:
Mr. Ong Kian Min (Chairman) Mr. Lew Syn Pau Mr. Boon Yoon Chiang Mdm. Tan Guek Ming
All four members of the AC are Non-executive Directors and the majority, including the Chairman, are independent. The Chairman of the AC, Mr. Ong Kian Min, is a lawyer and director of several public and private companies. The other three members of the AC have many years of management and fi nancial experience. The Directors are of the view that the members of the AC have suffi cient fi nancial management expertise and experience to discharge the AC’s duties and responsibilities.
During the year, the AC carried out its function in accordance with its written terms of reference.
37
Food Empire Holdings Limited Annual Report 2012
CORPORATE GOVERNANCE (cont’d)
I) AUDIT COMMITTEE (cont’d)- Principle 11: Establishment of Audit Committee (“AC”) with written terms of reference (cont’d)
The AC meets with management and/or the auditors of the Group on a regular basis to discuss and review:
a) the audit plans of the external auditors of the Group, the results of their examination and evaluation of the Group’s systems of internal accounting controls, their independence and the non-audit services provided by them;
b) risk or exposure that exists and the steps management has taken to minimise these risks to the Group;
c) the Group’s quarterly fi nancial results for submission to the Board;
d) the assistance given by the Group’s offi cers to the external auditors;
e) the Group’s interested person transactions in accordance with the requirements of the SGX-ST Listing Manual;
f) the fi nancial statements of the Company and the consolidated fi nancial statements of the Group before their submission to the Board of Directors and the external auditors’ report on those fi nancial statements;
g) the adequacy and effectiveness of the Group’s material internal controls, including fi nancial, operational and compliance controls and risk management via reviews carried out by the internal auditors;
h) the audit plans of the internal auditors; and
i) the results of their internal audit.
Apart from the duties listed above, the AC has the authority to commission and review the fi ndings of internal investigations into any matter where there is suspected fraud or irregularity, or failure of internal controls or infringement of any Singapore law, rule or regulation which has or is likely to have a material impact on the Group’s operating results or fi nancial position.
In performing its functions, the AC has:
a) full access to and cooperation from the management and has full discretion to invite any Director and executive offi cer to attend its meetings;
b) been given reasonable resources to enable it to discharge its duties and responsibilities properly; and
c) the expressed authority to conduct investigation into any matters within its terms of reference.
During the year, the AC held 4 meetings.
The AC has reviewed the internal procedures set up by the Company to identify and report, and where necessary, seek approval for interested person transactions, and with the assistance of the management, reviewed interested person transactions. The AC is of the opinion that the internal procedures have been complied with.
The AC has reviewed the non-audit services provided by the external auditors and is satisfi ed with the independence of the external auditors.
The AC meets with the external auditors without the presence of management at least once annually.
Different auditors have been appointed for some of the Singapore incorporated subsidiaries and overseas subsidiaries. The names of these audit fi rms are disclosed under Note 14 of the fi nancial statements. This matter has been reviewed by the AC and the Board and both are satisfi ed that these appointments did not compromise the standard and effectiveness of the audit of the Group.
38

CORPORATE GOVERNANCE (cont’d)
I) AUDIT COMMITTEE (cont’d)- Principle 11: Establishment of Audit Committee (“AC”) with written terms of reference (cont’d)
The Group has complied with Rules 712 and 716 of the SGX-ST Listing Manual.
The AC has recommended to the Board of Directors that the Auditors, Ernst & Young LLP, Certifi ed Public Accountants be nominated for re-appointment as Auditors at the forthcoming Annual General Meeting of the Company.
The AC has established the whistle-blowing policy where staff of the Group may, in confi dence, raise concerns about possible improprieties in matters of fi nancials that might have a signifi cant impact on the Group, such as actions that may lead to incorrect fi nancial reporting, unlawful and/or otherwise amount to serious improper conduct according to Company Policy.
J) INTERNAL CONTROLS AND INTERNAL AUDIT- Principle 12: Sound systems of internal audit- Principle 13: Setting up independent internal audit function
The Board is responsible for the Group’s systems of internal controls and risk management and for reviewing the adequacy and integrity of these systems. However, such systems are designed to manage rather than eliminate completely the risk of failure to business objectives. It should also be noted that any system could provide only reasonable and not absolute assurance against material misstatement (the occurrence of human errors), losses or fraud.
The Group outsources its internal audit function to Yang Lee & Associates to assess the adequacy of internal controls. They conduct reviews on the effectiveness of the Group’s internal control systems covering the fi nancial, operational and compliance risks.
The AC reviews and approves internal audit scope and plan. The internal auditors report directly to the AC. Internal control weaknesses identifi ed during the internal audit reviews and the recommended corrective actions are reported to the AC periodically.
The internal auditors completed a review during the last fi nancial year ended 31 December 2012. The fi ndings and recommendations of the internal auditors, management’s responses, and management’s implementation of the recommendations had been reviewed and discussed by the AC.
The Group’s external auditors also report to the AC on any material internal control weaknesses noted during the course of their audit.
The Group has also appointed Yang Lee & Associates to develop an Enterprise Risk Management Framework for the Group. The management reports to the AC on the Group’s risk profi le, the status of risk mitigation action plans and updates on the following areas:
1) assessment of the Group’s key risks by major business units and risk categories;2) identifi cation of specifi c risk owners who are responsible for the risks identifi ed;3) description of the processes and systems in place to identify and assess risks to the Group;4) status and changes in plan undertaken to manage key risks; and5) description of the risk monitoring and escalation processes and also systems in place.
The Group has taken note of the key risks factors identifi ed and other matters arising as aforesaid and the Group will request the internal auditors to take such risk factors into consideration in the next annual internal audit plan when executing the system and process review on the identifi ed key risk areas. The Board with the assistance of the AC, will continually assess on the adequacy and effectiveness of the Group’s risk management and internal control systems.
K) COMMUNICATION WITH SHAREHOLDERS- Principle 14: Regular, effective and fair communication with shareholders
Price sensitive information is fi rst publicly released via SGXNET before any meeting with any group of investors or analysts. Results are announced within the mandatory period on a quarterly basis to SGX-ST.
39
Food Empire Holdings Limited Annual Report 2012

CORPORATE GOVERNANCE (cont’d)
L) GREATER SHAREHOLDER PARTICIPATION- Principle 15: Shareholders’ participation at AGMs
All shareholders (except those who own the shares through Nominees) of the Company will receive the Annual Report of the Company and Notice of the Annual General Meeting (“AGM”) within the mandatory period. The Articles of Association of the Company allow a member of the Company to appoint one or two proxies to attend and vote for him.
At general meetings, the shareholders are given the opportunity to express their views and ask questions regarding the Group’s performance.
Resolutions to be passed at general meetings are always separate and distinct in terms of issue so that shareholders are able to exercise their right to approve or deny the issue or motion. Shareholders can also exercise their right to vote in absentia by the use of proxies.
The Chairpersons of the AC, NC and RC are present and available to address questions at the AGM. The external auditors are also present to assist the Directors in addressing any relevant queries by shareholders.
SUPPLEMENTARY INFORMATION FOR THE YEAR ENDED 31 DECEMBER 2012 (SGX-ST LISTING MANUAL REQUIREMENTS)
(i) Dealing in Securities
The Company has in place an internal policy prohibiting share dealings by Directors and offi cers of the Group while in possession of unpublished material or price sensitive information during the period commencing one month prior to the announcement of the Company’s annual result, and 2 weeks before the announcement of its quarterly results and ending on the date of the announcement of the relevant results. Directors and offi cers of the Group are expected to observe the insider trading laws at all times even when dealing in securities within the permitted trading period.
The Directors and offi cers of the Group are strongly discouraged to deal in the Company’s securities on short-term considerations.
During the fi nancial year ended 31 December 2012, the Company has complied with the best practices on dealing in securities in accordance with Rule 1207(19) of the SGX-ST Listing Manual.
(ii) Material Contracts
Other than those disclosed in the fi nancial statements, the Company and its subsidiary companies did not enter into any material contracts involving interests of the Directors or controlling shareholders and no such material contracts still subsist at the end of the fi nancial year.
(iii) Risk Management Policies and Processes
Dependence on the Russian MarketThe Group is dependent on the Russian market, which accounted for 57.6% of its turnover in 2012. Any signifi cant decline in the demand for the Group’s products in this market, whether or not brought about by political, social and/or economic changes, would adversely affect its turnover and profi tability.
The Group undertakes on-going efforts to increase sales by increasing sales in other existing markets and by developing new markets, which over time will reduce its dependency on the Russian market.
40
CORPORATE GOVERNANCE (cont’d)
SUPPLEMENTARY INFORMATION FOR THE YEAR ENDED 31 DECEMBER 2012 (SGX-ST LISTING MANUAL REQUIREMENTS) (cont’d)
(iii) Risk Management Policies and Processes (cont’d)
Foreign Exchange Exposure The Group is subject to foreign exchange risk arising mainly from those sales, purchases and operating costs by operating units denominated in currencies other than the operating units’ functional currency. Approximately 1.7% of the Group’s sales are denominated in currencies other than the functional currency of the operating units making the sales. The Group adopts natural hedging to protect itself against volatile foreign exchange rate movements. The Group has a natural hedge of 86.2% as 86.2% of the purchases and major operating expenses are denominated in the functional currency of the operating units.
Political and Regulatory Consideration The Group’s sales are generated mainly from developing markets such as Russia, Eastern Europe and Central Asia, where political, social, economic and regulatory uncertainties may have a direct impact on sales. For example, changes in policies by the respective government authorities of these regions may have an impact through (i) changes in laws and regulations; (ii) change in custom and import tariff; (iii) restrictions on currency conversions and remittances; and (iv) stability of the banking system.
The Group has representative offi ces in its major markets and is constantly updated on developments in government policy and regulation, allowing it to respond promptly to any policy changes that might affect sales.
Credit Risk of Customers In the normal course of its business, the Group extends credit terms to its customers, primarily to those located in developing countries. In the event of any signifi cant devaluation or depreciation of the currencies of these markets or if any major customer encounters fi nancial diffi culties, the Group would be exposed to the risk of non-collectability of some of its trade receivables.
The Group has a credit policy in place and exposure to credit risk is monitored on an on-going basis. Management believes that concentration of credit risk is limited due to the on-going evaluation of all customers.
Fluctuation in Raw Material Prices Instant coffee powder, creamer, sugar and packaging materials are the main raw materials used for the Group’s products. Due to the competitive nature of the instant beverage industry, the Group may not be able to pass on increases in raw material prices to its customers. Therefore any major increase in raw material prices may adversely affect profi tability. There is no regulated commodity market for trading of these raw materials. The Group monitors the movements of raw materials prices closely and keeps in regular contact with its major suppliers. The Group’s policy is to source from multiple suppliers where possible, so as to reduce dependency on any single source of supply.
The Group has embarked on a number of upstream green-fi eld projects to mitigate some of the uncertainties in commodities prices in the longer term.
Intellectual Property Risks Third parties may unlawfully copy and use the Group’s intellectual property. Policing such unauthorised use is diffi cult and the law on intellectual property rights and protection in some countries may not be as developed as others. Unauthorised use of trademarks, service marks, copyrights, trade secrets and other intellectual property may damage the brand and the name recognition of the Group and its credibility. The Group relies on trademark laws to protect its marks in countries that it operates in. The Group has fi led for registration of trademarks in countries where its products are marketed and distributed. The Group will take a strong stand on infringement and will take legal action to protect its intellectual property against counterfeit products and those who have unlawfully made use of its registered trademarks.
41
Food Empire Holdings Limited Annual Report 2012
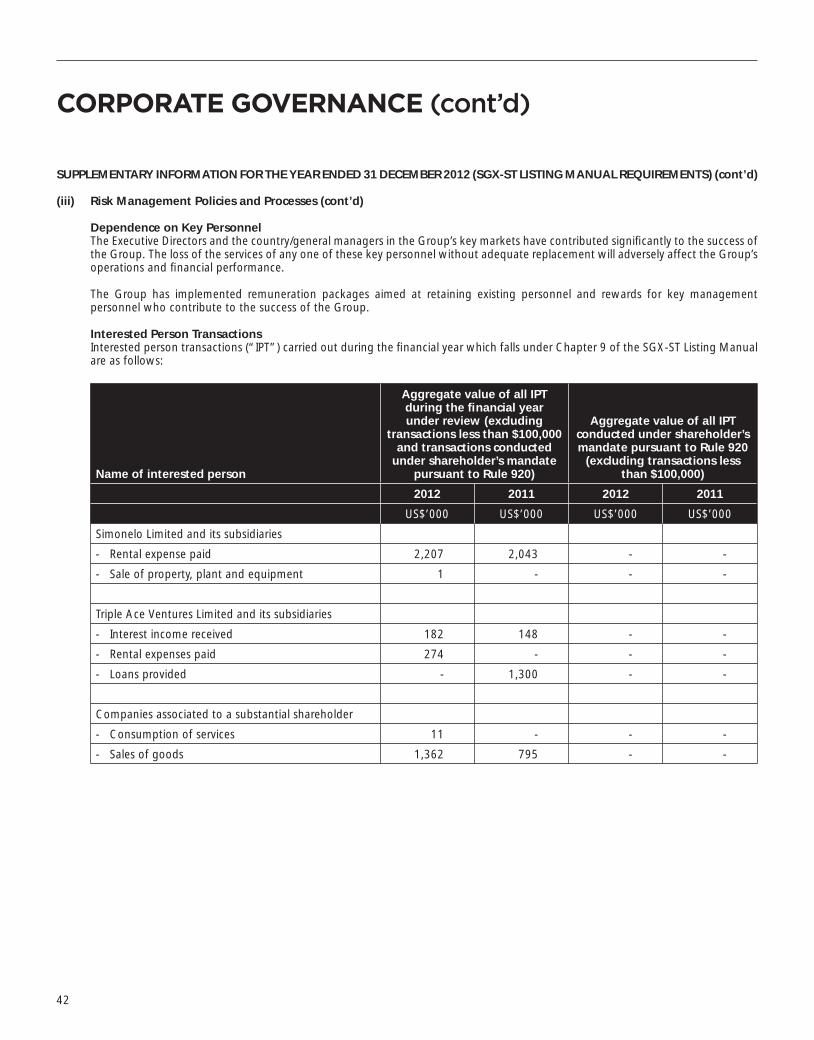
CORPORATE GOVERNANCE (cont’d)
SUPPLEMENTARY INFORMATION FOR THE YEAR ENDED 31 DECEMBER 2012 (SGX-ST LISTING MANUAL REQUIREMENTS) (cont’d)
(iii) Risk Management Policies and Processes (cont’d)
Dependence on Key PersonnelThe Executive Directors and the country/general managers in the Group’s key markets have contributed signifi cantly to the success of the Group. The loss of the services of any one of these key personnel without adequate replacement will adversely affect the Group’s operations and fi nancial performance.
The Group has implemented remuneration packages aimed at retaining existing personnel and rewards for key management personnel who contribute to the success of the Group.
Interested Person TransactionsInterested person transactions (“IPT”) carried out during the fi nancial year which falls under Chapter 9 of the SGX-ST Listing Manual are as follows:
Name of interested person
Aggregate value of all IPT during the fi nancial year under review (excluding
transactions less than $100,000 and transactions conducted
under shareholder’s mandate pursuant to Rule 920)
Aggregate value of all IPT conducted under shareholder’s mandate pursuant to Rule 920
(excluding transactions less than $100,000)
2012 2011 2012 2011
US$’000 US$’000 US$’000 US$’000
Simonelo Limited and its subsidiaries
- Rental expense paid 2,207 2,043 - -
- Sale of property, plant and equipment 1 - - -
Triple Ace Ventures Limited and its subsidiaries
- Interest income received 182 148 - -
- Rental expenses paid 274 - - -
- Loans provided - 1,300 - -
Companies associated to a substantial shareholder
- Consumption of services 11 - - -
- Sales of goods 1,362 795 - -
42
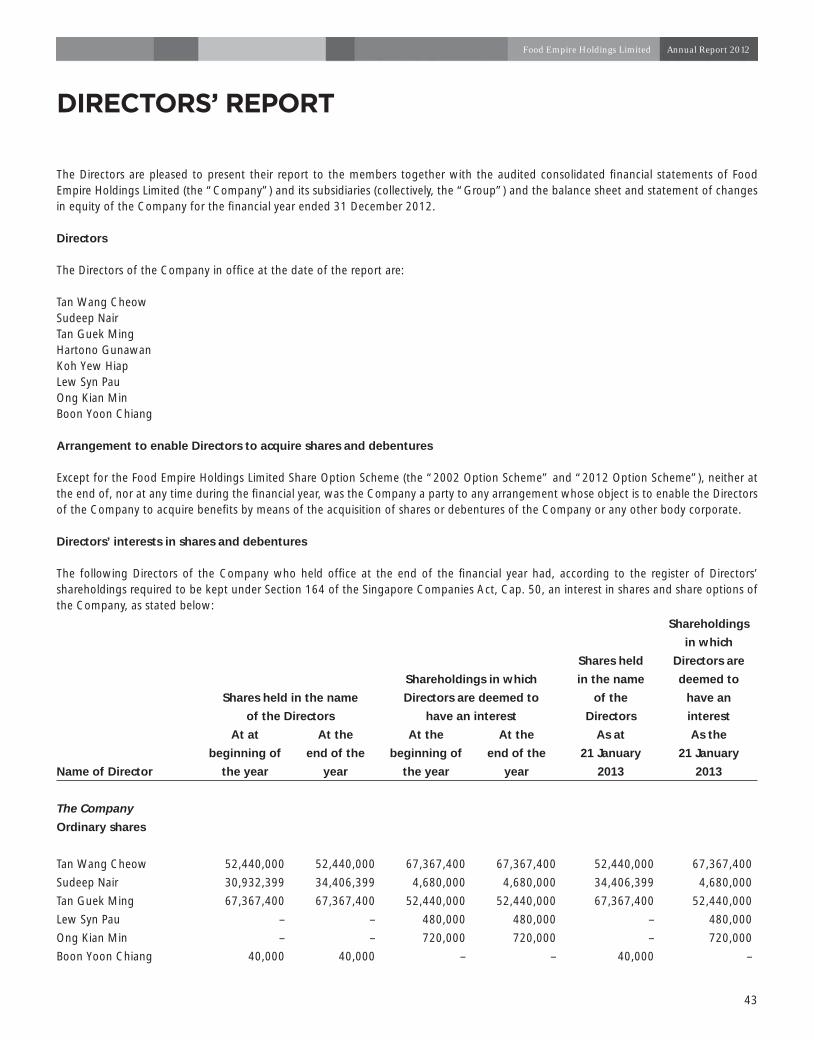
DIRECTORS’ REPORT
The Directors are pleased to present their report to the members together with the audited consolidated fi nancial statements of Food Empire Holdings Limited (the “Company”) and its subsidiaries (collectively, the “Group”) and the balance sheet and statement of changes in equity of the Company for the fi nancial year ended 31 December 2012.
Directors
The Directors of the Company in offi ce at the date of the report are:
Tan Wang CheowSudeep NairTan Guek MingHartono GunawanKoh Yew HiapLew Syn PauOng Kian MinBoon Yoon Chiang
Arrangement to enable Directors to acquire shares and debentures
Except for the Food Empire Holdings Limited Share Option Scheme (the “2002 Option Scheme” and “2012 Option Scheme”), neither at the end of, nor at any time during the fi nancial year, was the Company a party to any arrangement whose object is to enable the Directors of the Company to acquire benefi ts by means of the acquisition of shares or debentures of the Company or any other body corporate.
Directors’ interests in shares and debentures
The following Directors of the Company who held offi ce at the end of the fi nancial year had, according to the register of Directors’ shareholdings required to be kept under Section 164 of the Singapore Companies Act, Cap. 50, an interest in shares and share options of the Company, as stated below:
Shareholdings
in which
Shares held Directors are
Shareholdings in which in the name deemed to
Shares held in the name Directors are deemed to of the have an
of the Directors have an interest Directors interest
At at At the At the At the As at As the
beginning of end of the beginning of end of the 21 January 21 January
Name of Director the year year the year year 2013 2013
The Company
Ordinary shares
Tan Wang Cheow 52,440,000 52,440,000 67,367,400 67,367,400 52,440,000 67,367,400
Sudeep Nair 30,932,399 34,406,399 4,680,000 4,680,000 34,406,399 4,680,000
Tan Guek Ming 67,367,400 67,367,400 52,440,000 52,440,000 67,367,400 52,440,000
Lew Syn Pau – – 480,000 480,000 – 480,000
Ong Kian Min – – 720,000 720,000 – 720,000
Boon Yoon Chiang 40,000 40,000 – – 40,000 –
43
Food Empire Holdings Limited Annual Report 2012
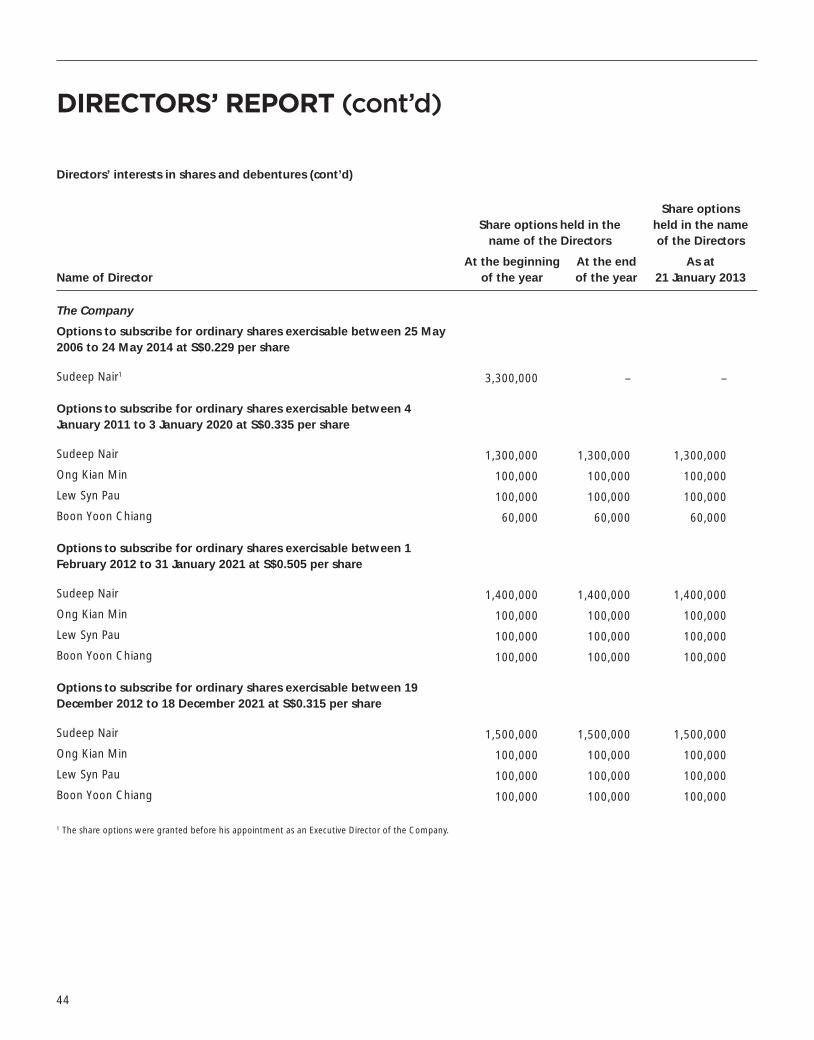
Directors’ interests in shares and debentures (cont’d)
Share options held in the name of the Directors
Share options held in the name of the Directors
Name of DirectorAt the beginning
of the yearAt the end of the year
As at 21 January 2013
The Company
Options to subscribe for ordinary shares exercisable between 25 May 2006 to 24 May 2014 at S$0.229 per share
Sudeep Nair1 3,300,000 – –
Options to subscribe for ordinary shares exercisable between 4 January 2011 to 3 January 2020 at S$0.335 per share
Sudeep Nair 1,300,000 1,300,000 1,300,000
Ong Kian Min 100,000 100,000 100,000
Lew Syn Pau 100,000 100,000 100,000
Boon Yoon Chiang 60,000 60,000 60,000
Options to subscribe for ordinary shares exercisable between 1 February 2012 to 31 January 2021 at S$0.505 per share
Sudeep Nair 1,400,000 1,400,000 1,400,000
Ong Kian Min 100,000 100,000 100,000
Lew Syn Pau 100,000 100,000 100,000
Boon Yoon Chiang 100,000 100,000 100,000
Options to subscribe for ordinary shares exercisable between 19 December 2012 to 18 December 2021 at S$0.315 per share
Sudeep Nair 1,500,000 1,500,000 1,500,000
Ong Kian Min 100,000 100,000 100,000
Lew Syn Pau 100,000 100,000 100,000
Boon Yoon Chiang 100,000 100,000 100,000
1 The share options were granted before his appointment as an Executive Director of the Company.
DIRECTORS’ REPORT (cont’d)
44

DIRECTORS’ REPORT (cont’d)
Directors’ interests in shares and debentures (cont’d)
By virtue of Section 7 of the Singapore Companies Act, Cap. 50, Mr. Tan Wang Cheow and Mdm. Tan Guek Ming are deemed to have an interest in the Company’s subsidiaries at the end of the fi nancial year.
There was no change in any of the above-mentioned interests between the end of the fi nancial year and 21 January 2013.
Except as disclosed in this report, no Director who held offi ce at the end of the fi nancial year had interests in shares, share options, warrants or debentures of the Company, or of related corporations, either at the beginning of the fi nancial year, or date of appointment if later, or at the end of the fi nancial year.
Directors’ contractual benefi ts
Except as disclosed in the fi nancial statements, since the end of the previous fi nancial year, no Director of the Company has received or become entitled to receive a benefi t by reason of a contract made by the Company or a related corporation with the Director, or with a fi rm of which the Director is a member, or with a company in which the Director has a substantial fi nancial interest.
Share options
The Food Empire Holdings Limited Share Option Scheme (the “2002 Option Scheme”) was approved and adopted at an Extraordinary General Meeting of the Company held on 22 January 2002, which has since expired on 31 December 2011.
The Food Empire Holdings Limited Share Option Scheme (the “2012 Option Scheme”) was approved and adopted at an Extraordinary General Meeting of the Company held on 27 April 2012.
The 2002 Option Scheme and 2012 Option Scheme are administered by the Remuneration Committee (“RC”) which comprises Mr. Lew Syn Pau (Chairman), Mr. Ong Kian Min, Mr. Boon Yoon Chiang, Mdm. Tan Guek Ming and Mr. Koh Yew Hiap.
The total number of shares in respect of the 2012 Option Scheme and the 2002 Option Scheme that may be offered shall not exceed 15% of the Company’s total issued share capital on the day immediately preceding the offer date.
45
Food Empire Holdings Limited Annual Report 2012

Share options (cont’d)
Unissued shares under 2002 Option Scheme
Unissued shares of the Company under the 2002 Option Scheme at the end of the fi nancial year were as follows:
Number of
holders at year
end
Number of options
outstanding at 1.1.2012
Number of options granted
during the fi nancial
year
Number of options
lapsed during the fi nancial
year
Number of options exercised
during the fi nancial
year
Number of options
outstanding at
31.12.2012
Exercise price per
shareS$ Exercise period
2002 Options – 240,000 – (240,000) – – 0.142 14 March 2004 to 13 March 2012
2004 Options 1 3,400,000 – – (3,300,000) 100,000 0.229 25 May 2006 to 24 May 2014
2010 Options 16 3,730,000 – (30,000) (140,000) 3,560,000 0.335 4 January 2011 to 3 January 2020
2011 Options (February)
17 4,050,000 – (100,000) – 3,950,000 0.505 1 February 2012 to 31 January 2021
2011 Options (December)
19 4,470,000 – (200,000) (140,000) 4,130,000 0.315 19 December 2012 to 18 December 2021
15,890,000 – (570,000) (3,580,000) 11,740,000
The options granted to Directors of the Company and participants who received 5% or more of the total number of options available under the 2002 Option Scheme are as follows:
Name of Director
Aggregate options granted since
commencement of 2002 Option Scheme to end
of fi nancial year
Aggregate options exercised since
commencement of 2002 Option Scheme to end
of fi nancial year
Aggregate options lapsed/cancelled since
commencement of 2002 Option Scheme to end
of fi nancial year
Aggregate options
outstanding as at end of
fi nancial year
Lew Syn Pau 900,000 (600,000) – 300,000
Ong Kian Min 900,000 (600,000) – 300,000
Sudeep Nair2 12,000,000 (7,800,000) – 4,200,000
Boon Yoon Chiang 300,000 (40,000) – 260,000
2 7,800,000 share options were granted before his appointment as an Executive Director of the Company.
DIRECTORS’ REPORT (cont’d)
46

Share options (cont’d)
Unissued shares under 2002 Option Scheme (cont’d)
Since the commencement of the 2002 Option Scheme till the end of the fi nancial year:• 45,215,000 options were granted • No options had been granted to the controlling shareholders of the Company or their associates• No options had been granted to the Directors appointed by the controlling shareholders• No options that entitle the holder to participate, by virtue of the options, in any share issue of any other corporation had been granted• No participant other than Mr. Sudeep Nair has been granted 5% or more of the total options available under the 2002 Option Scheme
Except as disclosed above, there were no unissued shares of the Company or its subsidiaries under options as at the end of the fi nancial year.
Options granted after the fi nancial year end
During the fi nancial year:
• The Company granted 4,580,000 options which are exercisable between 8 March 2014 to 7 March 2023, to subscribe for ordinary shares at an exercise price of S$0.669 per share, to Executive Directors and selected group of employees eligible under the 2012 Option Scheme.
• The Company also granted 300,000 options which are exercisable between 8 March 2014 to 7 March 2018, to subscribe for ordinary shares at an exercise price of S$0.669 per share, to Non-Executive Directors eligible under the 2012 Option Scheme.
The options granted to the Executive Directors and Non-Executive Directors of the Company on 8 March 2013 were as follows:
Executive Directors of the Company
Options, which are exercisable between 8 March 2014 to 7 March 2023, to subscribe for ordinary shares at S$0.669 per share
Sudeep Nair 1,500,000
Non-Executive Directors of the Company
Options, which are exercisable between 8 March 2014 to 7 March 2018, to subscribe for ordinary shares at S$0.669 per share
Lew Syn Pau 100,000
Ong Kian Min 100,000
Boon Yoon Chiang 100,000
DIRECTORS’ REPORT (cont’d)
47
Food Empire Holdings Limited Annual Report 2012

Audit Committee
The Audit Committee (“AC”) carried out its functions in accordance with Section 201B (5) of the Singapore Companies Act, Cap. 50. The functions performed by the AC are detailed in the Report on Corporate Governance.
The Board of Directors and the AC have reviewed the adequacy of the Group’s internal controls, including fi nancial, operational and compliance controls. Based on work done by the internal and external auditors and reviews performed by management throughout the fi nancial year 2012, the Board, with the concurrence of the AC, is of the opinion that the systems of internal controls in place are adequate to address the fi nancial, operational and compliance risks and also providing reasonable assurance of the effectiveness of the Group in safeguarding its assets and shareholders’ value.
Auditors
Ernst & Young LLP have expressed their willingness to accept re-appointment as auditors.
On behalf of the Board of Directors,
Tan Wang Cheow Sudeep NairDirector Director
21 March 2013
DIRECTORS’ REPORT (cont’d)
48

We, Tan Wang Cheow and Sudeep Nair, being two of the Directors of Food Empire Holdings Limited, do hereby state that, in the opinion of the Directors:
(i) the accompanying balance sheets, consolidated income statement, consolidated statement of comprehensive income, statements of changes in equity, and consolidated cash fl ow statement together with notes thereto are drawn up so as to give a true and fair view of the state of affairs of the Group and of the Company as at 31 December 2012 and the results of the business, changes in equity and cash fl ows of the Group and the changes in equity of the Company for the year ended on that date; and
(ii) at the date of this statement, there are reasonable grounds to believe that the Company will be able to pay its debts as and when they fall due.
On behalf of the Board of Directors,
Tan Wang Cheow Sudeep NairDirector Director
21 March 2013
STATEMENT BY DIRECTORS
49
Food Empire Holdings Limited Annual Report 2012
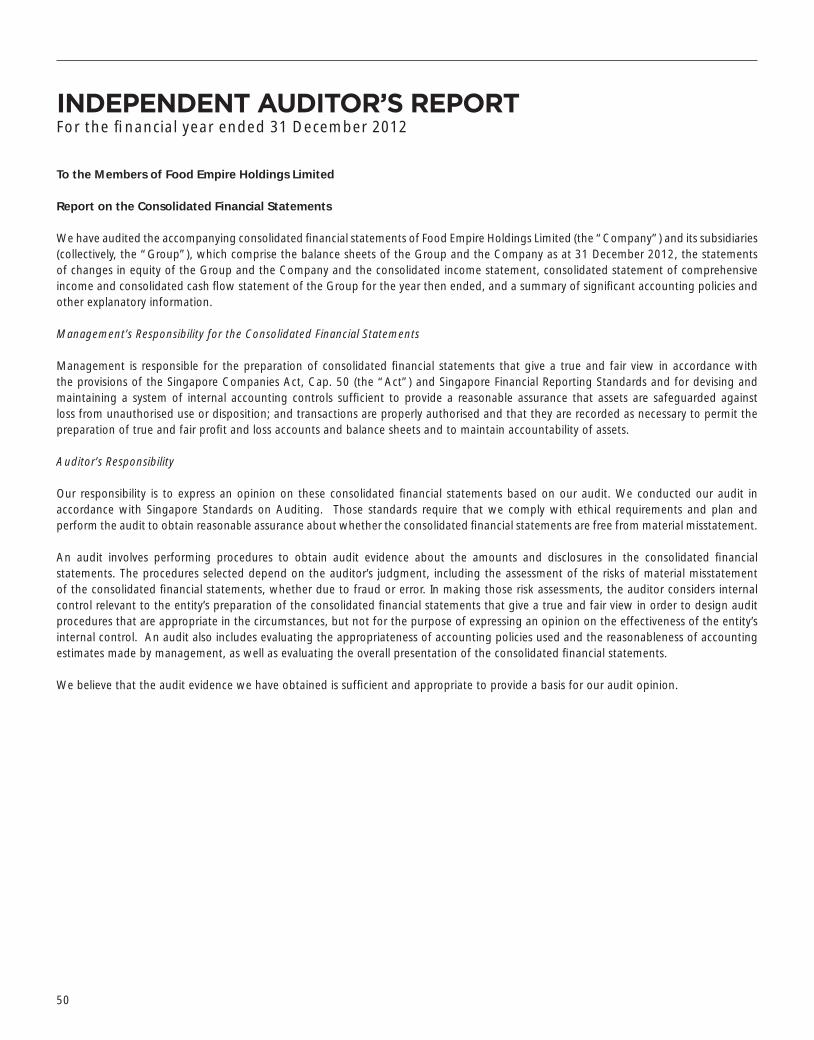
To the Members of Food Empire Holdings Limited
Report on the Consolidated Financial Statements
We have audited the accompanying consolidated fi nancial statements of Food Empire Holdings Limited (the “Company”) and its subsidiaries (collectively, the “Group”), which comprise the balance sheets of the Group and the Company as at 31 December 2012, the statements of changes in equity of the Group and the Company and the consolidated income statement, consolidated statement of comprehensive income and consolidated cash fl ow statement of the Group for the year then ended, and a summary of signifi cant accounting policies and other explanatory information.
Management’s Responsibility for the Consolidated Financial Statements
Management is responsible for the preparation of consolidated fi nancial statements that give a true and fair view in accordance with the provisions of the Singapore Companies Act, Cap. 50 (the “Act”) and Singapore Financial Reporting Standards and for devising and maintaining a system of internal accounting controls suffi cient to provide a reasonable assurance that assets are safeguarded against loss from unauthorised use or disposition; and transactions are properly authorised and that they are recorded as necessary to permit the preparation of true and fair profi t and loss accounts and balance sheets and to maintain accountability of assets.
Auditor’s Responsibility
Our responsibility is to express an opinion on these consolidated fi nancial statements based on our audit. We conducted our audit in accordance with Singapore Standards on Auditing. Those standards require that we comply with ethical requirements and plan and perform the audit to obtain reasonable assurance about whether the consolidated fi nancial statements are free from material misstatement.
An audit involves performing procedures to obtain audit evidence about the amounts and disclosures in the consolidated fi nancial statements. The procedures selected depend on the auditor’s judgment, including the assessment of the risks of material misstatement of the consolidated fi nancial statements, whether due to fraud or error. In making those risk assessments, the auditor considers internal control relevant to the entity’s preparation of the consolidated fi nancial statements that give a true and fair view in order to design audit procedures that are appropriate in the circumstances, but not for the purpose of expressing an opinion on the effectiveness of the entity’s internal control. An audit also includes evaluating the appropriateness of accounting policies used and the reasonableness of accounting estimates made by management, as well as evaluating the overall presentation of the consolidated fi nancial statements.
We believe that the audit evidence we have obtained is suffi cient and appropriate to provide a basis for our audit opinion.
INDEPENDENT AUDITOR’S REPORTFor the fi nancial year ended 31 December 2012
50
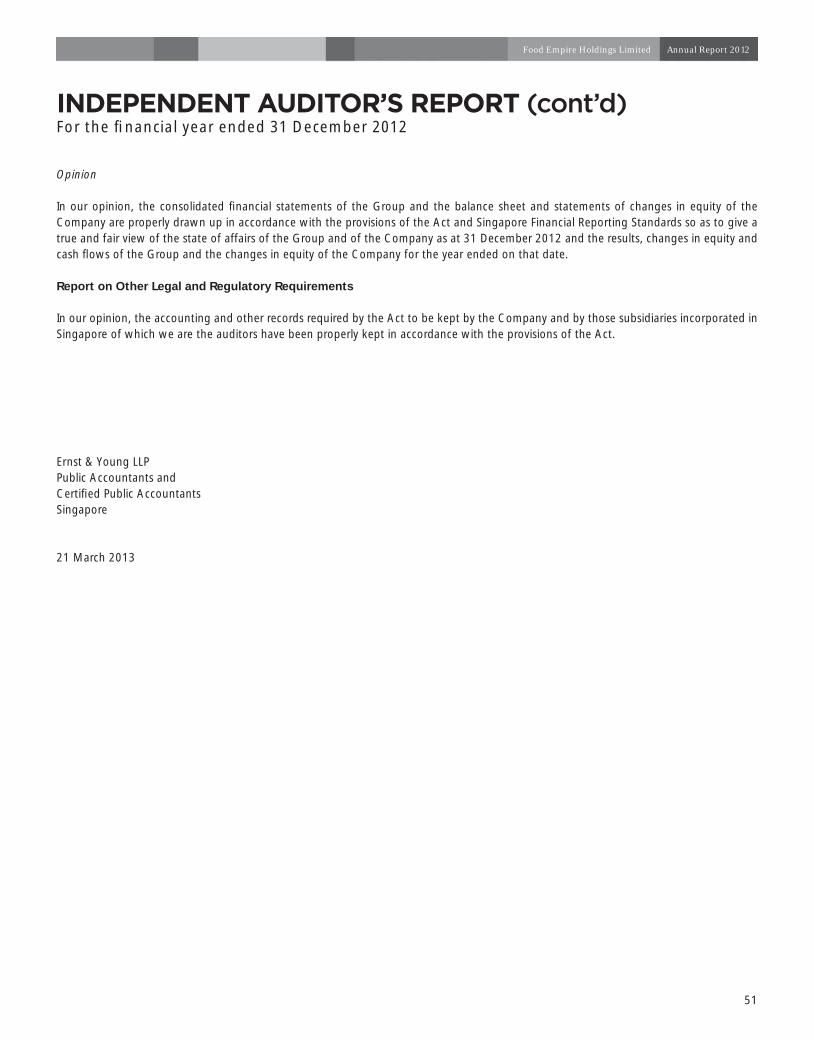
INDEPENDENT AUDITOR’S REPORT (cont’d)For the fi nancial year ended 31 December 2012
Opinion
In our opinion, the consolidated fi nancial statements of the Group and the balance sheet and statements of changes in equity of the Company are properly drawn up in accordance with the provisions of the Act and Singapore Financial Reporting Standards so as to give a true and fair view of the state of affairs of the Group and of the Company as at 31 December 2012 and the results, changes in equity and cash fl ows of the Group and the changes in equity of the Company for the year ended on that date.
Report on Other Legal and Regulatory Requirements
In our opinion, the accounting and other records required by the Act to be kept by the Company and by those subsidiaries incorporated in Singapore of which we are the auditors have been properly kept in accordance with the provisions of the Act.
Ernst & Young LLPPublic Accountants andCertifi ed Public AccountantsSingapore
21 March 2013
51
Food Empire Holdings Limited Annual Report 2012

Note 2012US$’000
2011US$’000
Revenue 4 237,663 225,662
Other income 5 1,111 1,101
Changes in inventories of fi nished goods 4,915 (1,396)
Raw materials and consumables used (131,420) (125,494)
Staff costs 6 (29,115) (24,435)
Depreciation of property, plant and equipment (2,805) (2,012)
Depreciation of investment properties (41) (41)
Foreign exchange gain/(loss) 585 (812)
Other operating expenses (60,325) (56,599)
Finance costs 7 (341) (86)
Share of profi t of associates 1,290 277
Profi t before taxation 8 21,517 16,165
Taxation 9 (1,276) (1,352)
Profi t for the year 20,241 14,813
Profi t attributable to:
Equity shareholders of the Company 20,486 14,962
Non-controlling interest (245) (149)
20,241 14,813
Earnings per share
Basic earnings per share (in cents) 11 3.87 2.83
Diluted earnings per share (in cents) 11 3.85 2.82
CONSOLIDATED INCOME STATEMENTFor the year ended 31 December 2012
The accompanying accounting policies and explanatory notes form an integral part of the fi nancial statements.
52
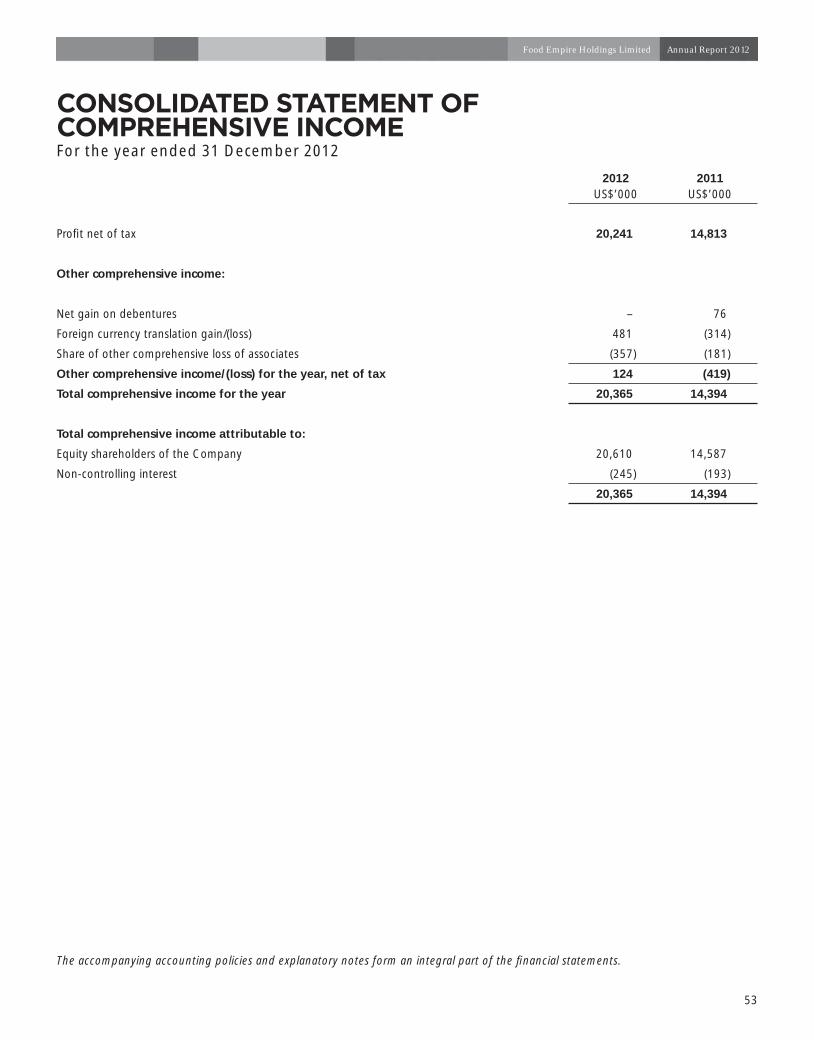
CONSOLIDATED STATEMENT OF COMPREHENSIVE INCOMEFor the year ended 31 December 2012
The accompanying accounting policies and explanatory notes form an integral part of the fi nancial statements.
2012US$’000
2011US$’000
Profi t net of tax 20,241 14,813
Other comprehensive income:
Net gain on debentures – 76
Foreign currency translation gain/(loss) 481 (314)
Share of other comprehensive loss of associates (357) (181)
Other comprehensive income/(loss) for the year, net of tax 124 (419)
Total comprehensive income for the year 20,365 14,394
Total comprehensive income attributable to:
Equity shareholders of the Company 20,610 14,587
Non-controlling interest (245) (193)
20,365 14,394
53
Food Empire Holdings Limited Annual Report 2012

Note Group Company
2012US$’000
2011US$’000
2012US$’000
2011US$’000
Non-Current Assets
Property, plant and equipment 12 33,562 23,857 186 221
Investment properties 13 11,400 10,765 – –
Investment in subsidiaries 14 – – 44,545 44,545
Investment in associates 15 12,890 9,988 – –
Amount due from an associate 16 2,600 2,600 – –
Intangible assets 17 13,343 13,343 – –
Deferred tax assets 18 207 142 – –
Other receivables 19 378 – – –
74,380 60,695 44,731 44,766
Current Assets
Inventories 20 27,172 22,257 – –
Prepaid operating expenses and other debtors 21 6,746 2,173 46 29
Deferred expenses 165 400 – –
Amounts due from subsidiaries (non-trade) 22 – – 7,353 5,889
Amounts due from associates (non-trade) 23 539 514 – –
Trade receivables 24 54,501 63,050 – –
Other receivables 19 938 2,435 – –
Derivatives 25 178 – – –
Cash and cash equivalents 26 46,596 35,148 418 116
136,835 125,977 7,817 6,034
The accompanying accounting policies and explanatory notes form an integral part of the fi nancial statements.
BALANCE SHEETSAs at 31 December 2012
54
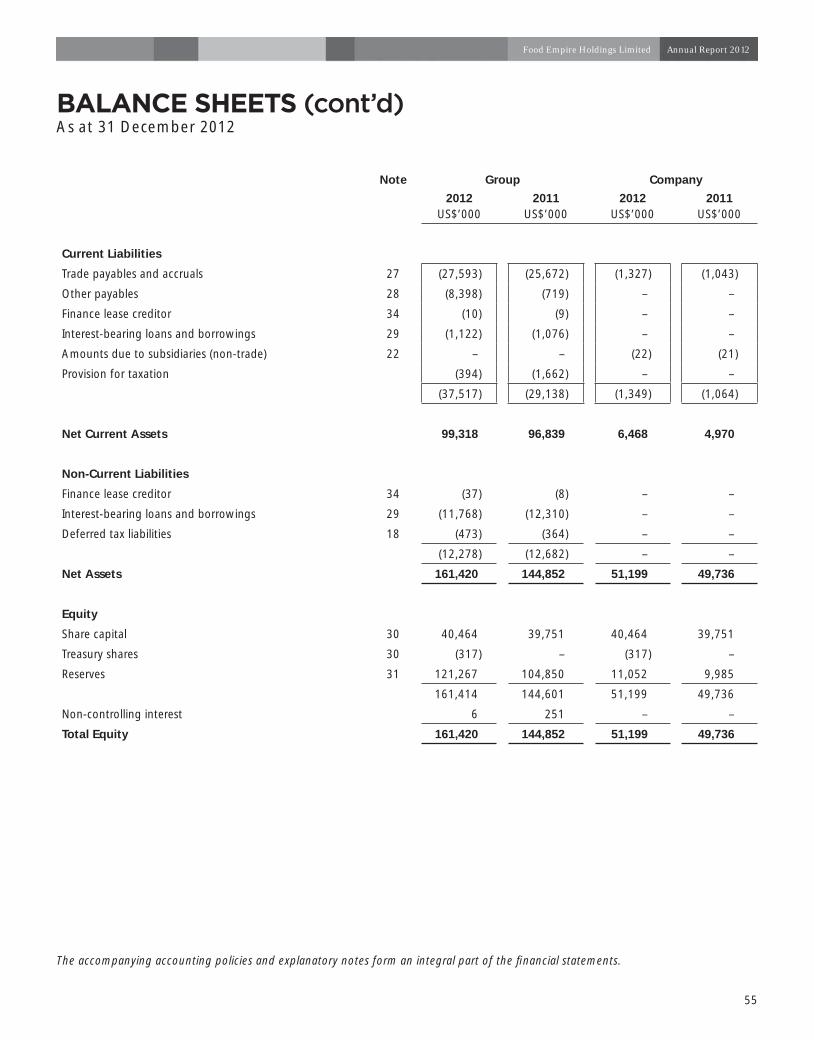
The accompanying accounting policies and explanatory notes form an integral part of the fi nancial statements.
BALANCE SHEETS (cont’d)As at 31 December 2012
Note Group Company
2012US$’000
2011US$’000
2012US$’000
2011US$’000
Current Liabilities
Trade payables and accruals 27 (27,593) (25,672) (1,327) (1,043)
Other payables 28 (8,398) (719) – –
Finance lease creditor 34 (10) (9) – –
Interest-bearing loans and borrowings 29 (1,122) (1,076) – –
Amounts due to subsidiaries (non-trade) 22 – – (22) (21)
Provision for taxation (394) (1,662) – –
(37,517) (29,138) (1,349) (1,064)
Net Current Assets 99,318 96,839 6,468 4,970
Non-Current Liabilities
Finance lease creditor 34 (37) (8) – –
Interest-bearing loans and borrowings 29 (11,768) (12,310) – –
Deferred tax liabilities 18 (473) (364) – –
(12,278) (12,682) – –
Net Assets 161,420 144,852 51,199 49,736
Equity
Share capital 30 40,464 39,751 40,464 39,751
Treasury shares 30 (317) – (317) –
Reserves 31 121,267 104,850 11,052 9,985
161,414 144,601 51,199 49,736
Non-controlling interest 6 251 – –
Total Equity 161,420 144,852 51,199 49,736
55
Food Empire Holdings Limited Annual Report 2012

The accompanying accounting policies and explanatory notes form an integral part of the fi nancial statements.
Attributable to equity shareholders of the Company
Group2012
Share capital
US$’000
Treasury shares
US$’000
Foreign currency
translation reserveUS$’000
Asset revaluation
reserveUS$’000
Share-based
payment reserveUS$’000
Accumulated profi ts
US$’000Total
US$’000
Non-controlling
interestUS$’000
Totalequity
US$’000
Balance as at 1 January 2012
39,751 – 850 60 825 103,115 144,601 251 144,852
Profi t for the year – – – – – 20,486 20,486 (245) 20,241
Other comprehensive income
Foreign currency translation
– – 481 – – – 481 – 481
Share of other comprehensive loss of associates
– – (357) – – – (357) – (357)
Total comprehensive income/(loss) for the year
– – 124 – –
20,486 20,610 (245) 20,365
Dividends paid to equity shareholders of the Company (Note 10)
– – – – – (4,504) (4,504) – (4,504)
Value of employee services received for issue of share options
– – – – 331 – 331 – 331
Purchase of treasury shares
– (317) – – – – (317) – (317)
Issuance of new shares 693 – – – – – 693 – 693
Exercise of share options 20 – – – (20) – – – –
Balance as at 31 December 2012
40,464 (317) 974 60 1,136 119,097 161,414 6 161,420
STATEMENTS OF CHANGES IN EQUITYFor the year ended 31 December 2012
56

The accompanying accounting policies and explanatory notes form an integral part of the fi nancial statements.
STATEMENTS OF CHANGES IN EQUITY (cont’d)For the year ended 31 December 2012
Attributable to equity shareholders of the Company
Group2011
Share capital
US$’000
Foreign currency
translation reserveUS$’000
Asset revaluation
reserveUS$’000
Share-based
payment reserveUS$’000
Fair value adjustment
reserveUS$’000
Accumulated profi ts
US$’000Total
US$’000
Non-controlling
interestUS$’000
Total equity
US$’000
Balance as at 1 January 2011
39,666 1,301 60 535 (76) 92,684 134,170 – 134,170
Profi t for the year – – – – – 14,962 14,962 (149) 14,813
Other comprehensive income
Net gain on disposal of debenture
– – – – 76 – 76 – 76
Foreign currency translation
– (270) – – – – (270) (44) (314)
Share of other comprehensive loss of associates
– (181) – – – – (181) – (181)
Total comprehensive (loss)/income for the year
– (451) – – 76 14,962 14,587 (193) 14,394
Dividends paid to equity shareholders of the Company (Note 10)
– – – – – (4,531) (4,531) – (4,531)
Value of employee services received for issue of share options
– – – 299 – – 299 – 299
Capital injection from non-controlling interest of a subsidiary
– – – – – – – 444 444
Issuance of new shares 76 – – – – – 76 – 76
Exercise of share options 9 – – (9) – – – – –
Balance as at 31 December 2011
39,751 850 60 825 – 103,115 144,601 251 144,852
57
Food Empire Holdings Limited Annual Report 2012

The accompanying accounting policies and explanatory notes form an integral part of the fi nancial statements.
Company2012
Share capital
US$’000
Treasury shares
US$’000
Foreign currency
translation reserveUS$’000
Share-based
payment reserveUS$’000
Accumulated profi ts
US$’000
Totalequity
US$’000
Balance as at 1 January 2012 39,751 – 3,869 825 5,291 49,736
Profi t for the year – – – – 4,895 4,895
Other comprehensive income
Foreign currency translation – – 365 – – 365
Total comprehensive income for the year – – 365 – 4,895 5,260
Issuance of new shares 693 – – – – 693
Exercise of share options 20 – – (20) – –
Dividends paid to equity shareholders of the Company (Note 10)
– – – – (4,504) (4,504)
Purchase of treasury shares – (317) – – – (317)
Value of employee services received for issue of share options
– – – 331 – 331
Balance as at 31 December 2012 40,464 (317) 4,234 1,136 5,682 51,199
2011
Balance as at 1 January 2011 39,666 – 3,963 535 271 44,435
Profi t for the year – – – – 9,551 9,551
Other comprehensive income
Foreign currency translation – – (94) – – (94)
Total comprehensive (loss)/income for the year – – (94) – 9,551 9,457
Issuance of new shares 76 – – – – 76
Exercise of share options 9 – – (9) – –
Dividends paid to equity shareholders of the Company (Note 10)
– – – – (4,531) (4,531)
Value of employee services received for issue of share options
– – – 299 – 299
Balance as at 31 December 2011 39,751 – 3,869 825 5,291 49,736
STATEMENTS OF CHANGES IN EQUITY (cont’d)For the year ended 31 December 2012
58
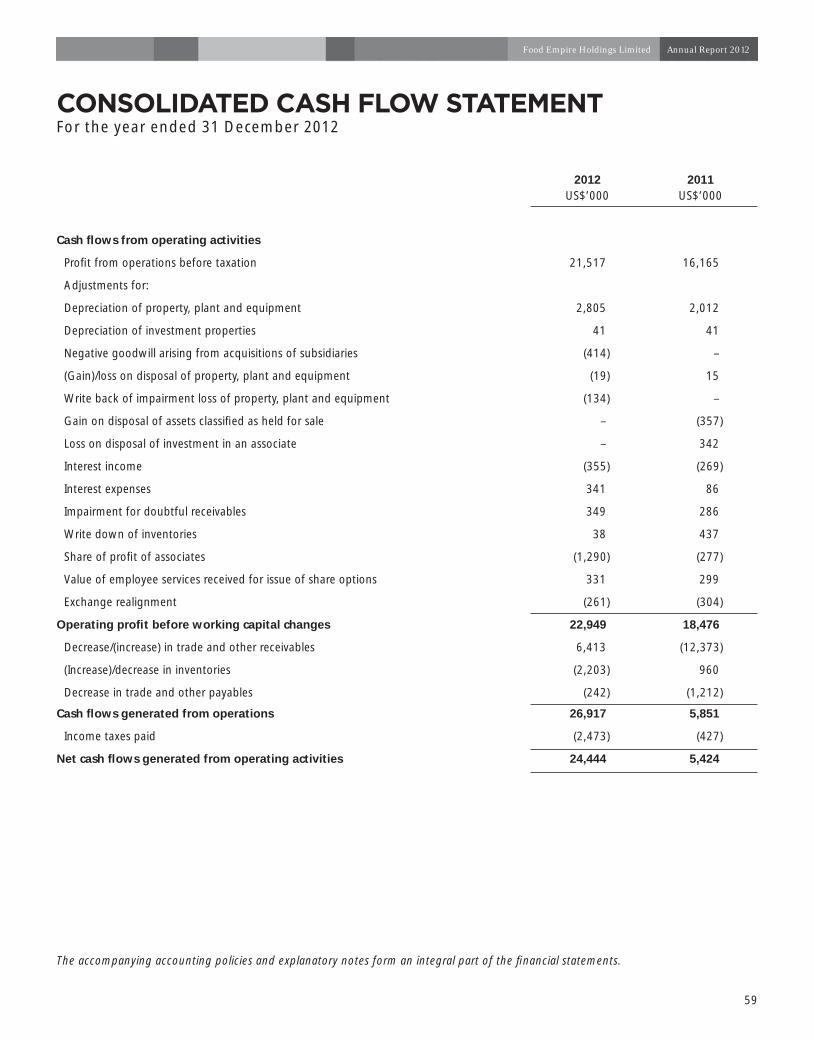
The accompanying accounting policies and explanatory notes form an integral part of the fi nancial statements.
CONSOLIDATED CASH FLOW STATEMENTFor the year ended 31 December 2012
2012US$’000
2011US$’000
Cash fl ows from operating activities
Profi t from operations before taxation 21,517 16,165
Adjustments for:
Depreciation of property, plant and equipment 2,805 2,012
Depreciation of investment properties 41 41
Negative goodwill arising from acquisitions of subsidiaries (414) –
(Gain)/loss on disposal of property, plant and equipment (19) 15
Write back of impairment loss of property, plant and equipment (134) –
Gain on disposal of assets classifi ed as held for sale – (357)
Loss on disposal of investment in an associate – 342
Interest income (355) (269)
Interest expenses 341 86
Impairment for doubtful receivables 349 286
Write down of inventories 38 437
Share of profi t of associates (1,290) (277)
Value of employee services received for issue of share options 331 299
Exchange realignment (261) (304)
Operating profi t before working capital changes 22,949 18,476
Decrease/(increase) in trade and other receivables 6,413 (12,373)
(Increase)/decrease in inventories (2,203) 960
Decrease in trade and other payables (242) (1,212)
Cash fl ows generated from operations 26,917 5,851
Income taxes paid (2,473) (427)
Net cash fl ows generated from operating activities 24,444 5,424
59
Food Empire Holdings Limited Annual Report 2012
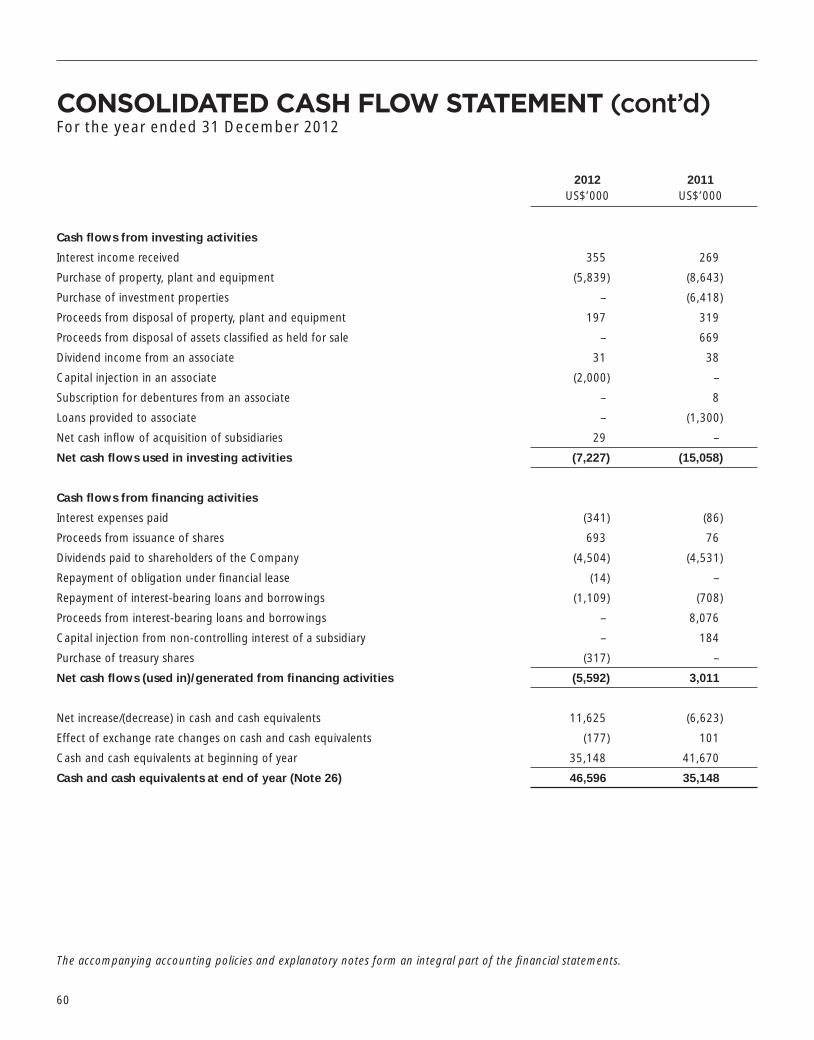
2012US$’000
2011US$’000
Cash fl ows from investing activities
Interest income received 355 269
Purchase of property, plant and equipment (5,839) (8,643)
Purchase of investment properties – (6,418)
Proceeds from disposal of property, plant and equipment 197 319
Proceeds from disposal of assets classifi ed as held for sale – 669
Dividend income from an associate 31 38
Capital injection in an associate (2,000) –
Subscription for debentures from an associate – 8
Loans provided to associate – (1,300)
Net cash infl ow of acquisition of subsidiaries 29 –
Net cash fl ows used in investing activities (7,227) (15,058)
Cash fl ows from fi nancing activities
Interest expenses paid (341) (86)
Proceeds from issuance of shares 693 76
Dividends paid to shareholders of the Company (4,504) (4,531)
Repayment of obligation under fi nancial lease (14) –
Repayment of interest-bearing loans and borrowings (1,109) (708)
Proceeds from interest-bearing loans and borrowings – 8,076
Capital injection from non-controlling interest of a subsidiary – 184
Purchase of treasury shares (317) –
Net cash fl ows (used in)/generated from fi nancing activities (5,592) 3,011
Net increase/(decrease) in cash and cash equivalents 11,625 (6,623)
Effect of exchange rate changes on cash and cash equivalents (177) 101
Cash and cash equivalents at beginning of year 35,148 41,670
Cash and cash equivalents at end of year (Note 26) 46,596 35,148
The accompanying accounting policies and explanatory notes form an integral part of the fi nancial statements.
CONSOLIDATED CASH FLOW STATEMENT (cont’d)For the year ended 31 December 2012
60

NOTES TO THE FINANCIAL STATEMENTSFor the year ended 31 December 2012
1. Corporate information
The fi nancial statements of Food Empire Holdings Limited (the “Company”) and its subsidiaries (collectively, the “Group”) for the year ended 31 December 2012 were authorised for issue in accordance with a resolution of the Directors on 21 March 2013.
The Company is a limited liability company, which is domiciled and incorporated in Singapore and is listed on the Singapore Exchange Securities Trading Limited (SGX-ST).
The registered offi ce of the Company is located at 50 Raffl es Place, #32-01, Singapore Land Tower, Singapore 048623. The principal place of business of the Company is located at 31 Harrison Road, #08-01 Food Empire Business Suite, Singapore 369649.
The principal activity of the Company is that of an investment holding company. The principal activities and other details of the subsidiaries are stated in Note 14 to the fi nancial statements. There have been no signifi cant changes in the nature of these activities during the fi nancial year under review.
Related parties refer to companies in which certain Directors or minority shareholders have substantial benefi cial interests, and/or in a position to exercise signifi cant infl uence over the Group’s fi nancial and operating policy decisions.
2. Summary of signifi cant accounting policies
2.1 Basis of preparation
The consolidated fi nancial statements of the Group and the balance sheet and statement of changes in equity of the Company have been prepared in accordance with Singapore Financial Reporting Standards (“FRS”).
The fi nancial statements have been prepared on a historical cost basis except as disclosed in the accounting policies below.
The Company’s functional currency is Singapore Dollars (“S$” or “SGD”) while the fi nancial statements are presented in United States Dollars (“US$” or “USD”). The Group adopted USD as the presentation currency as it is more refl ective of the business operations of the Group, where transactions are mostly in USD.
All values in the tables are rounded to the nearest thousand (US$’000), unless otherwise stated.
2.2 Changes in accounting policies
The accounting policies adopted are consistent with those of the previous fi nancial year except in the current fi nancial year, the Group has adopted all the new and revised standards and Interpretations of FRS (“INT FRS”) that are effective for annual periods beginning on or after 1 January 2012. The adoption of these standards and interpretations did not have any effect on the fi nancial performance or position of the Group and the Company, except as discussed below.
61
Food Empire Holdings Limited Annual Report 2012

2. Summary of signifi cant accounting policies (cont’d)
2.2 Changes in accounting policies (cont’d)
Amendments to FRS 12 Deferred Tax: Recovery of Underlying Assets
As of 1 January 2012, the Group adopted the Amendments to FRS 12 Deferred Tax: Recovery of Underlying Assets.
The Amendments to FRS 12 apply to the measurement of deferred tax liabilities and assets arising from investment properties measured using the fair value model under FRS 40 Investment Property, including investment property acquired in a business combination and subsequently measured using the fair value model. For the purposes of measuring deferred tax, the Amendments introduce a rebuttable presumption that the carrying amount of an investment property measured at fair value will be recovered entirely through sale. The presumption can be rebutted if the investment property is depreciable and is held within a business model whose objective is to consume substantially all of the economic benefi ts over time, rather than through sale.
The adoption of the amendments to FRS 12 effective 1 January 2012 will not have any impact to the accounting policies of the Group in the period of initial application.
2.3 Standards issued but not yet effective
The Group has not adopted the following standards and interpretations that have been issued but not yet effective:
Effective for annualperiods beginning
Description on or after
Amendments to FRS 1 Presentation of Items of Other Comprehensive Income 1 July 2012Revised FRS 19 Employee Benefi ts 1 January 2013FRS 113 Fair Value Measurement 1 January 2013Amendments to FRS 107 Disclosures – Offsetting Financial Assets and Financial Liabilities 1 January 2013Improvements to FRSs 2012 - Amendment to FRS 1 Presentation of Financial Statements 1 January 2013- Amendment to FRS 16 Property, Plant and Equipment 1 January 2013- Amendment to FRS 32 Financial Instruments: Presentation 1 January 2013Revised FRS 27 Separate Financial Statements 1 January 2014Revised FRS 28 Investments in Associates and Joint Ventures 1 January 2014FRS 110 Consolidated Financial Statements 1 January 2014 FRS 111 Joint Arrangements 1 January 2014 FRS 112 Disclosure of Interests in Other Entities 1 January 2014 Amendments to FRS 32 Offsetting Financial Assets and Financial Liabilities 1 January 2014
NOTES TO THE FINANCIAL STATEMENTS (cont’d)For the year ended 31 December 2012
62
NOTES TO THE FINANCIAL STATEMENTS (cont’d)For the year ended 31 December 2012
2. Summary of signifi cant accounting policies (cont’d)
2.3 Standards issued but not yet effective (cont’d)
Except for the Amendments to FRS 1, FRS 111, Revised FRS 28 and FRS 112, the directors expect that the adoption of the other standards and interpretations above will have no material impact on the fi nancial statements in the period of initial application. The nature of the impending changes in accounting policy on adoption of the Amendments to FRS 1, FRS 111, Revised FRS 28 and FRS 112 are described below.
Amendments to FRS 1 Presentation of Items of Other Comprehensive Income
The Amendments to FRS 1 Presentation of Items of Other Comprehensive Income (“OCI”) is effective for fi nancial periods beginning on or after 1 July 2012.
The Amendments to FRS 1 changes the grouping of items presented in OCI. Items that could be reclassifi ed to profi t or loss at a future point in time would be presented separately from items which will never be reclassifi ed. As the Amendments only affect the presentations of items that are already recognised in OCI, the Group does not expect any impact on its fi nancial position or performance upon adoption of this standard.
FRS 111 Joint Arrangements and Revised FRS 28 Investments in Associates and Joint Ventures
FRS 111 Joint Arrangements and the Revised FRS 28 Investments in Associates and Joint Ventures are effective for fi nancial periods beginning on or after 1 January 2014.
FRS 111 classifi es joint arrangements either as joint operations or joint ventures. Joint operation is a joint arrangement whereby the parties that have rights to the assets and obligations for the liabilities whereas joint venture is a joint arrangement whereby the parties that have joint control of the arrangement have rights to the net assets of the arrangement.
FRS 111 requires the determination of joint arrangement’s classifi cation to be based on the parties’ rights and obligations under the arrangement, with the existence of a separate legal vehicle no longer being the key factor. FRS 111 disallows proportionate consolidation and requires joint ventures to be accounted for using the equity method. The revised FRS 28 was amended to describe the application of equity method to investments in joint ventures in addition to associates.
FRS 112 Disclosure of Interests in Other Entities
FRS 112 Disclosure of Interests in Other Entities is effective for fi nancial periods beginning on or after 1 January 2014.
FRS 112 is a new and comprehensive standard on disclosure requirements for all forms of interests in other entities, including joint arrangements, associates, special purpose vehicles and other off balance sheet vehicles. FRS 112 requires an entity to disclose information that helps users of its fi nancial statements to evaluate the nature and risks associated with its interests in other entities and the effects of those interests on its fi nancial statements. As this is a disclosure standard, it will have no impact to the fi nancial position and fi nancial performance of the Group when implemented in 2014.
63
Food Empire Holdings Limited Annual Report 2012

2. Summary of signifi cant accounting policies (cont’d)
2.4 Basis of consolidation and business combination
(a) Basis of consolidation
Business of consolidation from 1 January 2010
The consolidated fi nancial statements comprise the fi nancial statements of the Company and its subsidiaries as at the end of the reporting period. The fi nancial statements of the subsidiaries used in the preparation of the consolidated fi nancial statements are prepared for the same reporting date as the Company. Consistent accounting policies are applied to like transactions and events in similar circumstances.
All intra-group balances, income and expenses and unrealised gains and losses resulting from intra-group transactions and dividends are eliminated in full.
Subsidiaries are consolidated from the date of acquisition, being the date on which the Group obtains control, and continue to be consolidated until the date that such control ceases.
Losses within a subsidiary are attributed to the non-controlling interest even if that results in a defi cit balance.
A change in the ownership interest of a subsidiary, without a loss of control, is accounted for as an equity transaction. If the Group loses control over a subsidiary, it:
• De-recognises the assets (including goodwill) and liabilities of the subsidiary at their carrying amounts at the date when controls is lost;
• De-recognises the carrying amount of any non-controlling interest;
• De-recognises the cumulative translation differences recorded in equity;
• Recognises the fair value of the consideration received;
• Recognises the fair value of any investment retained;
• Recognises any surplus or defi cit in profi t or loss;
• Re-classifi es the Group’s share of components previously recognised in other comprehensive income to profi t or loss or retained earnings, as appropriate.
NOTES TO THE FINANCIAL STATEMENTS (cont’d)For the year ended 31 December 2012
64
2. Summary of signifi cant accounting policies (cont’d)
2.4 Basis of consolidation and business combination (cont’d)
(a) Basis of consolidation (cont’d)
Business of consolidation from 1 January 2010 (cont’d)
Certain of the above-mentioned requirements were applied on a prospective basis. The following differences, however, are carried forward in certain instances from the previous basis of consolidation:
• Acquisition of non-controlling interests, prior to 1 January 2010, were accounted for using the parent entity extension method, whereby, the difference between the consideration and the book value of the share of the net assets acquired were recognised in goodwill.
• Losses incurred by the Group were attributed to the non-controlling interest until the balance was reduced to nil. Any further losses were attributed to the Group, unless the non-controlling interest had a binding obligation to cover these. Losses prior to 1 January 2010 were not reallocated between non-controlling interest and the owners of the Company.
• Upon loss of control, the Group accounted for the investment retained at its proportionate share of net asset value at the date control was lost. The carrying value of such investments as at 1 January 2010 have not been restated.
(b) Business combinations
Business combinations from 1 January 2010
Business combinations are accounted for by applying the acquisition method. Identifi able assets acquired and liabilities assumed in a business combination are measured initially at their fair values at the acquisition date. Acquisition-related costs are recognised as expenses in the periods in which the costs are incurred and the services are received.
When the Group acquires a business, it assesses the fi nancial assets and liabilities assumed for appropriate classifi cation and designation in accordance with the contractual terms, economic circumstances and pertinent conditions as at the acquisition date. This includes the separation of embedded derivatives in host contracts by the acquiree.
Any contingent consideration to be transferred by the acquirer will be recognised at fair value at the acquisition date. Subsequent changes to the fair value of the contingent consideration which is deemed to be an asset or liability will be recognised in accordance with FRS 39 either in profi t or loss or as a change to other comprehensive income. If the contingent consideration is classifi ed as equity, it is not remeasured until it is fi nally settled within equity.
In business combinations achieved in stages, previously held equity interests in the acquiree are remeasured to fair value at the acquisition date and any corresponding gain or loss is recognised in profi t or loss.
The Group elects for each individual business combination, whether non-controlling interest in the acquiree (if any) is recognised on the acquisition date at fair value, or at the non-controlling interest’s proportionate share of the acquiree’s identifi able net assets.
NOTES TO THE FINANCIAL STATEMENTS (cont’d)For the year ended 31 December 2012
65
Food Empire Holdings Limited Annual Report 2012

2. Summary of signifi cant accounting policies (cont’d)
2.4 Basis of consolidation and business combination (cont’d)
(b) Business combinations (cont’d)
Business combinations from 1 January 2010 (cont’d)
Any excess of the sum of the fair value of the consideration transferred in the business combination, the amount of non-controlling interest in the acquiree (if any), and the fair value of the Group’s previously held equity interest in the acquiree (if any), over the net fair value of the acquiree’s identifi able assets and liabilities is recorded as goodwill. The accounting policy for goodwill is set out in Note 2.11(a). In instances where the latter amount exceeds the former, the excess is recognised as gain on bargain purchase in profi t or loss on the acquisition date.
Business combinations prior to 1 January 2010
In comparison to the above mentioned requirements, the following differences applied:
Business combinations are accounted for by applying the purchase method. Transaction costs directly attributable to the acquisition formed part of the acquisition costs. The non-controlling interest (formerly known as minority interest) was measured at the proportionate share of the acquiree’s identifi able net assets.
Business combinations achieved in stages were accounted for as separate steps. Adjustments to those fair values relating to previously held interests are treated as a revaluation and recognised in equity. Any additional acquired share of interest did not affect previously recognised goodwill.
When the Group acquired a business, embedded derivatives separated from the host contract by the acquiree are not reassessed on acquisition unless the business combination results in a change in the terms of the contract that signifi cantly modifi ed the cash fl ows that otherwise would have been required under the contract.
Contingent consideration was recognised if, and only if, the Group had a present obligation, the economic outfl ow was more likely than not and a reliable estimate was determinable. Subsequent adjustments to the contingent consideration were recognised as part of goodwill.
2.5 Transactions with non-controlling interests
Non-controlling interest represents the equity in subsidiaries not attributable, directly or indirectly, to owners of the Company, and are presented separately in the consolidated statement of comprehensive income and within equity in the consolidated balance sheet, separately from equity attributable to owners of the Company.
Changes in the Company’s ownership interest in a subsidiary that do not result in a loss of control are accounted for as equity transactions. In such circumstances, the carrying amounts of the controlling and non-controlling interests are adjusted to refl ect the changes in their relative interests in the subsidiary. Any difference between the amount by which the non-controlling interest is adjusted and the fair value of the consideration paid or received is recognised directly in equity and attributed to owners of the Company.
NOTES TO THE FINANCIAL STATEMENTS (cont’d)For the year ended 31 December 2012
66
2. Summary of signifi cant accounting policies (cont’d)
2.6 Foreign currency
The Group’s consolidated fi nancial statements are presented in United States Dollars. Each entity in the Group determines its own functional currency and items included in the fi nancial statements of each entity are measured using that functional currency.
(a) Transactions and balances
Transactions in foreign currencies are measured in the respective functional currencies of the Company and its subsidiaries and are recorded on initial recognition in the functional currencies at exchange rates approximating those ruling at the transaction dates. Monetary assets and liabilities denominated in foreign currencies are translated at the rate of exchange ruling at the balance sheet date. Non-monetary items that are measured in terms of historical cost in a foreign currency are translated using the exchange rates as at the dates of the initial transactions. Non-monetary items measured at fair value in a foreign currency are translated using the exchange rates at the date when the fair value was determined.
Exchange differences arising on the settlement of monetary items or on translating monetary items at the balance sheet date are recognised in profi t or loss except for exchange differences arising on monetary items that form part of the Group’s net investment in foreign operations, which are recognised initially in other comprehensive income and accumulated under foreign currency translation reserve in equity. The foreign currency translation reserve is reclassifi ed from equity to profi t or loss of the Group on disposal of the foreign operation.
(b) Consolidated fi nancial statements
For consolidation purpose, the assets and liabilities of foreign operations are translated into USD at the rate of exchange ruling at the balance sheet date and their profi t or loss are translated at the exchange rates prevailing at the date of the transactions. The exchange differences arising on the translation are recognised in other comprehensive income. On disposal of a foreign operation, the component of other comprehensive income relating to that particular foreign operation is recognised in profi t or loss.
In the case of a partial disposal without loss of control of a subsidiary that includes a foreign operation, the proportionate share of the cumulative amount of the exchange differences are re-attributed to non-controlling interest and are not recognised in profi t or loss. For partial disposals of associates or jointly controlled entities that are foreign operations, the proportionate share of the accumulated exchange differences is reclassifi ed to profi t or loss.
2.7 Subsidiaries
A subsidiary is an entity over which the Group has the power to govern the fi nancial and operating policies so as to obtain benefi ts from its activities. In the Company’s separate fi nancial statements, investments in subsidiaries are accounted for at cost less impairment losses.
NOTES TO THE FINANCIAL STATEMENTS (cont’d)For the year ended 31 December 2012
67
Food Empire Holdings Limited Annual Report 2012
2. Summary of signifi cant accounting policies (cont’d)
2.8 Associates
An associate is an entity, not being a subsidiary or a joint venture, in which the Group has signifi cant infl uence. An associate is equity accounted for from the date the Group obtains signifi cant infl uence until the date the Group ceases to have signifi cant infl uence over the associate. The Group’s investments in associates are accounted for using the equity method. Under the equity method, the investment in associates is carried in the balance sheet at cost plus post-acquisition changes in the Group’s share of net assets of the associates. Goodwill relating to associates is included in the carrying amount of the investment and is neither amortised nor tested individually for impairment. Any excess of the Group’s share of the net fair value of the associate’s identifi able assets, liabilities and contingent liabilities over the cost of the investment is included as income in the determination of the Group’s share of results of the associate in the period in which the investment is acquired. The profi t or loss refl ects the share of the results of operations of the associates. Where there has been a change recognised in other comprehensive income by the associates, the Group recognises its share of such changes in other comprehensive income. Unrealised gains and losses resulting from transactions between the Group and the associate are eliminated to the extent of the interest in the associates.
The Group’s share of the profi t or loss of its associates is the profi t attributable to equity holders of the associate and, therefore is the profi t or loss after tax and non-controlling interests in the subsidiaries of associates. When the Group’s share of losses in an associate equals or exceeds its interest in the associate, the Group does not recognise further losses, unless it has incurred obligations or made payments on behalf of the associate. After application of the equity method, the Group determines whether it is necessary to recognise an additional impairment loss on the Group’s investment in its associates. The Group determines at each balance sheet date whether there is any objective evidence that the investment in the associate is impaired. If this is the case, the Group calculates the amount of impairment as the difference between the recoverable amount of the associate and its carrying value and recognises the amount in the profi t or loss.
The fi nancial statements of the associates are prepared as of the same reporting date as the Company. Where necessary, adjustments are made to bring the accounting policies into line with those of the Group. Upon loss of signifi cant infl uence over the associate, the Group measures and recognises any retained investment at its fair value. Any difference between the carrying amount of the associate upon loss of signifi cant infl uence and the fair value of the aggregate of the retained investment and proceeds from disposal is recognised in profi t or loss.
2.9 Property, plant and equipment
All items of property, plant and equipment are initially recorded at cost. Subsequent to recognition, plant and equipment and furniture and fi xtures are measured at cost less accumulated depreciation and any accumulated impairment losses. The cost includes the cost of replacing part of the property, plant and equipment and borrowing costs that are directly attributable to the acquisition, construction or production of a qualifying property, plant and equipment. The accounting policy for borrowing costs is set out in Note 2.21. The cost of an item of property, plant and equipment is recognised as an asset if, and only if, it is probable that future economic benefi ts associated with the item will fl ow to the Group and the cost of the item can be measured reliably.
NOTES TO THE FINANCIAL STATEMENTS (cont’d)For the year ended 31 December 2012
68

2. Summary of signifi cant accounting policies (cont’d)
2.9 Property, plant and equipment (cont’d)
When signifi cant parts of property, plant and equipment are required to be replaced in intervals, the Group recognises such parts as individual assets with specifi c useful lives and depreciation, respectively. Likewise, when a major inspection is performed, its cost is recognised in the carrying amount of the plant and equipment as a replacement if the recognition criteria are satisfi ed. All other repair and maintenance costs are recognised in profi t or loss as incurred.
Freehold and leasehold properties are measured at fair value less accumulated depreciation on buildings and impairment losses recognised after the date of the revaluation. Valuations are performed with suffi cient regularity to ensure that the carrying amount does not differ materially from the fair value of the freehold and leasehold properties at the balance sheet date.
Any revaluation surplus is recognised in other comprehensive income and accumulated in equity under the asset revaluation reserve, except to the extent that it reverses a revaluation decrease of the same asset previously recognised in profi t or loss, in which case the increase is recognised in profi t or loss. A revaluation defi cit is recognised in profi t or loss, except to the extent that it offsets an existing surplus on the same asset carried in the asset revaluation reserve.
Any accumulated depreciation as at the revaluation date is eliminated against the gross carrying amount of the asset and the net amount is restated to the revalued amount of the asset. The revaluation surplus included in the asset revaluation reserve in respect of an asset is transferred directly to retained earnings on retirement or disposal of the asset. Freehold land has an unlimited useful life and therefore is not depreciated.
Depreciation is computed on a straight-line basis over the estimated useful lives of the assets as follows:
Freehold properties - 50 yearsLeasehold properties - Over the remaining term of leasePlant and machinery - 5 – 10 yearsFurniture and fi ttings and other equipment - 3 – 15 yearsFactory and offi ce equipment - 5 – 10 yearsComputers - 3 – 5 yearsMotor vehicles - 3 – 5 yearsForklifts - 10 yearsRenovation, air-conditioners, electrical installation and leasehold improvements - 5 – 10 years
Capital work-in-progress included in property, plant and equipment are not depreciated as these assets are not yet available for use.
The carrying values of property, plant and equipment are reviewed for impairment when events or changes in circumstances indicate that the carrying value may not be recoverable. The residual value, useful life and depreciation method are reviewed at each fi nancial year-end, and adjusted prospectively, if appropriate. An item of property, plant and equipment is derecognised upon disposal or when no future economic benefi ts are expected from its use or disposal. Any gain or loss on derecognition of the asset is included in profi t or loss in the year the asset is derecognised.
NOTES TO THE FINANCIAL STATEMENTS (cont’d)For the year ended 31 December 2012
69
Food Empire Holdings Limited Annual Report 2012
2. Summary of signifi cant accounting policies (cont’d)
2.10 Investment properties
Investment properties are properties that are owned by the Group in order to earn rentals or for capital appreciation, or both, rather than for use in the production or supply of goods or services, or for administrative purposes, or in the ordinary course of business. Investment properties comprise completed investment properties and properties that are being constructed or developed for future use as investment properties.
Investment properties are initially recorded at cost, including transaction costs. The carrying amount includes the cost of replacing part of an existing investment property at the time that cost is incurred if the recognition criteria are met.
Depreciation is calculated using straight-line method to allocate the depreciable amounts over the estimated useful lives of 50 years. The residual values, useful lives and depreciation method of investment properties are reviewed, and adjusted as appropriate, at each balance sheet date. The effects of any revision are included in profi t or loss when the changes arise. Investment properties are derecognised when either they have been disposed of or when the investment property is permanently withdrawn from use and no future economic benefi t is expected from its disposal. Any gain or loss on the retirement or disposal of an investment property is recognised in profi t or loss in the year of retirement or disposal. Transfers are made to or from investment property only when there is a change in use. For a transfer from investment property to owner-occupied property, the deemed cost for subsequent accounting is the fair value at the date of change in use. For a transfer from owner-occupied property to investment property, the property is accounted for in accordance with the accounting policy for property, plant and equipment set out in Note 2.9 up to the date of change in use.
2.11 Intangible assets
(a) Goodwill
Goodwill is initially measured at cost. Following initial recognition, goodwill is measured at cost less any accumulated impairment losses.
For the purpose of impairment testing, goodwill acquired in a business combination is, from the acquisition date, allocated to each of the Group’s cash-generating units that are expected to benefi t from the synergies of the combination, irrespective of whether other assets or liabilities of the acquiree are assigned to those units.
The cash-generating unit to which goodwill has been allocated is tested for impairment annually and whenever there is an indication that the cash-generating unit may be impaired. Impairment is determined for goodwill by assessing the recoverable amount of each cash-generating unit (or group of cash-generating units) to which the goodwill relates. Where the recoverable amount of the cash-generating unit is less than the carrying amount, an impairment loss is recognised in profi t or loss. Impairment losses recognised for goodwill are not reversed in subsequent periods.
Where goodwill forms part of a cash-generating unit and part of the operation within that cash-generating unit is disposed of, the goodwill associated with the operation disposed of is included in the carrying amount of the operation when determining the gain or loss on disposal of the operation. Goodwill disposed of in this circumstance is measured based on the relative fair values of the operations disposed of and the portion of the cash-generating unit retained.
NOTES TO THE FINANCIAL STATEMENTS (cont’d)For the year ended 31 December 2012
70

2. Summary of signifi cant accounting policies (cont’d)
2.11 Intangible assets (cont’d)
(a) Goodwill (cont’d)
Goodwill and fair value adjustments arising on the acquisition of foreign operation on or after 1 January 2005 are treated as assets and liabilities of the foreign operations and are recorded in the functional currency of the foreign operations and translated in accordance with the accounting policy set out in Note 2.6.
Goodwill and fair value adjustments which arose on acquisitions of foreign operation before 1 January 2005 are deemed to be assets and liabilities of the Company and are recorded in USD at the rates prevailing at the date of acquisition.
(b) Other intangible assets
Intangible assets acquired separately are measured initially at cost. The cost of intangible assets acquired in a business combination is their fair value as at the date of acquisition. Following initial acquisition, intangible assets are measured at cost less any accumulated amortisation and any accumulated impairment losses. Internally generated intangible assets, excluding capitalised development costs, are not capitalised and expenditure is refl ected in the profi t or loss in the year in which the expenditure is incurred.
The useful lives of the intangible assets are assessed as either fi nite or indefi nite.
Intangible assets with fi nite useful lives are amortised over the estimated useful lives and assessed for impairment whenever there is an indication that the intangible asset may be impaired. The amortisation period and the amortisation method are reviewed at least at each fi nancial year-end. Changes in the expected useful life or the expected pattern of consumption of future economic benefi ts embodied in the asset is accounted for by changing the amortisation period or method, as appropriate, and are treated as changes in accounting estimates. The amortisation expense on intangible assets with fi nite lives is recognised in profi t or loss in the expense category consistent with the function of the intangible asset.
Intangible assets with indefi nite useful lives or not yet available for use are tested for impairment annually, or more frequently if the events and circumstances indicate that the carrying value may be impaired either individually or at the cash-generating unit level. Such intangible assets are not amortised. The useful life of an intangible asset with an indefi nite useful life is reviewed annually to determine whether the useful life assessment continues to be supportable. If not, the change in useful life from indefi nite to fi nite is made on a prospective basis.
Gains or losses arising from derecognition of an intangible asset are measured as the difference between the net disposal proceeds and the carrying amount of the asset and are recognised in profi t or loss when the asset is derecognised.
Brand
The brand was acquired in a business combination. The useful life of the brand is estimated to be indefi nite because based on the current market share of the brand, management believes there is no foreseeable limit to the period over which the brand is expected to generate net cash infl ows for the Group.
NOTES TO THE FINANCIAL STATEMENTS (cont’d)For the year ended 31 December 2012
71
Food Empire Holdings Limited Annual Report 2012
2. Summary of signifi cant accounting policies (cont’d)
2.12 Financial assets
Initial recognition and measurement
Financial assets are recognised when, and only when, the Group becomes a party to the contractual provisions of the fi nancial instrument. The Group determines the classifi cation of its fi nancial assets at initial recognition.
When fi nancial assets are recognised initially, they are measured at fair value, plus, in the case of fi nancial assets not at fair value through profi t or loss, directly attributable transaction costs.
Subsequent measurement
The subsequent measurement of fi nancial assets depends on their classifi cation as follows:
(a) Financial assets at fair value through profi t or loss
Financial assets at fair value through profi t or loss include fi nancial assets held for trading and fi nancial assets designated upon initial recognition at fair value through profi t or loss. Financial assets are classifi ed as held for trading if they are acquired for the purpose of selling or repurchasing in the near term. This category includes derivative fi nancial instruments entered into by the Group that are not designated as hedging instruments in hedge relationships as defi ned by FRS 39. Derivatives, including separated embedded derivatives are also classifi ed as held for trading unless they are designated as effective hedging instruments.
The Group has not designated any fi nancial assets upon initial recognition at fair value through profi t or loss.
Subsequent to initial recognition, fi nancial assets at fair value through profi t or loss are measured at fair value. Any gains or losses arising from changes in fair value of the fi nancial assets are recognised in profi t or loss. Net gains or net losses on fi nancial assets at fair value through profi t or loss include exchange differences, interest and dividend income.
Derivatives embedded in host contracts are accounted for as separate derivatives and recorded at fair value if their economic characteristics and risks are not closely related to those of the host contracts and the host contracts are not held for trading or designated at fair value through profi t or loss. These embedded derivatives are measured at fair value with changes in fair value recognised in profi t or loss. Reassessment only occurs if there is a change in the terms of the contract that signifi cantly modifi es the cash fl ows that would otherwise be required.
(b) Loans and receivables
Non-derivative fi nancial assets with fi xed or determinable payments that are not quoted in an active market are classifi ed as loans and receivables. Subsequent to initial recognition, loans and receivables are measured at amortised cost using the effective interest method, less impairment. Gains and losses are recognised in profi t or loss when the loans and receivables are derecognised or impaired, and through the amortisation process.
NOTES TO THE FINANCIAL STATEMENTS (cont’d)For the year ended 31 December 2012
72
2. Summary of signifi cant accounting policies (cont’d)
2.12 Financial assets (cont’d)
(c) Held-to-maturity investments
Non-derivative fi nancial assets with fi xed or determinable payments and fi xed maturity are classifi ed as held-to-maturity when the Group has the positive intention and ability to hold the investment to maturity. Subsequent to initial recognition, held-to-maturity investments are measured at amortised cost using the effective interest method, less impairment. Gains and losses are recognised in profi t or loss when the held-to-maturity investments are derecognised or impaired, and through the amortisation process.
(d) Available-for-sale fi nancial assets
Available-for-sale fi nancial assets include equity and debt securities. Equity investments classifi ed as available-for-sale are those, which are neither classifi ed as held for trading nor designated at fair value through profi t or loss. Debt securities in this category are those which are intended to be held for an indefi nite period of time and which may be sold in response to needs for liquidity or in response to changes in the market conditions.
After initial recognition, available-for-sale fi nancial assets are subsequently measured at fair value. Any gains or losses from changes in fair value of the fi nancial asset are recognised in other comprehensive income, except that impairment losses, foreign exchange gains and losses on monetary instruments and interest calculated using the effective interest method are recognised in profi t or loss. The cumulative gain or loss previously recognised in other comprehensive income is reclassifi ed from equity to profi t or loss as a reclassifi cation adjustment when the fi nancial asset is derecognised.
Investments in equity instruments whose fair value cannot be reliably measured are measured at cost less impairment loss.
Derecognition
A fi nancial asset is derecognised where the contractual right to receive cash fl ows from the asset has expired. On derecognition of a fi nancial asset in its entirety, the difference between the carrying amount and the sum of the consideration received and any cumulative gain or loss that had been recognised in other comprehensive income is recognised in profi t or loss.
All regular way purchases and sales of fi nancial assets are recognised or derecognised on the trade date i.e., the date that the Group commits to purchase or sell the asset. Regular way purchases or sales are purchases or sales of fi nancial assets that require delivery of assets within the period generally established by regulation or convention in the marketplace concerned.
NOTES TO THE FINANCIAL STATEMENTS (cont’d)For the year ended 31 December 2012
73
Food Empire Holdings Limited Annual Report 2012

2. Summary of signifi cant accounting policies (cont’d)
2.13 Impairment of non-fi nancial assets
The Group assesses at each reporting date whether there is an indication that an asset may be impaired. If any indication exists, or when an annual impairment assessment for an asset is required, the Group makes an estimate of the asset’s recoverable amount. An asset’s recoverable amount is the higher of an asset’s or cash-generating unit’s fair value less costs to sell and its value in use and is determined for an individual asset, unless the asset does not generate cash infl ows that are largely independent of those from other assets or group of assets. Where the carrying amount of an asset or cash-generating unit exceeds its recoverable amount, the asset is considered impaired and is written down to its recoverable amount. In assessing value in use, the estimated future cash fl ows expected to be generated by the asset are discounted to their present value using a pre-tax discount rate that refl ects current market assessments of the time value of money and the risks specifi c to the asset. In determining fair value less costs to sell, recent market transactions are taken into account, if available. If no such transactions can be identifi ed, an appropriate valuation model is used. These calculations are corroborated by valuation multiples or other available fair value indicators. The Group bases its impairment calculation on detailed budgets and forecast calculations which are prepared separately for each of the Group’s cash-generating units to which the individual assets are allocated. These budgets and forecast calculations are generally covering a period of fi ve years. For longer periods, a long-term growth rate is calculated and applied to project future cash fl ows after the fi fth year. Impairment losses of continuing operations are recognised in profi t or loss in those expense categories consistent with the function of the impaired asset, except for assets that are previously revalued where the revaluation was taken to other comprehensive income. In this case, the impairment is also recognised in other comprehensive income up to the amount of any previous revaluation.
For assets excluding goodwill, an assessment is made at each reporting date as to whether there is any indication that previously recognised impairment losses may no longer exist or may have decreased. If such indication exists, the Group estimates the asset’s or cash-generating unit’s recoverable amount. A previously recognised impairment loss is reversed only if there has been a change in the estimates used to determine the asset’s recoverable amount since the last impairment loss was recognised. If that is the case, the carrying amount of the asset is increased to its recoverable amount. That increase cannot exceed the carrying amount that would have been determined, net of depreciation, had no impairment loss been recognised previously. Such reversal is recognised in profi t or loss unless the asset is measured at revalued amount, in which case the reversal is treated as a revaluation increase.
2.14 Impairment of fi nancial assets
The Group assesses at each balance sheet date whether there is any objective evidence that a fi nancial asset is impaired. (a) Financial assets carried at amortised cost
For fi nancial assets carried at amortised cost, the Group fi rst assesses whether objective evidence of impairment exists individually for fi nancial assets that are individually signifi cant, or collectively for fi nancial assets that are not individually signifi cant. If the Group determines that no objective evidence of impairment exists for an individually assessed fi nancial asset, whether signifi cant or not, it includes the asset in a group of fi nancial assets with similar credit risk characteristics and collectively assesses them for impairment. Assets that are individually assessed for impairment and for which an impairment loss is, or continues to be recognised are not included in a collective assessment of impairment.
NOTES TO THE FINANCIAL STATEMENTS (cont’d)For the year ended 31 December 2012
74

2. Summary of signifi cant accounting policies (cont’d)
2.14 Impairment of fi nancial assets (cont’d)
(a) Financial assets carried at amortised cost (cont’d)
If there is objective evidence that an impairment loss on fi nancial assets carried at amortised cost has incurred, the amount of the loss is measured as the difference between the asset’s carrying amount and the present value of estimated future cash fl ows discounted at the fi nancial asset’s original effective interest rate. If a loan has a variable interest rate, the discount rate for measuring any impairment loss is the current effective interest rate. The carrying amount of the asset is reduced through the use of an allowance account. The impairment loss is recognised in the profi t or loss. When the asset becomes uncollectible, the carrying amount of impaired fi nancial assets is reduced directly or if an amount was charged to the allowance account, the amounts charged to the allowance account are written off against the carrying value of the fi nancial asset.
To determine whether there is objective evidence that an impairment loss on fi nancial assets has been incurred, the Group considers factors such as the probability of insolvency or signifi cant fi nancial diffi culties of the debtor and default or signifi cant delay in payments. If in a subsequent period, the amount of the impairment loss decreases and the decrease can be related objectively to an event occurring after the impairment was recognised, the previously recognised impairment loss is reversed to the extent that the carrying amount of the asset does not exceed its amortised cost at the reversal date. The amount of reversal is recognised in profi t or loss.
(b) Financial assets carried at cost
If there is objective evidence (such as signifi cant adverse changes in the business environment where the issuer operates, probability of insolvency or signifi cant fi nancial diffi culties of the issuer) that an impairment loss on fi nancial assets carried at cost has been incurred, the amount of the loss is measured as the difference between the asset’s carrying amount and the present value of estimated future cash fl ows discounted at the current market rate of return for a similar fi nancial asset. Such impairment losses are not reversed in subsequent periods.
(c) Available-for-sale fi nancial assets
In the case of equity investments classifi ed as available-for-sale, objective evidence of impairment include (i) signifi cant fi nancial diffi culty of the issuer or obligor, (ii) information about signifi cant changes with an adverse effect that have taken place in the technological, market, economic or legal environment in which the issuer operates, and indicates that the cost of the investment in equity instrument may not be recovered; and (iii) a signifi cant or prolonged decline in the fair value of the investment below its costs. ‘Signifi cant’ is to be evaluated against the original cost of the investment and ‘prolonged’ against the period in which the fair value has been below its original cost.
If an available-for-sale fi nancial asset is impaired, an amount comprising the difference between its acquisition cost (net of any principal repayment and amortisation) and its current fair value, less any impairment loss previously recognised in profi t or loss, is transferred from other comprehensive income and recognised in profi t or loss. Reversals of impairment losses in respect of equity instruments are not recognised in profi t or loss; increase in their fair value after impairment are recognised directly in other comprehensive income.
NOTES TO THE FINANCIAL STATEMENTS (cont’d)For the year ended 31 December 2012
75
Food Empire Holdings Limited Annual Report 2012
2. Summary of signifi cant accounting policies (cont’d)
2.14 Impairment of fi nancial assets (cont’d)
(c) Available-for-sale fi nancial assets (cont’d)
In the case of debt instruments classifi ed as available-for-sale, impairment is assessed based on the same criteria as fi nancial assets carried at amortised cost. However, the amount recorded for impairment is the cumulative loss measured as the difference between the amortised cost and the current fair value, less any impairment loss on that investment previously recognised in profi t or loss. Future interest income continues to be accrued based on the reduced carrying amount of the asset, using the rate of interest used to discount the future cash fl ows for the purpose of measuring the impairment loss. The interest income is recorded as part of fi nance income. If, in a subsequent year, the fair value of a debt instrument increases and the increases can be objectively related to an event occurring after the impairment loss was recognised in profi t or loss, the impairment loss is reversed in profi t or loss.
2.15 Cash and cash equivalents
Cash and cash equivalents comprise cash on hand and cash with banks or fi nancial institutions, including fi xed deposits and short-term, highly liquid investments that are readily convertible to known amount of cash and which are subject to an insignifi cant risk of changes in value. These also include bank overdrafts that form an integral part of the Group’s cash management.
2.16 Inventories
Inventories are stated at the lower of cost and net realisable value. Costs incurred in bringing the inventories to their present location and condition are accounted for as follows:
• Raw materials: costs of direct materials and goods purchased for resale are stated on a weighted average basis• Finished goods and work-in-progress: costs of direct materials and labour and a proportion of manufacturing overheads based
on normal operating capacity. These costs are assigned on a weighted average basis.
Where necessary, allowance is provided for damaged, obsolete and slow moving items to adjust the carrying value of inventories to the lower of cost and net realisable value.
Net realisable value is the estimated selling price in the ordinary course of business, less estimated costs of completion and the estimated costs necessary to make the sale.
2.17 Provisions
General
Provisions are recognised when the Group has a present obligation (legal or constructive) as a result of a past event, it is probable that an outfl ow of resources embodying economic benefi ts will be required to settle the obligation and the amount of the obligation can be estimated reliably.
Provisions are reviewed at each balance sheet date and adjusted to refl ect the current best estimate. If it is no longer probable that an outfl ow of economic resources will be required to settle the obligation, the provision is reversed. If the effect of the time value of money is material, provisions are discounted using a current pre-tax rate that refl ects, where appropriate, the risks specifi c to the liability. When discounting is used, the increase in the provision due to the passage of time is recognised as a fi nance cost.
NOTES TO THE FINANCIAL STATEMENTS (cont’d)For the year ended 31 December 2012
76

2. Summary of signifi cant accounting policies (cont’d)
2.18 Government grants
Government grants shall be recognised in profi t or loss on a systematic basis over the periods in which the entity recognises as expenses, the related costs for which the grants are intended to compensate. Grants related to income may be presented as a credit in profi t or loss under other income.
2.19 Financial liabilities
Initial recognition and measurement
Financial liabilities are recognised when, and only when, the Group becomes a party to the contractual provisions of the fi nancial instrument. The Group determines the classifi cation of its fi nancial liabilities at initial recognition.
All fi nancial liabilities are recognised initially at fair value, plus, in the case of fi nancial liabilities not at fair value through profi t or loss, directly attributable transaction costs. Subsequent measurement
The measurement of fi nancial liabilities depends on their classifi cation as follows: (a) Financial liabilities at fair value through profi t or loss
Financial liabilities at fair value through profi t or loss includes fi nancial liabilities held for trading and fi nancial liabilities designated upon initial recognition as at fair value through profi t or loss. Financial liabilities are classifi ed as held for trading if they are acquired for the purpose of selling in the near term. This category includes derivative fi nancial instruments entered into by the Group that are not designated as hedging instruments in hedge relationships. Separated embedded derivatives are also classifi ed as held for trading unless they are designated as effective hedging instruments.
Subsequent to initial recognition, fi nancial liabilities at fair value through profi t or loss are measured at fair value. Any gains or losses arising from changes in fair value of the fi nancial liabilities are recognised in profi t or loss.
The Group has not designated any fi nancial liabilities upon initial recognition at fair value through profi t or loss.
(b) Other fi nancial liabilities
After initial recognition, other fi nancial liabilities are subsequently measured at amortised cost using the effective interest rate method. Gains and losses are recognised in profi t or loss when the liabilities are derecognised, and through the amortisation process.
Derecognition
A fi nancial liability is derecognised when the obligation under the liability is discharged or cancelled or expires. When an existing fi nancial liability is replaced by another from the same lender on substantially different terms, or the terms of an existing liability are substantially modifi ed, such an exchange or modifi cation is treated as a derecognition of the original liability and the recognition of a new liability, and the difference in the respective carrying amounts is recognised in profi t or loss.
NOTES TO THE FINANCIAL STATEMENTS (cont’d)For the year ended 31 December 2012
77
Food Empire Holdings Limited Annual Report 2012
2. Summary of signifi cant accounting policies (cont’d)
2.20 Financial guarantee
A fi nancial guarantee contract is a contract that requires the issuer to make specifi ed payments to reimburse the holder for a loss it incurs because a specifi ed debtor fails to make payment when due in accordance with the terms of a debt instrument. Financial guarantees are recognised initially as a liability at fair value, adjusted for transaction costs that are directly attributable to the issuance of the guarantee. Subsequent to initial recognition, fi nancial guarantees are recognised as income in profi t or loss over the period of the guarantee. If it is probable that the liability will be higher than the amount initially recognised less amortisation, the liability is recorded at the higher amount with the difference charged to profi t or loss.
2.21 Borrowing costs
Borrowing costs are capitalised as part of the cost of a qualifying asset if they are directly attributable to the acquisition, construction or production of that asset. Capitalisation of borrowing costs commences when the activities to prepare the asset for its intended use or sale are in progress and the expenditures and borrowing costs are incurred. Borrowing costs are capitalised until the assets are substantially completed for their intended use or sale. All other borrowing costs are expensed in the period they occur. Borrowing costs consist of interest and other costs that an entity incurs in connection with the borrowing of funds.
2.22 Leases
The determination of whether an arrangement is, or contains a lease is based on the substance of the arrangement at inception date: whether fulfi llment of the arrangement is dependent on the use of a specifi c asset or assets or the arrangement conveys a right to use the asset, even if that right is not explicitly specifi ed in an arrangement. For arrangements entered into prior to 1 January 2005, the date of inception is deemed to be 1 January 2005 in accordance with the transitional requirements of INT FRS 104.
(a) As lessee
Finance leases which transfer to the Group substantially all the risks and rewards incidental to ownership of the leased item, are capitalised at the inception of the lease at the fair value of the leased asset or, if lower, at the present value of the minimum lease payments. Any initial direct costs are also added to the amount capitalised. Lease payments are apportioned between the fi nance charges and reduction of the lease liability so as to achieve a constant rate of interest on the remaining balance of the liability. Finance charges are charged to profi t or loss. Contingent rents, if any, are charged as expenses in the periods in which they are incurred. Capitalised leased assets are depreciated over the shorter of the estimated useful life of the asset and the lease term, if there is no reasonable certainty that the Group will obtain ownership by the end of the lease term. Operating lease payments are recognised as an expense in profi t or loss on a straight-line basis over the lease term. The aggregate benefi t of incentives provided by the lessor is recognised as a reduction of rental expense over the lease term on a straight-line basis.
NOTES TO THE FINANCIAL STATEMENTS (cont’d)For the year ended 31 December 2012
78

2. Summary of signifi cant accounting policies (cont’d)
2.22 Leases (cont’d)
(b) As lessor
Leases where the Group retains substantially all the risks and rewards of ownership of the asset are classifi ed as operating leases. Initial direct costs incurred in negotiating an operating lease are added to the carrying amount of the leased asset and recognised over the lease term on the same bases as rental income. The accounting policy for rental income is set out in Note 2.24 (b). Contingent rents are recognised as revenue in the period in which they are earned.
2.23 Non-current assets held for sale
Non-current assets and disposal groups classifi ed as held for sale are measured at the lower of their carrying amount and fair value less costs to sell. Non-current assets and disposal groups are classifi ed as held for sale if their carrying amounts will be recovered principally through a sale transaction rather than through continuing use. This condition is regarded as met only when the sale is highly probable and the asset or disposal group is available for immediate sale in its present condition. Management must be committed to the sale, which should be expected to qualify for recognition as a completed sale within one year from the date of classifi cation. Property, plant and equipment and intangible assets once classifi ed as held for sale are not depreciated or amortised.
2.24 Revenue
Revenue is recognised to the extent that it is probable that the economic benefi ts will fl ow to the Group and the revenue can be reliably measured, regardless of when the payment is made. Revenue is measured at the fair value of consideration received or receivable, taking into account contractually defi ned terms of payment and excluding taxes or duty. The Group assesses its revenue arrangements to determine if it is acting as principal or agent. The Group has concluded that it is acting as a principal in all of its revenue arrangements. The following specifi c recognition criteria must also be met before revenue is recognised:
(a) Sale of goods
Revenue from sale of goods is recognised upon the transfer of signifi cant risks and rewards of ownership of the goods to the customer, usually on delivery of goods. Revenue is not recognised to the extent where there are signifi cant uncertainties regarding recovery of the consideration due, associated costs or the possible return of goods.
(b) Rental income
Rental income arising from operating leases in investment properties is accounted for on a time apportionment basis over the lease terms. The aggregate costs of incentives provided to lessees are recognised as a reduction of rental income over the lease term on a straight-line basis.
(c) Dividend income
Dividend income is recognised when the Group’s right to receive the payment is established.
NOTES TO THE FINANCIAL STATEMENTS (cont’d)For the year ended 31 December 2012
79
Food Empire Holdings Limited Annual Report 2012
2. Summary of signifi cant accounting policies (cont’d)
2.24 Revenue (cont’d)
(d) Interest income
Interest income is recognised using the effective interest method.
(e) Royalty income
Royalty income is recognised on an accrual basis in accordance with the substance of the relevant agreements.
(f) Marketing service income
Marketing service income is recognised when services are rendered.
(g) Packaging service income
Packaging service income is recognised when services are rendered.
2.25 Finance costs
Interest expenses and similar charges are recognised as expenses in the period in which they are incurred.
2.26 Employee benefi ts
(a) Defi ned contribution plans
The Group participates in the national pension schemes as defi ned by the laws of the countries in which it has operations. In particular, the Singapore companies in the Group make contributions to the Central Provident Fund scheme in Singapore, a defi ned contribution pension scheme. Contributions to defi ned contribution pension schemes are recognised as an expense in the period in which the related service is performed.
(b) Employee leave entitlement
Employee entitlements to annual leave are recognised as a liability when they accrue to the employees. The estimated liability for leave is recognised for services rendered by employees up to the balance sheet date.
NOTES TO THE FINANCIAL STATEMENTS (cont’d)For the year ended 31 December 2012
80

2. Summary of signifi cant accounting policies (cont’d)
2.26 Employee benefi ts (cont’d)
(c) Employee equity compensation benefi ts Employee share option plans
Employees (including senior executives and Directors) of the Group receive remuneration in the form of share options as consideration for services rendered (‘equity-settled share based payment transactions’). The cost of these equity-settled share based payment transactions with employees is measured by reference to the fair value of the options at the date on which the options are granted which takes into account market condition and non-vesting conditions. This cost is recognised in profi t or loss, with a corresponding increase in the share-based payment reserve, over the vesting period. The cumulative expense recognised at each balance sheet date until the vesting date refl ects the extent to which the vesting period has expired and the Group’s best estimate of the number of options that will ultimately vest. The charge or credit to profi t or loss for a period represents the movement in cumulative expense recognised as at the beginning and end of that period and is recognised in employee benefi ts expense. No expense is recognised for options that do not ultimately vest, except for options where vesting is conditional upon a market or non-vesting condition, which are treated as vested irrespective of whether or not the market condition is satisfi ed, provided that all other performance and/or service conditions are satisfi ed. In the case where the option does not vest as the result of a failure to meet a non-vesting condition that is within the control of the Group or the employee, it is accounted for as a cancellation. In such case, the amount of the compensation cost that otherwise would be recognised over the remainder of the vesting period is recognised immediately in profi t or loss upon cancellation. The share-based payment reserve is transferred to retained earnings upon expiry of the share options.
2.27 Taxes
(a) Current income tax
Current income tax assets and liabilities for the current and prior periods are measured at the amount expected to be recovered from or paid to the taxation authorities. The tax rates and tax laws used to compute the amount are those that are enacted or substantively enacted by the balance sheet date, in the countries where the Group operates and generates taxable income.
Current income taxes are recognised in profi t or loss except to the extent that the tax relates to items recognised outside profi t or loss, either in other comprehensive income or directly in equity. Management periodically evaluates positions taken in the tax returns with respect to situations in which applicable tax regulations are subject to interpretation and establishes provisions where appropriate.
NOTES TO THE FINANCIAL STATEMENTS (cont’d)For the year ended 31 December 2012
81
Food Empire Holdings Limited Annual Report 2012
2. Summary of signifi cant accounting policies (cont’d) 2.27 Taxes (cont’d)
(b) Deferred tax
Deferred income tax is provided using the liability method on temporary differences at the balance sheet date between the tax bases of assets and liabilities and their carrying amounts for fi nancial reporting purposes.
Deferred tax liabilities are recognised for all temporary differences, except:
• where the deferred tax liability arises from the initial recognition of goodwill or of an asset or liability in a transaction that is not a business combination and, at the time of the transaction, affects neither the accounting profi t nor taxable profi t or loss; and
• in respect of taxable temporary differences associated with investments in subsidiaries, associates and interests in joint ventures, where the timing of the reversal of the temporary differences can be controlled and it is probable that the temporary differences will not reverse in the foreseeable future.
Deferred tax assets are recognised for all deductible temporary differences, carry forward of unused tax credits and unused tax losses, to the extent that it is probable that taxable profi t will be available against which the deductible temporary differences, and the carry forward of unused tax credits and unused tax losses can be utilised except:
• where the deferred tax asset relating to the deductible temporary difference arises from the initial recognition of an asset or liability in a transaction that is not a business combination and, at the time of the transaction, affects neither the accounting profi t nor taxable profi t or loss; and
• in respect of deductible temporary differences associated with investments in subsidiaries, associates and interests in joint ventures, deferred tax assets are recognised only to the extent that it is probable that the temporary differences will reverse in the foreseeable future and taxable profi t will be available against which the temporary differences can be utilised.
The carrying amount of deferred tax assets is reviewed at each balance sheet date and reduced to the extent that it is no longer probable that suffi cient taxable profi t will be available to allow all or part of the deferred tax asset to be utilised. Unrecognised deferred tax assets are reassessed at each balance sheet date and are recognised to the extent that it has become probable that future taxable profi t will allow the deferred tax asset to be recovered.
Deferred tax assets and liabilities are measured at the tax rates that are expected to apply to the year when the asset is realised or the liability is settled, based on tax rates and tax laws that have been enacted or substantively enacted at the balance sheet date.
Deferred tax relating to items recognised outside profi t or loss is recognised outside profi t or loss. Deferred tax items are recognised in correlation to the underlying transaction either in other comprehensive income or directly in equity and deferred tax arising from a business combination is adjusted against goodwill on acquisition.
NOTES TO THE FINANCIAL STATEMENTS (cont’d)For the year ended 31 December 2012
82

2. Summary of signifi cant accounting policies (cont’d)
2.27 Taxes (cont’d)
(b) Deferred tax (cont’d)
Deferred tax assets and deferred tax liabilities are offset, if a legally enforceable right exists to set off current income tax assets against current income tax liabilities and the deferred taxes relate to the same taxable entity and the same taxation authority.
Tax benefi ts acquired as part of a business combination, but not satisfying the criteria for separate recognition at that date, would be recognised subsequently if new information about facts and circumstances changed. The adjustment would either be treated as a reduction to goodwill (as long as it does not exceed goodwill) if it incurred during the measurement period or in profi t or loss.
(c) Sales tax
Revenues, expenses and assets are recognised net of the amount of sales tax except:
• where the sales tax incurred on a purchase of assets or services is not recoverable from the taxation authority, in which case the sales tax is recognised as part of the cost of acquisition of the asset or as part of the expense item as applicable; and
• receivables and payables that are stated with the amount of sales tax included.
The net amount of sales tax recoverable from, or payable to, the taxation authority is included as part of receivables or payables in the balance sheet.
2.28 Segment reporting
For management purposes, the Group is organised into operating segments based on their products and services which are independently managed by the respective segment managers responsible for the performance of the respective segments under their charge. The segment managers report directly to the management of the Company who regularly review the segment results in order to allocate resources to the segments and to assess the segment performance. Additional disclosures on each of these segments are shown in Note 33, including the factors used to identify the reportable segments and the measurement basis of segment information.
2.29 Share capital and share issue expenses
Proceeds from issuance of ordinary shares are recognised as share capital in equity. Incremental costs directly attributable to the issuance of ordinary shares are deducted against share capital.
2.30 Treasury shares
The Group’s own equity instruments, which are reacquired (treasury shares) are recognised at costs and deducted from equity. No gain or loss is recognised in profi t or loss on the purchase, sale, issue or cancellation of the Group’s own equity instruments. Any difference between the carrying amount of treasury shares and the consideration received, if reissued, is recognised directly in equity. Voting rights related to treasury shares are nullifi ed for the Group and no dividends are allocated to them respectively.
NOTES TO THE FINANCIAL STATEMENTS (cont’d)For the year ended 31 December 2012
83
Food Empire Holdings Limited Annual Report 2012

2. Summary of signifi cant accounting policies (cont’d)
2.31 Contingencies
A contingent liability is:
(a) a possible obligation that arises from past events and whose existence will be confi rmed only by the occurrence or non-occurrence of one or more uncertain future events not wholly within the control of the Group; or
(b) a present obligation that arises from past events but is not recognised because:
(i) it is not probable that an outfl ow of resources embodying economic benefi ts will be required to settle the obligation; or
(ii) the amount of the obligation cannot be measured with suffi cient reliability.
A contingent asset is a possible asset that arises from past events and whose existence will be confi rmed only by the occurrence or non-occurrence of one or more uncertain future events not wholly within the control of the Group.
Contingent liabilities and assets are not recognised on the balance sheet of the Group, except for contingent liabilities assumed in a business combination that are present obligations and which the fair values can be reliably determined.
2.32 Related parties
A related party is defi ned as follows:
(a) A person or a close member of that person’s family is related to the Group and Company if that person:
(i) has control or joint control over the Company;
(ii) has signifi cant infl uence over the Company; or
(iii) is a member of the key management personnel of the Group or Company or of a parent of the Company.
(b) An entity is related to the Group and the Company if any of the following conditions applies:
(i) the entity and the Company are members of the same group (which means that each parent, subsidiary and fellow subsidiary is related to the others);
(ii) one entity is an associate or joint venture of the other entity (or an associate or joint venture of a member of a group of which the other entity is a member);
(iii) both entities are joint ventures of the same third party;
NOTES TO THE FINANCIAL STATEMENTS (cont’d)For the year ended 31 December 2012
84
2. Summary of signifi cant accounting policies (cont’d)
2.32 Related parties (cont’d)
(iv) one entity is a joint venture of a third entity and the other entity is an associate of the third entity;
(v) the entity is a post-employment benefi t plan for the benefi t of employees of either the Company or an entity related to the Company. If the Company is itself such a plan, the sponsoring employers are also related to the Company;
(vi) the entity is controlled or jointly controlled by a person identifi ed in (a);
(vii) a person identifi ed in (a) (i) has signifi cant infl uence over the entity or is a member of the key management personnel of the entity (or of a parent of the entity).
3. Signifi cant accounting estimates and judgments
The preparation of the Group’s consolidated fi nancial statements requires management to make judgments, estimates and assumptions that affect the reported amounts of revenues, expenses, assets and liabilities, and the disclosure of contingent liabilities at the balance sheet date. However, uncertainty about these assumptions and estimates could result in outcomes that could require a material adjustment to the carrying amount of the asset or liability affected in the future periods.
3.1 Judgments made in applying accounting policies
In the process of applying the Group’s accounting policies, management has made the following judgments, apart from those involving estimations, which has the most signifi cant effect on the amounts recognised in the fi nancial statements:
(a) Operating lease commitments – as lessor
The Group has entered into commercial property leases on its investment properties. The Group has determined, based on an evaluation of the terms and conditions of the arrangements, that it retains all the signifi cant risks and rewards of ownership of these properties and so accounts for the contracts as operating leases.
(b) Determination of functional currency
The Group measures foreign currency transactions in the respective functional currencies of the Company and its subsidiaries. In determining the functional currencies of the entities in the Group, judgment is required to determine the currency that mainly infl uences sales prices for goods and services and of the country whose competitive forces and regulations mainly determines the sales prices of its goods and services. The functional currencies of the entities in the Group are determined based on management’s assessment of the economic environment in which the entities operate and the entities’ process of determining sales prices.
NOTES TO THE FINANCIAL STATEMENTS (cont’d)For the year ended 31 December 2012
85
Food Empire Holdings Limited Annual Report 2012
3. Signifi cant accounting estimates and judgments (cont’d)
3.2 Key sources of estimation uncertainty
The key assumptions concerning the future and other key sources of estimation uncertainty at the balance sheet date, that have a signifi cant risk of causing a material adjustment to the carrying amounts of assets and liabilities within the next fi nancial year are discussed below. The Group based its assumptions and estimates on parameters available when the fi nancial statements were prepared. Existing circumstances and assumptions about future developments, however, may change due to market changes or circumstances arising beyond the control of the Group. Such changes are refl ected in the assumptions when they occur.
(a) Impairment of goodwill and brand
An impairment exists when the carrying value of an asset or cash-generating unit exceeds its recoverable amount, which is the higher of its fair value less costs to sell and its value in use. The fair value less costs to sell calculation is based on available data from binding sales transactions in an arm’s length transaction of similar assets or observable market prices less incremental costs for disposing the asset. The value in use calculation is based on a discounted cash fl ow model. The cash fl ows are derived from the budget for the next fi ve years and do not include restructuring activities that the Group is not yet committed to or signifi cant future investments that will enhance the asset’s performance of the cash-generating unit being tested. The recoverable amount is most sensitive to the discount rate used for the discounted cash fl ow model as well as the expected future cash infl ows and the growth rate used for extrapolation purposes. Further details of the key assumptions applied in the impairment assessment of goodwill and brands, are given in Note 17 to the fi nancial statements.
(b) Depreciation of property, plant and equipment and investment properties
The costs of property, plant and equipment and investment properties are depreciated on a straight-line basis over their estimated useful lives. Management estimates the useful lives of these property, plant and equipment and investment properties to be within 3 to 50 years. Changes in the expected level of usage and technological developments could impact the economic useful lives and the residual values of these assets, therefore future depreciation charges could be revised. The carrying amount of the Group’s property, plant and equipment and investment properties at the balance sheet date are disclosed in Note 12 and Note 13 to the fi nancial statements respectively.
(c) Income taxes
The Group has exposure to income taxes in numerous jurisdictions. Signifi cant judgment is involved in determining the Group-wide provision for income taxes. There are certain transactions and computations for which the ultimate tax determination is uncertain during the ordinary course of business. The Group recognises liabilities for expected tax issues based on estimates of whether additional taxes will be due. Where the fi nal tax outcome of these matters is different from the amounts that were initially recognised, such differences will impact the income tax and deferred tax provisions in the period in which such determination is made.
The carrying amount of the Group’s tax payables and deferred tax liabilities as at 31 December 2012 were US$394,000 (2011: US$1,662,000) and US$473,000 (2011: US$364,000) respectively.
NOTES TO THE FINANCIAL STATEMENTS (cont’d)For the year ended 31 December 2012
86

3. Signifi cant accounting estimates and judgments (cont’d)
3.2 Key sources of estimation uncertainty (cont’d)
(d) Employee share options
The Group measures the cost of equity-settled transactions with employees by reference to the fair value of the equity instruments at the date at which they are granted. Estimating fair value for share-based payment transactions requires determining the most appropriate valuation model, which is dependent on the terms and conditions of the grant. This estimate also requires determining the most appropriate inputs to the valuation model including the expected life of the share option, volatility and dividend yield and making assumptions about them. The assumptions and models used for estimating fair value for share-based payment transactions are disclosed in Note 32.
(e) Fair value of fi nancial instruments
Where the fair values of fi nancial instruments recorded on the balance sheet cannot be derived from active markets, they are determined using valuation techniques including the discounted cash fl ow model. The inputs to these models are derived from observable market data where possible, but where this is not feasible, a degree of judgment is required in establishing fair values. The judgments include considerations of liquidity and model inputs regarding the future fi nancial performance of the investee, its risk profi le, and economic assumptions regarding the industry and geographical jurisdiction in which the investee operates. Changes in assumptions about these factors could affect the reported fair value of fi nancial instruments. The valuation of fi nancial instruments is described in more detail in Note 36.
(f) Impairment of trade receivables
The Group assesses at the balance sheet date whether there is any objective evidence that trade receivables are impaired. To determine whether there is objective evidence of impairment, the Group considers factors such as the probability of insolvency or signifi cant fi nancial diffi culties of the debtor and default or signifi cant delay in payments.
Where there is objective evidence of impairment, the amount and timing of future cash fl ows are estimated based on historical loss experience for assets with similar credit risk characteristics. The carrying amount of the Group’s trade receivables at the balance sheet is disclosed in Note 24 to the fi nancial statements.
NOTES TO THE FINANCIAL STATEMENTS (cont’d)For the year ended 31 December 2012
87
Food Empire Holdings Limited Annual Report 2012

4. Revenue
Revenue is analysed as follows:
Group
2012US$’000
2011US$’000
Sale of goods 182,363 181,310
Rental income 1,343 1,350
Royalty income 3,347 977
Marketing service fee 41,335 33,188
Packaging service fee 9,275 8,837
237,663 225,662
5. Other income
Group
2012US$’000
2011US$’000
Negative goodwill arising from acquisitions of subsidiaries 414 –
Write back of impairment loss of property, plant and equipment 134 –
Gain on disposal of assets classifi ed as held for sale – 357
Gain on disposal of property, plant and equipment 19 –
Interest income from
- Bank deposits 173 121
- Associates 182 148
Grant income from IE Singapore – 263
Sales of cartons/scrapped items 29 55
Other income 160 157
1,111 1,101
NOTES TO THE FINANCIAL STATEMENTS (cont’d)For the year ended 31 December 2012
88
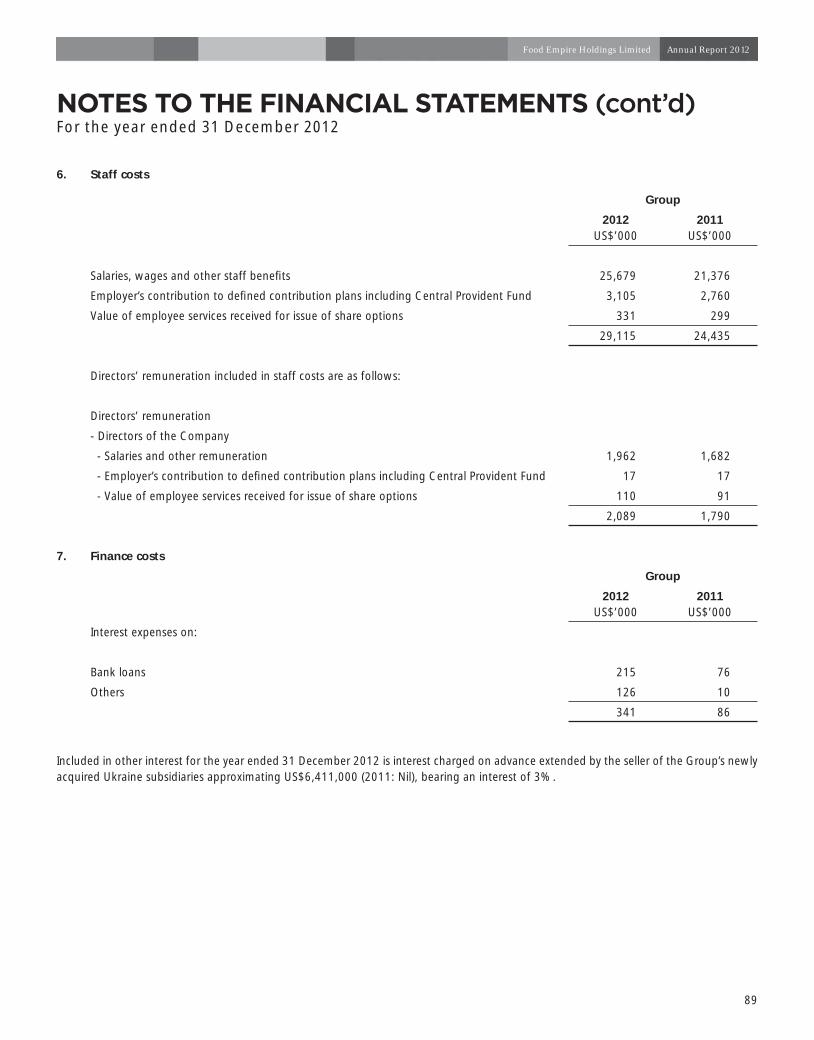
NOTES TO THE FINANCIAL STATEMENTS (cont’d)For the year ended 31 December 2012
6. Staff costs
Group
2012US$’000
2011US$’000
Salaries, wages and other staff benefi ts 25,679 21,376
Employer’s contribution to defi ned contribution plans including Central Provident Fund 3,105 2,760
Value of employee services received for issue of share options 331 299
29,115 24,435
Directors’ remuneration included in staff costs are as follows:
Directors’ remuneration
- Directors of the Company
- Salaries and other remuneration 1,962 1,682
- Employer’s contribution to defi ned contribution plans including Central Provident Fund 17 17
- Value of employee services received for issue of share options 110 91
2,089 1,790
7. Finance costs
Group
2012US$’000
2011US$’000
Interest expenses on:
Bank loans 215 76
Others 126 10
341 86
Included in other interest for the year ended 31 December 2012 is interest charged on advance extended by the seller of the Group’s newly acquired Ukraine subsidiaries approximating US$6,411,000 (2011: Nil), bearing an interest of 3%.
89
Food Empire Holdings Limited Annual Report 2012

8. Profi t before taxation
The following items have been included in arriving at profi t before taxation:
Group
2012US$’000
2011US$’000
Audit fees paid to
- Auditors of the Company 149 111
- Other auditors 163 98
Non-audit fees paid to
- Other auditors 12 53
Directors’ fee
- Directors of the Group 268 230
Foreign exchange (gain)/loss (585) 812
Other operating expenses/(income)
- (Gain)/loss on disposal of property, plant and equipment (19) 15
- Allowance for doubtful receivables 349 286
- Inventories written down 38 437
- Advertising and promotion expenses 35,799 35,008
- Legal and professional fees 2,142 1,450
9. Taxation
Major components of income tax expenses
The major components of income tax expenses for the years ended 31 December 2012 and 2011 are:
Group
2012US$’000
2011US$’000
Consolidated income statement
Current income tax
- Current income taxation 1,591 1,738
- Overprovision in respect of prior years (393) (196)
1,198 1,542
Deferred income tax
- Origination and reversal of temporary differences 78 (190)
Income tax expenses recognised in profi t or loss 1,276 1,352
NOTES TO THE FINANCIAL STATEMENTS (cont’d)For the year ended 31 December 2012
90
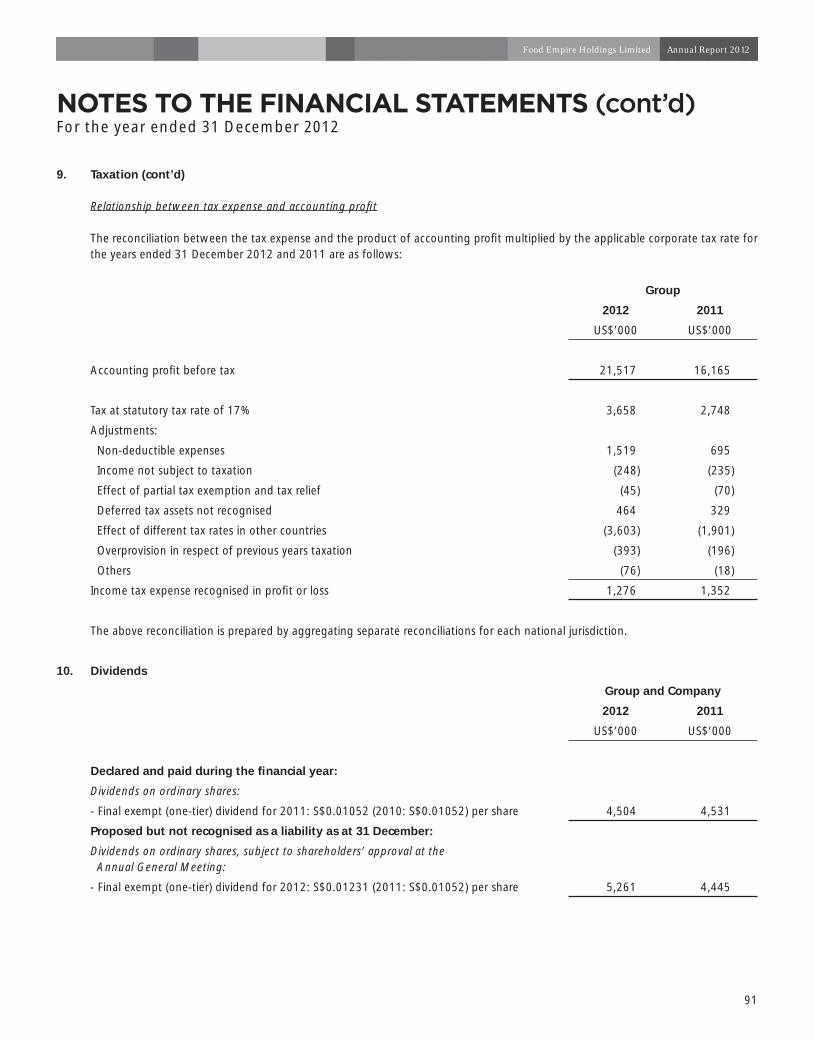
9. Taxation (cont’d)
Relationship between tax expense and accounting profi t
The reconciliation between the tax expense and the product of accounting profi t multiplied by the applicable corporate tax rate for the years ended 31 December 2012 and 2011 are as follows:
Group
2012 2011
US$’000 US$’000
Accounting profi t before tax 21,517 16,165
Tax at statutory tax rate of 17% 3,658 2,748
Adjustments:
Non-deductible expenses 1,519 695
Income not subject to taxation (248) (235)
Effect of partial tax exemption and tax relief (45) (70)
Deferred tax assets not recognised 464 329
Effect of different tax rates in other countries (3,603) (1,901)
Overprovision in respect of previous years taxation (393) (196)
Others (76) (18)
Income tax expense recognised in profi t or loss 1,276 1,352
The above reconciliation is prepared by aggregating separate reconciliations for each national jurisdiction.
10. Dividends
Group and Company
2012 2011
US$’000 US$’000
Declared and paid during the fi nancial year:
Dividends on ordinary shares:
- Final exempt (one-tier) dividend for 2011: S$0.01052 (2010: S$0.01052) per share 4,504 4,531
Proposed but not recognised as a liability as at 31 December:
Dividends on ordinary shares, subject to shareholders’ approval at the Annual General Meeting:
- Final exempt (one-tier) dividend for 2012: S$0.01231 (2011: S$0.01052) per share 5,261 4,445
NOTES TO THE FINANCIAL STATEMENTS (cont’d)For the year ended 31 December 2012
91
Food Empire Holdings Limited Annual Report 2012
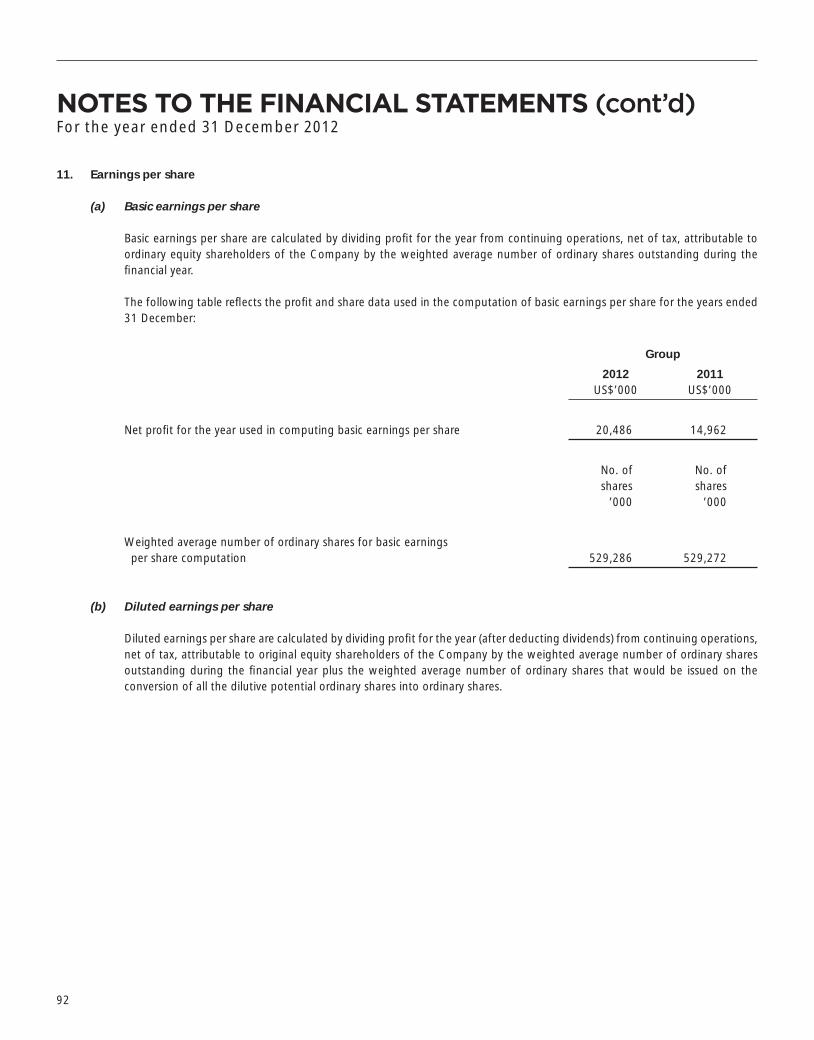
NOTES TO THE FINANCIAL STATEMENTS (cont’d)For the year ended 31 December 2012
11. Earnings per share
(a) Basic earnings per share
Basic earnings per share are calculated by dividing profi t for the year from continuing operations, net of tax, attributable to ordinary equity shareholders of the Company by the weighted average number of ordinary shares outstanding during the fi nancial year.
The following table refl ects the profi t and share data used in the computation of basic earnings per share for the years ended 31 December:
Group
2012US$’000
2011US$’000
Net profi t for the year used in computing basic earnings per share 20,486 14,962
No. of shares
’000
No. of shares
’000
Weighted average number of ordinary shares for basic earnings per share computation 529,286 529,272
(b) Diluted earnings per share
Diluted earnings per share are calculated by dividing profi t for the year (after deducting dividends) from continuing operations, net of tax, attributable to original equity shareholders of the Company by the weighted average number of ordinary shares outstanding during the fi nancial year plus the weighted average number of ordinary shares that would be issued on the conversion of all the dilutive potential ordinary shares into ordinary shares.
92

NOTES TO THE FINANCIAL STATEMENTS (cont’d)For the year ended 31 December 2012
11. Earnings per share (cont’d)
(b) Diluted earnings per share (cont’d)
The following table refl ects the profi t and share data used in the computation of dilutive earnings per share for the years ended 31 December:
Group
2012US$’000
2011US$’000
Net profi t for the year used in computing diluted earnings per share 20,486 14,962
No. of shares
’000
No. of shares
’000
Weighted average number of shares issued, used in the calculation of basic earnings per share* 529,286 529,272
Effect of dilution:
Weighted average number of unissued ordinary shares under option 11,116 8,388
Number of shares that would have been issued at fair value (8,230) (7,010)
Weighted average number of ordinary shares adjusted for the effect of dilution which is used for diluted earnings per share computation* 532,172 530,650
* The weighted average number of shares takes into account the weighted average effect of changes in treasury shares transactions during the year.
There are 3,950,000 (2011: 4,050,000) share options granted to employees under the existing employee share options plans that have not been included in the calculations of diluted earnings per share because they are anti-dilutive.
Since the end of the fi nancial year, there have been no other transaction involving ordinary shares or potential ordinary shares that would have changed signifi cantly the ordinary shares or potentially ordinary shares outstanding at the end of the period if those transactions had occurred before the end of the reporting period.
93
Food Empire Holdings Limited Annual Report 2012
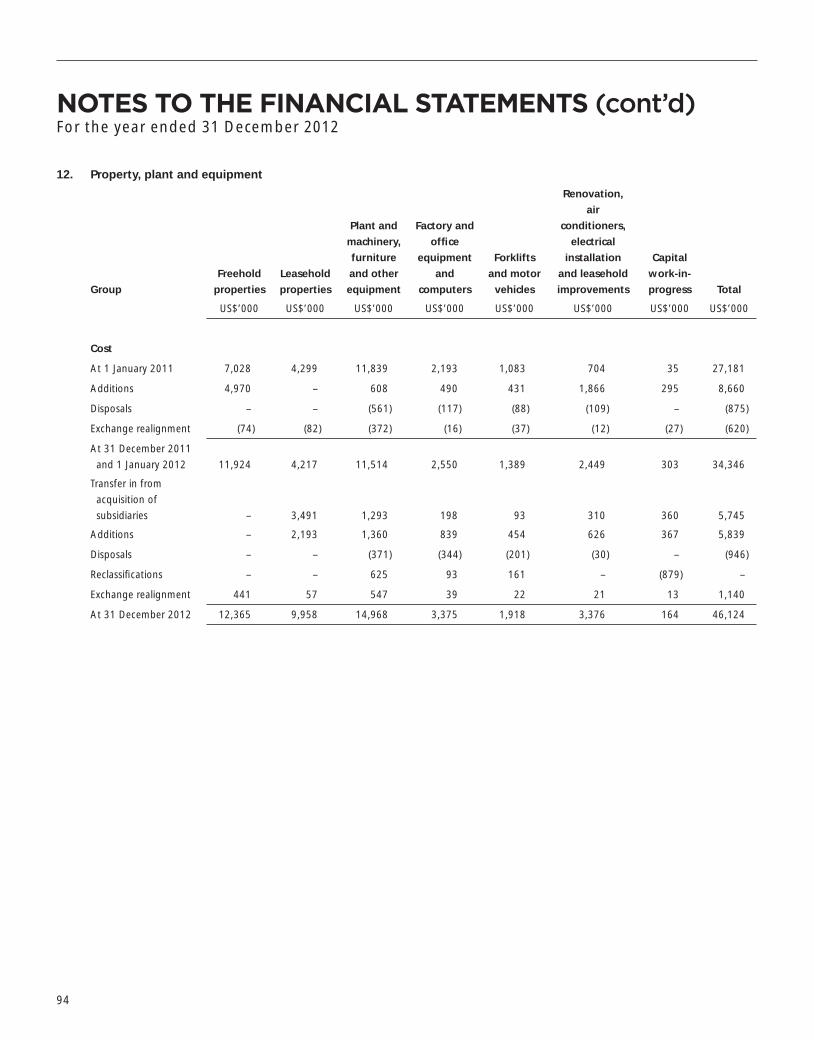
NOTES TO THE FINANCIAL STATEMENTS (cont’d)For the year ended 31 December 2012
12. Property, plant and equipment
Group
Freehold
properties
Leasehold
properties
Plant and
machinery,
furniture
and other
equipment
Factory and
offi ce
equipment
and
computers
Forklifts
and motor
vehicles
Renovation,
air
conditioners,
electrical
installation
and leasehold
improvements
Capital
work-in-
progress Total
US$’000 US$’000 US$’000 US$’000 US$’000 US$’000 US$’000 US$’000
Cost
At 1 January 2011 7,028 4,299 11,839 2,193 1,083 704 35 27,181
Additions 4,970 – 608 490 431 1,866 295 8,660
Disposals – – (561) (117) (88) (109) – (875)
Exchange realignment (74) (82) (372) (16) (37) (12) (27) (620)
At 31 December 2011
and 1 January 2012 11,924 4,217 11,514 2,550 1,389 2,449 303 34,346
Transfer in from
acquisition of
subsidiaries – 3,491 1,293 198 93 310 360 5,745
Additions – 2,193 1,360 839 454 626 367 5,839
Disposals – – (371) (344) (201) (30) – (946)
Reclassifi cations – – 625 93 161 – (879) –
Exchange realignment 441 57 547 39 22 21 13 1,140
At 31 December 2012 12,365 9,958 14,968 3,375 1,918 3,376 164 46,124
94
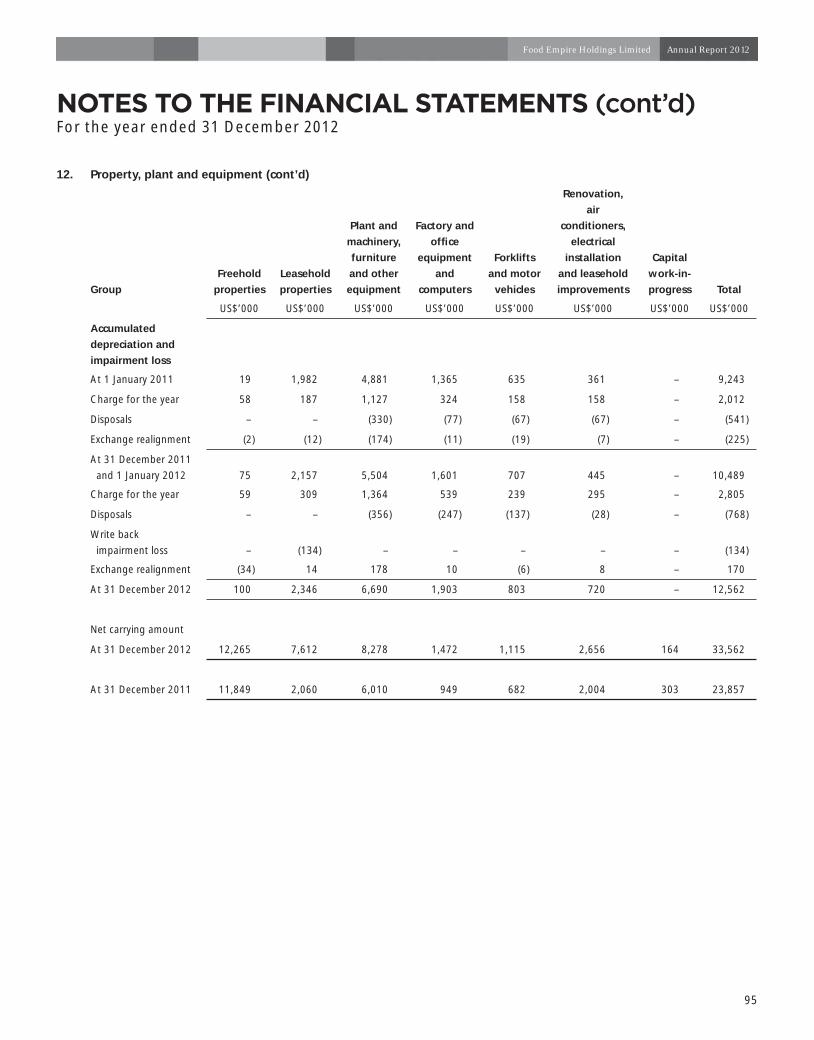
NOTES TO THE FINANCIAL STATEMENTS (cont’d)For the year ended 31 December 2012
12. Property, plant and equipment (cont’d)
Group
Freehold
properties
Leasehold
properties
Plant and
machinery,
furniture
and other
equipment
Factory and
offi ce
equipment
and
computers
Forklifts
and motor
vehicles
Renovation,
air
conditioners,
electrical
installation
and leasehold
improvements
Capital
work-in-
progress Total
US$’000 US$’000 US$’000 US$’000 US$’000 US$’000 US$’000 US$’000
Accumulated
depreciation and
impairment loss
At 1 January 2011 19 1,982 4,881 1,365 635 361 – 9,243
Charge for the year 58 187 1,127 324 158 158 – 2,012
Disposals – – (330) (77) (67) (67) – (541)
Exchange realignment (2) (12) (174) (11) (19) (7) – (225)
At 31 December 2011
and 1 January 2012 75 2,157 5,504 1,601 707 445 – 10,489
Charge for the year 59 309 1,364 539 239 295 – 2,805
Disposals – – (356) (247) (137) (28) – (768)
Write back
impairment loss – (134) – – – – – (134)
Exchange realignment (34) 14 178 10 (6) 8 – 170
At 31 December 2012 100 2,346 6,690 1,903 803 720 – 12,562
Net carrying amount
At 31 December 2012 12,265 7,612 8,278 1,472 1,115 2,656 164 33,562
At 31 December 2011 11,849 2,060 6,010 949 682 2,004 303 23,857
95
Food Empire Holdings Limited Annual Report 2012
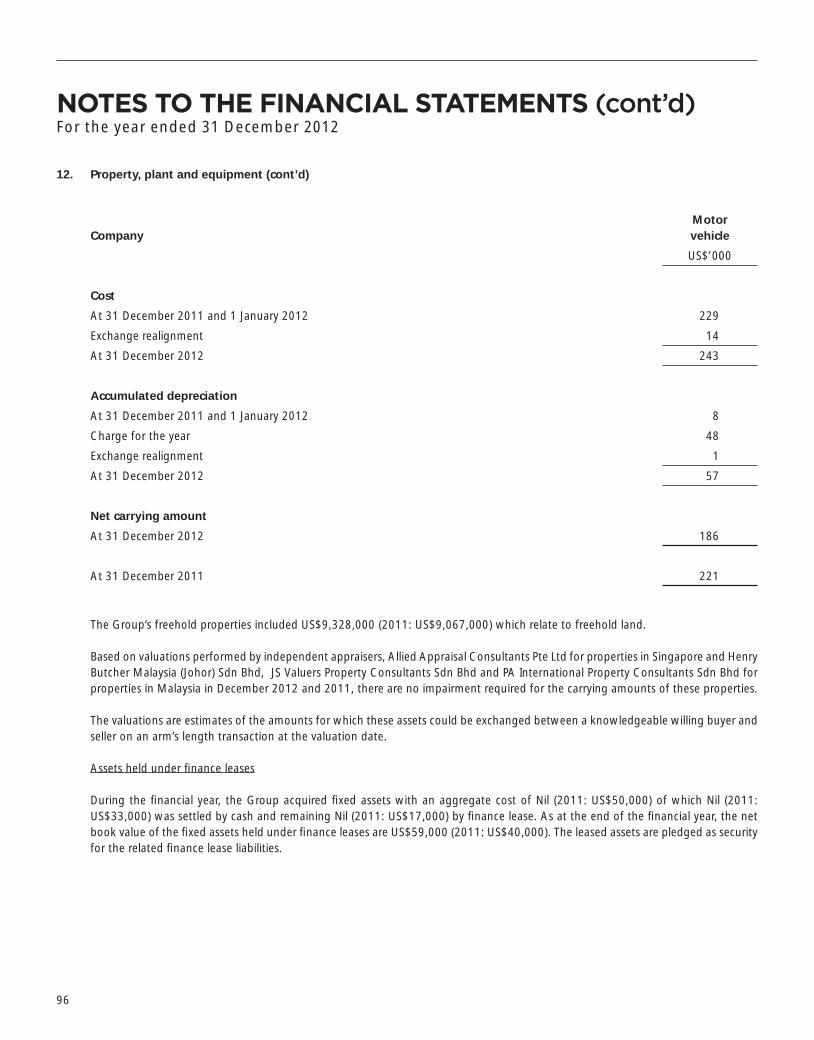
NOTES TO THE FINANCIAL STATEMENTS (cont’d)For the year ended 31 December 2012
12. Property, plant and equipment (cont’d)
CompanyMotor vehicle
US$’000
Cost
At 31 December 2011 and 1 January 2012 229
Exchange realignment 14
At 31 December 2012 243
Accumulated depreciation
At 31 December 2011 and 1 January 2012 8
Charge for the year 48
Exchange realignment 1
At 31 December 2012 57
Net carrying amount
At 31 December 2012 186
At 31 December 2011 221
The Group’s freehold properties included US$9,328,000 (2011: US$9,067,000) which relate to freehold land.
Based on valuations performed by independent appraisers, Allied Appraisal Consultants Pte Ltd for properties in Singapore and Henry Butcher Malaysia (Johor) Sdn Bhd, JS Valuers Property Consultants Sdn Bhd and PA International Property Consultants Sdn Bhd for properties in Malaysia in December 2012 and 2011, there are no impairment required for the carrying amounts of these properties.
The valuations are estimates of the amounts for which these assets could be exchanged between a knowledgeable willing buyer and seller on an arm’s length transaction at the valuation date.
Assets held under fi nance leases
During the fi nancial year, the Group acquired fi xed assets with an aggregate cost of Nil (2011: US$50,000) of which Nil (2011: US$33,000) was settled by cash and remaining Nil (2011: US$17,000) by fi nance lease. As at the end of the fi nancial year, the net book value of the fi xed assets held under fi nance leases are US$59,000 (2011: US$40,000). The leased assets are pledged as security for the related fi nance lease liabilities.
96
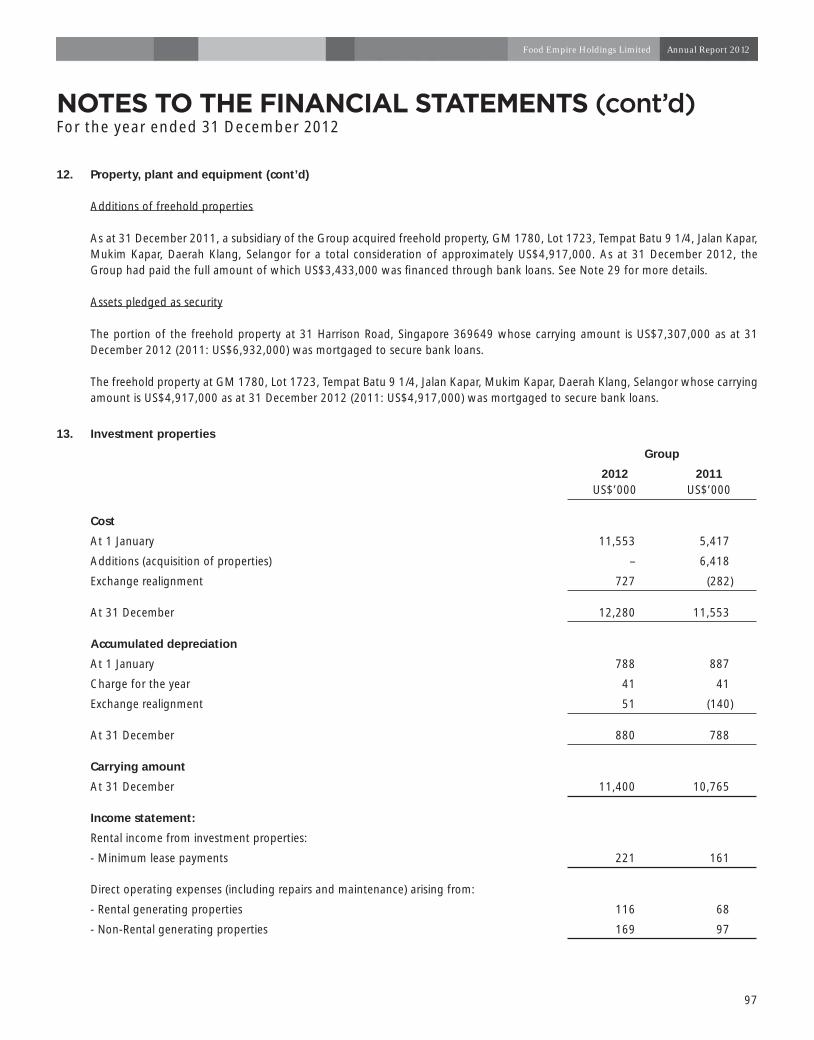
NOTES TO THE FINANCIAL STATEMENTS (cont’d)For the year ended 31 December 2012
12. Property, plant and equipment (cont’d)
Additions of freehold properties
As at 31 December 2011, a subsidiary of the Group acquired freehold property, GM 1780, Lot 1723, Tempat Batu 9 1/4, Jalan Kapar, Mukim Kapar, Daerah Klang, Selangor for a total consideration of approximately US$4,917,000. As at 31 December 2012, the Group had paid the full amount of which US$3,433,000 was fi nanced through bank loans. See Note 29 for more details.
Assets pledged as security
The portion of the freehold property at 31 Harrison Road, Singapore 369649 whose carrying amount is US$7,307,000 as at 31 December 2012 (2011: US$6,932,000) was mortgaged to secure bank loans.
The freehold property at GM 1780, Lot 1723, Tempat Batu 9 1/4, Jalan Kapar, Mukim Kapar, Daerah Klang, Selangor whose carrying amount is US$4,917,000 as at 31 December 2012 (2011: US$4,917,000) was mortgaged to secure bank loans.
13. Investment properties
Group
2012US$’000
2011US$’000
Cost
At 1 January 11,553 5,417
Additions (acquisition of properties) – 6,418
Exchange realignment 727 (282)
At 31 December 12,280 11,553
Accumulated depreciation
At 1 January 788 887
Charge for the year 41 41
Exchange realignment 51 (140)
At 31 December 880 788
Carrying amount
At 31 December 11,400 10,765
Income statement:
Rental income from investment properties:
- Minimum lease payments 221 161
Direct operating expenses (including repairs and maintenance) arising from:
- Rental generating properties 116 68
- Non-Rental generating properties 169 97
97
Food Empire Holdings Limited Annual Report 2012
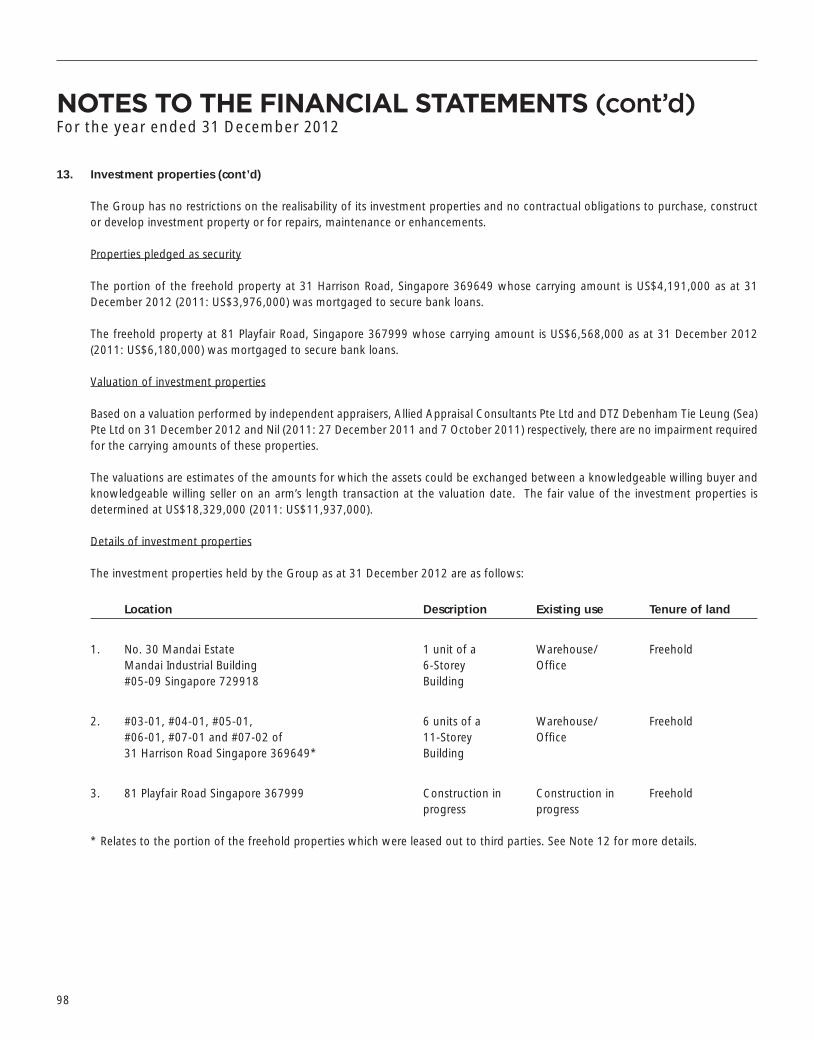
NOTES TO THE FINANCIAL STATEMENTS (cont’d)For the year ended 31 December 2012
13. Investment properties (cont’d)
The Group has no restrictions on the realisability of its investment properties and no contractual obligations to purchase, construct or develop investment property or for repairs, maintenance or enhancements.
Properties pledged as security
The portion of the freehold property at 31 Harrison Road, Singapore 369649 whose carrying amount is US$4,191,000 as at 31 December 2012 (2011: US$3,976,000) was mortgaged to secure bank loans.
The freehold property at 81 Playfair Road, Singapore 367999 whose carrying amount is US$6,568,000 as at 31 December 2012 (2011: US$6,180,000) was mortgaged to secure bank loans.
Valuation of investment properties
Based on a valuation performed by independent appraisers, Allied Appraisal Consultants Pte Ltd and DTZ Debenham Tie Leung (Sea) Pte Ltd on 31 December 2012 and Nil (2011: 27 December 2011 and 7 October 2011) respectively, there are no impairment required for the carrying amounts of these properties.
The valuations are estimates of the amounts for which the assets could be exchanged between a knowledgeable willing buyer and knowledgeable willing seller on an arm’s length transaction at the valuation date. The fair value of the investment properties is determined at US$18,329,000 (2011: US$11,937,000).
Details of investment properties
The investment properties held by the Group as at 31 December 2012 are as follows:
Location Description Existing use Tenure of land
1. No. 30 Mandai EstateMandai Industrial Building#05-09 Singapore 729918
1 unit of a6-StoreyBuilding
Warehouse/Offi ce
Freehold
2. #03-01, #04-01, #05-01,#06-01, #07-01 and #07-02 of31 Harrison Road Singapore 369649*
6 units of a11-StoreyBuilding
Warehouse/Offi ce
Freehold
3. 81 Playfair Road Singapore 367999 Construction in progress
Construction in progress
Freehold
* Relates to the portion of the freehold properties which were leased out to third parties. See Note 12 for more details.
98
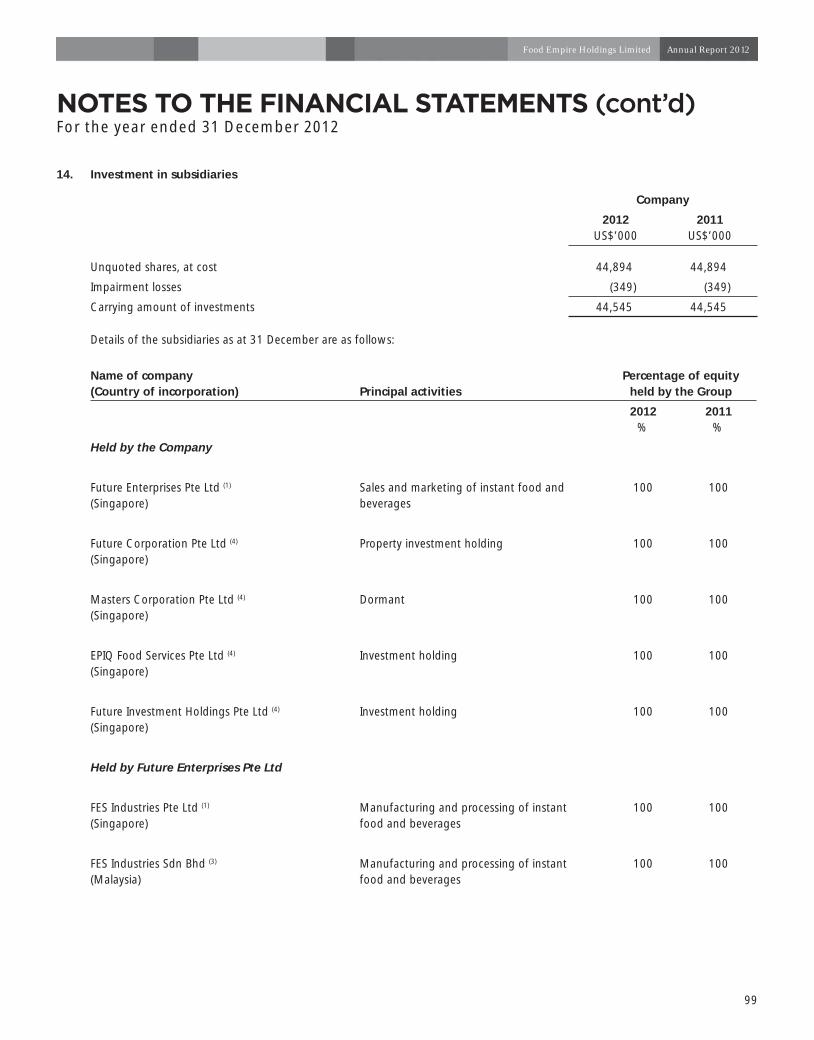
NOTES TO THE FINANCIAL STATEMENTS (cont’d)For the year ended 31 December 2012
14. Investment in subsidiaries
Company
2012US$’000
2011US$’000
Unquoted shares, at cost 44,894 44,894
Impairment losses (349) (349)
Carrying amount of investments 44,545 44,545
Details of the subsidiaries as at 31 December are as follows:
Name of company(Country of incorporation) Principal activities
Percentage of equityheld by the Group
2012%
2011%
Held by the Company
Future Enterprises Pte Ltd (1)
(Singapore)Sales and marketing of instant food and beverages
100 100
Future Corporation Pte Ltd (4)
(Singapore)Property investment holding 100 100
Masters Corporation Pte Ltd (4)
(Singapore)Dormant 100 100
EPIQ Food Services Pte Ltd (4)
(Singapore)Investment holding 100 100
Future Investment Holdings Pte Ltd (4) (Singapore)
Investment holding 100 100
Held by Future Enterprises Pte Ltd
FES Industries Pte Ltd (1)
(Singapore)Manufacturing and processing of instant food and beverages
100 100
FES Industries Sdn Bhd (3)
(Malaysia)Manufacturing and processing of instant food and beverages
100 100
99
Food Empire Holdings Limited Annual Report 2012
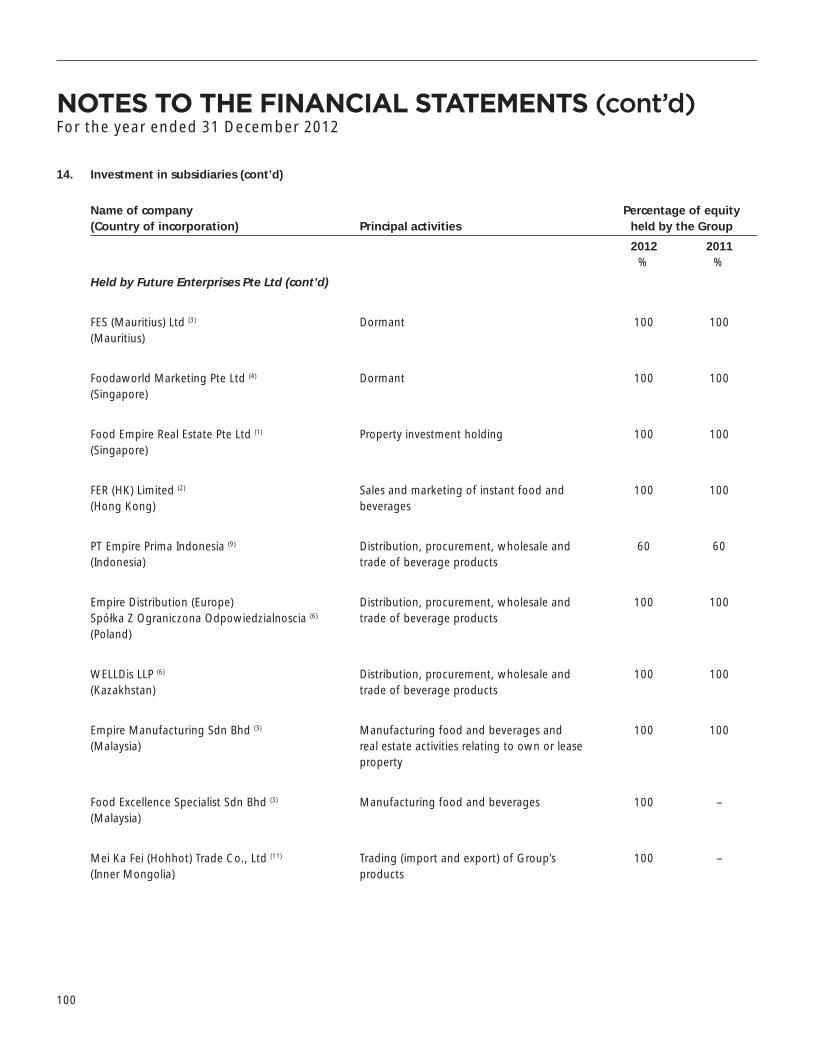
14. Investment in subsidiaries (cont’d)
Name of company(Country of incorporation) Principal activities
Percentage of equityheld by the Group
2012%
2011%
Held by Future Enterprises Pte Ltd (cont’d)
FES (Mauritius) Ltd (3)
(Mauritius)Dormant 100 100
Foodaworld Marketing Pte Ltd (4)
(Singapore)Dormant 100 100
Food Empire Real Estate Pte Ltd (1) (Singapore)
Property investment holding 100 100
FER (HK) Limited (2)
(Hong Kong)Sales and marketing of instant food and beverages
100 100
PT Empire Prima Indonesia (9)
(Indonesia)Distribution, procurement, wholesale and trade of beverage products
60 60
Empire Distribution (Europe) Spółka Z Ograniczona Odpowiedzialnoscia (6)
(Poland)
Distribution, procurement, wholesale and trade of beverage products
100 100
WELLDis LLP (6) (Kazakhstan)
Distribution, procurement, wholesale and trade of beverage products
100 100
Empire Manufacturing Sdn Bhd (3) (Malaysia)
Manufacturing food and beverages and real estate activities relating to own or lease property
100 100
Food Excellence Specialist Sdn Bhd (3)
(Malaysia) Manufacturing food and beverages 100 –
Mei Ka Fei (Hohhot) Trade Co., Ltd (11)
(Inner Mongolia) Trading (import and export) of Group’s products
100 –
NOTES TO THE FINANCIAL STATEMENTS (cont’d)For the year ended 31 December 2012
100

14. Investment in subsidiaries (cont’d)
Name of company(Country of incorporation) Principal activities
Percentage of equityheld by the Group
2012%
2011%
Held by Foodaworld Marketing Pte Ltd
Lovena Limited (5)
(Cyprus)Investment holding 100 100
Pavo Holding Limited (5)
(Cyprus)Investment holding 100 100
Held by Pavo Holding Limited
Delta Future (6)
(Ukraine)Manufacturing of food products 100 100
FE Production Ltd (6)
(Ukraine)Manufacturing of food products 100 100
Held by Lovena Limited
FES UKR LLC (3)
(Ukraine)Preparation, packaging and distribution of instant beverages
100 –
Held by FES Industries Pte Ltd
FES (Vietnam) Co., Ltd (3)
(Vietnam)Manufacturing and distribution of instant food and beverages
100 100
NOTES TO THE FINANCIAL STATEMENTS (cont’d)For the year ended 31 December 2012
101
Food Empire Holdings Limited Annual Report 2012
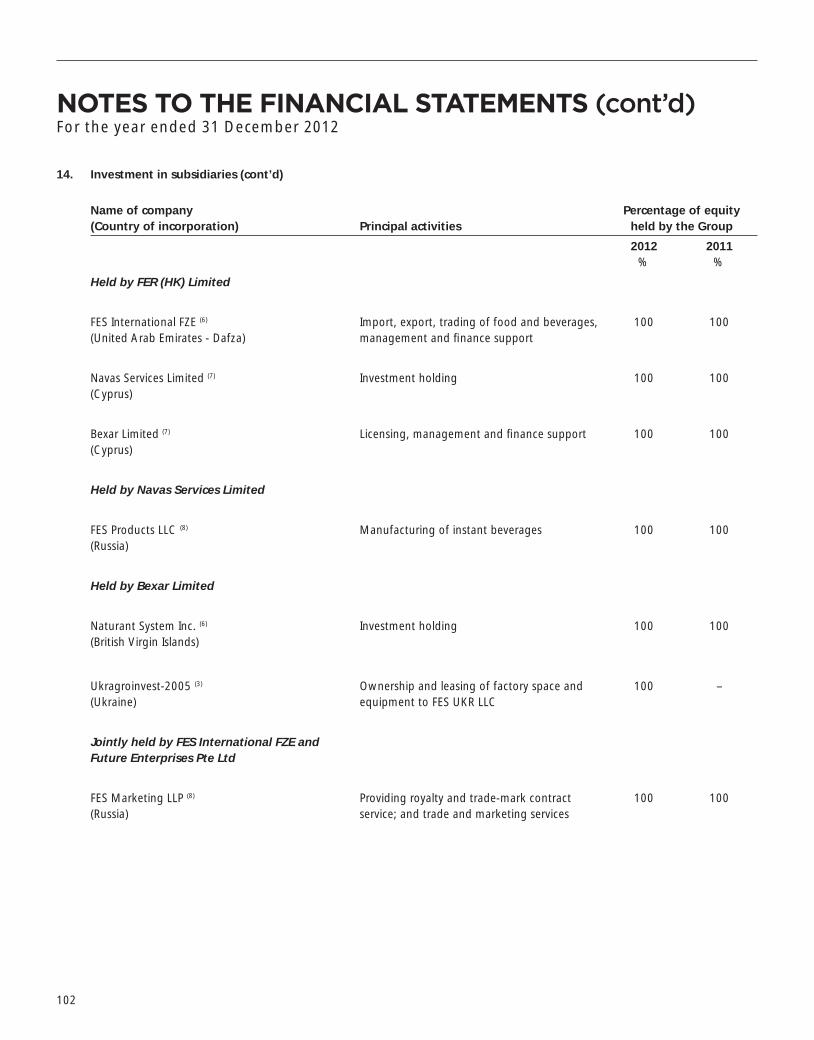
14. Investment in subsidiaries (cont’d)
Name of company(Country of incorporation) Principal activities
Percentage of equityheld by the Group
2012%
2011%
Held by FER (HK) Limited
FES International FZE (6)
(United Arab Emirates - Dafza)Import, export, trading of food and beverages, management and fi nance support
100 100
Navas Services Limited (7)
(Cyprus)Investment holding 100 100
Bexar Limited (7)
(Cyprus)Licensing, management and fi nance support 100 100
Held by Navas Services Limited
FES Products LLC (8)
(Russia)Manufacturing of instant beverages 100 100
Held by Bexar Limited
Naturant System Inc. (6)
(British Virgin Islands)Investment holding 100 100
Ukragroinvest-2005 (3) (Ukraine)
Ownership and leasing of factory space and equipment to FES UKR LLC
100 –
Jointly held by FES International FZE and Future Enterprises Pte Ltd
FES Marketing LLP (8)
(Russia)Providing royalty and trade-mark contract service; and trade and marketing services
100 100
NOTES TO THE FINANCIAL STATEMENTS (cont’d)For the year ended 31 December 2012
102

14. Investment in subsidiaries (cont’d)
Name of company(Country of incorporation) Principal activities
Percentage of equityheld by the Group
2012%
2011%
Held by EPIQ Food Services Pte Ltd
BVBA Food Expert (10)
(Belgium)Wholesale of food products 100 –
Held by Future Investment Holdings Pte Ltd
Food Land Empire Pte Ltd (4)
(Singapore)General wholesale trade 70 –
Food Land Investment Holdings Pte Ltd (4) (Singapore)
Investment holding 100 –
Held by Food Land InvestmentHoldings Pte Ltd
Food Land Manufacturing Co., Ltd (6)
(Myanmar)Manufacturing and processing of instant food and beverages
70 –
Jointly held by EPIQ Food Services Pte Ltd and Future Investment Holdings Pte Ltd
Global Food Excellence Ltd (12)
(Nigeria)Marketing support of Group’s products 100 –
Indus Coffee Private Limited (13)
(India)Manufacturing and packaging of instant coffee
100 –
(1) Audited by Ernst & Young LLP, Singapore.(2) Audited by S.B. Chow & Co., Certifi ed Public Accountants (Practising), Hong Kong.(3) Audited by associated fi rms of Ernst & Young LLP, Singapore.(4) Audited by IKA International Certifi ed Public Accountants, Singapore.(5) Audited by P. Kalopetrides & Co, Cyprus.(6) Not required to be audited by the law of its country of incorporation.(7) Audited by KPMG Cyprus.(8) Audited by KPMG (Moscow, Russia).(9) Audited by HLB Hadori Sugiarto Adi & Rekan (member of HLB International).(10) Audited by BDO Belgium.(11) Audited by Hohhot Zhicheng Certifi ed Public Accountants Co., Ltd. (Inner Mongolia).(12) Audited by UHY Maaji and Co. (Nigeria).(13) No audited fi nancial statements had been prepared as company had remained dormant since incorporation.
NOTES TO THE FINANCIAL STATEMENTS (cont’d)For the year ended 31 December 2012
103
Food Empire Holdings Limited Annual Report 2012
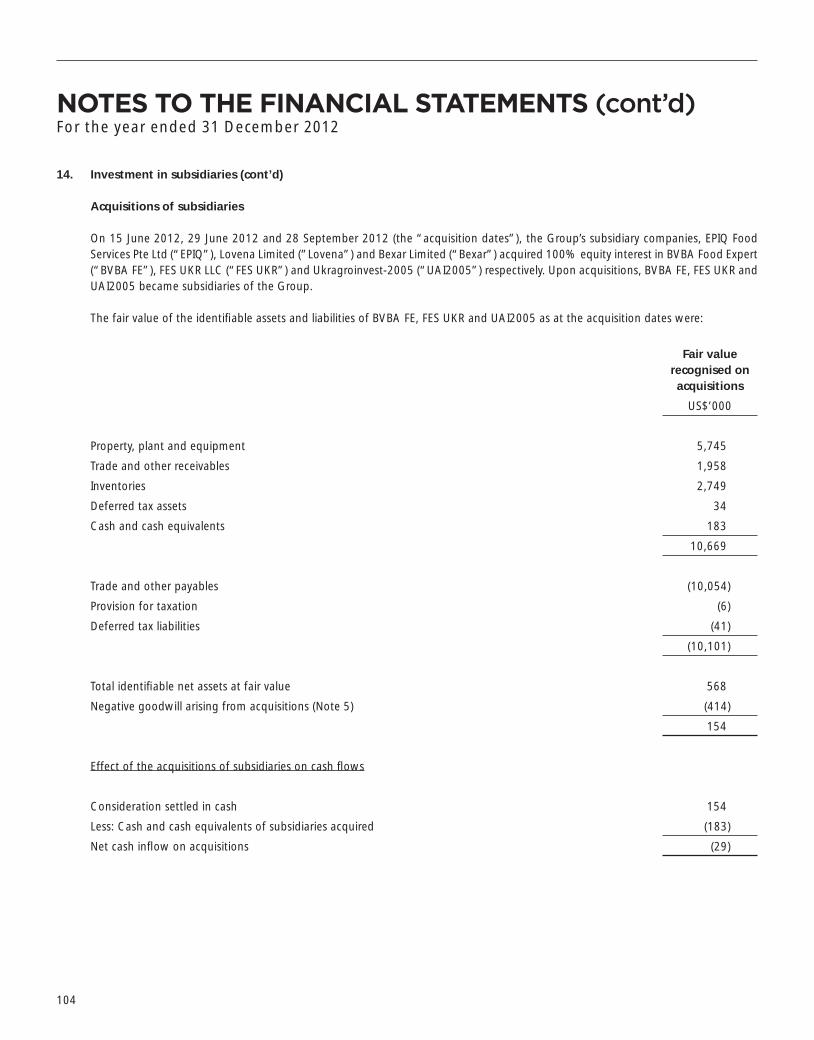
NOTES TO THE FINANCIAL STATEMENTS (cont’d)For the year ended 31 December 2012
14. Investment in subsidiaries (cont’d)
Acquisitions of subsidiaries
On 15 June 2012, 29 June 2012 and 28 September 2012 (the “acquisition dates”), the Group’s subsidiary companies, EPIQ Food Services Pte Ltd (“EPIQ”), Lovena Limited (”Lovena”) and Bexar Limited (“Bexar”) acquired 100% equity interest in BVBA Food Expert (“BVBA FE”), FES UKR LLC (“FES UKR”) and Ukragroinvest-2005 (“UAI2005”) respectively. Upon acquisitions, BVBA FE, FES UKR and UAI2005 became subsidiaries of the Group.
The fair value of the identifi able assets and liabilities of BVBA FE, FES UKR and UAI2005 as at the acquisition dates were:
Fair value recognised on acquisitions
US$’000
Property, plant and equipment 5,745
Trade and other receivables 1,958
Inventories 2,749
Deferred tax assets 34
Cash and cash equivalents 183
10,669
Trade and other payables (10,054)
Provision for taxation (6)
Deferred tax liabilities (41)
(10,101)
Total identifi able net assets at fair value 568
Negative goodwill arising from acquisitions (Note 5) (414)
154
Effect of the acquisitions of subsidiaries on cash fl ows
Consideration settled in cash 154
Less: Cash and cash equivalents of subsidiaries acquired (183)
Net cash infl ow on acquisitions (29)
104

NOTES TO THE FINANCIAL STATEMENTS (cont’d)For the year ended 31 December 2012
14. Investment in subsidiaries (cont’d)
Acquisitions of subsidiaries (cont’d)
Transaction Cost
Transaction cost related to the acquisition of US$16,000 have been recognised in the “Other operating expenses” line item in the Group’s profi t or loss for the year ended 31 December 2012.
Property, plant and equipment acquired
An external valuer, Knight Frank LLC, was engaged to assess the fair value of the property as at date of acquisition. Based on the valuation, the fair value was used to compute the goodwill at the date of acquisition.
Impact of the acquisitions on profi t or loss
From the date of acquisitions to 31 December 2012, the newly acquired subsidiaries have contributed US$24,298,000 of revenue to the Group revenue and US$2,265,000 of net profi t to the Group profi t. If the business combination had taken place at the beginning of the year, the revenue from continuing operations would have been US$238,540,000 and the Group’s profi t from continuing operations, net of tax would have been US$20,083,000.
15. Investment in associates
Group
2012US$’000
2011US$’000
Unquoted shares, at cost 10,230 8,230
Share of net post-acquisition reserves 2,660 1,758
12,890 9,988
105
Food Empire Holdings Limited Annual Report 2012

NOTES TO THE FINANCIAL STATEMENTS (cont’d)For the year ended 31 December 2012
15. Investment in associates (cont’d)
Disposal
For the year ended 31 December 2011, the Group disposed of its 26% interest in Vayhan Coffee Limited for a total consideration of approximately US$2,689,000. A loss on disposal of interest, amounting to US$342,000 was recognised in the profi t or loss.
Details of the associates as at 31 December are as follows:
Name of company(Country of incorporation) Principal activities
Percentage of equityheld by the Group
2012%
2011%
Held by subsidiaries
Simonelo Limited (1)
(Cyprus)Investment holding 50 50
Triple Ace Ventures Limited (2) (British Virgin Islands)
Investment holding 50 50
PT Marindo Makmur Usahjaya (3)
(Indonesia)Manufacturing of frozen seafood products 40 40
Empire Tea (PVT) Ltd (4)
(Sri Lanka) Exporter of bulk, packet and bagged tea 30 30
(1) Audited by KPMG Cyprus.(2) Not required to be audited by the law of its country of incorporation.(3) Audited by Drs. Suprihadi dan Rekan, Indonesia.(4) Audited by HLB Edirisinghe & Company, Sri Lanka.
The summarised fi nancial information of the associates is as follows:
Group
2012US$’000
2011US$’000
Assets and liabilities:
Total assets 75,172 59,187
Total liabilities 49,207 39,213
Revenue 78,350 70,883
Profi t for the year 3,306 1,547
106

NOTES TO THE FINANCIAL STATEMENTS (cont’d)For the year ended 31 December 2012
16. Amount due from an associate (non-current)
Group
2012 2011
US$’000 US$’000
3 years, unsecured long term loan 2,600 2,600
The 3 years loan of US$2,600,000 is unsecured and bears a fl oating interest rate of 7% per annum during the fi nancial year.
17. Intangible assets
Goodwill Brand Total
US$’000 US$’000 US$’000
Cost
At the beginning and end of the year for fi nancial year 2012 and 2011 7,390 8,361 15,751
Less: Impairment
At the beginning and end of the year for fi nancial year 2012 and 2011 706 1,702 2,408
Net carrying amount
At 31 December 2012 6,684 6,659 13,343
At 31 December 2011 6,684 6,659 13,343
Impairment testing of goodwill and brand
Goodwill and brand acquired through business combinations have been allocated to the Group’s cash-generating units (“CGU”) identifi ed according to each individual business unit for impairment testing.
Group
2012 2011
US$’000 US$’000
FER (HK) Limited Group 4,797 4,797
FES Industries Pte Ltd 1,887 1,887
Brand 6,659 6,659
13,343 13,343
107
Food Empire Holdings Limited Annual Report 2012
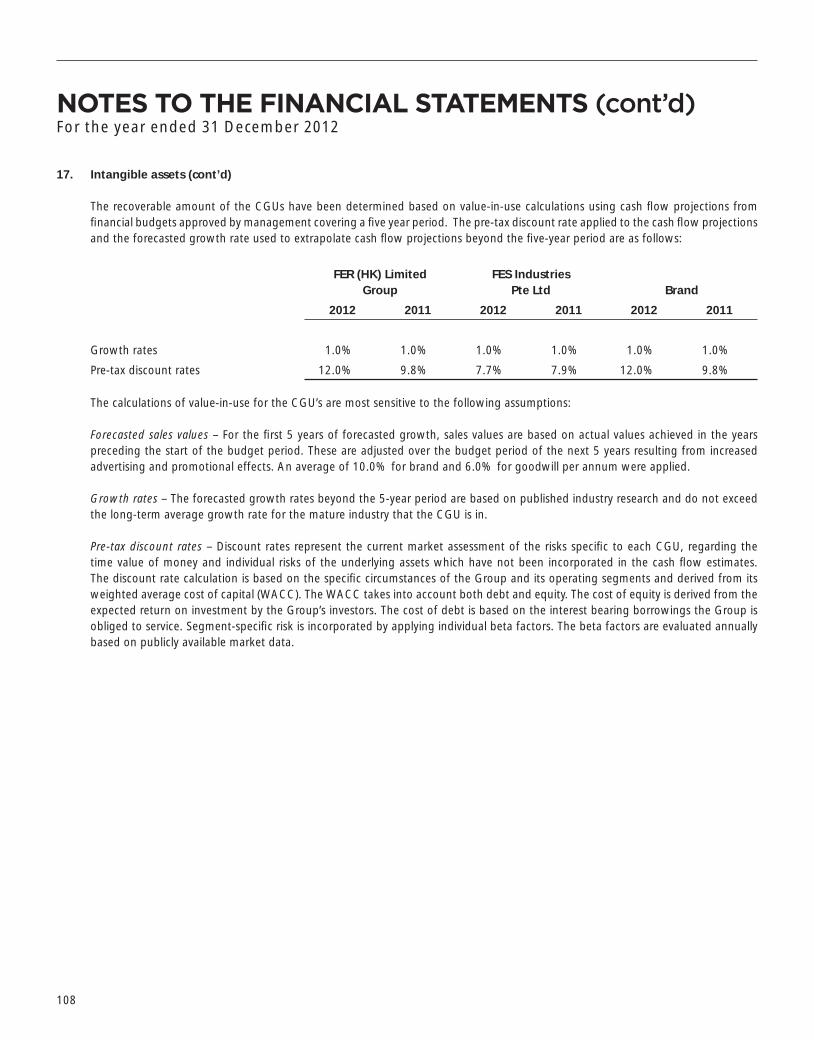
NOTES TO THE FINANCIAL STATEMENTS (cont’d)For the year ended 31 December 2012
17. Intangible assets (cont’d)
The recoverable amount of the CGUs have been determined based on value-in-use calculations using cash fl ow projections from fi nancial budgets approved by management covering a fi ve year period. The pre-tax discount rate applied to the cash fl ow projections and the forecasted growth rate used to extrapolate cash fl ow projections beyond the fi ve-year period are as follows:
FER (HK) Limited Group
FES IndustriesPte Ltd Brand
2012 2011 2012 2011 2012 2011
Growth rates 1.0% 1.0% 1.0% 1.0% 1.0% 1.0%
Pre-tax discount rates 12.0% 9.8% 7.7% 7.9% 12.0% 9.8%
The calculations of value-in-use for the CGU’s are most sensitive to the following assumptions:
Forecasted sales values – For the fi rst 5 years of forecasted growth, sales values are based on actual values achieved in the years preceding the start of the budget period. These are adjusted over the budget period of the next 5 years resulting from increased advertising and promotional effects. An average of 10.0% for brand and 6.0% for goodwill per annum were applied.
Growth rates – The forecasted growth rates beyond the 5-year period are based on published industry research and do not exceed the long-term average growth rate for the mature industry that the CGU is in.
Pre-tax discount rates – Discount rates represent the current market assessment of the risks specifi c to each CGU, regarding the time value of money and individual risks of the underlying assets which have not been incorporated in the cash fl ow estimates. The discount rate calculation is based on the specifi c circumstances of the Group and its operating segments and derived from its weighted average cost of capital (WACC). The WACC takes into account both debt and equity. The cost of equity is derived from the expected return on investment by the Group’s investors. The cost of debt is based on the interest bearing borrowings the Group is obliged to service. Segment-specifi c risk is incorporated by applying individual beta factors. The beta factors are evaluated annually based on publicly available market data.
108

NOTES TO THE FINANCIAL STATEMENTS (cont’d)For the year ended 31 December 2012
18. Deferred tax
Deferred tax as at 31 December relates to the following:
Group
2012 2011
US$’000 US$’000
Deferred tax assets
Sundry provisions 207 142
Deferred tax liabilities
Excess of net book value over tax written down value (473) (364)
At the balance sheet date, the Group has tax losses of approximately US$4,103,000 (2011: US$2,469,000) that are available for offset against future taxable profi ts of the companies in which the losses arose. The resulting deferred tax asset of US$895,000 (2011: US$499,000) are not recognised due to uncertainty of its recoverability. The use of these unutilised tax losses are subject to the agreement of the tax authorities and compliance with certain provisions of the tax legislation of the respective countries in which the companies operate.
19. Other receivables
Group
2012 2011
US$’000 US$’000
Current
Staff advances 234 148
Sundry receivables 573 2,168
Tax recoverable 131 119
938 2,435
Staff advances are unsecured, non-interest bearing and expected to be repayable on demand.
Included in sundry receivables for 2011, is an amount of approximately US$1,525,000 relating to the receivable amount from the disposal of associate, Vayhan Coffee Limited upon signing of the Memorandum of Understanding on 14 November 2011. This was fully paid up in 2012.
109
Food Empire Holdings Limited Annual Report 2012

NOTES TO THE FINANCIAL STATEMENTS (cont’d)For the year ended 31 December 2012
19. Other receivables (cont’d)
Group
2012 2011
US$’000 US$’000
Non-current
Loan to an external party 378 –
The loan is unsecured, bears an interest rate of 2.5% per annum and is repayable in 5 years. 20. Inventories
Group
2012 2011
US$’000 US$’000
Balance sheet:
Raw materials 11,410 9,761
Packaging materials 6,135 2,779
Finished products/trading goods 9,627 9,717
Total inventories at lower of cost and net realisable value 27,172 22,257
Income statement:
Inventories recognised as an expense in cost of sales 126,505 126,890
Inclusive of the following charge:
- Inventories written down 38 437 21. Prepaid operating expenses and other debtors
Group Company
2012 2011 2012 2011
US$’000 US$’000 US$’000 US$’000
Deposits 957 368 – –
Prepayments 5,789 1,805 46 29
6,746 2,173 46 29
110
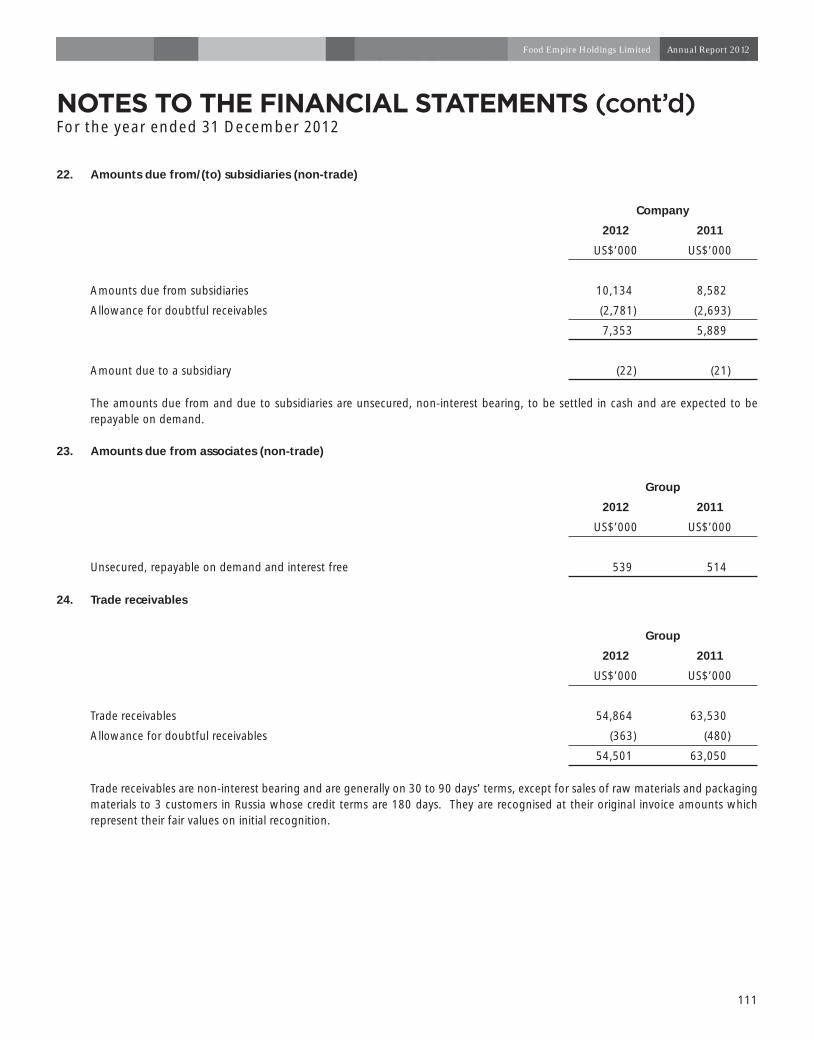
NOTES TO THE FINANCIAL STATEMENTS (cont’d)For the year ended 31 December 2012
22. Amounts due from/(to) subsidiaries (non-trade)
Company
2012 2011
US$’000 US$’000
Amounts due from subsidiaries 10,134 8,582
Allowance for doubtful receivables (2,781) (2,693)
7,353 5,889
Amount due to a subsidiary (22) (21)
The amounts due from and due to subsidiaries are unsecured, non-interest bearing, to be settled in cash and are expected to be repayable on demand.
23. Amounts due from associates (non-trade)
Group
2012 2011
US$’000 US$’000
Unsecured, repayable on demand and interest free 539 514 24. Trade receivables
Group
2012 2011
US$’000 US$’000
Trade receivables 54,864 63,530
Allowance for doubtful receivables (363) (480)
54,501 63,050
Trade receivables are non-interest bearing and are generally on 30 to 90 days’ terms, except for sales of raw materials and packaging materials to 3 customers in Russia whose credit terms are 180 days. They are recognised at their original invoice amounts which represent their fair values on initial recognition.
111
Food Empire Holdings Limited Annual Report 2012

NOTES TO THE FINANCIAL STATEMENTS (cont’d)For the year ended 31 December 2012
24. Trade receivables (cont’d)
Trade receivables denominated in foreign currencies at 31 December are as follows:
Group
2012 2011
US$’000 US$’000
Singapore Dollar 376 52
Euro 732 539
Russia Rubles 588 3,587
Ukrainian Hryvnia 5,866 –
Others 776 759
Receivables that are past due but not impaired
The Group has trade receivables amounting to US$5,447,000 (2011: US$10,890,000) that are past due at the balance sheet date but not impaired. These receivables are unsecured and the analysis of their aging at the balance sheet date is as follows:
Group
2012 2011
US$’000 US$’000
Trade receivables past due but not impaired:
Less than 90 days 4,600 10,496
91 to 120 days 728 57
More than 120 days 119 337
5,447 10,890
112

NOTES TO THE FINANCIAL STATEMENTS (cont’d)For the year ended 31 December 2012
24. Trade receivables (cont’d)
Receivables that are impaired
The Group’s trade receivables that are impaired at the balance sheet date and the movement of the allowance accounts used to record the impairment are as follows:
Group
Individually impaired
2012 2011
US$’000 US$’000
Trade receivables – nominal amounts 363 480
Less: Allowance for impairment (363) (480)
– –
Movement in allowance accounts:
At 1 January 480 219
Charge for the year 349 286
Bad debts written off against provision (466) (25)
At 31 December 363 480
Trade receivables that are individually determined to be impaired at the balance sheet date relate to debtors that are in signifi cant fi nancial diffi culties and have defaulted on payments. These receivables are not secured by any collateral or credit enhancements.
For the year ended 31 December 2012, net impairment loss on trade receivables of US$349,000 (2011: US$286,000) was recognised in the profi t or loss subsequent to a debt recovery assessment performed.
25. Derivatives
Group
2012 2011
US$’000 US$’000
Convertible option 178 –
During the year, the Group entered into a 5 years loan agreement through one of its subsidiaries for an amount of US$556,000 with an external party. There are convertible options embedded in the convertible loan entered with the external party. The loan bears interest of 2.5% per annum and can be convertible at the option of that subsidiary (lender) into 60% equity shares at any time during the tenure of the loan.
113
Food Empire Holdings Limited Annual Report 2012
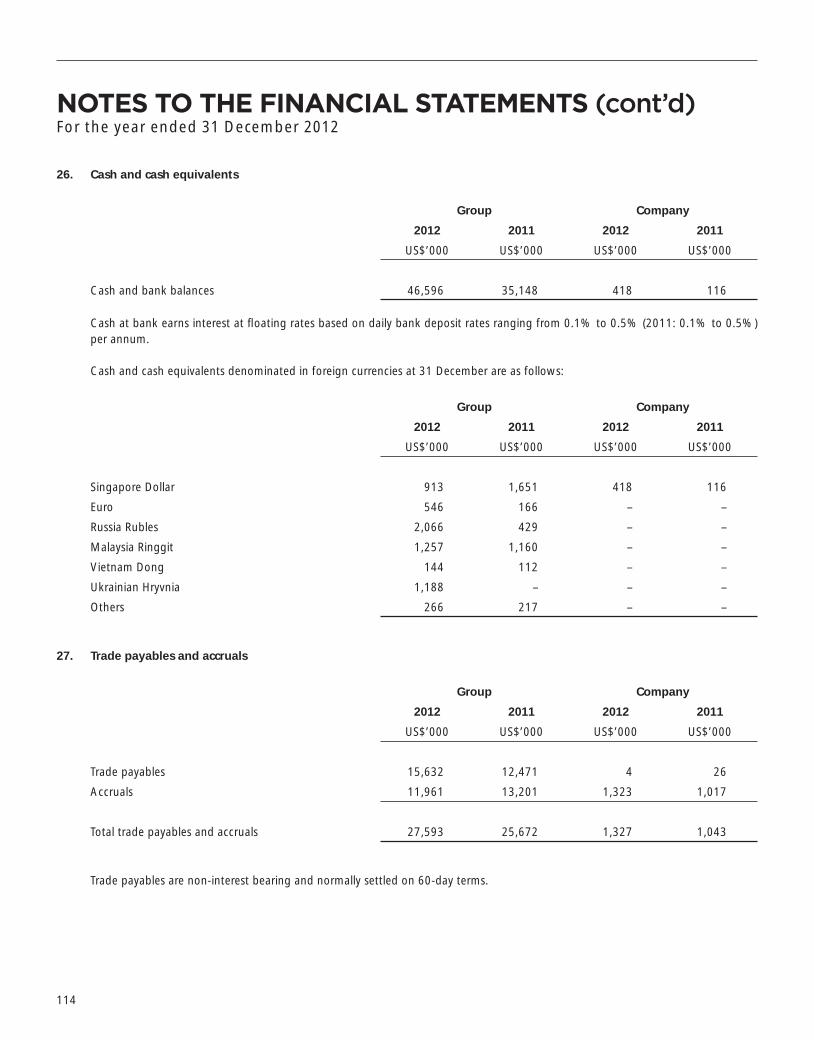
NOTES TO THE FINANCIAL STATEMENTS (cont’d)For the year ended 31 December 2012
26. Cash and cash equivalents
Group Company
2012 2011 2012 2011
US$’000 US$’000 US$’000 US$’000
Cash and bank balances 46,596 35,148 418 116
Cash at bank earns interest at fl oating rates based on daily bank deposit rates ranging from 0.1% to 0.5% (2011: 0.1% to 0.5%) per annum.
Cash and cash equivalents denominated in foreign currencies at 31 December are as follows:
Group Company
2012 2011 2012 2011
US$’000 US$’000 US$’000 US$’000
Singapore Dollar 913 1,651 418 116
Euro 546 166 – –
Russia Rubles 2,066 429 – –
Malaysia Ringgit 1,257 1,160 – –
Vietnam Dong 144 112 – –
Ukrainian Hryvnia 1,188 – – –
Others 266 217 – –
27. Trade payables and accruals
Group Company
2012 2011 2012 2011
US$’000 US$’000 US$’000 US$’000
Trade payables 15,632 12,471 4 26
Accruals 11,961 13,201 1,323 1,017
Total trade payables and accruals 27,593 25,672 1,327 1,043
Trade payables are non-interest bearing and normally settled on 60-day terms.
114

NOTES TO THE FINANCIAL STATEMENTS (cont’d)For the year ended 31 December 2012
27. Trade payables and accruals (cont’d)
Trade payables and accruals denominated in currencies other than the functional currency as at 31 December are as follows:
Group Company
2012 2011 2012 2011
US$’000 US$’000 US$’000 US$’000
Singapore Dollar 3,769 3,294 1,327 1,043
Euro 140 74 – –
Russia Rubles 1,059 1,116 – –
Vietnam Dong 522 235 – –
Ukrainian Hryvnia 294 – – –
Malaysia Ringgit 481 408 – –
Others 229 225 – – 28. Other payables
Group
2012 2011
US$’000 US$’000
Rental and other deposits 68 59
Sundry payables 8,330 660
Other payables 8,398 719
Included in the sundry payables for the year ended 31 December 2012 is an advance extended by the seller of the Group’s newly acquired Ukraine subsidiaries approximating US$6,411,000 (2011: Nil), bearing an interest of 3%.
The remaining sundry payables are non-interest bearing and are normally settled on a 120-day terms.
115
Food Empire Holdings Limited Annual Report 2012
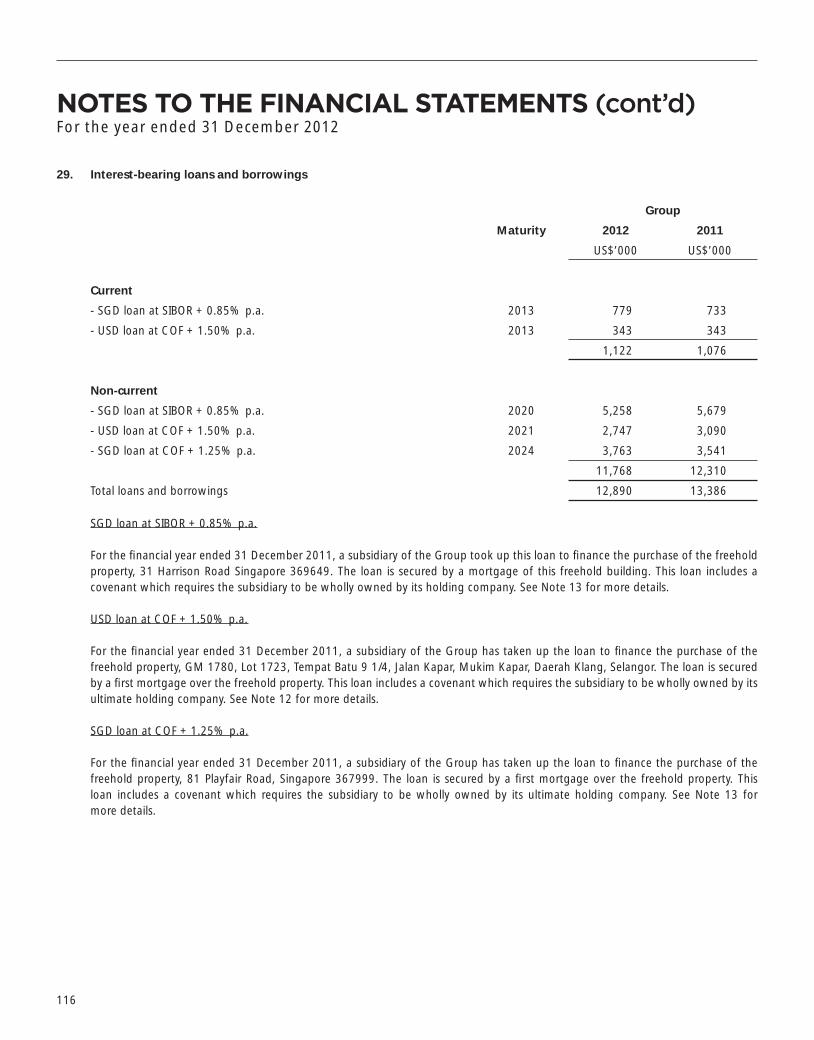
NOTES TO THE FINANCIAL STATEMENTS (cont’d)For the year ended 31 December 2012
29. Interest-bearing loans and borrowings
Group
Maturity 2012 2011
US$’000 US$’000
Current
- SGD loan at SIBOR + 0.85% p.a. 2013 779 733
- USD loan at COF + 1.50% p.a. 2013 343 343
1,122 1,076
Non-current
- SGD loan at SIBOR + 0.85% p.a. 2020 5,258 5,679
- USD loan at COF + 1.50% p.a. 2021 2,747 3,090
- SGD loan at COF + 1.25% p.a. 2024 3,763 3,541
11,768 12,310
Total loans and borrowings 12,890 13,386
SGD loan at SIBOR + 0.85% p.a.
For the fi nancial year ended 31 December 2011, a subsidiary of the Group took up this loan to fi nance the purchase of the freehold property, 31 Harrison Road Singapore 369649. The loan is secured by a mortgage of this freehold building. This loan includes a covenant which requires the subsidiary to be wholly owned by its holding company. See Note 13 for more details.
USD loan at COF + 1.50% p.a.
For the fi nancial year ended 31 December 2011, a subsidiary of the Group has taken up the loan to fi nance the purchase of the freehold property, GM 1780, Lot 1723, Tempat Batu 9 1/4, Jalan Kapar, Mukim Kapar, Daerah Klang, Selangor. The loan is secured by a fi rst mortgage over the freehold property. This loan includes a covenant which requires the subsidiary to be wholly owned by its ultimate holding company. See Note 12 for more details.
SGD loan at COF + 1.25% p.a.
For the fi nancial year ended 31 December 2011, a subsidiary of the Group has taken up the loan to fi nance the purchase of the freehold property, 81 Playfair Road, Singapore 367999. The loan is secured by a fi rst mortgage over the freehold property. This loan includes a covenant which requires the subsidiary to be wholly owned by its ultimate holding company. See Note 13 for more details.
116

NOTES TO THE FINANCIAL STATEMENTS (cont’d)For the year ended 31 December 2012
30. Share capital and treasury shares
(a) Share capital
Group and Company
2012 2011
US$’000 US$’000
Issued and fully paid:
At beginning of the year
529,413,999 (2011: 529,043,999) ordinary shares 39,751 39,666
Issued for cash under employee share option
3,300,000 ordinary shares issued at exercised price of S$0.229 619 44
140,000 ordinary shares issued at exercised price of S$0.335 38 32
140,000 ordinary shares issued at exercised price of S$0.315 36 –
Transfer from share-based payment reserve 20 9
At end of the year 40,464 39,751
The holders of ordinary shares are entitled to receive dividend as and when declared by the Company. All ordinary shares carry one vote per share without restrictions. The ordinary shares have no par value.
As at the end of the fi nancial year, unissued ordinary shares of the Company under options granted to eligible employees and Directors under the 2002 Option Scheme amounted to a total of 11,740,000 (2011: 15,890,000) ordinary shares. Details of outstanding options are set out in Note 32.
(b) Treasury shares
Group and Company
2012 2011
US$’000 US$’000
At 1 January – –
Acquired during the fi nancial year (317) –
At 31 December (317) –
Treasury shares relate to ordinary shares of the Company that is held by the Company.
The Company acquired 1,001,000 (2011: Nil) shares in the Company through purchases on the Singapore Exchange during the fi nancial year. The total amount paid to acquire the shares was US$317,000 (2011: Nil) and this was presented as a component within the shareholders’ equity.
117
Food Empire Holdings Limited Annual Report 2012

NOTES TO THE FINANCIAL STATEMENTS (cont’d)For the year ended 31 December 2012
31. Reserves
Group Company
2012 2011 2012 2011
US$’000 US$’000 US$’000 US$’000
Foreign currency translation reserve 974 850 4,234 3,869
Asset revaluation reserve 60 60 – –
Share-based payment reserve 1,136 825 1,136 825
Accumulated profi ts 119,097 103,115 5,682 5,291
121,267 104,850 11,052 9,985
(a) Foreign currency translation reserve
The foreign currency translation reserve represents exchange differences arising from the translation of the fi nancial statements of foreign operations whose functional currencies are different from that of the Group’s presentation currency.
(b) Asset revaluation reserve
The asset revaluation reserve represents increases in the fair value of freehold and leasehold properties, net of tax, and decreases to the extent that such decrease relates to an increase on the same asset previously recognised in other comprehensive income.
(c) Share-based payment reserve
Share-based payment reserve represents the equity-settled share options granted to employees (Note 32). The reserve is made up of the cumulative value of services rendered from employees recorded over the vesting period commencing from the grant date of equity-settled share options, and is reduced by the expiry or exercise of the share options.
(d) Fair value adjustment reserve
Fair value adjustment reserve represents the cumulative fair value changes, net of tax, of debentures until they are disposed or impaired.
118

NOTES TO THE FINANCIAL STATEMENTS (cont’d)For the year ended 31 December 2012
32. Employee benefi ts
The Food Empire Holdings Limited Share Option Scheme (the “2002 Option Scheme”) was approved and adopted at the Company’s Extraordinary General Meeting held on 22 January 2002 which has since expired on 31 December 2011.
The Food Empire Holdings Limited Share Option Scheme (the “2012 Option Scheme”) was approved and adopted at an Extraordinary General Meeting of the Company held on 27 April 2012. The 2012 Option Scheme applies to eligible employees and Directors of the Group, other than:
(i) the controlling shareholders of the Company and their associates(ii) Directors appointed by the controlling shareholders
The total number of shares in respect of which options may be offered shall not exceed 15% of the Company’s total issued share capital on the day immediately preceding the offer date.
The offer price of the options may be set at market price or at a price which is greater than the market price at the time of grant, at the discretion of the Remuneration Committee (“RC”).
The option period shall commence after 1 year from the offer date if the offer price is the prevailing market price.
The 2002 Option Scheme and 2012 Option Scheme is administered by the Remuneration Committee (“RC”) which comprises Mr. Lew Syn Pau (Chairman), Mr. Ong Kian Min, Mr. Boon Yoon Chiang, Mdm. Tan Guek Ming and Mr. Koh Yew Hiap.
119
Food Empire Holdings Limited Annual Report 2012

NOTES TO THE FINANCIAL STATEMENTS (cont’d)For the year ended 31 December 2012
32. Employee benefi ts (cont’d)
Movements in the number of ordinary shares outstanding under the 2002 Option Scheme as at 31 December 2012 and the details of the 2002 Option Scheme are as follows:
Number of
holders at end of
year
Number of options
outstanding at 1.1.2012
Number of options granted
during the fi nancial
year
Number of options lapsed
during the fi nancial
year
Number of options exercised
during the fi nancial
year
Number of options
outstanding at
31.12.2012
Exercise price per
shareS$
Exercise period
Remaining contractual life (years)
2002 Options 1 – 240,000 – (240,000) – – 0.142 14 March 2004 to
13 March 2012
–
2004 Options 1 3,400,000 – – (3,300,000) 100,000 0.229 25 May 2006 to 24 May 2014
1.4
2010 Options 16 3,730,000 – (30,000) (140,000) 3,560,000 0.335 4 January 2011 to
3 January 2020
7.0
2011 Options (February)
17 4,050,000 – (100,000) – 3,950,000 0.505 1 February 2012 to
31 January 2021
8.1
2011 Options (December)
19 4,470,000 – (200,000) (140,000) 4,130,000 0.315 19 December
2012 to 18 December
2021
9.0
15,890,000 – (570,000) 3,580,000 11,740,000
Weighted average share price (S$) 0.347 – 0.277 0.237 0.384
1 Included within these balances are equity-settled options that have not been recognised in accordance with FRS 102 as these
equity-settled options were granted on or before 22 November 2002. These options have not been subsequently modifi ed and therefore do not need to be accounted for in accordance with FRS 102.
120

NOTES TO THE FINANCIAL STATEMENTS (cont’d)For the year ended 31 December 2012
32. Employee benefi ts (cont’d)
Movements in the number of ordinary shares outstanding under the 2002 Option Scheme as at 31 December 2011 and the details of the 2002 Option Scheme are as follows:
Number of
holders at end of
year
Number of options
outstanding at 1.1.2011
Number of options granted
during the fi nancial
year
Number of options lapsed
during the fi nancial
year
Number of options exercised
during the fi nancial
year
Number of options
outstanding at
31.12.2011
Exercise price per
shareS$
Exercise period
Remaining contractual life (years)
2002 Options 1 4 240,000 – – – 240,000 0.142 14 March 2004 to
13 March 2012
0.2
2004 Options 2 3,650,000 – – (250,000) 3,400,000 0.229 25 May 2006 to 24 May
2014
2.4
2010 Options 17 4,750,000 – (900,000) (120,000) 3,730,000 0.335 4 January 2011 to
3 January 2020
8.0
2011 Options (February)
18 – 4,750,000 (700,000) – 4,050,000 0.505 1 February 2012 to
31 January 2021
9.1
2011 Options (December)
21 – 4,470,000 – – 4,470,000 0.315 19 December
2012 to 18 December
2021
10.0
8,640,000 9,220,000 (1,600,000) (370,000) 15,890,000
Weighted average share price (S$) 0.285 0.413 0.409 0.263 0.347
1 Included within these balances are equity-settled options that have not been recognised in accordance with FRS 102 as these
equity-settled options were granted on or before 22 November 2002. These options have not been subsequently modifi ed and therefore do not need to be accounted for in accordance with FRS 102.
121
Food Empire Holdings Limited Annual Report 2012
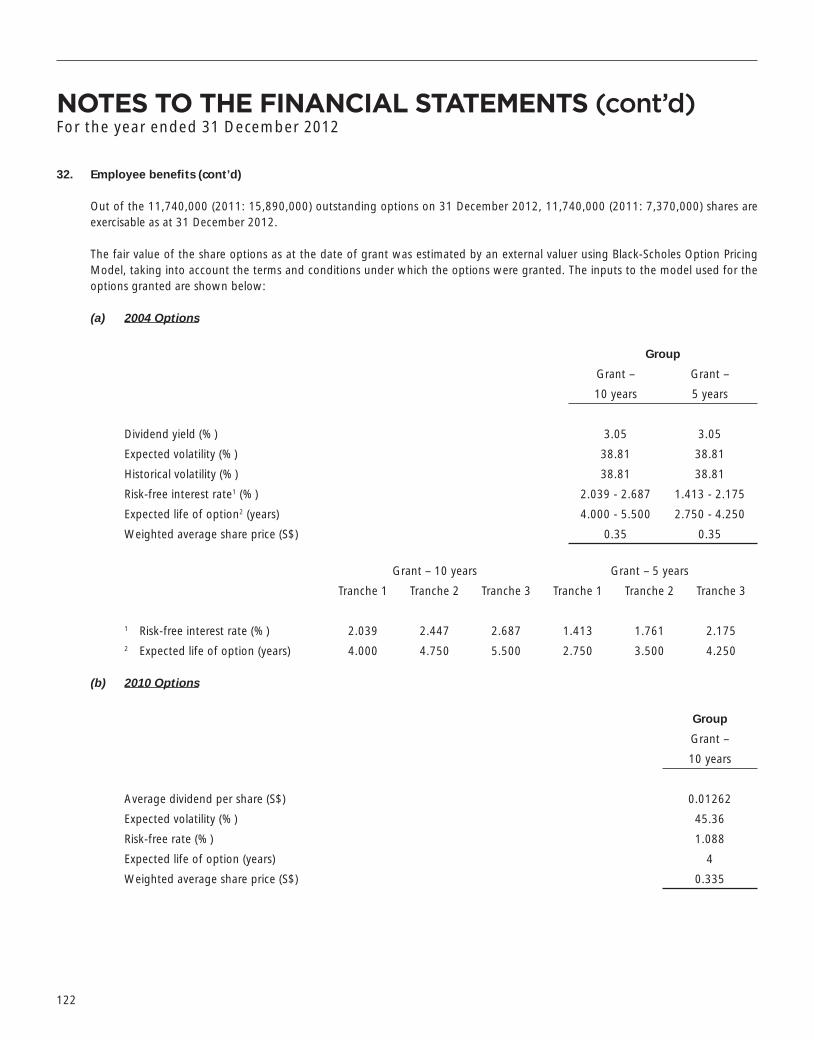
NOTES TO THE FINANCIAL STATEMENTS (cont’d)For the year ended 31 December 2012
32. Employee benefi ts (cont’d)
Out of the 11,740,000 (2011: 15,890,000) outstanding options on 31 December 2012, 11,740,000 (2011: 7,370,000) shares are exercisable as at 31 December 2012.
The fair value of the share options as at the date of grant was estimated by an external valuer using Black-Scholes Option Pricing Model, taking into account the terms and conditions under which the options were granted. The inputs to the model used for the options granted are shown below:
(a) 2004 Options
Group
Grant – Grant –
10 years 5 years
Dividend yield (%) 3.05 3.05
Expected volatility (%) 38.81 38.81
Historical volatility (%) 38.81 38.81
Risk-free interest rate1 (%) 2.039 - 2.687 1.413 - 2.175
Expected life of option2 (years) 4.000 - 5.500 2.750 - 4.250
Weighted average share price (S$) 0.35 0.35
Grant – 10 years Grant – 5 years
Tranche 1 Tranche 2 Tranche 3 Tranche 1 Tranche 2 Tranche 3
1 Risk-free interest rate (%) 2.039 2.447 2.687 1.413 1.761 2.1752 Expected life of option (years) 4.000 4.750 5.500 2.750 3.500 4.250
(b) 2010 Options
Group
Grant –
10 years
Average dividend per share (S$) 0.01262
Expected volatility (%) 45.36
Risk-free rate (%) 1.088
Expected life of option (years) 4
Weighted average share price (S$) 0.335
122

NOTES TO THE FINANCIAL STATEMENTS (cont’d)For the year ended 31 December 2012
32. Employee benefi ts (cont’d)
The fair value of the share options as at the date of grant was estimated by an external valuer using Trinomial Option Valuation Model, taking into account the terms and conditions under which the options were granted. The inputs to the model used for the options granted are shown below:
(c) 2011 Options (February)
Group
Grant –
10 years
Average dividend per share (S$) 0.01218
Expected volatility (%) 43.00
Risk-free rate (%) 0.935
Expected life of option (years) 4
Weighted average share price (S$) 0.505 (d) 2011 Options (December)
Group
Grant –
10 years
Average dividend per share (S$) 0.01218
Expected volatility (%) 41.23
Risk-free rate (%) 0.602
Expected life of option (years) 5
Weighted average share price (S$) 0.315
The expected life of the options is based on historical data and is not necessarily indicative of exercise patterns that may occur. The expected volatility refl ects the assumption that the historical volatility is indicative of future trends, which may not necessarily be the actual outcome.
No other features of the option grant were incorporated into the measurement of fair value.
123
Food Empire Holdings Limited Annual Report 2012

NOTES TO THE FINANCIAL STATEMENTS (cont’d)For the year ended 31 December 2012
33. Segment information
For management purposes, the Group is organised into 2 different business segments. Each business segment is a distinguishable component of the Group that is engaged in providing products or services that are subject to risks and returns that are different from each other. The 2 main segments are:
(i) The beverages segment is involved in the manufacture, sales and promotion of beverage products
(ii) The other products segment is involved in: • the manufacture, sales and promotion of other non-beverage products, such as confectionery, snack and frozen
convenience food • collection of rental income
Except as indicated above, no operating segments have been aggregated to form the above reporting operating segments.
The Group regularly reviews each business segment results for the purpose of making decisions about resource allocation and performance assessment. Segment performance is evaluated based on operating profi t or loss which in certain respects, as explained in the table below, is measured differently from the operating profi t or loss in the consolidated fi nancial statements.
Transfer pricing between operating parties, are on arm’s length basis in a manner similar to transactions with third parties.
124
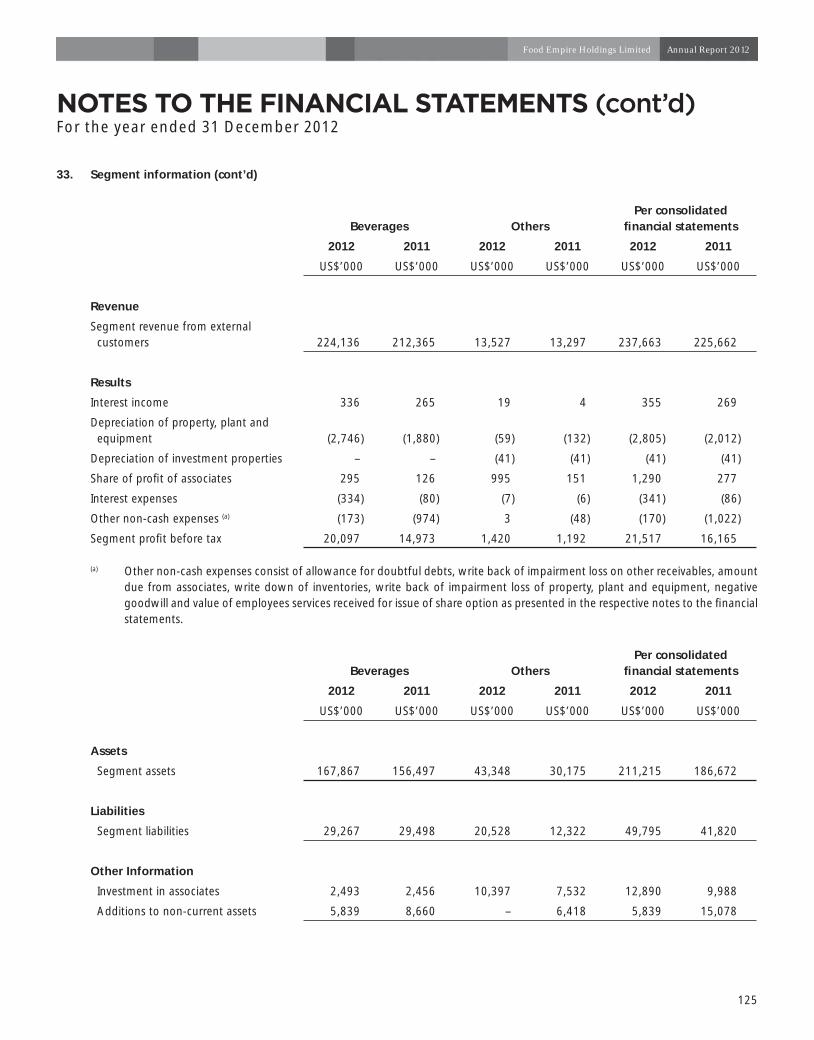
NOTES TO THE FINANCIAL STATEMENTS (cont’d)For the year ended 31 December 2012
33. Segment information (cont’d)
Beverages OthersPer consolidated
fi nancial statements
2012 2011 2012 2011 2012 2011
US$’000 US$’000 US$’000 US$’000 US$’000 US$’000
Revenue
Segment revenue from external customers 224,136 212,365 13,527 13,297 237,663 225,662
Results
Interest income 336 265 19 4 355 269
Depreciation of property, plant and equipment (2,746) (1,880) (59) (132) (2,805) (2,012)
Depreciation of investment properties – – (41) (41) (41) (41)
Share of profi t of associates 295 126 995 151 1,290 277
Interest expenses (334) (80) (7) (6) (341) (86)
Other non-cash expenses (a) (173) (974) 3 (48) (170) (1,022)
Segment profi t before tax 20,097 14,973 1,420 1,192 21,517 16,165
(a) Other non-cash expenses consist of allowance for doubtful debts, write back of impairment loss on other receivables, amount due from associates, write down of inventories, write back of impairment loss of property, plant and equipment, negative goodwill and value of employees services received for issue of share option as presented in the respective notes to the fi nancial statements.
Beverages OthersPer consolidated
fi nancial statements
2012 2011 2012 2011 2012 2011
US$’000 US$’000 US$’000 US$’000 US$’000 US$’000
Assets
Segment assets 167,867 156,497 43,348 30,175 211,215 186,672
Liabilities
Segment liabilities 29,267 29,498 20,528 12,322 49,795 41,820
Other Information
Investment in associates 2,493 2,456 10,397 7,532 12,890 9,988
Additions to non-current assets 5,839 8,660 – 6,418 5,839 15,078
125
Food Empire Holdings Limited Annual Report 2012

NOTES TO THE FINANCIAL STATEMENTS (cont’d)For the year ended 31 December 2012
33. Segment information (cont’d)
Geographical information
Segment revenue information based on the geographical location of customers are as follows:
Group
2012 2011
US$’000 US$’000
Russia 136,875 129,356
Eastern Europe and Central Asia 74,563 71,385
Other countries 26,225 24,921
237,663 225,662
Non-current assets and other information based on the geographical location of the assets are as follows:
Group
2012 2011
US$’000 US$’000
Singapore 25,415 24,314
Malaysia 9,536 7,050
Russia 11,687 11,532
Eastern Europe and Central Asia 10,644 4,431
Other countries 1,023 638
58,305 47,965
Non-current assets information presented above consist of property, plant and equipment, investment properties, and intangibles as presented in the consolidated balance sheet.
Information about a major customer
Revenue from one major customer amounted to US$130,778,000 (2011: US$120,379,000), arising from sales and services in the beverages segment.
126
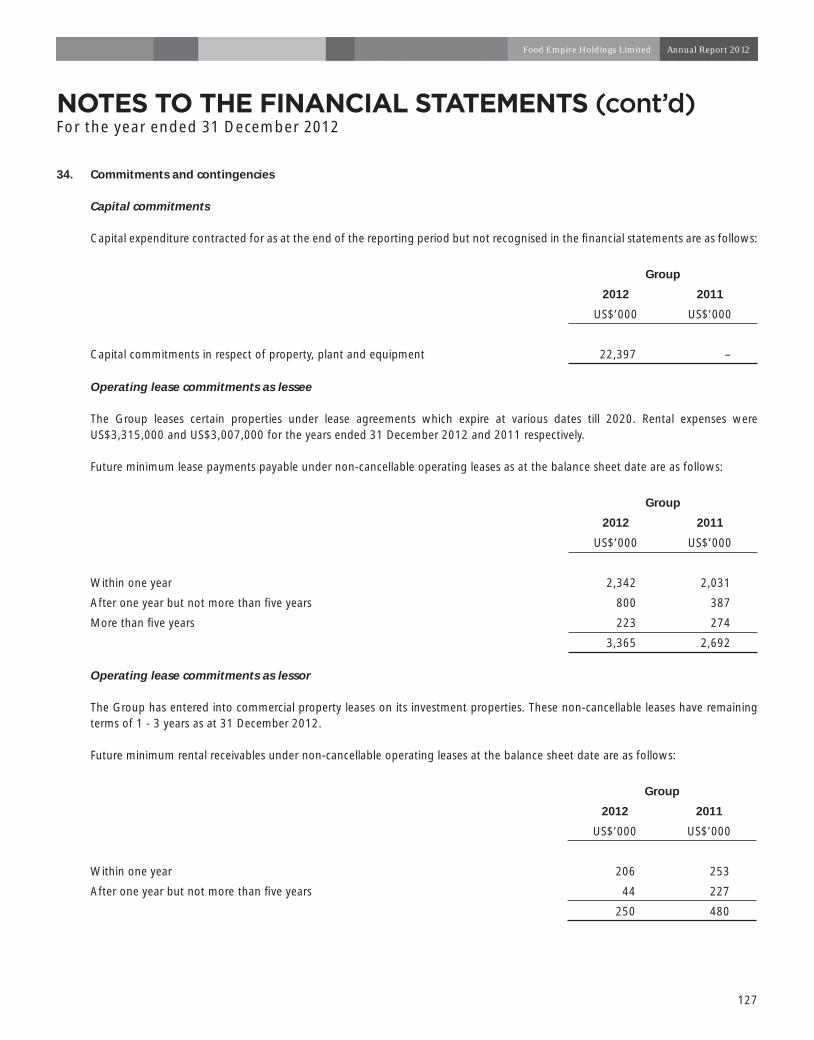
NOTES TO THE FINANCIAL STATEMENTS (cont’d)For the year ended 31 December 2012
34. Commitments and contingencies
Capital commitments
Capital expenditure contracted for as at the end of the reporting period but not recognised in the fi nancial statements are as follows:
Group
2012 2011
US$’000 US$’000
Capital commitments in respect of property, plant and equipment 22,397 –
Operating lease commitments as lessee
The Group leases certain properties under lease agreements which expire at various dates till 2020. Rental expenses were US$3,315,000 and US$3,007,000 for the years ended 31 December 2012 and 2011 respectively.
Future minimum lease payments payable under non-cancellable operating leases as at the balance sheet date are as follows:
Group
2012 2011
US$’000 US$’000
Within one year 2,342 2,031
After one year but not more than fi ve years 800 387
More than fi ve years 223 274
3,365 2,692
Operating lease commitments as lessor
The Group has entered into commercial property leases on its investment properties. These non-cancellable leases have remaining terms of 1 - 3 years as at 31 December 2012.
Future minimum rental receivables under non-cancellable operating leases at the balance sheet date are as follows:
Group
2012 2011
US$’000 US$’000
Within one year 206 253
After one year but not more than fi ve years 44 227
250 480
127
Food Empire Holdings Limited Annual Report 2012

NOTES TO THE FINANCIAL STATEMENTS (cont’d)For the year ended 31 December 2012
34. Commitments and contingencies (cont’d)
Finance lease commitments
The Group has fi nance leases for motor vehicles. The leases contain purchase options but no terms of renewal or escalation clauses.
Future minimum lease payments under fi nance leases together with the present value of the net minimum lease payments are as follows:
Group
2012 2011
Minimum lease
payments
Present value of
payments
Minimum lease
payments
Present value of payments
US$’000 US$’000 US$’000 US$’000
Not later than one year 10 10 9 9
Later than one year but not later than fi ve years 38 37 9 8
Total minimum lease payments 48 47 18 17
Less: Amounts representing fi nance charges (1) – (1) –
Present value of minimum lease 47 47 17 17
Contingent liabilities
The Company has given corporate guarantees to banks amounting to US$66,370,000 (2011: US$61,715,000) to secure banking facilities granted to its subsidiaries.
128

NOTES TO THE FINANCIAL STATEMENTS (cont’d)For the year ended 31 December 2012
35. Related party transactions
(a) Sales and purchase of goods and services
In addition to the related party information disclosed elsewhere in the fi nancial statements, the following signifi cant transactions between the Group and related parties took place at terms agreed between the parties during the fi nancial year:
2012 2011
US$’000 US$’000
Group
Triple Ace Ventures Limited and its subsidiaries
- Interest income received 182 148
- Loans provided – 1,300
- Rental expense paid 274 –
Simonelo Limited and its subsidiaries
- Rental expense paid 2,207 2,043
- Sale of property, plant and equipment 1 –
Companies associated to a substantial shareholder
- Consumption of services 11 –
- Sale of goods 1,362 795
Company
Subsidiaries
- Management fees received 1,338 1,278
- Dividend income received 5,884 10,255 (b) Compensation of key management personnel
Group
2012 2011
US$’000 US$’000
Salaries, wages and other staff benefi ts 3,844 3,214
Central Provident Fund contributions 41 40
Value of employee services received for issue of share options 200 189
Total compensation paid to key management personnel 4,085 3,443
129
Food Empire Holdings Limited Annual Report 2012
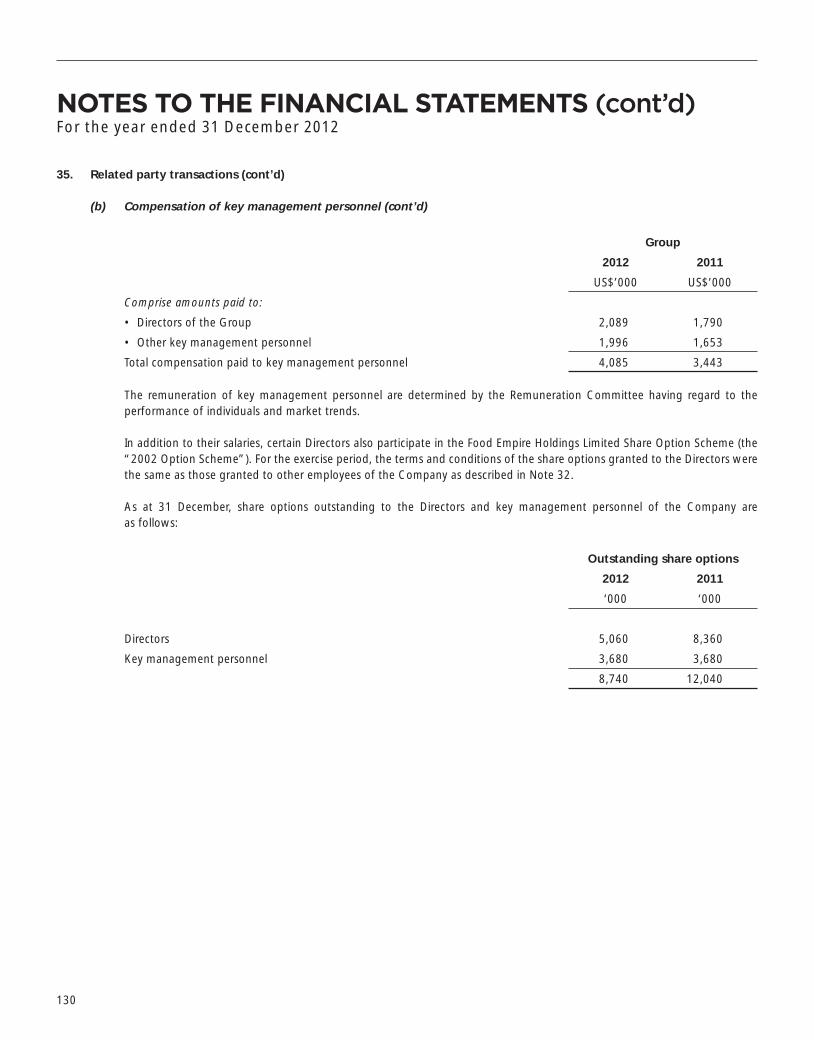
NOTES TO THE FINANCIAL STATEMENTS (cont’d)For the year ended 31 December 2012
35. Related party transactions (cont’d)
(b) Compensation of key management personnel (cont’d)
Group
2012 2011
US$’000 US$’000
Comprise amounts paid to:
• Directors of the Group 2,089 1,790
• Other key management personnel 1,996 1,653
Total compensation paid to key management personnel 4,085 3,443
The remuneration of key management personnel are determined by the Remuneration Committee having regard to the performance of individuals and market trends.
In addition to their salaries, certain Directors also participate in the Food Empire Holdings Limited Share Option Scheme (the “2002 Option Scheme”). For the exercise period, the terms and conditions of the share options granted to the Directors were the same as those granted to other employees of the Company as described in Note 32.
As at 31 December, share options outstanding to the Directors and key management personnel of the Company are as follows:
Outstanding share options
2012 2011
‘000 ‘000
Directors 5,060 8,360
Key management personnel 3,680 3,680
8,740 12,040
130
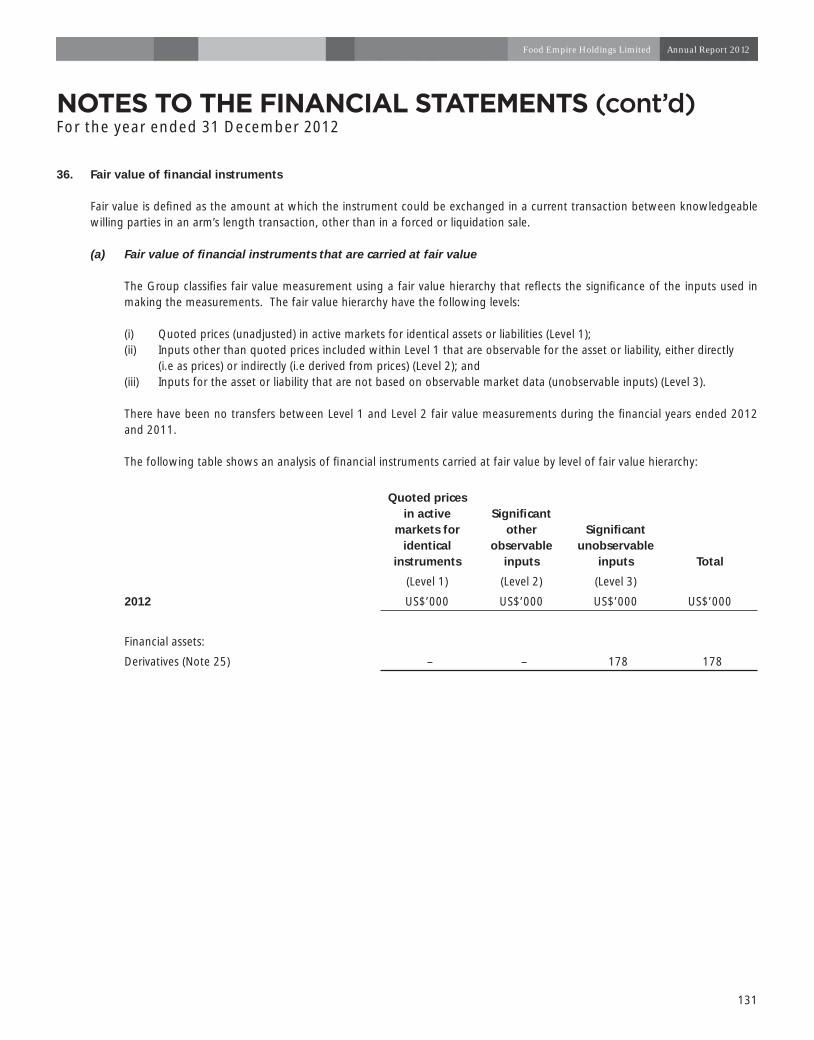
NOTES TO THE FINANCIAL STATEMENTS (cont’d)For the year ended 31 December 2012
36. Fair value of fi nancial instruments
Fair value is defi ned as the amount at which the instrument could be exchanged in a current transaction between knowledgeable willing parties in an arm’s length transaction, other than in a forced or liquidation sale.
(a) Fair value of fi nancial instruments that are carried at fair value
The Group classifi es fair value measurement using a fair value hierarchy that refl ects the signifi cance of the inputs used in making the measurements. The fair value hierarchy have the following levels:
(i) Quoted prices (unadjusted) in active markets for identical assets or liabilities (Level 1); (ii) Inputs other than quoted prices included within Level 1 that are observable for the asset or liability, either directly (i.e as prices) or indirectly (i.e derived from prices) (Level 2); and (iii) Inputs for the asset or liability that are not based on observable market data (unobservable inputs) (Level 3).
There have been no transfers between Level 1 and Level 2 fair value measurements during the fi nancial years ended 2012 and 2011.
The following table shows an analysis of fi nancial instruments carried at fair value by level of fair value hierarchy:
Quoted prices in active
markets for identical
instruments
Signifi cant other
observable inputs
Signifi cant unobservable
inputs Total
(Level 1) (Level 2) (Level 3)
2012 US$’000 US$’000 US$’000 US$’000
Financial assets:
Derivatives (Note 25) – – 178 178
131
Food Empire Holdings Limited Annual Report 2012
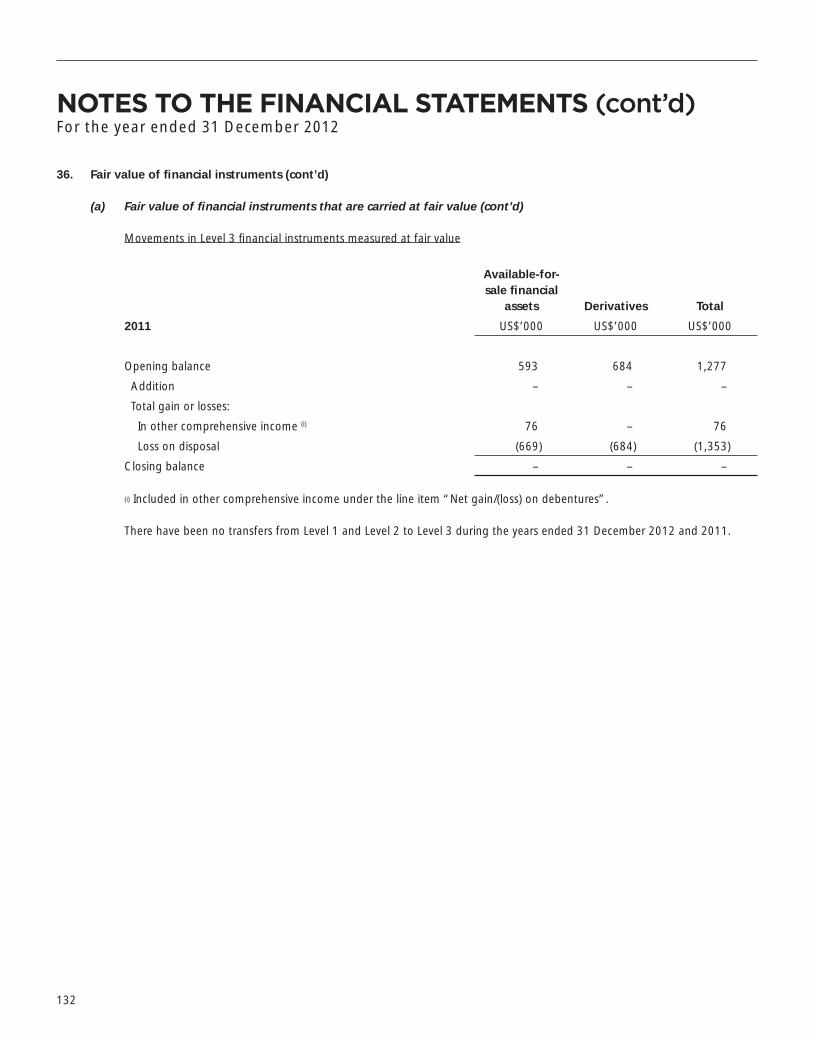
NOTES TO THE FINANCIAL STATEMENTS (cont’d)For the year ended 31 December 2012
36. Fair value of fi nancial instruments (cont’d)
(a) Fair value of fi nancial instruments that are carried at fair value (cont’d)
Movements in Level 3 fi nancial instruments measured at fair value
Available-for- sale fi nancial
assets Derivatives Total
2011 US$’000 US$’000 US$’000
Opening balance 593 684 1,277
Addition – – –
Total gain or losses:
In other comprehensive income (i) 76 – 76
Loss on disposal (669) (684) (1,353)
Closing balance – – –
(i) Included in other comprehensive income under the line item “Net gain/(loss) on debentures”.
There have been no transfers from Level 1 and Level 2 to Level 3 during the years ended 31 December 2012 and 2011.
132
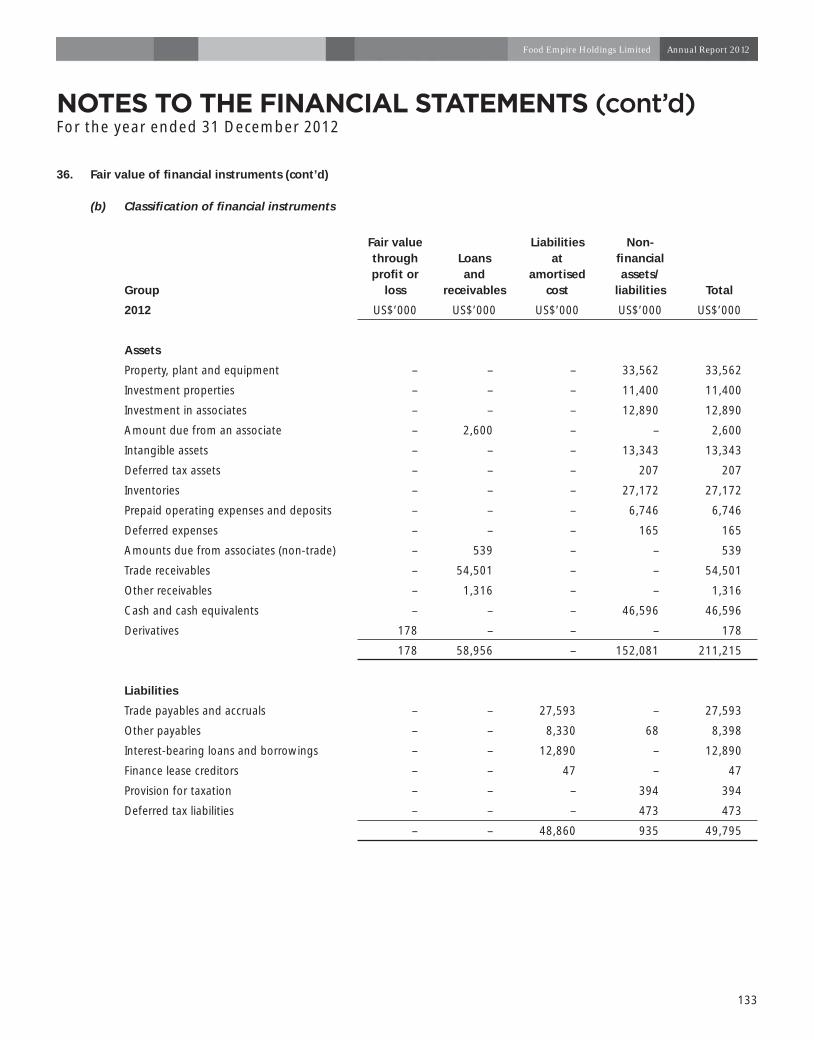
NOTES TO THE FINANCIAL STATEMENTS (cont’d)For the year ended 31 December 2012
36. Fair value of fi nancial instruments (cont’d)
(b) Classifi cation of fi nancial instruments
Group
Fair value through profi t or
loss
Loans and
receivables
Liabilities at
amortised cost
Non-fi nancial assets/
liabilities Total
2012 US$’000 US$’000 US$’000 US$’000 US$’000
Assets
Property, plant and equipment – – – 33,562 33,562
Investment properties – – – 11,400 11,400
Investment in associates – – – 12,890 12,890
Amount due from an associate – 2,600 – – 2,600
Intangible assets – – – 13,343 13,343
Deferred tax assets – – – 207 207
Inventories – – – 27,172 27,172
Prepaid operating expenses and deposits – – – 6,746 6,746
Deferred expenses – – – 165 165
Amounts due from associates (non-trade) – 539 – – 539
Trade receivables – 54,501 – – 54,501
Other receivables – 1,316 – – 1,316
Cash and cash equivalents – – – 46,596 46,596
Derivatives 178 – – – 178
178 58,956 – 152,081 211,215
Liabilities
Trade payables and accruals – – 27,593 – 27,593
Other payables – – 8,330 68 8,398
Interest-bearing loans and borrowings – – 12,890 – 12,890
Finance lease creditors – – 47 – 47
Provision for taxation – – – 394 394
Deferred tax liabilities – – – 473 473
– – 48,860 935 49,795
133
Food Empire Holdings Limited Annual Report 2012

NOTES TO THE FINANCIAL STATEMENTS (cont’d)For the year ended 31 December 2012
36. Fair value of fi nancial instruments (cont’d)
(b) Classifi cation of fi nancial instruments (cont’d)
Group
Fair value through profi t or
loss
Loans and
receivables
Liabilities at
amortised cost
Non-fi nancial assets/
liabilities Total
2011 US$’000 US$’000 US$’000 US$’000 US$’000
Assets
Property, plant and equipment – – – 23,857 23,857
Investment properties – – – 10,765 10,765
Investment in associates – – – 9,988 9,988
Amount due from an associate – 2,600 – – 2,600
Intangible assets – – – 13,343 13,343
Deferred tax assets – – – 142 142
Inventories – – – 22,257 22,257
Prepaid operating expenses and deposits – – – 2,173 2,173
Deferred expenses – – – 400 400
Amounts due from associates (non-trade) – 514 – – 514
Trade receivables – 63,050 – – 63,050
Other receivables – 2,316 – 119 2,435
Cash and cash equivalents – – – 35,148 35,148
– 68,480 – 118,192 186,672
Liabilities
Trade payables and accruals – – 25,672 – 25,672
Other payables – – 660 59 719
Interest-bearing loans and borrowings – – 13,386 – 13,386
Finance lease creditors – – 17 – 17
Provision for taxation – – – 1,662 1,662
Deferred tax liabilities – – – 364 364
– – 39,735 2,085 41,820
134

NOTES TO THE FINANCIAL STATEMENTS (cont’d)For the year ended 31 December 2012
36. Fair value of fi nancial instruments (cont’d)
(b) Classifi cation of fi nancial instruments (cont’d)
CompanyLoans and receivables
Liabilities at amortised
cost
Non-fi nancial assets/
liabilities Total
2012 US$’000 US$’000 US$’000 US$’000
Assets
Property, plant and equipment – – 186 186
Investment in subsidiaries – – 44,545 44,545
Prepaid operating expenses – – 46 46
Amounts due from subsidiaries (non-trade) 7,353 – – 7,353
Cash and cash equivalents 418 – – 418
7,771 – 44,777 52,548
Liabilities
Trade payables and accruals – 1,327 – 1,327
Amounts due to subsidiaries – 22 – 22
– 1,349 – 1,349
Company
2011
Assets
Property, plant and equipment – – 221 221
Investment in subsidiaries – – 44,545 44,545
Prepaid operating expenses – – 29 29
Amounts due from subsidiaries (non-trade) 5,889 – – 5,889
Cash and cash equivalents 116 – – 116
6,005 – 44,795 50,800
Liabilities
Trade payables and accruals – 1,043 – 1,043
Amounts due to subsidiaries – 21 – 21
– 1,064 – 1,064
135
Food Empire Holdings Limited Annual Report 2012

NOTES TO THE FINANCIAL STATEMENTS (cont’d)For the year ended 31 December 2012
37. Financial risk management objectives and policies
The Group and the Company are exposed to fi nancial risks arising from its operations and the use of fi nancial instruments. The key fi nancial risks include credit risk, liquidity risk, interest rate risk and foreign currency risk. The Board of Directors reviews and agrees policies and procedures for the management of these risks.
The Group and the Company does not apply hedge accounting.
The following sections provide details regarding the Group’s and Company’s exposure to the above-mentioned fi nancial risks and the objectives, policies and processes for the management of these risks. There has been no changes to the Group’s exposure to these fi nancial risks or the manner in which it manages and measures the risks.
(a) Credit risk
Credit risk is the risk of loss that may arise on outstanding fi nancial instruments should a counterparty default on its obligations. The Group’s and the Company’s exposure to credit risk arises primarily from trade and other receivables. For other fi nancial assets (including cash and cash equivalents), the Group and the Company minimise credit risk by dealing with high credit rating counterparties.
The management has a credit policy in place and exposure of credit risk is monitored on an on-going basis. The management believes that concentration of credit risk is limited due to on-going credit evaluations on all customers and maintaining an allowance for doubtful receivables, which the management believes will adequately provide for potential credit risks.
The Group sells mainly to Russia and Eastern European countries. Hence, risk is concentrated on the trade receivables in these countries.
Exposure to credit risk
At the balance sheet date, the Group’s and the Company’s maximum exposure to credit risk is represented by the carrying amount of each fi nancial assets in the balance sheets.
136

NOTES TO THE FINANCIAL STATEMENTS (cont’d)For the year ended 31 December 2012
37. Financial risk management objectives and policies (cont’d)
(a) Credit risk (cont’d)
Credit risk concentration profi le
The Group determines concentrations of credit risk by monitoring the country and industry sector profi le of its trade receivables on an on-going basis. The credit risk concentration profi le of the Group’s trade receivables at the balance sheet date is as follows:
Group
2012 2011
US$’000 US$’000
By country:
Russia 33,099 41,403
Eastern Europe and Central Asia 15,085 15,308
Other countries 6,317 6,339
54,501 63,050
Financial assets that are neither past due nor impaired
Trade and other receivables that are neither past due nor impaired are creditworthy debtors with good payment record with the Group. Cash and cash equivalents that are neither past due nor impaired are placed with or entered into with reputable fi nancial institutions or companies with high credit ratings and no history of default.
Financial assets that are either past due or impaired
Information regarding fi nancial assets that are either past due or impaired is disclosed in Note 24.
(b) Liquidity risk
Liquidity risk is the risk that the Group or the Company will encounter diffi culty in meeting fi nancial obligations due to shortage of funds. The Group’s and the Company’s exposure to liquidity risk arises primarily from mismatches of the maturities of fi nancial assets and liabilities.
The Group monitors its liquidity risk and maintains a level of cash and cash equivalents deemed adequate by Management to fi nance the Group’s operation and to mitigate the effects of fl uctuations in cash fl ows.
137
Food Empire Holdings Limited Annual Report 2012

NOTES TO THE FINANCIAL STATEMENTS (cont’d)For the year ended 31 December 2012
37. Financial risk management objectives and policies (cont’d)
(b) Liquidity risk (cont’d)
The table below summarises the maturity profi le of the Group’s and the Company’s fi nancial assets and liabilities at the balance sheet date based on contractual undiscounted payments.
GroupWithin1 year
Within 1 to 5 years
More than 5 years Total
US$’000 US$’000 US$’000 US$’000
2012
Trade and other receivables 54,501 – – 54,501
Cash and cash equivalents 46,596 – – 46,596
Interest-bearing loans and borrowings (1,122) (4,488) (7,280) (12,890)
Finance lease obligation (10) (37) – (47)
Trade and other payables (27,593) – – (27,593)
Total net undiscounted fi nancial assets/(liabilities) 72,372 (4,525) (7,280) 60,567
2011
Trade and other receivables 65,485 – – 65,485
Cash and cash equivalents 35,148 – – 35,148
Interest-bearing loans and borrowings (1,076) (4,304) (8,006) (13,386)
Finance lease obligation (9) (9) – (18)
Trade and other payables (26,391) – – (26,391)
Total net undiscounted fi nancial assets/(liabilities) 73,157 (4,313) (8,006) 60,838
Company
2012
Amounts due from subsidiaries (non-trade) 7,353 – – 7,353
Cash and cash equivalents 418 – – 418
Trade and other payables (1,327) – – (1,327)
Amounts due to subsidiaries (non-trade) (22) – – (22)
Total net undiscounted fi nancial assets 6,422 – – 6,422
138

NOTES TO THE FINANCIAL STATEMENTS (cont’d)For the year ended 31 December 2012
37. Financial risk management objectives and policies (cont’d)
(b) Liquidity risk (cont’d)
CompanyWithin 1 year
Within 1 to 5 years
More than 5 years Total
US$’000 US$’000 US$’000 US$’000
2011
Amounts due from subsidiaries (non-trade) 5,889 – – 5,889
Cash and cash equivalents 116 – – 116
Trade and other payables (1,043) – – (1,043)
Amounts due to subsidiaries (non-trade) (21) – – (21)
Total net undiscounted fi nancial assets 4,941 – – 4,941
(c) Interest rate risk
Interest rate risk is the risk that the fair value or future cash fl ows of the Group’s fi nancial instruments will fl uctuate because of changes in market interest rates. The Group’s and the Company’s exposure to interest rate risk arises primarily from interest-bearing loans and borrowings. The Group monitors the interest rate on loans and borrowings closely to ensure that the loans and borrowings are maintained at favorable rate.
The following table demonstrates the sensitivity of the Group’s profi t net of tax to a reasonably possible change in interest rate, with all other variables held constant.
Increase/ decrease in basis points
Effect on profi t, net of
tax
US$’000
2012
Cash and cash equivalents +10 41
Amounts due from associates (non-trade) +100 260
Interest-bearing loans and borrowings +100 (129)
Other payables +100 (139)
2011
Cash and cash equivalents +10 32
Amounts due from associates (non-trade) +100 20
Interest-bearing loans and borrowings +100 (233)
139
Food Empire Holdings Limited Annual Report 2012

NOTES TO THE FINANCIAL STATEMENTS (cont’d)For the year ended 31 December 2012
37. Financial risk management objectives and policies (cont’d)
(c) Interest rate risk (cont’d)
The following tables set out the carrying amount, by maturity, of the Group’s and the Company’s fi nancial instruments that are exposed to interest rate risk:
GroupWithin 1 year
1 – 2 years
2 – 3 years
3 – 4 years
4 – 5 years
More than 5 years Total
US$’000 US$’000 US$’000 US$’000 US$’000 US$’000 US$’000
2012
Fixed rate
Other receivables 378 – – – – – 378
Derivatives 178 – – – – – 178
Floating rate
Cash and bank balances 46,596 – – – – – 46,596
Amount due from an associate – 2,600 – – – – 2,600
Finance lease obligation 10 37 – – – – 47
Interest-bearing loans and borrowings 1,122 1,122 1,122 1,122 1,122 7,280 12,890
Company
2012
Floating rate
Cash and bank balances 418 – – – – – 418
Group
2011
Fixed rate
Debentures – – – – – – –
Floating rate
Cash and bank balances 35,148 – – – – – 35,148
Amount due from an associate – – 2,600 – – – 2,600
Finance lease obligation 9 8 – – – – 17
Interest-bearing loans and borrowings 1,076 1,076 1,076 1,076 1,076 8,006 13,386
Company
2011
Floating rate
Cash and bank balances 116 – – – – – 116 140

NOTES TO THE FINANCIAL STATEMENTS (cont’d)For the year ended 31 December 2012
37. FINANCIAL RISK MANAGEMENT OBJECTIVES AND POLICIES (cont’d)
(d) Foreign currency risk
The Group has transactional currency exposures arising from sales, purchases or operating costs by operating units in currencies other than the unit’s functional currency. Approximately 1.7% (2011: 1.6%) of the Group’s sales are denominated in currencies other than the functional currency of the operating unit making the sale, whilst 86.2% (2011: 88.1%) of purchases and operating costs are denominated in the unit’s functional currency.
The management ensures that the net exposure is maintained at an acceptable level by buying and selling foreign currencies at spot rates where necessary to address short-term fl uctuations.
Sensitivity analysis for foreign currency risk
The following table demonstrates the sensitivity to a reasonably possible change in the USD, SGD, EURO, Malaysia Ringgit (RM), Sterling Pound (GBP), Ukrainian Hryvnia (UAH) and Renminbi (RMB) against the respective functional currencies of the Group entities, with all variables held constant, of the Group’s profi t before tax.
Group
Profi t before tax
2012 2011
US$’000 US$’000
SGD/USD - strengthened 5% (2011: 5%) 82 42
- weakened 5% (2011: 5%) (82) (42)
EURO/USD - strengthened 5% (2011: 5%) 33 32
- weakened 5% (2011: 5%) (33) (32)
RM/USD - strengthened 5% (2011: 5%) 238 200
- weakened 5% (2011: 5%) (238) (200)
GBP/USD - strengthened 5% (2011: 5%) – 9
- weakened 5% (2011: 5%) – (9)
UAH/USD - strengthened 5% (2011: 5%) 559 –
- weakened 5% (2011: 5%) (559) –
RMB/USD - strengthened 5% (2011: 5%) 5 –
- weakened 5% (2011: 5%) (5) –
38. Capital management
The primary objective of the Group’s capital management is to ensure that it maintains a strong credit rating and healthy capital ratios in order to support its business and maximize shareholder value.
The Group manages its capital structure and makes adjustments to it, in light of changes in economic conditions. To maintain or adjust the capital structure, the Group may adjust the dividend payment to shareholders, return capital to shareholders or issue new shares. No changes were made in the objectives, policies or processes during the years ended 31 December 2012 and 31 December 2011.
141
Food Empire Holdings Limited Annual Report 2012

NOTES TO THE FINANCIAL STATEMENTS (cont’d)For the year ended 31 December 2012
38. Capital management (cont’d)
The Group monitors its capital structure as follows:
2012 2011
US$’000 US$’000
Interest-bearing loans and borrowings (Note 29) 12,890 13,386
Finance lease creditors (Note 34) 47 17
Trade payables and accruals (Note 27) 27,593 25,672
Other payables (Note 28) 8,398 719
Less: Cash and cash equivalents (Note 26) (46,596) (35,148)
Net debt 2,332 4,646
Equity attributable to the equity holders of the Company 161,414 144,601
Capital and net debt 163,746 149,247 39. Event occurring after balance sheet date
On 8 March 2013, the Company granted 4,880,000 options to subscribe for ordinary shares exercisable between 8 March 2014 to 7 March 2023 at market price of S$0.669 per share to selected group of Directors and employees eligible under the 2012 Option Scheme.
Details of the 8 March 2013 options granted are as follows:-
Exercisable periodNumber of options granted
which is exercisable
Executive Directors and other employees
Tranche 1 8 March 2014 - 7 March 2023 1,832,000
Tranche 2 8 March 2015 - 7 March 2023 1,374,000
Tranche 3 8 March 2016 - 7 March 2023 1,374,000
4,580,000
Non-executive Directors
Tranche 1 8 March 2014 - 7 March 2018 120,000
Tranche 2 8 March 2015 - 7 March 2018 90,000
Tranche 3 8 March 2016 - 7 March 2018 90,000
300,000
142
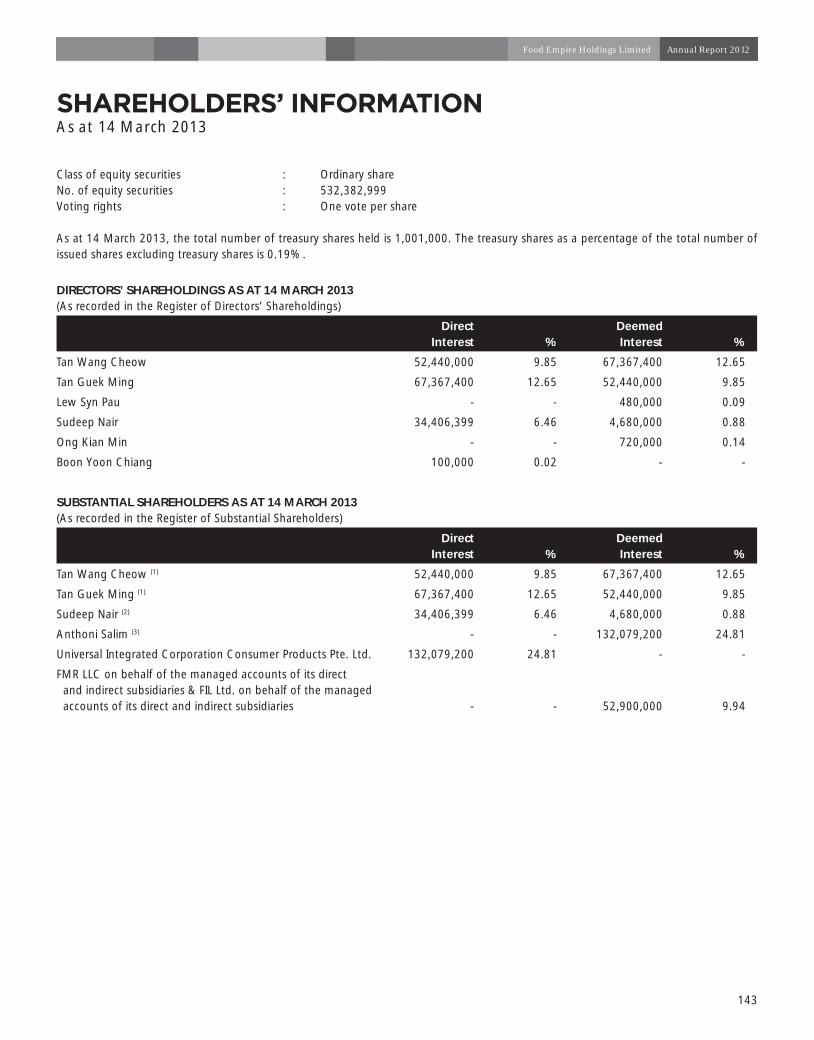
SHAREHOLDERS’ INFORMATIONAs at 14 March 2013
Class of equity securities : Ordinary shareNo. of equity securities : 532,382,999Voting rights : One vote per share
As at 14 March 2013, the total number of treasury shares held is 1,001,000. The treasury shares as a percentage of the total number of issued shares excluding treasury shares is 0.19%.
DIRECTORS’ SHAREHOLDINGS AS AT 14 MARCH 2013(As recorded in the Register of Directors’ Shareholdings)
DirectInterest %
DeemedInterest %
Tan Wang Cheow 52,440,000 9.85 67,367,400 12.65
Tan Guek Ming 67,367,400 12.65 52,440,000 9.85
Lew Syn Pau - - 480,000 0.09
Sudeep Nair 34,406,399 6.46 4,680,000 0.88
Ong Kian Min - - 720,000 0.14
Boon Yoon Chiang 100,000 0.02 - -
SUBSTANTIAL SHAREHOLDERS AS AT 14 MARCH 2013(As recorded in the Register of Substantial Shareholders)
DirectInterest %
DeemedInterest %
Tan Wang Cheow (1) 52,440,000 9.85 67,367,400 12.65
Tan Guek Ming (1) 67,367,400 12.65 52,440,000 9.85
Sudeep Nair (2) 34,406,399 6.46 4,680,000 0.88
Anthoni Salim (3) - - 132,079,200 24.81
Universal Integrated Corporation Consumer Products Pte. Ltd. 132,079,200 24.81 - -
FMR LLC on behalf of the managed accounts of its direct and indirect subsidiaries & FIL Ltd. on behalf of the managed accounts of its direct and indirect subsidiaries - - 52,900,000 9.94
143
Food Empire Holdings Limited Annual Report 2012
SHAREHOLDERS’ INFORMATION (cont’d)As at 14 March 2013
Notes:1 Mr. Tan Wang Cheow and Mdm. Tan Guek Ming are husband and wife. Mr. Tan Wang Cheow is deemed to have an interest in
the shares held by Mdm. Tan Guek Ming and vice versa.
2 Mr. Sudeep Nair is deemed to have an interest in the 4,680,000 shares held by UOB Kay Hian Pte Ltd, Kim Eng Securities Pte Ltd and DMG & Partners Securities Pte Ltd.
3 Mr. Anthoni Salim is the ultimate benefi cial owner of the entire issued share capital of Trevose International Pte Ltd, which is the sole shareholder of Universal Integrated Corporation Consumer Products Pte Ltd. Mr. Anthoni Salim is deemed to have an interest in the shares held by Universal Integrated Corporation Consumer Products Pte Ltd.
PUBLIC FLOAT
As at 14 March 2013, 35.16% of the Company’s shares are held in the hands of public. Accordingly, the Company has complied with Rule 723 of the Listing Manual of SGX-ST.
144

STATISTICS OF SHAREHOLDINGSAs at 14 March 2013
DISTRIBUTION OF SHAREHOLDINGS
Size of ShareholdingsNo. of
Shareholders % No. of Shares %
1 - 999 50 3.59 19,245 0.00
1,000 - 10,000 752 54.06 3,132,357 0.59
10,001 - 1,000,000 559 40.19 40,240,898 7.56
1,000,001 AND ABOVE 30 2.16 488,990,499 91.85
TOTAL : 1,391 100.00 532,382,999 100.00 TWENTY LARGEST SHAREHOLDERS
No. NameNo.
of Shares %
1. DBS NOMINEES PTE LTD 136,303,500 25.60
2. TAN GUEK MING 67,367,400 12.65
3. RAFFLES NOMINEES (PTE) LTD 53,112,000 9.98
4. TAN WANG CHEOW 52,440,000 9.85
5. SUDEEP NAIR 34,406,399 6.46
6. CITIBANK NOMINEES SINGAPORE PTE LTD 32,299,100 6.07
7. MAYBANK KIM ENG SECURITIES PTE LTD 20,330,400 3.82
8. OON PENG HENG 13,005,500 2.44
9. KOH PUAY LING 11,000,000 2.07
10. CHAN MENG HUAT 9,567,000 1.80
11. OON PENG LIM 9,257,300 1.74
12. TAN BIAN CHYE 7,580,800 1.42
13. OON PENG LAM 6,010,500 1.13
14. MERRILL LYNCH (SINGAPORE) PTE LTD 4,322,800 0.81
15. LIM SIEW KHENG 3,460,000 0.65
16. OON PENG WAH 3,022,500 0.57
17. YEAH HIANG NAM @ YEO HIANG NAM 2,943,000 0.55
18. TAN SIOK CHER 2,760,000 0.52
19. TAN SEOK WAH 2,630,000 0.49
20. UNITED OVERSEAS BANK NOMINEES (PTE) LTD 2,289,400 0.43
TOTAL : 474,107,599 89.05
145
Food Empire Holdings Limited Annual Report 2012

NOTICE OF ANNUAL GENERAL MEETING
NOTICE IS HEREBY GIVEN that the Annual General Meeting of Food Empire Holdings Limited (“the Company”) will be held at Marina Mandarin Hotel, Vanda Ballroom Level 5, 6 Raffl es Boulevard, Marina Square, Singapore 039594 on Tuesday, 23 April 2013 at 3.00 p.m. for the following purposes:
AS ORDINARY BUSINESS
1. To receive and adopt the Directors’ Report and the Audited Financial Statements of the Company for the year ended 31 December 2012 together with the Auditors’ Report thereon.
(Resolution 1) 2. To declare a fi rst and fi nal dividend of 1.231 Singapore cents per ordinary share (one-tier tax exempt) for the year ended 31
December 2012 (2011: A fi rst and fi nal dividend of 1.052 Singapore cents per ordinary share (one-tier tax exempt)). (Resolution 2)
3. To re-elect the following Directors of the Company retiring pursuant to Article 115 of the Articles of Association of the Company: Mr. Lew Syn Pau (Resolution 3) Mr. Ong Kian Min (Resolution 4) Mr. Sudeep Nair (Resolution 5)
Mr. Lew Syn Pau will, upon re-election as a Director of the Company, remain as Chairman of Nominating and Remuneration Committees and a member of the Audit Committee and will be considered independent.
Mr. Ong Kian Min will, upon re-election as a Director of the Company, remain as Chairman of the Audit Committee and a member of the Nominating and Remuneration Committees and will be considered independent.
4. To re-appoint Mr. Boon Yoon Chiang, a Director of the Company retiring under Section 153(6) of the Companies Act, Cap. 50, to hold offi ce from the date of this Annual General Meeting until the next Annual General Meeting of the Company.
[See Explanatory Note (i)]
Mr. Boon Yoon Chiang will, upon re-appointment as a Director of the Company, remain as member of the Audit, Nominating and Remuneration Committees and will be considered independent.
(Resolution 6)
5. To approve the payment of Directors’ fees of S$333,000 for the year ended 31 December 2012 (2011: S$306,000). (Resolution 7)
6. To re-appoint Ernst & Young LLP as the Auditors of the Company and to authorise the Directors of the Company to fi x their remuneration.
(Resolution 8) 7. To transact any other ordinary business which may properly be transacted at an Annual General Meeting.
146
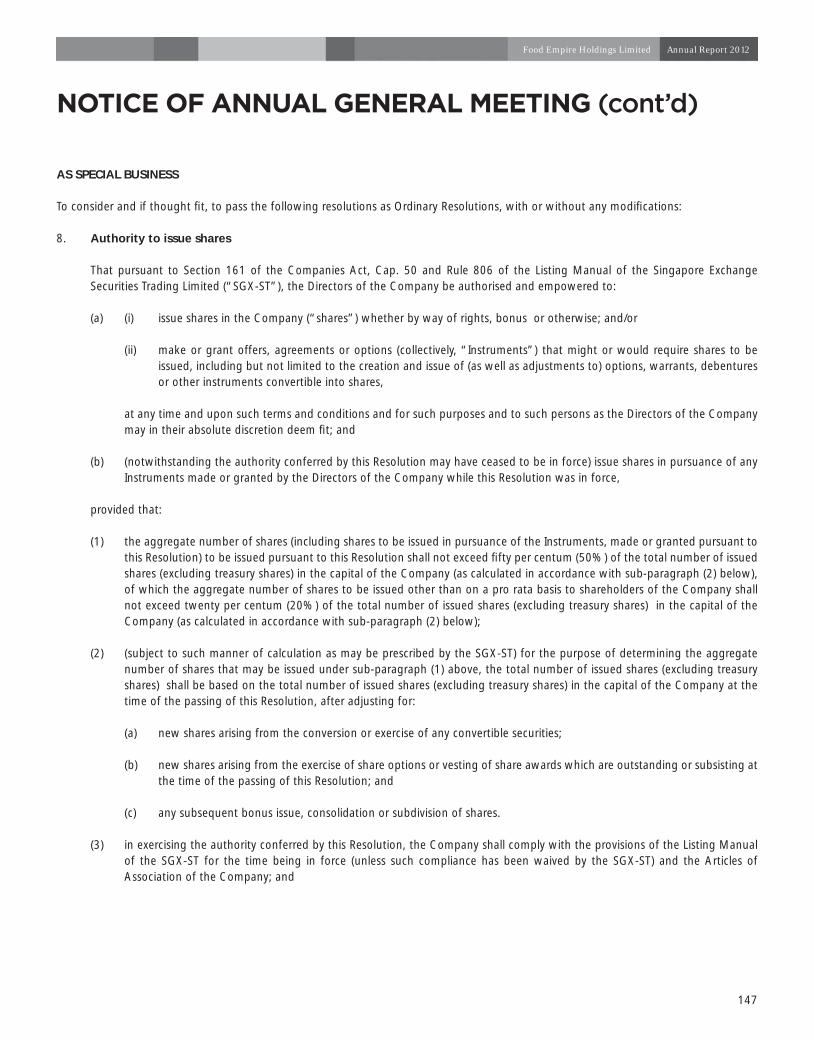
NOTICE OF ANNUAL GENERAL MEETING (cont’d)
AS SPECIAL BUSINESS
To consider and if thought fi t, to pass the following resolutions as Ordinary Resolutions, with or without any modifi cations: 8. Authority to issue shares
That pursuant to Section 161 of the Companies Act, Cap. 50 and Rule 806 of the Listing Manual of the Singapore Exchange Securities Trading Limited (“SGX-ST”), the Directors of the Company be authorised and empowered to:
(a) (i) issue shares in the Company (“shares”) whether by way of rights, bonus or otherwise; and/or
(ii) make or grant offers, agreements or options (collectively, “Instruments”) that might or would require shares to be issued, including but not limited to the creation and issue of (as well as adjustments to) options, warrants, debentures or other instruments convertible into shares,
at any time and upon such terms and conditions and for such purposes and to such persons as the Directors of the Company may in their absolute discretion deem fi t; and
(b) (notwithstanding the authority conferred by this Resolution may have ceased to be in force) issue shares in pursuance of any Instruments made or granted by the Directors of the Company while this Resolution was in force,
provided that:
(1) the aggregate number of shares (including shares to be issued in pursuance of the Instruments, made or granted pursuant to this Resolution) to be issued pursuant to this Resolution shall not exceed fi fty per centum (50%) of the total number of issued shares (excluding treasury shares) in the capital of the Company (as calculated in accordance with sub-paragraph (2) below), of which the aggregate number of shares to be issued other than on a pro rata basis to shareholders of the Company shall not exceed twenty per centum (20%) of the total number of issued shares (excluding treasury shares) in the capital of the Company (as calculated in accordance with sub-paragraph (2) below);
(2) (subject to such manner of calculation as may be prescribed by the SGX-ST) for the purpose of determining the aggregate number of shares that may be issued under sub-paragraph (1) above, the total number of issued shares (excluding treasury shares) shall be based on the total number of issued shares (excluding treasury shares) in the capital of the Company at the time of the passing of this Resolution, after adjusting for:
(a) new shares arising from the conversion or exercise of any convertible securities;
(b) new shares arising from the exercise of share options or vesting of share awards which are outstanding or subsisting at the time of the passing of this Resolution; and
(c) any subsequent bonus issue, consolidation or subdivision of shares.
(3) in exercising the authority conferred by this Resolution, the Company shall comply with the provisions of the Listing Manual of the SGX-ST for the time being in force (unless such compliance has been waived by the SGX-ST) and the Articles of Association of the Company; and
147
Food Empire Holdings Limited Annual Report 2012
NOTICE OF ANNUAL GENERAL MEETING (cont’d)
(4) unless revoked or varied by the Company in a general meeting, such authority shall continue in force until the conclusion of the next Annual General Meeting of the Company or the date by which the next Annual General Meeting of the Company is required by law to be held, whichever is earlier. [See Explanatory Note (ii)]
(Resolution 9)
9. Authority to issue shares under the previous Food Empire Holdings Limited Share Option Scheme (“2002 Option Scheme”)
That pursuant to Section 161 of the Companies Act, Cap. 50, the Directors of the Company be authorised and empowered to issue from time to time such number of shares in the capital of the Company as may be required to be issued pursuant to the exercise of options granted by the Company under the 2002 Option Scheme approved by shareholders on 22 January 2002, provided always that the aggregate number of additional ordinary shares to be issued pursuant to the 2002 Option Scheme and all other share-based incentive schemes of the Company shall not exceed fi fteen per centum (15%) of the total number of issued shares (excluding treasury shares) in the capital of the Company from time to time and that such authority shall, unless revoked or varied by the Company in a general meeting, continue in force until the conclusion of the next Annual General Meeting of the Company or the date by which the next Annual General Meeting of the Company is required by law to be held, whichever is earlier. [See Explanatory Note (iii)]
(Resolution 10)
10. Authority to issue shares under the current Food Empire Holdings Limited Share Option Scheme (“2012 Option Scheme”)
That pursuant to Section 161 of the Companies Act, Cap. 50, the Directors of the Company be authorised and empowered to offer and grant options under the 2012 Option Scheme and to issue from time to time such number of shares in the capital of the Company as may be required to be issued pursuant to the exercise of options granted or to be granted by the Company under the 2012 Option Scheme approved by shareholders on 27 April 2012, provided always that the aggregate number of additional ordinary shares to be issued pursuant to the 2012 Option Scheme and all other share-based incentive schemes of the Company shall not exceed fi fteen per centum (15%) of the total number of issued shares (excluding treasury shares) in the capital of the Company from time to time and that such authority shall, unless revoked or varied by the Company in a general meeting, continue in force until the conclusion of the next Annual General Meeting of the Company or the date by which the next Annual General Meeting of the Company is required by law to be held, whichever is earlier. [See Explanatory Note (iv)]
(Resolution 11)
By Order of the Board
Tan Cher LiangTan San-JuSecretariesSingapore, 5 April 2013
148

NOTICE OF ANNUAL GENERAL MEETING (cont’d)
Explanatory Notes:
(i) The effect of the Ordinary Resolution 6 in item 4 above, is to re-appoint a Director of the Company who is over 70 years of age.
(ii) The Ordinary Resolution 9 in item 8 above, if passed, will empower the Directors of the Company, effective until the conclusion of the next Annual General Meeting of the Company, or the date by which the next Annual General Meeting of the Company is required by law to be held or such authority is varied or revoked by the Company in a general meeting, whichever is the earlier, to issue shares, up to a number not exceeding, in total, 50% of the total number of issued shares (excluding treasury shares) in the capital of the Company, of which up to 20% may be issued other than on a pro rata basis to shareholders.
For determining the aggregate number of shares that may be issued, the total number of issued shares (excluding treasury shares) will be calculated based on the total number of issued shares (excluding treasury shares) in the capital of the Company at the time this Ordinary Resolution is passed after adjusting for new shares arising from the conversion or exercise of any convertible securities or share options or vesting of share awards which are outstanding or subsisting at the time when this Ordinary Resolution is passed and any subsequent bonus issue, consolidation or subdivision of shares.
(iii) Although the 2002 Option Scheme had expired on 31 December 2011, outstanding options granted prior to that date subsist and remain exercisable in accordance with the rules of the 2002 Option Scheme.
The Ordinary Resolution 10 in item 9 above, if passed, will empower the Directors of the Company, effective until the conclusion of the next Annual General Meeting of the Company, or the date by which the next Annual General Meeting of the Company is required by law to be held or such authority is varied or revoked by the Company in a general meeting, whichever is the earlier, to issue shares in the Company pursuant to the exercise of options granted under the 2002 Option Scheme and all other share-based incentive schemes of the Company up to a number not exceeding in aggregate (for the entire duration of the 2002 Option Scheme) fi fteen per centum (15%) of the total number of issued shares (excluding treasury shares) in the capital of the Company from time to time.
(iv) The Ordinary Resolution 11 in item 10 above, if passed, will empower the Directors of the Company, effective until the conclusion of the next Annual General Meeting of the Company, or the date by which the next Annual General Meeting of the Company is required by law to be held or such authority is varied or revoked by the Company in a general meeting, whichever is the earlier, to issue shares in the Company pursuant to the exercise of options granted or to be granted under the 2012 Option Scheme and all other share-based incentive schemes of the Company up to a number not exceeding in aggregate (for the entire duration of the 2012 Option Scheme) fi fteen per centum (15%) of the total number of issued shares (excluding treasury shares) in the capital of the Company from time to time.
Notes:
1. A Member entitled to attend and vote at the Annual General Meeting (the “Meeting”) is entitled to appoint not more than two proxies to attend and vote in his/her stead. A proxy need not be a Member of the Company.
2. The Instrument appointing a proxy must be deposited at the Registered Offi ce of the Company at 50 Raffl es Place #32-01, Singapore
Land Tower, Singapore 048623 not less than forty-eight (48) hours before the time appointed for holding the Meeting.
149
Food Empire Holdings Limited Annual Report 2012

This page is intentionally left blank.
150
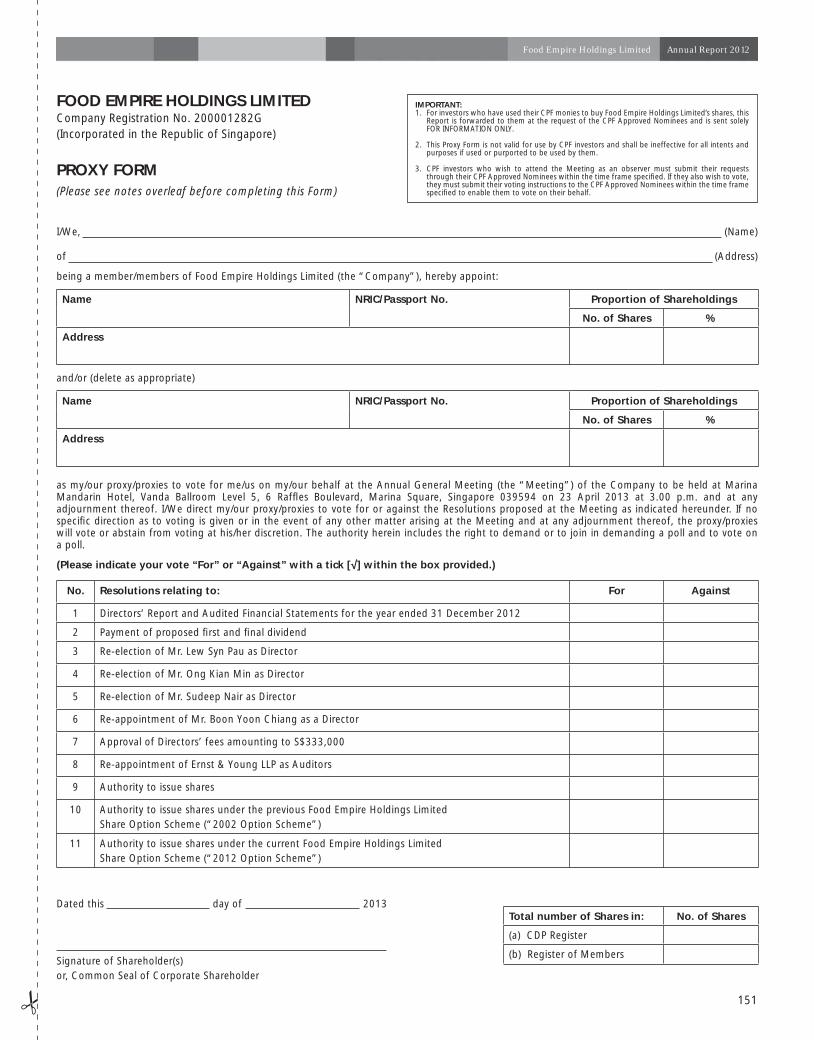
PROXY FORM(Please see notes overleaf before completing this Form)
FOOD EMPIRE HOLDINGS LIMITEDCompany Registration No. 200001282G (Incorporated in the Republic of Singapore)
I/We, (Name)
of (Address)
being a member/members of Food Empire Holdings Limited (the “Company”), hereby appoint:
Name NRIC/Passport No. Proportion of Shareholdings
No. of Shares %
Address
and/or (delete as appropriate)
Name NRIC/Passport No. Proportion of Shareholdings
No. of Shares %
Address
as my/our proxy/proxies to vote for me/us on my/our behalf at the Annual General Meeting (the “Meeting”) of the Company to be held at Marina Mandarin Hotel, Vanda Ballroom Level 5, 6 Raffl es Boulevard, Marina Square, Singapore 039594 on 23 April 2013 at 3.00 p.m. and at any adjournment thereof. I/We direct my/our proxy/proxies to vote for or against the Resolutions proposed at the Meeting as indicated hereunder. If no specifi c direction as to voting is given or in the event of any other matter arising at the Meeting and at any adjournment thereof, the proxy/proxies will vote or abstain from voting at his/her discretion. The authority herein includes the right to demand or to join in demanding a poll and to vote on a poll.
(Please indicate your vote “For” or “Against” with a tick [√] within the box provided.)
No. Resolutions relating to: For Against
1 Directors’ Report and Audited Financial Statements for the year ended 31 December 2012
2 Payment of proposed fi rst and fi nal dividend
3 Re-election of Mr. Lew Syn Pau as Director
4 Re-election of Mr. Ong Kian Min as Director
5 Re-election of Mr. Sudeep Nair as Director
6 Re-appointment of Mr. Boon Yoon Chiang as a Director
7 Approval of Directors’ fees amounting to S$333,000
8 Re-appointment of Ernst & Young LLP as Auditors
9 Authority to issue shares
10 Authority to issue shares under the previous Food Empire Holdings Limited Share Option Scheme (“2002 Option Scheme”)
11 Authority to issue shares under the current Food Empire Holdings Limited Share Option Scheme (“2012 Option Scheme”)
Dated this day of 2013
Signature of Shareholder(s) or, Common Seal of Corporate Shareholder
Total number of Shares in: No. of Shares
(a) CDP Register
(b) Register of Members
IMPORTANT:1. For investors who have used their CPF monies to buy Food Empire Holdings Limited’s shares, this
Report is forwarded to them at the request of the CPF Approved Nominees and is sent solely FOR INFORMATION ONLY.
2. This Proxy Form is not valid for use by CPF investors and shall be ineffective for all intents and purposes if used or purported to be used by them.
3. CPF investors who wish to attend the Meeting as an observer must submit their requests through their CPF Approved Nominees within the time frame specifi ed. If they also wish to vote, they must submit their voting instructions to the CPF Approved Nominees within the time frame specifi ed to enable them to vote on their behalf.
151
Food Empire Holdings Limited Annual Report 2012

Notes :
1. Please insert the total number of Shares held by you. If you have Shares entered against your name in the Depository Register (as defi ned in Section 130A of the Companies Act, Cap. 50 of Singapore), you should insert that number of Shares. If you have Shares registered in your name in the Register of Members, you should insert that number of Shares. If you have Shares entered against your name in the Depository Register and Shares registered in your name in the Register of Members, you should insert the aggregate number of Shares entered against your name in the Depository Register and registered in your name in the Register of Members. If no number is inserted, the Instrument appointing a proxy or proxies shall be deemed to relate to all the Shares held by you.
2. A member of the Company entitled to attend and vote at a meeting of the Company is entitled to appoint one or two proxies to attend and vote in his/her stead. A proxy need not be a member of the Company.
3. Where a member appoints two proxies, the appointments shall be invalid unless he/she specifi es the proportion of his/her shareholding (expressed as a percentage of the whole) to be represented by each proxy.
4. Completion and return of this Instrument appointing a proxy shall not preclude a member from attending and voting at the Meeting. Any appointment of a proxy or proxies shall be deemed to be revoked if a member attends the meeting in person, and in such event, the Company reserves the right to refuse to admit any person or persons appointed under the Instrument of proxy to the Meeting.
5. The Instrument appointing a proxy or proxies must be deposited at the Registered Offi ce of the Company at 50 Raffl es Place #32-01, Singapore Land Tower, Singapore 048623 not less than 48 hours before the time appointed for the Meeting.
6. The Instrument appointing a proxy or proxies must be under the hand of the appointor or of his attorney duly authorised in writing. Where the Instrument appointing a proxy or proxies is executed by a corporation, it must be executed either under its seal or under the hand of an offi cer or attorney duly authorised. Where the Instrument appointing a proxy or proxies is executed by an attorney on behalf of the appointor, the letter or power of attorney or a duly certifi ed copy thereof must be lodged with the Instrument.
7. A corporation which is a member may authorise by resolution of its directors or other governing body such person as it thinks fi t to act as its representative at the Meeting, in accordance with Section 179 of the Companies Act, Cap. 50 of Singapore.
General:
The Company shall be entitled to reject the Instrument appointing a proxy or proxies if it is incomplete, improperly completed or illegible, or where the true intentions of the appointor are not ascertainable from the instructions of the appointor specifi ed in the Instrument appointing a proxy or proxies. In addition, in the case of Shares entered in the Depository Register, the Company may reject any Instrument appointing a proxy or proxies lodged if the member, being the appointor, is not shown to have Shares entered against his name in the Depository Register as at 48 hours before the time appointed for holding the Meeting, as certifi ed by The Central Depository (Pte) Limited to the Company.
152


Food Empire Holdings Limited31 Harrison Road, #08-01, Food Empire Business Suites, Singapore 369649T (65) 6622 6900 F (65) 6744 8977 www.foodempire.com