Embed Size (px)
Citation preview

New Mexico 2016State of the Workforce ReportA Report Highlighting New Mexico’s Current and Future Workforce
March 2016
www.dws.state.nm.us
POPULATIONWORKFORCE
FUTURE WORKFORCE
INDUSTRIES, OCCUPATIONS & WAGES
SKILLS & EDUCATION

2 NEW MEXICO DEPARTMENT OF WORKFORCE SOLUTIONS
New Mexico 2016 State of the
Workforce Report
Susana Martinez Governor
State of New Mexico
New Mexico Department of
Workforce Solutions
Celina Bussey Cabinet Secretary
Joy Forehand Deputy Cabinet Secretary
Contributors:
Rachel Moskowitz Bureau Chief
Jonathan Blaich, Mark Flaherty, Nathan Friedman, Adam Garcia,
Julie Larranaga, Ashley Leach, Joseph Mayo, Tracy Shaleen,
and Stacy Johnston
For further information contact: New Mexico Department of
Workforce Solutions Economic Research &
Analysis Bureau
P.O. Box 1928 Albuquerque, NM 87103
Phone: (505) 838-2729
Email: NMDWS.Economicresearch@
state.nm.us
Published March 2016
General Note: All information presented in this report was compiled by the New Mexico Department of Workforce Solutions (NMDWS) Economic Research and Analysis Bureau (ER&A). Much of the data presented is produced in conjunction with the U.S. Department of Labor, Bureau of Labor Statistics. This report looks at data for multiple geographies at the state-, region-, Metropolitan Statistics Area- (MSA), and county-level. New Mexico has four MSAs—Albuquerque (Bernalillo, Sandoval, Torrance, and Valencia Counties), Farmington (San Juan County), Las Cruces (Doña Ana County), and Santa Fe (Santa Fe County). New Mexico’s four regions include the Central, Eastern, Northern, and Southwestern Regions. For geographic information on counties within each region, refer to the corresponding map. Non-historical data in this report represents the most recent data that are available and data vary by source.
At the time this publication was produced, and in most cases at the time of release, data were the most up-to-date available. In many cases, where data are expressed as annual averages, the most recent year is 2014. 2015 annual data will be available on the release of next year’s State of the Workforce report.

STATE OF THE WORKFORCE 2016 3
SUMMARY AND FINDINGS 4
NEW MEXICO’S POPULATION—A SNAPSHOT OF POPULATION ACROSS THE STATE 8State, Regional, and County Population Estimates 8
Age of the Population 12
Race and Ethnicity 14
Income 15
Poverty 16
NEW MEXICO’S WORKFORCE—WHAT IT LOOKS LIKE NOW 17Labor Force Participation 17
Labor Force Participation by Age Group 18
Age and Gender of the Labor Force 19
Race and Ethnicity of the Labor Force 21
Labor Force Participation by Educational Attainment 22
NEW MEXICO’S WORKFORCE—HOW IT’S GROWING 23Labor Force Growth 23
Employment Growth 25
Unemployment Growth 28
NEW MEXICO’S WORKFORCE—INDUSTRIES, OCCUPATIONS & WAGES 31Employment in New Mexico’s Industries 31
Occupational Employment of the Workforce 34
NEW MEXICO’S WORKFORCE—SKILLS & EDUCATION 36Educational Attainment of the Population and Labor Force 36
NEW MEXICO’S WORKFORCE—THE FUTURE WORKFORCE 40Projected Employment Growth in New Mexico’s Industries 40
Projected Employment Growth in New Mexico’s Substate Areas 42
Projected Occupational Employment Growth 50
Table of Contents

4 NEW MEXICO DEPARTMENT OF WORKFORCE SOLUTIONS
New Mexico’s Population • Population growth in New Mexico was nearly neutral
between 2013 and 2014, which represented the fifth slowest growth rate in the U.S. In 2014, the residents of New Mexico’s four metropolitan statistics areas (MSAs) (Albuquerque, Farmington, Santa Fe, and Las Cruces) made up just over two-thirds of the entire population of New Mexico. Over 43 percent of the state’s population lived in the Albuquerque MSA alone.
• A large proportion of New Mexico’s population is either young or aging. As of 2014, more than 28 percent of the population was 55 and over, representing a share greater than that of the nation and that of all neighboring states. The state had a smaller share of people between the ages of 25 and 44 (the bulk of the working-age population) than the nation and any other neighboring state.
• The large concentrations of Hispanic and American Indian populations within New Mexico’s population contribute to the state’s unique demographic mix and racial and ethnic diversity. In 2014, Hispanics/Latinos made up 47.7 percent of New Mexico’s total population. This represented, by far, the largest share among neighboring states and exceeded the national share by over 30 percentage points.
• New Mexico has the lowest median income of all neighboring states. In 2014, more than one out of every five New Mexicans lived below the poverty level. New Mexico had the second largest share of people
living below the poverty level among all U.S. states. Over one-third of American Indians and over one-quarter of Hispanics/Latinos lived below the poverty level in 2014. Over one-third of people with less than a high school diploma or equivalent certificate lived below the poverty level.
New Mexico’s Workforce• Between 2009 and 2014, participation in the labor
force declined in the nation as a whole. Nevertheless, New Mexico’s labor force participation declined more when compared to the U.S. average and the participation rates of New Mexico’s neighboring states. In 2014, 59.0 percent of New Mexico’s population (16 years and older) participated in the labor force, down 3.3 percentage points from 2009.
• Workers aged between 25 to 44 years had the highest labor force participation rate of any other age cohort in New Mexico, but this fell by 3.3 percentage points between 2009 and 2014. Although workers between the ages of 45 and 54 years had the second highest rate of labor force participation in New Mexico in 2014, the rate declined by 2.2 percentage points from 2009. Labor force participation rates of workers aged 55 to 64 years decreased by 3.3 percentage points over the same time period. Between 2009 and 2014, the labor force participation rate of workers 65 to 74 years old grew by 1.6 percentage points.
• New Mexico’s distribution of labor force participation is weighted towards older workers when compared to the distributions of neighboring states. Workers aged 60 to 64 years accounted for 6.7 percent of the labor force, and workers aged 65 to 74 years made up 4.6 percent of the labor force. Men comprised a larger percentage of New Mexico’s labor force than women in almost every age category in 2014.
• American Indians face some of the greatest challenges and barriers within the labor market. Labor force participation for this group is the lowest among all race and ethnicities. American Indians also experience some of the highest unemployment rates, as do those who are Black/African American.
Summary and Findings

STATE OF THE WORKFORCE 2016 5
How it’s Growing
• At the start of the last decade, immediately following the March 2001 to November 2001 national recession, New Mexico’s unemployment rate was on a steady upward trajectory. That trajectory began to reverse in late 2003 and the unemployment rate fell to a series-low of 3.7 percent in early to mid-2007. The civilian labor force continued to swell, and household survey-based employment peaked at 904,717 in March 2008. Soon after, however, effects of the Great Recession took hold, and labor market conditions statewide deteriorated rapidly
• In the years preceding the onset of the Great Recession, which officially lasted from December 2007 to June 2009, New Mexico’s labor force growth was competitive with that of at least some of its neighboring states and only slightly below the national average. While all states struggled during the downturn and its immediate aftermath, New Mexico’s labor market recovery remained especially weak through 2014, with employment and civilian labor force numbers still well below their pre-recession peaks. Neighboring states and the nation as a whole made more substantial gains in recent years.
• New Mexico’s four workforce regions each registered employment and labor force gains during the pre-recession period; however, recessionary losses between 2007 and 2010 were far less severe in the Central Region, where employment edged up slightly, than in the other three regions, each of which posted losses. During the recovery from 2010 to 2014, employment increased in the Eastern Region and decreased in the other three workforce areas. The Northern Region posted the largest employment and labor force declines for both the recession and recovery periods.
• Because local economies rely on different economic drivers, the recent downturn and recovery produced varied effects at the county level. Despite a sharp decline in crude oil process during the second half of 2014, Eddy and Lea Counties again generated large over-the-year employment gains, at 3.7 percent and 3.5 percent, respectively. Those two counties joined De Baca and Harding as the four counties to post
2014 growth exceeding 2 percent. A statewide over-the-year employment decline of 0.1 percent for 2014 comprised losses for 20 counties and gains for 13.
Industries, Occupations, and Wages
• Despite only representing 3.5 percent of the state’s employment, the mining industry led all other industries in terms of growth between 2009 and 2014. The industry added 10,288 jobs, representing a growth rate of 58.5 percent, during that period. The health care and social assistance industry made up the largest share of the New Mexico workforce (16.3 percent), and this industry added 9,746 jobs between 2009 and 2014. The next largest industries, retail trade and accommodation and food services, also experienced job growth, though that of retail trade was quite muted. In total, eight industries experienced employment growth in the same period.
• The construction industry saw the largest decline in employment, with a loss of 5,117 jobs representing a decrease of 9.9 percent. The information industry experienced the largest percentage decrease in employment, at 14.4 percent, but that only accounted for 2,304 jobs. Four other industries—manufacturing, public administration, educational services, and professional and technical services—declined by over 2,000 jobs each. Despite an overall gain in the number of jobs, more industries saw job losses than gains.
• Over one-third of New Mexico’s workers are employed in office/administrative support, sales, or food preparation and serving occupations. These occupations are often the most common across the U.S. In 2014, the average wages in these major occupational categories were below the all-occupation average wage. Science, technology, engineering, and mathematics (STEM) occupations, along with management occupations, were often the highest paying in New Mexico and other states.
Skills and Education
• New Mexico’s labor force had lower educational attainment than most surrounding states and many
Summary and Findings
6 NEW MEXICO DEPARTMENT OF WORKFORCE SOLUTIONS
states in the nation. Nearly 29 percent of the labor force had earned a bachelor’s degree or higher, as of 2014. New Mexico ranked fifth out of the six southwestern states in this measure, leading only Oklahoma and trailing the nation by over 6 percentage points.
• In 2014, the share of New Mexico’s labor force that had not attained a high school diploma was 12.2 percent. This was higher than the national average of 9.2 percent and higher than the shares of most surrounding states. Texas had the highest share of its labor force that had not earned a high school diploma, at 14.0 percent, while Colorado had the lowest share, at 7.7 percent, followed by Utah, at 7.8 percent.
• By 2022, employment in occupations that typically require a high school diploma (or equivalent certificate) or less is projected to grow by 11.6 percent, or 66,600 jobs. While this represents a large number, jobs that require a bachelor’s degree or higher are projected to grow at a faster rate (13.4 percent). Jobs requiring a master’s degree are projected to have the fastest rate of growth, at 21.6 percent.
• New Mexico’s competitive disadvantage is heightened by low public high school graduation rates. For the 2012–13 school year, 70 percent of New Mexico public high school students graduated in four years. This was 11 percentage points lower than the graduation rates for the U.S. and five percentage points lower than the rate in Arizona, the neighboring state with the next lowest rate. It is imperative that educational attainment be a focus of policy makers to ensure that
New Mexico strengthens its ability to compete for businesses and provides better opportunities for all of its citizens.
The Future Workforce
• New Mexico is projected to see employment grow by about 12 percent, or 101,610 jobs, between 2012 and 2022. Growth is projected to create 30,540 new job openings a year, of which around 35 percent (10,780) are anticipated to be new job openings, while the remaining 65 percent (19,760) are expected to come from the need to replace workers leaving their occupation.
• The Albuquerque MSA is expected to lead all of the state’s four MSAs in employment growth, with employment growing by 14.9 percent, or 56,730 jobs. The Northern Region is expected to lead the state’s regions in employment growth, increasing by 32,250 jobs or 16.1 percent. Growth in the non-MSA areas of the Northern Region is expected to exceed growth in the region’s MSAs (Farmington and Santa Fe). In an opposite trend, the majority of growth in the Southwestern Region is projected to occur within the Las Cruces MSA. The Eastern Region’s employment is projected to grow more slowly than statewide employment but faster than employment in the Southwestern Region.
• The health care and social assistance, educational services, and accommodation and food services industries are projected to see the largest increases
Summary and Findings
STATE OF THE WORKFORCE 2016 7
in employment over the ten-year projection period, providing nearly 63 percent of all new jobs.
• Five industries are projected to experience a decline in employment by 2022; over half of those losses are projected to occur in the federal government, and losses are expected across all substate areas. The only growth in manufacturing is anticipated to occur in the Northern Region, while small gains in agriculture are projected for the Central Region and non-MSA areas of the Northern Region. The Santa Fe MSA is projected to add jobs in state government, while all other substate areas experience employment losses in that sector.
• Employment growth is projected to be largest in the educational services subsector, with multiple health care subsectors showing significant numeric and percentage growth. Several retail trade, accommodation and food services, and administrative and support services subsectors are projected to grow in large numbers and quickly.
• Major occupational groups that are traditionally large are expected to continue their historic growth, adding a significant number of jobs over the projection period. Community and social service and computer and mathematical occupations, which are not as large, are projected to see job growth quicken in the coming years. Smaller detailed occupations that are projected to grow quickly include industrial machinery mechanics; physical therapists; coaches and scouts; market research analysts and specialists; postsecondary health specialties teachers; other health technologists and technicians; and interpreters and translators. Growth in these smaller detailed occupations is particularly interesting, as it can signal growing occupational opportunities that are not obvious when looking solely at numeric job growth.
• New Mexico’s Star Occupations—those that are projected to grow quickly, provide substantial job openings, and pay higher wages—include 11 education or health care-related occupations and six management or computer and mathematical occupations (out of 28 total Star Occupations). The occupations on the list span nearly every required education level, although 22 require more than a high school diploma or equivalent certificate.
Summary and Findings
8 NEW MEXICO DEPARTMENT OF WORKFORCE SOLUTIONS
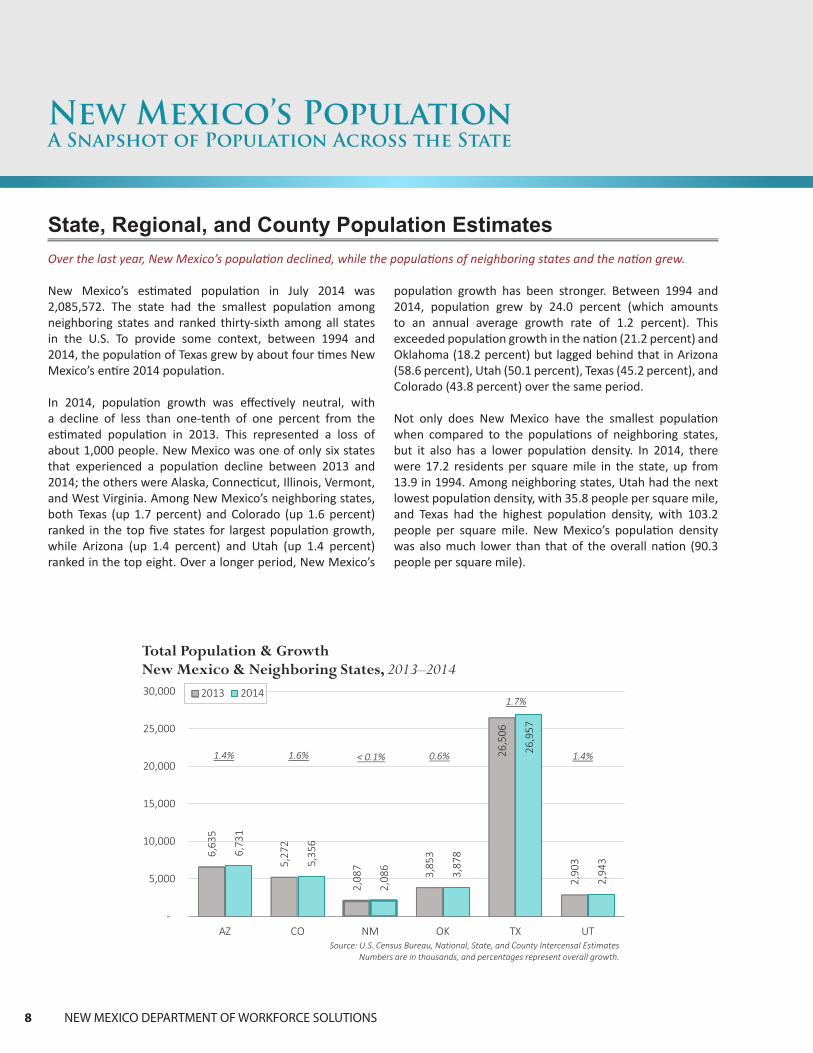
New Mexico’s estimated population in July 2014 was 2,085,572. The state had the smallest population among neighboring states and ranked thirty-sixth among all states in the U.S. To provide some context, between 1994 and 2014, the population of Texas grew by about four times New Mexico’s entire 2014 population.
In 2014, population growth was effectively neutral, with a decline of less than one-tenth of one percent from the estimated population in 2013. This represented a loss of about 1,000 people. New Mexico was one of only six states that experienced a population decline between 2013 and 2014; the others were Alaska, Connecticut, Illinois, Vermont, and West Virginia. Among New Mexico’s neighboring states, both Texas (up 1.7 percent) and Colorado (up 1.6 percent) ranked in the top five states for largest population growth, while Arizona (up 1.4 percent) and Utah (up 1.4 percent) ranked in the top eight. Over a longer period, New Mexico’s
population growth has been stronger. Between 1994 and 2014, population grew by 24.0 percent (which amounts to an annual average growth rate of 1.2 percent). This exceeded population growth in the nation (21.2 percent) and Oklahoma (18.2 percent) but lagged behind that in Arizona (58.6 percent), Utah (50.1 percent), Texas (45.2 percent), and Colorado (43.8 percent) over the same period.
Not only does New Mexico have the smallest population when compared to the populations of neighboring states, but it also has a lower population density. In 2014, there were 17.2 residents per square mile in the state, up from 13.9 in 1994. Among neighboring states, Utah had the next lowest population density, with 35.8 people per square mile, and Texas had the highest population density, with 103.2 people per square mile. New Mexico’s population density was also much lower than that of the overall nation (90.3 people per square mile).
New Mexico’s PopulationA Snapshot of Population Across the State
State, Regional, and County Population EstimatesOver the last year, New Mexico’s population declined, while the populations of neighboring states and the nation grew.
6,63
5
5,27
2
2,08
7
3,85
3
26,5
06
2,90
3
6,73
1
5,35
6
2,08
6 3,87
8
26,9
57
2,94
3
-
5,000
10,000
15,000
20,000
25,000
30,000
AZ CO NM OK TX UT
Total Population & GrowthNew Mexico & Neighboring States, 2013–2014
2013 2014
Source: U.S. Census Bureau, National, State, and County Intercensal EstimatesNumbers are in thousands, and percentages represent overall growth.
1.4% 1.6% < 0.1% 1.4%
1.7%
0.6%

STATE OF THE WORKFORCE 2016 9
New Mexico’s PopulationA Snapshot of Population Across the State
4,24
5
3,72
4
1,68
2
3,28
1
18,5
64
1,96
0
6,73
1
5,35
6
2,08
6
3,87
8
26,9
57
2,94
3
-
5,000
10,000
15,000
20,000
25,000
30,000
AZ CO NM OK TX UT
Total Population & GrowthNew Mexico & Neighboring States, 1994–2014
1994 2014
Source: U.S. Census Bureau, National, State, and County Intercensal EstimatesNumbers are in thousands, and percentages represent overall growth.
58.6% 43.8% 24.0% 50.1%
45.2%
18.2%
74.5
37.4
35.9
13.9
47.8
71.1
23.9
90.3
59.3
51.7
17.2
56.5
103.
2
35.8
0
20
40
60
80
100
120
US AZ CO NM OK TX UT
Population DensityNew Mexico & Neighboring States, 1994 & 2014
1994 2014
Source: U.S. Census Bureau, National, State, and County Intercensal Estimates and Quick FactsNumbers are a measure of people per square mile.

10 NEW MEXICO DEPARTMENT OF WORKFORCE SOLUTIONS
New Mexico’s PopulationA Snapshot of Population Across the State
With Albuquerque’s large population within its bounds, it is estimated that 675,551 people were living in Bernalillo County in 2014. This is over three times more than that of the next most populous county, Doña Ana (equivalent to the Las Cruces MSA), which had an estimated population of 213,676. The next three most populous counties—Santa
1,682
670 333435
245
2,086
905367
509304
0
500
1,000
1,500
2,000
2,500
New Mexico Central Eastern Northern Southwestern
Total Population & GrowthNew Mexico & Its Regions, 1994–2014
1994 2014
Source: U.S. Census Bureau, State and County Intercensal EstimatesNumbers are in thousands, and percentages represent overall growth.
24.0%
24.0%17.2%10.4%35.1%
0.7
1.8
3.6
4.34.5
123.8
137.6
148.2
213.7
0.0 50.0 100.0 150.0 200.0 250.0 300.0 350.0 400.0
Harding
De Baca
Catron
Union
Guadalupe
San Juan
Sandoval
Santa Fe
Doña Ana
Bernalillo
Total Population Most & Least Populated Counties, 2014
Source: U.S. Census Bureau, State and County Intercensal Estimates* Bernalillo employment exceeds the chart maximum for comparative purposes. Numbers are in thousands.
675.6*
Fe (or the Santa Fe MSA), Sandoval, and San Juan (or the Farmington MSA)—each had estimated populations within the 120,000–150,000 range. In 2014, the least populous counties—Guadalupe, Union, Catron, De Baca, and Harding—each had between 700 and 4,500 residents.
STATE OF THE WORKFORCE 2016 11
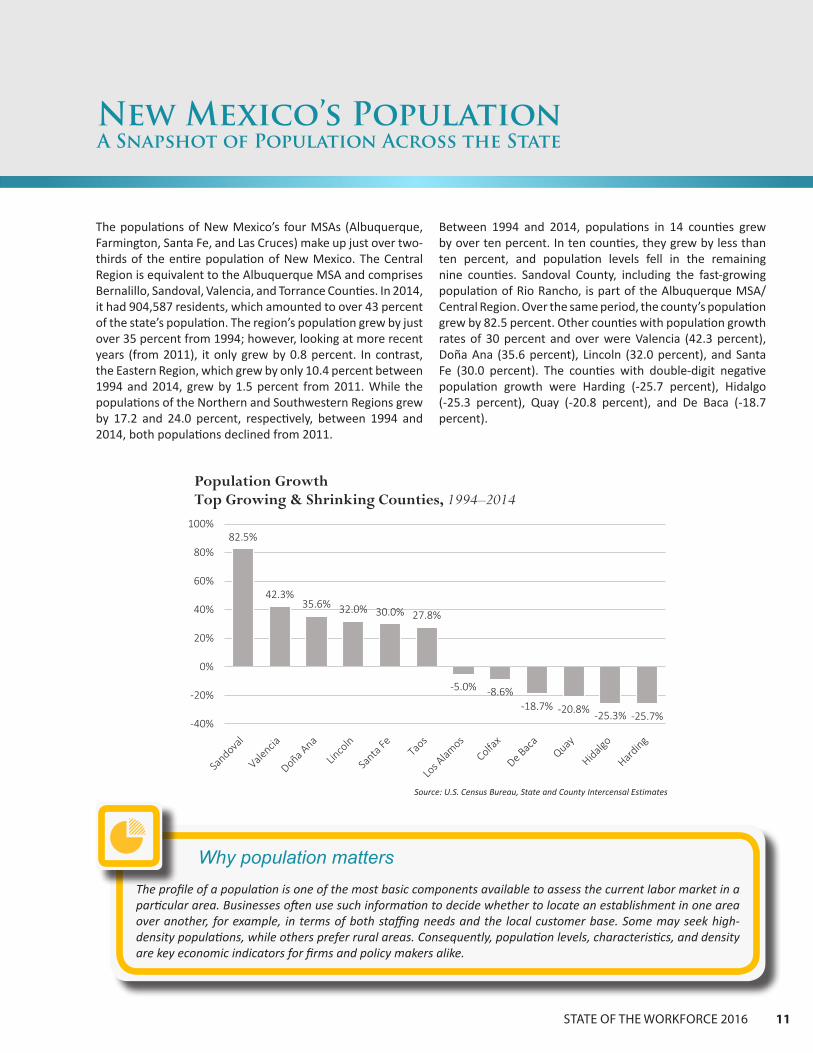
Between 1994 and 2014, populations in 14 counties grew by over ten percent. In ten counties, they grew by less than ten percent, and population levels fell in the remaining nine counties. Sandoval County, including the fast-growing population of Rio Rancho, is part of the Albuquerque MSA/Central Region. Over the same period, the county’s population grew by 82.5 percent. Other counties with population growth rates of 30 percent and over were Valencia (42.3 percent), Doña Ana (35.6 percent), Lincoln (32.0 percent), and Santa Fe (30.0 percent). The counties with double-digit negative population growth were Harding (-25.7 percent), Hidalgo (-25.3 percent), Quay (-20.8 percent), and De Baca (-18.7 percent).
New Mexico’s PopulationA Snapshot of Population Across the State
The populations of New Mexico’s four MSAs (Albuquerque, Farmington, Santa Fe, and Las Cruces) make up just over two- thirds of the entire population of New Mexico. The Central Region is equivalent to the Albuquerque MSA and comprises Bernalillo, Sandoval, Valencia, and Torrance Counties. In 2014, it had 904,587 residents, which amounted to over 43 percent of the state’s population. The region’s population grew by just over 35 percent from 1994; however, looking at more recent years (from 2011), it only grew by 0.8 percent. In contrast, the Eastern Region, which grew by only 10.4 percent between 1994 and 2014, grew by 1.5 percent from 2011. While the populations of the Northern and Southwestern Regions grew by 17.2 and 24.0 percent, respectively, between 1994 and 2014, both populations declined from 2011.
82.5%
42.3%35.6% 32.0% 30.0% 27.8%
-5.0% -8.6%-18.7% -20.8% -25.3% -25.7%
-40%
-20%
0%
20%
40%
60%
80%
100%
Source: U.S. Census Bureau, State and County Intercensal Estimates
Population GrowthTop Growing & Shrinking Counties, 1994–2014
Why population mattersThe profile of a population is one of the most basic components available to assess the current labor market in a particular area. Businesses often use such information to decide whether to locate an establishment in one area over another, for example, in terms of both staffing needs and the local customer base. Some may seek high-density populations, while others prefer rural areas. Consequently, population levels, characteristics, and density are key economic indicators for firms and policy makers alike.

12 NEW MEXICO DEPARTMENT OF WORKFORCE SOLUTIONS
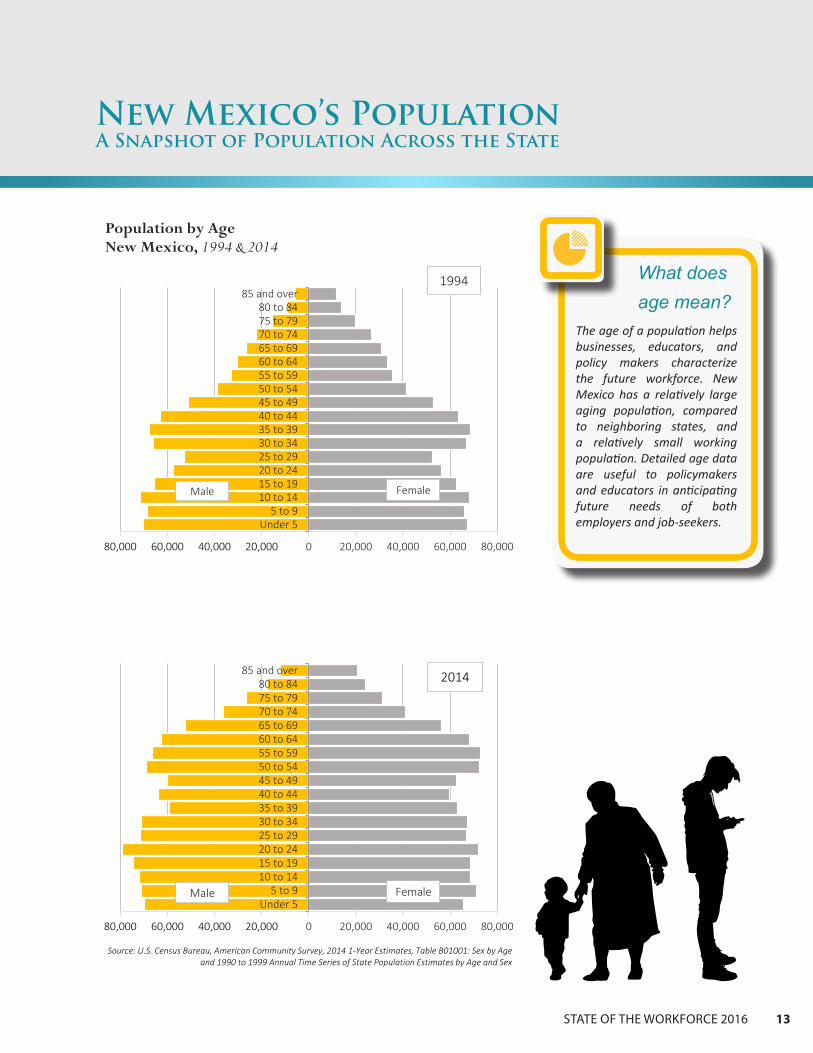
As the oldest members of the baby boomer generation (referring to those born between 1946 and 1964) have moved into the over-65 age category, the nation has seen an increase in its elderly population. In 2014, the median age in New Mexico was 37.2, which was older than the median age of any other neighboring state but younger than the national median age (37.7).
In the same year, people 55 and older made up 28.2 percent of New Mexico’s population. This was a larger share than that of the nation (27.1 percent) and all other neighboring states. Specifically, the state’s share of people aged 55 to 64 (almost 13 percent) was larger than that of the nation and those of other neighboring states. New Mexico also had the smallest share of people between 25 and 44 years of age. Between 1994 and 2014, the population between the ages of 20 and 64 years—i.e., the majority of the working-age population—grew by about 30 percent. The population 65
and older grew by about 75 percent. In contrast to this, the state had a considerable under-25 population, which made up 34.1 percent of the total population. This was equal to the percentage of under-25 year olds in Arizona and larger than that of the nation and Colorado, but still less than the share of people under 25 in each of Oklahoma, Texas, and Utah.
New Mexico’s PopulationA Snapshot of Population Across the State
Age of the PopulationNew Mexico has a large population of young and older persons but a small working-age population.
37.7 36.9 36.3 37.236.2
34.3
30.5
20
22
24
26
28
30
32
34
36
38
40
0%
10%
20%
30%
40%
50%
60%
70%
80%
90%
100%
US AZ CO NM OK TX UT
Population Distribution & Median AgeNew Mexico & Neighboring States, 2014
Under 5 5 to 14 15 to 24 25 to 34 35 to 44
45 to 54 55 to 64 65 to 74 75+ Median Age
Source: U.S. Census Bureau, American Community Survey, 2014 1-Year Estimates, Table B01001: Sex by Age and B01002: Median Age by Sex
STATE OF THE WORKFORCE 2016 13
New Mexico’s PopulationA Snapshot of Population Across the State
80,000 60,000 40,000 20,000 0 20,000 40,000 60,000 80,000
Under 55 to 9
10 to 1415 to 1920 to 2425 to 2930 to 3435 to 3940 to 4445 to 4950 to 5455 to 5960 to 6465 to 6970 to 7475 to 7980 to 84
85 and over1994
FemaleMale
Population by AgeNew Mexico, 1994 & 2014
80,000 60,000 40,000 20,000 0 20,000 40,000 60,000 80,000
Under 55 to 9
10 to 1415 to 1920 to 2425 to 2930 to 3435 to 3940 to 4445 to 4950 to 5455 to 5960 to 6465 to 6970 to 7475 to 7980 to 84
85 and over
Source: U.S. Census Bureau, American Community Survey, 2014 1-Year Estimates, Table B01001: Sex by Age and 1990 to 1999 Annual Time Series of State Population Estimates by Age and Sex
2014
FemaleMale
What does age mean?The age of a population helps businesses, educators, and policy makers characterize the future workforce. New Mexico has a relatively large aging population, compared to neighboring states, and a relatively small working population. Detailed age data are useful to policymakers and educators in anticipating future needs of both employers and job-seekers.

14 NEW MEXICO DEPARTMENT OF WORKFORCE SOLUTIONS
New Mexico is uniquely diverse in terms of both race and ethnicity In 2014, the percentage of people in New Mexico identifying as non-White (26.9 percent) was greater than that of the nation (26.6 percent) and was only exceeded among neighboring states by Oklahoma, with 27.1 percent. Based on the 2010 Decennial Census, the states with the largest shares of the total U.S. American Indian population were California (12.4 percent), Oklahoma (11.0 percent), Arizona (10.1 percent), and, in fourth place, New Mexico (6.6 percent). However, American Indians in New Mexico comprised 9.5 percent of the state’s population in 2014, which was the largest share of all neighboring states and the second largest of all U.S. states (after Alaska, at 14.0 percent). Oklahoma had the next largest share among neighboring states, with 7.5 percent, followed by Arizona, with 4.4 percent. New Mexico also had the largest proportion of people identifying as two or more races (15.4 percent). On the other hand, the state had the second smallest share of
New Mexico’s PopulationA Snapshot of Population Across the State
Race & EthnicityNew Mexico’s racial and ethnic diversity makes for a unique place to live.
African Americans in its population (2.0 percent). Only Utah had a smaller share, with 1.1 percent.
New Mexico is also ethnically unique—being one of only four states identified in the 2010 Decennial Census as a majority-minority state (i.e., the population contains less than 50 percent non-Hispanic Whites). Hispanics and Latinos of all races made up 47.7 percent of New Mexico’s total population, which is the largest share among neighboring states and one that exceeds the national share by over 30 percentage points.
Strength in diversity
A culturally and linguistically diverse population provides many economic benefits and can support a variety of business and employment opportunities. Businesses that sell products and services to a multilingual and multicultural customer base will likely benefit from a labor force that can communicate with and understand the specific needs of more diverse segments of the population.
73.4
%
78.3
%
84.4
%
73.1
%
72.9
%
75.2
% 87.3
%
12.7
%
4.2%
4.0%
2.0% 7.
4% 12.0
%
1.1%
0.8% 4.
4%
1.0%
9.5%
7.5%
0.5%
1.1%
13.1
%
13.1
%
10.5
%
15.4
%
12.2
%
12.4
%
10.5
%
17.3
% 30.5
%
21.2
%
47.7
%
9.8%
38.6
%
13.5
%
0%
10%
20%
30%
40%
50%
60%
70%
80%
90%
US AZ CO NM OK TX UT
Racial & Ethnic DiversityNew Mexico & Neighboring States, 2014
White Black/African American American Indian
Other or 2 or More Races Hispanic/Latino (All Races)
Source: U.S. Census Bureau, American Community Survey, 2014 1-Year Estimates,Table B02001: Race and Table B03001: Hispanic or Latino Origin by Specific Origin
Other includes those that are Asian, Native Hawaiian/Other Pacific, or other race not mentioned.

STATE OF THE WORKFORCE 2016 15
New Mexico’s PopulationA Snapshot of Population Across the State
New Mexico has the lowest average (mean) and median household incomes among its neighboring states. In 2014, the state’s average household income was $61,470, which was 18.7 percent less than the national average ($75,591). The average household incomes of Colorado ($82,295) and
Utah ($77,413) exceeded the national average. Similarly, New Mexico’s median household income ($44,803) was below those of all neighboring states and was 16.5 percent less than the national median household income ($53,657).
IncomeNew Mexico has the lowest average income and median income of all neighboring states and the sixth lowest average income in the country.
$75,591
$68,103
$82,295
$61,470 $64,584
$75,557 $77,413
$53,657$50,068
$61,303
$44,803 $47,529$53,035
$60,922
$0
$10,000
$20,000
$30,000
$40,000
$50,000
$60,000
$70,000
$80,000
$90,000
US AZ CO NM OK TX UT
Average and Median Household IncomeNew Mexico & Neighboring States, 2014
Average Household Income Median Household Income
Source: U.S. Census Bureau, American Community Survey, 2014 1-Year Estimates, Table CP03: Comparative Economic CharacteristicsIncome is measured in inflation-adjusted dollars.
Income as an indicator of economic health
Household income is a measure of the combined incomes of all people sharing a place of residence and is used as an indicator of the monetary well-being of people within a local economy. Because median income is one of many measurements that are indicative of economic health, it is used by economic developers, policymakers, and other parties interested in evaluating the state of the economy and labor force.
16 NEW MEXICO DEPARTMENT OF WORKFORCE SOLUTIONS
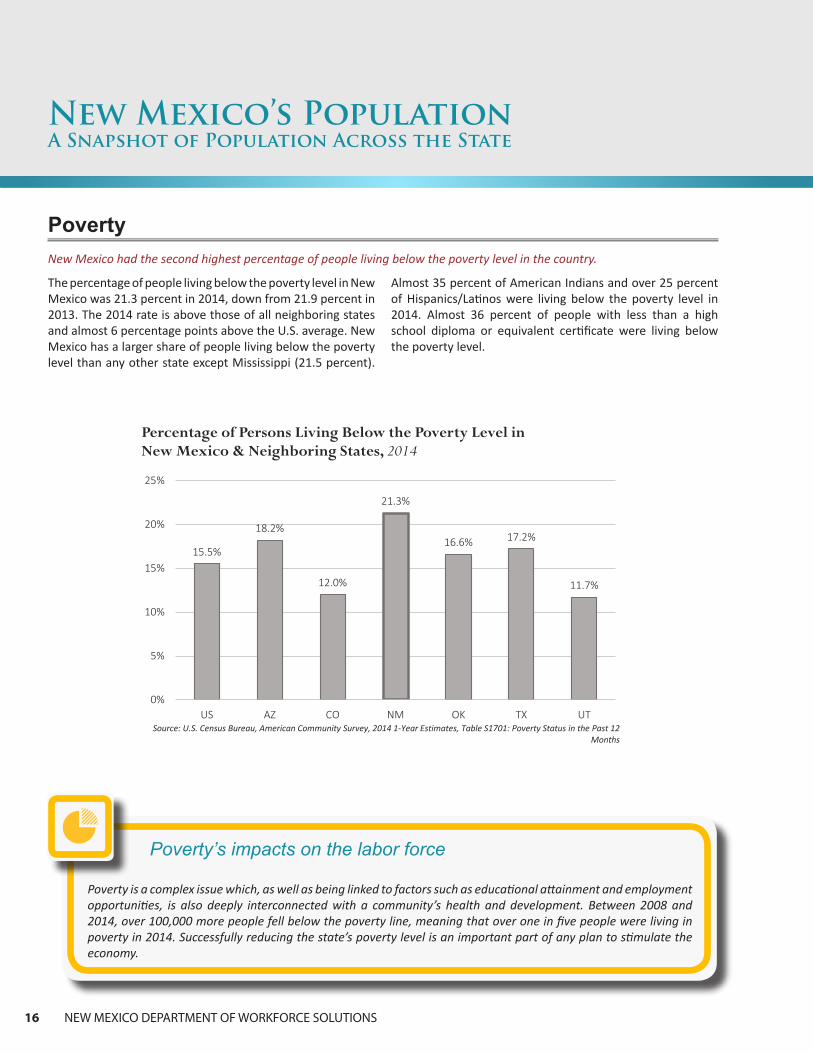
The percentage of people living below the poverty level in New Mexico was 21.3 percent in 2014, down from 21.9 percent in 2013. The 2014 rate is above those of all neighboring states and almost 6 percentage points above the U.S. average. New Mexico has a larger share of people living below the poverty level than any other state except Mississippi (21.5 percent).
New Mexico’s PopulationA Snapshot of Population Across the State
PovertyNew Mexico had the second highest percentage of people living below the poverty level in the country.
Almost 35 percent of American Indians and over 25 percent of Hispanics/Latinos were living below the poverty level in 2014. Almost 36 percent of people with less than a high school diploma or equivalent certificate were living below the poverty level
15.5%
18.2%
12.0%
21.3%
16.6% 17.2%
11.7%
0%
5%
10%
15%
20%
25%
US AZ CO NM OK TX UT
Percentage of Persons Living Below the Poverty Level in New Mexico & Neighboring States, 2014
Source: U.S. Census Bureau, American Community Survey, 2014 1-Year Estimates, Table S1701: Poverty Status in the Past 12 Months
Poverty’s impacts on the labor force
Poverty is a complex issue which, as well as being linked to factors such as educational attainment and employment opportunities, is also deeply interconnected with a community’s health and development. Between 2008 and 2014, over 100,000 more people fell below the poverty line, meaning that over one in five people were living in poverty in 2014. Successfully reducing the state’s poverty level is an important part of any plan to stimulate the economy.

STATE OF THE WORKFORCE 2016 17
In 2014, New Mexico’s labor force participation rate was 59.0 percent, down from 59.3 in 2013 and down from 62.3 percent in 2009. New Mexico’s 2014 rate was 4.3 percentage points below the U.S. labor force participation rate of 63.3 percent. It was the lowest compared to those of all neighboring states and the sixth lowest in the country. The state with the lowest labor force participation rate in 2014 was West Virginia, with a rate of 53.2 percent. Nebraska had the highest rate, at 70.3 percent. From 2009, New Mexico’s labor force participation rate declined by 3.3 percentage points, the largest decline
Note: Unless otherwise noted, all information and data specific to labor force demographics gathered from the U.S. Census Bureau (participation, gender, race, age, education, etc.) include both civilian and active duty armed forces populations. Labor force estimates, employment, and unemployment data, both in total and at industry and occupational levels, count only the civilian labor force.
New Mexico’s WorkforceWhat it Looks Like Now
Labor Force ParticipationIn 2014, New Mexico’s labor force participation rate was the lowest compared to those of all neighboring states and the sixth lowest in the country.
when compared to neighboring states. Arizona’s labor force participation rate declined by 3.2 percentage points, the second largest decline. Rates of all other neighboring states declined by less than 2 percentage points, the average decline for the nation as a whole. The labor force participation rate in Oklahoma fell by only 1.6 percentage points from 2009, while Texas’s rate fell by 1.7 percentage points. Colorado’s rate fell by 1.8 percentage points, and Utah’s rate fell by 1.9 percentage points.
65.3
%
62.4
% 69.9
%
62.3
%
62.9
%
66.2
%
69.5
%
63.3
%
59.2
%
68.1
%
59.0
%
61.3
%
64.5
%
67.6
%
0%
10%
20%
30%
40%
50%
60%
70%
US AZ CO NM OK TX UT
Labor Force ParticipationNew Mexico & Neighboring States, 2009 & 2014
2009 2014
Source: U.S. Census Bureau, American Community Survey, 2009 and 2014 1-Year Estimates, Table S2301:Employment Status
What does labor force participation mean?
The state’s labor force participation measures the civilian population age 16 and older in the labor force (i.e., persons who are either employed or unemployed and actively looking for work). Influenced by many factors, including employment opportunities, population demographics, and wealth, it is an important measure of the state’s economic health. Better economic conditions and job opportunities usually create a higher participation rate.
18 NEW MEXICO DEPARTMENT OF WORKFORCE SOLUTIONS
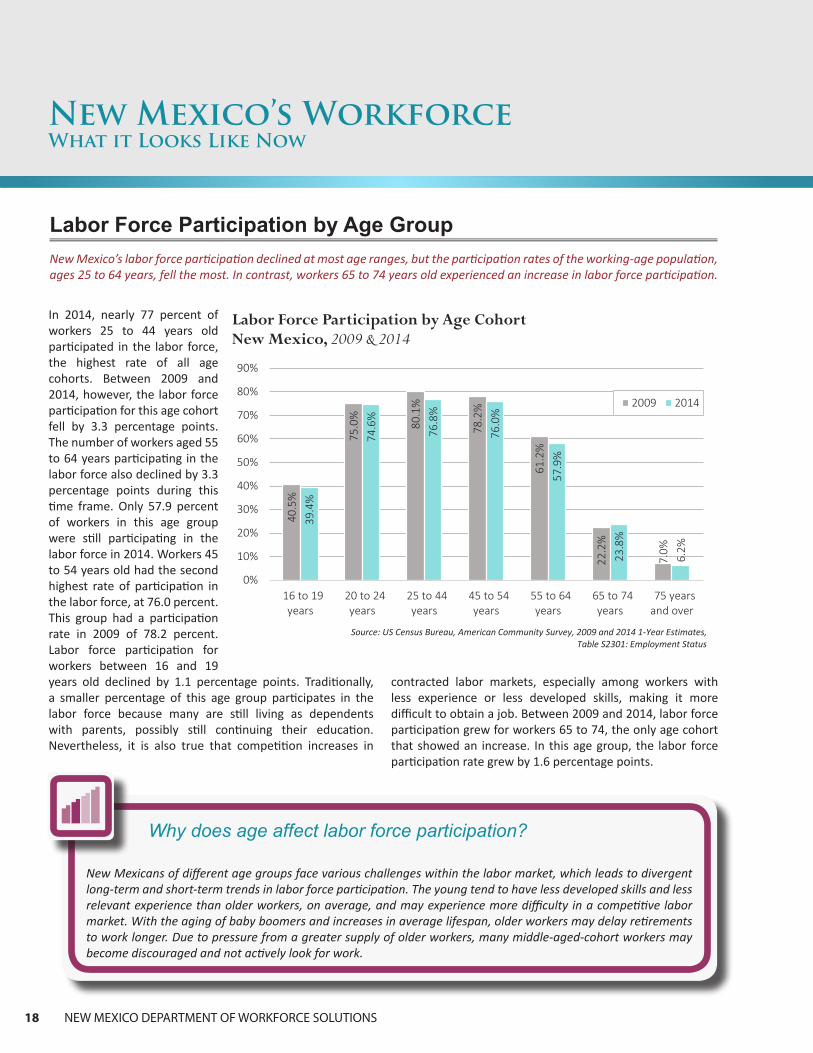
In 2014, nearly 77 percent of workers 25 to 44 years old participated in the labor force, the highest rate of all age cohorts. Between 2009 and 2014, however, the labor force participation for this age cohort fell by 3.3 percentage points. The number of workers aged 55 to 64 years participating in the labor force also declined by 3.3 percentage points during this time frame. Only 57.9 percent of workers in this age group were still participating in the labor force in 2014. Workers 45 to 54 years old had the second highest rate of participation in the labor force, at 76 0 percent This group had a participation rate in 2009 of 78 2 percent Labor force participation for workers between 16 and 19 years old declined by 1.1 percentage points. Traditionally, a smaller percentage of this age group participates in the labor force because many are still living as dependents with parents, possibly still continuing their education. Nevertheless, it is also true that competition increases in
New Mexico’s WorkforceWhat it Looks Like Now
Labor Force Participation by Age Group New Mexico’s labor force participation declined at most age ranges, but the participation rates of the working-age population, ages 25 to 64 years, fell the most. In contrast, workers 65 to 74 years old experienced an increase in labor force participation.
contracted labor markets, especially among workers with less experience or less developed skills, making it more difficult to obtain a job. Between 2009 and 2014, labor force participation grew for workers 65 to 74, the only age cohort that showed an increase. In this age group, the labor force participation rate grew by 1.6 percentage points.
40.5
%
75.0
%
80.1
%
78.2
%
61.2
%
22.2
%
7.0%
39.4
%
74.6
%
76.8
%
76.0
%
57.9
%
23.8
%
6.2%
0%
10%
20%
30%
40%
50%
60%
70%
80%
90%
16 to 19years
20 to 24years
25 to 44years
45 to 54years
55 to 64years
65 to 74years
75 yearsand over
Labor Force Participation by Age CohortNew Mexico, 2009 & 2014
2009 2014
Source: US Census Bureau, American Community Survey, 2009 and 2014 1-Year Estimates, Table S2301: Employment Status
Why does age affect labor force participation?
New Mexicans of different age groups face various challenges within the labor market, which leads to divergent long-term and short-term trends in labor force participation. The young tend to have less developed skills and less relevant experience than older workers, on average, and may experience more difficulty in a competitive labor market. With the aging of baby boomers and increases in average lifespan, older workers may delay retirements to work longer. Due to pressure from a greater supply of older workers, many middle-aged-cohort workers may become discouraged and not actively look for work.
STATE OF THE WORKFORCE 2016 19
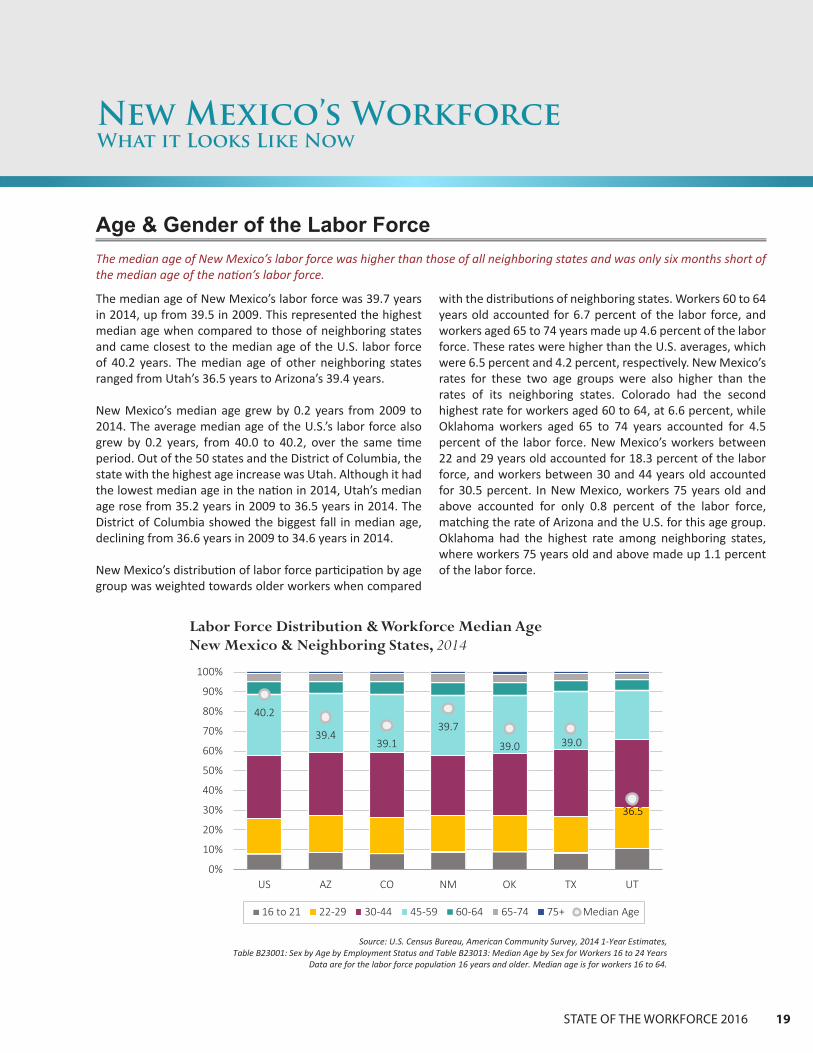
The median age of New Mexico’s labor force was 39.7 years in 2014, up from 39.5 in 2009. This represented the highest median age when compared to those of neighboring states and came closest to the median age of the U.S. labor force of 40.2 years. The median age of other neighboring states ranged from Utah’s 36.5 years to Arizona’s 39.4 years.
New Mexico’s median age grew by 0.2 years from 2009 to 2014. The average median age of the U.S.’s labor force also grew by 0.2 years, from 40.0 to 40.2, over the same time period. Out of the 50 states and the District of Columbia, the state with the highest age increase was Utah. Although it had the lowest median age in the nation in 2014, Utah’s median age rose from 35.2 years in 2009 to 36.5 years in 2014. The District of Columbia showed the biggest fall in median age, declining from 36.6 years in 2009 to 34.6 years in 2014.
New Mexico’s distribution of labor force participation by age group was weighted towards older workers when compared
New Mexico’s WorkforceWhat it Looks Like Now
Age & Gender of the Labor ForceThe median age of New Mexico’s labor force was higher than those of all neighboring states and was only six months short of the median age of the nation’s labor force.
with the distributions of neighboring states. Workers 60 to 64 years old accounted for 6.7 percent of the labor force, and workers aged 65 to 74 years made up 4.6 percent of the labor force. These rates were higher than the U.S. averages, which were 6.5 percent and 4.2 percent, respectively. New Mexico’s rates for these two age groups were also higher than the rates of its neighboring states. Colorado had the second highest rate for workers aged 60 to 64, at 6.6 percent, while Oklahoma workers aged 65 to 74 years accounted for 4.5 percent of the labor force. New Mexico’s workers between 22 and 29 years old accounted for 18.3 percent of the labor force, and workers between 30 and 44 years old accounted for 30.5 percent. In New Mexico, workers 75 years old and above accounted for only 0 8 percent of the labor force, matching the rate of Arizona and the U.S. for this age group. Oklahoma had the highest rate among neighboring states, where workers 75 years old and above made up 1.1 percent of the labor force
40.2
39.439.1
39.7
39.0 39.0
36.5
34.0
35.0
36.0
37.0
38.0
39.0
40.0
41.0
0%
10%
20%
30%
40%
50%
60%
70%
80%
90%
100%
US AZ CO NM OK TX UT
Labor Force Distribution & Workforce Median AgeNew Mexico & Neighboring States, 2014
16 to 21 22-29 30-44 45-59 60-64 65-74 75+ Median Age
Source: U.S. Census Bureau, American Community Survey, 2014 1-Year Estimates,Table B23001: Sex by Age by Employment Status and Table B23013: Median Age by Sex for Workers 16 to 24 Years
Data are for the labor force population 16 years and older. Median age is for workers 16 to 64.
20 NEW MEXICO DEPARTMENT OF WORKFORCE SOLUTIONS
New Mexico’s WorkforceWhat it Looks Like Now
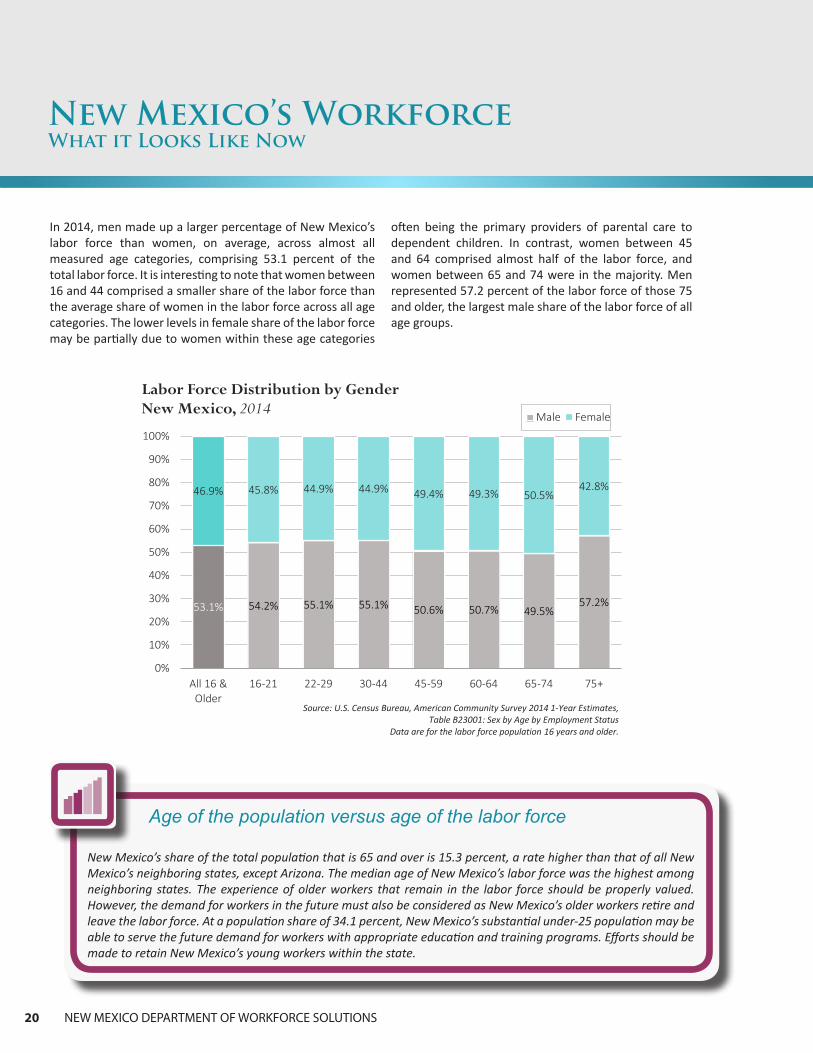
In 2014, men made up a larger percentage of New Mexico’s labor force than women, on average, across almost all measured age categories, comprising 53.1 percent of the total labor force. It is interesting to note that women between 16 and 44 comprised a smaller share of the labor force than the average share of women in the labor force across all age categories. The lower levels in female share of the labor force may be partially due to women within these age categories
often being the primary providers of parental care to dependent children. In contrast, women between 45 and 64 comprised almost half of the labor force, and women between 65 and 74 were in the majority. Men represented 57.2 percent of the labor force of those 75 and older, the largest male share of the labor force of all age groups.
53.1% 54.2% 55.1% 55.1% 50.6% 50.7% 49.5%57.2%
46.9% 45.8% 44.9% 44.9% 49.4% 49.3% 50.5%42.8%
0%
10%
20%
30%
40%
50%
60%
70%
80%
90%
100%
All 16 &Older
16-21 22-29 30-44 45-59 60-64 65-74 75+
Labor Force Distribution by GenderNew Mexico, 2014
Male Female
Source: U.S. Census Bureau, American Community Survey 2014 1-Year Estimates,Table B23001: Sex by Age by Employment Status
Data are for the labor force population 16 years and older.
Age of the population versus age of the labor force
New Mexico’s share of the total population that is 65 and over is 15.3 percent, a rate higher than that of all New Mexico’s neighboring states, except Arizona. The median age of New Mexico’s labor force was the highest among neighboring states. The experience of older workers that remain in the labor force should be properly valued. However, the demand for workers in the future must also be considered as New Mexico’s older workers retire and leave the labor force. At a population share of 34.1 percent, New Mexico’s substantial under-25 population may be able to serve the future demand for workers with appropriate education and training programs. Efforts should be made to retain New Mexico’s young workers within the state.
STATE OF THE WORKFORCE 2016 21
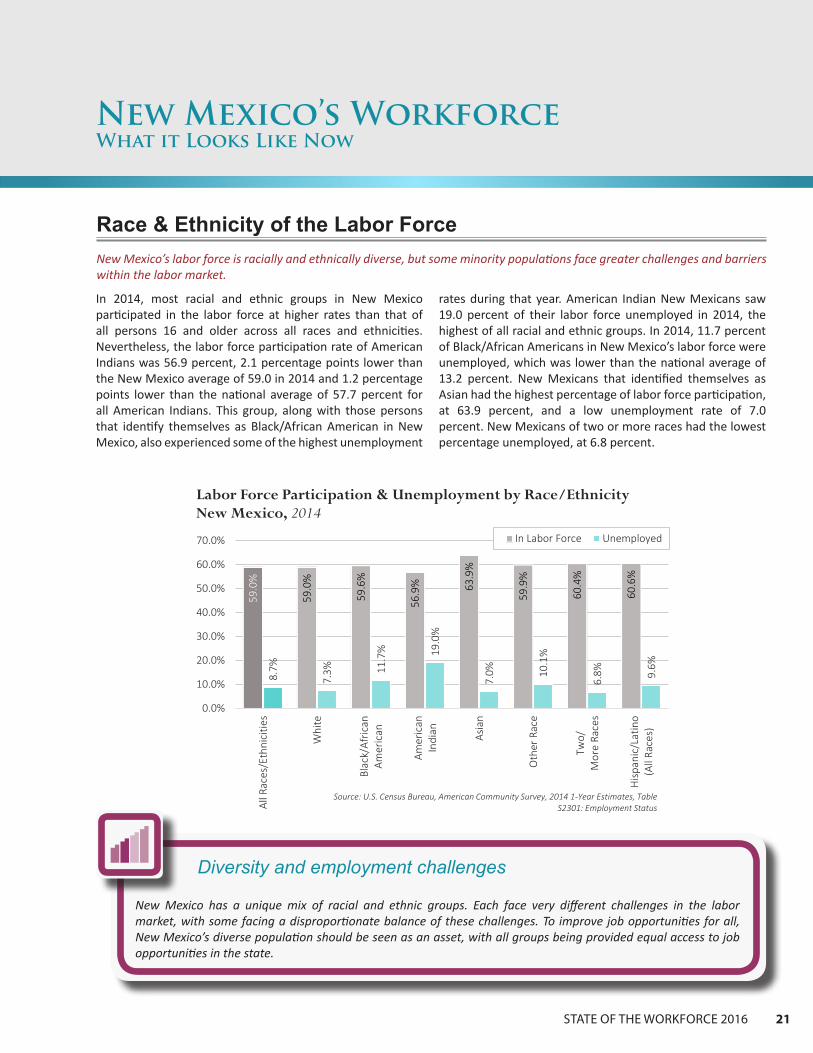
In 2014, most racial and ethnic groups in New Mexico participated in the labor force at higher rates than that of all persons 16 and older across all races and ethnicities. Nevertheless, the labor force participation rate of American Indians was 56.9 percent, 2.1 percentage points lower than the New Mexico average of 59.0 in 2014 and 1.2 percentage points lower than the national average of 57.7 percent for all American Indians. This group, along with those persons that identify themselves as Black/African American in New Mexico, also experienced some of the highest unemployment
rates during that year. American Indian New Mexicans saw 19.0 percent of their labor force unemployed in 2014, the highest of all racial and ethnic groups. In 2014, 11.7 percent of Black/African Americans in New Mexico’s labor force were unemployed, which was lower than the national average of 13.2 percent. New Mexicans that identified themselves as Asian had the highest percentage of labor force participation, at 63.9 percent, and a low unemployment rate of 7.0 percent. New Mexicans of two or more races had the lowest percentage unemployed, at 6.8 percent.
New Mexico’s WorkforceWhat it Looks Like Now
Race & Ethnicity of the Labor Force New Mexico’s labor force is racially and ethnically diverse, but some minority populations face greater challenges and barriers within the labor market.
59.0
%
59.0
%
59.6
%
56.9
% 63.9
%
59.9
%
60.4
%
60.6
%
8.7%
7.3% 11
.7% 19
.0%
7.0% 10
.1%
6.8% 9.
6%
0.0%
10.0%
20.0%
30.0%
40.0%
50.0%
60.0%
70.0%
All R
aces
/Eth
nici
ties
Whi
te
Blac
k/Af
rican
Amer
ican
Amer
ican
Indi
an Asia
n
Oth
er R
ace
Two/
Mor
e Ra
ces
Hisp
anic
/Lat
ino
(All
Race
s)
In Labor Force Unemployed
Source: U.S. Census Bureau, American Community Survey, 2014 1-Year Estimates, Table S2301: Employment Status
Labor Force Participation & Unemployment by Race/EthnicityNew Mexico, 2014
Diversity and employment challenges
New Mexico has a unique mix of racial and ethnic groups. Each face very different challenges in the labor market, with some facing a disproportionate balance of these challenges. To improve job opportunities for all, New Mexico’s diverse population should be seen as an asset, with all groups being provided equal access to job opportunities in the state.
22 NEW MEXICO DEPARTMENT OF WORKFORCE SOLUTIONS
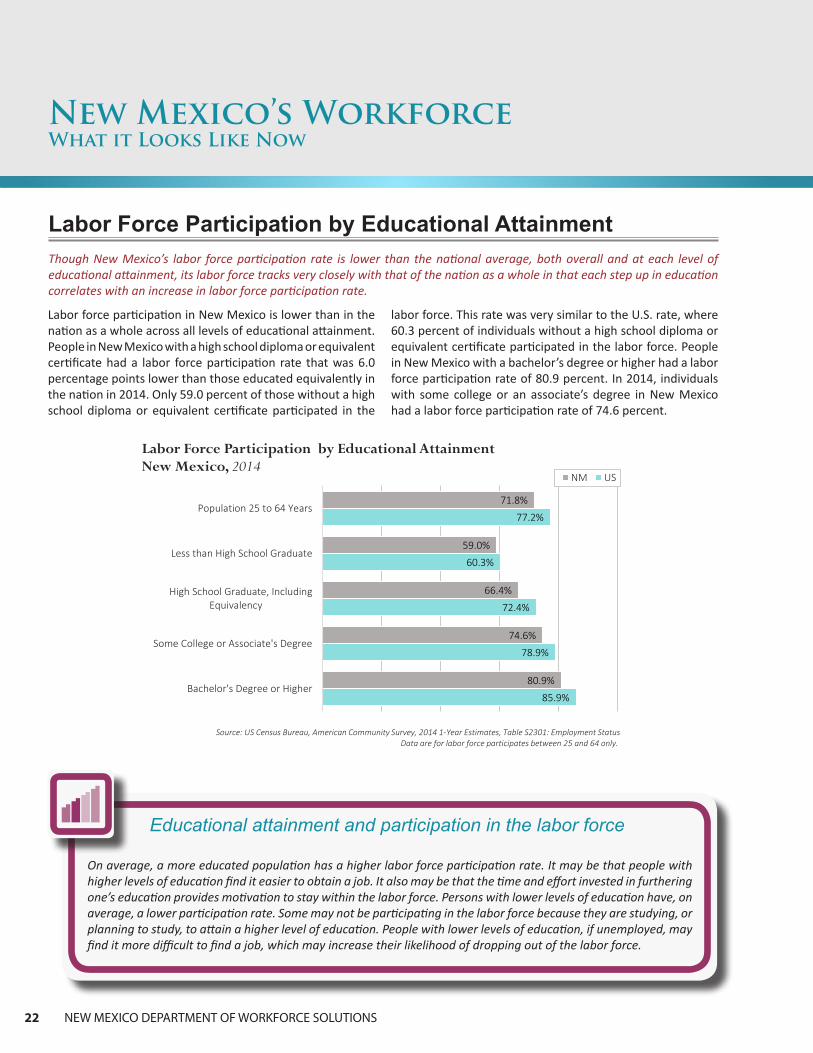
Labor force participation in New Mexico is lower than in the nation as a whole across all levels of educational attainment. People in New Mexico with a high school diploma or equivalent certificate had a labor force participation rate that was 6.0 percentage points lower than those educated equivalently in the nation in 2014. Only 59.0 percent of those without a high school diploma or equivalent certificate participated in the
Labor Force Participation by Educational AttainmentThough New Mexico’s labor force participation rate is lower than the national average, both overall and at each level of educational attainment, its labor force tracks very closely with that of the nation as a whole in that each step up in education correlates with an increase in labor force participation rate.
labor force. This rate was very similar to the U.S. rate, where 60.3 percent of individuals without a high school diploma or equivalent certificate participated in the labor force. People in New Mexico with a bachelor’s degree or higher had a labor force participation rate of 80.9 percent. In 2014, individuals with some college or an associate’s degree in New Mexico had a labor force participation rate of 74.6 percent.
New Mexico’s WorkforceWhat it Looks Like Now
85.9%
78.9%
72.4%
60.3%
77.2%
80.9%
74.6%
66.4%
59.0%
71.8%
Bachelor's Degree or Higher
Some College or Associate's Degree
High School Graduate, IncludingEquivalency
Less than High School Graduate
Population 25 to 64 Years
Labor Force Participation by Educational AttainmentNew Mexico, 2014
NM US
Source: US Census Bureau, American Community Survey, 2014 1-Year Estimates, Table S2301: Employment StatusData are for labor force participates between 25 and 64 only.
Educational attainment and participation in the labor force
On average, a more educated population has a higher labor force participation rate. It may be that people with higher levels of education find it easier to obtain a job. It also may be that the time and effort invested in furthering one’s education provides motivation to stay within the labor force. Persons with lower levels of education have, on average, a lower participation rate. Some may not be participating in the labor force because they are studying, or planning to study, to attain a higher level of education. People with lower levels of education, if unemployed, may find it more difficult to find a job, which may increase their likelihood of dropping out of the labor force.

STATE OF THE WORKFORCE 2016 23
Although the Great Recession officially ended in June 2009, civilian labor force numbers increased nationally only from 2012 forward, after declining for the previous three years. The timing of state- and county-level recessionary effects varied, making comparison-year selections somewhat arbitrary; however, in the labor force, employment, and unemployment sections that follow, reference-year ranges were chosen to
generally encompass national pre-recession, recession, and recovery periods, along with the most recent ten-year span. Because of redesign changes in the Bureau of Labor Statistics’ Local Area Unemployment Statistics program, substate estimates include series breaks between 2009 and 2010 that are largely noneconomic in nature. These breaks tend to be more noticeable in employment than unemployment.
New Mexico’s WorkforceHow it’s Growing
Labor Force GrowthNew Mexico’s annual average civilian labor force growth slowed to 0.2 percent during the recent downturn (defined here as 2007 to 2010), slightly lower than the 0.5 percent national average. The state’s growth dipped to negative 1.9 percent for the subsequent four-year period.
New Mexico’s labor force growth for 2004–2007, when the economy was operating at a high level, registered 3.5 percent, only slightly lower than the 3.9 percent national rate. The statewide figure dropped to 0.2 percent for 2007–2010, before falling to negative 1.9 percent for 2010–2014; comparable national rates were 0.5 percent and 1.3 percent, respectively. Among New Mexico’s neighboring states, only
Texas posted robust growth for all four reference periods. Utah’s labor force numbers jumped sharply during recovery, with growth increasing from negative 0.2 percent for 2007–2010 to 5.5 percent for 2010–2014. Recent losses pushed New Mexico’s 2004–2014 growth rate to 1.8 percent, well below levels for nearby states and the nation as a whole.
3.9%
8.5%
5.2%
3.5%
2.2% 4.
0%
10.4
%
0.5% 1.
8% 2.2%
0.2%
2.4%
7.1%
-0.2
%
1.3%
0.0%
3.4%
-1.9
%
0.9%
7.1%
5.5%5.8%
10.5
%
11.3
%
1.8%
5.6%
19.3
%
16.2
%
-10.0%
-5.0%
0.0%
5.0%
10.0%
15.0%
20.0%
US AZ CO NM OK TX UT
Labor Force Growth RatesNew Mexico & Neighboring States, 2004–2014
2004-2007 2007-20102010-2014 2004-2014
Source: NMDWS calculations based on U.S. Bureau of Labor Statistics estimates

24 NEW MEXICO DEPARTMENT OF WORKFORCE SOLUTIONS
New Mexico’s WorkforceHow it’s Growing
New Mexico’s 3.5 percent labor force growth for 2004–2007 comprised a gain for each of the state’s four workforce regions. For 2007–2010, the Central Region logged a 5.0 percent gain that dwarfed the statewide increase of just 0.2 percent, which included losses in the Eastern and Northern Regions (down 2.1 percent and 6.5 percent, respectively) and a slight gain in the Southwestern Region (up 0.8 percent). For the 2010–2014 recovery period, only the Eastern Region, at
2.6 percent, posted positive growth, with labor forces contracting for the three other regions. For the most recent ten-year period, gains in the Central (up 6.5 percent), Eastern (up 4.3 percent), and Southwestern (up 4.2 percent) Regions were partially offset by a large decline in the Northern Region (down 8.7 percent), resulting in a statewide gain of 1.8 percent.
3.5% 4.
3%
3.8%
1.4%
4.7%
0.2%
5.0%
-2.1
%
-6.5
%
0.8%
-1.9
%
-2.8
%
2.6%
-3.8
%
-1.2
%
1.8%
6.5%
4.3%
-8.7
%
4.2%
-10.0%
-8.0%
-6.0%
-4.0%
-2.0%
0.0%
2.0%
4.0%
6.0%
8.0%
Statewide Central Eastern Northern Southwestern
Labor Force Growth RatesNew Mexico & Regions, 2004–2014
2004-2007 2007-2010
2010-2014 2004-2014
Source: NMDWS calculations based on U.S. Bureau of Labor Statistics estimates
Bright spots and areas of continued focus
Oil and gas activity produced significant labor force expansions in Lea County, up 14.8 percent, and Eddy County, up 11.2 percent, between 2010 and 2014, a period in which labor force numbers contracted for nearly every other county in the state. Crude oil prices dipped sharply, however, during the second half of 2014 and have since remained subdued, dampening near-term growth prospects in the Permian Basin. According to the latest census data, New Mexico was one of only six states to lose population between 2013 and 2014, and, because nearly all of those states had relatively high unemployment rates, at least part of the population exodus was likely due to job seekers relocating for employment opportunities in neighboring states and beyond.

STATE OF THE WORKFORCE 2016 25
During the 2004–2007 pre-recession period, New Mexico’s employment growth, at 5.4 percent, slightly exceeded the national rate of 4.9 percent and ranked near the middle among neighboring states. Recessionary losses pushed New Mexico’s 2007–2010 employment decline to 4.3 percent, similar to that of the nation as a whole, down 4.8 percent, and most of the nearby states. Employment actually increased in Texas, up 2.8 percent, and fell only slightly in Oklahoma, down 0.4 percent. Employment growth increased, ranging from fairly to very sharply, for the other five states and the U.S. between 2010 and 2014 but fell by 0.2 percent for New Mexico. This recent weakness in New Mexico employment growth left the state’s ten-year rate at a meager 0.6 percent, well below the 5.1 percent national level and the rates for neighboring states. Texas was the only area in this analysis to post positive employment growth for each of the reference periods.
Similar to the civilian labor force changes, New Mexico’s statewide employment growth of 5.4 percent for the 2004–2007 period reflected gains in all four substate regions. Large disparities in growth rates emerged, however, during the 2007–2010 period, with employment increasing in the Central Region, up 0.2 percent, while decreasing in the other three regions, producing a statewide net decline of 4.3 percent. The Eastern Region’s employment gain of 4.6 percent between 2010 and 2014 was more than offset by generally modest losses elsewhere, resulting in a statewide decline of 0.2 percent. Employment edged up just 0.6 percent statewide between 2004 and 2014, with a sharp dip in the Northern Region, down 10.0 percent, nearly equaling the combined gains in the remaining regions.
New Mexico’s WorkforceHow it’s Growing
Employment GrowthEmployment growth in New Mexico slipped to negative 4.3 percent for 2007–2010, a slightly better outcome than for the nation as a whole. However, growth remained below the zero line for 2010–2014, while neighboring states and the U.S. moved into recovery.
4.9%
9.9%
7.2%
5.4%
3.0%
5.8%
13.2
%
-4.8
%
-5.1
% -3.1
%
-4.3
%
-0.4
%
2.8%
-5.6
%
5.2%
3.9%
7.6%
-0.2
%
3.4%
10.7
%
10.2
%
5.1%
8.4%
11.8
%
0.6%
6.0%
20.4
%
17.7
%
-12.0%
-7.0%
-2.0%
3.0%
8.0%
13.0%
18.0%
23.0%
US AZ CO NM OK TX UT
Employment Growth RatesNew Mexico & Neighboring States, 2004–2014
2004-2007 2007-2010
2010-2014 2004-2014
Source: NMDWS calculations based on U.S. Bureau of Labor Statistics estimates

26 NEW MEXICO DEPARTMENT OF WORKFORCE SOLUTIONS
New Mexico’s WorkforceHow it’s Growing
5.4% 5.9%
5.9%
3.4%
7.5%
-4.3
%
0.2%
-5.9
%
-11.
1%
-4.0
%
-0.2
%
-1.1
%
4.6%
-2.1
% -0.1
%
0.6%
5.0%
4.2%
-10.
0%
3.2%
-16.0%
-12.0%
-8.0%
-4.0%
0.0%
4.0%
8.0%
12.0%
Statewide Central Eastern Northern Southwestern
Employment Growth RatesNew Mexico & Regions, 2004–2014 2004-2007 2007-2010
2010-2014 2004-2014
Source: NMDWS calculations based on U.S. Bureau of Labor Statistics estimates
Bright spots and areas of continued focus
New Mexico’s employment growth, as measured by the Local Area Unemployment Statistics program, exceeded that of the U.S. during the years immediately preceding the Great Recession. However, the state’s employment gains for subsequent years lagged those of its five neighbors and the nation as a whole. Aside from the mining sector, which in recent years produced large employment increases from the oil and gas activities in southeastern New Mexico, no single sector or combination of sectors generated employment growth sufficient to propel the recovery forward. Nevertheless, the health care sector has created a large number of new jobs, many related to the recent Medicaid expansion.

STATE OF THE WORKFORCE 2016 27
New Mexico’s WorkforceHow it’s Growing
2007
2008
20102011
Bernalillo Sandoval
Torrance
Valencia
Guadalupe
Harding
Quay
Union
Curry
De Baca
Roosevelt
Chaves
Eddy
Lea Lincoln
Otero Cibola McKinley Rio Arriba
San Juan
Colfax
Los Alamos
Mora
San Miguel
Santa Fe
Taos
Catron
Dona Ana
Grant
Hidalgo
Luna Sierra
Socorro
2013
Central
Northeastern
East-Central
SoutheasternNorthwestern
North-Central
Southwestern
Source: NMDWS calculations based on U.S. Bureau of Labor Statistics estimates
Over-the-Year Employment ChangesNew Mexico's Counties by Region, 2007-2014
2009
2012
2014
Increased more than 2%Increased between 1% & 2%
Increased less than 1% Decreased less than 1%Decreased between 1% and 2%Decreased more than 2%
2007
2008
20102011
Bernalillo Sandoval
Torrance
Valencia
Guadalupe
Harding
Quay
Union
Curry
De Baca
Roosevelt
Chaves
Eddy
Lea Lincoln
Otero Cibola McKinley Rio Arriba
San Juan
Colfax
Los Alamos
Mora
San Miguel
Santa Fe
Taos
Catron
Dona Ana
Grant
Hidalgo
Luna Sierra
Socorro
2013
Central
Northeastern
East-Central
SoutheasternNorthwestern
North-Central
Southwestern
Source: NMDWS calculations based on U.S. Bureau of Labor Statistics estimates
Over-the-Year Employment ChangesNew Mexico's Counties by Region, 2007-2014
2009
2012
2014

28 NEW MEXICO DEPARTMENT OF WORKFORCE SOLUTIONS
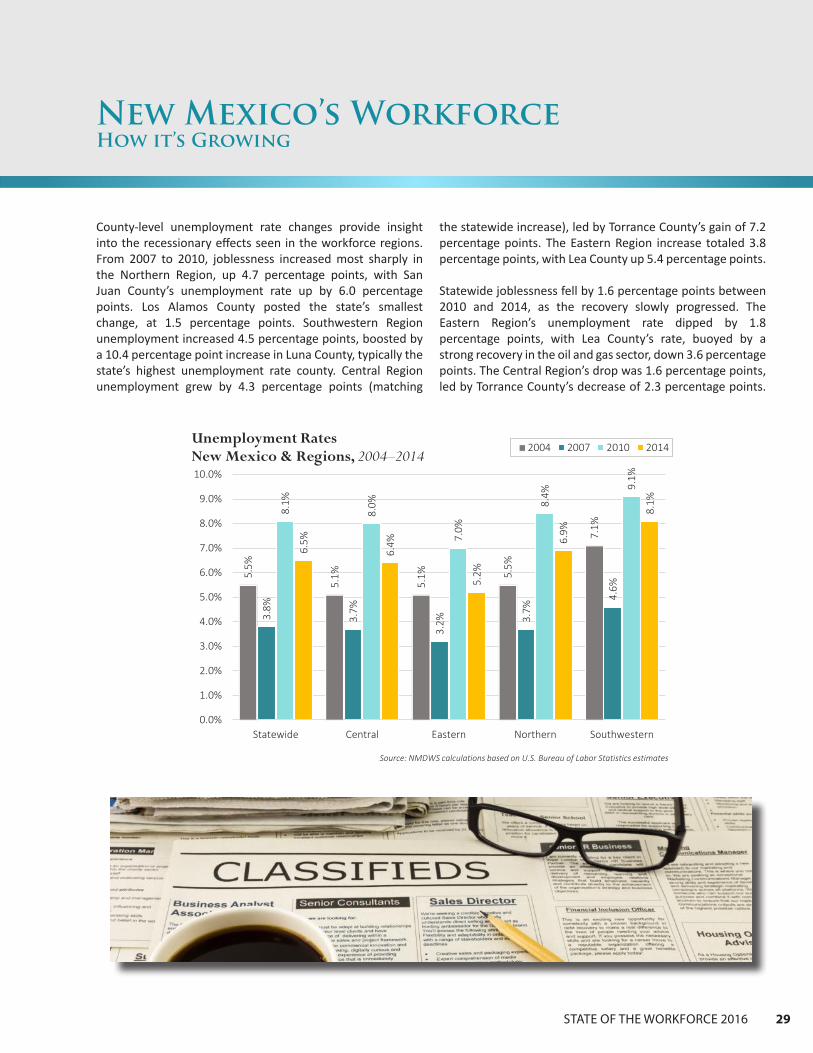
Annual average unemployment rates for the nation as a whole and the six neighboring states were remarkably similar in 2004, ranging from 4.9 percent in Oklahoma to 5.9 percent in Texas, with joblessness at 5.0 percent for Arizona and Utah and 5.5 percent for New Mexico, Colorado, and the U.S. By 2007, unemployment had dipped to 4.6 percent nationally and fallen even more sharply for New Mexico, at 3.8 percent, and most of its nearby states. The recession’s impacts boosted rates significantly between 2007 and 2010 (to more than double for five of the seven areas). Recovery between 2010 and 2014 was slower for New Mexico than for the other areas, although unemployment rates were down across the board.
The Central Region’s unemployment rate was 0.4 percentage point below the statewide level in 2004 (5.1 percent to 5.5 percent), before the deficit narrowed to 0.1 percentage point in each of the later reference years. Unemployment rates in the Eastern Region were lower than statewide levels for all four years, while those in the Southwestern Region were higher. Joblessness in the Northern Region equaled that for the state as a whole in 2004, at 5.5 percent, was 0.1 point lower for 2007, 3.7 percent to 3.8 percent, and exceeded the statewide level for both 2010, 8.4 percent to 8.1 percent, and 2014, 6 9 percent to 6 5 percent
New Mexico’s WorkforceHow it’s Growing
Unemployment GrowthNew Mexico’s unemployment rate dipped 0.8 percentage point below the national level in 2007, around the last business cycle peak, and stood 1.5 percentage points lower in 2010, when annual averages for both the state and nation approached series highs. The positions reversed between 2010 and 2014, however, as the unemployment rate fell by 3.4 percentage points in the U.S. but just 1.6 percentage points in New Mexico.
5.5%
5.0% 5.
5%
5.5%
4.9%
5.9%
5.0%
4.6%
3.9%
3.7% 3.8% 4.
1% 4.3%
2.6%
9.6%
10.4
%
8.7%
8.1%
6.8%
8.1%
7.8%
6.2% 6.
9%
5.0%
6.5%
4.5% 5.
1%
3.8%
0.0%
2.0%
4.0%
6.0%
8.0%
10.0%
12.0%
US AZ CO NM OK TX UT
Unemployment RatesNew Mexico & Neighboring States, 2004–2014
2004 2007 2010 2014
Source: U.S. Bureau of Labor Statistics
Future Workforce Supply
STATE OF THE WORKFORCE 2016 29
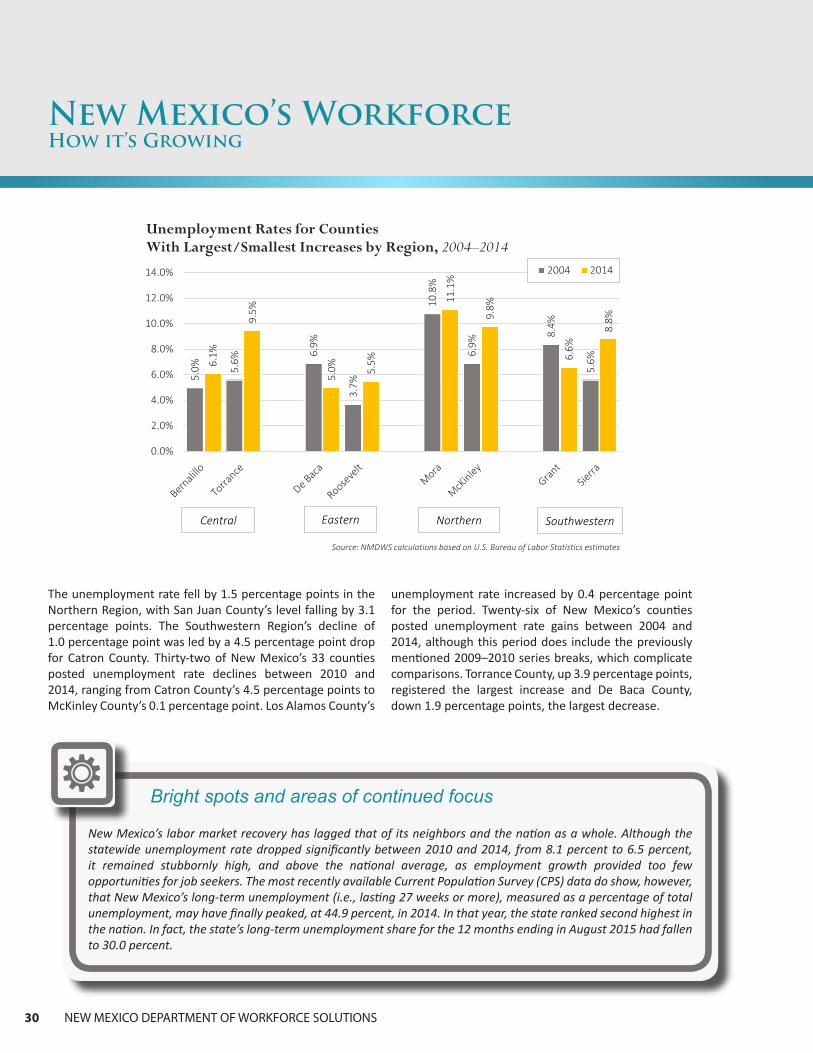
County-level unemployment rate changes provide insight into the recessionary effects seen in the workforce regions. From 2007 to 2010, joblessness increased most sharply in the Northern Region, up 4.7 percentage points, with San Juan County’s unemployment rate up by 6.0 percentage points. Los Alamos County posted the state’s smallest change, at 1.5 percentage points. Southwestern Region unemployment increased 4.5 percentage points, boosted by a 10.4 percentage point increase in Luna County, typically the state’s highest unemployment rate county. Central Region unemployment grew by 4.3 percentage points (matching
the statewide increase), led by Torrance County’s gain of 7.2 percentage points. The Eastern Region increase totaled 3.8 percentage points, with Lea County up 5.4 percentage points.
Statewide joblessness fell by 1.6 percentage points between 2010 and 2014, as the recovery slowly progressed. The Eastern Region’s unemployment rate dipped by 1.8 percentage points, with Lea County’s rate, buoyed by a strong recovery in the oil and gas sector, down 3.6 percentage points. The Central Region’s drop was 1.6 percentage points, led by Torrance County’s decrease of 2.3 percentage points.
New Mexico’s WorkforceHow it’s Growing
5.5%
5.1%
5.1% 5.
5%
7.1%
3.8%
3.7%
3.2% 3.
7%
4.6%
8.1%
8.0%
7.0%
8.4%
9.1%
6.5%
6.4%
5.2%
6.9%
8.1%
0.0%
1.0%
2.0%
3.0%
4.0%
5.0%
6.0%
7.0%
8.0%
9.0%
10.0%
Statewide Central Eastern Northern Southwestern
Unemployment RatesNew Mexico & Regions, 2004–2014
2004 2007 2010 2014
Source: NMDWS calculations based on U.S. Bureau of Labor Statistics estimates
30 NEW MEXICO DEPARTMENT OF WORKFORCE SOLUTIONS
The unemployment rate fell by 1.5 percentage points in the Northern Region, with San Juan County’s level falling by 3.1 percentage points. The Southwestern Region’s decline of 1.0 percentage point was led by a 4.5 percentage point drop for Catron County. Thirty-two of New Mexico’s 33 counties posted unemployment rate declines between 2010 and 2014, ranging from Catron County’s 4.5 percentage points to McKinley County’s 0.1 percentage point. Los Alamos County’s
New Mexico’s WorkforceHow it’s Growing
unemployment rate increased by 0.4 percentage point for the period. Twenty-six of New Mexico’s counties posted unemployment rate gains between 2004 and 2014, although this period does include the previously mentioned 2009–2010 series breaks, which complicate comparisons. Torrance County, up 3.9 percentage points, registered the largest increase and De Baca County, down 1.9 percentage points, the largest decrease.
5.0% 5.
6%
6.9%
3.7%
10.8
%
6.9%
8.4%
5.6%6.
1%
9.5%
5.0% 5.
5%
11.1
%
9.8%
6.6%
8.8%
0.0%
2.0%
4.0%
6.0%
8.0%
10.0%
12.0%
14.0% 2004 2014
Source: NMDWS calculations based on U.S. Bureau of Labor Statistics estimates
Central SouthwesternEastern Northern
Unemployment Rates for Counties With Largest/Smallest Increases by Region, 2004–2014
Bright spots and areas of continued focus
New Mexico’s labor market recovery has lagged that of its neighbors and the nation as a whole. Although the statewide unemployment rate dropped significantly between 2010 and 2014, from 8.1 percent to 6.5 percent, it remained stubbornly high, and above the national average, as employment growth provided too few opportunities for job seekers. The most recently available Current Population Survey (CPS) data do show, however, that New Mexico’s long-term unemployment (i.e., lasting 27 weeks or more), measured as a percentage of total unemployment, may have finally peaked, at 44.9 percent, in 2014. In that year, the state ranked second highest in the nation. In fact, the state’s long-term unemployment share for the 12 months ending in August 2015 had fallen to 30.0 percent.

STATE OF THE WORKFORCE 2016 31
New Mexico’s largest employing industry in 2014 was health care and social assistance. Jobs in the industry made up 16.3 percent of total employment. All of the six largest industries, including health care and social assistance, were service industries. These industries, including retail trade (11.7 percent), accommodation and food services (10.9 percent),
educational services (9.8 percent), public administration (7.5 percent), and professional, scientific, and technical services (6.7 percent), comprised 62.9 percent of the state’s total employment. Manufacturing and mining each made up only 3.5 percent of employment.
New Mexico’s WorkforceIndustries, Occupations & Wages
Employment in New Mexico’s IndustriesThe health care industry has experienced the largest employment growth in all regions throughout New Mexico, except the Eastern Region, where mining has seen the largest and fastest growth.
Health Care & Social Assistance
16.3%
Retail Trade11.7%
Accommodation & Food Svcs
10.9%
Educational Svcs9.8%
Public Administration
7.5%
Professional, Scientific & Technical
Svcs6.7%
Construction5.8%
Admin./Support & Waste Mgmt Svcs
5.5%
Manufacturing 3.5%
Mining3.5%
Transportation & Warehousing
2.8%
Wholesale Trade2.7%
Finance & Insurance2.7%
Other Services(Ex. Government)
2.6%
Arts, Entertainment & Recreation
2.1%Information
1.7%
Agriculture1.4%
Real Estate & Rental
1.3%
Utilities0.8%
Mgmt of Companies & Enterprises
0.6%
Industry DistributionNew Mexico, 2014
Source: Quarterly Census of Employment and Wages (QCEW)

32 NEW MEXICO DEPARTMENT OF WORKFORCE SOLUTIONS
Between 2009 and 2014, more industries experienced employment losses than saw growth. But, there was an overall increase in employment due to relatively large gains in the three fastest growing industries. The mining industry saw the largest growth in both percentage change and number of jobs added. The industry added 10,288 jobs between 2009 and 2014, representing a 58.5 percent increase. Health care and social assistance added almost as many jobs (9,746), but, due to the large size of the industry, growth only amounted to an 8.1 percent increase. Employment in accommodation
and food services increased by 6,027 jobs, rounding out the large-industry gains. Five other industries had much smaller employment gains. Several industries had notable decreases in employment, with losses of more than 2,000 jobs in each of construction, manufacturing, information, educational services, public administration, and professional, scientific, and technical services. Construction took the biggest hit over the five-year period. The industry lost over 5,100 jobs, amounting to a 9.9 percent decline in employment.
New Mexico’s WorkforceIndustries, Occupations & Wages
-5,117
-3,411
-3,261
-2,777
-2,304
-2,036
-985
-521
-228
-162
-43
-29
41
163
542
578
905
6,027
9,746
10,288
-9.9%
-5.4%
-5.7%
-3.4%
-14.4%
-6.8%
-4.5%
-2.3%
-3.5%
-1.6%
-0.2%
-0.6%
0.2%
0.4%
2.4%
5.3%
1.0%
7.4%
8.1%
58.5%
-81% -61% -41% -21% -1% 19% 39% 59%
-18,000 -13,000 -8,000 -3,000 2,00 0 7,00 0 12,0 00
Construction
Public Administration
Professional, Scientific & Technical Svcs
Educational Svcs
Information
Manufacturing
Other Services (Ex. Government)
Finance & Insurance
Utilities
Real Estate & Rental
Wholesale Trade
Mgmt of Companies & Enterprises
Arts, Entertainment & Recreation
Admin./Support & Waste Mgmt Svcs
Transportation & Warehousing
Agriculture
Retail Trade
Accommodation & Food Services
Health Care & Social Assistance
Mining
Industry Employment GrowthNew Mexico, 2009–2014
Numeric Change
% Change
Source: Quarterly Census of Employment and Wages (QCEW)
STATE OF THE WORKFORCE 2016 33
New Mexico’s WorkforceIndustries, Occupations & Wages
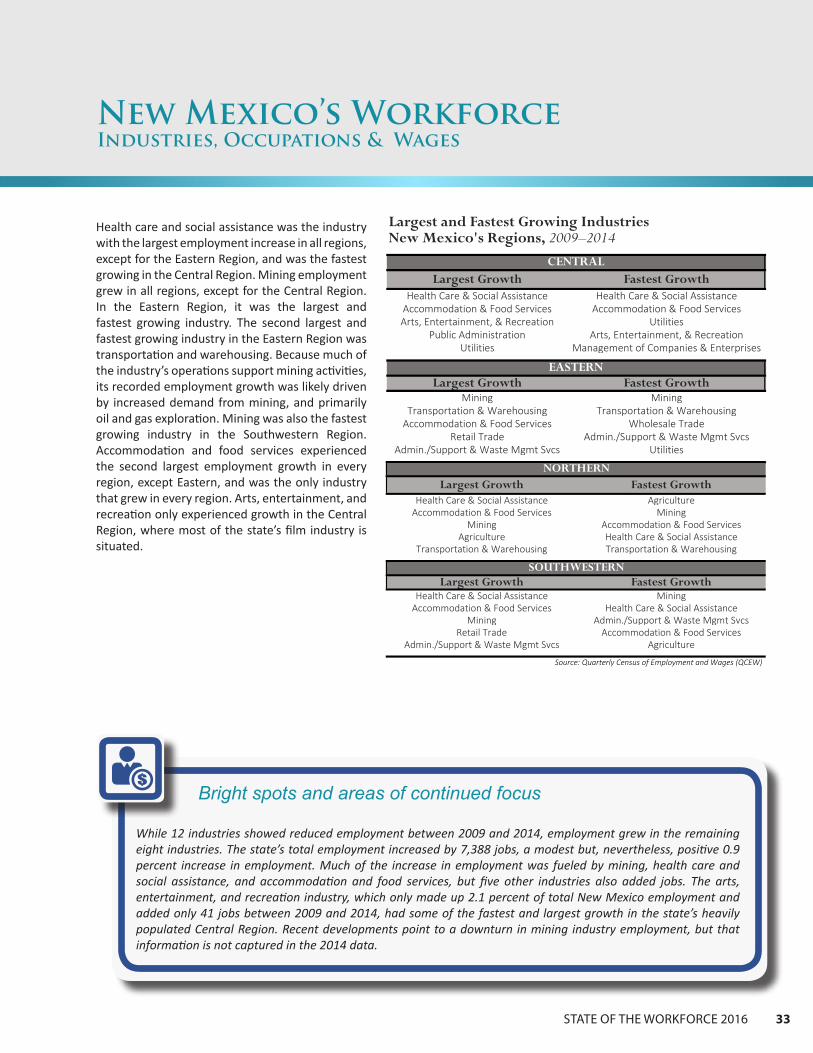
Health care and social assistance was the industry with the largest employment increase in all regions, except for the Eastern Region, and was the fastest growing in the Central Region. Mining employment grew in all regions, except for the Central Region. In the Eastern Region, it was the largest and fastest growing industry. The second largest and fastest growing industry in the Eastern Region was transportation and warehousing. Because much of the industry’s operations support mining activities, its recorded employment growth was likely driven by increased demand from mining, and primarily oil and gas exploration. Mining was also the fastest growing industry in the Southwestern Region. Accommodation and food services experienced the second largest employment growth in every region, except Eastern, and was the only industry that grew in every region. Arts, entertainment, and recreation only experienced growth in the Central Region, where most of the state’s film industry is situated.
Largest and Fastest Growing IndustriesNew Mexico's Regions, 2009–2014
Largest Growth Fastest Growth Largest Growth Fastest GrowthHealth Care & Social Assistance Health Care & Social Assistance Health Care & Social Assistance Agriculture
Accommodation & Food Services Accommodation & Food Services Accommodation & Food Services MiningArts, Entertainment, & Recreation Utilities Mining Accommodation & Food Services
Public Administration Arts, Entertainment, & Recreation Agriculture Health Care & Social AssistanceUtilities Management of Companies & Enterprises Transportation & Warehousing Transportation & Warehousing
Largest Growth Fastest Growth Largest Growth Fastest GrowthMining Mining Health Care & Social Assistance Mining
Transportation & Warehousing Transportation & Warehousing Accommodation & Food Services Health Care & Social AssistanceAccommodation & Food Services Wholesale Trade Mining Admin./Support & Waste Mgmt Svcs
Retail Trade Admin./Support & Waste Mgmt Svcs Retail Trade Accommodation & Food ServicesAdmin./Support & Waste Mgmt Svcs Utilities Admin./Support & Waste Mgmt Svcs Agriculture
Source: Quarterly Census of Employment and Wages (QCEW)Only four industries experienced growth between 2009 and 2014 within the Northern Region
CENTRAL NORTHERN
EASTERN SOUTHWESTERN
Bright spots and areas of continued focus
While 12 industries showed reduced employment between 2009 and 2014, employment grew in the remaining eight industries. The state’s total employment increased by 7,388 jobs, a modest but, nevertheless, positive 0.9 percent increase in employment. Much of the increase in employment was fueled by mining, health care and social assistance, and accommodation and food services, but five other industries also added jobs. The arts, entertainment, and recreation industry, which only made up 2.1 percent of total New Mexico employment and added only 41 jobs between 2009 and 2014, had some of the fastest and largest growth in the state’s heavily populated Central Region. Recent developments point to a downturn in mining industry employment, but that information is not captured in the 2014 data.
Largest and Fastest Growing IndustriesNew Mexico's Regions, 2009–2014
Largest Growth Fastest Growth Largest Growth Fastest GrowthHealth Care & Social Assistance Health Care & Social Assistance Health Care & Social Assistance Agriculture
Accommodation & Food Services Accommodation & Food Services Accommodation & Food Services MiningArts, Entertainment, & Recreation Utilities Mining Accommodation & Food Services
Public Administration Arts, Entertainment, & Recreation Agriculture Health Care & Social AssistanceUtilities Management of Companies & Enterprises Transportation & Warehousing Transportation & Warehousing
Largest Growth Fastest Growth Largest Growth Fastest GrowthMining Mining Health Care & Social Assistance Mining
Transportation & Warehousing Transportation & Warehousing Accommodation & Food Services Health Care & Social AssistanceAccommodation & Food Services Wholesale Trade Mining Admin./Support & Waste Mgmt Svcs
Retail Trade Admin./Support & Waste Mgmt Svcs Retail Trade Accommodation & Food ServicesAdmin./Support & Waste Mgmt Svcs Utilities Admin./Support & Waste Mgmt Svcs Agriculture
Source: Quarterly Census of Employment and Wages (QCEW)Only four industries experienced growth between 2009 and 2014 within the Northern Region
CENTRAL NORTHERN
EASTERN SOUTHWESTERN
34 NEW MEXICO DEPARTMENT OF WORKFORCE SOLUTIONS
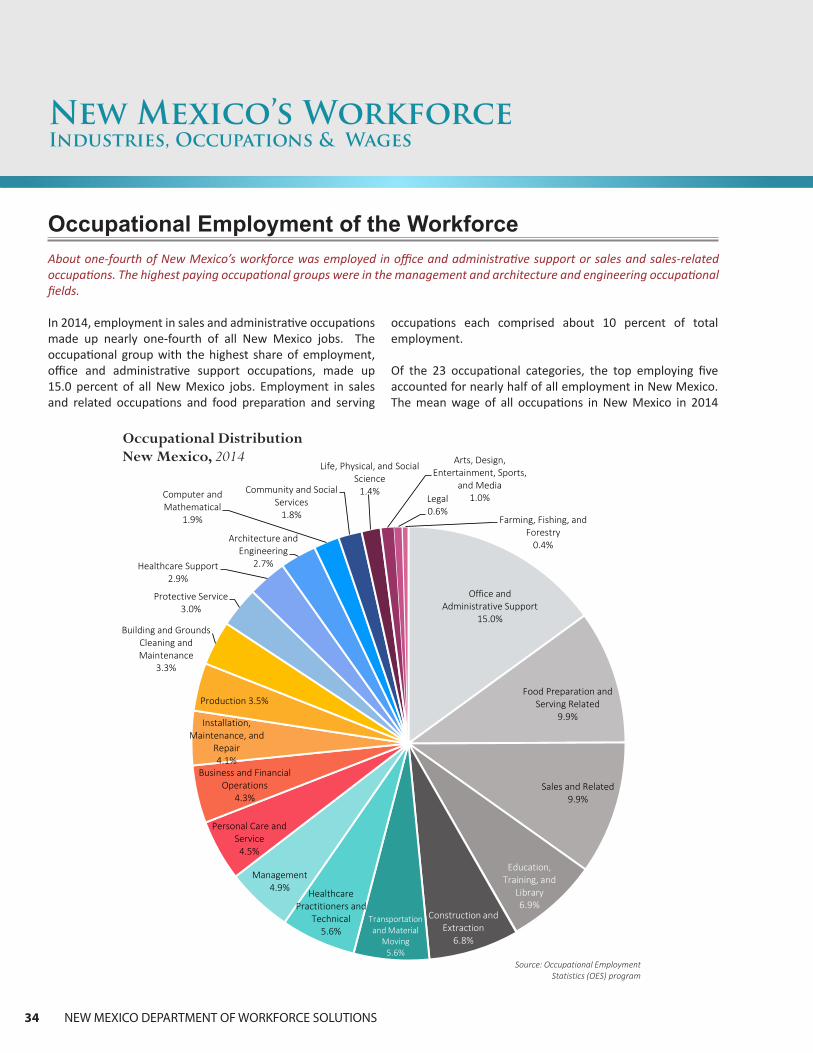
In 2014, employment in sales and administrative occupations made up nearly one-fourth of all New Mexico jobs. The occupational group with the highest share of employment, office and administrative support occupations, made up 15.0 percent of all New Mexico jobs. Employment in sales and related occupations and food preparation and serving
occupations each comprised about 10 percent of total employment.
Of the 23 occupational categories, the top employing five accounted for nearly half of all employment in New Mexico. The mean wage of all occupations in New Mexico in 2014
New Mexico’s WorkforceIndustries, Occupations & Wages
Occupational Employment of the WorkforceAbout one-fourth of New Mexico’s workforce was employed in office and administrative support or sales and sales-related occupations. The highest paying occupational groups were in the management and architecture and engineering occupational fields.
Office and Administrative Support
15.0%
Food Preparation and Serving Related
9.9%
Sales and Related9.9%
Education, Training, and
Library6.9%
Construction and Extraction
6.8%
Transportation and Material
Moving5.6%
Healthcare Practitioners and
Technical5.6%
Management4.9%
Personal Care and Service
4.5%
Business and Financial Operations
4.3%
Installation, Maintenance, and
Repair4.1%
Production 3.5%
Building and Grounds Cleaning and Maintenance
3.3%
Protective Service3.0%
Healthcare Support2.9%
Architecture and Engineering
2.7%
Computer and Mathematical
1.9%
Community and Social Services
1.8%
Life, Physical, and Social Science
1.4%
Arts, Design, Entertainment, Sports,
and Media1.0%Legal
0.6%Farming, Fishing, and
Forestry0.4%
Occupational DistributionNew Mexico, 2014
Source: Occupational Employment Statistics (OES) program

STATE OF THE WORKFORCE 2016 35
New Mexico’s WorkforceIndustries, Occupations & Wages
was $42,230. Only one of the largest five occupational groups—education, training, and library—had a mean wage higher than the state average. Construction and extraction was the only occupational group in the largest five that was not related to sales, service, or professional occupations. With a mean wage of $20,710, food preparation and serving was the lowest paying occupational group. The mean wage for construction and extraction occupations was nearly double that for occupations in food preparation and serving.
There were 10 occupational groups that had mean wages above the state average, and employment in these made up 33 4 percent of total employment in New Mexico. Management was the highest-paying occupational group (4.9 percent of total employment and a mean wage of $92,640), followed by architecture and engineering (2.7 percent of total employment, with a mean wage of $82,530). The highest concentration of employment in an occupational group with mean wages above the state average was in education, training, and library. This group accounted for 6.9 percent of total employment, with a mean wage of $46,040.
Of the top five highest paying occupational groups, health care practitioners and technical and management occupations had the most jobs, with employment between them accounting for 10.5 percent of all occupational employment. The other six occupational groups paying higher than the all-occupation average had a combined share of total employment of 13.3 percent
$92,640$82,530
$76,240$74,850$73,980$73,630
$61,610$46,040$46,000
$42,790$42,230
$40,890$40,470$39,750
$36,940$34,210
$32,160$30,170
$27,370$22,670$21,940$21,660$20,710
ManagementArchitecture & Engineering
Life, Physical, & Social ScienceLegal
Healthcare Practitioners & TechnicalComputer & Mathematical
Business & FinancialEducation, Training, & Library
Arts, Entertain., MediaInstallation, Maintenance, & Repair
Total All OccupationsProtective Service
Construction & ExtractionCommunity & Social Services
ProductionTransportation & Material Moving
Office & Administrative SupportSales & Related
Healthcare SupportBuilding & Grounds Clean/Maint.
Farming, Fishing, & ForestryPersonal Care & Service
Food Prep. & Serving
Mean Wage of OccupationsNew Mexico, 2014
Source: Occupational Employment Statistics (OES) program
Grey-colored categories represent those with a wage above the all-occupation
average.
Bright spots and areas of continued focus
Occupations related to office and administrative support, food preparation and serving, and sales continue to comprise the largest shares of employment in New Mexico. Education and training occupations and health practitioners and technical occupations provide a good balance of a relatively large share of employment and above-average wages. Management occupations offer the highest median wages. Many lucrative non-management occupations are STEM-related (science, technology, engineering, and mathematics).

36 NEW MEXICO DEPARTMENT OF WORKFORCE SOLUTIONS
In 2014, 28.8 percent of New Mexico’s labor force had earned a bachelor’s degree or higher. This share was lower than the national average of 35.1 percent and was almost tied with Oklahoma, which had the lowest share of all surrounding states. Colorado had the largest share, at 42.3 percent. The share of New Mexico’s labor force that had earned a high school diploma or equivalent certificate was 24.7 percent, which was equal to the national average. About 87.8 percent
of the labor force had at least a high school diploma or equivalent certificate, meaning that 12.2 percent of the labor force had not attained that level of education. This share was higher than the national average of 9.2 percent and higher than the shares in surrounding states, except Texas, in which 14.0 percent of the labor force had not attained that level of education.
New Mexico’s WorkforceSkills & Education
Educational Attainment of the Population & Labor ForceThe educational attainment of New Mexico’s labor force was lower than the attainment of the labor forces of most surrounding states and the nation.
The educational attainment of New Mexico’s labor force may be adequately suited to the current demands of employers in the state. Although nearly 29 percent of New Mexico’s workforce had earned a bachelor’s degree or higher as of 2014, only about 21 percent of jobs in the state actually required that level of education, assuming standard minimum education requirements by occupation (as of 2012). Some workers who have attained a high level of education may be employed in positions that do not demand the degree of education they have earned. Nevertheless, they are more likely to participate in the labor force and, more specifically, be employed than those who have attained a lower level of education. In addition, employers may screen out candidates
who have not earned a bachelor’s degree for certain positions. States with workforces that are highly educated will also have a competitive advantage in attracting new employers. However, it is important to note that education level does not always reflect the entire skill set needed for a particular position.
However, educational attainment levels may not be so well matched with the future demands of employers, as can be seen by looking at projections data. In 2012, nearly 68 percent of New Mexico’s jobs required a high school diploma (or equivalent certificate) or less, based on standard occupational education requirements determined by the
14.7%
26.5%
33.1%
25.7%
12.2%
24.7%
34.3%
28.8%
0%
10%
20%
30%
40%
Less than High School High School Some College orAssociate's Degree
Bachelor's Degree orHigher
% of Population % of Labor Force
Source: U.S. Census Bureau, American Community Survey, 2014 1-Year Estimates,Table B23006: Educational Attainment by Employment Status for the Population 25 to 64 Years
Data is for civilian labor force (population 25 to 64), as military has specific educational requirements that may impact analysis.
Educational Attainment for the Population & Labor ForceNew Mexico, 2014
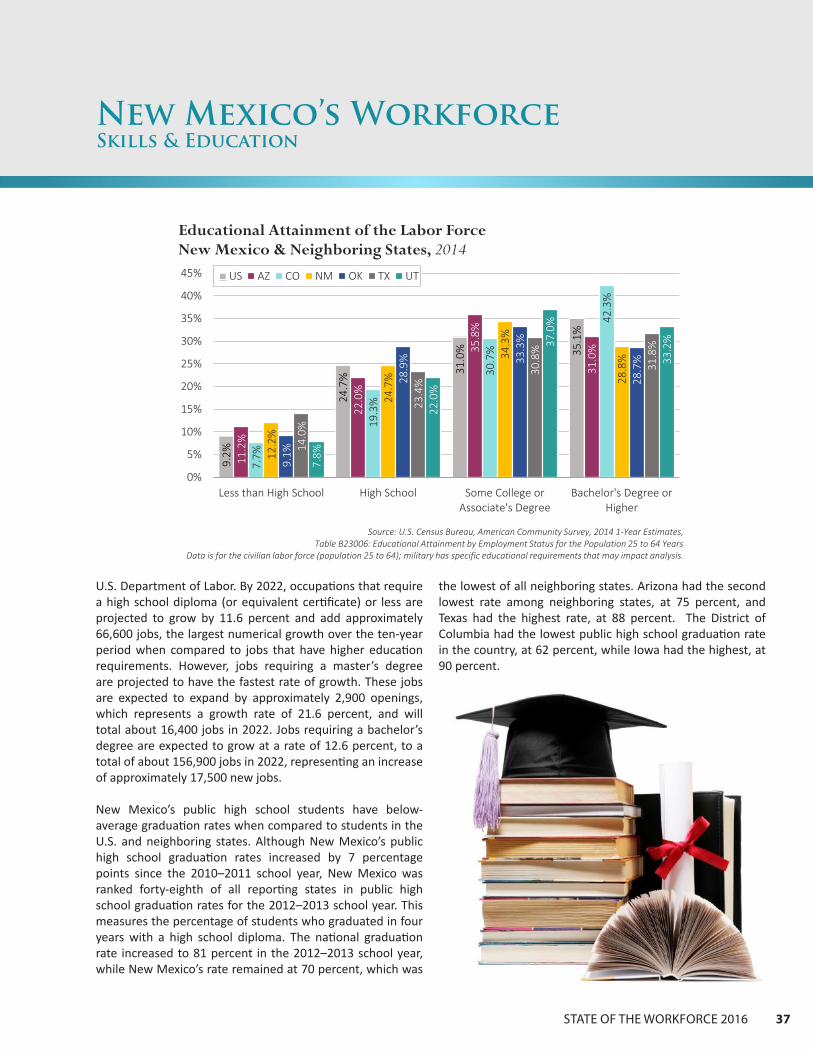
STATE OF THE WORKFORCE 2016 37
U.S. Department of Labor. By 2022, occupations that require a high school diploma (or equivalent certificate) or less are projected to grow by 11.6 percent and add approximately 66,600 jobs, the largest numerical growth over the ten-year period when compared to jobs that have higher education requirements. However, jobs requiring a master’s degree are projected to have the fastest rate of growth. These jobs are expected to expand by approximately 2,900 openings, which represents a growth rate of 21.6 percent, and will total about 16,400 jobs in 2022. Jobs requiring a bachelor’s degree are expected to grow at a rate of 12.6 percent, to a total of about 156,900 jobs in 2022, representing an increase of approximately 17,500 new jobs.
New Mexico’s public high school students have below-average graduation rates when compared to students in the U.S. and neighboring states. Although New Mexico’s public high school graduation rates increased by 7 percentage points since the 2010–2011 school year, New Mexico was ranked forty-eighth of all reporting states in public high school graduation rates for the 2012–2013 school year. This measures the percentage of students who graduated in four years with a high school diploma. The national graduation rate increased to 81 percent in the 2012–2013 school year, while New Mexico’s rate remained at 70 percent, which was
New Mexico’s WorkforceSkills & Education
the lowest of all neighboring states. Arizona had the second lowest rate among neighboring states, at 75 percent, and Texas had the highest rate, at 88 percent. The District of Columbia had the lowest public high school graduation rate in the country, at 62 percent, while Iowa had the highest, at 90 percent
9.2%
24.7
% 31.0
% 35.1
%
11.2
%
22.0
%
35.8
%
31.0
%
7.7%
19.3
%
30.7
%
42.3
%
12.2
%
24.7
%
34.3
%
28.8
%
9.1%
28.9
% 33.3
%
28.7
%
14.0
%
23.4
%
30.8
%
31.8
%
7.8%
22.0
%
37.0
%
33.2
%
0%
5%
10%
15%
20%
25%
30%
35%
40%
45%
Less than High School High School Some College orAssociate's Degree
Bachelor's Degree orHigher
US AZ CO NM OK TX UT
Source: U.S. Census Bureau, American Community Survey, 2014 1-Year Estimates,Table B23006: Educational Attainment by Employment Status for the Population 25 to 64 Years
Data is for the civilian labor force (population 25 to 64); military has specific educational requirements that may impact analysis.
Educational Attainment of the Labor ForceNew Mexico & Neighboring States, 2014

38 NEW MEXICO DEPARTMENT OF WORKFORCE SOLUTIONS
New Mexico’s WorkforceSkills & Education
16.4%
8.0%
18.3%
11.6%10.2%
12.6%
21.6%
14.0%
0.0%
5.0%
10.0%
15.0%
20.0%
25.0%
Less
than
HS
HS
Dip
lom
a/Eq
uiv.
Som
e Co
llege
,N
o D
egre
e
Post
sec.
,N
on-D
egre
e Aw
ard
Asso
ciat
e's
Bach
elor
's
Mas
ter's
Doc
tora
l/Pro
f.
Source: NMDWS Employment Projections program
Employment Growth by Educational Attainment RequiredNew Mexico, 2012–2022
Less than HS29.4%
HSDiploma/Equiv
38.3%Some College,
No Degree1.4%
Postsec. Non-Degree Award
5.6%
Associate's4.7%
Bachelor's16.5%
Doctoral/Prof.2.4%
Master's1.6%
Employment by Educational Requirement New Mexico, 2012
Source: NMDWSEmployment
Projections program
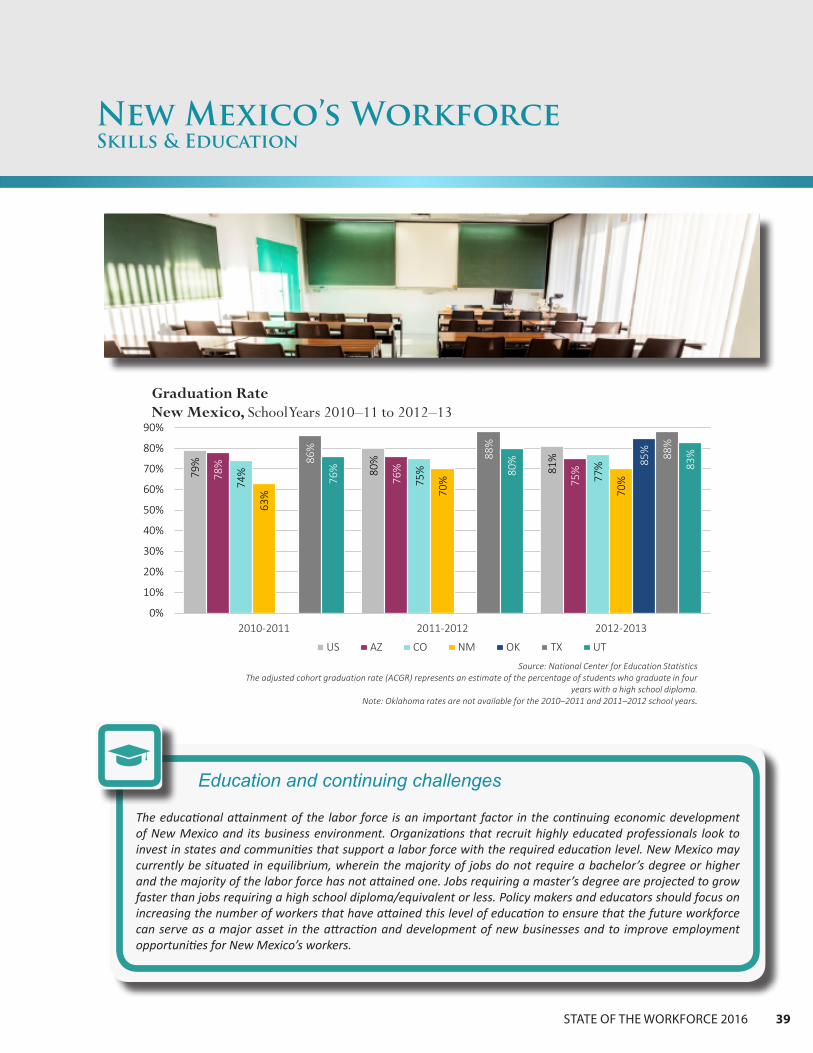
STATE OF THE WORKFORCE 2016 39
New Mexico’s WorkforceSkills & Education
79%
80%
81%
78%
76%
75%
74%
75%
77%
63% 70
%
70%
85%
86%
88%
88%
76% 80
% 83%
0%
10%
20%
30%
40%
50%
60%
70%
80%
90%
2010-2011 2011-2012 2012-2013
Graduation RateNew Mexico, School Years 2010–11 to 2012–13
US AZ CO NM OK TX UT
Source: National Center for Education StatisticsThe adjusted cohort graduation rate (ACGR) represents an estimate of the percentage of students who graduate in four
years with a high school diploma. Note: Oklahoma rates are not available for the 2010–2011 and 2011–2012 school years.
Education and continuing challenges
The educational attainment of the labor force is an important factor in the continuing economic development of New Mexico and its business environment. Organizations that recruit highly educated professionals look to invest in states and communities that support a labor force with the required education level. New Mexico may currently be situated in equilibrium, wherein the majority of jobs do not require a bachelor’s degree or higher and the majority of the labor force has not attained one. Jobs requiring a master’s degree are projected to grow faster than jobs requiring a high school diploma/equivalent or less. Policy makers and educators should focus on increasing the number of workers that have attained this level of education to ensure that the future workforce can serve as a major asset in the attraction and development of new businesses and to improve employment opportunities for New Mexico’s workers.

40 NEW MEXICO DEPARTMENT OF WORKFORCE SOLUTIONS
Employment in New Mexico is projected to increase by approximately 12 percent between 2012 and 2022, or approximately 101,610 jobs (rounded). Around 35 percent of annual openings (10,780) are anticipated to be new openings driven by increased demand. The remaining 65 percent of annual openings (19,760) are projected to be openings from replacement needs, as employers replace workers leaving the occupation (e.g., retirement, occupational change).
Employment growth in each of four industries is projected to comprise over 10 percent of net growth over the projection period. These industries include: health care and social assistance, with 29,490 more jobs, representing 29.0 percent of net projected growth; educational services, with 18,430 more jobs, representing 18.1 percent of net projected growth; accommodation and food services, with 16,030 more jobs, representing 15.8 percent of net projected growth; and retail trade, with 10,930 more jobs, representing 10.8 percent of net projected growth.
Employment in five industries is projected to decline over the projection period, with losses totaling approximately 5,430 jobs. Over half of all employment losses are anticipated to occur in the federal government; the subsector is projected to lose 3,070 jobs over the period, representing a decline in employment of nearly 11.7 percent. Employment in manufacturing is projected to fall by 1,180 jobs, while losses in agriculture, information, and state government represent less than 22 percent of the remaining projected losses.
NMDWS also produces industry employment projections for nearly 100 industry subsectors. The subsectors projected to grow the most in number and percentage are not surprising. Growth in educational services, with just one subsector, educational services, leads growth in all other subsectors, primarily due to its size. Three of the four health care and social assistance subsectors are found within the top six
New Mexico’s WorkforceThe Future Workforce
Projected Employment Growth in New Mexico’s IndustriesNearly 63 percent of New Mexico’s future job growth is projected to occur in three industries—health care and social assistance, educational services, and accommodation and food services. Growth within these industries is also projected to occur more quickly than in other industries, with employment increasing by over 19 percent in each.
-3,070
-1,180
-620
-470
-90
130
250
260
1,000
1,220
1,570
1,870
2,230
2,420
2,430
2,610
3,750
4,620
7,800
10,930
16,030
18,430
29,490
-11.7
-4.0
-5.7
-3.5
-0.4
2.6
5.8
0.4
4.8
12.7
8.3
8.8
16.9
10.1
5.7
12.4
9.1
8.8
19.3
12.0
19.7
23.8
24.6
-12 -7 -2 3 8 13 18 23 28
-16,100 -6,100 3,90 0 13,9 00 23,9 00 33,9 00
Federal Government
Manufacturing
Agriculture
Information
State Government
Mgmt of Companies & Enterprises
Utilities
Self Employed/Unpaid Family
Finance & Insurance
Real Estate & Rental
Transportation & Warehousing
Wholesale Trade
Arts, Entertainment & Recreation
Mining
Local Government
Other Services (Ex. Government)
Construction
Professional, Scientific & Technical…
Admin./Support & Waste Mgmt Svcs
Retail Trade
Accommodation & Food Svcs
Educational Svcs
Health Care & Social Assistance
Projected Employment Growthby Major Industry, 2012–2022
NumericPct
Source: NMDWS Employment
Projections programGrowth is rounded.
New Mexico

STATE OF THE WORKFORCE 2016 41
subsectors projected to grow the most and the top five projected to grow the fastest (of the subsectors meeting both criteria). Three retail subsectors are projected to experience significant employment increases, with the building material and garden equipment and supplies dealers subsector projected to grow the fastest (35.9 percent). The four subsectors comprising accommodation and food services and administrative and support and waste management and
remediation services (listed as administrative and support services in the corresponding charts) are also listed. Within accommodation and food services, employment in the food services and drinking places subsector is projected to grow by over 21 percent. The waste management and remediation services subsector in administrative and support services is projected to grow by 26.8 percent.
New Mexico’s WorkforceThe Future Workforce
580
620
900
1,480
1,620
1,910
2,000
2,290
2,760
2,810
3,380
7,190
8,900
13,750
14,490
18,430
16.7
26.8
17.9
23.4
14.3
15.5
17.8
13.0
35.9
12.4
24.7
18.8
35.5
21.6
31.8
23.8
0.0 5.0 10.0 15.0 20.0 25.0 30.0 35.0 40.0
0 500 0 100 00 150 00 200 00
Rental & Leasing Services
Waste Mgmt & Remediation Services
Oil & Gas Extraction
Religious/Grantmaking/Civic/Prof. Organizations
Merchant Wholesalers, Durable Goods
Motor Vehicle & Parts Dealers
Amusement, Gambling & Recreation Industries
Accommodation, Incl. Hotels & Motels
Bldg Material & Garden Equip. & Supplies Dealers
General Merchandise Stores
Nursing & Residential Care Facilities
Administrative & Support Services
Social Assistance
Food Services & Drinking Places
Ambulatory Health Care Services
Educational Services
Industry Subsectors Projected to Growthe Most and Fastest, 2012–2022
NumericPct
Source: NMDWS Employment Projections programGrowth is rounded.
Only includes industries with 2012 employment greater than 380.
New Mexico

42 NEW MEXICO DEPARTMENT OF WORKFORCE SOLUTIONS
NMDWS produces industry and occupational employment projections for New Mexico’s four workforce regions and four metropolitan statistical areas (MSAs). Growth rates in some industries don’t vary much across the regions and MSAs. Industry growth in substate areas is considered notable if growth meets one or more of the following criteria:
1 The industry’s share of total growth in the MSA/region places it within the top ten industries for share of total growth.
2 The industry’s share of total growth in the MSA/region is notably larger than the industry’s share of growth statewide (i.e., growth has a greater impact in the MSA/region than in the state).
3 The industry’s employment is projected to grow more quickly in the MSA/region than in the state as a whole.
4 The industry’s growth rate in the MSA/region is substantially higher than the industry’s rate at the statewide level.
Central Region/Albuquerque MSA
The Central Region and Albuquerque MSA represent the same geography. Employment within the region is projected to increase by about 56,730, or 14.9 percent, reaching approximately 436,470 (rounded) in 2022. The health care and social assistance and educational services sectors are projected to see the largest increases in jobs, with employment also growing quickly (by more than 23 percent in each). The following industries represent those in which regional projected growth is notably strong when compared to growth at the statewide level.
New Mexico’s WorkforceThe Future Workforce
Projected Employment Growth in New Mexico’s Substate Areas The Albuquerque MSA is expected to lead all four of the state’s MSAs in projected employment growth. Even with fast-paced growth in the Albuquerque MSA, the Northern Region’s projected employment growth is expected to outpace that of the state’s three other regions. Projected growth in the north, however, is primarily attributed to the region’s non-MSA areas as opposed to the Santa Fe and Farmington MSAs.
-1,460
-1,090
***
-10
***
80
170
230
790
***
970
1,010
1,110
***
1,660
2,340
2,570
3,730
5,480
***
7,540
***
13,580
-11.6
-6.1
***
-0.2
7.2
17.5
2.1
6.8
15.1
11.2
5.8
9.5
11.2
22.8
6.9
20.2
13.8
13.2
13.4
31.0
20.5
26.8
23.4
-18.5 -8.5 1.5 11.5 21.5 31.5 41.5
-10,000 -5,000 0 5,00 0 10,0 00 15,0 00 20,0 00
Federal Government
Manufacturing
Mining
State Government
Utilities
Agriculture
Information
Mgmt of Companies & Enterprises
Real Estate & Rental
Transportation & Warehousing
Local Government
Finance & Insurance
Other Services (Ex. Government)
Arts, Entertainment & Recreation
Self Employed/Unpaid Family
Wholesale Trade
Construction
Professional, Scientific & Technical…
Retail Trade
Admin./Support & Waste Mgmt Svcs
Accommodation & Food Svcs
Educational Svcs
Health Care & Social Assistance
Projected Employment Growthby Major Industry, 2012–2022
NumericPct
Source: NMDWSEmployment Projections
programGrowth is rounded.
*** Data are suppressed.
Central Region/Albuquerque
MSA

STATE OF THE WORKFORCE 2016 43
New Mexico’s WorkforceThe Future Workforce
• Administrative and support and waste management and remediation services
• Wholesale trade
• Self-employed and unpaid family workers
• Professional, scientific, and technical services
Eastern Region
Employment in the Eastern Region is projected to increase from approximately 139,730 (as of 2012) to 156,100 (rounded) in 2022. This represents growth of 16,370 jobs, or 11.7 percent. The health care and social assistance and accommodation and food services industries are projected to see the largest and fastest employment growth. Industries that are anticipated to see comparatively strong growth in the Eastern Region include:
• Accommodation and food services
• Construction
• Mining
• Transportation and warehousing
The mining industry is a particularly significant industry in the Eastern Region, primarily in Eddy and Lea Counties. Because of this, mining indirectly impacts employment and economic activity in many other industries, including those listed above. For example, construction and transportation operations, which are closely tied to mining in the region, will see employment shift by varying degrees alongside mining, as demand for supporting inputs changes. Industries such as accommodation and food services will also be impacted, as the spending of workers varies with expansion and contractions within mining.
-520
-480
-200
***
-10
0
50
60
***
150
160
210
240
360
390
450
580
1,580
1,610
1,690
1,910
3,350
4,730
-4.7
-11.6
-5.5
-0.5
-0.2
-0.2
6.8
4.5
***
4.8
4.9
13.9
7.7
5.8
11.7
8.3
13.4
19.9
11.8
10.9
15.6
24.2
30.2
-17.5 -7.5 2.5 12.5 22.5 32.5
-2,800 -1,800 -800 200 1,20 0 2,20 0 3,20 0 4,20 0 5,20 0 6,20 0
Self Employed/Unpaid Family
Federal Government
Manufacturing
Agriculture
State Government
Utilities
Mgmt of Companies & Enterprises
Information
Arts, Entertainment & Recreation
Professional, Scientific & Technical…
Wholesale Trade
Real Estate & Rental
Finance & Insurance
Local Government
Other Services (Ex. Government)
Admin./Support & Waste Mgmt Svcs
Transportation & Warehousing
Construction
Mining
Retail Trade
Educational Svcs
Accommodation & Food Svcs
Health Care & Social Assistance
Projected Employment Growthby Major Industry, 2012–2022
NumericPct
Eastern Region
Source: NMDWSEmployment Projections
programGrowth is rounded.
*** Data are suppressed.
44 NEW MEXICO DEPARTMENT OF WORKFORCE SOLUTIONS
Northern Region and Farmington and Santa Fe MSAsEmployment in the Northern Region, which includes the Farmington and Santa Fe MSAs, is projected to grow by approximately 32,250 (rounded), or 16.1 percent, from 200,840 in 2012 to 233,090 in 2022. The region is projected to see its employment grow more quickly than any other New Mexico region and all of its MSAs. Interestingly, a large portion of this growth is projected to occur in the non-MSA areas of the north.
The health care and social assistance and accommodation and food services industries are projected to see the largest increases in employment. Employment in many of the region’s industries is expected to grow more quickly than at the state
level. Notable industries in which growth is projected to be strong (when compared to state measurements) include professional, scientific, and technical services and mining. In addition, while projected growth in manufacturing and agriculture comprises a small percentage of total growth, the increase in employment is significant because manufacturing is anticipated to grow in the Northern Region only, while agriculture is only expected to grow in the Northern and Central Regions.
In the Northern Region, much of the projected employment growth is expected to occur outside of the two MSAs.
New Mexico’s WorkforceThe Future Workforce
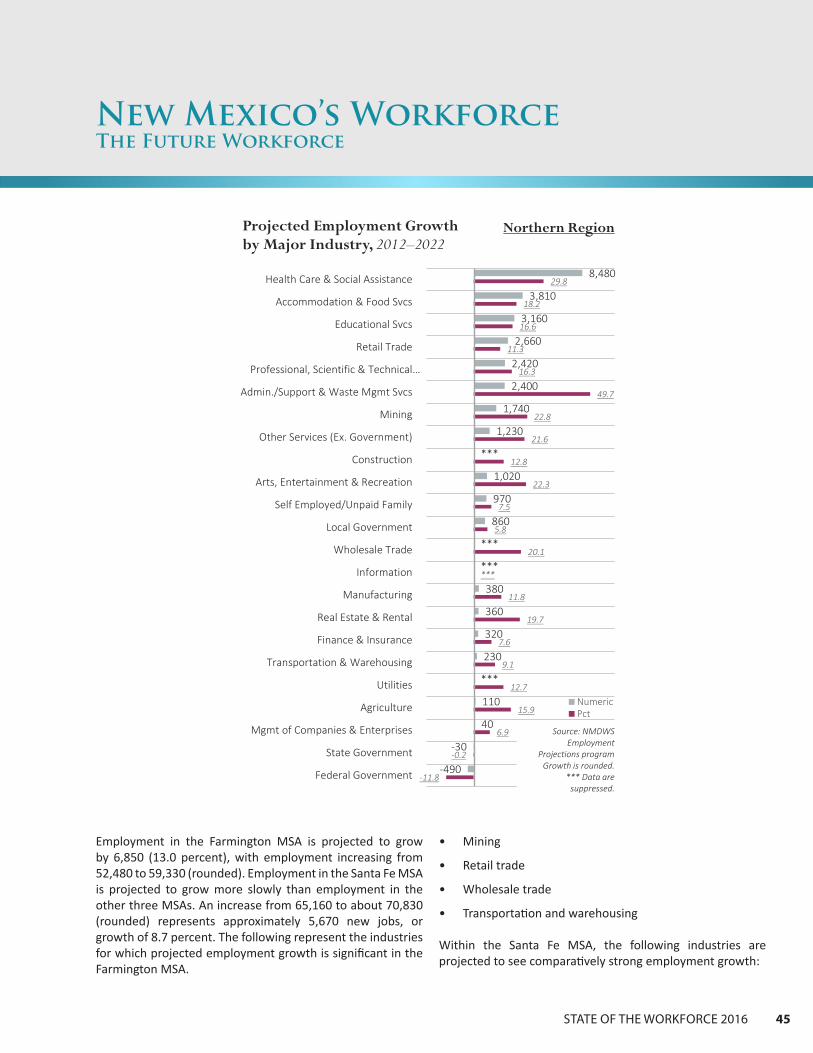
STATE OF THE WORKFORCE 2016 45
New Mexico’s WorkforceThe Future Workforce
Employment in the Farmington MSA is projected to grow by 6,850 (13.0 percent), with employment increasing from 52,480 to 59,330 (rounded). Employment in the Santa Fe MSA is projected to grow more slowly than employment in the other three MSAs. An increase from 65,160 to about 70,830 (rounded) represents approximately 5,670 new jobs, or growth of 8.7 percent. The following represent the industries for which projected employment growth is significant in the Farmington MSA.
• Mining
• Retail trade
• Wholesale trade
• Transportation and warehousing
Within the Santa Fe MSA, the following industries are projected to see comparatively strong employment growth:
-490
-30
40
110
***
230
320
360
380
***
***
860
970
1,020
***
1,230
1,740
2,400
2,420
2,660
3,160
3,810
8,480
-11.8
-0.2
6.9
15.9
12.7
9.1
7.6
19.7
11.8
***
20.1
5.8
7.5
22.3
12.8
21.6
22.8
49.7
16.3
11.3
16.6
18.2
29.8
-20 -10 0 10 20 30 40 50 60
-3,700 -1,700 300 2,30 0 4,30 0 6,30 0 8,30 0 10,3 00
Federal Government
State Government
Mgmt of Companies & Enterprises
Agriculture
Utilities
Transportation & Warehousing
Finance & Insurance
Real Estate & Rental
Manufacturing
Information
Wholesale Trade
Local Government
Self Employed/Unpaid Family
Arts, Entertainment & Recreation
Construction
Other Services (Ex. Government)
Mining
Admin./Support & Waste Mgmt Svcs
Professional, Scientific & Technical…
Retail Trade
Educational Svcs
Accommodation & Food Svcs
Health Care & Social Assistance
Projected Employment Growthby Major Industry, 2012–2022
NumericPct
Northern Region
Source: NMDWSEmployment
Projections programGrowth is rounded.
*** Data are suppressed.
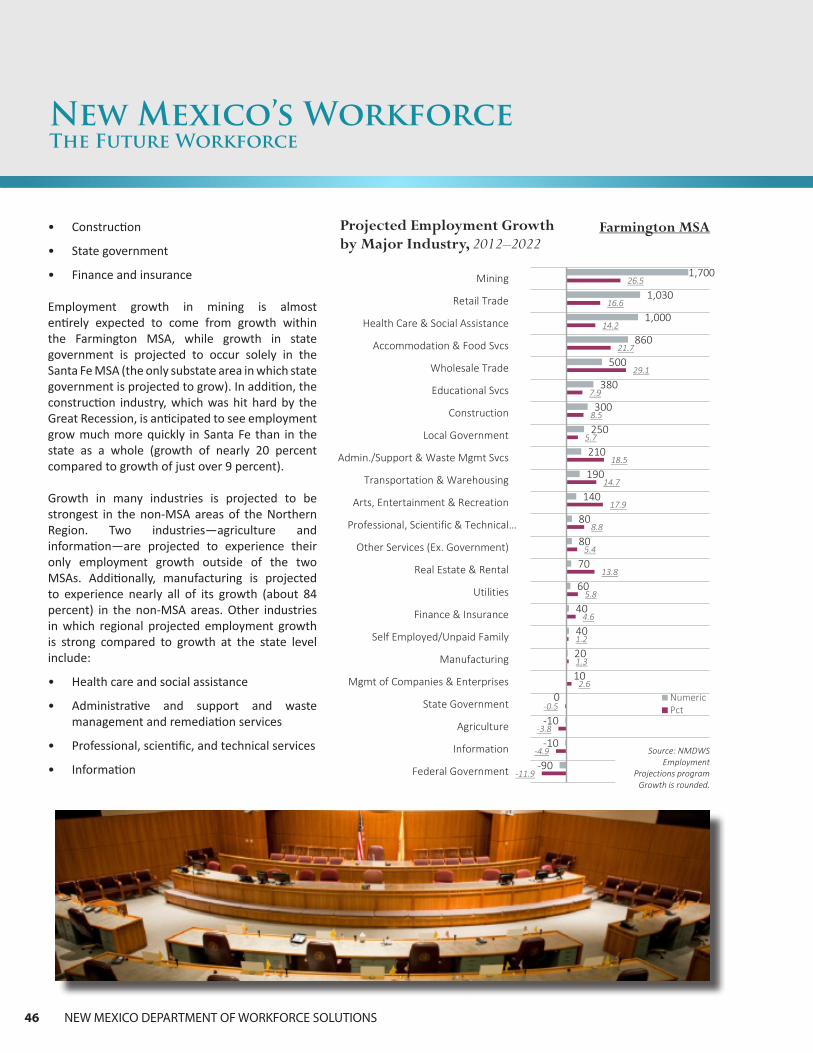
46 NEW MEXICO DEPARTMENT OF WORKFORCE SOLUTIONS
New Mexico’s WorkforceThe Future Workforce
-90
-10
-10
0
10
20
40
40
60
70
80
80
140
190
210
250
300
380
500
860
1,000
1,030
1,700
-11.9
-4.9
-3.8
-0.5
2.6
1.3
1.2
4.6
5.8
13.8
5.4
8.8
17.9
14.7
18.5
5.7
8.5
7.9
29.1
21.7
14.2
16.6
26.5
-17.5 -7.5 2.5 12.5 22.5 32.5 42.5 52.5 62.5
-500 0 500 1,00 0 1,50 0 2,00 0
Federal Government
Information
Agriculture
State Government
Mgmt of Companies & Enterprises
Manufacturing
Self Employed/Unpaid Family
Finance & Insurance
Utilities
Real Estate & Rental
Other Services (Ex. Government)
Professional, Scientific & Technical…
Arts, Entertainment & Recreation
Transportation & Warehousing
Admin./Support & Waste Mgmt Svcs
Local Government
Construction
Educational Svcs
Wholesale Trade
Accommodation & Food Svcs
Health Care & Social Assistance
Retail Trade
Mining
Projected Employment Growthby Major Industry, 2012–2022
NumericPct
Farmington MSA
Source: NMDWS Employment
Projections programGrowth is rounded.
• Construction
• State government
• Finance and insurance
Employment growth in mining is almost entirely expected to come from growth within the Farmington MSA, while growth in state government is projected to occur solely in the Santa Fe MSA (the only substate area in which state government is projected to grow). In addition, the construction industry, which was hit hard by the Great Recession, is anticipated to see employment grow much more quickly in Santa Fe than in the state as a whole (growth of nearly 20 percent compared to growth of just over 9 percent).
Growth in many industries is projected to be strongest in the non-MSA areas of the Northern Region. Two industries—agriculture and information—are projected to experience their only employment growth outside of the two MSAs. Additionally, manufacturing is projected to experience nearly all of its growth (about 84 percent) in the non-MSA areas. Other industries in which regional projected employment growth is strong compared to growth at the state level include:
• Health care and social assistance
• Administrative and support and waste management and remediation services
• Professional, scientific, and technical services
• Information

STATE OF THE WORKFORCE 2016 47
New Mexico’s WorkforceThe Future Workforce
-110
-60
-20
10
10
10
40
40
90
100
120
140
220
240
270
270
320
330
530
560
570
710
1,290
-12.6
-7.9
-9.9
2.6
5.6
10.2
7.1
6.0
11.7
2.9
2.4
15.3
8.8
2.9
15.1
14.0
18.4
13.6
19.7
12.1
6.5
8.6
15.1
-17 -12 -7 -2 3 8 13 18 23 28
-1,000 -500 0 500 1,00 0 1,50 0
Federal Government
Information
Agriculture
Mgmt of Companies & Enterprises
Utilities
Mining
Transportation & Warehousing
Manufacturing
Real Estate & Rental
Local Government
Self Employed/Unpaid Family
Wholesale Trade
Professional, Scientific & Technical…
State Government
Finance & Insurance
Arts, Entertainment & Recreation
Admin./Support & Waste Mgmt Svcs
Other Services (Ex. Government)
Construction
Educational Svcs
Retail Trade
Accommodation & Food Svcs
Health Care & Social Assistance
Projected Employment Growthby Major Industry, 2012–2022
NumericPct
Santa Fe MSA
Source: NMDWS Employment
Projections programGrowth is rounded.

48 NEW MEXICO DEPARTMENT OF WORKFORCE SOLUTIONS
Southwestern Region and Las Cruces MSAThe Southwestern Region, which includes the Las Cruces MSA, is projected to see employment grow by 8,360, or about 7.9 percent (from 105,780 in 2012 to 114,140 in 2022, rounded). This growth rate is the slowest of all four regions and all MSAs, and employment in only six of the 23 major industry sectors is projected to grow faster in the region than in the state. Health care and social assistance and educational services are projected to experience the most growth, although at a slower rate than at the state level. Professional, scientific, and technical services is a critical industry when evaluating projected growth. Employment is projected to grow by 12.7 percent (530 jobs), a rate which is 3.9 percentage points higher than that of the state. Accommodation and food services is also projected to grow more quickly in the region than in state (20.4 percent versus 19.7 percent). Although the difference in growth is just 0.7 percentage point, growth in the industry represents over 22 percent of net projected growth in the region.
The majority of growth in the Southwestern Region is projected to occur in the Las Cruces MSA, with employment growing by 12.4 percent, or 9,380 (rounded). Employment is anticipated to increase from 75,450 in 2012 to 84,830 in 2022. Industries in which employment growth is comparatively strong in Las Cruces include:
• Construction
• Professional, scientific, and technical services
• Retail trade
• Wholesale trade
Employment growth in the Las Cruces MSA is anticipated to drive growth in the region over the ten-year period. With this rate being much faster than that of the region as a whole, the non-MSA areas are anticipated to actually experience a decline in employment.
New Mexico’s WorkforceThe Future Workforce
-610
-530
-340
***
-50
-10
10
30
30
50
80
***
100
***
210
270
***
530
630
1,050
1,860
1,950
2,610
-11.3
-6.3
-7.2
-1.4
-4.6
-0.4
2.9
1.8
5.8
3.2
9.1
7.2
4.7
7.4
17.5
5.7
7.2
12.7
19.2
9.7
20.4
13.0
16.0
-15 -10 -5 0 5 10 15 20 25
-2,000 -1,000 0 1,00 0 2,00 0 3,00 0
Federal Government
Self Employed/Unpaid Family
Agriculture
Manufacturing
Information
State Government
Mgmt of Companies & Enterprises
Other Services (Ex. Government)
Utilities
Mining
Real Estate & Rental
Wholesale Trade
Finance & Insurance
Transportation & Warehousing
Arts, Entertainment & Recreation
Local Government
Construction
Professional, Scientific & Technical…
Admin./Support & Waste Mgmt Svcs
Retail Trade
Accommodation & Food Svcs
Educational Svcs
Health Care & Social Assistance
Projected Employment Growthby Major Industry, 2012–2022
NumericPct
Southwestern Region
Source: NMDWSEmployment Projections
programGrowth is rounded.
*** Data are suppressed.
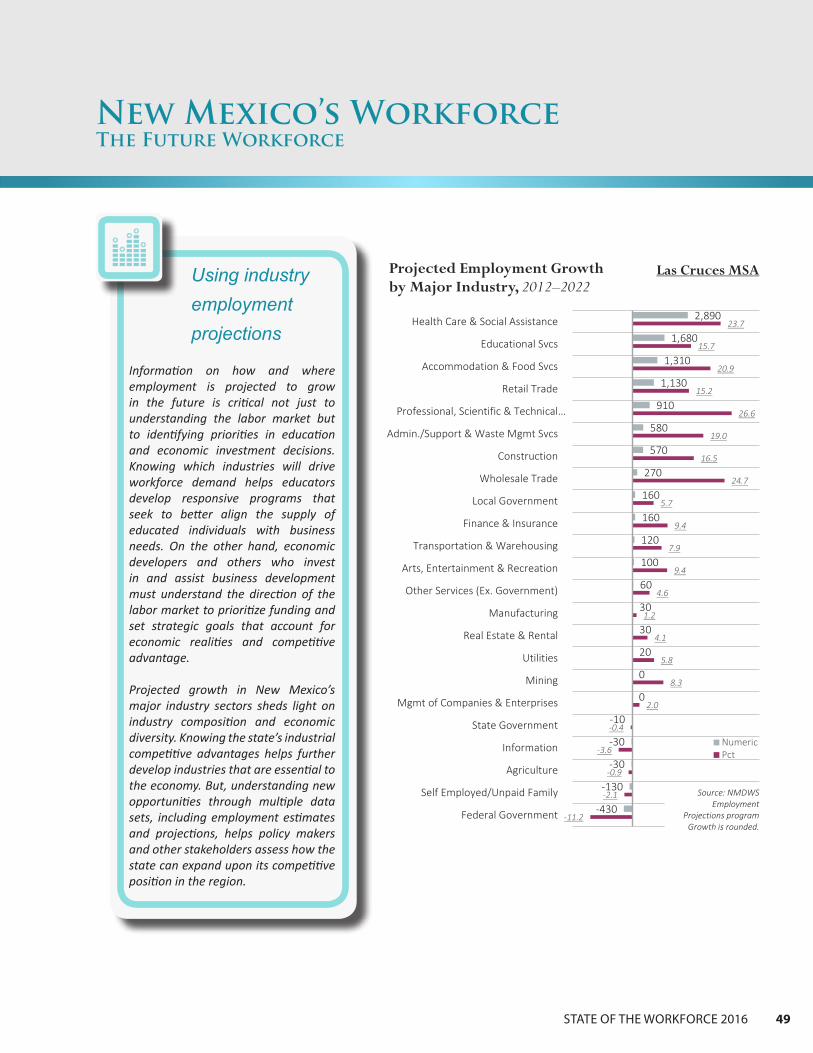
STATE OF THE WORKFORCE 2016 49
New Mexico’s WorkforceThe Future Workforce
-430
-130
-30
-30
-10
0
0
20
30
30
60
100
120
160
160
270
570
580
910
1,130
1,310
1,680
2,890
-11.2
-2.1
-0.9
-3.6
-0.4
2.0
8.3
5.8
4.1
1.2
4.6
9.4
7.9
9.4
5.7
24.7
16.5
19.0
26.6
15.2
20.9
15.7
23.7
-16 -11 -6 -1 4 9 14 19 24 29 34
-3,100 -2,100 -1,100 -100 900 1,90 0 2,90 0 3,90 0 4,90 0 5,90 0
Federal Government
Self Employed/Unpaid Family
Agriculture
Information
State Government
Mgmt of Companies & Enterprises
Mining
Utilities
Real Estate & Rental
Manufacturing
Other Services (Ex. Government)
Arts, Entertainment & Recreation
Transportation & Warehousing
Finance & Insurance
Local Government
Wholesale Trade
Construction
Admin./Support & Waste Mgmt Svcs
Professional, Scientific & Technical…
Retail Trade
Accommodation & Food Svcs
Educational Svcs
Health Care & Social Assistance
Projected Employment Growthby Major Industry, 2012–2022
NumericPct
Las Cruces MSA
Source: NMDWS Employment
Projections programGrowth is rounded.
Using industry employment projections
Information on how and where employment is projected to grow in the future is critical not just to understanding the labor market but to identifying priorities in education and economic investment decisions. Knowing which industries will drive workforce demand helps educators develop responsive programs that seek to better align the supply of educated individuals with business needs. On the other hand, economic developers and others who invest in and assist business development must understand the direction of the labor market to prioritize funding and set strategic goals that account for economic realities and competitive advantage.
Projected growth in New Mexico’s major industry sectors sheds light on industry composition and economic diversity. Knowing the state’s industrial competitive advantages helps further develop industries that are essential to the economy. But, understanding new opportunities through multiple data sets, including employment estimates and projections, helps policy makers and other stakeholders assess how the state can expand upon its competitive position in the region.

50 NEW MEXICO DEPARTMENT OF WORKFORCE SOLUTIONS
Projected employment growth between 2012 and 2022 is anticipated to result in approximately 30,540 job openings a year (rounded), of which 35 percent (10,780) are projected
to be new openings from growth, while the remaining 65 percent (19,760) are projected to come from the need to replace workers leaving their occupation.
Projected Occupational Employment GrowthTraditionally large occupations, including food preparation and serving, personal care, education, and office and sales-related occupations, are anticipated to see the largest demand for workers between 2012 and 2022. Occupational groups that are not as large, including computer and mathematical and community and social service occupations, are anticipated to see a quickening demand for workers in the future, and their rates of growth point towards expanding occupational opportunities.
New Mexico’s WorkforceThe Future Workforce
-400
300
520
670
780
1,110
2,030
2,230
2,270
2,890
3,100
3,470
4,150
4,320
4,450
5,480
6,960
8,040
9,210
11,430
13,570
15,030
-5.3
4.7
5.0
3.1
5.7
3.6
13.8
15.4
10.0
8.7
5.5
10.5
9.2
13.4
7.7
22.2
14.3
10.1
7.4
23.1
31.3
19.8
-12.5 -2.5 7.5 17.5 27.5 37.5 47.5
-6,000 -1,000 4,00 0 9,00 0 14,0 00 19,0 00 24,0 00
Farming, Fishing & Forestry
Legal
Arts/Design/Entertainment/Sports/Media
Architecture & Engineering
Life, Physical & Social Science
Production
Computer & Mathematical
Community & Social Services
Protective Service
Business & Financial Operations
Management
Installation, Maintenance & Repair
Transportation & Material Moving
Building & Grounds Cleaning & Maintenance
Construction & Extraction
Healthcare Support
Healthcare Practitioners & Technical
Sales & Related
Office & Administrative Support
Education, Training & Library
Personal Care & Service
Food Preparation & Serving-Related
Projected Employment Growth by Major Occupation,2012–2022
Numeric Percentage
Source: NMDWS Employment Projections programGrowth is rounded.
New Mexico2014 Median Wage
($31,810)
$18,770
$19,090
$42,660
$29,410
$23,070
$60,860
$26,150
$36,180
$20,640
$29,030
$38,730
$80,830
$55,930
$35,260
$36,260
$69,450
$31,010
$65,580
$76,490
$37,340
$60,870
$18,800

STATE OF THE WORKFORCE 2016 51
Over half of all projected new jobs fall within five major occupational groups—food preparation and serving-related; personal care and service; education, training, and library; office and administrative support; and sales and related occupations. Each of these groups is projected to see employment grow by more than 8,000 jobs over the projection period. The top three occupations are projected to grow by more than 19 percent each. Other fast-growing occupational groups include healthcare support; community and social services; healthcare practitioners and technical; and computer and mathematical occupations.
Projected employment growth comprises new jobs created from increasing demand. Projected job openings are another employment measure and they capture not only new job openings created from increasing demand, but also job openings from existing positions becoming available after a person leaves the occupation (also known as replacement
job openings). The number of projected job openings, which includes job growth and replacement estimates, typically corresponds with projected employment growth; this is the case across the majority of occupational groups. Of the major occupational groups, only three are projected to see more job openings from growth than replacement needs. These groups are education, training, and library; personal care and service; and healthcare support.
NMDWS produces occupation employment projections for over 800 detailed occupations. The majority of occupations are projected to grow by fewer than 100 jobs over the projection period, with around 200 occupations projected to grow by more than 100 jobs and 30 occupations projected to see employment decline by 2022. The following detailed occupations are projected to grow both quickly and by a large number of jobs.
New Mexico’s WorkforceThe Future Workforce
31
4
78
206
89
227
103
228
177
293
553
432
350
426
454
495
700
1,362
1,145
816
1,104
1,503
104
216
241
239
399
337
466
615
697
657
472
663
771
1,035
1,105
1,102
987
679
1,038
2,545
2,612
2,781
135220319
445488564569
8438749501,0251,0951,121
1,4611,5591,5971,687
2,0412,183
3,3613,716
4,284
LegalFarming, Fishing & Forestry
Arts/Design/Entertainment/Sports/MediaComputer & Mathematical
Life, Physical & Social ScienceCommunity & Social Services
Architecture & EngineeringProtective Service
ProductionBusiness & Financial Operations
Healthcare SupportBuilding & Grounds Cleaning & Maintenance
Installation, Maintenance & RepairTransportation & Material Moving
Construction & ExtractionManagement
Healthcare Practitioners & TechnicalPersonal Care & Service
Education, Training & LibrarySales & Related
Office & Administrative SupportFood Preparation & Serving-Related
Growth Replacements
Projected Annual Openings by Major Occupation Group2012–2022
New Mexico
Source: NMDWS Employment Projections program

52 NEW MEXICO DEPARTMENT OF WORKFORCE SOLUTIONS
New Mexico’s WorkforceThe Future Workforce
Large Occupations
• Personal care aides (ranked third in total employment as of 2012)
• Food preparation and serving workers (ranked eighth)
• Elementary school teachers (ranked nineteenth)
• Teacher assistants (ranked twenty-third)
Fast-Growing Occupations
• Industrial machinery mechanics
• Physical therapists
• Coaches and scouts
• Market research analysts and specialists
• Postsecondary health specialties teachers
• Other health technologists and technicians
• Interpreters and translators
NMDWS uses employment projections and wage data to identify “Star Occupations.” An occupation’s designation as a Star Occupation is based on the combination of its rankings with respect to projected annual job openings, rate of job growth, and median wage. Elementary and middle school teachers top the list of best occupational opportunities in New Mexico. Their designation as a Star Occupation is driven by both projected annual job openings and wages, although the wages for both are lower than many other occupations requiring a bachelor’s degree.
The list includes six education occupations, five health care practitioner and technical occupations, three management occupations, and three computer and mathematical occupations. While the Star Occupations span nearly all education levels, more than half require at least a bachelor’s degree
146
490
180
1,120
640
520
360
1,580
370
290
390
380
340
320
730
300
***
1,410
980
1,790
***
2,430
4,370
2,420
10,450
42.3
20.7
33.1
19.8
21.4
22.3
25.4
20.2
25.2
27.8
26.1
26.4
28.0
28.2
24.3
31.8
28.1
25.0
27.6
26.8
54.4
27.6
27.8
45.4
51.0
0.0 10.0 20.0 30.0 40.0 50.0 60.0 70.0 80.0
0 2,00 0 4,00 0 6,00 0 8,00 0 10,0 00 12,0 00 14,0 00 16,0 00
Interpreters & Translators
Fitness Trainers & Aerobics Instructors
Other Health Technologists & Technicians
Secondary Sch. Teachers, Ex. Career/Tech.
Substitute Teachers
Bartenders
Computer Systems Analysts
Teacher Assistants
Edu./Guidance/Sch./Vocational Counselors
Coaches & Scouts
Medical & Clinical Laboratory Technicians
Kindergarten Teachers, Ex. Special Edu.
Industrial Machinery Mechanics
Physical Therapists
Medical Secretaries
Market Research Analysts & Specialists
Other Postsecondary Teachers
Spvrs of Food Prep. & Serving Workers
Middle Sch. Teachers, Ex. Career/Tech.
Restaurant Cooks
Postsecondary Health Specialties Teachers
Elementary Sch. Teachers, Ex. Special Edu.
Food Prep. & Serving Workers, Incl. Fast Food
Home Health Aides
Personal Care Aides
Detailed Occupations with the Greatest and Fastest Growth2012–2022 Numeric Percentage
Source: NMDWS Employment Projections programGrowth is rounded and *** indicates data are suppressed.
List includes occupations that rank at the top for both numeric and percentage growth. Excludes graduate teaching assistants.
New Mexico
$18,670
$19,530
$17,920
$48,930
$112,760
$20,990
$47,710
$27,390
$54,860
$46,720
$30,860
$87,320
$46,710
$44,560
$37,520
$23,340
$46,330
$19,280
$72,980
$18,880
$19,030
$49,310
$34,880
$31,520
$38,480
2014 Median Wage($31,810)

STATE OF THE WORKFORCE 2016 53
New Mexico’s WorkforceThe Future Workforce
Occupation
25-2021 Elementary School Teachers ∞ 440 $49,000 Bachelor's Degree25-2022 Middle School Teachers ∞ 180 $47,130 Bachelor's Degree29-1123 Physical Therapists 60 $84,610 Doctorate/Prof. Degree11-9111 Medical & Health Services Mgrs 90 $88,560 Bachelor's Degree25-2031 Secondary School Teachers ∞ 270 $49,200 Bachelor's Degree29-1141 Registered Nurses 540 $64,070 Associate's Degree11-1021 General & Operations Mgrs 500 $79,140 Bachelor's Degree13-1111 Management Analysts 140 $60,890 Bachelor's Degree25-2012 Kindergarten Teachers ∞ 80 $44,850 Bachelor's Degree49-9041 Industrial Machinery Mechanics 70 $46,450 High School Diploma/Equiv.
15-1121 Computer Systems Analysts 60 $73,180 Bachelor's Degree25-1199 Postsec. Teachers, All Other 60 $54,090 Doctorate/Prof. Degree19-3031 Clinical, Counseling & Sch. Psychologists 70 $61,570 Doctorate/Prof. Degree47-5013 Oil/Gas/Mining Svc Unit Operators 140 $50,350 Less than High School11-9032 Elem./Secondary Edu. Administrators 60 $75,590 Master's Degree21-1012 Edu./Guid./Sch./Vocational Counselors 70 $48,540 Master's Degree29-2012 Medical & Clinical Lab. Technicians 80 $33,510 Associate's Degree15-1133 Systems Software Developers 60 $85,560 Bachelor's Degree15-1151 Computer User Support Specialists 110 $42,500 Some College, No Degree
39-9031 Fitness Trainers & Aerobics Instructors 80 $31,690 High School Diploma/Equiv.43-1011 Spvrs of Office & Administrative Workers 340 $42,720 High School Diploma/Equiv.29-2061 Licensed Practical & Vocational Nurses 120 $44,830 Postsec., Non-Degree Award25-2052 K-Elem. Special Ed. Teachers 50 $48,340 Bachelor's Degree21-1021 Child, Family & School Social Workers 60 $36,560 Bachelor's Degree41-3099 Sales Reps, Services, All Other 70 $48,010 High School Diploma/Equiv.29-2041 Emergency Medical Techs & Paramedics 70 $34,960 Postsec., Non-Degree Award31-9091 Dental Assistants 70 $31,560 Postsec., Non-Degree Award43-3011 Bill & Account Collectors 70 $31,770 High School Diploma/Equiv.
Annual Openings
MedianAnnual Wage
Education Requiredfor Entry
New Mexico's STAR Occupations
∞ Excludes preschool through kindergarten special education teachers and middle through postsecondary school special, career, and technical education teachers.
5-ST
AR
4-ST
AR
3-ST
AR
Using occupational employment projections
Understanding the future distribution of employment is imperative to developing new educational programs, and enhancing existing programs, that are responsive to market demand. The education of today’s students should align with the needs of business so that workforce shortages do not develop or increase. Occupational employment projections provide critical information on worker demand. Coupled with supply data from educational institutions, educators, and policy makers can focus efforts and outreach on key programs, geographies, and student populations, effectively ensuring that workforce demand and supply can move in the direction of equilibrium. The ultimate result of informed decision making is the reduction of skills mismatches and skills gaps, as workers successfully provide the skills demanded by employers and employers provide improved, quality job opportunities for New Mexico’s workforce.

New Mexico Department of Workforce SolutionsP.O. Box 1928
Albuquerque, NM 87103www.dws.state.nm.us
This workforce product was funded by a grant awarded by the U.S. Department of Labor’s Employment and Training Administration. The product was created by the recipient and does not necessarily reflect the official position of the U.S. Department of Labor. The Department of Labor makes no guarantees, warranties, or assurances of any kind, express or implied, with respect to such information, including any information on linked sites and including, but not limited to, accuracy of the information or its completeness, timeliness, usefulness, adequacy, continued availability, or ownership. This product is copyrighted by the institution that created it. Internal use by an organization and/or personal use by an individual for non-commercial purposes is permissible. All other uses require the prior authorization of the copyright owner.