Embed Size (px)
Citation preview
New Mexico 2014State of the Workforce ReportA Report Highlighting New Mexico’s Current and Future Workforce
November 2013
www.dws.state.nm.us

2 NEW MEXICO DEPARTMENT OF WORKFORCE SOLUTIONS
State of New MexicoWorkforce Report 2014
Susana Martinez Governor, State of New Mexico
Celina Bussey Cabinet Secretary, New Mexico Department of Workforce Solutions
Prepared by New Mexico Department of Workforce Solutions Economic Research and Analysis Bureau
Major Contributors: Mark Boyd, Bureau Chief
Katie Bass, Economist Mark Flaherty, Economist Ashley Leach, Economist Jessa Rianelli, Statistician
Stacy Johnston, Public Relations Specialist
November 2013
For further information contact: New Mexico Department of Workforce Solutions
Economic Research and Analysis Bureau P.O. Box 1928
Albuquerque, NM 87103 (505) 383-2737
General Note: All information presented in this report was compiled by the New Mexico Department of Workforce Solutions (NMDWS) Economic Research and Analysis Bureau (ER&A). This report looks at data for multiple geographies at the state-, region-, Metropolitan Statistics Area- (MSA), and county-level. New Mexico has four MSAs—Albuquerque (Bernalillo, Sandoval, Torrance, and Valencia counties), Farmington (San Juan County), Las Cruces (Doña Ana County), and Santa Fe (Santa Fe County). New Mexico’s four regions include the Central, Eastern, Northern, and Southwestern regions. For geographic information on counties within each region, refer to the corresponding map. Non-historical data in this report represents the most recent data that is available and varies by data source.

STATE OF THE WORKFORCE 2014 3
SUMMARY AND FINDINGS 4New Mexico’s Population 4
New Mexico’s Workforce 4
NEW MEXICO’S POPULATION ACROSS THE STATE 7State, Regional & County Population Estimates 7
Age of the Population 10
Race & Ethnicity 12
Income 13
Poverty 14
NEW MEXICO’S WORKFORCE - WHAT IT LOOKS LIKE NOW 15Labor Force Participation 15
Age & Gender of the Labor Force 16
Race & Ethnicity in the Labor Force 18
NEW MEXICO’S WORKFORCE - HOW IT’S GROWING 19Labor Force Growth 19
Employment Growth 21
Unemployment Growth 24
NEW MEXICO’S WORKFORCE - INDUSTRIES, OCCUPATIONS & WAGES 26Employment in New Mexico’s Industires 26
Occupational Employment of the Workforce 29
NEW MEXICO’S WORKFORCE - SKILLS & EDUCATION 31Educational Attainment of the Population & Labor Force 31
NEW MEXICO’S WORKFORCE - THE FUTURE WORKFORCE 35Projected Employment Growth in New Mexico’s Industries 35
Projected Occupational Employment Growth 40
New Mexico’s “TOP” Occupations 42
Table of Contents
4 NEW MEXICO DEPARTMENT OF WORKFORCE SOLUTIONS
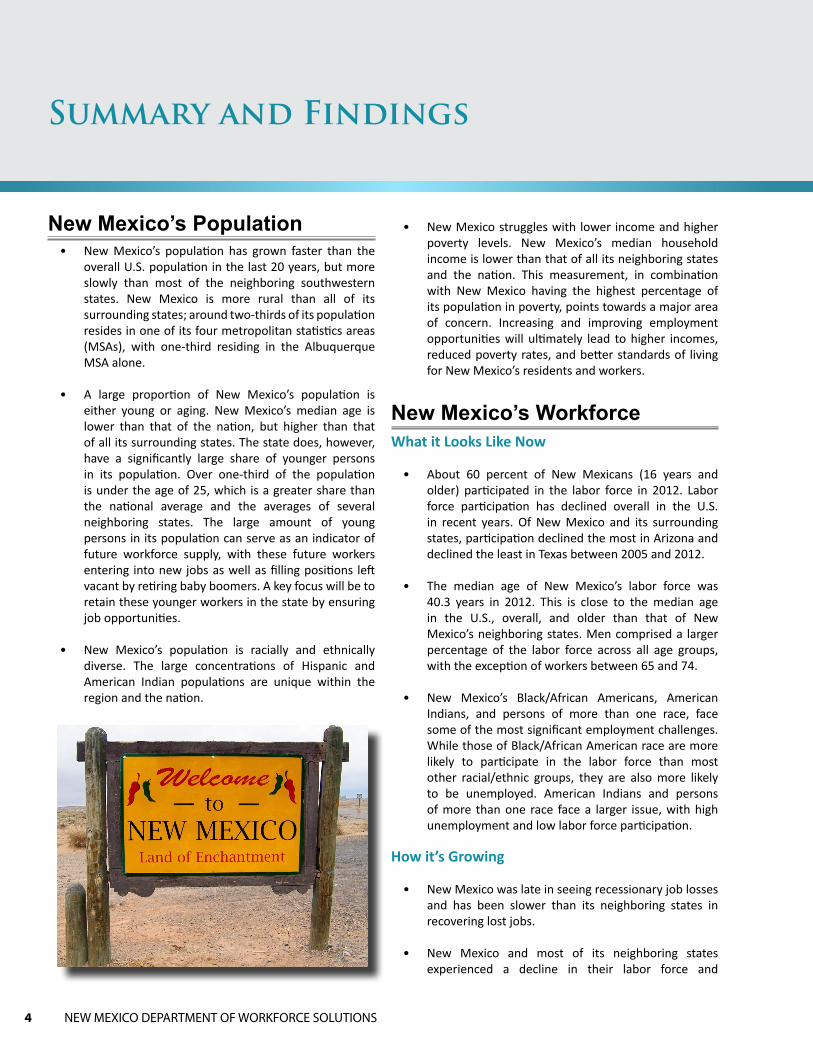
New Mexico’s Population • New Mexico’s population has grown faster than the
overall U.S. population in the last 20 years, but more slowly than most of the neighboring southwestern states. New Mexico is more rural than all of its surrounding states; around two-thirds of its population resides in one of its four metropolitan statistics areas (MSAs), with one-third residing in the Albuquerque MSA alone.
• A large proportion of New Mexico’s population is either young or aging. New Mexico’s median age is lower than that of the nation, but higher than that of all its surrounding states. The state does, however, have a significantly large share of younger persons in its population. Over one-third of the population is under the age of 25, which is a greater share than the national average and the averages of several neighboring states. The large amount of young persons in its population can serve as an indicator of future workforce supply, with these future workers entering into new jobs as well as filling positions left vacant by retiring baby boomers. A key focus will be to retain these younger workers in the state by ensuring job opportunities.
• New Mexico’s population is racially and ethnically diverse. The large concentrations of Hispanic and American Indian populations are unique within the region and the nation.
• New Mexico struggles with lower income and higher poverty levels. New Mexico’s median household income is lower than that of all its neighboring states and the nation. This measurement, in combination with New Mexico having the highest percentage of its population in poverty, points towards a major area of concern. Increasing and improving employment opportunities will ultimately lead to higher incomes, reduced poverty rates, and better standards of living for New Mexico’s residents and workers.
New Mexico’s WorkforceWhat it Looks Like Now
• About 60 percent of New Mexicans (16 years and older) participated in the labor force in 2012. Labor force participation has declined overall in the U.S. in recent years. Of New Mexico and its surrounding states, participation declined the most in Arizona and declined the least in Texas between 2005 and 2012.
• The median age of New Mexico’s labor force was 40.3 years in 2012. This is close to the median age in the U.S., overall, and older than that of New Mexico’s neighboring states. Men comprised a larger percentage of the labor force across all age groups, with the exception of workers between 65 and 74.
• New Mexico’s Black/African Americans, American Indians, and persons of more than one race, face some of the most significant employment challenges. While those of Black/African American race are more likely to participate in the labor force than most other racial/ethnic groups, they are also more likely to be unemployed. American Indians and persons of more than one race face a larger issue, with high unemployment and low labor force participation.
How it’s Growing
• New Mexico was late in seeing recessionary job losses and has been slower than its neighboring states in recovering lost jobs.
• New Mexico and most of its neighboring states experienced a decline in their labor force and
Summary and Findings

STATE OF THE WORKFORCE 2014 5
employment, while unemployment increased, during the recession and early recovery period. While New Mexico was not the only southwestern state that continued to struggle in the recovery, it did enter its recovery more slowly than some states. During the recovery, New Mexico continued to see its labor force and employment decline. New Mexico has also seen its unemployment rate somewhat stagnate, at best, and increase, at worst, during the three-year period, while most of its neighboring states have seen their unemployment rates fall by at least a half a percentage point.
• The Eastern Region, overall, saw the least severe recessionary impacts of New Mexico’s four workforce regions. Employment declined the least during the recession and has been growing during the recovery. The Southwestern Region has also registered some positive employment measures during the recovery, although the unemployment rate has remained high (mostly driven by high rates in Luna County). The Central and Northern regions’ labor forces have lagged these two regions in recovering from the recession.
• Counties that saw the largest over-the-year losses in employment between 2011 and 2012 include Chaves, Colfax, Los Alamos, Rio Arriba, Taos, and Union. Counties that saw the largest over-the-year gains in employment between 2011 and 2012 include Catron, Cibola, Socorro, Eddy, Grant, Lea, Otero, and Roosevelt.
Industries, Occupations, and Wages
• The health care industry employs the largest percentage of New Mexico’s workforce (16 percent) and also saw the largest numeric growth in employment between 2007 and 2012. Accommodation and food services was the only other industry within the top five largest that saw employment growth over the five-year period. Mining, with only 3 percent of New Mexico’s workforce, experienced the fastest growth. Many industries continued to struggle with overall employment losses into 2012.
• Construction and manufacturing, which comprise 6 and 4 percent of total employment, respectively, each lost over 20 percent of their total workforces over the five-year period. While the construction industry has
very recently started to see some minor improvements in employment, manufacturing has continued to struggle significantly.
• Over two-thirds of New Mexico’s workers are employed in an office/administrative support, retail sales, or food preparation and serving occupation. These occupations are often the most common across the U.S. While over two-thirds of New Mexicans are employed in an occupation within these major categories, the average wages for these categories fall within the bottom third of all occupations. Science, Technology, Engineering, and Mathematics (STEM) occupations, along with management occupations, are often the highest paying in New Mexico and other states
Skills and Education
• Educational attainment is considered an area of concern when evaluating New Mexico’s workforce because low educational attainment and graduation rates place New Mexico at a competitive disadvantage to neighboring states and the nation as a whole.
• While it appears that New Mexicans have, on average, the education required for existing jobs in the state, the state also is home to a less educated population than its neighboring states and the nation. The percentage of New Mexicans that did not complete high school exceeds the same measurement for the U.S., and the percentage of New Mexicans with a bachelor’s degree or higher is 4.5 percentage points less than the national percentage.
• New Mexico’s competitive disadvantage in educational attainment is further impacted by its low graduation rates. In 2009 (the most recent year for which data was available) 64.8 percent of high school seniors graduated. This rate is lower than that of all surrounding states and trails the graduation rate of the nation by almost 8 percentage points.
• While lower-skill jobs are projected to grow quickly into the future, jobs requiring a bachelor’s degree or more are projected to grow nearly as quickly. Although increasing and improving educational attainment and preparing a skilled workforce is a very complex issue
Summary and Findings

6 NEW MEXICO DEPARTMENT OF WORKFORCE SOLUTIONS
that is not easily tackled, future efforts should continue to focus on areas of high demand, while keeping in mind the role of economic development.
The Future Workforce
• New Mexico is projected to see employment grow by about 136,000 jobs over the 2010 to 2020 period.
• Employment growth in the health care and educational services industries is projected to lead that of all other industries in numeric growth. Employment in both industries, along with employment in the mining industry, is also projected to grow the fastest. Each of the state’s four regions are projected to see large growth in health care and education, while mining employment growth will likely be more concentrated in the Eastern and Northern regions.
• Manufacturing is the only major industry sector that is projected to experience a decline in employment over the 10-year period.
• Employment growth in the Central Region is projected to be very similar to that of the state as a whole. Employment in the Eastern Region is projected to grow slightly faster than the state’s average rate, while employment in the Northern and Southwestern regions is projected to grow slightly slower.
• Employment in food preparation and serving; education, training, and library; personal care and service; and office/administrative support occupations are projected to grow more than employment in all
other major occupational groups. Growth in these four major occupational groups accounts for over 40 percent of all employment growth in New Mexico over the 10-year projection period. Average wages for education, training, and library occupations are the highest of these top occupational groups.
• Employment in healthcare practitioner/technical and healthcare support occupations is projected to grow significantly and at fast rates; growth in these occupational categories represents close to 14 percent of all growth, with employment in healthcare support occupations projected to grow the fastest of any occupational category. This reflects the large projected growth in the health care industry overall.
• Several specific health care occupations are also projected to provide some of the best employment opportunities for New Mexicans. Based on methodology determined by NMDWS that evaluates projected growth and median wages, six of New Mexico’s top 30 occupations are within health care and social assistance.
• Several occupations within education are also projected to offer some of the best future employment opportunities for New Mexicans. Where the top health care and education occupations typically require at least some postsecondary education, several mining occupations that are identified as top employment opportunities require less education, but still pay higher-than-average wages. Other top occupations include those within administration and business.
Summary and Findings

STATE OF THE WORKFORCE 2014 7
In 2012, New Mexico had an estimated population of 2.1 million people, a 31.9 percent increase from 1992’s population of 1.6 million. Although New Mexico’s population has grown faster than that of the nation overall, 31.9 percent as compared to 23.1 percent, respectively, the rate has been slower than most other neighboring states, with the exception of Oklahoma, at 19.1 percent. The fastest-growing of the neighboring states during the 20-year period was Arizona, at 69.5 percent, followed by Utah, Colorado, and Texas.
New Mexico was not only the least populated among neighboring states in 2012, but it also had the fewest inhabitants per square mile. The population density was 17.2 persons per square mile, followed by Utah at 34.7 persons per square mile.
New Mexico’s four metropolitan statistical areas (MSAs)—Albuquerque, Santa Fe, Farmington, and Las Cruces—are
home to over two-thirds of the state’s population. The Central Region, which also represents the Albuquerque MSA, contains over 40 percent of the population and saw the greatest population growth between 1992 and 2012. Growth in this region represented just over 43 percent of all statewide population growth, and expanded at an average annual rate of 2.1 percent.
Between 2002 and 2012, Sandoval County, located in the Central Region, claimed the highest growth rate of all 33 New Mexico counties. Its growth rate over this period was nearly 37 percent. The next-fastest growth rates belonged to Doña Ana, Bernalillo, Lea, and Valencia counties, ranging from 11.2 to 17.6 percent. Almost half of all counties saw declining populations over the 10-year period. The populations in the counties of Hidalgo, De Baca, Quay, Sierra, and Mora declined at the greatest rates, ranging from a negative 8.5 percent to a negative 16.2 percent.
New Mexico’s PopulationA Snapshot of Population Across the State
State, Regional, and County Population Estimates“Over the last 20 years, New Mexico’s population has grown faster than that of the nation, but slower than most other neighboring states.”
3,86
7
3,46
0
1,58
1
3,20
4 17,6
50
1,82
1 6,55
3
5,18
8
2,08
6
3,81
5
26,0
59
2,85
5
-
5,000
10,000
15,000
20,000
25,000
30,000
AZ CO NM OK TX UT
Total Population & GrowthNew Mexico & Neighboring States, 1992-2012
1992 2012
Numbers are in thousands and percentages represent overall growth.Source: U.S. Census Bureau
69.5% 49.9% 31.9% 56.8%
47.6%
19.1%

8 NEW MEXICO DEPARTMENT OF WORKFORCE SOLUTIONS
Why population mattersPopulation is one of the key elements by which a business can assess the extant labor pool, and it is often taken into consideration by businesses determining whether to relocate to or establish themselves in a certain area. No one area or population profile is right for every business; some employers seek rural areas, whereas others wish to take advantage of areas with high-density populations. The characteristics of the population also come into consideration as businesses determine whether the population of an area fits the model for their targeted customer base. Population levels, characteristics, and density are important to any business as it decides to invest in a community.
New Mexico’s PopulationA Snapshot of Population Across the State
1,59
8
638 31
6
416
229
2,08
6
902
364 51
3
307
0
500
1,000
1,500
2,000
2,500
New Mexico Central Eastern Northern Southwestern
Total Population & GrowthNew Mexico & Its Regions, 1992-2012
1992 2012
Numbers are in thousands and percentages represent overall growth. Source: U.S. Census Bureau
30.5%
33.9%23.5%15.2%41.4%
72.2
34.0
33.4 13
.0 46.7
67.6
22.2
88.9
57.7
50.1
17.2 55
.6
99.8
34.7
0
20
40
60
80
100
120
US AZ CO NM OK TX UT
Population DensityNew Mexico & Neighboring States, 1992-2012
1992 2012
Source: U.S. Census Bureau

STATE OF THE WORKFORCE 2014 9
New Mexico’s PopulationA Snapshot of Population Across the State
36.8
%
17.6
%
16.3
%
14.5
%
11.2
%
-8.5
%
-8.8
%
-12.
0%
-12.
6%
-16.
2%
-50%
-30%
-10%
10%
30%
50%
70%
Source: U.S. Census Bureau
Population GrowthTop Growing & Shrinking Counties, 1992-2012
0.71.93.7
4.44.6
128.5135.6
146.4
214.5 673.4*
0 50 100 150 200 250 300 350 400
HardingDe Baca
CatronUnion
Guadalupe
San JuanSandovalSanta Fe
Doña AnaBernallillo
Total Population Most & Least Populated Counties, 1992-2012
* Bernalillo employment exceeds the chart maximum for comparative purposes.Source: U.S. Census Bureau. Numbers are in thousands.
10 NEW MEXICO DEPARTMENT OF WORKFORCE SOLUTIONS
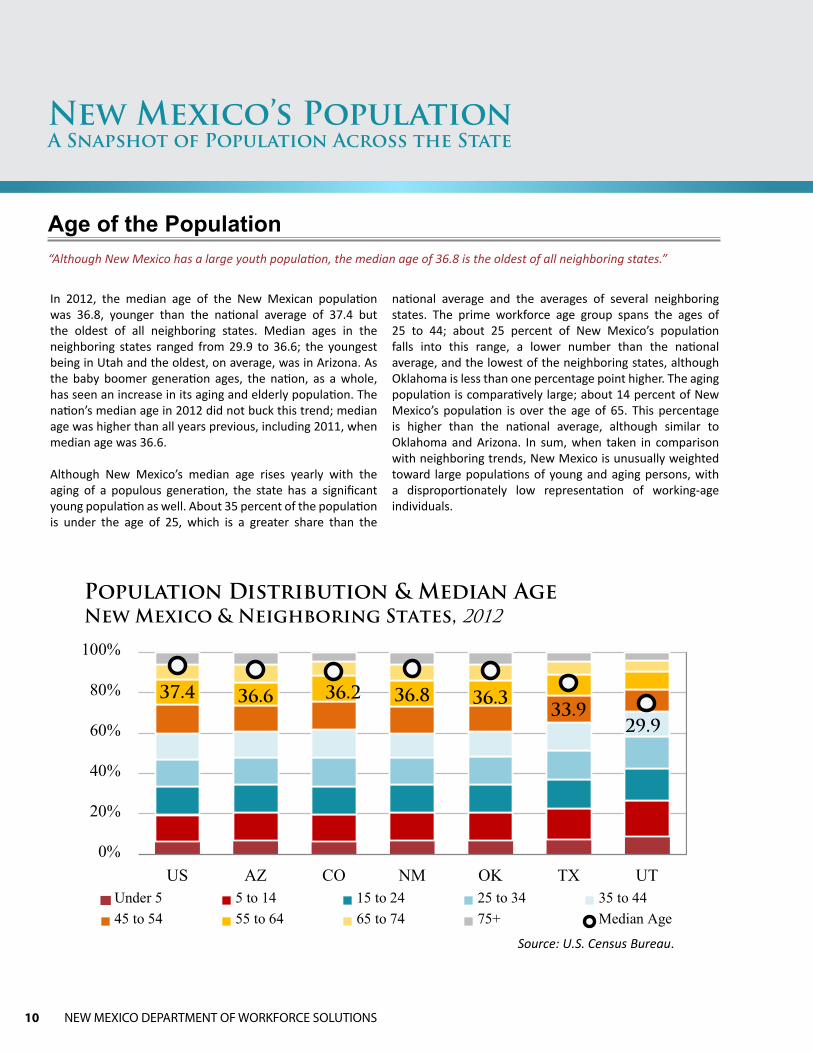
In 2012, the median age of the New Mexican population was 36.8, younger than the national average of 37.4 but the oldest of all neighboring states. Median ages in the neighboring states ranged from 29.9 to 36.6; the youngest being in Utah and the oldest, on average, was in Arizona. As the baby boomer generation ages, the nation, as a whole, has seen an increase in its aging and elderly population. The nation’s median age in 2012 did not buck this trend; median age was higher than all years previous, including 2011, when median age was 36.6.
Although New Mexico’s median age rises yearly with the aging of a populous generation, the state has a significant young population as well. About 35 percent of the population is under the age of 25, which is a greater share than the
national average and the averages of several neighboring states. The prime workforce age group spans the ages of 25 to 44; about 25 percent of New Mexico’s population falls into this range, a lower number than the national average, and the lowest of the neighboring states, although Oklahoma is less than one percentage point higher. The aging population is comparatively large; about 14 percent of New Mexico’s population is over the age of 65. This percentage is higher than the national average, although similar to Oklahoma and Arizona. In sum, when taken in comparison with neighboring trends, New Mexico is unusually weighted toward large populations of young and aging persons, with a disproportionately low representation of working-age individuals.
New Mexico’s PopulationA Snapshot of Population Across the State
Age of the Population“Although New Mexico has a large youth population, the median age of 36.8 is the oldest of all neighboring states.”
37.4 36.6 36.2 36.8 36.333.9
29.9
0%
20%
40%
60%
80%
100%
US AZ CO NM OK TX UT
Population Distribution & Median AgeNew Mexico & Neighboring States, 2012
Under 5 5 to 14 15 to 24 25 to 34 35 to 4445 to 54 55 to 64 65 to 74 75+ Median Age
Source: U.S. Census Bureau

STATE OF THE WORKFORCE 2014 11
What does age mean?The age of the population is a quality that businesses and educators examine when attempting to characterize the future workforce. New Mexico currently has a large aging population and a relatively small labor force in prime working age, but the size of the youth population promises a larger labor force to come. Businesses looking to establish themselves often value the size of the future workforce, as it indicates the potential for expansion. In turn, educators and educational institutions may devise programs of study based on the careers they predict will be in high demand in the future.
New Mexico’s PopulationA Snapshot of Population Across the State
80,000 60,000 40,000 20,000 0 20,000 40,000 60,000 80,000
Under 5 years
5 to 9 years
10 to 14 years
15 to 19 years
20 to 24 years
25 to 29 years
30 to 34 years
35 to 39 years
40 to 44 years
45 to 49 years
50 to 54 years
55 to 59 years
60 to 64 years
65 to 69 years
70 to 74 years
75 to 79 years
80 to 84 years
85 and over
Source: U.S. Census Bureau.
1992
FemaleMale
Population by AgeNew Mexico, 1992 & 2012
80,000 60,000 40,000 20,000 0 20,000 40,000 60,000 80,000
Under 5 years
5 to 9 years
10 to 14 years
15 to 19 years
20 to 24 years
25 to 29 years
30 to 34 years
35 to 39 years
40 to 44 years
45 to 49 years
50 to 54 years
55 to 59 years
60 to 64 years
65 to 69 years
70 to 74 years
75 to 79 years
80 to 84 years
85 and over
Female
Source: U.S. Census Bureau.
2012
Male

12 NEW MEXICO DEPARTMENT OF WORKFORCE SOLUTIONS
New Mexico possesses unique racial and ethnic diversity among its neighbors and compared to the nation as a whole. In 2012, about 47 percent of the population was Hispanic/Latino, 9 percent was American Indian, and 17 percent identified as two or more races. These percentages were
Strength in diversityA diverse population provides multiple economic benefits. Rich and distinct cultural heritage can support a variety of business and employment opportunities. Furthermore, a diverse labor force can serve as an enticement to businesses that seek to target a diverse customer base. Businesses that plan to target multilingual and multicultural customers may look for a labor force that is able to better communicate with and understand the specific needs and demands of such a customer base.
New Mexico’s PopulationA Snapshot of Population Across the State
Race & Ethnicity“New Mexico’s uniquely diverse population includes higher concentrations of several minority groups as compared to other neighboring states and the nation as a whole.”
higher than the nationwide average and the averages of all other neighboring states. New Mexico is not only unique in this diversity, but is also considered a minority majority state because of the large Hispanic/Latino population.
73.9
%
78.8
%
84.4
%
71.9
%
73.5
%
75.0
% 88.1
%
12.6
%
4.4%
4.2%
2.1% 7.
2% 11.9
%
1.1%
0.8% 4.
4%
0.9%
9.2%
7.3%
0.5%
1.1%
12.7
%
12.4
%
10.5
%
16.8
%
12.0
%
12.6
%
9.7%
16.5
% 29.7
%
20.6
%
46.7
%
9.1%
37.6
%
13.1
%
0%
50%
US AZ CO NM OK TX UT
Racial & Ethnic DiversityNew Mexico & Neighboring States, 2012
White Black/African American American Indian Other or 2 or More Races Hispanic/Latino (All Races)
Source: U.S. Census Bureau

STATE OF THE WORKFORCE 2014 13
New Mexico’s PopulationA Snapshot of Population Across the State
Between 2002 and 2012, New Mexico’s median household income grew by 22.5 percent. Median income represents the income at which half of New Mexicans earn less than that income, and half earn more than that income. Although the growth rate exceeded that of the nation and three neighboring states, growth rates in Oklahoma and Texas were much higher. Furthermore, in 2012, the median household income
Income as an indicator of economic healthA high household median income is an indicator of a prosperous local economy that supports high-wage jobs and demonstrates that residents have a higher level of purchasing power. These indicators can work towards attracting new businesses to the area, which in turn employ a greater percentage of the workforce. Because median income is one of many measurements that are symptomatic of economic health, it is used as a diagnostic gauge by economic developers, policymakers, and other parties interested in evaluating the state of the economy and labor force.
was comparatively low. The median New Mexico household brought in $43,424, whereas the next lowest neighboring state, Arizona, had a median income of $47,044. The highest median income of the neighboring states, $58,341, was in Utah. Certain regions and cities within New Mexico may fare better when compared to the national average, but the state as a whole has a poorer median income than its neighbors.
Income“New Mexico has the lowest median income of all neighboring states; however, it has experienced a faster rate of income growth than many neighboring states and the nation as a whole.”
$42,
409
$39,
734
$48,
294
$35,
457
$36,
458
$40,
149
$47,
861
$51,
017
$47,
044
$57,
255
$43,
424
$48,
407
$51,
926
$58,
341
$0
$10,000
$20,000
$30,000
$40,000
$50,000
$60,000
$70,000
US AZ CO NM OK TX UT
Median Household Income & GrowthNew Mexico & Neighboring States, 2002-2012
2002 2012
Percentages represent overall growth. Source: U.S. Census Bureau
29.3%32.8%22.5%18.6%18.4%20.3% 21.9%

14 NEW MEXICO DEPARTMENT OF WORKFORCE SOLUTIONS
Between 2002 and 2012, all neighboring states and the nation saw increases in the population living below the poverty line. In that period, the size of New Mexico’s population below the poverty line increased by 2.5 percent. Although the rate of increase was lower than the national average
Poverty’s impacts on the labor forceReducing New Mexico’s poverty level is an important goal in any plan to strengthen the economy, attract new business, and improve the living standards of the population. Poverty is a multifaceted issue that is not only strongly influenced by educational attainment and employment opportunities, but is deeply intertwined with a variety of societal factors such as purchasing power, health, and community development. Successfully reducing the state’s poverty level and increasing income and employment would likely generate enhanced economic development opportunities that benefit all New Mexicans.
New Mexico’s PopulationA Snapshot of Population Across the State
Poverty“New Mexico has a higher percentage of people in poverty than any other neighboring state. Between 2002 and 2012, the number of persons in poverty grew by 2.5 percent.”
and several neighboring states, except Texas and Utah, the actual percentage of residents in poverty was higher, at 20.4 percent, than all of its neighbors. The neighboring state with the next-largest percentage of residents living below the poverty line was Arizona, at 19.0 percent.
12.1
%
13.6
%
9.8%
17.9
%
14.1
%
15.7
%
9.9%
15.0
% 19.0
%
11.9
%
20.4
%
18.0
%
17.0
%
11.0
%
0.0%
5.0%
10.0%
15.0%
20.0%
25.0%
US AZ CO NM OK TX UT
Percentage of Persons in Poverty & GrowthNew Mexico & Neighboring States, 2002-2012
2002 2012
Percentages represent overall growth.Source: U.S. Census Bureau
2.9% 5.4% 2.1% 2.5% 4.0% 1.4% 1.1%

STATE OF THE WORKFORCE 2014 15
In 2012, just over 60 percent of New Mexico’s population (16 years and older) participated in the labor force; these persons were either employed or unemployed and actively looking for work. New Mexico’s labor force participation decreased by 3.3 percentage points between 2005 and 2012,
What does labor force participation mean?Labor force participation is driven by many factors, including the number and diversity of employment opportunities, the age of the population, cultural factors, and incomes and wealth, among others. If an area has a large number and wide variety of employment opportunities, persons may be more motivated to enter the labor force and look for work. Even with other factors playing a role in labor force participation, providing diverse and strong employment opportunities will only help in increasing labor force participation and the overall health of an area’s labor market and economy.
Note: Unless otherwise noted, all information and data specific to labor force demographics gathered from the U.S. Census Bureau (participation, gender, race, age, education, etc.) includes both civilian and active duty armed forces populations. Labor force estimates, employment and unemployment data, both in total and at industry and occupational levels, counts only the civilian labor force due to methodology of data collection under the Quarterly Census of Employment and Wages (QCEW), Occupational Employment Statistics (OES), and Local Area Unemployment Statistics (LAUS) programs.
New Mexico’s WorkforceWhat it Looks Like Now
Labor Force Participation“Participation in the labor force has declined in New Mexico, its neighboring states, and the nation in recent years. The 2007 to 2009 recession is a major cause of such a large decline. Arizona and New Mexico’s labor force participation rates declined more than those of the U.S. and New Mexico’s other neighboring states.”
a decrease that was greater than all other neighboring states except Arizona. The recession was likely a major cause of the large declines in labor force participation, although other factors, such as an aging labor force, have also played a role.
65.9
%
63.9
%
71.3
%
63.4
%
64.2
% 66.7
% 70.9
%
63.8
%
60.2
%
68.7
%
60.1
%
61.8
% 64.8
% 68.8
%
50%
55%
60%
65%
70%
75%
US AZ CO NM OK TX UT
Labor Force ParticipationNew Mexico & Neighboring States, 2005-2012
2005 2012
Source: U.S. Census Bureau
16 NEW MEXICO DEPARTMENT OF WORKFORCE SOLUTIONS
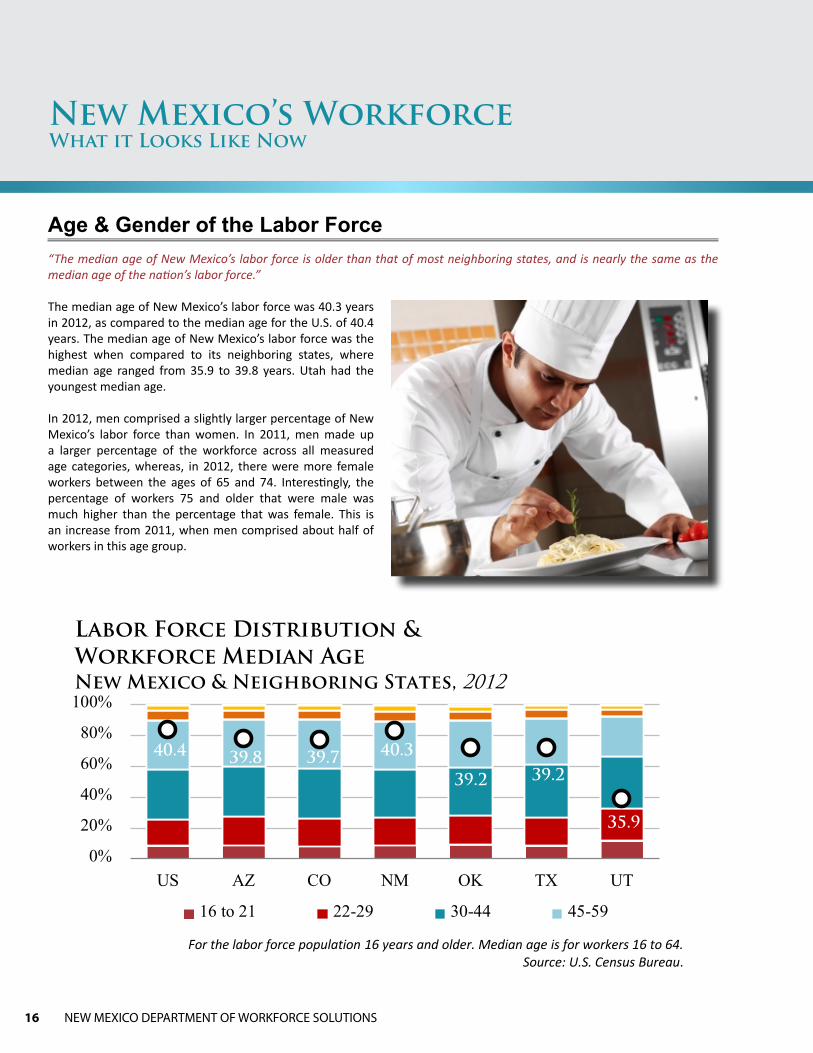
The median age of New Mexico’s labor force was 40.3 years in 2012, as compared to the median age for the U.S. of 40.4 years. The median age of New Mexico’s labor force was the highest when compared to its neighboring states, where median age ranged from 35.9 to 39.8 years. Utah had the youngest median age.
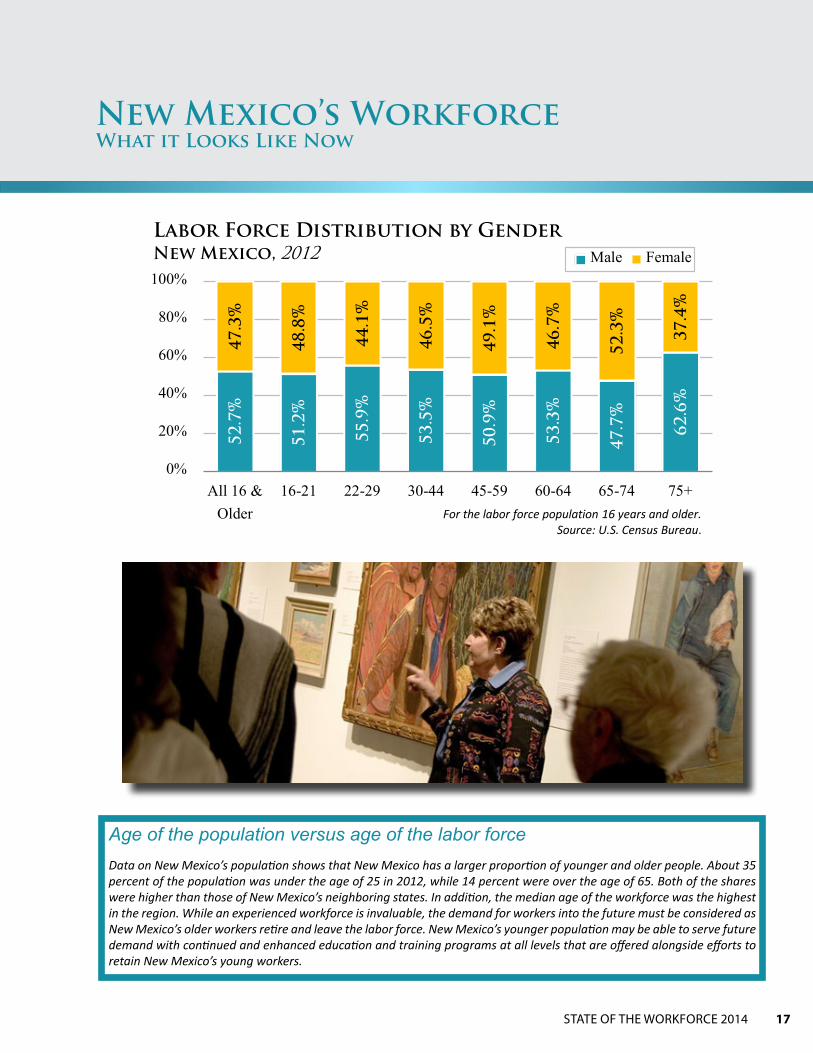
In 2012, men comprised a slightly larger percentage of New Mexico’s labor force than women. In 2011, men made up a larger percentage of the workforce across all measured age categories, whereas, in 2012, there were more female workers between the ages of 65 and 74. Interestingly, the percentage of workers 75 and older that were male was much higher than the percentage that was female. This is an increase from 2011, when men comprised about half of workers in this age group.
New Mexico’s WorkforceWhat it Looks Like Now
Age & Gender of the Labor Force“The median age of New Mexico’s labor force is older than that of most neighboring states, and is nearly the same as the median age of the nation’s labor force.”
40.4 39.8 39.7 40.3
39.2 39.2
35.9
32
34
36
38
40
42
0%
20%
40%
60%
80%
100%
US AZ CO NM OK TX UT
Labor Force Distribution & Workforce Median AgeNew Mexico & Neighboring States, 2012
16 to 21 22-29 30-44 45-59
For the labor force population 16 years and older. Median age is for workers 16 to 64.Source: U.S. Census Bureau
STATE OF THE WORKFORCE 2014 17
Age of the population versus age of the labor forceData on New Mexico’s population shows that New Mexico has a larger proportion of younger and older people. About 35 percent of the population was under the age of 25 in 2012, while 14 percent were over the age of 65. Both of the shares were higher than those of New Mexico’s neighboring states. In addition, the median age of the workforce was the highest in the region. While an experienced workforce is invaluable, the demand for workers into the future must be considered as New Mexico’s older workers retire and leave the labor force. New Mexico’s younger population may be able to serve future demand with continued and enhanced education and training programs at all levels that are offered alongside efforts to retain New Mexico’s young workers.
New Mexico’s WorkforceWhat it Looks Like Now
52.7
%
51.2
%
55.9
%
53.5
%
50.9
%
53.3
%
47.7
%
62.6
%
47.3
%
48.8
%
44.1
%
46.5
%
49.1
%
46.7
%
52.3
%
37.4
%
0%
20%
40%
60%
80%
100%
All 16 &Older
16-21 22-29 30-44 45-59 60-64 65-74 75+
Labor Force Distribution by GenderNew Mexico, 2012 Male Female
For the labor force population 16 years and older.Source: U.S. Census Bureau

18 NEW MEXICO DEPARTMENT OF WORKFORCE SOLUTIONS
In 2012, about 60 percent of New Mexicans 16 and older were participating in the labor force. When evaluating participation by race and ethnicity, it appears that most of New Mexico’s racial and ethnic groups had participation rates above this average. However, American Indians and persons of two or more races had labor force participation that was lower than the average in 2012. These two groups, along with New
Mexicans that identify themselves as Black/African American, also experienced some of the highest unemployment rates during that year. Black/African American New Mexicans saw close to 19 percent of their labor force unemployed in 2012. This was the highest of all racial and ethnic groups. New Mexicans that identify themselves as Asian had the highest labor force participation and lowest unemployment rate.
Diversity and employment challengesIt is necessary that policy makers and other stakeholders stay ever-conscious of New Mexico’s diverse population and labor force when evaluating how to improve the employment opportunities of all New Mexicans. New Mexicans of different racial and ethnic groups face varying challenges within the labor market, with some groups facing much more significant challenges than others. New Mexico’s diverse population and labor force is an asset, but can only be fully used as such when employment opportunities are accessible and attainable to all New Mexicans.
New Mexico’s WorkforceWhat it Looks Like Now
Race & Ethnicity in the Labor Force “New Mexico’s workforce is racially and ethnically diverse, but some minority populations face greater challenges and barriers within the labor market.”
60.7
%
62.5
%
53.6
%
63.4
%
61.0
%
57.6
%
62.2
%
10.0
%
18.9
%
16.0
%
9.0% 11
.8%
16.8
%
12.5
%
0.0%
20.0%
40.0%
60.0%
Whi
te
Bla
ck/A
fric
anA
mer
ican
Am
eric
anIn
dian
Asi
an
Oth
er R
ace
Two/
Mor
e Ra
ces
His
pani
c/La
tino
(All
Rac
es)
Labor Force Participation & Unemployment by Race/EthnicityNew Mexico, 2012 In Labor Force Unemployed
Source: U.S. Census Bureau

STATE OF THE WORKFORCE 2014 19
Throughout the recession (2007-2009), the labor force in New Mexico grew by 0.2 percent, which was slower than that of the nation and all of the surrounding states. Since the end of the recession, New Mexico has experienced minor losses to the labor force (of 0.2 percent), a decline that was more than what the nation saw but less than the losses reported in Arizona and Utah. Over the past 10 years (2002-2012), the labor force in New Mexico grew by 7.4 percent. Growth prior to the recession helped to soften the blow of the near stagnant labor force that has been seen in New Mexico over the past 5 years.
The Southwestern Region had the largest increase in its labor force compared to the other regions between 2002 and 2012. The Eastern Region followed closely and had a growth rate of 12.5 percent over the 10-year period. Additionally, the labor force in both regions grew during and after the recession. The Northern Region reported the largest labor force losses between 2007 and 2012; it declined by 2.6 percent. The Central Region had a strong growth rate of 7.6 percent prior to the recession, but saw its labor force drop by 0.6 percent during the recession and 1.3 percent in the three years after the recession. Overall, it had a growth rate of 5.6 percent between 2002 and 2012.
Bright spots and areas of continued focusDespite declines in the labor force over the past five years, New Mexico reported a stronger growth rate than that of the nation between 2002 and 2012. Additionally, New Mexico was not alone in experiencing slower or negative growth rates in the labor force in the years following the start of the recession. Declines in labor force participation and the size of the labor force, in general, have been challenges for most of the neighboring states. Likewise, it’s a trend that has been seen nationwide and could be tied to other factors, such as retirement of baby boomers as they leave the labor force, as well as an effect of the recession. Further analysis would need to be completed to identify the indicators that are driving the decline of the labor force in the Central and Northern regions.
New Mexico’s WorkforceHow it’s Growing
Labor Force Growth“New Mexico’s labor force has yet to return to its pre-recession level, however, the Eastern and Southwestern regions have helped to lessen the impact with growth rates of more than 4 percent between 2007 and 2012.”
5.7%
12.5
%
9.9%
7.5% 3.
1%
5.6%
15.5
%
0.7%
3.9%
1.8%
0.2% 1.
8%
4.9%
1.3%
0.5%
-3.1
%
0.4%
-0.2
%
2.1%
5.3%
-2.1
%
7.0%
13.3
%
12.3
%
7.4%
7.1%
16.6
%
14.5
%
-10.0%
-5.0%
0.0%
5.0%
10.0%
15.0%
20.0%
US AZ CO NM OK TX UT
Labor Force Growth RatesNew Mexico & Neighboring States, 2002-2012
2002-2007 2007-2009 2009-2012 2002-2012
Data is for civilian labor force only.Source: Local Area Unemployment Statistics (LAUS).

20 NEW MEXICO DEPARTMENT OF WORKFORCE SOLUTIONS
New Mexico’s WorkforceHow it’s Growing
7.5%
7.6% 8.1%
6.4%
8.3%
0.2%
-0.6
%
1.8%
-0.9
%
2.3%
-0.2
%
-1.3
%
2.3%
-1.7
%
2.8%
7.4%
5.6%
12.5
%
3.7%
14.0
%
-6.0%
-1.0%
4.0%
9.0%
14.0%
NM CWIA EWIA NWIA SWIA
Labor Force Growth RatesNew Mexico & Regions, 2002-2012
2002-2007 2007-2009 2009-2012 2002-2012
Source: Local Area Unemployment Statistics (LAUS).

STATE OF THE WORKFORCE 2014 21
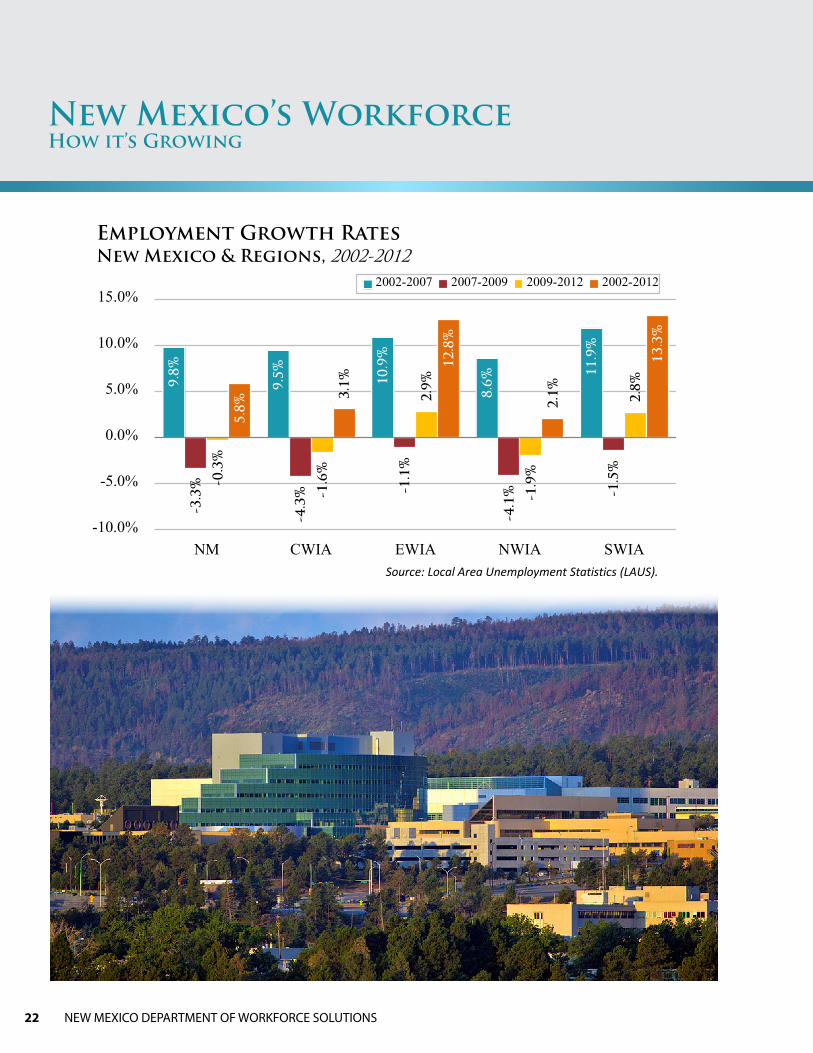
Employment in New Mexico increased by 5.8 percent between 2002 and 2012, the least out of the surrounding states, but more than the nation. Employment dropped by 3.3 percent during the recession. Losses have continued, albeit at a much slower rate, in the three years following the recession. Arizona was the only surrounding state that experienced a larger decline in its employment level during the recovery period.
All four regions in New Mexico saw employment levels drop between 2007 and 2009. The Eastern and Southwestern regions, however, have reported increases in employment
during the recovery period, whereas the Central and Northern regions have continued to experience employment losses.
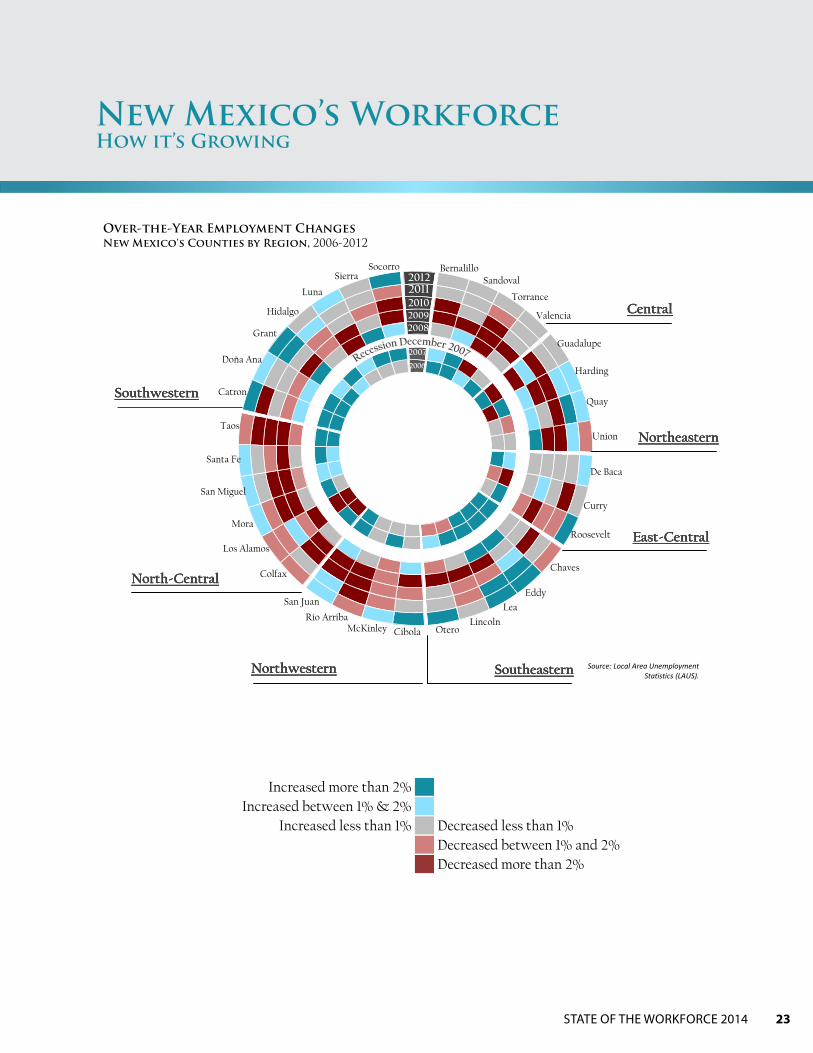
Over-the-year employment changes at the county level can help to identify the struggling areas in the North and Central regions. Most of the Northern Counties reported over-the-year job growth of more than 1 percent in 2012; however, Colfax, Los Alamos, Rio Arriba, and Taos counties saw employment decline over the year. Job growth in the Central Counties was minimal, with growth rates around 0.5 percent.
Bright spots and areas of continued focusEmployment in New Mexico grew by a faster rate than that of the nation over the 10-year period. The Eastern and Southwestern regions have had exceptionally strong growth rates during the time period of 12.8 and 13.3 percent, respectively. However, with much of the state’s population being concentrated in the Central and Northern regions, where losses were larger and post-recession growth has been slower, the state’s overall growth has been slowed down. Employment in these two regions should be an area of focus.
New Mexico’s WorkforceHow it’s Growing
Employment Growth“Employment losses in New Mexico have lessened since the end of the recession, but have continued during the recovery period through 2012.”
7.0%
15.3
%
12.1
%
9.8%
3.8%
7.9%
19.4
%
-4.2
%
-2.7
%
-2.8
%
-3.3
%
-0.9
%
1.4%
-4.0
%
1.9%
-1.5
%
0.5%
-0.3
%
3.7% 6.
1%
0.1%
4.4%
10.6
%
9.5%
5.8% 6.7%
16.1
%
14.6
%
-10.0%
-5.0%
0.0%
5.0%
10.0%
15.0%
20.0%
US AZ CO NM OK TX UT
Employment Growth RatesNew Mexico & Neighboring States, 2002-2012
2002-2007 2007-2009 2009-2012 2002-2012
Source: Local Area Unemployment Statistics (LAUS).
22 NEW MEXICO DEPARTMENT OF WORKFORCE SOLUTIONS
New Mexico’s WorkforceHow it’s Growing
9.8%
9.5% 10
.9%
8.6%
11.9
%
-3.3
%
-4.3
% -1.1
%
-4.1
% -1.5
%
-0.3
%
-1.6
%
2.9%
-1.9
%
2.8%
5.8%
3.1%
12.8
%
2.1%
13.3
%
-10.0%
-5.0%
0.0%
5.0%
10.0%
15.0%
NM CWIA EWIA NWIA SWIA
Employment Growth RatesNew Mexico & Regions, 2002-2012
2002-2007 2007-2009 2009-2012 2002-2012
Source: Local Area Unemployment Statistics (LAUS).
STATE OF THE WORKFORCE 2014 23
New Mexico’s WorkforceHow it’s Growing
2006
2007
200820092010
Bernalillo Sandoval
Torrance
Valencia
Guadalupe
Harding
Quay
Union
De Baca
Curry
Roosevelt
Chaves
Eddy
Lea
Lincoln Otero Cibola McKinley
Rio Arriba
San Juan
Colfax
Los Alamos
Mora
San Miguel
Santa Fe
Taos
Catron
Doña Ana
Grant
Hidalgo
Luna
Sierra Socorro
2012
Central
Northeastern
East-Central
SoutheasternNorthwestern
North-Central
Southwestern
Central
Northeastern
East-Central
SoutheasternNorthwestern
North-Central
Southwestern
2011
Central
Northeastern
East-Central
SoutheasternNorthwestern
North-Central
Southwestern
Source: Local Area Unemployment Statistics (LAUS).
Over-the-Year Employment ChangesNew Mexico's Counties by Region, 2006-2012
Increased more than 2%Increased between 1% & 2%
Increased less than 1% Decreased less than 1%Decreased between 1% and 2%Decreased more than 2%

24 NEW MEXICO DEPARTMENT OF WORKFORCE SOLUTIONS
New Mexico’s unemployment rate has managed to remain one of the lowest out of the states in the southwest. In 2012, New Mexico had a lower unemployment rate than the nation, Arizona, and Colorado. However, New Mexico was late to enter the recession, and, in 2007, it had an unemployment rate of 3.5 percent. Over the next five years, the unemployment rate increased by 3.4 percentage points, whereas the nation’s unemployment rate increased by 3.5 percentage points. In 2012, the number of unemployed people in New Mexico was nearly double that of 2007; likewise, in the U.S. there was an increase of around 75 percent of unemployed people. It’s important to remember that all labor market indicators should be used when analyzing New Mexico’s workforce.
The Eastern Region maintained the lowest unemployment rate, and the rate increased by only 2.2 percentage points, between 2007 and 2012. The Southwestern Region had the highest unemployment rate in 2012. It also had the largest increase in its labor force between 2007 and 2012, while employment increased at a lower rate. If persons continue to enter the labor force, but are unable to find employment, then it will cause an increase in the unemployment rate. The recession’s negative impact on the Central Region can also be seen in its high unemployment rate of 7.8 percent. The Northern Region followed closely, with an unemployment rate of 6.8 percent in 2012.
Bright spots and areas of continued focusNew Mexico has maintained a relatively low unemployment rate compared to the surrounding states. It has also begun to show signs of recovery after reaching a high of 7.9 percent for its unemployment rate in 2010. Likewise, all four regions have seen their unemployment rates decline since then—Central from 8.3 percent, Eastern from 6.6 percent, Northern from 7.8 percent, and Southwestern from 8.6 percent. It’s important to recognize the diverse labor market found in New Mexico and to aid those counties that are continuing to struggle. This is especially important considering the unemployment rates in New Mexico counties ranged from 3.5 percent to 17.2 percent in 2012.
New Mexico’s WorkforceHow it’s Growing
Unemployment Growth“Despite comparatively large labor force and employment losses, New Mexico’s unemployment rate has been lower than that of the nation and two of its five surrounding states.”
5.8% 6.0%
5.7%
5.5%
4.8%
6.4%
5.8%
4.6%
3.7%
3.8%
3.5% 4.
1% 4.4%
2.6%
9.3% 9.
8%
8.1%
6.8%
6.7% 7.
5% 7.8%8.1% 8.3%
8.0%
6.9%
5.2%
6.8%
5.7%
0.0%
2.0%
4.0%
6.0%
8.0%
10.0%
US AZ CO NM OK TX UT
Unemployment RatesNew Mexico & Neighboring States, 2002-2012
2002 2007 2009 2012
Source: Local Area Unemployment Statistics (LAUS).
Future Workforce Supply
STATE OF THE WORKFORCE 2014 25
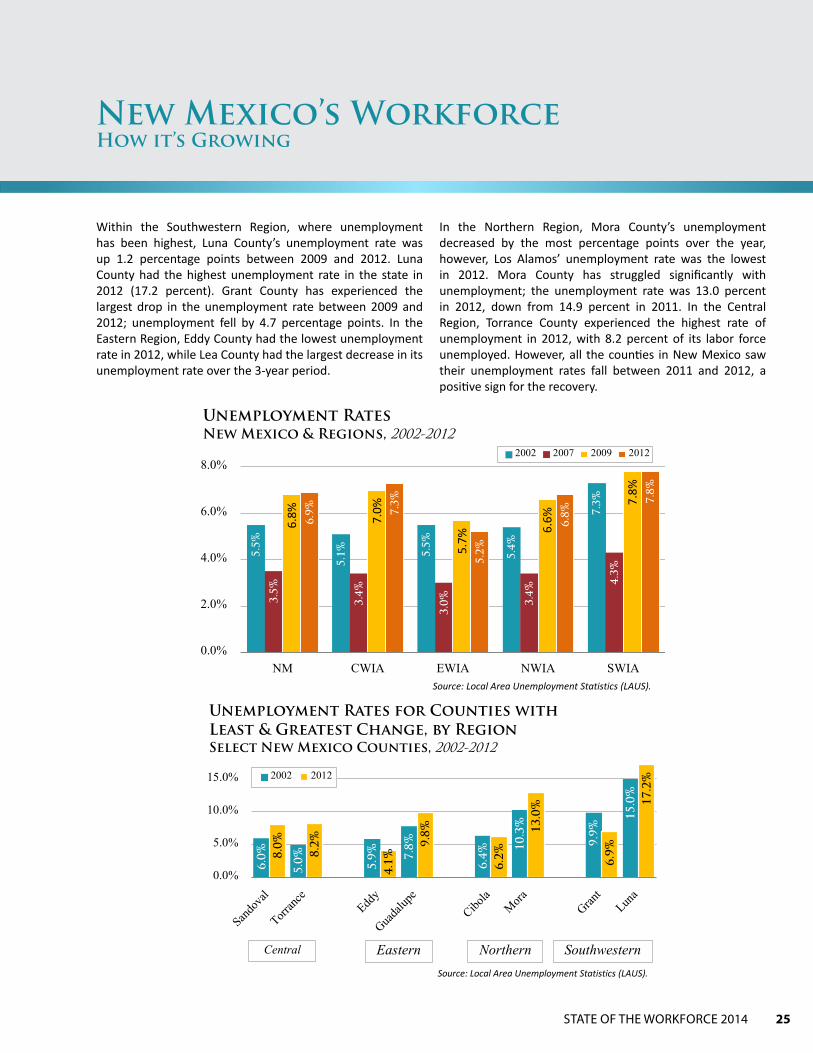
Within the Southwestern Region, where unemployment has been highest, Luna County’s unemployment rate was up 1.2 percentage points between 2009 and 2012. Luna County had the highest unemployment rate in the state in 2012 (17.2 percent). Grant County has experienced the largest drop in the unemployment rate between 2009 and 2012; unemployment fell by 4.7 percentage points. In the Eastern Region, Eddy County had the lowest unemployment rate in 2012, while Lea County had the largest decrease in its unemployment rate over the 3-year period.
In the Northern Region, Mora County’s unemployment decreased by the most percentage points over the year, however, Los Alamos’ unemployment rate was the lowest in 2012. Mora County has struggled significantly with unemployment; the unemployment rate was 13.0 percent in 2012, down from 14.9 percent in 2011. In the Central Region, Torrance County experienced the highest rate of unemployment in 2012, with 8.2 percent of its labor force unemployed. However, all the counties in New Mexico saw their unemployment rates fall between 2011 and 2012, a positive sign for the recovery.
New Mexico’s WorkforceHow it’s Growing
5.5%
5.1% 5.
5%
5.4%
7.3%
3.5%
3.4%
3.0% 3.
4%
4.3%
6 8% 7 0%
5 7%
6 6%
7 8%
6.9% 7.
3%
5.2%
6.8%
7.8%
0.0%
2.0%
4.0%
6.0%
8.0%
NM CWIA EWIA NWIA SWIA
Unemployment RatesNew Mexico & Regions, 2002-2012
2002 2007 2009 2012
Source: Local Area Unemployment Statistics (LAUS).
6.0%
5.0% 5.9% 7.
8%
6.4%
10.3
%
9.9%
15.0
%
8.0%
8.2%
4.1%
9.8%
6.2%
13.0
%
6.9%
17.2
%
0.0%
5.0%
10.0%
15.0%
Unemployment Rates for Counties with Least & Greatest Change, by RegionSelect New Mexico Counties, 2002-2012
2002 2012
Source: Local Area Unemployment Statistics (LAUS).
Central SouthwesternEastern Northern

26 NEW MEXICO DEPARTMENT OF WORKFORCE SOLUTIONS
In 2012, nearly one in every six New Mexico jobs (16 percent) was in the health care industry, making it the top employing industry within the state. Retail trade, accommodation and food services, and educational services followed health care, with a combined share of total employment amounting to 33 percent. Consequently, these top four employing industries account for almost half of the jobs within New Mexico.
In addition to having the largest share of employment distribution, health care also added the most jobs between
2007 and 2012. During this period, 14,683 new jobs were added within health care, representing 13.1 percent growth. Mining, though it only represented 3 percent of total employment in 2012, was the fastest growing industry in the state over the same period. Between 2007 and 2012 the industry expanded by 23.8 percent, adding 4,611 new jobs, which represented the second largest number of new jobs added across all industries. Public administration, which employed 8 percent of working New Mexicans in 2012, also grew in large numbers. The industry added 1,605 new jobs,
New Mexico’s WorkforceIndustries, Occupations & Wages
Employment in New Mexico’s Industries“The health care industry has led the economic recovery in New Mexico, employing the highest number of workers, growing faster than all other industries, except mining, and adding the most new jobs.”
Health Care16%
Retail12%
Accommodation & Food Services
11%
Educational Services10%
Public Administration
8%
Professional & Technical Svcs
7%
Construction6%
Administrative & Waste Svcs
5%
Manufacturing4%
Mining3%
Transp. & Warehousing
3%
Other Services, Ex. Public Admin.
3%
Wholesale Trade3%
Finance & Insurance3%
Arts, Entertainment & Rec.
2%
Information2%
Agriculture1%
Real Estate/Rental & Leasing
1% Utilities1%
Mgmt of Companies1%
Industry DistributionNew Mexico, 2012
Source: Quarterly Census of Employment and Wages (QCEW).

STATE OF THE WORKFORCE 2014 27
or 2.7 percent, between 2007 and 2012. Several industries saw employment decline between 2007 and 2012, mostly as an effect of the recession. Manufacturing and construction faced the largest losses. Their combined job losses totaled 25,570, with construction contracting the fastest (by almost 29 percent).
Industry employment distribution in New Mexico’s regions reflects that of the state as a whole. In 2012, health care and retail trade were in the top three employing industries in every region. Similarly, accommodation and food services and educational services fell within the top five employing industries, with educational services making up the second largest share of employment in the Southwestern Region. Public administration made up a significant share of the Northern Region’s employment, as did mining within the Eastern Region. The professional and technical services
industry made up a larger share of the Central Region’s employment relative to other regions.
Industry-level employment growth data is often suppressed for New Mexico’s regions and counties, so specific data is not provided in this report. The largest and fastest growing industries are listed based on growth between 2007 and 2012. Health care was the top growth industry, and was also in the top three fastest growing industries for all regions except the Eastern Region. Mining was the fastest growing industry across all regions except the Northern Region and was in the top two largest growth industries for all regions except the Central Region. Agriculture, forestry, fishing and hunting was the fastest growing industry within the Northern Region, while transportation and warehousing showed fast and large growth in both Northern and Southwestern regions.
New Mexico’s WorkforceIndustries, Occupations & Wages
-18127
-7442
-6362
-4964
-3168
-2815
-2656
-2452
-2355
-2021
-1813
-1712
-1031
-796
147
178
493
1605
4611
14683
-28.8%
-20.1%
-13.0%
-5.1%
-5.6%
-3.5%
-10.6%
-14.3%
-9.9%
-17.0%
-9.5%
-7.5%
-4.6%
-13.8%
1.3%
3.0%
0.6%
2.7%
23.8%
13.1%
-30% -20% -10% 0% 10% 20% 30%
-30,000 -20,000 -10,000 0 10,000 20,000 30,000
Construction
Manufacturing
Administrative & Waste Svcs
Retail
Professional & Technical Svcs
Educational Services
Transp. & Warehousing
Information
Wholesale Trade
Real Estate/Rental & Leasing
Arts, Entertainment & Rec.
Finance & Insurance
Other Services, Ex. Public Admin.
Mgmt of Companies
Agriculture
Utilities
Accommodation & Food Services
Public Administration
Mining
Health Care
Industry Employment GrowthNew Mexico, 2007-2012
Source: Quarterly Census of Employment and Wages (QCEW).

28 NEW MEXICO DEPARTMENT OF WORKFORCE SOLUTIONS
Bright spots and areas of continued focusEmployment within New Mexico declined by about 4.4 percent between 2007 and 2012, with a loss of approximately 36,000 jobs. The health care industry is a bright spot within New Mexico, in terms of employment distribution, as well as fast and numerically substantial job growth. The industry experienced almost continuous job growth during the recession and recovery, with overall jobs gains in 27 of the last 32 quarters between 2005 (second quarter) and 2013 (first quarter). It also offers wages that are higher on average than other industries. The mining industry has also been providing increasingly good employment opportunities, with a growth rate in 2012 of around 24 percent, exceeding the next highest growth rate by over 10 percentage points. Of New Mexico’s top five employing industries, health care, accommodation and food services, and public administration experienced positive employment growth between 2007 and 2012. Retail trade and educational services, the remaining top five industries, along with many other industries, experienced job losses over the period, illustrating the significant impacts of the 2007 to 2009 recession. While losses in industries, like construction, occurred across many states in the U.S., recovery has been slow, and these industries, and the workers within them, continue to face reduced employment opportunities.
New Mexico’s WorkforceIndustries, Occupations & Wages
Largest and Fastest Growing IndustriesNew Mexico's Regions, 2007-2012
Largest Growth Fastest Growth Largest Growth Fastest Growth
Health Care & Social Assistance Mining Health Care & Social Assistance Agriculture/Forestry/HuntingPublic Administration Utilities Mining Transportation & Warehousing
Accommodation & Food Services Health Care & Social Assistance Transportation & Warehousing Health Care and Social AssistanceUtilities Public Administration Agriculture/Forestry/Hunting MiningMining Accommodation & Food Services
Largest Growth Fastest Growth Largest Growth Fastest Growth
Mining Mining Health Care & Social Assistance MiningRetail Trade Utilities Mining Transportation & Warehousing
Manufacturing Manufacturing Transportation & Warehousing Health Care & Social AssistanceAdministrative & Waste Services Retail Trade Professional & Technical Services UtilitiesHealth Care & Social Assistance Administrative & Waste Services Public Administration Professional & Technical Services
Source: Quarterly Census of Employment and Wages (QCEW).Note: Only four industries experienced growth between 2007-2012 within the Northern region.
CENTRAL NORTHERN
EASTERN SOUTHWESTERN

STATE OF THE WORKFORCE 2014 29
In 2012, about a quarter of all jobs were sales and administrative occupations. Sixteen percent of all New Mexico jobs were in office and administration support occupations, the group with the highest share of all employment. Sales and sales-related occupations and food preparation and serving occupations each made up 10 percent of total employment.
Of the top five employing occupational categories, which made up almost half of all employment in New Mexico, only education, training, and library (7 percent) paid an average wage above the all-occupation average. Construction and extraction was the only occupational group within the top five that did not fall within sales, service, or professional-
New Mexico’s WorkforceIndustries, Occupations & Wages
Occupational Employment of the Workforce“About a quarter of New Mexico’s workforce is employed in office and administrative support or sales and sales-related occupations.”
Office & Admin. Support 16%
Sales & Related 10%
Food Prep & Serving 10%
Education, Training, & Library 7%
Construction & Extraction 6%Healthcare
Practitioners & Tech. 6%
Transp. & Material Moving 6%
Management 5%
Personal Care & Service 4%
Business & Financial
Operations 4%
Installation, Maintenance, &
Repair 4%
Production 4%
Building & Grounds Clean/Maint. 3%
Protective Service 3%
Healthcare Support 3%
Architecture & Engineering 3%
Computer & Mathematical 2%
Community & Social Services 2%
Life, Physical, & Social Science 2%
Arts, Entertain., Media 1%
Legal 1% Farming, Fishing, & Forestry 0%
Occupational DistributionNew Mexico, 2012
Source: Occupational Employment Statistics (OES).
30 NEW MEXICO DEPARTMENT OF WORKFORCE SOLUTIONS
Bright spots and areas of continued focusThough office-based and sales-related occupations have lost many jobs since 2007, they still held the highest share of the occupational distribution in 2012. Health care and education are bright spots in that their share of total employment has increased and they also both offer higher than average wages. Health care jobs specifically, and in particular healthcare support occupations, were less impacted by the recession and have recently experienced growth. As will be seen in later sections, health care and education are also projected to continue providing some of the best employment options in the future.
New Mexico’s WorkforceIndustries, Occupations & Wages
$90,400$80,707
$75,639$75,406$73,561$73,378
$60,445$45,594$44,814
$42,134$41,941$41,499
$39,289$39,077
$36,901$33,565$31,677$29,810
$27,701$22,843$21,795$21,537$20,809
ManagementArchitecture & Engineering
LegalLife, Physical & Social Science
Healthcare Practitioners & TechnicalComputer & Mathematical
Business & Financial OperationsEducation, Training & Library
Arts, Entertain., MediaInstallation, Maintenance & Repair
Total All OccupationsCommunity & Social Services
Construction & ExtractionProtective Service
ProductionTransportation & Material Moving
Office & Admin. SupportSales & Related
Healthcare SupportBuilding & Grounds Clean/Maint.
Farming, Fishing & ForestryPersonal Care & Service
Food Prep & Serving
Mean Wage of OccupationsNew Mexico, 2012
Blue-colored categories represent those with a wage above the all-occupation average. Source: Occupational Employment Statistics (OES)
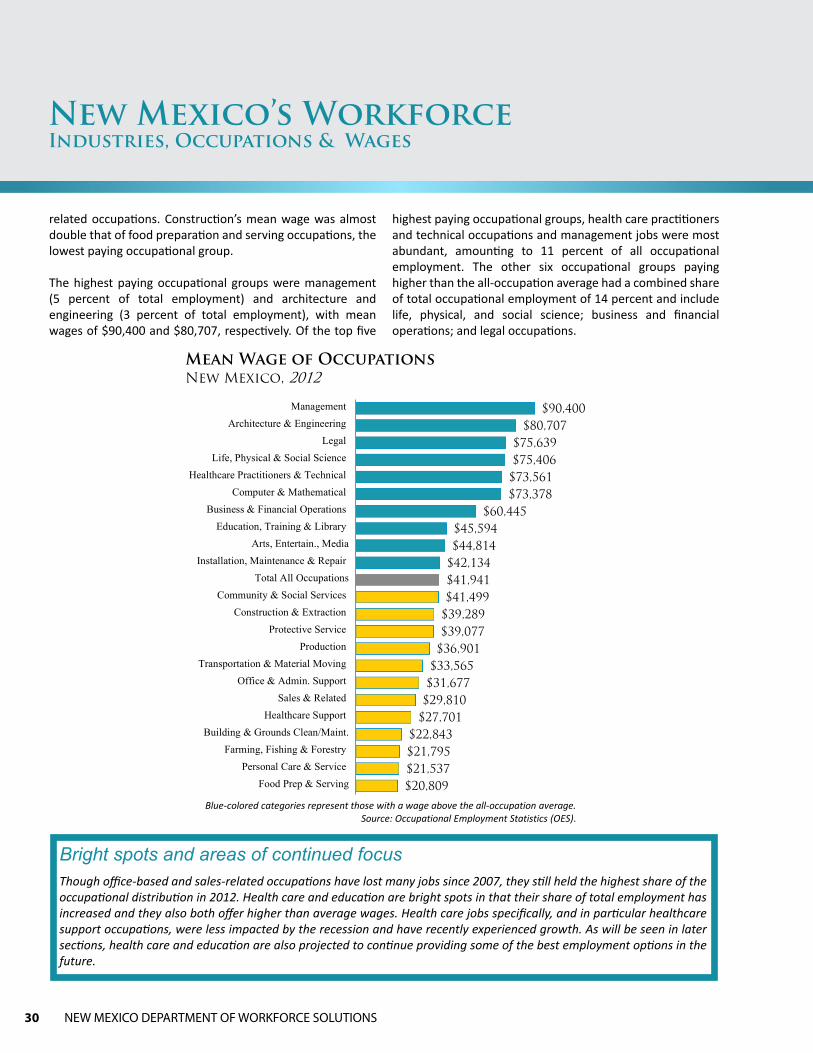
related occupations. Construction’s mean wage was almost double that of food preparation and serving occupations, the lowest paying occupational group.
The highest paying occupational groups were management (5 percent of total employment) and architecture and engineering (3 percent of total employment), with mean wages of $90,400 and $80,707, respectively. Of the top five
highest paying occupational groups, health care practitioners and technical occupations and management jobs were most abundant, amounting to 11 percent of all occupational employment. The other six occupational groups paying higher than the all-occupation average had a combined share of total occupational employment of 14 percent and include life, physical, and social science; business and financial operations; and legal occupations.

STATE OF THE WORKFORCE 2014 31
In 2012, New Mexico was home to a less educated populace than the surrounding states and the nation, on average. About 86 percent of the general population and 88 percent of the labor force had at least a high school degree or equivalent, meaning that 12 percent of the labor force had not attained that level of education. This is higher than the national average of 9.4 percent. Additionally, 29.5 percent of the New Mexico labor force had achieved a bachelor’s degree or higher. This is lower than both national and regional averages.
New Mexico’s labor force, however, may be aptly suited to the demands and needs of the state occupations and industries. Although 30 percent of New Mexico’s workforce has attained a bachelor’s degree or higher, a smaller percentage of extant jobs within the state actually require that level of education
upon entry into the job. Therefore, a number of workers may be employed in positions that do not demand the degree of education they have earned. Additionally, there are a greater number of low-skill jobs, requiring a high school diploma or less, than there are workers with that level of education. It is possible that by and large, the New Mexican population is attaining the education necessary to get jobs within the state. However, it may also be true that lower education levels are not helping to attract new, high-skill jobs to the state. In addition, while education level is often a major indicator of the skills a person possesses, it is not always reflective of the entire skill set needed for a particular position. Just as required education level varies by occupation, skills required vary by geography, employer, and job.
New Mexico’s WorkforceSkills & Education
Educational Attainment of the Population & Labor Force“While educational attainment data indicates that the current labor force may have the requisite education needed based on the composition of jobs in the current labor market, lower educational attainment, coupled with lower graduation rates, as compared to neighboring state and the nation, place New Mexico at a competitive disadvantage in attracting new businesses and supporting home-grown businesses within the state.”
14.0
%
26.4
% 33.7
%
25.9
%
11.6
% 24.9
% 33.9
%
29.5
%
0%
10%
20%
30%
40%
Less than HighSchool
High School Some College orAssociate's Degree
Bachelor's Degree orHigher
% of Population % of Labor Force Source: U.S. Census Bureau For population 25 to 64.
Data is for civilian labor force, as military has specific educational requirements that may impact analysis.
Educational Attainment for the Population & Labor ForceNew Mexico, 2012
32 NEW MEXICO DEPARTMENT OF WORKFORCE SOLUTIONS
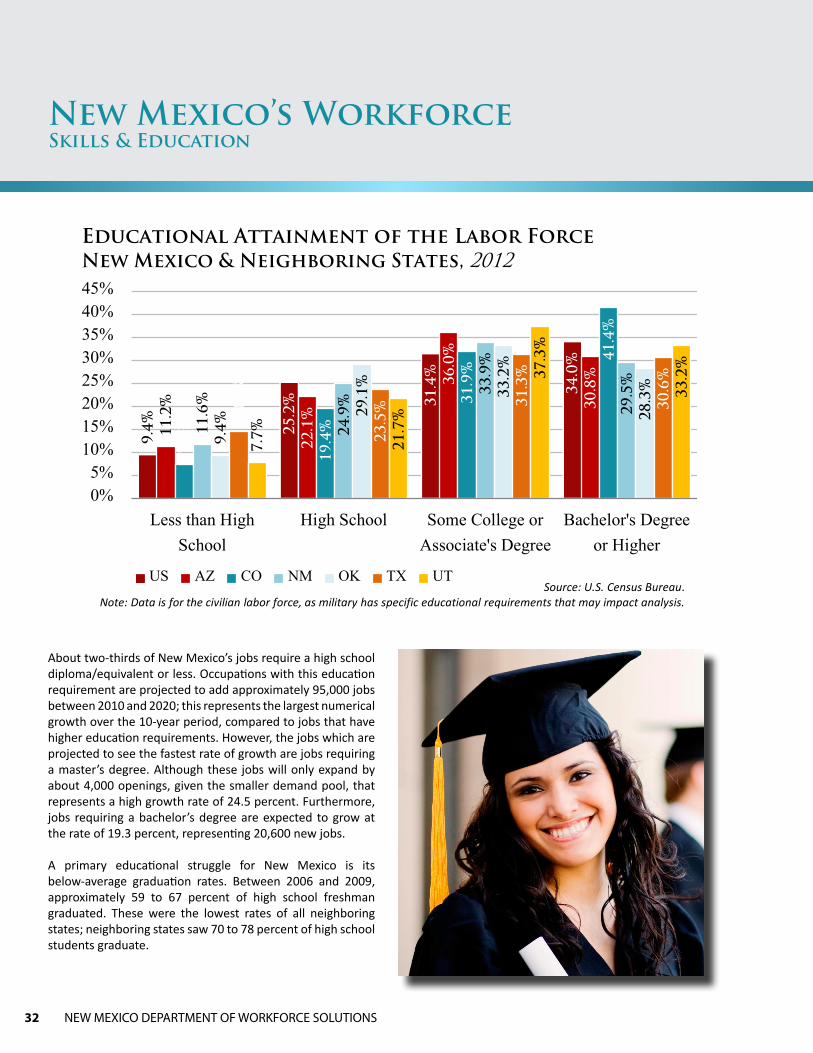
About two-thirds of New Mexico’s jobs require a high school diploma/equivalent or less. Occupations with this education requirement are projected to add approximately 95,000 jobs between 2010 and 2020; this represents the largest numerical growth over the 10-year period, compared to jobs that have higher education requirements. However, the jobs which are projected to see the fastest rate of growth are jobs requiring a master’s degree. Although these jobs will only expand by about 4,000 openings, given the smaller demand pool, that represents a high growth rate of 24.5 percent. Furthermore, jobs requiring a bachelor’s degree are expected to grow at the rate of 19.3 percent, representing 20,600 new jobs.
A primary educational struggle for New Mexico is its below-average graduation rates. Between 2006 and 2009, approximately 59 to 67 percent of high school freshman graduated. These were the lowest rates of all neighboring states; neighboring states saw 70 to 78 percent of high school students graduate.
New Mexico’s WorkforceSkills & Education
9.4% 25
.2% 31
.4%
34.0
%
11.2
%
22.1
%
36.0
%
30.8
%
7.3%
19.4
%
31.9
%
41.4
%
11.6
%
24.9
%
33.9
%
29.5
%
9.4%
29.1
%
33.2
%
28.3
%
14.6
%
23.5
% 31.3
%
30.6
%
7.7%
21.7
%
37.3
%
33.2
%
0%5%
10%15%20%25%30%35%40%45%
Less than HighSchool
High School Some College orAssociate's Degree
Bachelor's Degreeor Higher
US AZ CO NM OK TX UTSource: U.S. Census Bureau
Note: Data is for the civilian labor force, as military has specific educational requirements that may impact analysis.
Educational Attainment of the Labor ForceNew Mexico & Neighboring States, 2012

STATE OF THE WORKFORCE 2014 33
New Mexico’s WorkforceSkills & Education
Less than HS 30%
HS Diploma/Equiv.
41%
Some College, No Degree 1%
Postsec. Non-Degree Award 4%
Associate's 6%
Bachelor's 13%
Doctoral/Prof. 3%Master's 2%
Employment by Educational RequirementNew Mexico, 2010
Source: NMDWS.
20.7
%
12.0
%
11.7
%
15.2
%
13.7
% 18.2
%
19.3
% 24.5
%
0.0%5.0%
10.0%15.0%20.0%25.0%
Less
than
HS
HS
Dip
lom
a/Eq
uiv.
Som
e Co
llege
,N
o D
egre
e
Post
sec.
, Non
-D
egre
e A
war
d
Ass
ocia
te's
Bac
helo
r's
Doc
tora
l/Pro
f.
Mas
ter's
Employment Growth by Educational Attainment RequiredNew Mexico, 2010-2020
Source: NMDWS.

34 NEW MEXICO DEPARTMENT OF WORKFORCE SOLUTIONS
Education and continuing challengesThe educational attainment of the labor force is one of the most important factors in the continuing economic development of the state and its business environment. Businesses that seek to recruit highly educated professionals look to put down roots in states and communities that support a labor force with the requisite education level. New Mexico may currently be positively situated in equilibrium, wherein the majority of jobs do not require a bachelor’s degree or higher and, in turn, the majority of the labor force has not attained one, but projected economic trends threaten this state of balance. Jobs requiring a bachelor’s degree or higher are projected to grow faster than jobs requiring a high school degree or less. Future efforts should consider methods of improving high school graduation rates and educational attainment, in general, to ensure that the future workforce can serve as a major asset in the attraction and development of new businesses alongside improving the employment opportunities for New Mexico’s workers.
New Mexico’s WorkforceSkills & Education
69.6
70.7
72.576
.6
75.4
77.6
59.1 66
.8
64.8
77.8
78.0
77.3
71.9
73.1
75.4
76.6
74.3 79
.4
0.0
10.0
20.0
30.0
40.0
50.0
60.0
70.0
80.0
2006-2007 2007-2008 2008-2009
Average Freshman Graduation RateNew Mexico, 2006-2009
AZ CO NM OK TX UTData represents an estimate of the percentage of an entering freshman class graduating in 4 years.
Source: National Center for Education Statistics.

STATE OF THE WORKFORCE 2014 35
The New Mexico economy is projected to gain about 136,300 jobs between 2010 and 2020, with employment growing from 855,300 to 991,600 jobs. This represents a growth rate of approximately 15.9 percent, which is slightly higher than the projected national growth rate of 14.3 percent for the same period. Job growth for 2008-2018 was previously
projected to be 8.2 percent, thus indicating an upward trend in projected employment, likely in part due to the improving economic conditions within the state. About 342,000 job openings due to growth and replacements are projected to occur between 2010 and 2020.
New Mexico’s WorkforceThe Future Workforce
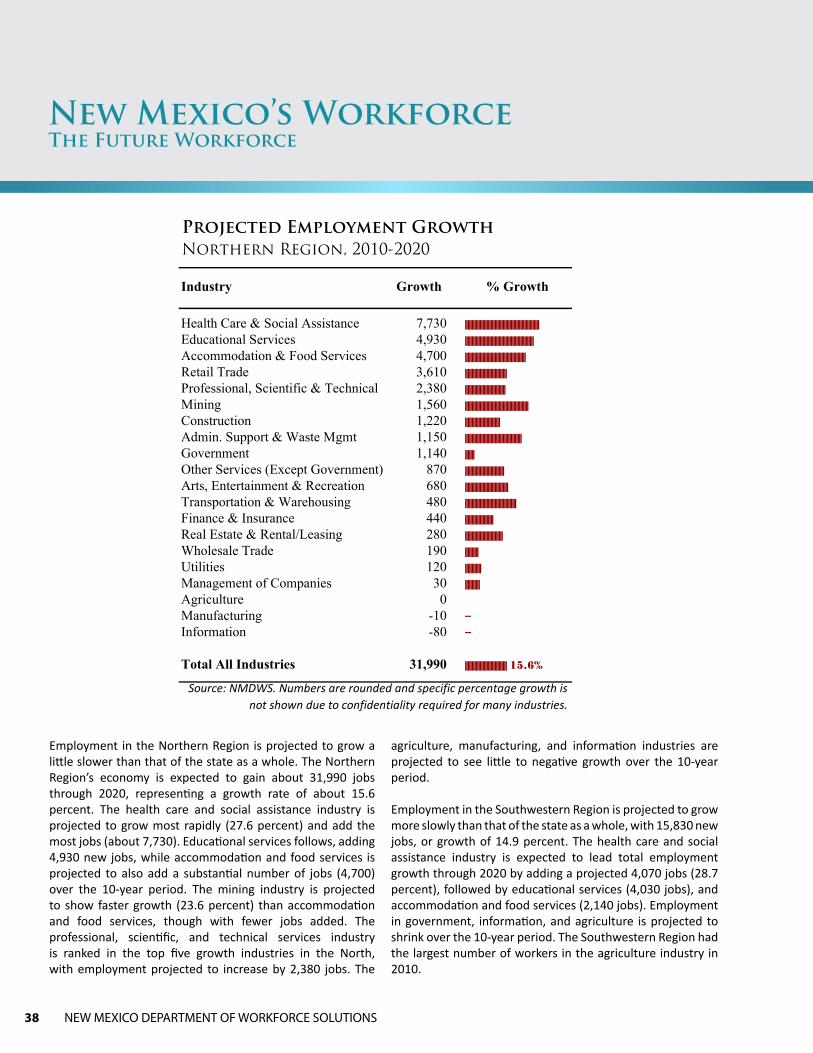
Projected Employment Growth in New Mexico’s Industries“Employment within New Mexico is projected to grow more quickly than that of the nation according to 2010-2020 projections. The health care and educational services industries are projected to offer the largest number of new job opportunities by 2020, as well as being two of the largest growth industries across all four regions.”
Projected Employment GrowthNew Mexico, 2010-2020
Industry Growth % Growth
Health Care & Social Assistance 32,430 ||||||||||||||||||||||||||||||||||||||||||||||||||||||||Educational Services 20,850 |||||||||||||||||||||||||||||||||||||||||||||||||||Accommodation & Food Services 18,800 |||||||||||||||||||||||||||||||||||||||||||||||Retail Trade 15,030 |||||||||||||||||||||||||||||||||Admin. Support & Waste Mgmt 8,760 ||||||||||||||||||||||||||||||||||||||||||Professional, Scientific & Technical 8,240 ||||||||||||||||||||||||||||||Construction 6,030 ||||||||||||||||||||||||||Government 5,820 ||||||||||||Mining 4,790 ||||||||||||||||||||||||||||||||||||||||||||||||||||Other Services (Except Government) 3,020 ||||||||||||||||||||||||||||Transportation & Warehousing 2,890 |||||||||||||||||||||||||||||||||Finance & Insurance 2,210 ||||||||||||||||||||Arts, Entertainment & Recreation 1,960 |||||||||||||||||||||||||||||||Real Estate & Rental/Leasing 1,380 ||||||||||||||||||||||||||||Wholesale Trade 1,190 ||||||||||Management of Companies 280 |||||||||||Utilities 270 ||||||||||||Agriculture 140 ||Information 40Manufacturing -430 --
Total All Industries 136,300 ||||||||||||||||||||||||||||||| 15.9%
Source: NMDWS. Numbers are rounded and specific percentage growth is not shown due to confidentiality required for many industries.

36 NEW MEXICO DEPARTMENT OF WORKFORCE SOLUTIONS
The health care and educational services industries are projected to provide the largest number of new jobs and grow the fastest. Health care is projected to add 32,430 jobs, which is a 28.1 percent increase, followed by educational services, which is projected to add 20,850 jobs (a 25.8 percent increase). Accommodation and food services and retail trade are also projected to add a large number of jobs. Employment in the mining industry is projected to continue to grow quickly, with employment growth of 26.0 percent over the 10-year period. Accommodation and food services; educational services; and administrative, support, and waste management are all projected to grow by over 20 percent.
Manufacturing is the only industry that is projected to see employment decline in New Mexico.
The Central Region’s economy is expected to generate about 61,320 new jobs due to growth and recovery through the year 2020. This represents a growth rate of about 15.8 percent, which is similar to that of the state. The health care and social assistance industry is projected to lead the growth by adding the most new jobs (about 15,450) and growing the fastest (28.0 percent). The educational services and accommodation and food services industries are both projected to grow significantly (25.8 percent and 24.1 percent, respectively).
New Mexico’s WorkforceThe Future Workforce
Projected Employment GrowthCentral Region, 2010-2020
Industry Growth % Growth
Health Care & Social Assistance 15,450 |||||||||||||||||||||||||||||||||||||||||||||||||||||||Accommodation & Food Services 8,650 ||||||||||||||||||||||||||||||||||||||||||||||||Educational Services 8,640 |||||||||||||||||||||||||||||||||||||||||||||||||||Retail Trade 6,790 |||||||||||||||||||||||||||||||||Admin. Support & Waste Mgmt 5,250 ||||||||||||||||||||||||||||||||||||||||||Professional, Scientific & Technical 4,380 ||||||||||||||||||||||||||||||Construction 2,780 ||||||||||||||||||||||||||Government 2,140 ||||||||||||Other Services (Except Government) 1,410 ||||||||||||||||||||||||||||Transportation & Warehousing 1,330 |||||||||||||||||||||||||||||||||Finance & Insurance 1,130 ||||||||||||||||||||Arts, Entertainment & Recreation 910 |||||||||||||||||||||||||||||||Real Estate & Rental/Leasing 730 ||||||||||||||||||||||||||||Wholesale Trade 660 ||||||||||Management of Companies 180 |||||||||||Information 180 ||||Mining 60 |||||||||||||||||||||||||||||||||||||||||||||||Utilities 60 ||||||||||||Agriculture 10 |Manufacturing -870 --
Total All Industries 59,020 |||||||||||||||||||||||||||||| 15.2%
Source: NMDWS. Numbers are rounded and specific percentage growth is not shown due to confidentiality required for many industries.

STATE OF THE WORKFORCE 2014 37
Employment in manufacturing is projected to decline by 5 percent, losing around 870 jobs over the 10-year period. Growth in government is the largest out of all the regions (6.1 percent) and is similar to that of the state as a whole (6.2 percent).
The Eastern Region is expected to gain about 22,190 jobs through 2020. This represents a growth rate of about 16.1 percent, demonstrating slightly faster employment growth than that of the state as a whole. The health care and social assistance industry is projected to lead total employment
growth through 2020 by adding 4,580 jobs, representing a growth rate of 28.4 percent. Educational services and accommodation and food services follow, with both industries projected to add around 3,200 new jobs. Mining employment is projected to grow more quickly in the Eastern Region than any other, adding 2,950 jobs between 2010 and 2020, mostly due to oil and gas extraction. The corresponding chart shows industries in order of employment growth, from the industry with the greatest number of new jobs, to that with the fewest. All of the industries in the Eastern Region are projected to grow over the 10-year period.
New Mexico’s WorkforceThe Future Workforce
Projected Employment GrowthEastern Region, 2010-2020
Industry Growth % Growth
Health Care & Social Assistance 4,580 ||||||||||||||||||||||||||||||||||||||||||||||||||||||||Educational Services 3,200 |||||||||||||||||||||||||||||||||||||||||||||||||||Accommodation & Food Services 3,200 |||||||||||||||||||||||||||||||||||||||||||||||Mining 2,950 ||||||||||||||||||||||||||||||||||||||||||||||||||||||||Retail Trade 2,650 |||||||||||||||||||||||||||||||||||Construction 1,010 ||||||||||||||||||||||||||Admin. Support & Waste Mgmt 990 ||||||||||||||||||||||||||||||||||||||||||Transportation & Warehousing 750 |||||||||||||||||||||||||||||||||||||||||Professional, Scientific & Technical 540 ||||||||||||||||||||||||||||||Other Services (Except Government) 480 ||||||||||||||||||||||||||||||Finance & Insurance 340 ||||||||||||||||||||Real Estate & Rental/Leasing 240 |||||||||||||||||||||||||||||||Arts, Entertainment & Recreation 210 ||||||||||||||||||||||||||||||||Agriculture 200 ||||||||Manufacturing 190 |||||||||Wholesale Trade 170 |||||||||||Government 130 ||Utilities 60 ||||||||||||Management of Companies 40 |||||||||||Information 10 |
Total All Industries 22,190 |||||||||||||||||||||||||||||||| 16.1%
Source: NMDWS. Numbers are rounded and specific percentage growth is not shown due to confidentiality required for many industries.
38 NEW MEXICO DEPARTMENT OF WORKFORCE SOLUTIONS
Employment in the Northern Region is projected to grow a little slower than that of the state as a whole. The Northern Region’s economy is expected to gain about 31,990 jobs through 2020, representing a growth rate of about 15.6 percent. The health care and social assistance industry is projected to grow most rapidly (27.6 percent) and add the most jobs (about 7,730). Educational services follows, adding 4,930 new jobs, while accommodation and food services is projected to also add a substantial number of jobs (4,700) over the 10-year period. The mining industry is projected to show faster growth (23.6 percent) than accommodation and food services, though with fewer jobs added. The professional, scientific, and technical services industry is ranked in the top five growth industries in the North, with employment projected to increase by 2,380 jobs. The
agriculture, manufacturing, and information industries are projected to see little to negative growth over the 10-year period.
Employment in the Southwestern Region is projected to grow more slowly than that of the state as a whole, with 15,830 new jobs, or growth of 14.9 percent. The health care and social assistance industry is expected to lead total employment growth through 2020 by adding a projected 4,070 jobs (28.7 percent), followed by educational services (4,030 jobs), and accommodation and food services (2,140 jobs). Employment in government, information, and agriculture is projected to shrink over the 10-year period. The Southwestern Region had the largest number of workers in the agriculture industry in 2010
New Mexico’s WorkforceThe Future Workforce
Projected Employment GrowthNorthern Region, 2010-2020
Industry Growth % Growth
Health Care & Social Assistance 7,730 |||||||||||||||||||||||||||||||||||||||||||||||||||||||Educational Services 4,930 |||||||||||||||||||||||||||||||||||||||||||||||||||Accommodation & Food Services 4,700 |||||||||||||||||||||||||||||||||||||||||||||Retail Trade 3,610 |||||||||||||||||||||||||||||||Professional, Scientific & Technical 2,380 ||||||||||||||||||||||||||||||Mining 1,560 |||||||||||||||||||||||||||||||||||||||||||||||Construction 1,220 ||||||||||||||||||||||||||Admin. Support & Waste Mgmt 1,150 ||||||||||||||||||||||||||||||||||||||||||Government 1,140 |||||||Other Services (Except Government) 870 |||||||||||||||||||||||||||||Arts, Entertainment & Recreation 680 ||||||||||||||||||||||||||||||||Transportation & Warehousing 480 ||||||||||||||||||||||||||||||||||||||Finance & Insurance 440 |||||||||||||||||||||Real Estate & Rental/Leasing 280 ||||||||||||||||||||||||||||Wholesale Trade 190 ||||||||||Utilities 120 ||||||||||||Management of Companies 30 |||||||||||Agriculture 0Manufacturing -10 --Information -80 --
Total All Industries 31,990 ||||||||||||||||||||||||||||||| 15.6%
Source: NMDWS. Numbers are rounded and specific percentage growth is not shown due to confidentiality required for many industries.
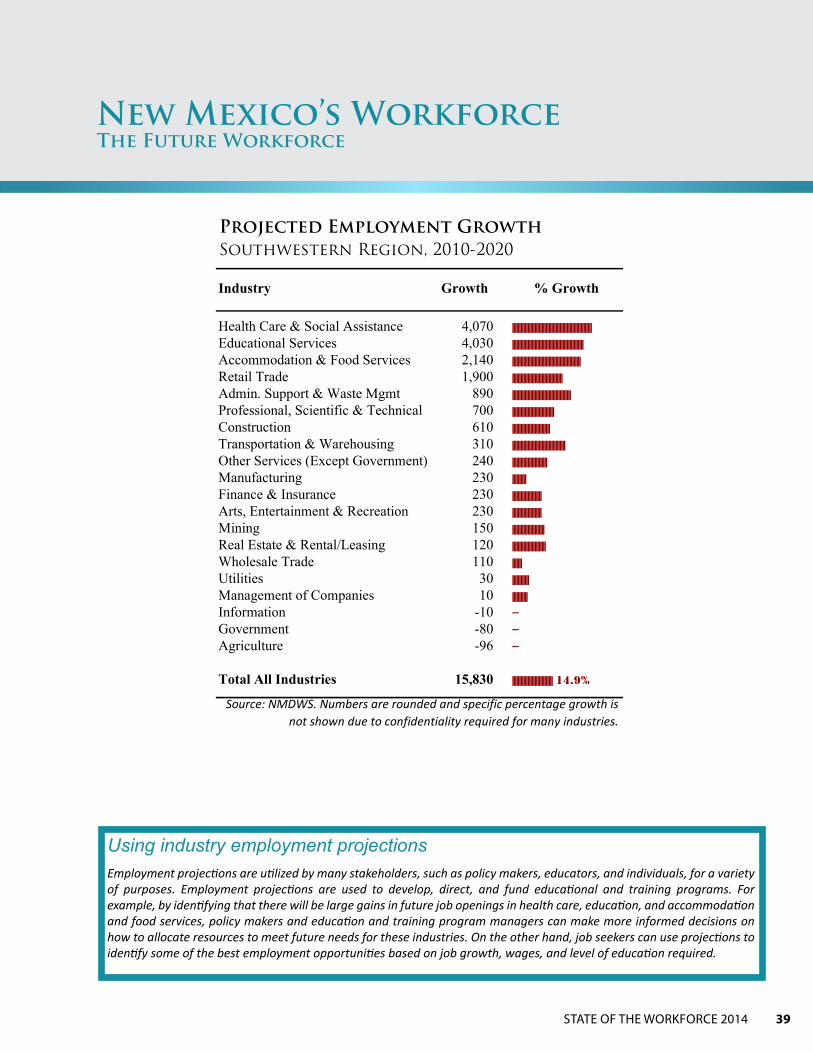
STATE OF THE WORKFORCE 2014 39
Using industry employment projectionsEmployment projections are utilized by many stakeholders, such as policy makers, educators, and individuals, for a variety of purposes. Employment projections are used to develop, direct, and fund educational and training programs. For example, by identifying that there will be large gains in future job openings in health care, education, and accommodation and food services, policy makers and education and training program managers can make more informed decisions on how to allocate resources to meet future needs for these industries. On the other hand, job seekers can use projections to identify some of the best employment opportunities based on job growth, wages, and level of education required.
New Mexico’s WorkforceThe Future Workforce
Projected Employment GrowthSouthwestern Region, 2010-2020
Industry Growth % Growth
Health Care & Social Assistance 4,070 |||||||||||||||||||||||||||||||||||||||||||||||||||||||||Educational Services 4,030 |||||||||||||||||||||||||||||||||||||||||||||||||||Accommodation & Food Services 2,140 |||||||||||||||||||||||||||||||||||||||||||||||||Retail Trade 1,900 ||||||||||||||||||||||||||||||||||||Admin. Support & Waste Mgmt 890 ||||||||||||||||||||||||||||||||||||||||||Professional, Scientific & Technical 700 ||||||||||||||||||||||||||||||Construction 610 |||||||||||||||||||||||||||Transportation & Warehousing 310 ||||||||||||||||||||||||||||||||||||||Other Services (Except Government) 240 |||||||||||||||||||||||||Manufacturing 230 ||||||||||Finance & Insurance 230 |||||||||||||||||||||Arts, Entertainment & Recreation 230 |||||||||||||||||||||Mining 150 |||||||||||||||||||||||Real Estate & Rental/Leasing 120 ||||||||||||||||||||||||Wholesale Trade 110 |||||||Utilities 30 ||||||||||||Management of Companies 10 |||||||||||Information -10 --Government -80 --Agriculture -96 --
Total All Industries 15,830 ||||||||||||||||||||||||||||| 14.9%
Source: NMDWS. Numbers are rounded and specific percentage growth is not shown due to confidentiality required for many industries.

40 NEW MEXICO DEPARTMENT OF WORKFORCE SOLUTIONS
Between 2010 and 2020, employment is projected to grow by about 136,300 jobs, or 15.9 percent. Employment growth in food preparation and serving occupations is projected to account for the highest share (about 12 percent) of total growth across all occupations. The occupational group is projected to add 16,920 new jobs, reflecting an increase of 23.2 percent.
Employment growth in education, training, and library occupations follows that of food preparation and serving jobs, with 14,170 new jobs projected to be added, at an overall growth rate of 26.0 percent, 2.8 percentage points higher than that of food preparation and serving. The personal care and service occupational group is also projected to add a high number of jobs (12,940) and add those jobs at a fast rate (30.8 percent). These top four occupational groups, along with office and administrative support occupations, account for over 40 percent of total growth combined.
With both healthcare practitioners and technicians and healthcare support occupational categories combined, we see that health care occupations are projected to add 18,550 new jobs. Healthcare support, alone, is projected to grow by 31.7 percent, the fastest growth rate across all occupational groups. Computer and mathematical occupations are projected to grow the fastest of the occupations projected to contribute less than 5 percent of total growth over the 10-year period.
Using occupational employment projectionsSimilar to industry employment projections, occupational employment projections are used to inform policy decisions on education, training, and resource allocation. They also provide information for job seekers to engage in focused career exploration. Occupational projections are often found to be very relevant inasmuch as they refer to specific job-related tasks and skills. Many of the projected future jobs will be in occupations that typically have large employment. These occupations, however, often offer lower-than-average wages, such as food preparation and serving; office and administrative support; and sales occupations. There are occupations, however, that are projected to provide many future jobs along with better wages. The next section of this report looks at some of these top occupations within New Mexico.
New Mexico’s WorkforceThe Future Workforce
Projected Occupational Employment Growth“Food preparation and serving occupations are projected to grow the most of all occupations in New Mexico, while the fastest employment growth is projected to occur mostly in education, as well as health care- and personal care-related occupations.”

STATE OF THE WORKFORCE 2014 41
New Mexico’s WorkforceThe Future Workforce
Projected Occupational Employment GrowthNew Mexico, 2010-2020
Occupation Group Growth Mean Wage2012
Food Prep & Serving 16,920 23.2% |||||||||||||||||||||||||||||||||||||||||||||| $20,808.57Education, Training & Library 14,170 26.0% |||||||||||||||||||||||||||||||||||||||||||||||||||| $45,594.06Personal Care & Service 12,940 30.8% ||||||||||||||||||||||||||||||||||||||||||||||||||||||||||||| $21,537.27Office & Admin. Support 12,700 10.2% |||||||||||||||||||| $31,677.35Sales & Related 12,000 14.4% |||||||||||||||||||||||||||| $29,809.93Healthcare Practitioners & Technical 9,970 21.7% ||||||||||||||||||||||||||||||||||||||||||| $73,560.72HealthCare Support 8,580 31.7% ||||||||||||||||||||||||||||||||||||||||||||||||||||||||||||||| $27,700.90Construction & Extraction 7,960 12.4% |||||||||||||||||||||||| $39,289.07Transportation & Material Moving 6,560 14.3% |||||||||||||||||||||||||||| $33,564.74Business & Financial Operations 4,830 16.9% ||||||||||||||||||||||||||||||||| $60,445.22Building & Grounds Clean/Maint. 4,760 14.1% |||||||||||||||||||||||||||| $22,842.87Installation, Maintenance & Repair 4,680 13.6% ||||||||||||||||||||||||||| $42,133.74Management 3,920 7.0% |||||||||||||| $90,400.10Protective Service 3,160 13.4% |||||||||||||||||||||||||| $39,076.79Computer & Mathematical 3,000 21.6% ||||||||||||||||||||||||||||||||||||||||||| $73,378.26Community & Social Services 2,810 17.3% |||||||||||||||||||||||||||||||||| $41,498.91Architecture & Engineering 2,460 11.5% ||||||||||||||||||||||| $80,706.96Life, Physical & Social Science 2,070 14.6% ||||||||||||||||||||||||||||| $75,405.56Production 1,590 5.4% |||||||||| $36,901.32Arts, Entertain., Media 770 7.1% |||||||||||||| $44,813.55Farming, Fishing & Forestry 250 3.4% |||||| $21,794.73Legal 210 4.0% |||||||| $75,638.70
Total All Occupations 136,300 15.9% ||||||||||||||||||||||||||||||| $41,940.57
Source: NMDWS and Occupational Employment Statistics (OES), growth numbers are rounded.
% Growth

42 NEW MEXICO DEPARTMENT OF WORKFORCE SOLUTIONS
NMDWS ER&A used employment projections and wage data to identify some of the best occupational opportunities within New Mexico. ER&A prepares a listing of occupations for each region and MSA that identifies jobs that are not only projected to have higher annual openings, but also pay higher than the median wage for the area. An occupation’s place on the top jobs list is based on the combination of its rankings with respect to projected annual job openings, rate of job growth, and median wage. These jobs are classified within a star-rating system and are listed as the best job opportunities for the projection period. According to this methodology, registered nurses and elementary and middle school teachers are some of the best occupational opportunities in New Mexico. These three occupations are projected to add 1,410 jobs, on average, annually between 2010 and 2020. All three occupations have growth rates of over 25 percent and offer wages that are at least 25 percent above the all-occupation average. Other health care and education occupations such as clinical, counseling, and school psychologists; secondary school teachers; special education teachers; other teachers and instructors; licensed practical and vocational nurses;
other postsecondary teachers; kindergarten teachers; child, family, and school social workers; mental health and substance abuse social workers; and dental assistants fall within 4-Star and 3-Star occupations and are anticipated to provide good employment and wage opportunities in the future
There are several top occupations that fall within administration and business, including management analysts; other managers; business operations specialists; supervisors and managers of office workers; administrative service managers; and bill and account collectors. Additionally, the first three of these occupations pay an average wage of above $70,000 a year. The mining industry is projected to experience fast growth statewide, and that growth will provide several good opportunities for workers in that industry. Oil and gas roustabouts; service unit operators; truck drivers; managers of construction trades and extraction workers; welders, cutters, solderers and brazers; and operating engineers and other construction equipment operators are all listed as top jobs
Using information on New Mexico’s top jobsWhen an individual is searching for a new career, several factors contribute to him/her deciding upon which available opportunities to focus. Some job seekers consider income to be the most important thing, and their career choices will depend on an assessment of wages and salary differences. For others, career considerations such as job flexibility, work environment, and location may be far more important than income. The bottom line is, of course, to find a suitable job. This is where occupational projections can be so useful. Information on the best occupational opportunities not only provide job seekers and students with additional information to guide their career choices, but give a better understanding of some of the things they should be considering throughout their exploration. Occupational projections allow them to identify occupations that are projected to have more future employment opportunities (i.e. job openings), and occupations that pay better wages.
New Mexico’s WorkforceThe Future Workforce
New Mexico’s “TOP” Occupations“New Mexico’s top jobs, in terms of employment growth and wages, range across various industries and have diverse educational, work experience, and job training requirements. Over half of the top occupations are in health care and education.”

STATE OF THE WORKFORCE 2014 43
New Mexico’s WorkforceThe Future Workforce
OccupationJob
OpeningsRate Entry Average
Exper-ienced
EducationWork
Experience Training
5-STAR Registered Nurses 670 2 3% $51,590 $67,620 $75,630 Associate's None NoneElementary School Teachers, Ex. Special Edu. 500 2 6% $38,290 $52,310 $59,340 Bachelor's None InternshipMiddle School Teachers, Ex. Special & Vocational Edu. 240 2 6% $38,560 $53,290 $60,650 Bachelor's None InternshipClinical, Counseling & School Psychologists 170 1 8% $46,830 $68,690 $79,620 Doctorate None InternshipSoftware Developers, Systems Software 80 2 9% $70,810 $99,650 $114,070 Bachelor's None NoneManagement Analysts 130 1 9% $41,230 $71,270 $86,290 Bachelor's 1 to 5 yrs NoneSecondary School Teachers, Ex. Special & Vocational Edu. 270 1 7% $37,570 $51,470 $58,430 Bachelor's None InternshipRoustabouts, Oil & Gas 180 3 4% $25,960 $37,260 $42,900 Less than HS None Moderate-Term OJTSpecial Education Teachers, P-K & Elementary* 100 2 9% $38,170 $52,200 $59,220 Bachelor's None InternshipManagers, All Other 150 1 3% $46,070 $80,340 $97,460 High School 1 to 5 yrs None
4-STAREngineers, All Other 110 1 5% $72,040 $113,640 $134,440 Bachelor's None NoneService Unit Operators--Oil, Gas & Mining 90 2 7% $37,110 $52,230 $59,790 Less than HS None Moderate-Term OJTTruck Drivers, Heavy & Tractor-Trailer 340 1 7% $26,910 $38,990 $45,020 High School 1 to 5 yrs Short-Term OJTSpvs/Mgrs of Construction Trades Extraction Workers 220 1 3% $36,900 $57,010 $67,070 High School More than 5 yrs NoneBusiness Operations Specialists, All Other 140 1 6% $33,790 $63,850 $78,870 High School Less than 1 yr Long-Term OJTTeachers & Instructors, All Other 120 2 1% $25,760 $51,170 $63,880 Bachelor's None NoneLicensed Practical & Licensed Vocational Nurses 200 1 6% $38,060 $47,630 $52,420 Postsec. Award None NoneComputer Support Specialists* 140 1 7% $30,720 $48,840 $57,900 Some College None Moderate-Term OJTPostsecondary Teachers, All Other* 80 2 6% $29,920 $52,440 $63,710 Master's None NoneSpvs/Mgrs of Office & Administrative Support Workers 410 1 4% $30,380 $46,290 $54,250 High School 1 to 5 yrs None
3-STARAdministrative Services Managers 110 1 4% $47,740 $75,710 $89,700 High School 1 to 5 yrs NoneKindergarten Teachers, Ex. Special Edu. 80 2 6% $33,730 $46,700 $53,180 Bachelor's None InternshipFitness Trainers & Aerobics Instructors 90 2 6% $18,970 $33,950 $41,430 High School None Short-Term OJTWelders, Cutters, Solderers & Brazers 100 1 6% $28,420 $43,820 $51,510 High School Less than 1 yr Moderate-Term OJTChild, Family & School Social Workers 90 1 6% $26,940 $44,400 $53,130 Master's None NoneAutomotive Service Technicians & Mechanics 180 1 2% $23,990 $37,730 $44,620 High School None Long-Term OJTOperating Engineers & Other Construction Equip. Optrs 150 1 3% $29,790 $40,230 $45,460 High School None Moderate-Term OJTBill & Account Collectors 100 1 6% $26,350 $36,160 $41,070 High School None Moderate-Term OJTMental Health & Substance Abuse Social Workers 80 1 5% $31,210 $42,570 $48,260 Bachelor's None NoneDental Assistants 80 1 5% $24,190 $32,580 $36,780 Postsec. Award None None
Top Occupations in New Mexico
Average Annual Growth (2010-20)
Annual Wage(2012)
What You Need to Enter intoa Job in this Occupation
Source: NMDWS, Occupational Employment Statistics (OES) program, 2012, unless otherwise noted.* Wage data is from 2011 as opposed to 2012 due to data limitations.Other Notes: Openings and wages are rounded. "OJT" refers to On-the-Job Training.Methodology: All listed occupations meet the same criteria--total annual openings are greater than 70, employment growth is greater than the median for all occupations, and the median wage is greater
than that for all occupations. The order in which occupations are listed is based on a weighted measurement of all three criteria. The higher ranked the occupation is in all three criteria, the more it is categorized as a top occupation.

New Mexico Department of Workforce Solutions
P.O. Box 1928
Albuquerque, NM 87102
www.dws.state.nm.us