Embed Size (px)
Citation preview
T h e o p e n – a c c e s s j o u r n a l f o r p h y s i c s
New Journal of Physics
Structural, chemical and magnetic properties
of secondary phases in Co-doped ZnO
A Ney1,5
, A Kovacs2,4
, V Ney1, S Ye
1, K Ollefs
1, T Kammermeier
1,
F Wilhelm3, A Rogalev
3and R E Dunin-Borkowski
2,4
1 Fakultat fur Physik and CeNIDE, Universitat Duisburg-Essen, Lotharstrasse 1,D-47057 Duisburg, Germany2 Center for Electron Nanoscopy, Technical University of Denmark, DK-2800Kgs Lyngby, Denmark3 European Synchrotron Radiation Facility (ESRF), 6 Rue Jules Horowitz,BP 220, 38043 Grenoble Cedex, France4 Ernst Ruska-Centre for Microscopy and Spectroscopy with Electrons,Peter Grunberg Institute, Research Centre Julich, D-52425 Julich, GermanyE-mail: [email protected]
New Journal of Physics 13 (2011) 103001 (17pp)
Received 20 June 2011Published 3 October 2011Online at http://www.njp.org/doi:10.1088/1367-2630/13/10/103001
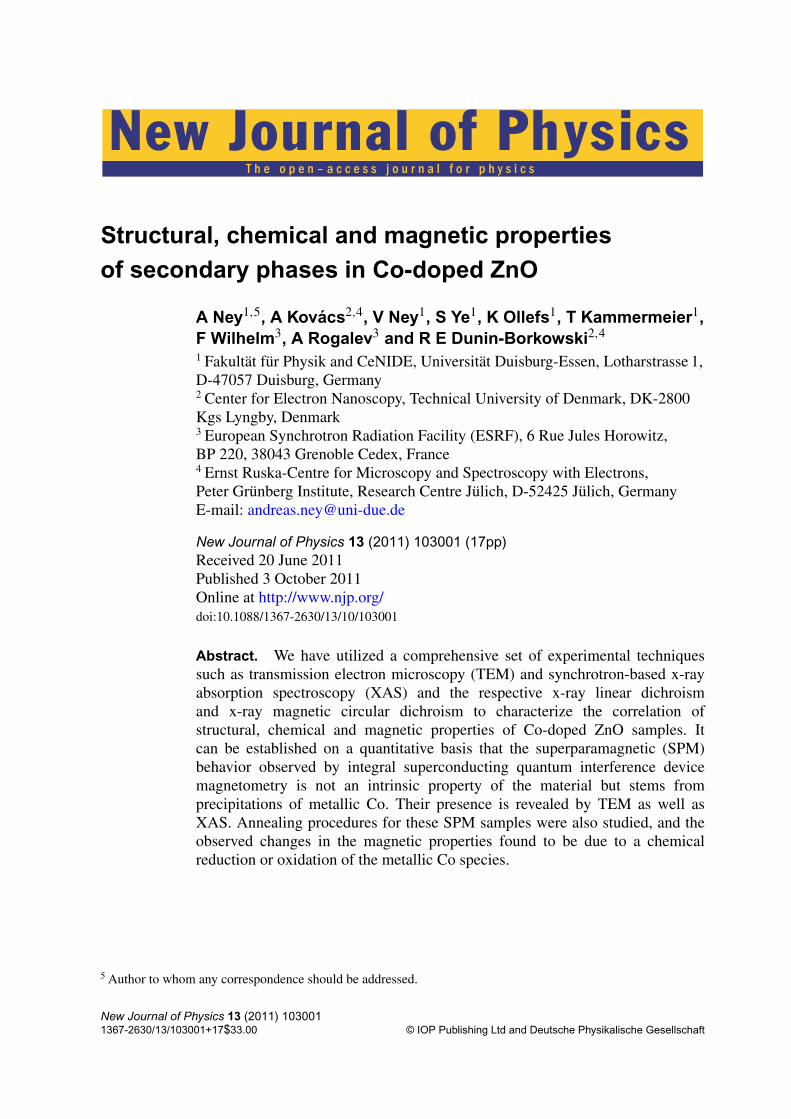
Abstract. We have utilized a comprehensive set of experimental techniquessuch as transmission electron microscopy (TEM) and synchrotron-based x-rayabsorption spectroscopy (XAS) and the respective x-ray linear dichroismand x-ray magnetic circular dichroism to characterize the correlation ofstructural, chemical and magnetic properties of Co-doped ZnO samples. Itcan be established on a quantitative basis that the superparamagnetic (SPM)behavior observed by integral superconducting quantum interference devicemagnetometry is not an intrinsic property of the material but stems fromprecipitations of metallic Co. Their presence is revealed by TEM as well asXAS. Annealing procedures for these SPM samples were also studied, and theobserved changes in the magnetic properties found to be due to a chemicalreduction or oxidation of the metallic Co species.
5 Author to whom any correspondence should be addressed.
New Journal of Physics 13 (2011) 103001
1367-2630/13/103001+17$33.00 © IOP Publishing Ltd and Deutsche Physikalische Gesellschaft
2
Contents
1. Introduction 22. Experimental details 3
2.1. Experimental techniques . . . . . . . . . . . . . . . . . . . . . . . . . . . . . 32.2. Sample overview . . . . . . . . . . . . . . . . . . . . . . . . . . . . . . . . . 5
3. Experimental results 53.1. Structural properties measured by transmission electron microscopy (TEM) . . 63.2. Annealing of the superparamagnetic, reactive magnetron sputtering (SPM-
RMS) sample . . . . . . . . . . . . . . . . . . . . . . . . . . . . . . . . . . . 73.3. Characterization using x-ray absorption spectroscopy . . . . . . . . . . . . . . 83.4. Elemental analysis using TEM . . . . . . . . . . . . . . . . . . . . . . . . . . 143.5. Origin of the SPM behavior . . . . . . . . . . . . . . . . . . . . . . . . . . . . 15
4. Conclusion 16Acknowledgments 16References 17
1. Introduction
In the past ten years, dilute magnetic semiconductors (DMS) based on oxide materials, andZn1−xCoxO (Co : ZnO) in particular, have raised high expectations as potentially exhibitingroom temperature ferromagnetism [1]. Since the first report [2] of ferromagnetism in Co :ZnO, sample quality and reproducibility have been issues, giving rise to a long sequenceof controversial publications, captured in many review articles (see, e.g., [3, 4]). An elegantapproach towards identifying the relevant mechanism for magnetic order in Co : ZnO isannealing experiments. It was shown that annealing Co : ZnO in a Zn (oxygen) atmospherecould reversibly switch on (off) the magnetic order, which was correlated with the increase(decrease) of the n-type carrier concentration [5]. In contrast, Zn-annealing had only a small,possibly extrinsic, influence on the magnetic properties of Co-ion-implanted ZnO substrates [6].Despite the persisting controversy [4], there is increasing experimental evidence that phase-pure Co : ZnO is intrinsically paramagnetic (PM) [3] with antiferromagnetic Co–O–Cointeractions [7, 8]. This conclusion is independent of the n-type carrier concentration aslong as the structural integrity is maintained, as recently demonstrated for Al-codoped Co :ZnO [9]. In particular, the use of synchrotron-based experimental techniques such as x-rayabsorption spectroscopy (XAS), and x-ray linear dichroism (XLD) and x-ray magnetic circulardichroism (XMCD), constitutes a powerful toolbox for a meaningful characterization of DMSmaterials [10]. For Co : ZnO, XAS in the hard x-ray regime has proven to be particularly usefulin establishing quantitative quality indicators to discriminate between phase-pure samples andthe onset of phase separation [11]. In contrast, when using soft x-rays the results remain lessconclusive. Integral superconducting quantum interference device (SQUID) magnetometry andelement-specific magnetometry using XMCD reveal a different magnetic behavior, i.e. theSQUID suggests ferromagnetism while the XMCD finds PM behavior of the Co [12]. Otherauthors report the absence of any remanent soft XMCD signal at any absorption edge of eachatomic species of Co : ZnO [13]. To account for these puzzling findings, the presence of defectsin Mn-doped ZnO was correlated with the observed ferromagnetism [14, 15], a conclusion
New Journal of Physics 13 (2011) 103001 (http://www.njp.org/)
3
that was recently corroborated by a novel theoretical explanation [16]. Usually, the long-rangemagnetic order is only evidenced by SQUID, e.g., in [2, 12, 13, 15]. On the other hand, thepresence of long-range magnetic order seen by SQUID could be correlated with the presenceof metallic Co precipitations using a combination of extended x-ray absorption fine-structurespectroscopy (EXAFS) and transmission electron microscopy (TEM) [17] on polycrystallinesamples and, for epitaxial films, using soft XMCD and TEM [18] or a combination of soft andhard x-rays [19]. Therefore, the microscopic origin of long-range magnetic order in Co : ZnO isstill under debate; hence further experimental efforts are necessary to unambiguously identifythe microscopic origin of the magnetic order seen in integral SQUID magnetometry.
Here we present a comprehensive study based on a combination of TEM, XAS andSQUID to investigate the structural and magnetic properties of PM Co : ZnO samples incomparison with superparamagnetic (SPM) samples. The XAS quality indicators that wereestablished earlier [11] will be correlated with an in-depth TEM analysis highlighting the highstructural quality of epitaxial PM Co : ZnO films. In addition, the structure of SPM samplesand the influence of annealing procedures on the magnetic properties can provide insight intothe microscopic origin of the magnetic response in SPM Co : ZnO samples. The annealingexperiments confirm that the changes in the magnetic properties are not due to a changein the carrier concentration but due to a reduction (oxidation) of a fraction of the Co thatis not substitutionally incorporated into the ZnO host crystal, corroborating earlier findingson polycrystalline Co : ZnO samples annealed in hydrogen [20]. In all the studied cases, themagnetic behavior as measured with integral SQUID magnetometry at room temperature canbe quantitatively correlated with the low-temperature magnetic response in element selectiveM(H)-curves measured by XMCD at photon energies characteristic of metallic Co, thuspointing toward an extrinsic origin of the magnetic order in the SPM Co : ZnO samples.
2. Experimental details
The aim of this section is twofold. Firstly, a brief overview of the experimental techniques usedwill be given. Secondly, the preparation details and existing pre-characterization of all samplespecimens presented in this paper will be provided.
2.1. Experimental techniques
The integral structural properties were routinely characterized by x-ray diffraction (XRD),which reveals for PM samples a c-plane orientation for the ZnO films and no indicationof additional crystallographic phases within the detection limit of XRD, i.e. ruling out Cocrystallites above ∼2–4 nm diameter; cf [18]. For SPM samples, additional reflections wereobserved in some cases [11].
For TEM investigations, cross-sectional samples of Co : ZnO films were fabricated bymechanical polishing and Ar ion milling. Each cross-sectional specimen was finished by low-energy Ar ion milling at 500 eV in order to minimize sample damage. For a conventional TEMcharacterization, an FEI Tecnai G2 microscope was used at 200 kV. Both image and probeaberration-corrected TEM and scanning TEM (STEM) studies were carried out using FEI Titanmicroscopes operated at 300 kV. Information about the local concentration of the elements wasobtained using a combination of STEM images and energy dispersive x-ray spectroscopy (EDS)line-scan and point probe experiments.
New Journal of Physics 13 (2011) 103001 (http://www.njp.org/)
4
The XAS spectra in the near edge regime (XANES) were taken at the ID12 beamline [21]of the ESRF in total fluorescence yield. The XANES/XLD measurements were carried out at300 K and a quarter wave plate [21] was used to flip the linear polarization of the synchrotronlight from vertical (E � c) to horizontal (E⊥c); the angle of incidence was 10◦ with respect tothe sample surface. The XLD was taken as the direct difference of the normalized XAS withE⊥c and E � c. The isotropic XANES was derived from the weighted average of the two XASspectra, i.e. (2 × XAS(E⊥c) + XAS(E � c))/3. Note that in the case of perfectly c-orientedsamples, this corresponds to the true isotropic XANES. The XMCD measurements were taken at6.5 K as the direct difference of normalized XANES spectra recorded with right and left circularpolarized light for H = 6 T under grazing incidence (15◦), respectively. To minimize artifacts,the direction of the external magnetic field was reversed as well. For c-oriented samples theXANES in this case corresponds to (XAS(E⊥c) + XAS(E � c))/2.
The integral magnetic measurements were carried out in the temperature range from 5to 300 K using a commercial SQUID magnetometer (Quantum Design MPMS-XL 5 T) takinggreat care to minimize magnetic contamination and sample-mounting related artifacts [22, 23].The magnetic field was applied in the sample plane, and no correction of the residualmagnetic field as described in [23] was done. This led to a small residual magnetic hysteresislimiting the significant magnetic signal size to above 2–4 × 10⁻⁷ emu; smaller signals weredisregarded [22, 23]. A standard SQUID measurement cycle in this work consists of M(H)curves recorded at 300 and 5 K and two M(T ) measurements while warming from 5 to 300 Kin 10 mT: once under field-cooled (FC; in 4 T) conditions and once under zero-field-cooled(ZFC) conditions. The diamagnetic background of the substrate was determined from theM(H) behavior at 300 K and high magnetic fields, and it is subsequently subtracted from allmagnetization data.
Throughout this paper the magnetic properties, along with the sample names, are termedeither ‘PM’ or ‘SPM’. The term ‘ferromagnetic’ (FM) is avoided. PM samples refer to theabsence of any magnetic hysteresis at any temperature down to 5 K, coinciding FC versus ZFCcurves and a pronounced ‘Brillouin-like’ M(H) curve at low temperatures. SPM samples arecharacterized by hysteretic M(H) behavior at low temperatures, a clear separation of the FCversus ZFC curves with a characteristic maximum in the ZFC data typical of blocking behaviorand mostly anhysteretic but S-shaped M(H) curves at 300 K indicative of large magnetic‘supermoments’.
It should be stressed that SPM behavior in Co : ZnO can have various different microscopicorigins and the experimental challenge is to discriminate between them. On the one hand, if themagnetic order in DMS materials can be described by a coalescence model, e.g., of boundmagnetic polarons as in [27], SPM-like signatures in integral magnetometry are likely. The‘blocking temperature’, e.g., would correspond to the temperature where the magnetic couplingbetween the magnetic polarons sets in or breaks down, respectively. In this scenario, SPM is anintrinsic property of the material. On the other hand, small ferromagnetic inclusions naturallyconstitute SPM behavior. Such ‘nanoclusters’ can have different microscopic origins: (i) phaseseparation of dopant atoms forming secondary phases, (ii) decoration of grain boundarieswith dopant atoms beyond the solubility limit, (iii) magnetic contaminations due to sample-handling and (iv) dopant-rich regions in a dopant-poor host matrix, often termed ‘spinodaldecomposition’. Whereas (iv) can be considered as an intrinsic property of the material, (i)–(iii)should be regarded as extrinsic. Only in the cases where scenarios (i)–(iii) are experimentally
New Journal of Physics 13 (2011) 103001 (http://www.njp.org/)
5
ruled out, (iv) or a bound magnetic polaron scenario remains the possible explanation for themagnetic behavior of DMS materials.
2.2. Sample overview
Nominally 10% Co : ZnO films were grown on epiready c-plane sapphire substrates usingreactive dc-magnetron sputtering (RMS) at 20 W from Co/Zn metal targets in an ultrahighvacuum deposition system with a base pressure of 5 × 10⁻¹⁰ mbar. The pressure duringdeposition was 4 × 10⁻³ mbar at a substrate temperature of 350 ◦C. The composition of theAr : O2 sputter gas was varied from 10 : 1, leading to PM Co : ZnO samples down to 10 : 0.5yielding SPM behavior [11]. The PM-RMS sample was previously studied using SQUID onlyand it was shown to exhibit anisotropic paramagnetism (see figure 3 in [24]), which can bedescribed by an effective spin model with single ion anisotropy introduced for Co2+ impuritiesin ZnO [25] and later used for epitaxial Co : ZnO films [26]. The SPM-RMS sample was studiedbefore using SQUID and XAS [11]. For this work the sample was split into three pieces. Oneremained in the as-grown state (as-g) in which it was studied before, one was annealed underhigh vacuum conditions (p ∼ 10−6 mbar) at 450 ◦C for 30 min (HV-a) and one was annealed inoxygen atmosphere at 450 ◦C for 30 min (O2-a). It should be stressed that identical findings werefound in another SPM sample grown with an Ar : O2 ratio of 10 : 0.4; for better comparabilitywith previously published data, we have chosen to present the annealing data from the samplein [11]. In addition, a nominally 15% Co : ZnO film was grown with an Ar : O2 ratio of 10 : 0.5(SPM-RMS 15% sample). TEM cross-sectional samples were fabricated from the PM-RMSand the SPM-RMS as-g samples, respectively.
In addition, an SPM nominally 5% Co : ZnO sample was grown by pulsed laser deposition(PLD) on r -plane sapphire in three steps at growth temperatures of 600, 400 and 200 ◦C at theJohannes–Gutenberg University in Mainz. The preparation concept for this SPM-PLD samplewas intended to maximize the magnetic response of similar Co : ZnO samples that were studiedearlier [13, 28]. Note that for this sample the geometry for the XLD measurements had to bealtered to normal incidence of the x-ray beam with suitable azimuthal orientation to ensure thatE⊥c and E � c, respectively.
As a reference material for the size of the XLD at the Zn K -edge, an undoped 305(1) nmthick ZnO epitaxial layer was grown on a 20 nm Mg : ZnO buffer layer on c-plane sapphiresubstrates by molecular beam epitaxy (MBE) at the Walter Schottky Institute controlling thegrowth using reflection high-energy electron diffraction. It has excellent structural quality asindicated by the full-width at half-maximum (FWHM) of 0.007◦ in ω-rocking curves of the(0002) reflection of ZnO, which itself has an FWHM of 0.03◦ in the ω–2θ -scan.
3. Experimental results
The presentation of the experimental results is organized as follows. First, the TEMinvestigations of the PM-RMS and the SPM-RMS samples are compared. The integral magneticproperties of the SPM-RMS sample are determined as a function of the annealing treatment.Subsequently, the XANES, XLD and XMCD results for all samples are presented. This iscomplemented by a detailed XANES analysis of the different Co-species found in the SPMsamples. Finally, the element-selective magnetic properties are compared to integral SQUIDmagnetometry.
New Journal of Physics 13 (2011) 103001 (http://www.njp.org/)
6
(c)10 nm(b)
200 nm(a) PM-RMS
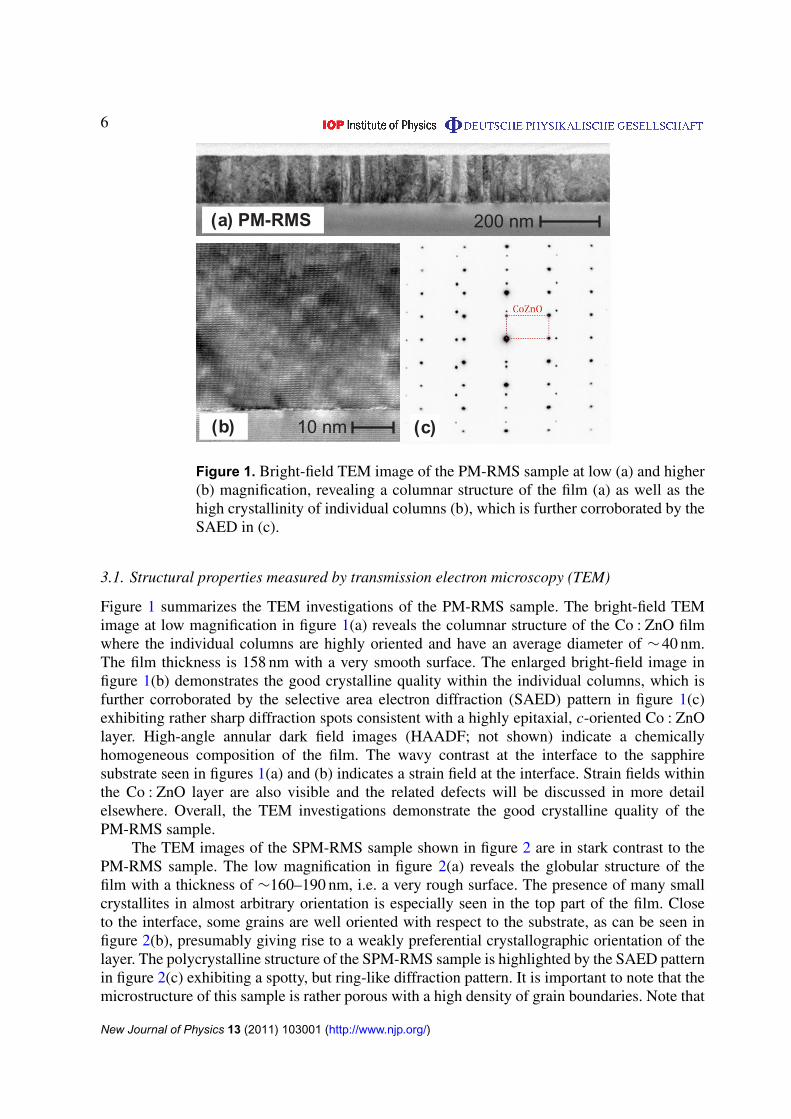
Figure 1. Bright-field TEM image of the PM-RMS sample at low (a) and higher(b) magnification, revealing a columnar structure of the film (a) as well as thehigh crystallinity of individual columns (b), which is further corroborated by theSAED in (c).
3.1. Structural properties measured by transmission electron microscopy (TEM)
Figure 1 summarizes the TEM investigations of the PM-RMS sample. The bright-field TEMimage at low magnification in figure 1(a) reveals the columnar structure of the Co : ZnO filmwhere the individual columns are highly oriented and have an average diameter of ∼40 nm.The film thickness is 158 nm with a very smooth surface. The enlarged bright-field image infigure 1(b) demonstrates the good crystalline quality within the individual columns, which isfurther corroborated by the selective area electron diffraction (SAED) pattern in figure 1(c)exhibiting rather sharp diffraction spots consistent with a highly epitaxial, c-oriented Co : ZnOlayer. High-angle annular dark field images (HAADF; not shown) indicate a chemicallyhomogeneous composition of the film. The wavy contrast at the interface to the sapphiresubstrate seen in figures 1(a) and (b) indicates a strain field at the interface. Strain fields withinthe Co : ZnO layer are also visible and the related defects will be discussed in more detailelsewhere. Overall, the TEM investigations demonstrate the good crystalline quality of thePM-RMS sample.
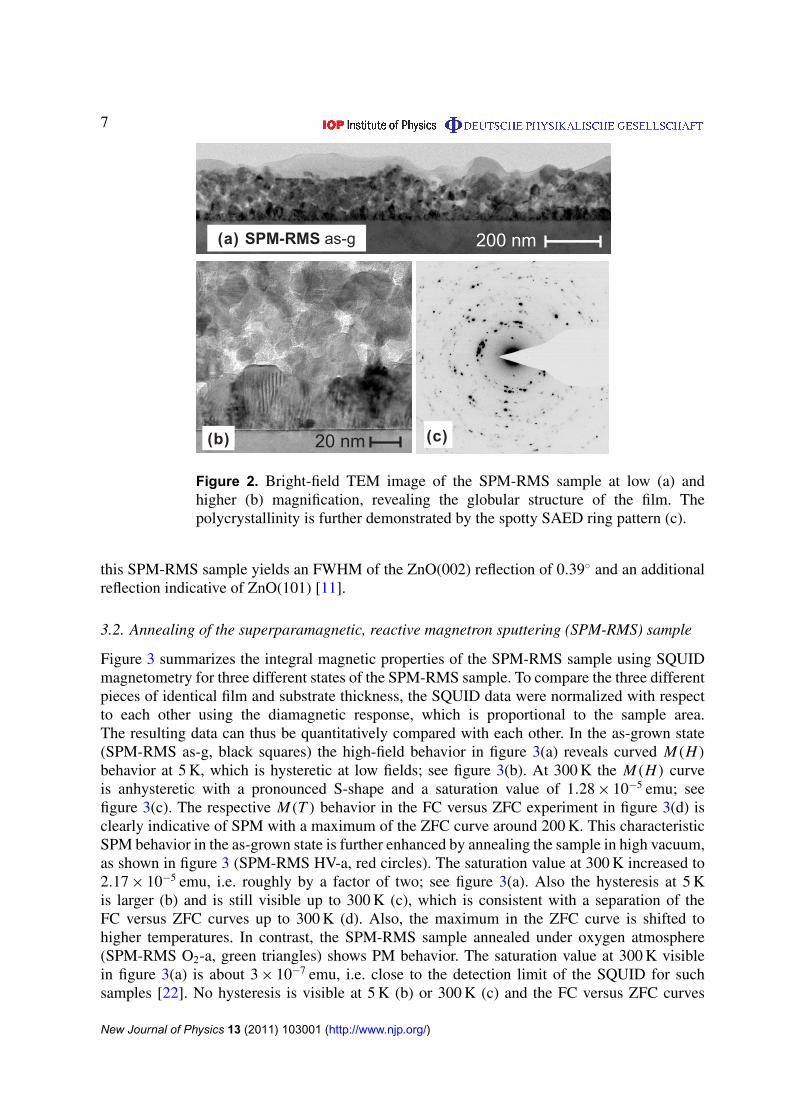
The TEM images of the SPM-RMS sample shown in figure 2 are in stark contrast to thePM-RMS sample. The low magnification in figure 2(a) reveals the globular structure of thefilm with a thickness of ∼160–190 nm, i.e. a very rough surface. The presence of many smallcrystallites in almost arbitrary orientation is especially seen in the top part of the film. Closeto the interface, some grains are well oriented with respect to the substrate, as can be seen infigure 2(b), presumably giving rise to a weakly preferential crystallographic orientation of thelayer. The polycrystalline structure of the SPM-RMS sample is highlighted by the SAED patternin figure 2(c) exhibiting a spotty, but ring-like diffraction pattern. It is important to note that themicrostructure of this sample is rather porous with a high density of grain boundaries. Note that
New Journal of Physics 13 (2011) 103001 (http://www.njp.org/)
7
200 nm
20 nm
(a) SPM-RMS as-g
(b) (c)
Figure 2. Bright-field TEM image of the SPM-RMS sample at low (a) andhigher (b) magnification, revealing the globular structure of the film. Thepolycrystallinity is further demonstrated by the spotty SAED ring pattern (c).
this SPM-RMS sample yields an FWHM of the ZnO(002) reflection of 0.39◦ and an additionalreflection indicative of ZnO(101) [11].
3.2. Annealing of the superparamagnetic, reactive magnetron sputtering (SPM-RMS) sample
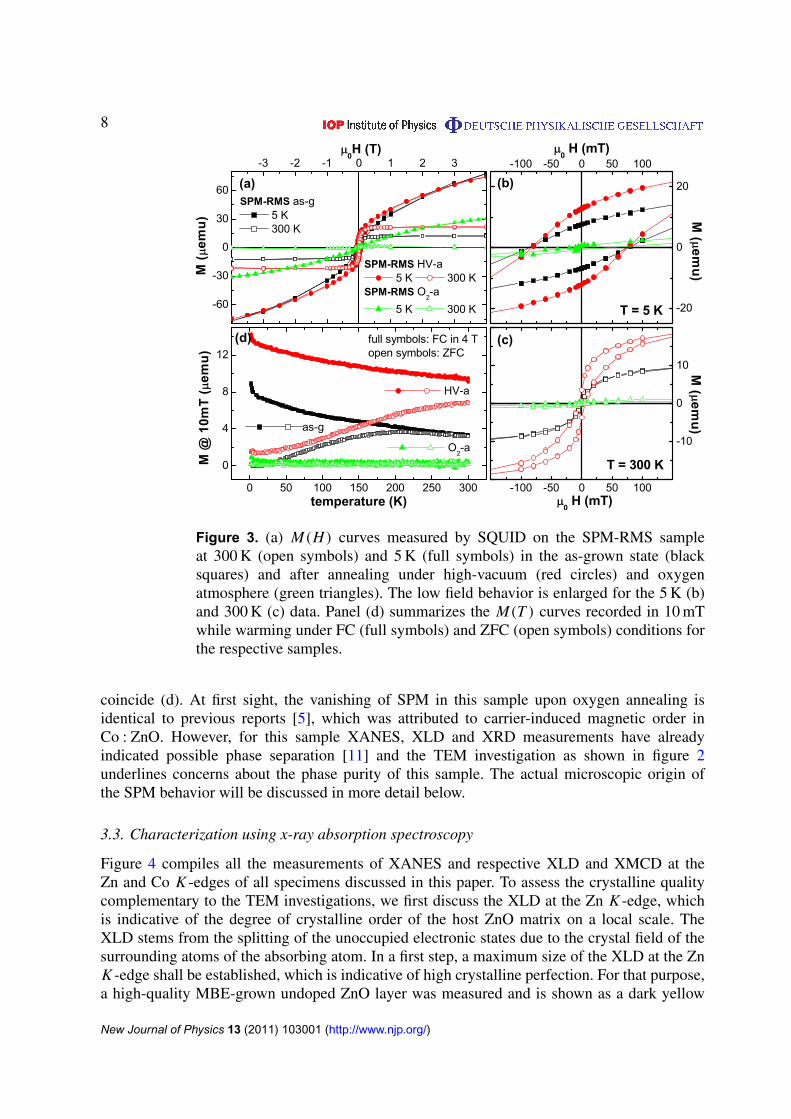
Figure 3 summarizes the integral magnetic properties of the SPM-RMS sample using SQUIDmagnetometry for three different states of the SPM-RMS sample. To compare the three differentpieces of identical film and substrate thickness, the SQUID data were normalized with respectto each other using the diamagnetic response, which is proportional to the sample area.The resulting data can thus be quantitatively compared with each other. In the as-grown state(SPM-RMS as-g, black squares) the high-field behavior in figure 3(a) reveals curved M(H)behavior at 5 K, which is hysteretic at low fields; see figure 3(b). At 300 K the M(H) curveis anhysteretic with a pronounced S-shape and a saturation value of 1.28 × 10⁻⁵ emu; seefigure 3(c). The respective M(T ) behavior in the FC versus ZFC experiment in figure 3(d) isclearly indicative of SPM with a maximum of the ZFC curve around 200 K. This characteristicSPM behavior in the as-grown state is further enhanced by annealing the sample in high vacuum,as shown in figure 3 (SPM-RMS HV-a, red circles). The saturation value at 300 K increased to2.17 × 10−5 emu, i.e. roughly by a factor of two; see figure 3(a). Also the hysteresis at 5 Kis larger (b) and is still visible up to 300 K (c), which is consistent with a separation of theFC versus ZFC curves up to 300 K (d). Also, the maximum in the ZFC curve is shifted tohigher temperatures. In contrast, the SPM-RMS sample annealed under oxygen atmosphere(SPM-RMS O2-a, green triangles) shows PM behavior. The saturation value at 300 K visiblein figure 3(a) is about 3 × 10⁻⁷ emu, i.e. close to the detection limit of the SQUID for suchsamples [22]. No hysteresis is visible at 5 K (b) or 300 K (c) and the FC versus ZFC curves
New Journal of Physics 13 (2011) 103001 (http://www.njp.org/)
8
Figure 3. (a) M(H) curves measured by SQUID on the SPM-RMS sampleat 300 K (open symbols) and 5 K (full symbols) in the as-grown state (blacksquares) and after annealing under high-vacuum (red circles) and oxygenatmosphere (green triangles). The low field behavior is enlarged for the 5 K (b)and 300 K (c) data. Panel (d) summarizes the M(T ) curves recorded in 10 mTwhile warming under FC (full symbols) and ZFC (open symbols) conditions forthe respective samples.
coincide (d). At first sight, the vanishing of SPM in this sample upon oxygen annealing isidentical to previous reports [5], which was attributed to carrier-induced magnetic order inCo : ZnO. However, for this sample XANES, XLD and XRD measurements have alreadyindicated possible phase separation [11] and the TEM investigation as shown in figure 2underlines concerns about the phase purity of this sample. The actual microscopic origin ofthe SPM behavior will be discussed in more detail below.
3.3. Characterization using x-ray absorption spectroscopy
Figure 4 compiles all the measurements of XANES and respective XLD and XMCD at theZn and Co K -edges of all specimens discussed in this paper. To assess the crystalline qualitycomplementary to the TEM investigations, we first discuss the XLD at the Zn K -edge, whichis indicative of the degree of crystalline order of the host ZnO matrix on a local scale. TheXLD stems from the splitting of the unoccupied electronic states due to the crystal field of thesurrounding atoms of the absorbing atom. In a first step, a maximum size of the XLD at the ZnK -edge shall be established, which is indicative of high crystalline perfection. For that purpose,a high-quality MBE-grown undoped ZnO layer was measured and is shown as a dark yellow
New Journal of Physics 13 (2011) 103001 (http://www.njp.org/)
9
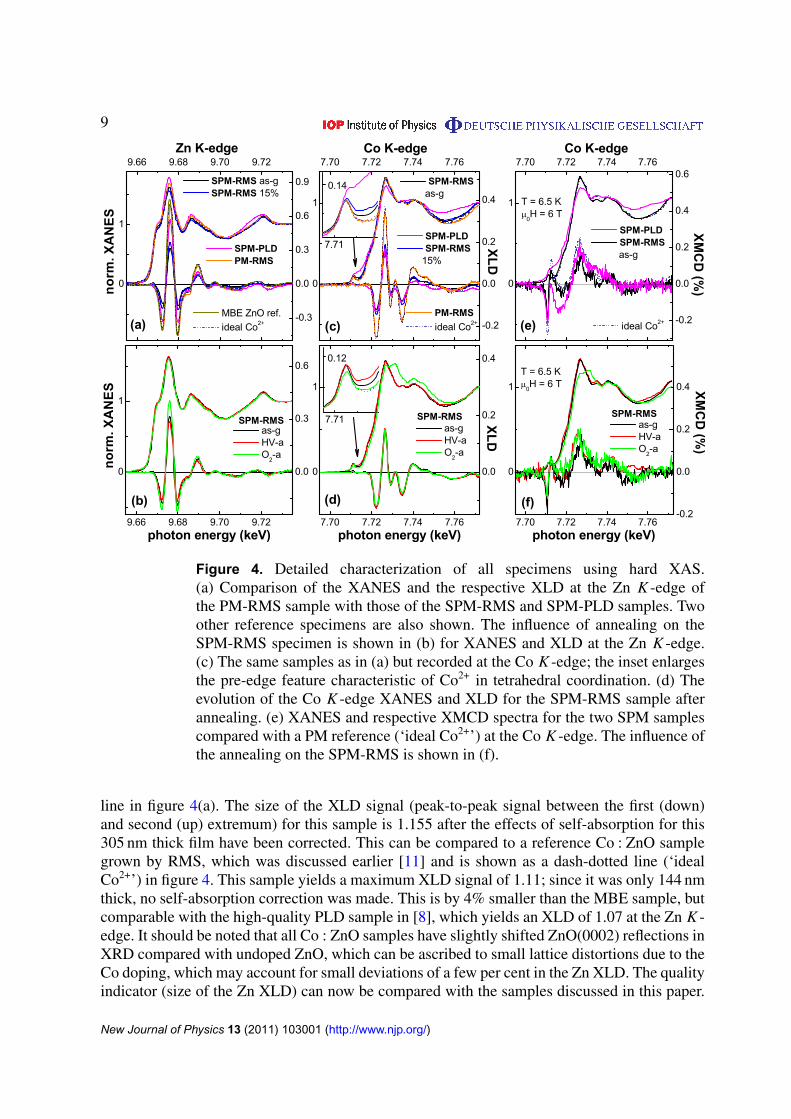
Figure 4. Detailed characterization of all specimens using hard XAS.(a) Comparison of the XANES and the respective XLD at the Zn K -edge ofthe PM-RMS sample with those of the SPM-RMS and SPM-PLD samples. Twoother reference specimens are also shown. The influence of annealing on theSPM-RMS specimen is shown in (b) for XANES and XLD at the Zn K -edge.(c) The same samples as in (a) but recorded at the Co K -edge; the inset enlargesthe pre-edge feature characteristic of Co2+ in tetrahedral coordination. (d) Theevolution of the Co K -edge XANES and XLD for the SPM-RMS sample afterannealing. (e) XANES and respective XMCD spectra for the two SPM samplescompared with a PM reference (‘ideal Co2+’) at the Co K -edge. The influence ofthe annealing on the SPM-RMS is shown in (f).
line in figure 4(a). The size of the XLD signal (peak-to-peak signal between the first (down)and second (up) extremum) for this sample is 1.155 after the effects of self-absorption for this305 nm thick film have been corrected. This can be compared to a reference Co : ZnO samplegrown by RMS, which was discussed earlier [11] and is shown as a dash-dotted line (‘idealCo2+’) in figure 4. This sample yields a maximum XLD signal of 1.11; since it was only 144 nmthick, no self-absorption correction was made. This is by 4% smaller than the MBE sample, butcomparable with the high-quality PLD sample in [8], which yields an XLD of 1.07 at the Zn K -edge. It should be noted that all Co : ZnO samples have slightly shifted ZnO(0002) reflections inXRD compared with undoped ZnO, which can be ascribed to small lattice distortions due to theCo doping, which may account for small deviations of a few per cent in the Zn XLD. The qualityindicator (size of the Zn XLD) can now be compared with the samples discussed in this paper.
New Journal of Physics 13 (2011) 103001 (http://www.njp.org/)
10
The PM-RMS sample shown in figure 1 yields an XLD signal at the Zn K -edge of 1.11 and canthus be considered to be of high crystalline perfection, which is consistent with the findings ofTEM analysis in figure 1. Note that the size of the XLD is obviously not strongly influencedby the columnar microstructure as long as the columns are of good crystalline quality and welloriented. Such high-quality samples in the thickness range of 100 nm as shown in figure 4(a)and in [8, 11] typically have an FWHM of the ZnO(0002) reflection of less than ∼ 0.13◦ inXRD measurements.
In contrast, the SPM samples exhibit a reduced XLD at the Zn K -edge, indicative of lesserstructural quality. Whereas the SPM-PLD sample exhibits an XLD signal of 0.90 and thuslargely maintains good crystallinity, the two SPM-RMS samples have a clearly reduced XLDof 0.58 for the SPM-RMS 15% sample and of 0.49 for the SPM-RMS sample. The comparisonof the reduced XLD with the TEM analysis in figure 2 demonstrates that a reduction of theXLD by a factor of more than two is correlated with the presence of many rotated grainsand poor structural integrity. The remaining XLD signal most likely stems from the bottompart of the film close to the substrate, but some of the rotated grains may also be oriented sothat they contribute to the XLD. Figure 4(b) shows the evolution of the Zn K -edge XLD forthe SPM-RMS upon annealing. Whereas high-vacuum annealing reduces the XLD slightly to0.44, O2 annealing increases it to 0.62, which correlates well with the fact that this sample wasprepared under oxygen-deficient conditions. Although oxygen annealing turns the sample PM,the crystalline quality is not fully re-established compared with the PM samples.
Figures 4(c) and (d) show XANES and XLD spectra of the same samples as in (a) and (b),respectively, but now measured at the Co K -edge. The insets enlarge the pre-edge feature ofthe Co K -edge characteristic of Co2+ in tetrahedral coordination, which was used as a qualityindicator earlier [11]. In figure 4(c), it becomes obvious that the PM-RMS sample and thereference specimen (ideal Co2+) have a virtually identical Co K -edge XLD of 0.62 and 0.63,respectively, which can be compared to the 0.67 for the high-quality PLD sample in [8]. Also,the shape of the pre-edge feature for these samples is virtually identical, pointing toward Cobeing fully Co2+. In contrast, all SPM samples have an XLD signal of about 0.28(2), i.e. areduction by a factor of more than two irrespective of the size of the Zn K -edge XLD. Thisindicates that the substitutional Co incorporation can be to some degree independent of thestructural perfection of the ZnO host crystal. For all SPM samples, the pre-edge feature is lesspronounced compared to the PM samples, which is indicative of increasing metallic characterof the Co species from the SPM RMS as-g over the SPM-RMS 15% to the SPM-PLD sample.
Figure 4(d) shows the evolution of XANES and XLD of the SPM-RMS sample uponannealing. Surprisingly, the size of the Co K -edge XLD does not significantly change uponany annealing procedure. Obviously, the fraction of Co atoms (which are incorporated in thesubstitutional lattice site and thus give rise to the XLD signal) is not altered by the annealing.Therefore, the fraction of substitutional Co cannot be responsible for the change in magneticproperties as measured by SQUID in figure 3. However, there is an obvious change in the shapeof the XANES for the SPM-RMS O2-a sample. The maximum of the absorption is clearlyshifted to a higher photon energy, which is indicative of another Co species (with a higheroxidation state than 2+) being present in this particular sample. Also, the pre-edge region(figure 4(d), inset) reveals significant changes upon annealing: the high-vacuum annealingdecreases the pre-edge feature indicative of increasing metallicity of the Co, whereas the oxygenannealing leads to a pre-edge feature that is almost identical to the ideal Co2+ (dash-dotted line).Obviously, non-substitutional Co, i.e. Co without a sizable XLD signature (such as Co metal,cubic CoO, etc), is responsible for the change in magnetic properties upon annealing.New Journal of Physics 13 (2011) 103001 (http://www.njp.org/)
11
Figure 4 also shows the Co-specific magnetic properties as measured using XMCD at theCo K -edge at 6.5 K in an external magnetic field of 6 T for all SPM samples (e) and the changesupon annealing (f). As introduced before, ideal Co2+ has zero XMCD signal at 7718.26 eV,where Co metal has its maximum dichroic signal [11]. The maximum XMCD signal of idealCo2+ at the pre-edge feature is in turn at 7711.35 eV; however, metallic Co also has a finiteXMCD signal at this photon energy, so that a superposition of both species can be measuredthere. In figure 4(e), it is obvious that at 7718.26 eV there is a sizable XMCD signal forthe SPM-RMS sample, which is much more pronounced for the SPM-PLD sample. For theSPM-RMS sample this ‘metallic’ XMCD signal increases upon high-vacuum annealing,whereas it vanishes upon oxygen annealing (f). Oxygen annealing also reduces the size of theXMCD signal at the pre-edge feature, i. e. the overall magnetization, consistent with the SQUIDmeasurements in figure 3(a).
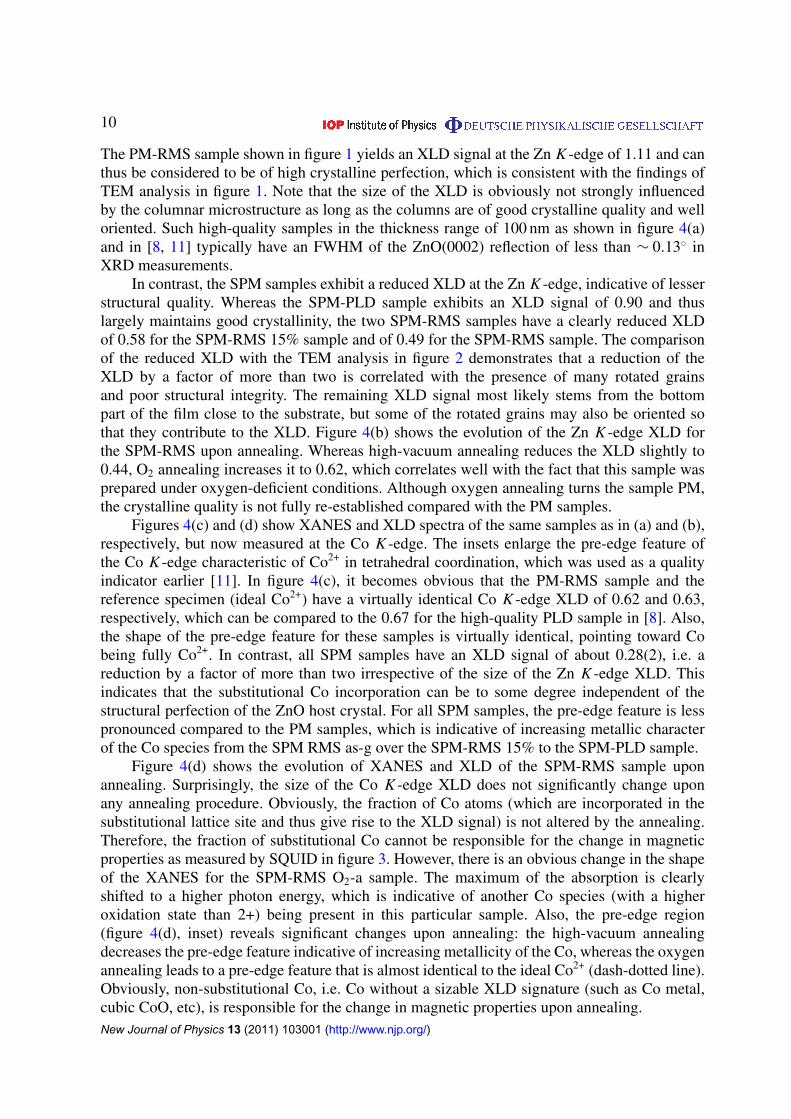
The comprehensive analysis using XAS in figure 4 can be further refined on a quantitativebasis. First, one can compare the size of the XLD at the Zn and Co K -edges of the SPM-RMSsample with the ideal Co2+ sample: whereas the Zn XLD is reduced to 44.4% of the ideal value,the Co XLD is reduced to 43.0%, i.e. in the most optimistic case of a correlated reductionof Zn and Co XLD, at least 3% of the Co as lower bound can be present as Co species withno significant XLD; the upper bound is naturally 57%. To put this crude estimate on moresolid grounds, the Co K -edge XANES spectra are more suitable for such an estimate, becausethey capture all existing Co species that may be present in the sample. Note that hard x-rayscan probe the entire thickness (about 100 nm) of the film without significant self-absorptioneffects [11]. Figure 5 displays fits of the measured XANES spectra for the SPM-RMS samplein the as-grown state (a), after high-vacuum (b) and oxygen annealing (c) using the referencespectra for ideal Co2+, Co metal, Co3O4 and CoO shown in (d). Figure 5 includes the differencebetween experimental XANES and fit (thin lines), which was minimized by varying the contentof the respective species in 1% steps, which is therefore a measure of the uncertainty of thisprocedure (±1%). The use of CoO XANES did not improve any of the fits; therefore it isexcluded that a significant amount (>1%) of (cubic) CoO is present in any sample. TheSPM-RMS as-g (a) and HV-a (b) samples could be best fitted with a superposition of ideal Co2+
and Co metal XANES, revealing that in the as-grown state the sample contains 5% metallic Co,which is increased to 8% upon high-vacuum annealing. This increase is in good quantitativeagreement with the increase of the saturation value of the magnetization at 300 K as measuredby SQUID in figure 3(a). The SPM-RMS O2-a could be fitted with a combination of 57% ofideal Co2+ and 43% of Co3O4 without a significant amount of metallic Co, again consistent withzero magnetization at 300 K as measured by SQUID. Since Co3O4 is an antiferromagnet with aNeel temperature of 40 K [29], this naturally explains the absence of any SPM signatures andthe reduction of the magnetization by a factor of more than two at 5 K as measured by SQUIDin figure 3(a). Note that Co and Co3O4 as secondary phases have also been found earlier byselected area electron diffraction in polycrystalline Co : ZnO films [30] in line with the presentXAS analysis.
The quantitative analysis can be further refined, which will be exemplified using theSPM-RMS as-g sample. Using the hypothesis that the SQUID response at 300 K of this sampleis solely due to the 5% fraction of metallic Co (with a magnetic moment of 1.73µB atom−1),one can estimate the expected magnetization at 5 K and 4 T in the SQUID experiment. For thisdiscussion the unit emu is used in the following, since this is the unit directly provided bythe SQUID. If 5% metallic Co give rise to 1.28 × 10⁻⁵ emu under fully saturated conditions,
New Journal of Physics 13 (2011) 103001 (http://www.njp.org/)
12
Figure 5. Quantitative analysis of the XANES of the SPM-RMS specimen inthe as-grown state (a) and after annealing under high vacuum (b) and oxygenatmosphere (c), together with a fit using the reference spectra for ideal Co2+,Co metal, Co3O4 and CoO shown in (d) and the respective difference betweenexperiment and fit (thin lines). The same fitting is shown for the SPM-RMS15% sample (e) and the SPM-PLD sample (f), revealing a significant amount ofmetallic Co.
100% Co give 2.56 × 10⁻⁴ emu, i.e. 2.43 × 10⁻⁴ emu for the remaining 95% Co if these have1.73µB as well. Since it is known that the ideal Co2+ possesses a magnetic moment of 3.41µB
(see [7, 24]), i.e. double the moment of metallic Co, 4.86 × 10⁻⁴ emu can be expected in fullmagnetic saturation. Since this moment is of PM nature, as seen in figure 3(a), the value hasto be corrected for the experimental measurement conditions yielding an expected signal of3.81 × 10−4 emu at 5 K and 4 T, while the SQUID experiment exhibits 7.75 × 10⁻⁵ emu, i.e.only about 20% of the expected value. Based on a statistical dopant distribution, such a reductionstems from antiferromagnetic coupling of Co–O–Co pairs in these samples and is known todepend on the actual Co concentration in the sample [7, 8]. Using this relation, the reductioncan be correlated with a dopant concentration by assuming that only the isolated Co dopantatoms contribute to the SQUID signal. For the derived value of 20% of the expected signal,this can be associated with a dopant concentration of about 12.5%, which is consistent with thenominal concentration of 10% in this particular sample, as well as with the TEM analysis of thehomogeneous regions in figure 6 below. The preceding quantitative estimate indicates that it is
New Journal of Physics 13 (2011) 103001 (http://www.njp.org/)
13
point O Co Zn1 57 28 15
2 56 30 14
3 63 11 26
4 48 34 18
5 43 38 19
6 59 8 33
7 56 15 29
8 56 21 23
0 2 4 6 8 10 12
0
1
Al
O
Zn
Conorm
. Int
ensi
ty
d (nm)
(b)(a)
PM
-RM
SS
PM
-RM
S a
s-g
(c)
12
3 4
10 nm10 nm
(d)
10 nm10 nm
6
7
58
2 nm2 nm
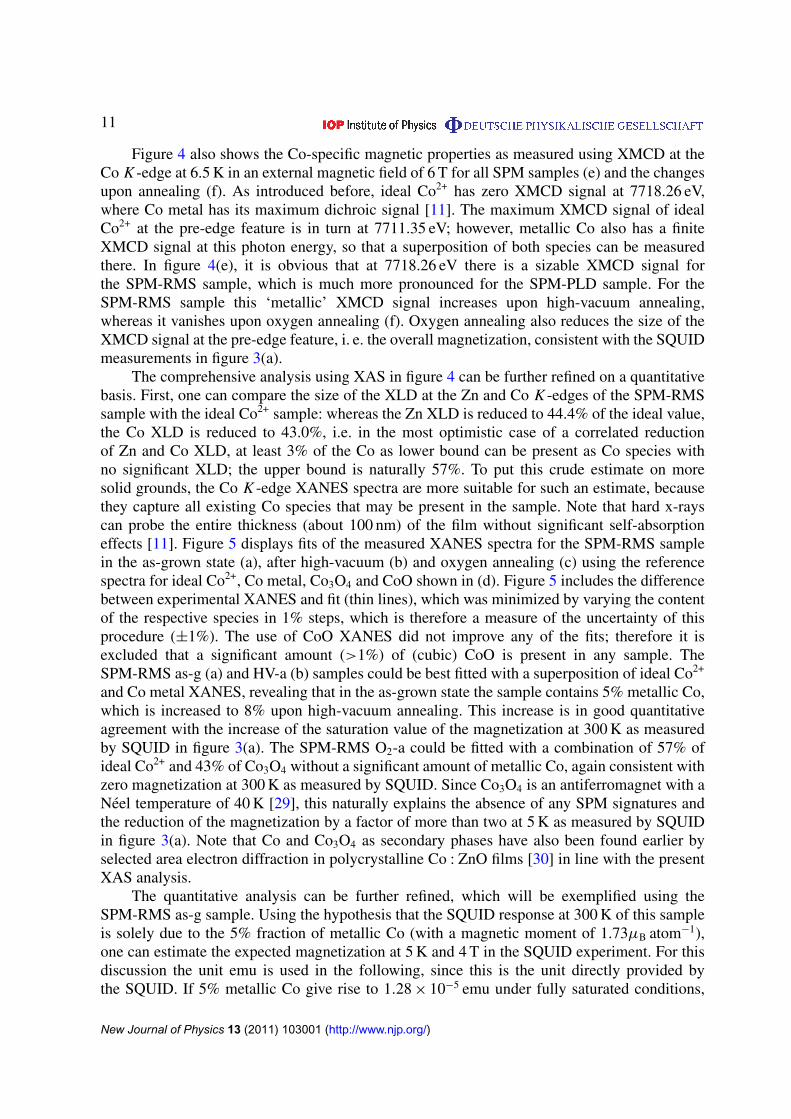
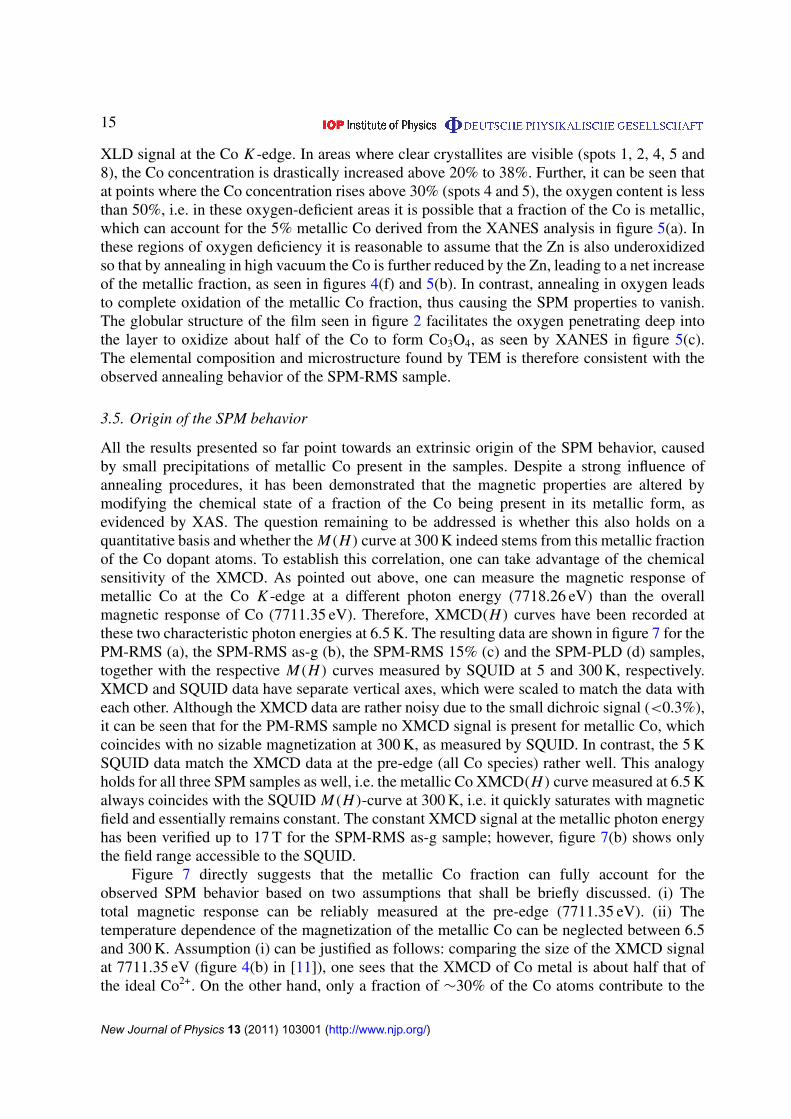
Figure 6. (a) High-resolution, aberration-corrected STEM high-angular annulardark field (HAADF) image of the interface of the PM-SPM film and the sapphiresubstrate. (b) EDS of Al (red squares), O (green circles), Zn (blue up triangles)and Co (cyan down triangles) along the red line shown in (a). (c, d) Elementalanalysis using EDS at two different spots of the SPM-RMS as–g sample. Thetable summarizes the concentration of O, Co and Zn in % on some crystallites(1, 2, 4, 5 and 8), as well as on the homogeneous part of the film (3, 6 and 7). TheADF inner detector semi-angles used were (a) 59.8 mrad and (c, d) 47.4 mrad.
quantitatively possible that the SQUID signal at 300 K can be solely caused by the metallic Cofraction in this sample, but it does not constitute an unambiguous proof.
Turning back to the fit of the XANES spectra of the SPM-RMS 15% sample in figure 5(e)and the SPM-PLD sample (f), one sees that the SPM-RMS 15% sample contains 10% metallicCo, whereas the SPM-PLD sample contains 38% metallic Co. The latter value has a largeruncertainty of about ±3% due to the lesser quality of the fit, which can either reproduce thepre-edge region well, or the main absorption. Using the derived metallic fraction, a comparableanalysis as that for the SPM-RMS as-g sample above can be performed based on the SQUIDmeasurements (see figure 7) and yields an estimated Co concentration of 6.6% for the SPM-PLD(nominally 5%) and of 11.5% for the SPM-RMS 15% sample. The latter discrepancy may bedue to the fact that the peak in the ZFC curve of the SPM-RMS 15% is much broader, especiallydown to low temperatures (not shown), which indicates that very small clusters may be presentin this particular sample, leading to a small supermoment which cannot be fully saturated with4 T at 300 K, and therefore being subtracted together with the diamagnetic background. Inaddition, it was shown for nominally 15% Co : ZnO PM samples that the presence of largerCo–O–. . .-configurations leads to an increased contribution to the M(T ) behavior beyond theisolated Co atoms compared to nominally 10% Co : ZnO samples [24]—this would also accountfor the discrepancy between estimated and nominal Co concentrations in the SPM-RMS 15%sample following the above procedure. Nonetheless, for all SPM samples the above estimationdoes not preclude the possibility that the SQUID signal at 300 K is only caused by the metallicfraction of the Co dopant.
New Journal of Physics 13 (2011) 103001 (http://www.njp.org/)
14
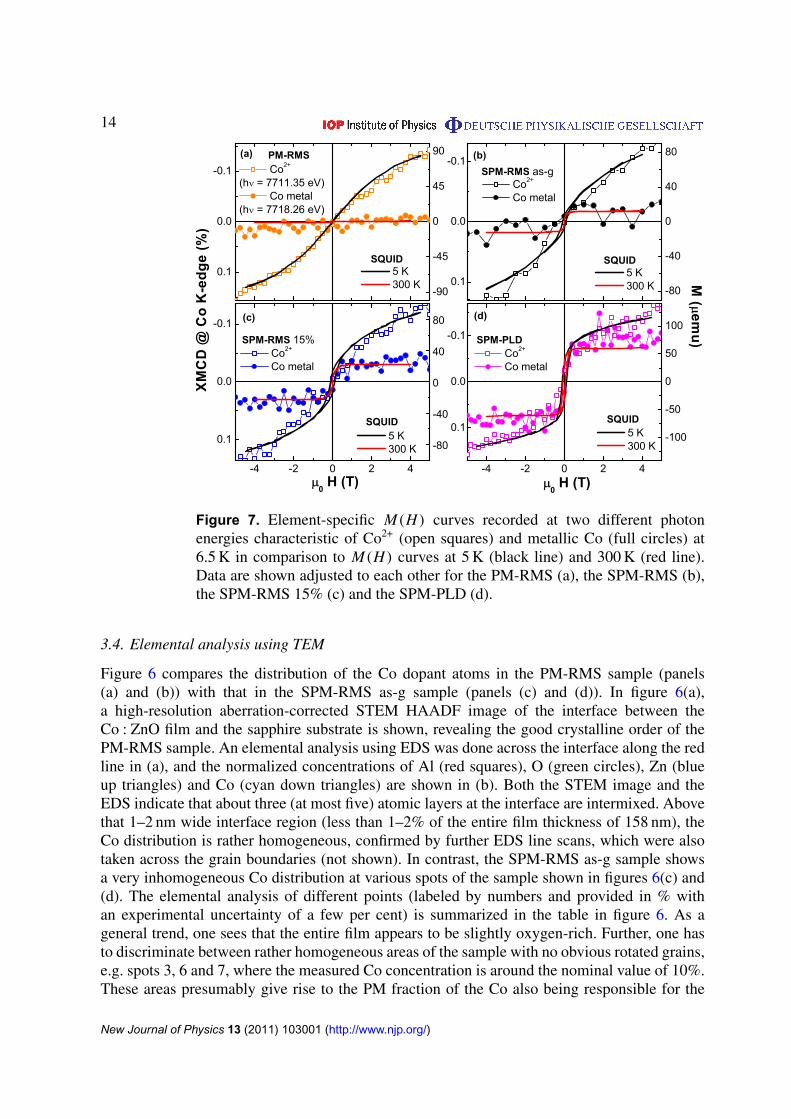
Figure 7. Element-specific M(H) curves recorded at two different photonenergies characteristic of Co2+ (open squares) and metallic Co (full circles) at6.5 K in comparison to M(H) curves at 5 K (black line) and 300 K (red line).Data are shown adjusted to each other for the PM-RMS (a), the SPM-RMS (b),the SPM-RMS 15% (c) and the SPM-PLD (d).
3.4. Elemental analysis using TEM
Figure 6 compares the distribution of the Co dopant atoms in the PM-RMS sample (panels(a) and (b)) with that in the SPM-RMS as-g sample (panels (c) and (d)). In figure 6(a),a high-resolution aberration-corrected STEM HAADF image of the interface between theCo : ZnO film and the sapphire substrate is shown, revealing the good crystalline order of thePM-RMS sample. An elemental analysis using EDS was done across the interface along the redline in (a), and the normalized concentrations of Al (red squares), O (green circles), Zn (blueup triangles) and Co (cyan down triangles) are shown in (b). Both the STEM image and theEDS indicate that about three (at most five) atomic layers at the interface are intermixed. Abovethat 1–2 nm wide interface region (less than 1–2% of the entire film thickness of 158 nm), theCo distribution is rather homogeneous, confirmed by further EDS line scans, which were alsotaken across the grain boundaries (not shown). In contrast, the SPM-RMS as-g sample showsa very inhomogeneous Co distribution at various spots of the sample shown in figures 6(c) and(d). The elemental analysis of different points (labeled by numbers and provided in % withan experimental uncertainty of a few per cent) is summarized in the table in figure 6. As ageneral trend, one sees that the entire film appears to be slightly oxygen-rich. Further, one hasto discriminate between rather homogeneous areas of the sample with no obvious rotated grains,e.g. spots 3, 6 and 7, where the measured Co concentration is around the nominal value of 10%.These areas presumably give rise to the PM fraction of the Co also being responsible for the
New Journal of Physics 13 (2011) 103001 (http://www.njp.org/)
15
XLD signal at the Co K -edge. In areas where clear crystallites are visible (spots 1, 2, 4, 5 and8), the Co concentration is drastically increased above 20% to 38%. Further, it can be seen thatat points where the Co concentration rises above 30% (spots 4 and 5), the oxygen content is lessthan 50%, i.e. in these oxygen-deficient areas it is possible that a fraction of the Co is metallic,which can account for the 5% metallic Co derived from the XANES analysis in figure 5(a). Inthese regions of oxygen deficiency it is reasonable to assume that the Zn is also underoxidizedso that by annealing in high vacuum the Co is further reduced by the Zn, leading to a net increaseof the metallic fraction, as seen in figures 4(f) and 5(b). In contrast, annealing in oxygen leadsto complete oxidation of the metallic Co fraction, thus causing the SPM properties to vanish.The globular structure of the film seen in figure 2 facilitates the oxygen penetrating deep intothe layer to oxidize about half of the Co to form Co3O4, as seen by XANES in figure 5(c).The elemental composition and microstructure found by TEM is therefore consistent with theobserved annealing behavior of the SPM-RMS sample.
3.5. Origin of the SPM behavior
All the results presented so far point towards an extrinsic origin of the SPM behavior, causedby small precipitations of metallic Co present in the samples. Despite a strong influence ofannealing procedures, it has been demonstrated that the magnetic properties are altered bymodifying the chemical state of a fraction of the Co being present in its metallic form, asevidenced by XAS. The question remaining to be addressed is whether this also holds on aquantitative basis and whether the M(H) curve at 300 K indeed stems from this metallic fractionof the Co dopant atoms. To establish this correlation, one can take advantage of the chemicalsensitivity of the XMCD. As pointed out above, one can measure the magnetic response ofmetallic Co at the Co K -edge at a different photon energy (7718.26 eV) than the overallmagnetic response of Co (7711.35 eV). Therefore, XMCD(H) curves have been recorded atthese two characteristic photon energies at 6.5 K. The resulting data are shown in figure 7 for thePM-RMS (a), the SPM-RMS as-g (b), the SPM-RMS 15% (c) and the SPM-PLD (d) samples,together with the respective M(H) curves measured by SQUID at 5 and 300 K, respectively.XMCD and SQUID data have separate vertical axes, which were scaled to match the data witheach other. Although the XMCD data are rather noisy due to the small dichroic signal (<0.3%),it can be seen that for the PM-RMS sample no XMCD signal is present for metallic Co, whichcoincides with no sizable magnetization at 300 K, as measured by SQUID. In contrast, the 5 KSQUID data match the XMCD data at the pre-edge (all Co species) rather well. This analogyholds for all three SPM samples as well, i.e. the metallic Co XMCD(H) curve measured at 6.5 Kalways coincides with the SQUID M(H)-curve at 300 K, i.e. it quickly saturates with magneticfield and essentially remains constant. The constant XMCD signal at the metallic photon energyhas been verified up to 17 T for the SPM-RMS as-g sample; however, figure 7(b) shows onlythe field range accessible to the SQUID.
Figure 7 directly suggests that the metallic Co fraction can fully account for theobserved SPM behavior based on two assumptions that shall be briefly discussed. (i) Thetotal magnetic response can be reliably measured at the pre-edge (7711.35 eV). (ii) Thetemperature dependence of the magnetization of the metallic Co can be neglected between 6.5and 300 K. Assumption (i) can be justified as follows: comparing the size of the XMCD signalat 7711.35 eV (figure 4(b) in [11]), one sees that the XMCD of Co metal is about half that ofthe ideal Co2+. On the other hand, only a fraction of ∼30% of the Co atoms contribute to the
New Journal of Physics 13 (2011) 103001 (http://www.njp.org/)
16
magnetic signal due to the antiferromagnetic compensation of the Co–O–Co pairs [7, 8]. Thesetwo facts lead to the situation that metallic Co and ideal Co2+ contribute equally (within thenecessary accuracy for this comparison) to the XMCD signal. One should note that especiallyat low magnetic fields where the XMCD is even smaller, the experimental uncertainty is ratherlarge, so that the hysteretic behavior cannot be reliably resolved at the Co K -edge. Assumption(ii) is also a reasonable assumption. The drop in magnetization from 30 to 300 K has beenmeasured by in situ SQUID magnetometry for epitaxial Co films (figure 3(a) of [31]). It hasbeen shown that above film thicknesses of eight atomic layers, i.e. about 1.4 nm, this reductionis below a few per cent because the reduction of the Curie temperature compared to bulk Codue to finite-size effects is sufficiently small. Although the finite-size effects for nanocrystallitesmay be slightly different from those for ultrathin films, it is unlikely that the Co-rich clustersseen by TEM in figures 2(b) and 6(c) and (d), which are of the order of 3–5 nm or larger, havea more pronounced reduction of the Curie temperature and thus a stronger reduction of themagnetization between 6.5 and 300 K than a 1.8 nm film between 30 and 300 K. Therefore,the suggestive character of the correlation between the 300 K SQUID data and the metallic Cofraction should also hold on a quantitative basis.
4. Conclusion
In summary, we have used a comprehensive set of experimental techniques for an in-depthcharacterization of a range of Co : ZnO samples grown mostly by RMS. We were able to asso-ciate a certain degree of the measured XLD at the Zn and Co K -edges with the high structuralquality seen in TEM investigations, as well as by comparing to an MBE ZnO reference sample.These findings are compared with SPM samples in order to clarify the microscopic origin ofthe SPM behavior found by integral SQUID magnetometry. XLD as well as TEM reveals adrastic loss in structural quality, which is accompanied by a fraction of Co dopant atoms beingmetallic in all SPM samples. The elemental analysis using XAS and TEM can also explain theobserved changes of the magnetic properties upon annealing procedures, which is not causedby a change in the carrier concentration of the DMS, but is merely a consequence of reductionor oxidation of the metallic fraction of the Co dopant atoms. The various Co-containingspecies could be quantified by fitting the XANES using reference spectra, which in turnare quantitatively consistent with the magnetization values measured by SQUID. Finally, itcould be directly shown by comparing integral SQUID magnetometry with element-specificXMCD(H) measurements that the metallic Co species found in all SPM samples by meansof their spectroscopic signatures indeed causes the SPM behavior of Co : ZnO. In turn, thesefindings underline that the spectroscopic signatures of phase pureness in XANES, XLD andXMCD are a meaningful and quantitative measure to characterize a range of oxide-based DMSsamples, in agreement with the complementary finding of an in-depth TEM analysis.
Acknowledgments
AN gratefully acknowledges financial support from the German Research Foundation (DFG)through the Heisenberg Programme. The early stage of this work was supported by theEuropean Commission under grant number MEXT-CT-2004-014195. The TEM investigationswere supported by the ‘FunDMS’ Advanced Grant of the European Research Council within the‘Ideas’ 7th Framework Programme of the European Commission. We are grateful to T Wassner
New Journal of Physics 13 (2011) 103001 (http://www.njp.org/)
17
and M Eickhoff from the Walter Schottky Institute, Garching, for providing us with the MBE-grown ZnO film and to M Gacic and G Jakob from the Johannes Gutenberg University, Mainz,for providing us with the SPM-PLD sample.
References
[1] Dietl T 2010 Nat. Mater. 9 965[2] Ueda K, Tabata H and Kawai T 2001 Appl. Phys. Lett. 79 988[3] Chambers S A 2010 Adv. Mater. 22 219[4] Ogale S B 2010 Adv. Mater. 22 3125[5] Kittilstved K R, Schwartz D A, Tuan A C, Heald S M, Chambers S A and Gamelin D R 2006 Phys. Rev. Lett.
97 037203[6] Ney V, Ye S, Kammermeier T, Ney A, Zhou H, Fallert J, Kalt H, Lo F-Y, Melnikov A and Wieck A D 2008
J. Appl. Phys. 104 083904[7] Sati P, Deparis C, Morhain C, Schafer S and Stepanov A A 2007 Phys. Rev. Lett. 98 137204[8] Ney A, Ollefs K, Ye S, Kammermeier T, Ney V, Kaspar T C, Chambers S A, Wilhelm F and Rogalev A 2008
Phys. Rev. Lett. 100 157201[9] Ney A, Ney V, Ye S, Ollefs K, Kammermeier T, Kaspar T C, Chambers S A, Wilhelm F and Rogalev A 2010
Phys. Rev. B 82 041202[10] Ney A 2010 Materials 3 3565[11] Ney A et al 2010 New J. Phys. 12 013020[12] Barla A et al 2007 Phys. Rev. B 76 125201[13] Tietze T, Gacic M, Schutz G, Jakob G, Bruck S and Goering E 2008 New J. Phys. 10 055009[14] Xu Q, Schmidt H, Hartmann L, Hochmuth H, Lorenz M, Setzer A, Esquinazi P and Grundmann M 2007
Appl. Phys. Lett. 91 092503[15] Straumal B B, Mazilkin A A, Protasova S G, Myatiev A A, Straumal P B, Schutz G, van Aken P A, Goering
E and Baretzky B 2009 Phys. Rev. B 79 205206[16] Coey J M D, Mlack J T, Venkatesan M and Stamenov P 2010 IEEE Trans. Magn. 46 2501[17] Park J H, Kim M G, Jang H M, Ryo S and Kim Y M 2004 Appl. Phys. Lett. 84 1338[18] Opel M, Nielsen K-W, Bauer S, Goennenwein S T B, Cezar J C, Schmeisser D, Simon J, Mader W and Gross
R 2008 Eur. Phys. J. B 63 437[19] Rode K et al 2008 Appl. Phys. Lett. 92 012509[20] Deka S and Joy P A 2006 Appl. Phys. Lett. 89 032508[21] Rogalev A, Goulon J, Goulon-Ginet C and Malgrange C 2001 Lect. Notes Phys. 565 61[22] Ney A, Kammermeier T, Ney V, Ollefs K and Ye S 2008 J. Magn. Magn. Mater. 320 3341[23] Sawicki M, Stefanowicz W and Ney A 2011 Semicond. Sci. Technol. 26 064006[24] Ney A, Kammermeier T, Ollefs K, Ye S, Ney V, Kaspar T C, Chambers S A, Wilhelm F and Rogalev A 2010
Phys. Rev. B 81 054420[25] Estle T L and de Wit M 1961 Bull. Am. Phys. Soc. 6 445[26] Sati P et al 2006 Phys. Rev. Lett. 96 017203[27] Coey J M D, Venkatesan M and Fitzgerald C B 2005 Nat. Mater. 4 173[28] Gacic M, Adrian H and Jakob G 2008 Appl. Phys. Lett. 93 152509[29] Roth W L 1964 J. Phys. Chem. Solids 25 1[30] Deka S, Pasricha R and Joy P A 2006 Phys. Rev. B 74 033201[31] Ney A, Poulopoulos P, Farle M and Baberschke K 2000 Phys. Rev. B 62 11336
New Journal of Physics 13 (2011) 103001 (http://www.njp.org/)