Embed Size (px)
Citation preview

New Hampshire CORE Energy Efficiency Programs
1st Quarter Report January 2016 – March 2016
Docket DE 14-216
May 27, 2016

New Hampshire CORE Energy Efficiency ProgramsNHPUC Docket No. DE 14-216
Description Page
Highlights CORE and Company-Specific Programs 1CORE Programs 2Company-Specific Programs 3Home Energy Assistance Program - Highlights 4CO2 Emissions Reductions 5Annual Savings by Fuel Type 6Summary of Results by Utility 7
Program Results Home Energy Assistance (HEA) 8Energy Star® Homes 9Home Performance with Energy Star® (HPwES) 10Energy Star® Products 11Large Business Energy Solutions 12Small Business Energy Solutions 13Municipal Program 14Company-Specific Programs - LU Electric & LU Gas; Unitil Electric & Unitil Gas; NHEC 15Company-Specific Programs - Eversource 16Company-Specific Programs - Eversource 2015 Energy Rewards C&I RFP Program 17Education Programs 18Forward Capacity Market (FCM) - Proceeds and Expenses 19
Expenses by Activity Residential Programs 20-21C&I and Municipal Programs 22-23Residential, C&I and Municipal Combined 23
Other Evaluation, Monitoring and Verification (EM&V) 24Revolving Loan Fund (RLF) 25Smart-Start Revolving Loan Program 26Residential Third Party Financing Option - Funded Through the CORE Program 27Residential Third Party Financing Option - Funded Through BetterBuildings OEP/CDFA Collaboration 28Electric Programs - Summary of Actual Results by Utility and Program 29Allocation of Electric Program Expenses, Savings and Customers Served by Funding Source System Benefits Charge, Forward Capacity Market and Interest Funds Only 30 Energy Efficiency Fund Only - Regional Greenhouse Gas Initiative 31Gas Programs - Summary of Actual Results by Utility and Program 32
1st Quarter ReportJanuary 2016 - March 2016
Table of Contents

New Hampshire CORE Energy Efficiency ProgramsNHPUC Docket No. DE 14-216
Program Expenses 1 kWh Savings MMBtu Savings CustomersDescription Actual % of Budget Annual Lifetime Life: % of Goal Annual Lifetime Life: % of Goal Count % of Goal
Electric Utilities
CORE ProgramsMunicipal Program 199,742$ 10% 260,755 3,427,096 6% 2,231 20,039 50% 12 4%All Other CORE Programs 3,878,035$ 19% 10,210,038 147,380,908 23% 12,469 275,235 30% 9,751 10%Sub-total 4,077,777$ 18% 10,470,793 150,808,004 22% 14,699 295,275 31% 9,763 10%
Company Specific Programs 2 608,924$ 32% 806,813 6,051,568 20% - - - 24,588 98%Total Electric 4,686,701$ 19% 11,277,606 156,859,571 22% 14,699 295,275 31% 34,351 29%
Gas Utilities
CORE Programs 511,133$ 8% 8,957 144,536 19% 10,247 210,452 9% 264 7%Company Specific Programs 2 75,189$ 21% - - - 12,857 38,570 70% 25,000 100%Total Gas 586,322$ 8% 8,957 144,536 19% 23,103 249,023 10% 25,264 87%
Grand Total 5,273,023$ 17% 11,286,563 157,004,108 22% 37,803 544,297 16% 59,615 40%
Notes:
http://www.puc.state.nh.us/Regulatory/Docketbk/2014/14-216/LETTERS-MEMOS-TARIFFS/14-216%202014-12-11%20PSNH%20ATT-JT%20SETTLEMENT%20AGREEMENT.PDF(2) Company-specific includes company-specific programs, education, forward capacity market and loan program implementation expenses.
1st Quarter ReportJanuary 2016 - March 2016
HighlightsCORE & Company-Specific Programs
(1) Program expenses shown in this report exclude the performance incentive (PI), which can vary by program and accomplishment thresholds. The planned budget for PI is 7.5% of actual program expenditures for the electric utilities and 8% of actual program expenditures for the gas utilities as shown in the Commission approved 2015-2016 Plan, p. 82. The actual PI for each utility is calculated to reflect the utilities' final accomplishments and is filed with the Commission by June 1st of each year for the preceding program year.
1 of 32

New Hampshire CORE Energy Efficiency ProgramsNHPUC Docket No. DE 14-216
Program Expenses kWh Savings MMBtu Savings CustomersDescription Actual % of Budget Annual Lifetime Life: % of Goal Annual Lifetime Life: % of Goal Count % of Goal
Electric UtilitiesResidentialHome Energy Assistance 921,723$ 24% 177,424 3,077,331 27% 3,103 66,106 28% 143 31%EnergyStar® Homes 347,502$ 25% 513,838 10,064,542 30% 3,699 92,040 49% 130 35%NH Home Performance w/Energy Star 673,903$ 25% 165,083 3,320,574 45% 5,319 113,712 33% 231 33%EnergyStar® Appliances 363,817$ 13% 897,840 13,183,771 9% 347 3,378 2% 9,145 10%Sub-total 2,306,945$ 22% 1,754,186 29,646,218 15% 12,469 275,235 30% 9,649 10%Commercial & IndustrialLarge Business Energy Solutions 959,709$ 15% 7,025,889 98,704,081 31% - - - 43 11%Small Business Energy Solutions 611,381$ 18% 1,429,963 19,030,609 15% - - - 59 8%Municipal Program 199,742$ 10% 260,755 3,427,096 6% 2,231 20,039 50% 12 4%Sub-total 1,770,832$ 15% 8,716,607 121,161,786 24% 2,231 20,039 50% 114 8%Total Electric 4,077,777$ 18% 10,470,793 150,808,004 22% 14,699 295,275 31% 9,763 10%
Gas UtilitiesResidentialHome Energy Assistance 41,087$ 4% 666 12,755 5% 849 13,896 9% 12 4%EnergyStar® Homes 12,769$ 8% - - 0% 878 21,960 40% 2 4%NH Home Performance w/Energy Star 129,000$ 16% 3,095 58,581 - 950 19,919 6% 36 6%EnergyStar® Appliances 113,626$ 9% 4,700 65,760 33% 2,053 36,240 10% 140 7%Sub-total 296,482$ 9% 8,461 137,096 18% 4,730 92,014 10% 190 6%Commercial & IndustrialLarge Business Energy Solutions 124,111$ 7% 496 7,440 - 2,175 46,603 5% 7 2%Small Business Energy Solutions 90,540$ 6% - - 0% 3,342 71,836 154% 67 10%Sub-total 214,651$ 7% 496 7,440 - 5,517 118,439 8% 74 8%Total Gas 511,133$ 8% 8,957 144,536 19% 10,247 210,452 9% 264 7%
Grand Total 4,588,910$ 16% 10,479,750 150,952,540 22% 24,946 505,727 15% 10,027 10%
Notes:(1) Amounts shown above pertain only to the CORE programs. The amounts pertaining to the Company-Specific programs are shown on page 3.
1st Quarter ReportJanuary 2016 - March 2016
HighlightsCORE Programs 1
2 of 32

New Hampshire CORE Energy Efficiency ProgramsNHPUC Docket No. DE 14-216
Program Expenses kWh Savings CustomersDescription Actual % of Budget Annual Lifetime Life: % of Goal Annual Lifetime Life: % of Goal Count % of Goal
Electric UtilitiesResidentialHome Energy Reports 6,481$ 3% 806,813 6,051,568 115% - - - 24,588 98%Education 6,749$ 13% - - - - - - - - Customer Engagement Platform 204,098$ 87% - - - - - - - - Forward Capacity Market Expenses 2 10,868$ 14% - - - - - - - - Sub-total 228,196$ 19% 806,813 6,051,568 115% - - - 24,588 98%Commercial & IndustrialSmart Start 11,382$ 22% - - - - - - - - C&I Customer Partnerships -$ 0% - - - - - - - - C&I RFP Program 9,794$ 2% - - 0% - - - - 0%Education 30,469$ 10% - - - - - - - - Customer Engagement Platform 306,147$ 89% - - - - - - - - Forward Capacity Market Expenses 2 22,935$ 14% - - - - - - - - Sub-total 380,728$ 62% - - 0% - - - - 0%Total Residential and C&I 608,924$ 32% 806,813 6,051,568 20% - - - 24,588 98%
Gas UtilitiesResidentialBuilding Practices & Demonstration 69,962$ 23% - - - 12,857 38,570 70% 25,000 100%Education 1,941$ 11% - - - - - - - - Sub-total 71,903$ 23% - - - 12,857 38,570 70% 25,000 100%Commercial & IndustrialBuilding Practices & Demonstration -$ 0% - - - - - - Education 3,286$ 9% - - - - - - - - Sub-total 3,286$ 1% - - - - - - - - Total Residential and C&I 75,189$ 21% - - - 12,857 38,570 70% 25,000 100%
Grand Total 684,113$ 30% 806,813 6,051,568 20% 12,857 38,570 70% 49,588 99%
Notes:(1) Amounts shown above pertain only to the Company-Specific programs. The amounts pertaining to the CORE programs are shown on page 2. Company-specific includes company-specific programs, education, forward capacity market and loan program implementation expenses.(2) Amounts shown are expenses related to the electric utilities' participation in ISO-NE's Forward Capacity Market. Revenues received from ISO-NE are reported on page 19.
1st Quarter ReportJanuary 2016 - March 2016
HighlightsCompany-Specific Programs 1
MMBtu Savings
3 of 32

New Hampshire CORE Energy Efficiency ProgramsNHPUC Docket No. DE 14-216
Electric Utilities Gas UtilitiesLiberty Sub-total Sub-total Grand
Description Utilities NHEC Eversource Unitil Electric LU Gas Unitil Gas Gas Total
Program Expense: Budget 2 330,589$ 255,703$ 2,751,286$ 455,327$ 3,792,905$ 895,000$ 208,884$ 1,103,884$ 4,896,789$ (CORE Program) Actual 29,176$ 89,055$ 740,582$ 62,909$ 921,723$ 19,499$ 21,588$ 41,087$ 962,810$
Percent 9% 35% 27% 14% 24% 2% 10% 4% 20%
Program Incentives: Budget 3 241,330$ 198,345$ 2,408,421$ 327,779$ 3,175,875$ 742,850$ 148,393$ 891,243$ 4,067,118$ (CORE Program) Actual 4 31,521$ 53,480$ 615,277$ 60,708$ 760,986$ 66,632$ 13,021$ 79,653$ 840,639$
Percent 13% 27% 26% 19% 24% 9% 9% 9% 21%
Customers Served: Goal 37 28 352 48 465 306 32 338 803 Actual 5,6 6 12 116 10 144 11 2 13 157 Percent 16% 43% 33% 21% 31% 4% 6% 4% 20%
Collaboration: Actual Collaborated Funds 7 25,540$ 4,096$ 111,143$ 2,152$ 142,931$ 15,300$ -$ 15,300$ 158,231$ Total Actual Expenses (CORE + Collaboration) 54,716$ 57,576$ 726,420$ 62,861$ 901,573$ 81,932$ 13,021$ 94,953$ 996,526$ % of Total Actual Expenses 47% 7% 15% 3% 16% 19% 0% 16% 16%
Collaborated Units 6 5 55 4 70 5 - 5 75 % of Total Customers Served 100% 42% 47% 40% 49% 45% 0% 38% 48%
Heating Systems: Actual Incentives 2,110$ 10,978$ 116,750$ 7,570$ 137,408$ -$ -$ -$ 137,408$ % of HEA CORE Total Budget 1% 4% 4% 2% 4% 0% 0% 0% 3%
Dwelling Mix:Single Family 6 12 116 10 144 11 2 13 157Multi-Family 0 0 0 0 0 0 0 0 0Total 6 12 116 10 144 11 2 13 157
Notes:(1) Program savings results are shown on page 8.(2) Program budget and actual numbers are based on total expenditures.(3) Reflects Program "Rebates/Services" only.(4) Program incentives are based on the HEA tracking system and do not include items not billed in the tracking system, such as heating system incentives and quality assurance costs.(5) Program participation is based on the HEA tracking system and does not align with the program participation numbers on page 8 due to timing differences. Program participation numbers on page 8 are based on the invoices that have been processed through the end of the first quarter whereas the HEA tracking system reflects real-time number of participants. A true-up to actual number of participants is completed at year-end.(6) Number of customers served by county are as follows:
Belknap Carroll Cheshire Coos Grafton Hillsborough Merrimack Rockingham Strafford Sullivan TotalElectric 11 17 2 10 11 46 11 28 3 5 144Gas 0 0 0 0 0 11 0 1 1 0 13Total 157 (7) Collaborated funds may include funding from numerous sources including the Department of Energy, town assistance, Community Development Block grants and also from other utilities. For example, if Eversource and Liberty Utilities-Gas worked on a joint project, Eversource includes the incentives from Liberty-Gas as part of its collaboration funds and Liberty-Gas includes incentives from Eversource as collaboration funds.
1st Quarter ReportJanuary 2016 - March 2016
HighlightsHome Energy Assistance Program 1
4 of 32
New Hampshire CORE Energy Efficiency ProgramsNHPUC Docket No. DE 14-216
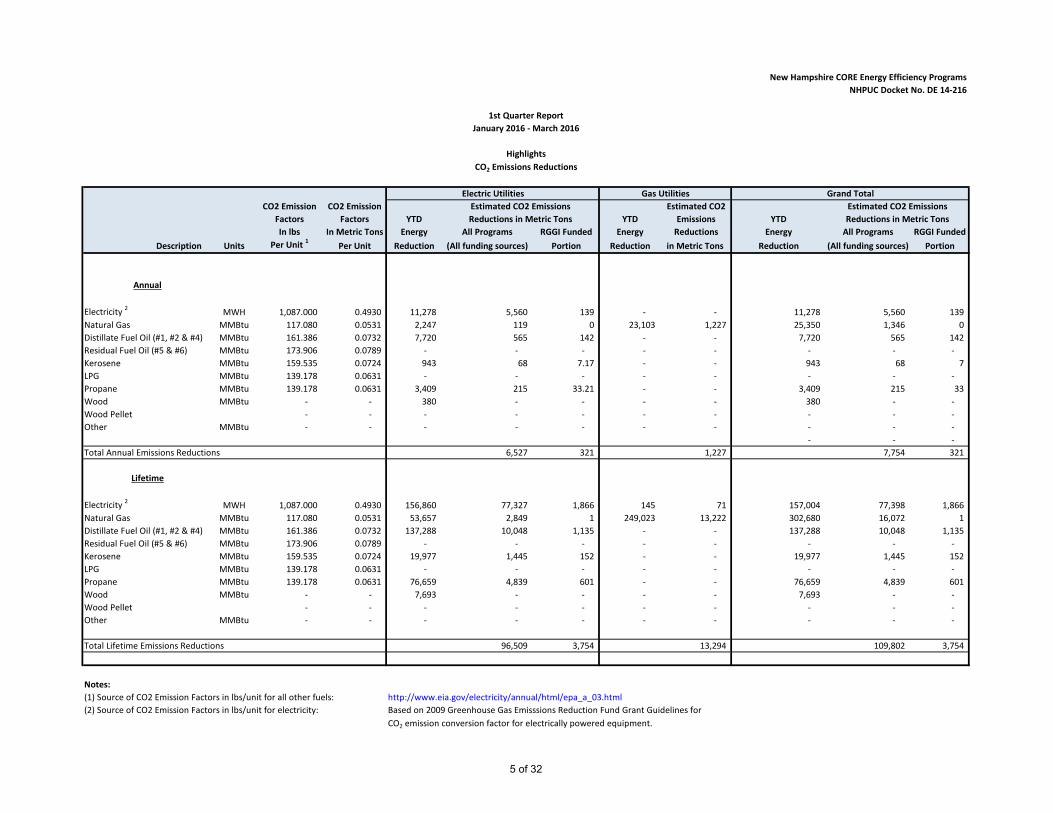
CO2 Emission CO2 Emission Estimated CO2Factors Factors YTD YTD Emissions YTDIn lbs In Metric Tons Energy All Programs RGGI Funded Energy Reductions Energy All Programs RGGI Funded
Description Units Per Unit 1 Per Unit Reduction (All funding sources) Portion Reduction in Metric Tons Reduction (All funding sources) Portion
Electricity 2 MWH 1,087.000 0.4930 11,278 5,560 139 - - 11,278 5,560 139 Natural Gas MMBtu 117.080 0.0531 2,247 119 0 23,103 1,227 25,350 1,346 0 Distillate Fuel Oil (#1, #2 & #4) MMBtu 161.386 0.0732 7,720 565 142 - - 7,720 565 142 Residual Fuel Oil (#5 & #6) MMBtu 173.906 0.0789 - - - - - - - - Kerosene MMBtu 159.535 0.0724 943 68 7.17 - - 943 68 7 LPG MMBtu 139.178 0.0631 - - - - - - - - Propane MMBtu 139.178 0.0631 3,409 215 33.21 - - 3,409 215 33 Wood MMBtu - - 380 - - - - 380 - - Wood Pellet - - - - - - - - - - Other MMBtu - - - - - - - - - -
- - - Total Annual Emissions Reductions 6,527 321 1,227 7,754 321
Electricity 2 MWH 1,087.000 0.4930 156,860 77,327 1,866 145 71 157,004 77,398 1,866 Natural Gas MMBtu 117.080 0.0531 53,657 2,849 1 249,023 13,222 302,680 16,072 1 Distillate Fuel Oil (#1, #2 & #4) MMBtu 161.386 0.0732 137,288 10,048 1,135 - - 137,288 10,048 1,135 Residual Fuel Oil (#5 & #6) MMBtu 173.906 0.0789 - - - - - - - - Kerosene MMBtu 159.535 0.0724 19,977 1,445 152 - - 19,977 1,445 152 LPG MMBtu 139.178 0.0631 - - - - - - - - Propane MMBtu 139.178 0.0631 76,659 4,839 601 - - 76,659 4,839 601 Wood MMBtu - - 7,693 - - - - 7,693 - - Wood Pellet - - - - - - - - - - Other MMBtu - - - - - - - - - -
Total Lifetime Emissions Reductions 96,509 3,754 13,294 109,802 3,754
Notes:(1) Source of CO2 Emission Factors in lbs/unit for all other fuels: http://www.eia.gov/electricity/annual/html/epa_a_03.html(2) Source of CO2 Emission Factors in lbs/unit for electricity: Based on 2009 Greenhouse Gas Emisssions Reduction Fund Grant Guidelines for
CO2 emission conversion factor for electrically powered equipment.
Estimated CO2 EmissionsReductions in Metric Tons
Lifetime
Gas UtilitiesElectric Utilities
Annual
Estimated CO2 EmissionsReductions in Metric Tons
1st Quarter ReportJanuary 2016 - March 2016
HighlightsCO2 Emissions Reductions
Grand Total
5 of 32

New Hampshire CORE Energy Efficiency ProgramsNHPUC Docket No. DE 14-216
AnnualkWh Savings
NaturalOil Gas LP Kerosene Wood Wood Pellet Other Total Electricity
Home Energy Assistance 1,586 7 414 852 244 - - 3,103 177,424 EnergyStar® Homes 66 2,064 1,454 28 88 - - 3,700 513,838 NH Home Performance w/Energy Star 4,121 25 1,061 62 49 - - 5,318 165,083 EnergyStar® Products 196 150 1 - - - - 347 897,840 Large Business Energy Solutions - - - - - - - - 7,025,889 Small Business Energy Solutions - - - - - - - - 1,429,963 Municipal Program 1,752 - 479 - - - - 2,231 260,755 Company-Specific Programs - - - - - - - - 806,813 Total 7,720 2,247 3,409 943 380 - - 14,699 11,277,606
AnnualkWh Savings
NaturalOil Gas LP Kerosene Wood Wood Pellet Other Total Electricity
Home Energy Assistance - 849 - - - - - 849 666 EnergyStar® Homes - 878 - - - - - 878 - NH Home Performance w/Energy Star - 950 - - - - - 950 3,095 EnergyStar® Products - 2,053 - - - - - 2,053 4,700 Large Business Energy Solutions - 2,175 - - - - - 2,175 496 Small Business Energy Solutions - 3,342 - - - - - 3,342 - Municipal Program - - - - - - - - - Company-Specific Programs - 12,857 - - - - - 12,857 - Total - 23,103 - - - - - 23,103 8,957
Gas Utilities
Annual MMBtu Savings
Program
Program
1st Quarter ReportJanuary 2016 - March 2016
HighlightsAnnual Savings by Fuel Type
Annual MMBtu Savings
Electric Utilities
6 of 32

New Hampshire CORE Energy Efficiency ProgramsNHPUC Docket No. DE 14-216
Electric Utilities Gas UtilitiesLiberty Sub-total Sub-total Grand
Description Utilities NHEC Eversource Unitil Electric LU Gas Unitil Gas Gas Total
Program Expenses Budget 2,130,693$ 1,649,458$ 17,486,605$ 2,937,650$ 24,204,406$ 5,621,815$ 1,347,647$ 6,969,462$ 31,173,868$ Actual 371,862$ 289,779$ 3,538,461$ 486,599$ 4,686,700$ 403,396$ 182,926$ 586,322$ 5,273,022$ Percent 17% 18% 20% 17% 19% 7% 14% 8% 17%
Program Participation Goal 11,551 7,569 85,931 15,346 120,397 28,163 732 28,895 149,292 Actual 309 1,257 29,513 3,272 34,351 25,208 56 25,264 59,615 Percent 3% 17% 34% 21% 29% 90% 8% 87% 40%
Annual kWh Savings Goal 3,715,633 2,883,291 40,882,648 5,605,054 53,086,627 46 35,418 35,464 53,122,091 Actual 2,698,025 543,392 6,796,728 1,239,461 11,277,606 6,251 2,706 8,957 11,286,563 Percent 73% 19% 17% 22% 21% 13709% 8% 25% 21%
Lifetime kWh Savings Goal 50,280,545 41,031,395 553,930,561 81,688,552 726,931,054 783 776,842 777,625 727,708,679 Actual 39,448,007 7,486,906 92,611,418 17,313,241 156,859,571 104,367 40,169 144,536 157,004,108 Percent 78% 18% 17% 21% 22% 13323% 5% 19% 22%
Annual MMBtu Savings Goal 3,125 2,987 39,100 5,886 51,097 122,344 30,148 152,492 203,589 Actual 250 491 12,364 1,594 14,699 21,299 1,804 23,103 37,803 Percent 8% 16% 32% 27% 29% 17% 6% 15% 19%
Lifetime MMBtu Savings Goal 70,261 60,970 703,891 124,691 959,814 1,831,144 541,804 2,372,949 3,332,762 Actual 5,122 9,508 248,314 32,331 295,275 210,196 38,827 249,023 544,297 Percent 7% 16% 35% 26% 31% 11% 7% 10% 16%
(1) Company-specific includes company-specific programs, education, forward capacity market and loan program implementation expenses.
1st Quarter ReportJanuary 2016 - March 2016
Summary of Results by UtilityCORE & Company-Specific Programs Combined 1
7 of 32

New Hampshire CORE Energy Efficiency ProgramsNHPUC Docket No. DE 14-216
Electric Utilities Gas UtilitiesLiberty Sub-total Sub-total Grand
Description Utilities NHEC Eversource Unitil Electric LU Gas Unitil Gas Gas Total
Program Expenses Budget 330,589$ 255,703$ 2,751,286$ 455,327$ 3,792,905$ 895,000$ 208,884$ 1,103,884$ 4,896,789$ Actual 29,176$ 89,055$ 740,582$ 62,909$ 921,723$ 19,499$ 21,588$ 41,087$ 962,810$ Percent 9% 35% 27% 14% 24% 2% 10% 4% 20%
Program Participation Goal 37 28 352 48 465 306 32 338 803 Actual 6 11 116 10 143 11 1 12 155 Percent 16% 39% 33% 21% 31% 4% 3% 4% 19%
Annual kWh Savings Goal 60,076 33,321 487,615 52,270 633,281 2 9,790 9,792 643,073 Actual 6,540 14,733 139,789 16,363 177,424 666 - 666 178,090 Percent 11% 44% 29% 31% 28% 28087% 0% 7% 28%
Lifetime kWh Savings Goal 989,551 531,288 8,870,954 952,712 11,344,505 47 236,062 236,109 11,580,615 Actual 117,948 248,036 2,403,666 307,680 3,077,331 12,755 - 12,755 3,090,086 Percent 12% 47% 27% 32% 27% 27137% 0.0% 5% 27%
Annual MMBtu Savings Goal 961 733 8,372 1,466 11,531 6,339 1,112 7,451 18,982 Actual 180 204 2,318 402 3,103 820 29 849 3,953 Percent 19% 28% 28% 27% 27% 13% 3% 11% 21%
Lifetime MMBtu Savings Goal 21,494 15,042 168,662 28,654 233,853 123,267 24,183 147,451 381,303 Actual 3,931 4,079 49,790 8,306 66,106 13,307 589 13,896 80,001 Percent 18% 27% 30% 29% 28% 11% 2% 9% 21%
1st Quarter ReportJanuary 2016 - March 2016
Program ResultsHome Energy Assistance (HEA)
8 of 32

New Hampshire CORE Energy Efficiency ProgramsNHPUC Docket No. DE 14-216
Electric Utilities Gas UtilitiesLiberty Sub-total Sub-total Grand
Description Utilities NHEC Eversource Unitil Electric LU Gas Unitil Gas Gas Total
Program Expenses Budget 114,653$ 150,426$ 957,269$ 170,000$ 1,392,348$ 85,000$ 68,750$ 153,750$ 1,546,098$ Actual 9,804$ 24,221$ 304,809$ 8,669$ 347,502$ 3,453$ 9,316$ 12,769$ 360,271$ Percent 9% 16% 32% 5% 25% 4% 14% 8% 23%
Program Participation Goal 30 17 303 26 376 41 11 52 428 Actual 1 2 126 1 130 1 1 2 132 Percent 3% 12% 42% 4% 35% 2% 9% 4% 31%
Annual kWh Savings Goal 34,755 130,931 1,143,194 67,579 1,376,459 - 14,291 14,291 1,390,750 Actual 15,261 214,281 283,445 851 513,838 - - - 513,838 Percent 44% 164% 25% 1% 37% - 0% 0% 37%
Lifetime kWh Savings Goal 784,460 3,231,914 27,881,919 1,321,301 33,219,594 - 339,322 339,322 33,558,916 Actual 376,528 2,912,098 6,754,222 21,695 10,064,542 - - - 10,064,542 Percent 48% 90% 24% 2% 30% - 0% 0% 30%
Annual MMBtu Savings Goal 889 588 5,177 895 7,549 1,599 610 2,209 9,758 Actual - 137 3,496 66 3,699 780 98 878 4,577 Percent 0% 23% 68% 7% 49% 49% 16% 40% 47%
Lifetime MMBtu Savings Goal 22,193 14,605 128,871 21,692 187,361 39,984 14,309 54,292 241,653 Actual - 3,425 86,965 1,650 92,040 19,510 2,450 21,960 114,000 Percent 0% 23% 67% 8% 49% 49% 17% 40% 47%
1st Quarter ReportJanuary 2016 - March 2016
Program ResultsEnergy Star® Homes
9 of 32

New Hampshire CORE Energy Efficiency ProgramsNHPUC Docket No. DE 14-216
Electric Utilities Gas UtilitiesLiberty Sub-total Sub-total Grand
Description Utilities NHEC Eversource Unitil Electric LU Gas Unitil Gas Gas Total
Program Expenses Budget 187,613$ 229,205$ 1,860,400$ 436,631$ 2,713,849$ 645,815$ 147,740$ 793,555$ 3,507,404$ Actual 37,528$ 35,496$ 532,012$ 68,867$ 673,903$ 86,865$ 42,135$ 129,000$ 802,903$ Percent 20% 15% 29% 16% 25% 13% 29% 16% 23%
Program Participation Goal 46 53 507 101 706 571 38 609 1,315 Actual 6 5 195 25 231 19 17 36 267 Percent 13% 9% 38% 25% 33% 3% 45% 6% 20%
Annual kWh Savings Goal 30,442 32,355 295,674 42,289 400,760 - - - 400,760 Actual 6,684 4,119 135,768 18,512 165,083 929 2,166 3,095 168,178 Percent 22% 13% 46% 44% 41% - - - 42%
Lifetime kWh Savings Goal 571,330 602,877 5,414,924 755,036 7,344,167 - - - 7,344,167 Actual 142,915 88,994 2,706,563 382,102 3,320,574 18,412 40,169 58,581 3,379,155 Percent 25% 15% 50% 51% 45% - - - 46%
Annual MMBtu Savings Goal 1,029 1,282 11,650 3,211 17,172 15,258 1,525 16,783 33,955 Actual 49 61 4,533 676 5,319 556 394 950 6,269 Percent 5% 5% 39% 21% 31% 4% 26% 6% 18%
Lifetime MMBtu Savings Goal 21,756 25,905 227,822 68,632 344,115 305,154 34,783 339,937 684,052 Actual 959 1,369 97,070 14,314 113,712 11,775 8,144 19,919 133,630 Percent 4% 5% 43% 21% 33% 4% 23% 6% 20%
1st Quarter ReportJanuary 2016 - March 2016
Program ResultsHome Performance With Energy Star® (HPwES)
10 of 32

New Hampshire CORE Energy Efficiency ProgramsNHPUC Docket No. DE 14-216
Electric Utilities Gas UtilitiesLiberty Sub-total Sub-total Grand
Description Utilities NHEC Eversource Unitil Electric LU Gas Unitil Gas Gas Total
Program Expenses Budget 218,882$ 349,270$ 1,853,018$ 365,000$ 2,786,170$ 995,000$ 335,243$ 1,330,243$ 4,116,413$ Actual 14,715$ 60,590$ 222,629$ 65,883$ 363,817$ 59,268$ 54,357$ 113,626$ 477,443$ Percent 7% 17% 12% 18% 13% 6% 16% 9% 12%
Program Participation Goal 11,312 7,317 58,752 15,066 92,446 1,417 509 1,926 94,373 Actual 286 1,234 4,412 3,212 9,145 106 34 140 9,285 Percent 3% 17% 8% 21% 10% 7% 7% 7% 10%
Annual kWh Savings Goal 1,010,711 787,894 6,137,671 1,433,378 9,369,655 41 11,337 11,378 9,381,033 Actual 35,868 117,698 454,030 290,244 897,840 4,160 540 4,700 902,540 Percent 4% 15% 7% 20% 10% 10177.3% 5% 41% 10%
Lifetime kWh Savings Goal 13,337,296 11,969,548 91,936,633 23,633,361 140,876,838 694 201,457 202,151 141,078,989 Actual 557,945 1,734,484 6,306,253 4,585,089 13,183,771 65,760 - 65,760 13,249,531 Percent 4% 14% 7% 19% 9% 9475.1% 0% 33% 9%
Annual MMBtu Savings Goal 86 300 12,658 83 13,127 15,590 4,977 20,568 33,695 Actual 21 42 266 19 347 1,485 568 2,053 2,400 Percent 24% 14% 2% 23% 3% 10% 11% 10% 7%
Lifetime MMBtu Savings Goal 948 3,302 149,092 913 154,254 261,654 92,742 354,396 508,650 Actual 232 15 2,925 206 3,378 25,707 10,533 36,240 39,618 Percent 24% 0% 2% 23% 2% 10% 11% 10% 8%
1st Quarter ReportJanuary 2016 - March 2016
Program ResultsEnergy Star® Products
11 of 32

New Hampshire CORE Energy Efficiency ProgramsNHPUC Docket No. DE 14-216
Electric Utilities Gas UtilitiesLiberty Sub-total Sub-total Grand
Description Utilities NHEC Eversource Unitil Electric LU Gas Unitil Gas Gas Total
Program Expenses Budget 648,101$ 202,403$ 4,704,790$ 708,104$ 6,263,398$ 1,488,000$ 325,308$ 1,813,308$ 8,076,706$ Actual 228,201$ 21,276$ 657,097$ 53,135$ 959,709$ 87,995$ 36,116$ 124,111$ 1,083,820$ Percent 35% 11% 14% 8% 15% 6% 11% 7% 13%
Program Participation Goal 17 37 320 23 397 270 42 312 709 Actual 7 1 31 4 43 6 1 7 50 Percent 40% 3% 10% 17% 11% 2% 2% 2% 7%
Annual kWh Savings Goal 1,374,367 978,279 18,265,965 2,778,532 23,397,143 - - - 23,397,143 Actual 2,517,413 128,325 3,861,577 518,574 7,025,889 496 - 496 7,026,385 Percent 183% 13% 21% 19% 30% - - - 30%
Lifetime kWh Savings Goal 18,480,627 12,737,793 247,514,974 38,416,850 317,150,244 - - - 317,150,244 Actual 36,588,304 1,668,226 53,706,089 6,741,462 98,704,081 7,440 - 7,440 98,711,521 Percent 198% 13% 22% 18% 31% - - - 31%
Annual MMBtu Savings Goal - - - - - 47,471 16,626 64,097 64,097 Actual - - - - - 1,546 629 2,175 2,175 Percent - - - - - 3% 4% 3% 3%
Lifetime MMBtu Savings Goal - - - - - 725,780 258,334 984,114 984,114 Actual - - - - - 30,890 15,713 46,603 46,603 Percent - - - - - 4% 6% 5% 5%
1st Quarter ReportJanuary 2016 - March 2016
Program ResultsLarge Business Energy Solutions
12 of 32

New Hampshire CORE Energy Efficiency ProgramsNHPUC Docket No. DE 14-216
Electric Utilities Gas UtilitiesLiberty Sub-total Sub-total Grand
Description Utilities NHEC Eversource Unitil Electric LU Gas Unitil Gas Gas Total
Program Expenses Budget 421,266$ 253,038$ 2,205,962$ 455,001$ 3,335,266$ 1,190,000$ 231,722$ 1,421,722$ 4,756,988$ Actual 33,832$ 38,375$ 386,512$ 152,662$ 611,381$ 76,104$ 14,436$ 90,540$ 701,921$ Percent 8% 15% 18% 34% 18% 6% 6% 6% 15%
Program Participation Goal 69 85 488 54 696 558 100 658 1,354 Actual 3 3 36 17 59 65 2 67 126 Percent 4% 4% 7% 31% 8% 12% 2% 10% 9%
Annual kWh Savings Goal 860,961 614,054 7,535,748 990,500 10,001,264 2 - 2 10,001,266 Actual 116,259 64,236 944,982 304,486 1,429,963 - - - 1,429,963 Percent 14% 10% 13% 31% 14% 0% - 0% 14%
Lifetime kWh Savings Goal 11,568,083 7,978,317 98,130,331 13,468,500 131,145,231 42 - 42 131,145,274 Actual 1,664,367 835,068 12,501,980 4,029,194 19,030,609 - - - 19,030,609 Percent 14% 10% 13% 30% 15% 0% - 0% 15%
Annual MMBtu Savings Goal - - - - - 17,647 5,297 22,944 22,944 Actual - - - - - 3,256 86 3,342 3,342 Percent - - - - - 18% 2% 15% 15%
Lifetime MMBtu Savings Goal - - - - - 319,986 117,452 437,438 437,438 Actual - - - - - 70,438 1,398 71,836 71,836 Percent - - - - - 22% 1% 16% 16%
1st Quarter ReportJanuary 2016 - March 2016
Program ResultsSmall Business Energy Solutions
13 of 32

New Hampshire CORE Energy Efficiency ProgramsNHPUC Docket No. DE 14-216
Liberty GrandDescription Utilities NHEC Eversource Unitil Total
Program Expenses Budget 163,788$ 160,393$ 1,453,464$ 219,876$ 1,997,520$ Actual 12,317$ 14,363$ 115,093$ 57,969$ 199,742$ Percent 8% 9% 8% 26% 10%
Program Participation Goal 41 32 202 28 304 Actual - 1 8 3 12 Percent 0% 3% 4% 11% 4%
Annual kWh Savings Goal 344,321 306,457 3,312,917 240,506 4,204,201 Actual - - 170,324 90,431 260,755 Percent 0% 0% 5% 38% 6%
Lifetime kWh Savings Goal 4,549,199 3,979,658 44,131,322 3,140,791 55,800,970 Actual - - 2,181,077 1,246,019 3,427,096 Percent 0% 0% 5% 40% 6%
Annual MMBtu Savings Goal 159 85 1,243 231 1,718 Actual - 48 1,752 431 2,231 Percent 0% 56% 141% 187% 130%
Lifetime MMBtu Savings Goal 3,871 2,115 29,445 4,801 40,231 Actual - 620 11,564 7,855 20,039 Percent 0% 29% 39% 164% 50%
1st Quarter ReportJanuary 2016 - March 2016
Program ResultsMunicipal Program
Electric Utilities
14 of 32
New Hampshire CORE Energy Efficiency ProgramsNHPUC Docket No. DE 14-216
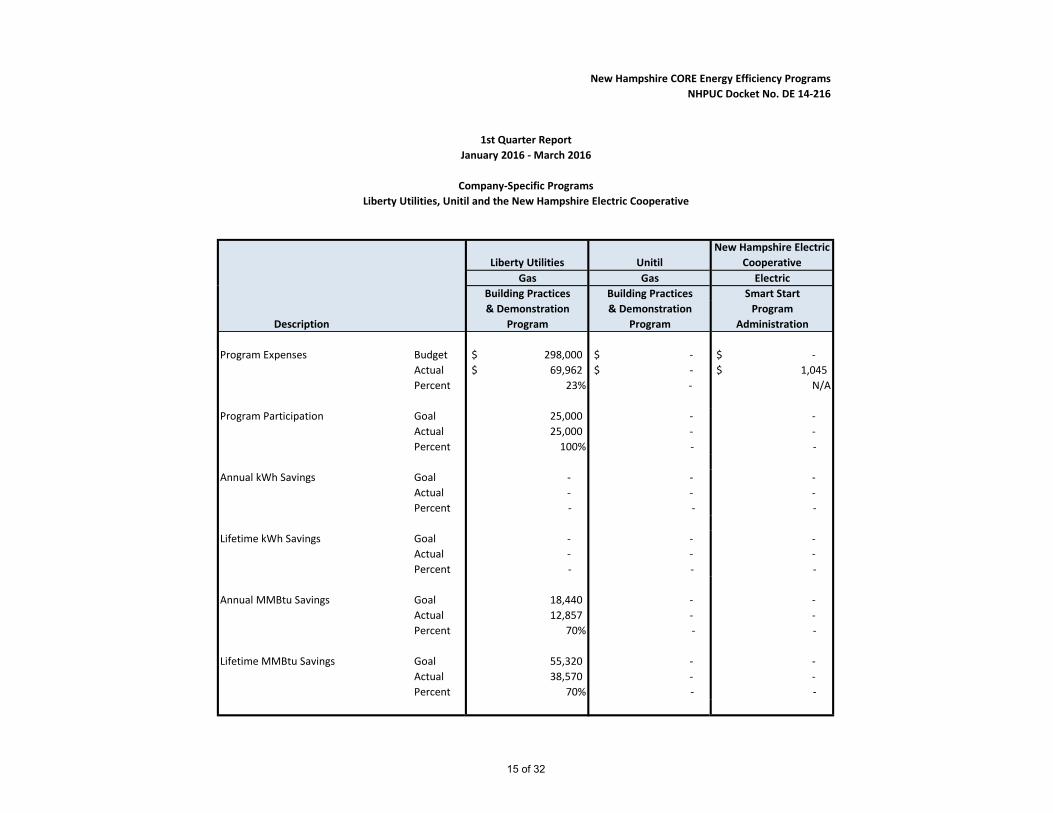
Liberty Utilities UnitilNew Hampshire Electric
CooperativeGas Gas Electric
Building Practices Building Practices Smart Start& Demonstration & Demonstration Program
Description Program Program Administration
Program Expenses Budget 298,000$ -$ -$ Actual 69,962$ -$ 1,045$ Percent 23% - N/A
Program Participation Goal 25,000 - - Actual 25,000 - - Percent 100% - -
Annual kWh Savings Goal - - - Actual - - - Percent - - -
Lifetime kWh Savings Goal - - - Actual - - - Percent - - -
Annual MMBtu Savings Goal 18,440 - - Actual 12,857 - - Percent 70% - -
Lifetime MMBtu Savings Goal 55,320 - - Actual 38,570 - - Percent 70% - -
1st Quarter ReportJanuary 2016 - March 2016
Company-Specific ProgramsLiberty Utilities, Unitil and the New Hampshire Electric Cooperative
15 of 32

New Hampshire CORE Energy Efficiency ProgramsNHPUC Docket No. DE 14-216
Smart Start Customer Home C&I C&IProgram Engagement Energy RFP Customer
Description Administration Platform* Reports Program Partnerships Total
Program Expenses Budget 52,000$ 580,539$ 251,006$ 431,355$ 18,919$ 1,333,819$ Actual 10,337$ 510,245$ 6,481$ 9,794$ -$ 536,856$ Percent 20% 88% 3% 2% - 40%
Program Participation Goal - - 25,000 2 4 25,006 Actual - - 24,588 - - 24,588 Percent - - 98% 0% - 98%
Annual kWh Savings Goal - - 1,755,681 1,948,183 - 3,703,864 Actual - - 806,813 - - 806,813 Percent - - 46% 0% - 22%
Lifetime kWh Savings Goal - - 5,267,042 24,782,462 - 30,049,504 Actual - - 6,051,568 - - 6,051,568 Percent - - 115% 0% - 20%
*Updates on the Customer Engagement Platform:
(1) Launch date: March 31, 2016
(2) Marketing efforts planned after NH launch include:
a. Email campaign tool that is part of the CEP software
b. Bill insert
c. Links from Eversource's website
d. One-on-one roll outs with largest customers
(3) Interface with US Department of Energy's Portfolio Manager: Eversource is planning to have CEP incorporate an interface with Portfolio Manager via an Application Program Interface (API)
Work is ongoing.
1st Quarter ReportJanuary 2016 - March 2016
Program ResultsCompany-Specific Programs
Eversource
16 of 32

New Hampshire CORE Energy Efficiency ProgramsNHPUC Docket No. DE 14-216
Number of Attendees at Annual Bidders Conference: 15Number of Bids Received: 6 2
Number of Bids Selected: 5
Total Annual LifetimeProject Incentive Incentive kWh kWh Benefit/Cost
Customer Project Number Project Description Cost 3 Amount % Savings Savings Benefits 4 Ratio
A 1 Rebuilt third 150 hp condenser water pump with new pump internals 28,164$ 10,000$ 35.5% 58,908 765,804 67,959$ 2 Interior LED high bay lighting with wireless controlled smart fixtures 227,641 83,939 36.9% 407,163 5,293,119 469,721 3 Replaced V-bets with cog belts for process fan drives 19,162 7,384 38.5% 73,079 1,096,185 97,277
4 VFDs on Krack Unit fans and and pump motors 47,173 15,792 33.5% 393,894 5,120,622 454,414 5 Technical Assistance/Third Party Engineering Review 7,743 7,070 91.3% - - -
329,883$ 124,185$ 37.6% 933,044 12,275,730 1,089,371$ 3.30
B 1 VFDs on condenser water pumps 10,510$ 4,050$ 38.5% 34,049 442,637 39,280$ 2 Chiller controls and software for condensor and chilled water systems 125,575 47,703 38.0% 424,193 4,241,930 376,437 3 Retrofitted 4 Kitchen exhaust hoods with VFDs 116,973 45,073 38.5% 35,091 456,183 40,483 4 LED indoor and outdoor lighting retrofit (2 separate projects) 136,099 47,602 35.0% 231,959 3,015,467 267,598 5 Technical Assistance/Third Party Engineering Review 8,235 7,520 91.3% - - -
397,393$ 151,948$ 38.2% 725,292 8,156,217 723,798$ 1.82
C 1 LED lighting retrofit 4,575$ 1,655$ 36.2% 12,211 158,743 14,087$ 2 Replaced boiler pumps with smaller size pump and motors and VFDs 56,022 18,574 33.2% 110,216 1,432,808 127,150 3 Water treatment & filtering system for condenser water 102,404 36,600 35.7% 38,564 501,332 44,489 4 Replaced lead water cooled chiller with VFD 310,462 110,963 35.7% 224,791 4,495,820 398,967 5 Technical Assistance/Third Party Engineering Review 8,433 7,700 91.3% - - -
481,896$ 175,492$ 36.4% 385,782 6,588,703 584,694$ 1.21
D 1 Dry type transformer replacements 75,717$ 25,024$ 33.0% 54,504 1,090,080 96,736$ 2 Two-part foam insulation to brine cooling headers 20,061 9,575 47.7% 71,092 782,012 69,397$ 3 Technical Assistance/Third Party Engineering Review 5,425 4,954 91.3% - - -$
101,204$ 39,553$ 39.1% 125,596 1,872,092 166,133$ 1.64
Overall Totals 1,310,376$ 491,178$ 37.5% 2,169,714 28,892,742 2,563,996$ 1.96
(1) In compliance with NHPUC Order No. 25,462 dated February 1, 2013.(2) All 6 bids were reviewed and 5 were selected. Four customers bids were completed (15 projects).(3) Includes customer costs of $772,447 from 2015 Annual Performance Incentive Report.(4) Total Program Benefits are allocated to projects based on lifetime kWh savings.
2015 Annual Report 1
Company-Specific ProgramsEversource
Energy Rewards C&I RFP Program
17 of 32

New Hampshire CORE Energy Efficiency ProgramsNHPUC Docket No. DE 14-216
1st Quarter ReportJanuary 2016 - March 2016
Education Programs
Electric Utilities Gas UtilitiesLiberty Sub-total Sub-total Grand
Description Utilities NHEC Eversource Unitil Electric LU Gas Unitil Gas Gas TotalProgram Expenses
Residential Budget -$ -$ -$ 52,776$ 52,776$ -$ 17,000$ 17,000$ 69,776$ Actual - - - 6,749 6,749 - 1,941 1,941 8,691
Percent - - - 13% 13% - 11% 11% 12%
Commercial & Industrial Budget 10,802$ 39,020$ 206,596$ 44,936$ 301,354$ 25,000$ 13,000$ 38,000$ 339,354$ Actual 3,900 5,358 16,812 4,400 30,469 250 3,036 3,286 33,756
Percent 36% 14% 8% 10% 10% 1% 23% 9% 10%
Total Budget 10,802$ 39,020$ 206,596$ 97,712$ 354,130$ 25,000$ 30,000$ 55,000$ 409,130$ Actual 3,900 5,358 16,812 11,149 37,219 250 4,977 5,227 42,446 Percent 36% 14% 8% 11% 11% 1% 17% 10% 10%
Focus Areas Activities
Residential Programs > Conducted "Ductless Heat Pump" all-day training seminar with 95 attendees
> Conducted "Making Energy Savings Real with NHSaves" presentation at NH State Home Show with 20 attendees
Commercial, Industrial & Municipal Programs > Conducted "High Efficiency Lighting" presentation at NH State Home Show with 15 attendees
K-12 Energy Efficiency Education > Completed 37 presentations in 9 schools that reached 842 students and 83 educators.
18 of 32

New Hampshire CORE Energy Efficiency ProgramsNHPUC Docket No. DE 14-216
Liberty GrandDescription Utilities NHEC Eversource Unitil Total
Estimated Annual FCM Proceeds 210,000$ 65,000$ 1,823,283$ 312,800$ 2,411,083$ Estimated Annual FCM Expenses 35,000$ 10,000$ 160,000$ 30,000$ 235,000$
Actual FCM ProceedsQtr. 1 53,176$ 12,784$ 531,549$ 70,991$ 668,500$ Qtr. 2 - - - - - Qtr. 3 - - - - - Qtr. 4 - - - - - Total 53,176$ 12,784$ 531,549$ 70,991$ 668,500$
Actual FCM Expenses Financial Assurance Qtr. 1 -$ -$ -$ -$ -$
Qtr. 2 - - - - - Qtr. 3 - - - - - Qtr. 4 - - - - - Total -$ -$ -$ -$ -$
Other Qtr. 1 2,389$ -$ 26,059$ 5,355$ 33,803$ Qtr. 2 - - - - - Qtr. 3 - - - - - Qtr. 4 - - - - - Total 2,389$ -$ 26,059$ 5,355$ 33,803$
Total Financial Assurance & Other 2,389$ -$ 26,059$ 5,355$ 33,803$
Actual Net FCM Proceeds* 50,787$ 12,784$ 505,489$ 65,636$ 634,697$
programs. The FCM proceeds budget and actual FCM proceeds are allocated to the residential and the C&I sectors based on an estimate of each sector'scontribution to peak demand reduction (approximately 30% for the Residential sector and 70% for the C&I sector). Initially approved by the Commission in its Order No. 24,930 in DE 08-130 dated January 5, 2009 (2009 CORE Programs) and in all subsequent CORE program Orders.
Electric Utilities
1st Quarter ReportJanuary 2016 - March 2016
Forward Capacity Market (FCM) Proceeds and Expenses
* The CORE Electric Utilities leverage the Forward Capacity Market which provides additional energy efficiency funds to the NH CORE energy efficiency
19 of 32

New Hampshire CORE Energy Efficiency ProgramsNHPUC Docket No. DE 14-216
1st Quarter ReportJanuary 2016 - March 2016
Expenses By ActivityResidential Programs
Electric Utilities Gas UtilitiesLiberty Sub-total Sub-total Grand
Description Utilities NHEC Eversource Unitil Electric LU Gas Unitil Gas Gas Total
Home Energy Internal Admin 487$ 6,407$ 20,193$ 5,899$ 32,986$ 1,376$ 14,222$ 15,598$ 48,584$ Assistance External Admin - 8,985 - - 8,985 - 742 742 9,727
Rebate/Services 16,699 58,591 677,561 39,549 792,400 216 5,796 6,012 798,412 Implementation Services 9,331 12,303 24,089 16,936 62,660 13,525 500 14,025 76,685 Marketing - 1,556 - - 1,556 - - - 1,556 EM&V 2,659 1,213 18,739 524 23,135 4,382 328 4,710 27,845 Total 29,176$ 89,055$ 740,582$ 62,909$ 921,723$ 19,499$ 21,588$ 41,087$ 962,810$
EnergyStar® Homes Internal Admin 1,346$ 1,412$ 7,061$ 2,212$ 12,032$ 95$ 1,032$ 1,127$ 13,159$ External Admin - 1,866 - - 1,866 - - - 1,866 Rebate/Services 2,650 5,455 260,221 1,099 269,426 - 4,782 4,782 274,208 Implementation Services 3,507 15,029 32,479 5,160 56,176 1,343 3,399 4,742 60,918 Marketing 262 343 2,529 - 3,135 1,055 - 1,055 4,190 EM&V 2,038 115 2,518 197 4,868 960 102 1,062 5,931 Total 9,804$ 24,221$ 304,809$ 8,669$ 347,502$ 3,453$ 9,316$ 12,769$ 360,271$
HP w/EnergyStar® Internal Admin 2,830$ 2,263$ 13,627$ 5,899$ 24,619$ 4,463$ 2,270$ 6,733$ 31,352$ External Admin - 2,989 11 2,934 5,934 - 738 738 6,672 Rebate/Services 22,361 14,194 452,199 38,966 527,720 58,649 26,833 85,482 613,202 Implementation Services 5,683 14,625 50,008 20,545 90,861 8,565 12,069 20,634 111,495 Marketing 429 550 724 - 1,703 8,017 - 8,017 9,720 EM&V 6,226 875 15,442 524 23,067 7,171 225 7,396 30,463 Total 37,528$ 35,496$ 532,012$ 68,867$ 673,903$ 86,865$ 42,135$ 129,000$ 802,903$
EnergyStar® Products Internal Admin 467$ 3,851$ 13,627$ 4,793$ 22,738$ 1,156$ 5,160$ 6,316$ 29,054$ External Admin - 5,086 - 8,627 13,714 - 1,248 1,248 14,962 Rebate/Services 3,081 23,626 151,009 37,308 215,024 23,392 35,477 58,869 273,893 Implementation Services 8,921 25,708 19,145 11,979 65,753 17,294 11,097 28,390 94,144 Marketing 501 2,004 31,453 2,750 36,709 12,351 865 13,216 49,924 EM&V 1,744 314 7,395 426 9,879 5,075 512 5,587 15,466 Total 14,715$ 60,590$ 222,629$ 65,883$ 363,817$ 59,268$ 54,357$ 113,626$ 477,443$
20 of 32

New Hampshire CORE Energy Efficiency ProgramsNHPUC Docket No. DE 14-216
1st Quarter ReportJanuary 2016 - March 2016
Expenses by ActivityResidential Programs (Continued)
Electric Utilities Gas UtilitiesLiberty Sub-total Sub-total Grand
Description Utilities NHEC Eversource Unitil Electric LU Gas Unitil Gas Gas TotalOther* Internal Admin 1,027$ -$ 1,858$ 2,023$ 4,909$ 382$ -$ 382$ 5,290$
External Admin - - - - - - - - - Rebate/Services - - 203,084 3,210 206,294 58,000 - 58,000 264,294 Implementation Services - - 1,014 - 1,014 4,223 - 4,223 5,237 Marketing - - - 3,539 3,539 3,699 1,941 5,640 9,180 EM&V - - 12,440 - 12,440 3,658 - 3,658 16,098 Total 1,027$ -$ 218,396$ 8,773$ 228,196$ 69,962$ 1,941$ 71,903$ 300,099$
Total Residential Internal Admin 6,158$ 13,933$ 56,366$ 20,827$ 97,283$ 7,472$ 22,684$ 30,156$ 127,439$ External Admin - 18,926 11 11,561 30,498 - 2,728 2,728 33,226 Rebate/Services 44,791 101,866 1,744,075 120,132 2,010,863 140,258 72,888 213,145 2,224,009 Implementation Services 27,441 67,667 126,736 54,620 276,464 44,950 27,065 72,014 348,479 Marketing 1,193 4,454 34,706 6,290 46,642 25,122 2,806 27,928 74,570 EM&V 12,668 2,517 56,534 1,671 73,390 21,246 1,167 22,413 95,803 Total 92,251$ 209,362$ 2,018,427$ 215,101$ 2,535,141$ 239,047$ 129,337$ 368,385$ 2,903,526$
Total % Internal Admin 6.7% 6.7% 2.8% 9.7% 3.8% 3.1% 17.5% 8.2% 4.4%External Admin 0.0% 9.0% 0.0% 5.4% 1.2% 0.0% 2.1% 0.7% 1.1%Rebate/Services 48.6% 48.7% 86.4% 55.8% 79.3% 58.7% 56.4% 57.9% 76.6%Implementation Services 29.7% 32.3% 6.3% 25.4% 10.9% 18.8% 20.9% 19.5% 12.0%Marketing 1.3% 2.1% 1.7% 2.9% 1.8% 10.5% 2.2% 7.6% 2.6%EM&V 13.7% 1.2% 2.8% 0.8% 2.9% 8.9% 0.9% 6.1% 3.3%Total 100.0% 100.0% 100.0% 100.0% 100.0% 100.0% 100.0% 100.0% 100.0%
* Other includes company-specific programs, education, forward capacity market and loan program implementation expenses.
21 of 32

New Hampshire CORE Energy Efficiency ProgramsNHPUC Docket No. DE 14-216
1st Quarter ReportJanuary 2016 - March 2016
Expenses by ActivityC&I and Municipal Programs
Gas UtilitiesLiberty Sub-total Sub-total GrandUtilities NHEC Eversource Unitil Electric LU Gas Unitil Gas Gas Total
Large Business Energy Internal Admin 665$ 1,302$ 36,049$ 9,218$ 47,234$ 1,145$ 5,160$ 6,305$ 53,539$ Solutions External Admin - 1,720 - - 1,720 - - - 1,720
Rebate/Services 199,482 7,875 469,481 29,131 705,968 47,825 13,463 61,287 767,256 Implementation Services 22,619 9,956 130,697 13,968 177,240 20,402 16,958 37,360 214,600 Marketing 1,483 316 2,621 - 4,420 8,418 24 8,442 12,863 EM&V 3,951 106 18,250 819 23,126 10,205 512 10,717 33,843 Total 228,201$ 21,276$ 657,097$ 53,135$ 959,709$ 87,995$ 36,116$ 124,111$ 1,083,820$
Small Business Energy Internal Admin 945$ 2,421$ 16,972$ 5,899$ 26,237$ 1,376$ 3,715$ 5,091$ 31,328$ Solutions External Admin - 3,198 - - 3,198 - 772 772 3,970
Rebate/Services 13,289 16,465 270,141 130,577 430,472 41,185 2,948 44,133 474,605 Implementation Services 13,513 15,506 89,740 15,661 134,421 21,086 5,852 26,938 161,359 Marketing 964 588 78 - 1,630 6,882 781 7,663 9,293 EM&V 5,121 197 9,581 524 15,424 5,574 369 5,942 21,366 Total 33,832$ 38,375$ 386,512$ 152,662$ 611,381$ 76,104$ 14,436$ 90,540$ 701,921$
Municipal Internal Admin 139$ 836$ 11,149$ 3,713$ 15,837$ -$ -$ -$ 15,837$ External Admin - 1,104 - - 1,104 - - - 1,104 Rebate/Services 3,120 3,964 83,696 50,268 141,049 - - - 141,049 Implementation Services 5,623 8,188 14,640 3,726 32,177 - - - 32,177 Marketing 375 203 - - 578 - - - 578 EM&V 3,060 68 5,607 262 8,997 - - - 8,997 Total 12,317$ 14,363$ 115,093$ 57,969$ 199,742$ -$ -$ -$ 199,742$
Other* Internal Admin 1,362$ 423$ 3,345$ 3,332$ 8,461$ -$ -$ -$ 8,461$ External Admin - 559 -$ - 559 - - - 559 Rebate/Services 3,900 3,349 318,647$ - 325,896 250 740 990 326,886 Implementation Services - 1,934 17,229$ - 19,163 - - - 19,163 Marketing - 103 773$ 4,400 5,275 - 2,296 2,296 7,571 EM&V - 34 21,338$ - 21,373 - - - 21,373 Total 5,262$ 6,403$ 361,332$ 7,732$ 380,728$ 250$ 3,036$ 3,286$ 384,014$
* Other includes company-specific programs, education, forward capacity market and loan program implementation expenses.
Electric Utilities
22 of 32
New Hampshire CORE Energy Efficiency ProgramsNHPUC Docket No. DE 14-216
1st Quarter ReportJanuary 2016 - March 2016
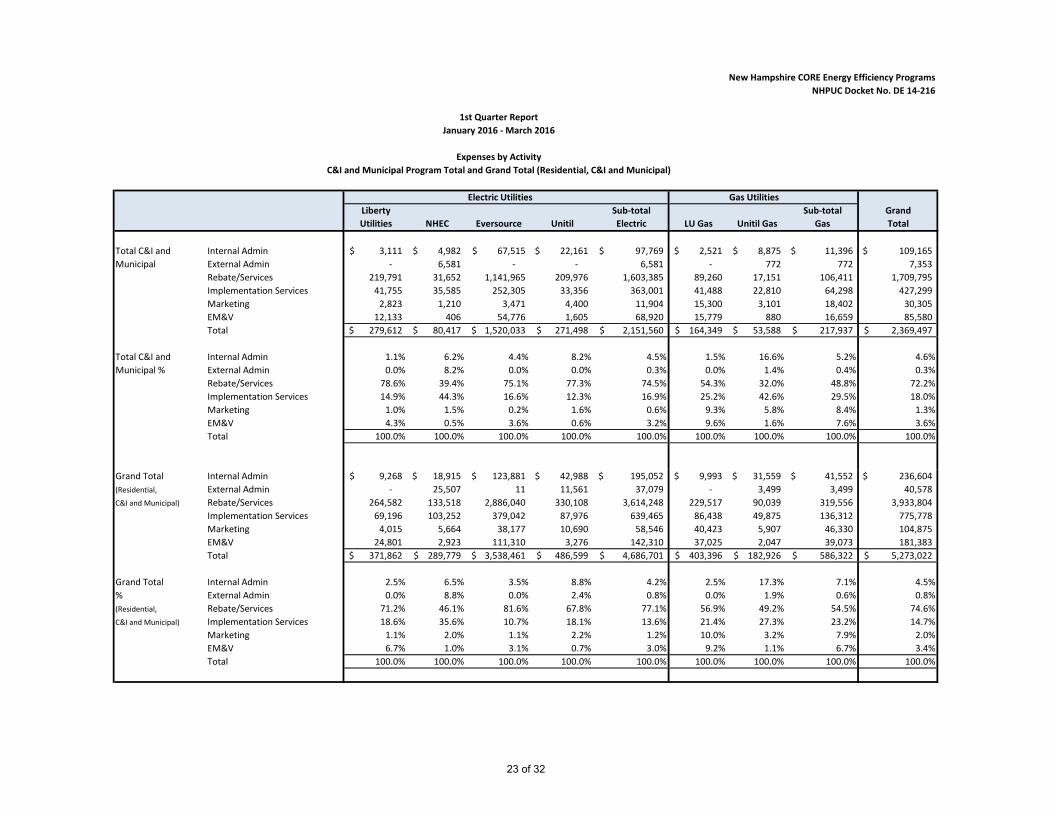
Expenses by ActivityC&I and Municipal Program Total and Grand Total (Residential, C&I and Municipal)
Electric Utilities Gas UtilitiesLiberty Sub-total Sub-total GrandUtilities NHEC Eversource Unitil Electric LU Gas Unitil Gas Gas Total
Total C&I and Internal Admin 3,111$ 4,982$ 67,515$ 22,161$ 97,769$ 2,521$ 8,875$ 11,396$ 109,165$ Municipal External Admin - 6,581 - - 6,581 - 772 772 7,353
Rebate/Services 219,791 31,652 1,141,965 209,976 1,603,385 89,260 17,151 106,411 1,709,795 Implementation Services 41,755 35,585 252,305 33,356 363,001 41,488 22,810 64,298 427,299 Marketing 2,823 1,210 3,471 4,400 11,904 15,300 3,101 18,402 30,305 EM&V 12,133 406 54,776 1,605 68,920 15,779 880 16,659 85,580 Total 279,612$ 80,417$ 1,520,033$ 271,498$ 2,151,560$ 164,349$ 53,588$ 217,937$ 2,369,497$
Total C&I and Internal Admin 1.1% 6.2% 4.4% 8.2% 4.5% 1.5% 16.6% 5.2% 4.6%Municipal % External Admin 0.0% 8.2% 0.0% 0.0% 0.3% 0.0% 1.4% 0.4% 0.3%
Rebate/Services 78.6% 39.4% 75.1% 77.3% 74.5% 54.3% 32.0% 48.8% 72.2%Implementation Services 14.9% 44.3% 16.6% 12.3% 16.9% 25.2% 42.6% 29.5% 18.0%Marketing 1.0% 1.5% 0.2% 1.6% 0.6% 9.3% 5.8% 8.4% 1.3%EM&V 4.3% 0.5% 3.6% 0.6% 3.2% 9.6% 1.6% 7.6% 3.6%Total 100.0% 100.0% 100.0% 100.0% 100.0% 100.0% 100.0% 100.0% 100.0%
Grand Total Internal Admin 9,268$ 18,915$ 123,881$ 42,988$ 195,052$ 9,993$ 31,559$ 41,552$ 236,604$ (Residential, External Admin - 25,507 11 11,561 37,079 - 3,499 3,499 40,578 C&I and Municipal) Rebate/Services 264,582 133,518 2,886,040 330,108 3,614,248 229,517 90,039 319,556 3,933,804
Implementation Services 69,196 103,252 379,042 87,976 639,465 86,438 49,875 136,312 775,778 Marketing 4,015 5,664 38,177 10,690 58,546 40,423 5,907 46,330 104,875 EM&V 24,801 2,923 111,310 3,276 142,310 37,025 2,047 39,073 181,383 Total 371,862$ 289,779$ 3,538,461$ 486,599$ 4,686,701$ 403,396$ 182,926$ 586,322$ 5,273,022$
Grand Total Internal Admin 2.5% 6.5% 3.5% 8.8% 4.2% 2.5% 17.3% 7.1% 4.5%% External Admin 0.0% 8.8% 0.0% 2.4% 0.8% 0.0% 1.9% 0.6% 0.8%(Residential, Rebate/Services 71.2% 46.1% 81.6% 67.8% 77.1% 56.9% 49.2% 54.5% 74.6%C&I and Municipal) Implementation Services 18.6% 35.6% 10.7% 18.1% 13.6% 21.4% 27.3% 23.2% 14.7%
Marketing 1.1% 2.0% 1.1% 2.2% 1.2% 10.0% 3.2% 7.9% 2.0%EM&V 6.7% 1.0% 3.1% 0.7% 3.0% 9.2% 1.1% 6.7% 3.4%Total 100.0% 100.0% 100.0% 100.0% 100.0% 100.0% 100.0% 100.0% 100.0%
23 of 32

New Hampshire CORE Energy Efficiency ProgramsNHPUC Docket No. DE 14-216
Electric Utilities Gas UtilitiesLiberty Sub-total Sub-total Grand
Description Utilities NHEC Eversource Unitil Electric LU Gas Unitil Gas Gas Total
Annual Budget 1 180,942$ 82,473$ 874,330$ 155,828$ 1,293,573$ 335,809$ 40,876$ 376,685$ 1,670,258$
Actual Expenses 2 Qtr. 1 24,801$ 2,923$ 111,310$ 3,276$ 142,310$ 37,025$ 2,047$ 39,073$ 181,383$ Qtr. 2 - - - - - - - - -$ Qtr. 3 - - - - - - - - -$ Qtr. 4 - - - - - - - - -$ Total 24,801$ 2,923$ 111,310$ 3,276$ 142,310$ 37,025$ 2,047$ 39,073$ 181,383$
Notes:(1) The Evaluation, Monitoring and Verification budget is based on 5% of the annual NH CORE Energy Efficiency Program budget.(2) The actual EM&V expenses for each program are included in the expense totals reported for each program.(3) Status of EM&V Studies:
Est. Cost Vendor StatusNE Avoided Energy Supply Cost Study (2015) $38,000 TCR Completed: 3-27-2015 (Revised 3-25-2016) - Peak/Super Peak Avoided Cost Study $10,000 TCR Completed: 3-7-2016Treat/Otter Auditing/Tracking Software $150,000 PSD Annual cost billed monthlyNEEP/CEE Regional/National M&E: $100,000 NEEP Ongoing - Early Replacement Measures, Phase 2 (Gas) Evergreen Economics Completed: 11-4-20152015 Carryover Initiatives NEEP Webinar/Conference Schedule - Incremental Cost Research (Emerging Technologies) NEEP ECD: Q2 2016 June 6, 1:00 PM: Emerging Technologies Incremental Cost Research - Net Savings Guidelines & Supporting Research NEEP ECD: Q2 2016 May 26, 2:30 PM: Forum Net Savings Guidelines Webinar - Loadshape Data Catalog NEEP ECD: Q3, 20162016 Initiatives - Steering Committee Facilitation & Info Exchange NEEP Ongoing June 13-14: NEEP Summit at Bretton Woods, NH - EM&V Protocols, Reporting Tools & Training NEEP Ongoing - EM&V 2.0 - Advanced Data Collection & Data Analytics NEEP Ongoing June 23, 1-3 PM: EM&V 2.0 Webinar - EM&V for EE & Demand Side Energy Resources Integration NEEP Ongoing Sep 21-22: Home Energy Management Systems & EM&V 2.0 Workshop (CT) - EM&V for New Technologies & Program Models NEEP ECD: Q4 2016 - State EE Data Analysis & Trends (REED database) NEEP ECD: Q4 2016Energy Star Homes - Process & Impact Evaluation $160,000 ERS ECD: 2016 (ERS Hired, Kickoff meeting held 4-8-2016)Energy Star Appliance Program - Impact Evaluation tbd tbd ECD: 2015-2016Home Energy Reports Pilot Program Evaluation (Eversource) $61,000 Navigant Completed: 3-24-2016.
Evaluations available at: http://www.puc.state.nh.us/Electric/Monitoring%20and%20Evaluation%20Reports/Monitoring_Evaluation_Report_List.htm
1st Quarter ReportJanuary 2016 - March 2016
Evaluation, Monitoring and Verification (EM&V)
24 of 32

New Hampshire CORE Energy Efficiency ProgramsNHPUC Docket No. DE 14-216
Electric UtilitiesLiberty
Description Utilities NHEC Eversource Unitil
Amount Available to LoanRevolving Loan Fund 1 303,000$ 300,000$ 690,000$ 800,250$ Less: Loans 465,037 534,872 1,411,731 1,143,066 Plus: Loan Payments Received 209,049 333,305 878,093 616,855 Current Balance 47,012 98,433 156,362 274,039 Less: Loans in Process - 3,662 - - Less: Potential Loans - - 12,000 - Amount Available to Loan 47,012$ 94,771$ 144,362$ 274,039$
Maximum Loans and Maximum Term
Residential Maximum Loan 500$ 7,500$ 7,500$ 7,500$ Maximum Term 2 Years 7 Years 7 Years 7 Years
Municipal and C&I 2 Maximum Loan 50,000$ 50,000$ Maximum Term 2 years Smart Start Smart Start 10 Years
Year-to-date Project Financing InformationResidential No. of Projects Financed - 4 2 1
Average Loan Amount N/A 1,991$ 1,493$ 2,849$
Municipal and C&I 2 No. of Projects Financed - - - - Average Loan Amount N/A N/A N/A N/A
Notes:(1) Includes funds from a RGGI-funded grant awarded to the Electric Utilities in 2009 and CORE Program funds.(2) Not applicable to the NHEC and PSNH. Utilize SmartStart Loan Program.
1st Quarter ReportJanuary 2016 - March 2016
Revolving Loan Fund (RLF)
25 of 32
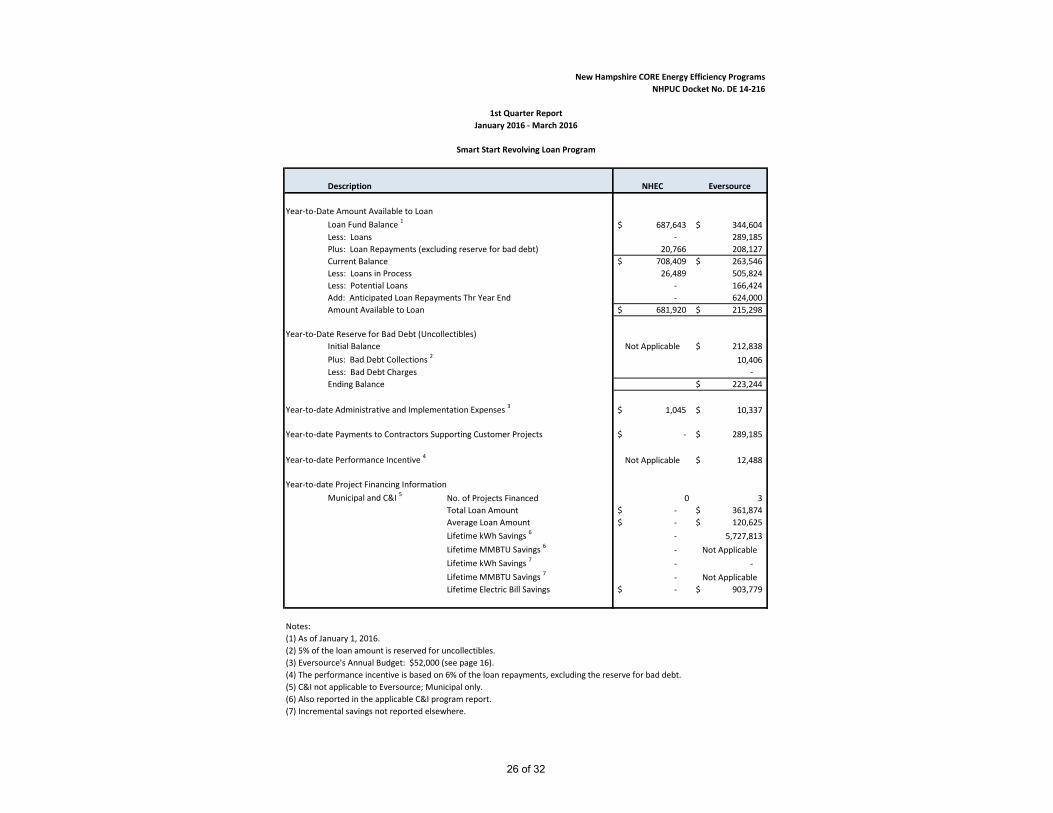
New Hampshire CORE Energy Efficiency ProgramsNHPUC Docket No. DE 14-216
Description NHEC Eversource
Year-to-Date Amount Available to LoanLoan Fund Balance 1 687,643$ 344,604$ Less: Loans - 289,185 Plus: Loan Repayments (excluding reserve for bad debt) 20,766 208,127 Current Balance 708,409$ 263,546$ Less: Loans in Process 26,489 505,824 Less: Potential Loans - 166,424 Add: Anticipated Loan Repayments Thr Year End - 624,000 Amount Available to Loan 681,920$ 215,298$
Year-to-Date Reserve for Bad Debt (Uncollectibles)Initial Balance Not Applicable 212,838$ Plus: Bad Debt Collections 2 10,406 Less: Bad Debt Charges - Ending Balance 223,244$
Year-to-date Administrative and Implementation Expenses 3 1,045$ 10,337$
Year-to-date Payments to Contractors Supporting Customer Projects -$ 289,185$
Year-to-date Performance Incentive 4 Not Applicable 12,488$
Year-to-date Project Financing InformationMunicipal and C&I 5 No. of Projects Financed 0 3
Total Loan Amount -$ 361,874$ Average Loan Amount -$ 120,625$ Lifetime kWh Savings 6 - 5,727,813 Lifetime MMBTU Savings 6 - Not ApplicableLifetime kWh Savings 7 - - Lifetime MMBTU Savings 7 - Not ApplicableLifetime Electric Bill Savings -$ 903,779$
Notes:(1) As of January 1, 2016. (2) 5% of the loan amount is reserved for uncollectibles. (3) Eversource's Annual Budget: $52,000 (see page 16). (4) The performance incentive is based on 6% of the loan repayments, excluding the reserve for bad debt.(5) C&I not applicable to Eversource; Municipal only.(6) Also reported in the applicable C&I program report.(7) Incremental savings not reported elsewhere.
1st Quarter ReportJanuary 2016 - March 2016
Smart Start Revolving Loan Program
26 of 32

New Hampshire CORE Energy Efficiency ProgramsNHPUC Docket No. DE 14-216
Electric Utilities Gas UtilitiesLiberty Sub-total Sub-total Grand
Description Utilities NHEC Eversource Unitil1 Electric LU Gas Unitil Gas1 Gas Total
Amount Available for Interest Rate Buy-DownsBeginning Balance2 4,780$ 8,000$ 10,000$ -$ 22,780$ 36,920$ 2,000$ 38,920$ 61,700$ Less: Interest Rate Buy-Downs Paid 188$ -$ 4,878$ -$ 5,066$ 3,980$ 25$ 4,005$ 9,071$ Current Balance 4,592$ 8,000$ 5,122$ -$ 17,714$ 32,940$ 1,975$ 34,915$ 52,629$ Less: Potential Interest Rate Buy-Downs3 -$ -$ 3,768$ -$ 3,768$ -$ -$ -$ 3,768$ Amount Available for Interest Rate Buy-Downs 4,592$ 8,000$ 1,354$ -$ 13,946$ 32,940$ 1,975$ 34,915$ 48,861$
Year-to-date Project Loan InformationNo. of Projects Financed 1 - 9 - 10 6 1 7 17 Total Project Cost4 9,116$ -$ 91,702$ -$ 100,818$ 49,192$ 5,229$ 54,421$ 155,239$ Average Project Cost4 9,116$ - 10,189$ - 10,082$ 8,199$ 5,229$ 7,774$ 9,132$
Total Loan Amount 2,879$ -$ 49,930$ -$ 52,809$ 38,772$ 2,000$ 40,772$ 93,581$ Average Loan Amount 2,879$ - 5,548$ - 5,281$ 6,462$ 2,000$ 5,825$ 5,505$ Average Loan Term (years) 3.0 - 4.2 - 4.1 4.5 2.0 4.1 4.1
Total Interest Rate Buy-Down Amount 188$ -$ 4,878$ -$ 5,066$ 3,980$ 25$ 4,005$ 9,071$ Average Interest Rate Buy-Down Amount 188$ - 542$ - 507$ 663$ 25$ 572$ 534$
Average Gross Interest Rate 6.49% 0.00% 6.55% 0.00% 6.54% 6.57% 5.99% 6.49% 6.52%Average Customer Interest Rate 2.00% 2.00% 2.00% 2.00% 2.00% 2.00% 2.00% 2.00% 2.00%
Average Sq. Footage of Home (HPwES Projects) 1,103 - 2,491 - 2,352 1,015 2,115 1,172 1,866 Total Estimated Annual Space Heating Energy Savings (MMBtu)5 8 - 465 - 473 121 23 144 617 Average Estimated Annual Space Heating Energy Savings (MMBtu) 8 - 52 - 47 12 23 21 36
No. of Loan Write-offs - - - - - - - - - Total Loan Write-off Amount -$ -$ -$ -$ -$ -$ -$ -$ -$ Pre-paid Interest Rate Buy-Down Amount Associated with Loan Write-off -$ -$ -$ -$ -$ -$ -$ -$ -$
Notes:(1) Given the availability of Better Buildings funding, Unitil and Unitil Gas did not budget CORE funding to be used for third party interest rate buy-downs. However, for any customer falling outside of the parameters of the Better Buildings program, Unitil and Unitil Gas will pay for the interest rate buy-down out of its electric or gas Home Performance with ENERGY STAR program budgets.(2 As of January 1, 2015.(3) Estimated based on outstanding loan authorizations.(4) Includes utility and customer costs.(5) Also reported in the applicable Residential program reports. Includes space heating savings associated with all fuel sources.
1st Quarter ReportJanuary 2016 - March 2016
Residential Third Party Financing OptionFunded Through the CORE Programs
27 of 32

New Hampshire CORE Energy Efficiency ProgramsNHPUC Docket No. DE 14-216
Electric Utilities Gas UtilitiesLiberty Sub-total Sub-total Grand
Description Utilities NHEC Eversource Unitil Electric LU Gas Unitil Gas Gas Total
Amount Available for Interest Rate Buy-DownsBeginning Balance1 9,540$ 11,250$ 78,390$ 13,920$ 113,100$ 31,980$ 4,920$ 36,900$ 150,000$ Less: Interest Rate Buy-Downs Paid -$ -$ 147$ -$ 147$ -$ -$ -$ 147$ Current Balance 9,540$ 11,250$ 78,243$ 13,920$ 112,953$ 31,980$ 4,920$ 36,900$ 149,853$ Less: Potential Interest Rate Buy-Downs2 -$ -$ 2,319$ -$ 2,319$ -$ -$ -$ 2,319$ Amount Available for Interest Rate Buy-Downs 9,540$ 11,250$ 75,924$ 13,920$ 110,634$ 31,980$ 4,920$ 36,900$ 147,534$
Year-to-date Project Loan InformationNo. of Projects Financed - - 1 - 1 - - - 1 Total Project Cost3 -$ -$ 7,273$ -$ 7,273$ -$ -$ -$ 7,273$ Average Project Cost3 - - 7,273$ - 7,273$ - - - 7,273$
Total Loan Amount -$ -$ 3,254$ -$ 3,254$ -$ -$ -$ 3,254$ Average Loan Amount - - 3,254$ - 3,254$ - - - 3,254$ Average Loan Term (years) - - 2.0 - 2.0 - - - 2.0
Total Interest Rate Buy-Down Amount -$ -$ 147$ -$ 147$ -$ -$ -$ 147$ Average Interest Rate Buy-Down Amount - - 147$ - 147$ - - - 147$
Average Gross Interest Rate 0.00% 0.00% 6.50% 0.00% 6.50% 0.00% 0.00% 0.00% 6.50%Average Customer Interest Rate 2.00% 2.00% 2.00% 2.00% 2.00% 2.00% 2.00% 2.00% 2.00%
Average Sq. Footage of Home (HPwES Projects) - - 1,467 - 1,467 - - - 1,467 Total Estimated Annual Space Heating Energy Savings (MMBtu)4 - - 44 - 44 - - - 44$ Average Estimated Annual Space Heating Energy Savings (MMBtu) - - 44 - 44 - - - 44
No. of Loan Write-offs - - - - - - - - - Total Loan Write-off Amount -$ -$ -$ -$ -$ -$ -$ -$ -$ Pre-paid Interest Rate Buy-Down Amount Associated with Loan Write-off -$ -$ -$ -$ -$ -$ -$ -$ -$
Notes:(1) As of January 1, 2015.(2) Estimated based on outstanding loan authorizations.(3) Includes utility and customer costs.(4) Also reported in the applicable Residential program reports. Includes space heating savings associated with all fuel sources.
1st Quarter ReportJanuary 2016 - March 2016
Residential Third Party Financing OptionFunded Through BetterBuildings OEP/CDFA Collaboration
28 of 32

New Hampshire CORE Energy Efficiency ProgramsNHPUC Docket No. DE 14-216
Actual Customers Served, Program Expenses, Lifetime kWh and MMBtu Savings
LU Electric NHEC Eversource Unitil Electric Total Home Energy Assistance Number of Units / Lifetime kWh Savings 6 117,948 11 248,036 116 2,403,666 10 307,680 143 3,077,331 Expenses / Lifetime MMBtu Savings $29,176 3,931 $89,055 4,079 $740,582 49,790 $62,909 8,306 $921,723 66,106
Home Performance w/ENERGY STAR Number of Rebates / Lifetime kWh Savings 6 142,915 5 88,994 195 2,706,563 25 382,102 231 3,320,574 Expenses / Lifetime MMBtu Savings $37,528 959 $35,496 1,369 $532,012 97,070 $68,867 14,314 $673,903 113,712
ENERGY STAR Homes Number of Homes / Lifetime kWh Savings 1 376,528 2 2,912,098 126 6,754,222 1 21,695 130 10,064,542 Expenses / Lifetime MMBtu Savings $9,804 0 $24,221 3,425 $304,809 86,965 $8,669 1,650 $347,502 92,040
ENERGY STAR Products Number of Rebates / Lifetime kWh Savings 286 557,945 1,234 1,734,484 4,412 6,306,253 3,212 4,585,089 8,866 49,214,130 Expenses / Lifetime MMBtu Savings $14,715 232 $60,590 15 $222,629 2,925 $65,883 206 $363,817 3,146
Large Business Energy Solutions Number of Participants / Lifetime kWh Savings 7 36,588,304 1 1,668,226 31 53,706,089 4 6,741,462 39 63,780,143 Expenses / Lifetime MMBtu Savings $228,201 0 $21,276 0 $657,097 0 $53,135 0 $959,709 0
Small Business Energy Solutions Number of Participants / Lifetime kWh Savings 3 1,664,367 3 835,068 36 12,501,980 17 4,029,194 59 19,030,609 Expenses / Lifetime MMBtu Savings $33,832 0 $38,375 0 $386,512 0 $152,662 0 $611,381 0
Municipal Program Number of Participants / Lifetime kWh Savings 0 0 1 0 8 2,181,077 3 1,246,019 12 3,427,096 Expenses / Lifetime MMBtu Savings $12,317 0 $14,363 620 $115,093 11,564 $57,969 7,855 $199,742 20,039
Educational Programs Expenses $3,900 $5,358 $16,812 $11,149 $37,219
Company Specific Programs / FCM Expenses Number of Participants / Lifetime kWh Savings 0 0 0 0 534,833 6,051,568 0 0 534,833 6,051,568 Expenses / Lifetime MMBtu Savings $2,389 0 $0 0 $552,579 0 $5,355 0 $560,323 0
Smart Start (NHEC/PSNH), RLF (UES) Expenses $0 $1,045 $10,337 $0 $11,382
Total Program Expenses $371,862 $289,779 $3,538,461 $486,599 $4,686,701
1st Quarter ReportJanuary 2016 - March 2016
Electric Programs
29 of 32

New Hampshire CORE Energy Efficiency ProgramsNHPUC Docket No. DE 14-216
LU Electric NHEC Eversource Unitil Electric Total Home Energy Assistance Number of Units / Lifetime kWh Savings 5 104,673 10 217,530 102 2,122,163 9 274,430 126 2,718,795 Expenses / Lifetime MMBtu Savings $25,892 3,488 $78,102 3,577 $653,849 43,959 $56,111 7,408 $813,955 58,433
Home Performance w/ENERGY STAR Number of Rebates / Lifetime kWh Savings 6 142,915 5 88,994 195 2,706,563 25 382,102 226 3,554,187 Expenses / Lifetime MMBtu Savings $37,528 959 $35,496 1,369 $532,012 97,070 $68,867 14,314 $673,903 112,753
ENERGY STAR Homes Number of Homes / Lifetime kWh Savings 1 376,528 2 2,912,098 126 6,754,222 1 21,695 130 10,064,542 Expenses / Lifetime MMBtu Savings $9,804 0 $24,221 3,425 $304,809 86,965 $8,669 1,650 $347,502 92,040
ENERGY STAR Products Number of Rebates / Lifetime kWh Savings 286 557,945 1,234 1,734,484 4,412 6,306,253 3,212 4,585,089 8,866 49,214,130 Expenses / Lifetime MMBtu Savings $14,715 232 $60,590 15 $222,629 2,925 $65,883 206 $363,817 3,146
Large Business Energy Solutions Number of Participants / Lifetime kWh Savings 7 36,588,304 1 1,668,226 31 53,706,089 4 6,741,462 39 63,780,143 Expenses / Lifetime MMBtu Savings $228,201 0 $21,276 0 $657,097 0 $53,135 0 $959,709 0
Small Business Energy Solutions Number of Participants / Lifetime kWh Savings 3 1,664,367 3 835,068 36 12,501,980 17 4,029,194 59 19,030,609 Expenses / Lifetime MMBtu Savings $33,832 0 $38,375 0 $386,512 0 $152,662 0 $611,381 0
Municipal Program Number of Participants / Lifetime kWh Savings 0 0 0 0 0 0 0 0 0 0 Expenses / Lifetime MMBtu Savings $0 0 $0 0 $0 0 $0 0 $0 0
Educational Programs Expenses $3,900 $5,358 $16,812 $11,149 $37,219
Company Specific Programs / FCM Expenses Number of Participants / Lifetime kWh Savings 0 0 0 0 534,833 6,051,568 0 0 534,833 6,051,568 Expenses / Lifetime MMBtu Savings $2,389 0 $0 0 $552,579 0 $5,355 0 $560,323 0
Smart Start (NHEC/PSNH), RLF (UES) Expenses $0 $1,045 $10,337 $0 $11,382
Total Program Expenses $356,261 $264,463 $3,336,635 $421,831 $4,379,191
1st Quarter ReportJanuary 2016 - March 2016
Electric Programs
(System Benefits Charge, Forward Capacity Market and Interest Funds Only) *
Actual Customers Served, Program Expenses, Lifetime kWh and MMBtu Savings
30 of 32

New Hampshire CORE Energy Efficiency ProgramsNHPUC Docket No. DE 14-216
LU Electric NHEC Eversource Unitil Electric Total Home Energy Assistance Number of Units / Lifetime kWh Savings 1 13,276 1 30,506 14 281,503 1 33,250 17 358,536 Expenses / Lifetime MMBtu Savings $3,284 442 $10,953 502 $86,733 5,831 $6,798 898 $107,768 7,673
Home Performance w/ENERGY STAR Number of Rebates / Lifetime kWh Savings 0 0 0 0 0 0 0 0 0 0 Expenses / Lifetime MMBtu Savings $0 0 $0 0 $0 0 $0 0 $0 0
ENERGY STAR Homes Number of Homes / Lifetime kWh Savings 0 0 0 0 0 0 0 0 0 0 Expenses / Lifetime MMBtu Savings $0 0 $0 0 $0 0 $0 0 $0 0
ENERGY STAR Products Number of Rebates / Lifetime kWh Savings 0 0 0 0 0 0 0 0 0 0 Expenses / Lifetime MMBtu Savings $0 0 $0 0 $0 0 $0 0 $0 0
Large Business Energy Solutions Number of Participants / Lifetime kWh Savings 0 0 0 0 0 0 0 0 0 0 Expenses / Lifetime MMBtu Savings $0 0 $0 0 $0 0 $0 0 $0 0
Small Business Energy Solutions Number of Participants / Lifetime kWh Savings 0 0 0 0 0 0 0 0 0 0 Expenses / Lifetime MMBtu Savings $0 0 $0 0 $0 0 $0 0 $0 0
Municipal Program Number of Participants / Lifetime kWh Savings 0 0 1 0 8 2,181,077 3 1,246,019 12 3,427,096 Expenses / Lifetime MMBtu Savings $12,317 0 $14,363 620 $115,093 11,564 $57,969 7,855 $199,742 20,039
Educational Programs Expenses $0 $0 $0 $0 $0
Company Specific Programs / FCM Expenses Number of Participants / Lifetime kWh Savings 0 0 0 0 0 0 0 0 0 0 Expenses / Lifetime MMBtu Savings $0 0 $0 0 $0 0 $0 0 $0 0
Smart Start (NHEC/PSNH), RLF (UES) Expenses $0 $0 $0 $0 $0
Total Program Expenses $15,601 $25,316 $201,825 $64,768 $307,510
*Allocation is based on actual RGGI proceeds apportioned to the HEA and Municipal Programs. Municipal Programs include carryovers.
1st Quarter ReportJanuary 2016 - March 2016
Electric Programs
Actual Customers Served, Program Expenses, Lifetime kWh and MMBtu Savings
(Energy Efficiency Fund Only - Regional Greenhouse Gas Initiative) *
31 of 32

New Hampshire CORE Energy Efficiency ProgramsNHPUC Docket No. DE 14-216
Actual Customers Served, Program Expenses, Lifetime kWh and MMBtu Savings
LU-Gas Unitil-Gas Total Home Energy Assistance Number of Units 11 1 12 Expenses / Lifetime MMBtu Savings $19,499 13,307 $21,588 589 $41,087 13,896
Home Performance w/ENERGY STAR Number of Units 19 17 36 Expenses / Lifetime MMBtu Savings $86,865 11,775 $42,135 8,144 $129,000 19,919
ENERGY STAR Homes Number of Homes 1 1 2 Expenses / Lifetime MMBtu Savings $3,453 19,510 $9,316 2,450 $12,769 21,960
ENERGY STAR Products Number of Rebates 106 34 140 Expenses / Lifetime MMBtu Savings $59,268 25,707 $54,357 10,533 $113,626 36,240
Large Business Energy Solutions Number of Participants 6 1 7 Expenses / Lifetime MMBtu Savings $87,995 30,890 $36,116 15,713 $124,111 46,603
Small Business Energy Solutions Number of Participants 65 2 67 Expenses / Lifetime MMBtu Savings $76,104 70,438 $14,436 1,398 $90,540 71,836
Educational Programs Expenses $250 $4,977 $5,227
Company Specific Programs / FCM Expenses Number of Participants 25,000 0 25,000 Expenses / Lifetime MMBtu Savings $69,962 38,570 $0 0 $69,962 38,570
Total Program Expenses $403,396 $182,926 $586,322
1st Quarter ReportJanuary 2016 - March 2016
Gas Programs
32 of 32