Embed Size (px)
Citation preview
8/14/2019 New Food Systems
http://slidepdf.com/reader/full/new-food-systems 1/30
Richmond RegionalRichmond RegionalFood System AnalysisFood System Analysis January 2006January 2006
8/14/2019 New Food Systems
http://slidepdf.com/reader/full/new-food-systems 2/30
8/14/2019 New Food Systems
http://slidepdf.com/reader/full/new-food-systems 3/30
3
Introduction
Food plays a vital role in the Richmond region’s health, environment, and economy.
The Richmond Region Food System Analysis was developed to provide an overview of the localfood system with current data and statistics for a variety of measures and indicators. This reportwill analyze four processes that make up a food system; these processes include the production,distribution, consumption, and disposal of food in the Richmond region. Examining andunderstanding all of these processes of the regional food system provides a unique viewpointwhich cannot be seen when looking at production or consumption alone. This ‘systems’ picturemay bring greater efficiency to the Richmond region’s food system, by helping to ensure thateveryone has access to affordable, nutritious and culturally appropriate foods, and by helping toensure that the system functions with the principles of public health, social justice, economicstability, and environmental sustainability in mind. This report compiles existing data andstatistics, primarily from secondary or already existing public sources, to illustrate gaps, assetsand opportunities in the Richmond region’s food system. It is intended to stimulate thought andaction and lead to recommendations for making the Richmond region’s local food systemhealthier, more equitable and more sustainable.
What is a food system?
A food system is a complex integrated framework that includes the production, processing,distribution, sale, purchasing, preparation, consumption, and waste disposal of food. (Pirog)Several qualifying terms have been used to describe a food system: simple, complex, local,global and regional. A healthy and ideal food system may be one in which food production,processing, distribution and consumption are integrated to enhance the environmental,economic, social and nutritional health of a particular geographic location. In this case, thegeographic area of interest is the Richmond region. This report will examine the chain of activities that make up the food system, beginning with the production of food and moving onto include the processing, distributing, wholesaling, retailing, and consumption of food, andeventually to the disposal of food waste in the Richmond region.
Why is it important?
There are numerous reasons why the sustainability of the Richmond region’s food systems isimportant. Reasons range from the economy of the region to the environmental vitality of theregion. Nearly 67% of the farms in the U.S. have been lost to development since 1920, due tocorporate pressure and rising land values. In today’s national and global food productionsystem most of the food production and processing occurs far away from where consumers liveand buy their groceries. The dominant trend has been toward industrialization, with increasingcentralization in production and with farmer control over production, marketing, and labordecisions being replaced by corporate control (Welsh, 1997). In areas of high poverty, such asinner cities and remote rural areas, many people are not able to access fresh, locally grown food(Garrett).
8/14/2019 New Food Systems
http://slidepdf.com/reader/full/new-food-systems 4/30
4
ProductionThe first section of this report focuses on the production of food in the Richmond region.Production in the food system refers to the cultivation of plants and the domestication of animals. The Richmond region has over 300,000 acres of farmland, nearly one quarter of theentire land area. Crops produced in the Richmond region range from soybeans to pumpkins.
The Richmond region’s fertile soil and moderate climate make the Richmond regionparticularly well suited for food production. The first part of this report uses data from theUnited States Department of Agriculture (USDA) 2002 Census and information from localextension agencies to examine what and how much food products are produced in the region.This section also looks to food production in other regions in Virginia as a point of comparisonfor the Richmond region.
Distribution The second section of this report focuses on the distribution of food in the Richmond region.Distribution in the food system refers to the networks and processes involved in getting foodfrom the producing farm, factory or warehouse to where it will be purchased, used or
consumed. Nationally, as well as in the Richmond region, most of the food consumed in thewithin the region has traveled from far outside the region before it reaches its final destination.The global distribution system of food products requires a substantial amount of energy in theform of fuel, refrigeration, and the processing and preservation of food products. Food that isdistributed across shorter distances supports people, farms, and businesses closer to theRichmond region. Shorter distribution pathways are also supported because they are lessresource-intensive and less polluting. The distribution section of this report focuses on the 115food wholesalers who are located within the region, as well as some alternative fooddistribution systems that support a more localized regional food network.
Consumption
The third section of this report focuses on food consumption in the Richmond region.Consumption in the food system refers to all activities and processes by which an individualacquires and utilizes food after it has been produced and distributed. This section of the reportexamines the retail food markets in the Richmond region, from the traditional supermarkets tothe corner neighborhood grocery store, and the three farmer’s markets within the Richmondregion. This section of the report also examines access to food in the Richmond region,including low-income food assistance programs as well as the location of various types of retailestablishments.
Waste and Disposal Finally, the fourth section of this report focuses on food waste and disposal in the Richmond
region. Food waste can be converted into useful materials or products through food recyclingprocesses such as composting. For example, leftovers, bread products, outdated/expired foods,fruits and vegetables, meat and fish scraps, plate scrapings, and coffee grounds can all becomposted. Major generators of food and organic waste products include farmers, producecenters, food processors, supermarkets, restaurants, hotels, school and business cafeterias,hospitals, prisons, and community events. Waste from food includes not only the actual foodproducts themselves, but also the packaging materials and containers used to hold foodproducts. The waste and disposal section of this report examines the amount of waste producedin the Richmond region and some methods of reducing the food waste in the region’s landfills.
8/14/2019 New Food Systems
http://slidepdf.com/reader/full/new-food-systems 5/30
5
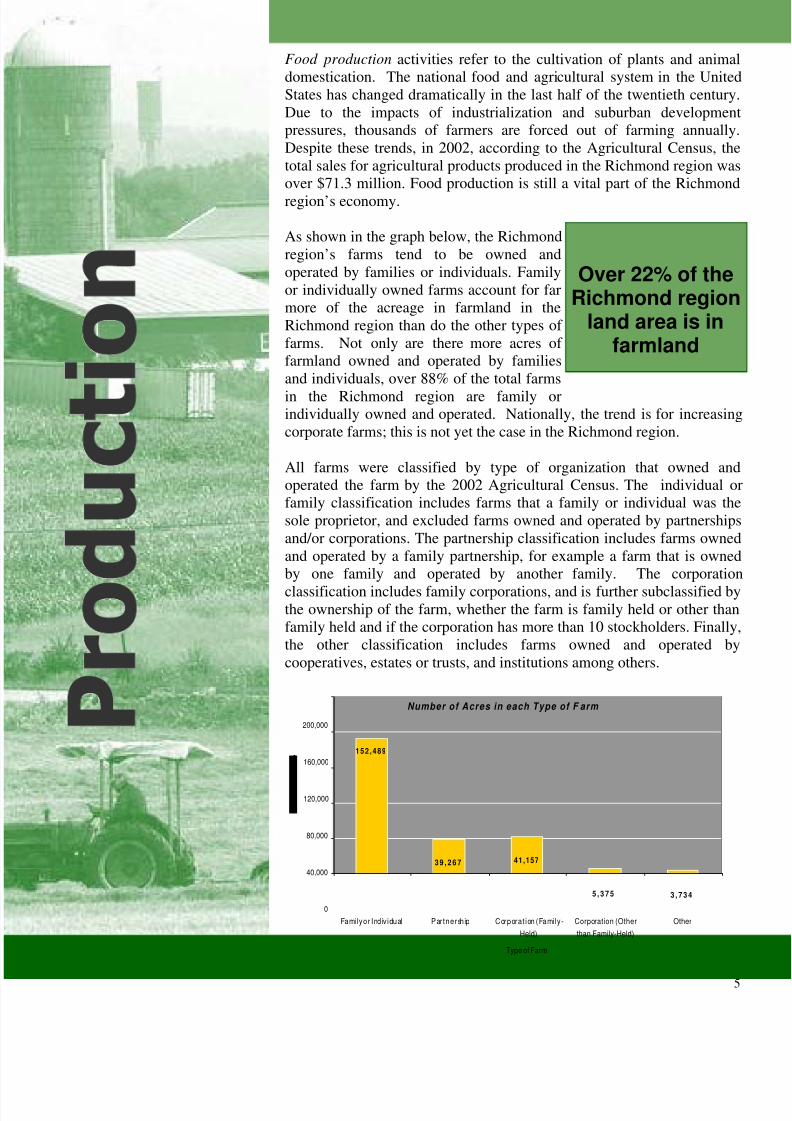
Food production activities refer to the cultivation of plants and animaldomestication. The national food and agricultural system in the UnitedStates has changed dramatically in the last half of the twentieth century.Due to the impacts of industrialization and suburban developmentpressures, thousands of farmers are forced out of farming annually.Despite these trends, in 2002, according to the Agricultural Census, thetotal sales for agricultural products produced in the Richmond region wasover $71.3 million. Food production is still a vital part of the Richmondregion’s economy.
As shown in the graph below, the Richmondregion’s farms tend to be owned andoperated by families or individuals. Familyor individually owned farms account for farmore of the acreage in farmland in theRichmond region than do the other types of farms. Not only are there more acres of farmland owned and operated by familiesand individuals, over 88% of the total farmsin the Richmond region are family orindividually owned and operated. Nationally, the trend is for increasingcorporate farms; this is not yet the case in the Richmond region.
All farms were classified by type of organization that owned andoperated the farm by the 2002 Agricultural Census. The individual orfamily classification includes farms that a family or individual was thesole proprietor, and excluded farms owned and operated by partnershipsand/or corporations. The partnership classification includes farms ownedand operated by a family partnership, for example a farm that is ownedby one family and operated by another family. The corporationclassification includes family corporations, and is further subclassified bythe ownership of the farm, whether the farm is family held or other thanfamily held and if the corporation has more than 10 stockholders. Finally,the other classification includes farms owned and operated bycooperatives, estates or trusts, and institutions among others.
Over 22% of theRichmond region
land area is infarmland
Number of Acres in each Type of F arm
3 9 , 2 6 7 41,157
5 , 3 7 5 3 , 7 3 4
152 ,489
0
40,000
80,000
120,000
160,000
200,000
Family or Individual Partnership Corporation (Family-
Held)
Corporation (Other
than Family-Held)
Other
Type of Farm
8/14/2019 New Food Systems
http://slidepdf.com/reader/full/new-food-systems 6/30
6
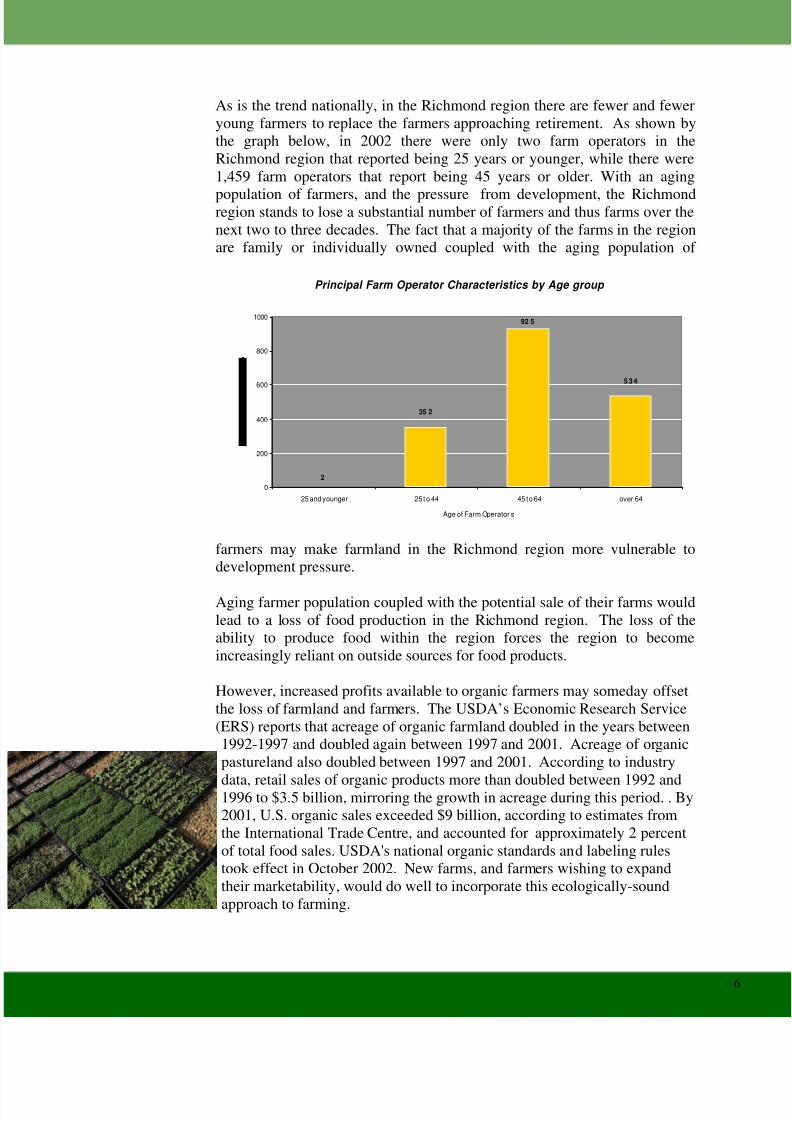
As is the trend nationally, in the Richmond region there are fewer and feweryoung farmers to replace the farmers approaching retirement. As shown bythe graph below, in 2002 there were only two farm operators in theRichmond region that reported being 25 years or younger, while there were1,459 farm operators that report being 45 years or older. With an aging
population of farmers, and the pressure from development, the Richmondregion stands to lose a substantial number of farmers and thus farms over thenext two to three decades. The fact that a majority of the farms in the regionare family or individually owned coupled with the aging population of
farmers may make farmland in the Richmond region more vulnerable todevelopment pressure.
Aging farmer population coupled with the potential sale of their farms wouldlead to a loss of food production in the Richmond region. The loss of theability to produce food within the region forces the region to becomeincreasingly reliant on outside sources for food products.
However, increased profits available to organic farmers may someday offsetthe loss of farmland and farmers. The USDA’s Economic Research Service(ERS) reports that acreage of organic farmland doubled in the years between1992-1997 and doubled again between 1997 and 2001. Acreage of organicpastureland also doubled between 1997 and 2001. According to industry
data, retail sales of organic products more than doubled between 1992 and1996 to $3.5 billion, mirroring the growth in acreage during this period. . By2001, U.S. organic sales exceeded $9 billion, according to estimates fromthe International Trade Centre, and accounted for approximately 2 percentof total food sales. USDA's national organic standards and labeling rulestook effect in October 2002. New farms, and farmers wishing to expandtheir marketability, would do well to incorporate this ecologically-soundapproach to farming.
Principal Farm Operator Characteristics by Age group
2
5 3 4
92 5
35 2
0
200
400
600
800
1000
25 and younger 25 t o 44 45 t o 64 over 64
Age of Farm Operator s
8/14/2019 New Food Systems
http://slidepdf.com/reader/full/new-food-systems 7/30
7
Crops and Food Products in the Richmond Region
According to the 2002 Agricultural Census, the Richmond region was hometo 1,135 farms that actively harvested crops and 687 farms that producedsome kind of livestock product. The Richmond region as a whole produces
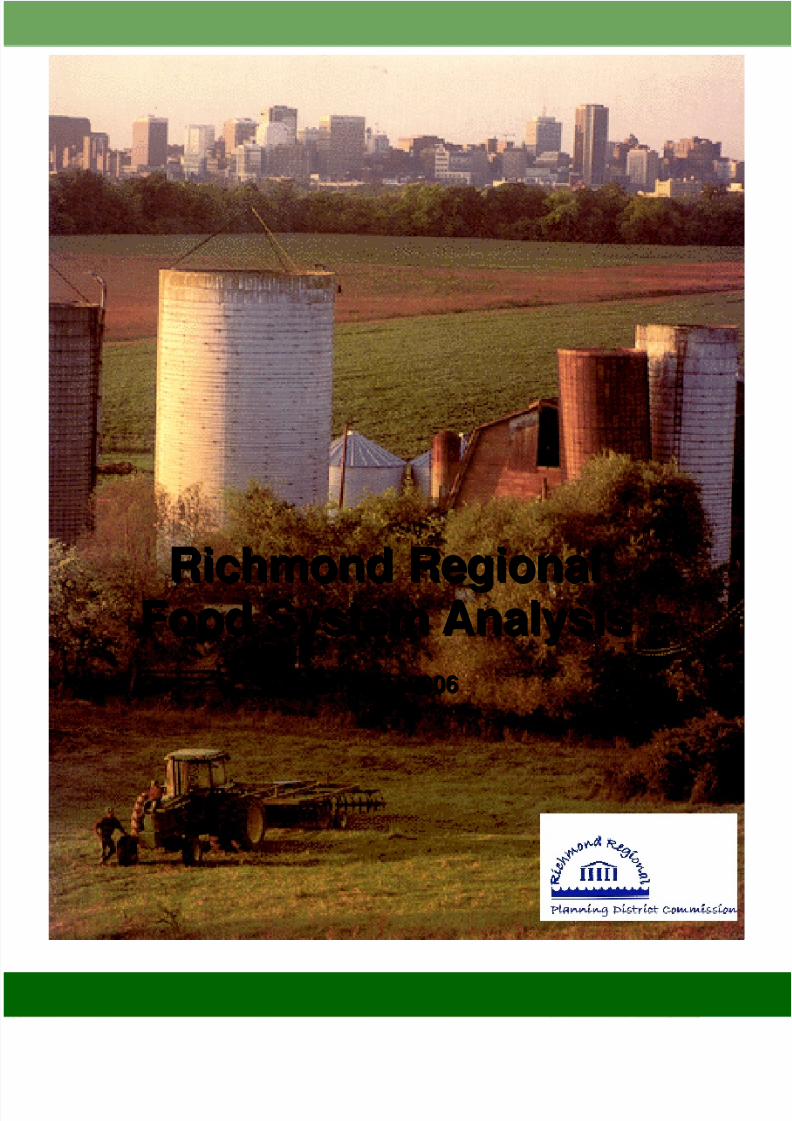
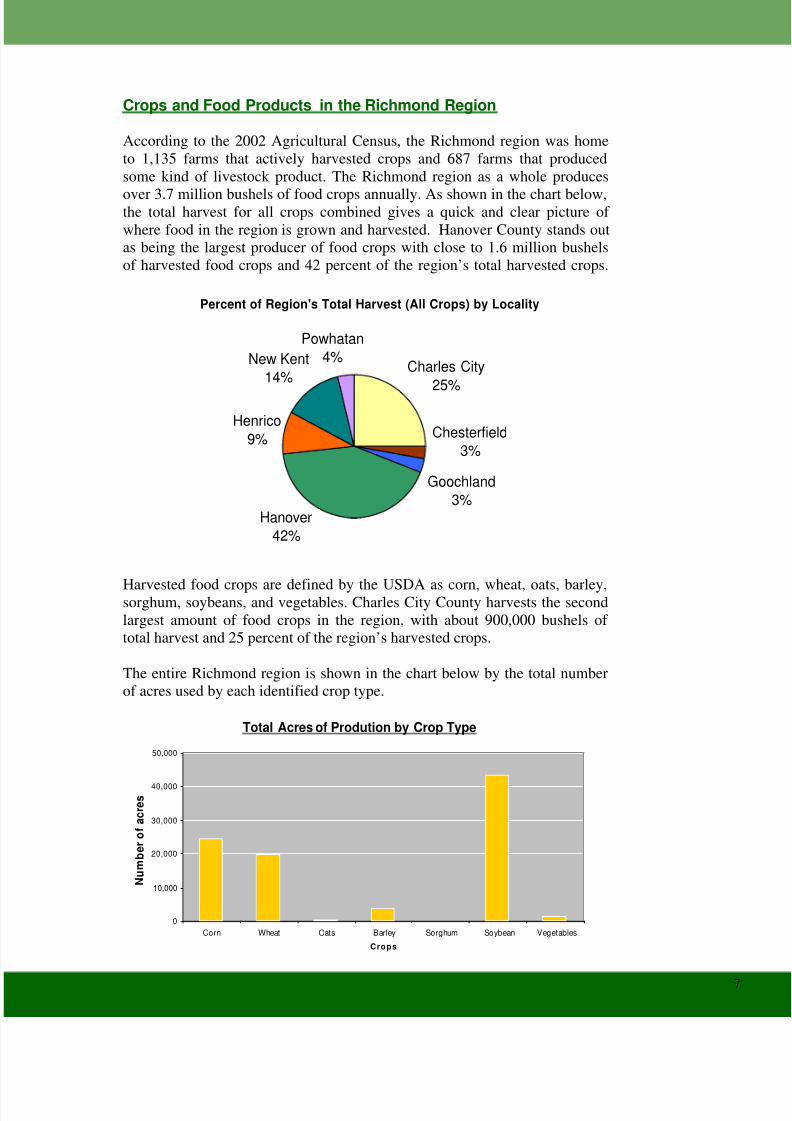
over 3.7 million bushels of food crops annually. As shown in the chart below,the total harvest for all crops combined gives a quick and clear picture of where food in the region is grown and harvested. Hanover County stands outas being the largest producer of food crops with close to 1.6 million bushelsof harvested food crops and 42 percent of the region’s total harvested crops.
Harvested food crops are defined by the USDA as corn, wheat, oats, barley,sorghum, soybeans, and vegetables. Charles City County harvests the secondlargest amount of food crops in the region, with about 900,000 bushels of total harvest and 25 percent of the region’s harvested crops.
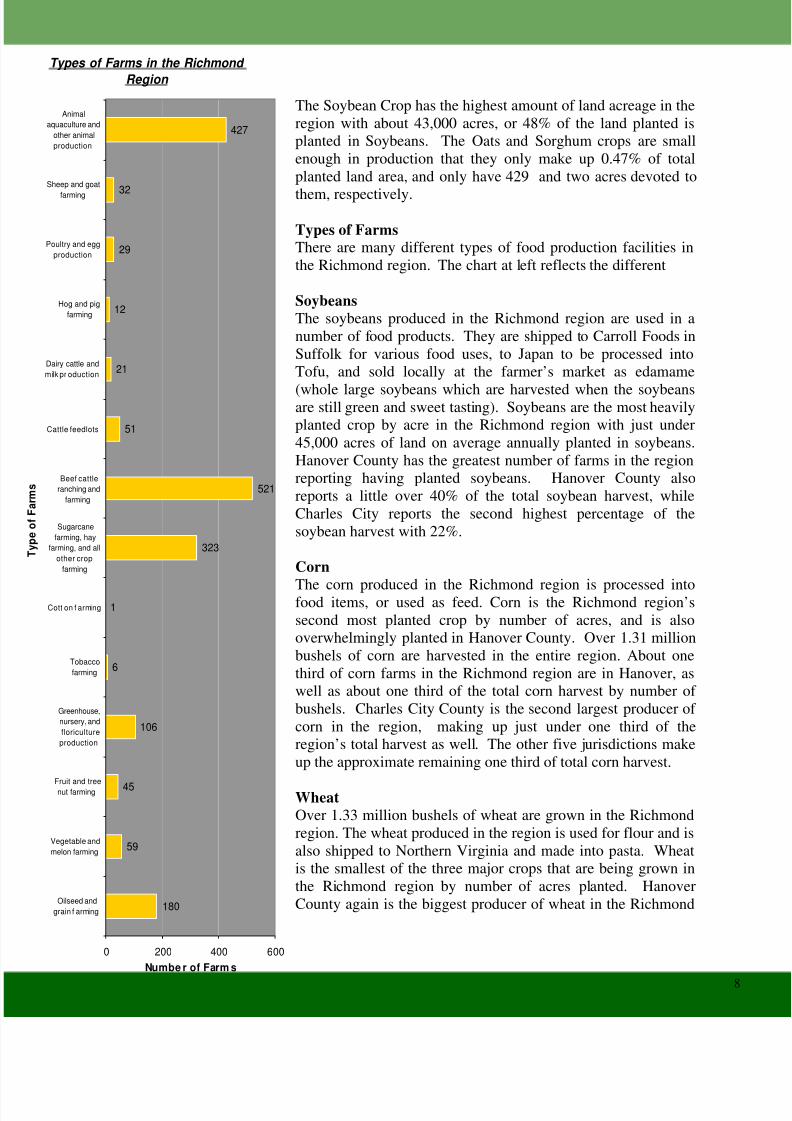
The entire Richmond region is shown in the chart below by the total numberof acres used by each identified crop type.
Percent of Region's Total Harvest (All Crops) by Locality
Charles City
25%Henrico
9%
New Kent14%
Powhatan4%
Hanover42%
Chesterfield3%
Goochland3%
Total Acres of Prodution by Crop Type
0
10,000
20,000
30,000
40,000
50,000
Corn Wheat Oats Barley Sorghum Soybean Vegetables
Crops
N u m b e r o f a c r e s
8/14/2019 New Food Systems
http://slidepdf.com/reader/full/new-food-systems 8/30
8
The Soybean Crop has the highest amount of land acreage in theregion with about 43,000 acres, or 48% of the land planted isplanted in Soybeans. The Oats and Sorghum crops are smallenough in production that they only make up 0.47% of totalplanted land area, and only have 429 and two acres devoted to
them, respectively.
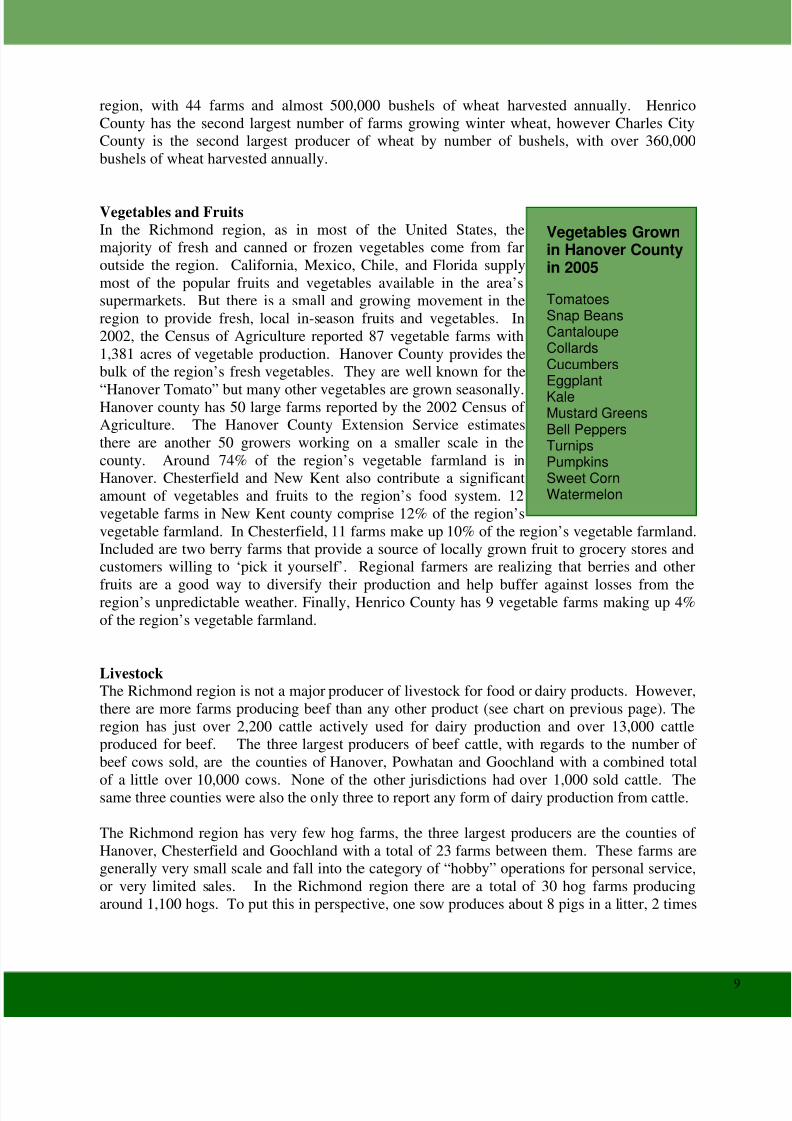
Types of FarmsThere are many different types of food production facilities inthe Richmond region. The chart at left reflects the different
SoybeansThe soybeans produced in the Richmond region are used in anumber of food products. They are shipped to Carroll Foods inSuffolk for various food uses, to Japan to be processed intoTofu, and sold locally at the farmer’s market as edamame
(whole large soybeans which are harvested when the soybeansare still green and sweet tasting). Soybeans are the most heavilyplanted crop by acre in the Richmond region with just under45,000 acres of land on average annually planted in soybeans.Hanover County has the greatest number of farms in the regionreporting having planted soybeans. Hanover County alsoreports a little over 40% of the total soybean harvest, whileCharles City reports the second highest percentage of thesoybean harvest with 22%.
Corn
The corn produced in the Richmond region is processed intofood items, or used as feed. Corn is the Richmond region’ssecond most planted crop by number of acres, and is alsooverwhelmingly planted in Hanover County. Over 1.31 millionbushels of corn are harvested in the entire region. About onethird of corn farms in the Richmond region are in Hanover, aswell as about one third of the total corn harvest by number of bushels. Charles City County is the second largest producer of corn in the region, making up just under one third of theregion’s total harvest as well. The other five jurisdictions makeup the approximate remaining one third of total corn harvest.
WheatOver 1.33 million bushels of wheat are grown in the Richmondregion. The wheat produced in the region is used for flour and isalso shipped to Northern Virginia and made into pasta. Wheatis the smallest of the three major crops that are being grown inthe Richmond region by number of acres planted. HanoverCounty again is the biggest producer of wheat in the Richmond
Types of Farms in the Richmond Region
59
45
106
6
1
323
521
51
21
12
29
32
427
180
0 200 400 600
Oilseed andgrain f arming
Vegetable andmelon farming
Fruit and treenut farming
Greenhouse,nursery, andfloricultureproduction
Tobaccofarming
Cott on f arming
Sugarcanefarming, hay
farming, and allother crop
farming
Beef cattleranching and
farming
Cattle feedlots
Dairy cattle andmilk pr oduction
Hog and pigfarming
Poultry and eggproduction
Sheep and goat
farming
Animalaquaculture and
other animalproduction
TypeofFarms
Numbe r of Farm s
8/14/2019 New Food Systems
http://slidepdf.com/reader/full/new-food-systems 9/30
9
region, with 44 farms and almost 500,000 bushels of wheat harvested annually. HenricoCounty has the second largest number of farms growing winter wheat, however Charles CityCounty is the second largest producer of wheat by number of bushels, with over 360,000bushels of wheat harvested annually.
Vegetables and FruitsIn the Richmond region, as in most of the United States, themajority of fresh and canned or frozen vegetables come from faroutside the region. California, Mexico, Chile, and Florida supplymost of the popular fruits and vegetables available in the area’ssupermarkets. But there is a small and growing movement in theregion to provide fresh, local in-season fruits and vegetables. In2002, the Census of Agriculture reported 87 vegetable farms with1,381 acres of vegetable production. Hanover County provides thebulk of the region’s fresh vegetables. They are well known for the
“Hanover Tomato” but many other vegetables are grown seasonally.Hanover county has 50 large farms reported by the 2002 Census of Agriculture. The Hanover County Extension Service estimatesthere are another 50 growers working on a smaller scale in thecounty. Around 74% of the region’s vegetable farmland is inHanover. Chesterfield and New Kent also contribute a significantamount of vegetables and fruits to the region’s food system. 12vegetable farms in New Kent county comprise 12% of the region’svegetable farmland. In Chesterfield, 11 farms make up 10% of the region’s vegetable farmland.Included are two berry farms that provide a source of locally grown fruit to grocery stores andcustomers willing to ‘pick it yourself’. Regional farmers are realizing that berries and other
fruits are a good way to diversify their production and help buffer against losses from theregion’s unpredictable weather. Finally, Henrico County has 9 vegetable farms making up 4%of the region’s vegetable farmland.
LivestockThe Richmond region is not a major producer of livestock for food or dairy products. However,there are more farms producing beef than any other product (see chart on previous page). Theregion has just over 2,200 cattle actively used for dairy production and over 13,000 cattleproduced for beef. The three largest producers of beef cattle, with regards to the number of beef cows sold, are the counties of Hanover, Powhatan and Goochland with a combined total
of a little over 10,000 cows. None of the other jurisdictions had over 1,000 sold cattle. Thesame three counties were also the only three to report any form of dairy production from cattle.
The Richmond region has very few hog farms, the three largest producers are the counties of Hanover, Chesterfield and Goochland with a total of 23 farms between them. These farms aregenerally very small scale and fall into the category of “hobby” operations for personal service,or very limited sales. In the Richmond region there are a total of 30 hog farms producingaround 1,100 hogs. To put this in perspective, one sow produces about 8 pigs in a litter, 2 times
Vegetables Grownin Hanover Countyin 2005
TomatoesSnap BeansCantaloupeCollardsCucumbersEggplantKaleMustard GreensBell PeppersTurnipsPumpkinsSweet CornWatermelon
8/14/2019 New Food Systems
http://slidepdf.com/reader/full/new-food-systems 10/30
10
a year. Dividing 1100 by sixteen equals about 70 sows in the region—a single large hog farmwould have at least this many sows.
The region does have limited production in broiler chickens (chickens raised for meat), with thelargest concentration in Chesterfield County with 13 farms and about 1.75 million chickens
sold. In the Richmond region there are a total of 25 chicken farms. Between the four countiesreporting numbers sold, the Richmond region sold about 4.3 million chickens in one year to thefood market. Most poultry raised in the Richmond region is processed and distributed throughlarge scale companies like Tyson and Perdue.
8/14/2019 New Food Systems
http://slidepdf.com/reader/full/new-food-systems 11/30
11
Food Production the Richmond Region Compared to Other Regions
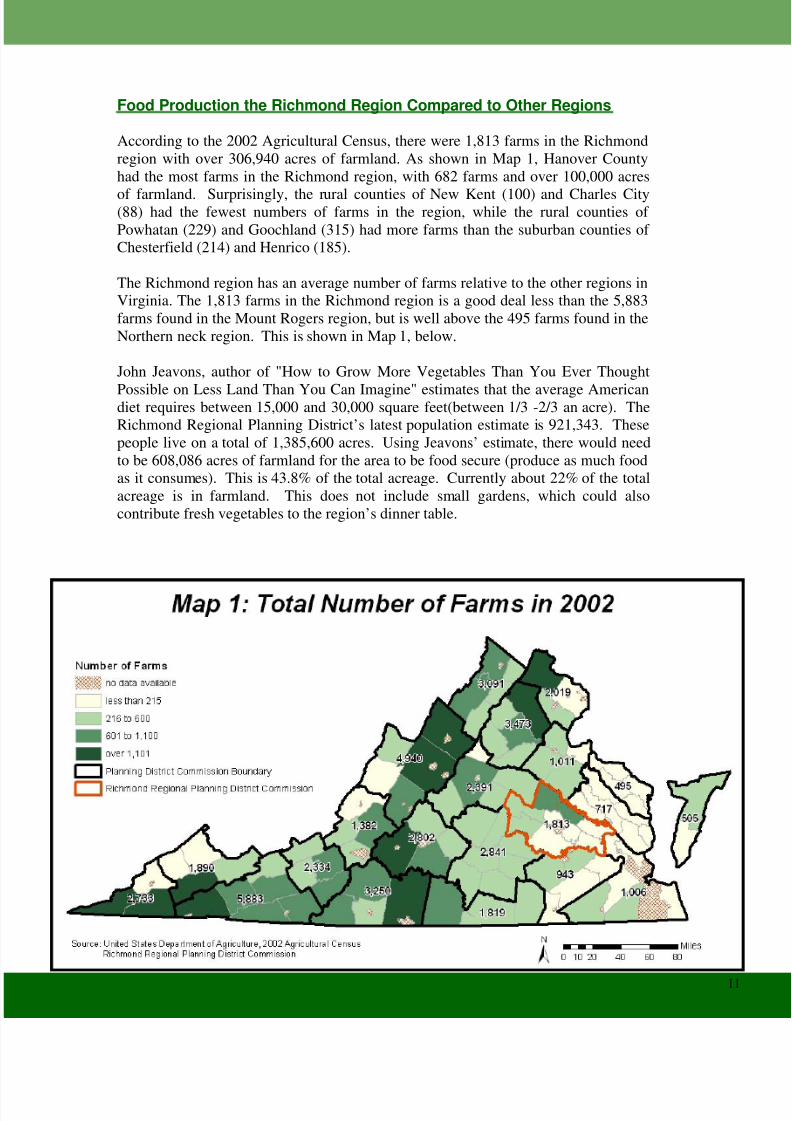
According to the 2002 Agricultural Census, there were 1,813 farms in the Richmondregion with over 306,940 acres of farmland. As shown in Map 1, Hanover Countyhad the most farms in the Richmond region, with 682 farms and over 100,000 acres
of farmland. Surprisingly, the rural counties of New Kent (100) and Charles City(88) had the fewest numbers of farms in the region, while the rural counties of Powhatan (229) and Goochland (315) had more farms than the suburban counties of Chesterfield (214) and Henrico (185).
The Richmond region has an average number of farms relative to the other regions inVirginia. The 1,813 farms in the Richmond region is a good deal less than the 5,883farms found in the Mount Rogers region, but is well above the 495 farms found in theNorthern neck region. This is shown in Map 1, below.
John Jeavons, author of "How to Grow More Vegetables Than You Ever Thought
Possible on Less Land Than You Can Imagine" estimates that the average Americandiet requires between 15,000 and 30,000 square feet(between 1/3 -2/3 an acre). TheRichmond Regional Planning District’s latest population estimate is 921,343. Thesepeople live on a total of 1,385,600 acres. Using Jeavons’ estimate, there would needto be 608,086 acres of farmland for the area to be food secure (produce as much foodas it consumes). This is 43.8% of the total acreage. Currently about 22% of the totalacreage is in farmland. This does not include small gardens, which could alsocontribute fresh vegetables to the region’s dinner table.
8/14/2019 New Food Systems
http://slidepdf.com/reader/full/new-food-systems 12/30
12
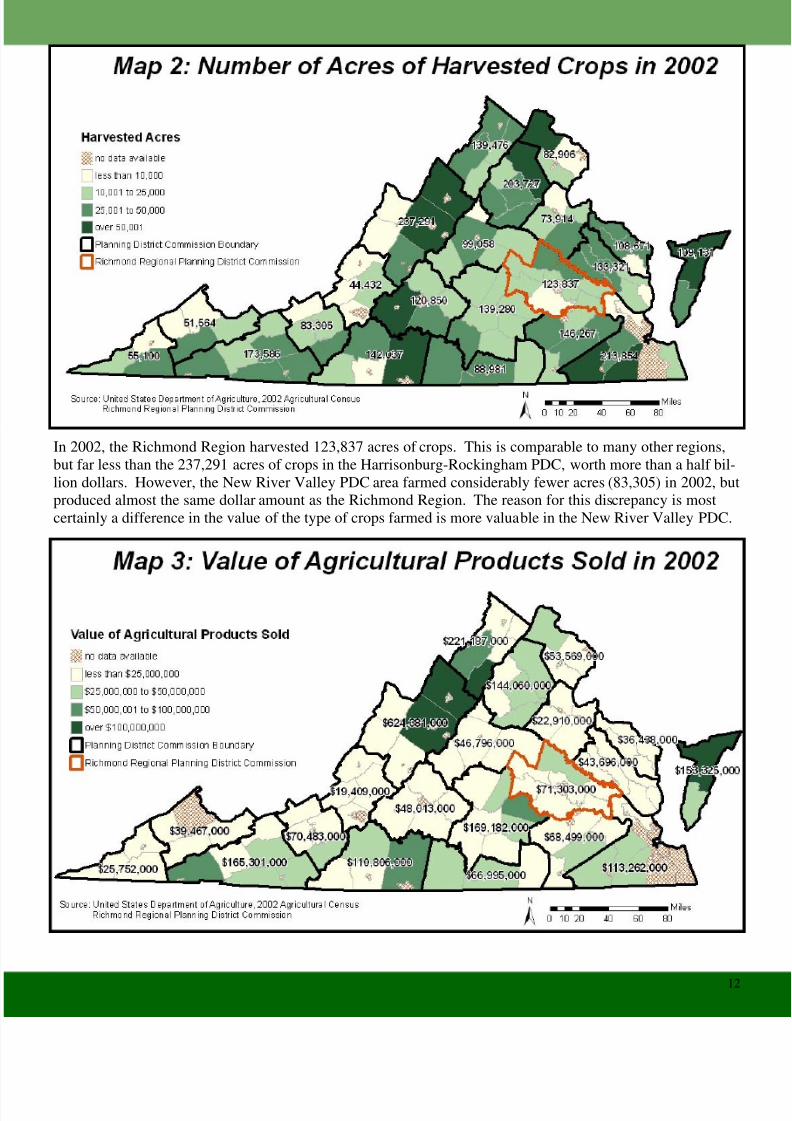
In 2002, the Richmond Region harvested 123,837 acres of crops. This is comparable to many other regions,but far less than the 237,291 acres of crops in the Harrisonburg-Rockingham PDC, worth more than a half bil-lion dollars. However, the New River Valley PDC area farmed considerably fewer acres (83,305) in 2002, butproduced almost the same dollar amount as the Richmond Region. The reason for this discrepancy is mostcertainly a difference in the value of the type of crops farmed is more valuable in the New River Valley PDC.
8/14/2019 New Food Systems
http://slidepdf.com/reader/full/new-food-systems 13/30
13
Recommended Strategies for Protecting Farmland
The United States Department of Agriculture (USDA) defines prime farmland as the land bestsuited to food, feed, forage, fiber, and oilseed crops. Prime farmland produces the highest yieldswith minimal inputs of energy and economic resources, and farming it results in the leastdamage to the environment.Virginia’s location on the Chesapeake Bay watershed brings an obligation to protect its naturalresources. Preserving farmland and other water-permeable surfaces reduces the impact of impervious surfaces due to development. Currently, there is no “Prime Farmland” identified forprotection in the Richmond Region. Ideally, Richmond region farmland should surveyed todiscover the location of prime farmland and protected as such. Unfortunately, there exists greatpressure on landowners to convert or develop this land, often because the attributes which makeit desirable for farming (relatively flat, workable, and well drained soil) make it desirable forresidential development.
Introduce Preservation Programs Pennsylvania, with its own legacy of farming, has several programs in place to protect theselands, while preventing them from being converted into developed land.
The programs include the• Agricultural Land Preservation Policy (text of this bill can be found at http://
www.pabulletin.com/secure/data/vol33/33-29/1397.html) • Agricultural Security Areas
created by local municipalities in cooperation with individual landowners who agree tocollectively place at least 250 acres in an agricultural security area. Participatingfarmers are entitled to special consideration from local and state governmentagencies, thus encouraging the continuing use of the land for productive agricultural
purposes.• Land Preservation for Open Space Uses
Communities across the country have found that protecting open space, parks, and farmland is a strategy that can be used to strengthen existing communities, attract businesses,and avoid the costs of urban and suburban sprawl.
• Right-to-Farm LawProtects farmers from “nuisance” lawsuits filed by neighboring landowners.
Other strategies Virginia could implement include:• Authorize county and municipal governments to adopt agricultural zoning ordinances. Such
agricultural zones would limit non-agricultural development to densities and development
patterns that are consistent with the continuation of agriculture.• Riparian Barrier leasing program• Farmers lease a strip of land along any stream that might be on their property. For
cropland, the strip is generally planted with plants that absorb pollutants and slow downrunoff. For grazing land, grants are available to construct fences and provide alternatewater sources to prevent direct access to the water’s edge.
8/14/2019 New Food Systems
http://slidepdf.com/reader/full/new-food-systems 14/30
14
• Conservation tax CreditsA credit is allowed against individual and corporate income taxes when real property is
donated for conservation purposes.• Transfer of Development Rights
Provisions in a zoning law that allow for the purchase of the right to develop landlocated in a sending area and the transfer of these rights to land located in a receivingarea.
8/14/2019 New Food Systems
http://slidepdf.com/reader/full/new-food-systems 15/30
15
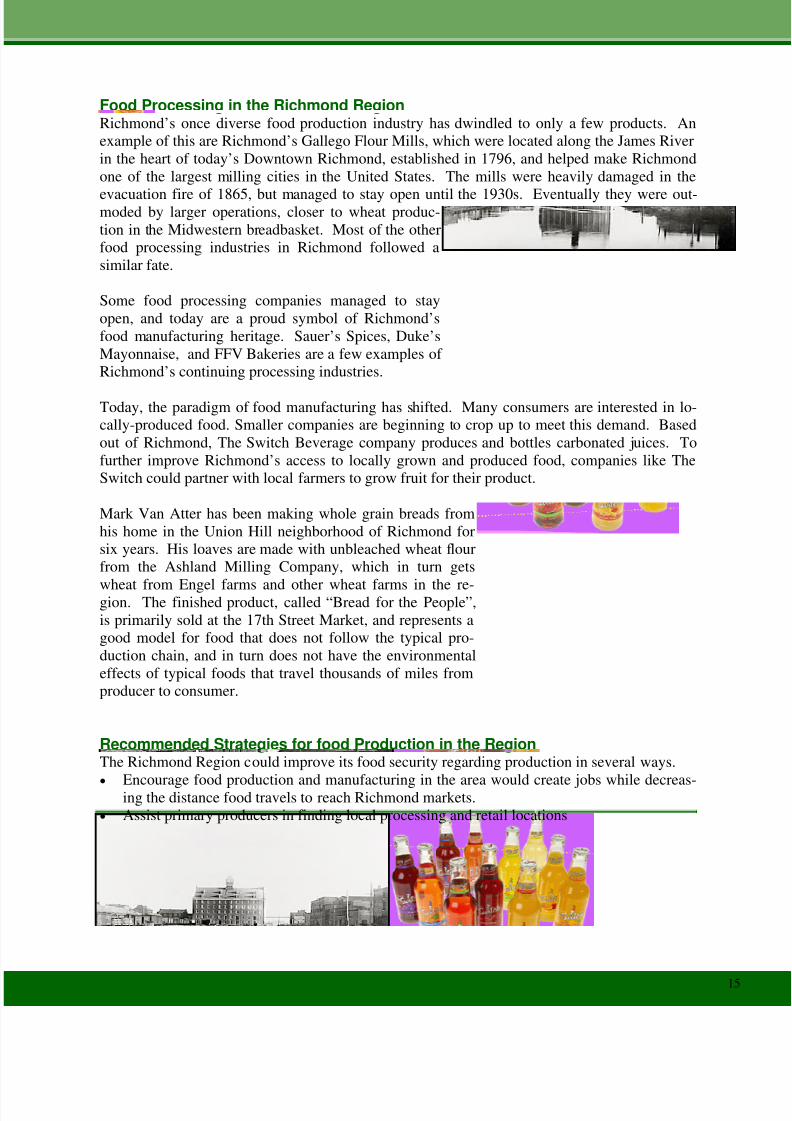
Food Processing in the Richmond RegionRichmond’s once diverse food production industry has dwindled to only a few products. Anexample of this are Richmond’s Gallego Flour Mills, which were located along the James Riverin the heart of today’s Downtown Richmond, established in 1796, and helped make Richmondone of the largest milling cities in the United States. The mills were heavily damaged in the
evacuation fire of 1865, but managed to stay open until the 1930s. Eventually they were out-moded by larger operations, closer to wheat produc-tion in the Midwestern breadbasket. Most of the otherfood processing industries in Richmond followed asimilar fate.
Some food processing companies managed to stayopen, and today are a proud symbol of Richmond’sfood manufacturing heritage. Sauer’s Spices, Duke’sMayonnaise, and FFV Bakeries are a few examples of Richmond’s continuing processing industries.
Today, the paradigm of food manufacturing has shifted. Many consumers are interested in lo-cally-produced food. Smaller companies are beginning to crop up to meet this demand. Basedout of Richmond, The Switch Beverage company produces and bottles carbonated juices. Tofurther improve Richmond’s access to locally grown and produced food, companies like TheSwitch could partner with local farmers to grow fruit for their product.
Mark Van Atter has been making whole grain breads fromhis home in the Union Hill neighborhood of Richmond forsix years. His loaves are made with unbleached wheat flourfrom the Ashland Milling Company, which in turn gets
wheat from Engel farms and other wheat farms in the re-gion. The finished product, called “Bread for the People”,is primarily sold at the 17th Street Market, and represents agood model for food that does not follow the typical pro-duction chain, and in turn does not have the environmentaleffects of typical foods that travel thousands of miles fromproducer to consumer.
Recommended Strategies for food Production in the RegionThe Richmond Region could improve its food security regarding production in several ways.•
Encourage food production and manufacturing in the area would create jobs while decreas-ing the distance food travels to reach Richmond markets.• Assist primary producers in finding local processing and retail locations
8/14/2019 New Food Systems
http://slidepdf.com/reader/full/new-food-systems 16/30
16
Food distribution is the process of getting food products from producersto consumers. More specifically, food distribution relies on transportationand storage infrastructures, food safety and handing procedures, andmarketing. Therefore, food distribution is comprised of a large network of complex operating and management systems involving coordination,
organization, purchasing and delivery of food goods and services fromproducers to consumers. Distribution in the food system refers to thenetworks and processes involved in getting food from the producingfarm, factory or warehouse to where it will be purchased, used orconsumed.
Today, only around 1-2% of America's food is locally grown. Theaverage American dinner is trucked 1,500 miles before it reaches theplate. In the past 30 years there has been a significant global increase infossil fuel use. One reason for the rise in U.S. fossil fuel use is theincreased use of trucks to transport goods. In 1965, there were 787,000
combination trucks registered in the United States, and these vehiclesconsumed 6.658 billion gallons of fuel. 1 In 1997, there were 1,790,000combination trucks that used 20.294 billion gallons of fuel. (US DOT).
Many of these trucks transport food throughout the United States. Arecent study by Richard Pirog indicated that in California alone morethan 485,000 truckloads of fresh fruit and vegetables leave the state everyyear and travel from 100 to 3,100 miles to reach their destinations. Onlyabout 10% of the fossil fuel energy used in the world’s food system isused in production; the other 90% goes into packaging, transportation,and marketing.
The most typical manner in which food gets to a retail business,merchant, or manufacturer is through the use of wholesalers. In theRichmond region, there are approximately 115 food wholesalers whichare primarily concentrated in the Southeast quadrant of the city.
In addition to the conventional wholesale food distribution model, thereare several alternative distribution pathways that focus on getting foodfrom a farmer directly to a household, private business, or publicinstitution. These pathways have been established in order to helpconsumers get fresher food and develop relationships with the farmer,and to help farmers get a higher percentage of the food’s ultimate
purchase price. Shorter distribution pathways are also supported becausethey are less resource-intensive and less polluting.
Much of the Richmond region’s food comes from outside the region, andmust be transported into and throughout the region by truck or train.However, there are few food manufacturing plants in the area that useraw materials grown in the region. Much of the grain grown in theregion goes to processing plants in Maryland and Pennsylvania. The
8/14/2019 New Food Systems
http://slidepdf.com/reader/full/new-food-systems 17/30
17
closest manufacturing plant for soybeans, which the largest crop produced in the region, is innearby Suffolk.A very small amount of the food consumed in the Richmond region is also produced andprocessed in the region. For example, Engel Farms, a 12,000 acre grain farm in HenricoCounty, grows corn that is sent to the Ashland Milling Company in Hanover County to be
ground into cornmeal, and is then made into hush-puppy mix served at the Smokey Pigrestaurant in Ashland. The Ashland Milling Company also supplies flour made from locallygrown grains to the Billy Bread Bakery in Richmond. This bread is distributed in local grocerystores like Ukrop’s and Ellwood Thompson's, as well as served in the Lemaire restaurant inRichmond’s Jefferson Hotel. There are also several small vegetable farms in the region delivertheir produce to upscale restaurants in the region.
WholesaleIn most metropolitan areas, food distribution is handled by food wholesalers that act asintermediaries between producers and consumers. Food wholesalers sell food products tobusinesses in large quantities. Sales to retail businesses, merchants, manufacturers, industrial
firms, commercial, and other businesses are done on a large scale, allowing a diverse number of food products to be funneled and distributed in one place, thus bringing efficiency into fooddistribution. Among food wholesalers, there is an opportunity to support sustainable foodproducers as well as consumers’ and retailers’ preferences by sourcing and offering sustainablygrown agricultural products.
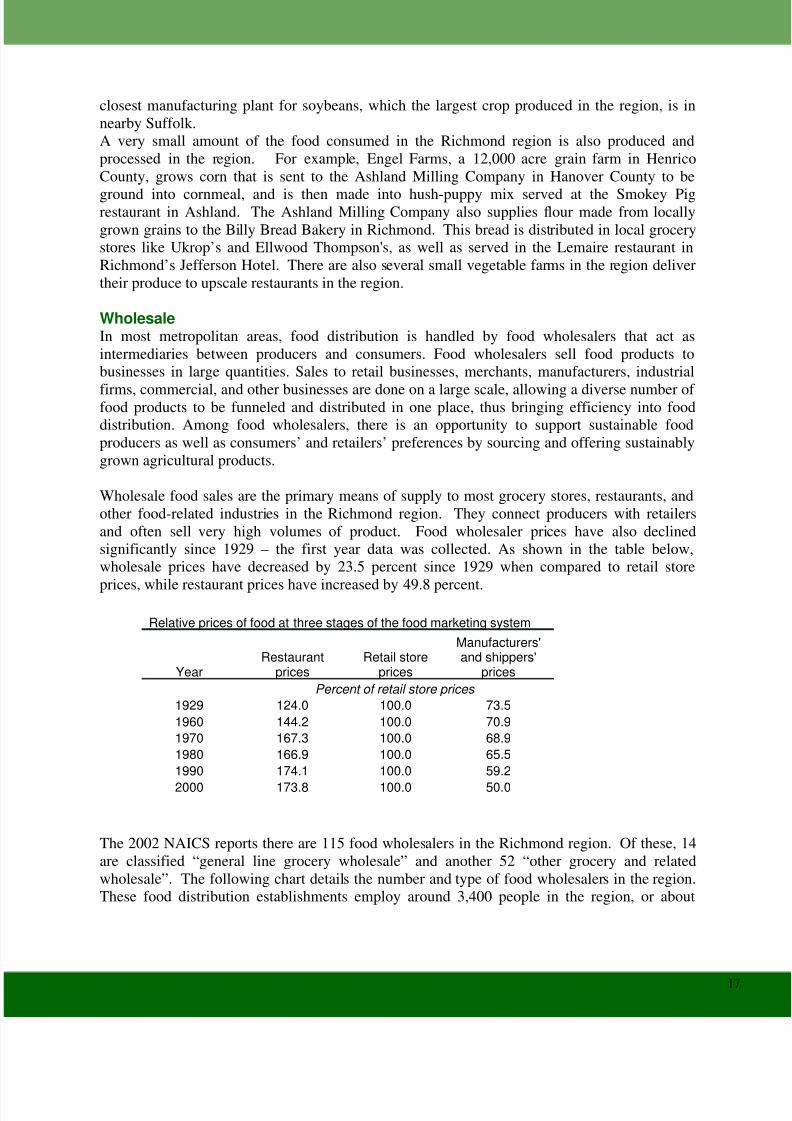
Wholesale food sales are the primary means of supply to most grocery stores, restaurants, andother food-related industries in the Richmond region. They connect producers with retailersand often sell very high volumes of product. Food wholesaler prices have also declinedsignificantly since 1929 – the first year data was collected. As shown in the table below,wholesale prices have decreased by 23.5 percent since 1929 when compared to retail store
prices, while restaurant prices have increased by 49.8 percent.
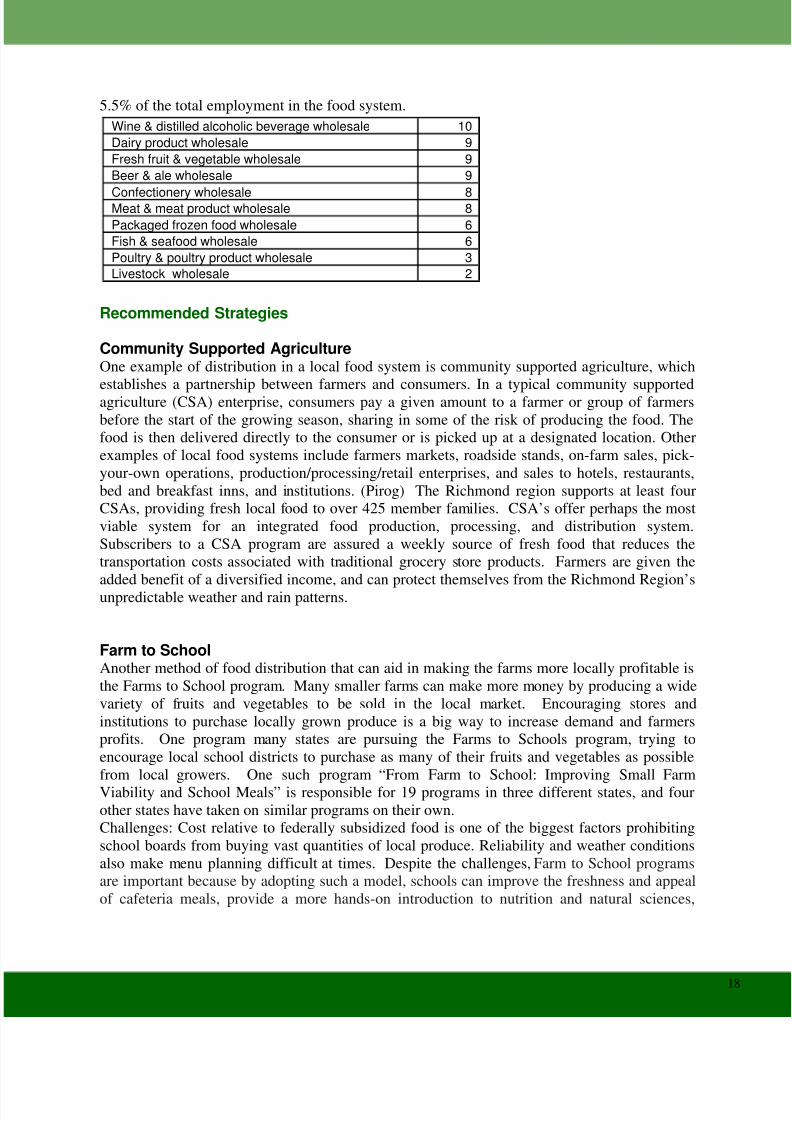
The 2002 NAICS reports there are 115 food wholesalers in the Richmond region. Of these, 14are classified “general line grocery wholesale” and another 52 “other grocery and relatedwholesale”. The following chart details the number and type of food wholesalers in the region.These food distribution establishments employ around 3,400 people in the region, or about
Relative prices of food at three stages of the food marketing system
Year Restaurant
prices Retail store
prices
Manufacturers'and shippers'
prices Percent of retail store prices
1929 124.0 100.0 73.5 1960 144.2 100.0 70.9 1970 167.3 100.0 68.9 1980 166.9 100.0 65.5 1990 174.1 100.0 59.2
2000 173.8 100.0 50.0
8/14/2019 New Food Systems
http://slidepdf.com/reader/full/new-food-systems 18/30
18
5.5% of the total employment in the food system.
Recommended Strategies
Community Supported AgricultureOne example of distribution in a local food system is community supported agriculture, whichestablishes a partnership between farmers and consumers. In a typical community supportedagriculture (CSA) enterprise, consumers pay a given amount to a farmer or group of farmersbefore the start of the growing season, sharing in some of the risk of producing the food. Thefood is then delivered directly to the consumer or is picked up at a designated location. Otherexamples of local food systems include farmers markets, roadside stands, on-farm sales, pick-your-own operations, production/processing/retail enterprises, and sales to hotels, restaurants,bed and breakfast inns, and institutions. (Pirog) The Richmond region supports at least fourCSAs, providing fresh local food to over 425 member families. CSA’s offer perhaps the mostviable system for an integrated food production, processing, and distribution system.Subscribers to a CSA program are assured a weekly source of fresh food that reduces thetransportation costs associated with traditional grocery store products. Farmers are given theadded benefit of a diversified income, and can protect themselves from the Richmond Region’sunpredictable weather and rain patterns.
Farm to SchoolAnother method of food distribution that can aid in making the farms more locally profitable isthe Farms to School program. Many smaller farms can make more money by producing a widevariety of fruits and vegetables to be sold in the local market. Encouraging stores andinstitutions to purchase locally grown produce is a big way to increase demand and farmersprofits. One program many states are pursuing the Farms to Schools program, trying toencourage local school districts to purchase as many of their fruits and vegetables as possiblefrom local growers. One such program “From Farm to School: Improving Small FarmViability and School Meals” is responsible for 19 programs in three different states, and fourother states have taken on similar programs on their own.Challenges: Cost relative to federally subsidized food is one of the biggest factors prohibitingschool boards from buying vast quantities of local produce. Reliability and weather conditionsalso make menu planning difficult at times. Despite the challenges, Farm to School programsare important because by adopting such a model, schools can improve the freshness and appealof cafeteria meals, provide a more hands-on introduction to nutrition and natural sciences,
Wine & distilled alcoholic beverage wholesale 10 Dairy product wholesale 9 Fresh fruit & vegetable wholesale 9 Beer & ale wholesale 9
Confectionery wholesale 8 Meat & meat product wholesale 8 Packaged frozen food wholesale 6 Fish & seafood wholesale 6 Poultry & poultry product wholesale 3 Livestock wholesale 2
8/14/2019 New Food Systems
http://slidepdf.com/reader/full/new-food-systems 19/30
19
support the surrounding farm economy, and increase communities’ understanding of theimportance of local agriculture, environmental protection, and farmland conservation.Currently, no school districts in the Richmond region are participating in such a program.
Farm to Restaurant
“Farm to Restaurant” is a general term that is used to describe a distribution link betweenrestaurants and farms. A significant amount of food in the Richmond region is consumed atrestaurants, and local chefs are increasingly adding seasonal and locally sourced food to theirmenus by purchasing directly from local farms. This farm to restaurant model is importantbecause it allows chefs and restaurant owners/managers to add freshness, variety, andseasonality to their menus and to run more sustainable businesses that acknowledge and rewardsmall farmers and food producers. Because farm to restaurant programs support area farmers,they contribute to the economic vitality of our region and state.
8/14/2019 New Food Systems
http://slidepdf.com/reader/full/new-food-systems 20/30
20
Business Patterns and EmploymentAccording to the North American Industry Classification System(NAICS), in 2002 there were about 4,800 businesses in the Richmondregion related to the region’s food system (grocery stores, restaurants,distributors, and manufacturers) employing around 62,200 people in theregion. Limited and Full service restaurants and eating/drinking places,and grocery stores had the most establishments and employed the mostpersons. There were approximately 1,625 Food Service/Drinking Placesin the region in 2002, employing almost 31,000 people. Grocery storesemploy an additional 17,500 in 400 stores throughout the region. Of these grocery stores, 207 are considered “supermarkets” and 193“convenience” stores. Several grocery store chains have left theRichmond region over the past couple of years. Winn Dixie closed sevenstores in the area, and the entire “Community Pride” grocery chain,originally opened in the early 1990’s to serve urban markets who lackedgrocery stores, also closed in 2004.
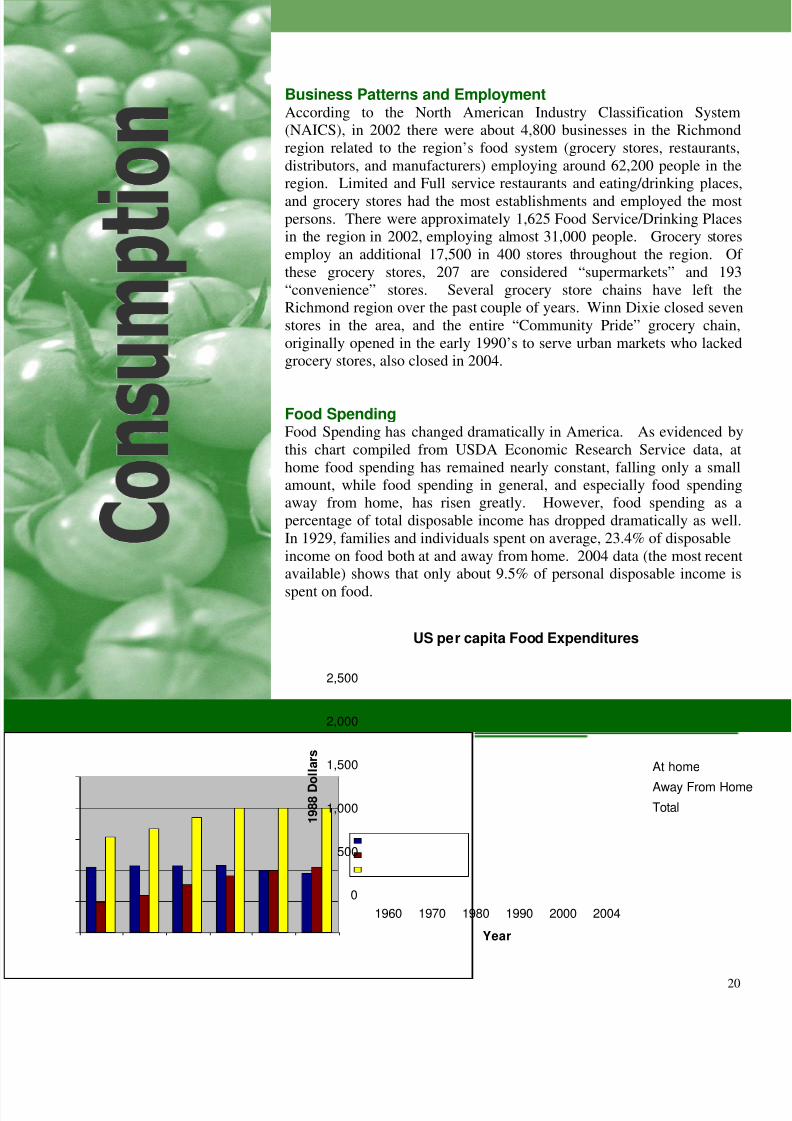
Food SpendingFood Spending has changed dramatically in America. As evidenced bythis chart compiled from USDA Economic Research Service data, athome food spending has remained nearly constant, falling only a smallamount, while food spending in general, and especially food spendingaway from home, has risen greatly. However, food spending as apercentage of total disposable income has dropped dramatically as well.In 1929, families and individuals spent on average, 23.4% of disposableincome on food both at and away from home. 2004 data (the most recentavailable) shows that only about 9.5% of personal disposable income isspent on food.
US per capita Food Expenditures
0
500
1,000
1,500
2,000
2,500
1960 1970 1980 1990 2000 2004
Year
1 9 8 8 D o
l l a r s
At home
Away From HomeTotal
8/14/2019 New Food Systems
http://slidepdf.com/reader/full/new-food-systems 21/30
21
RetailRetail food stores are businesses where people buy food products that will be used forpreparation and consumption at another site. Based on categories established by the UnitedStates Department of Labor and the Economic Research Service of the United StatesDepartment of Agriculture, the types of food stores discussed in this section are grocery stores,
supermarkets, convenience stores, fruit and vegetable markets, cooperative stores,delicatessens, meat and fish stores, bakeries, candy stores and dairy stores. According to theTrip Generation Manual, 6th Edition, a grocery store of 40,000 square feet generates 4600 cartrips every day.
SupermarketsMost large supermarkets in the region are between 40,000-50,000 square feet and often employmore than 125 persons. These stores have traditional distribution networks, operated by thechains themselves. In the region, there is some focus on “organic” or “health” food sections inthe stores, but little or no focus on locally grown or produced foods.
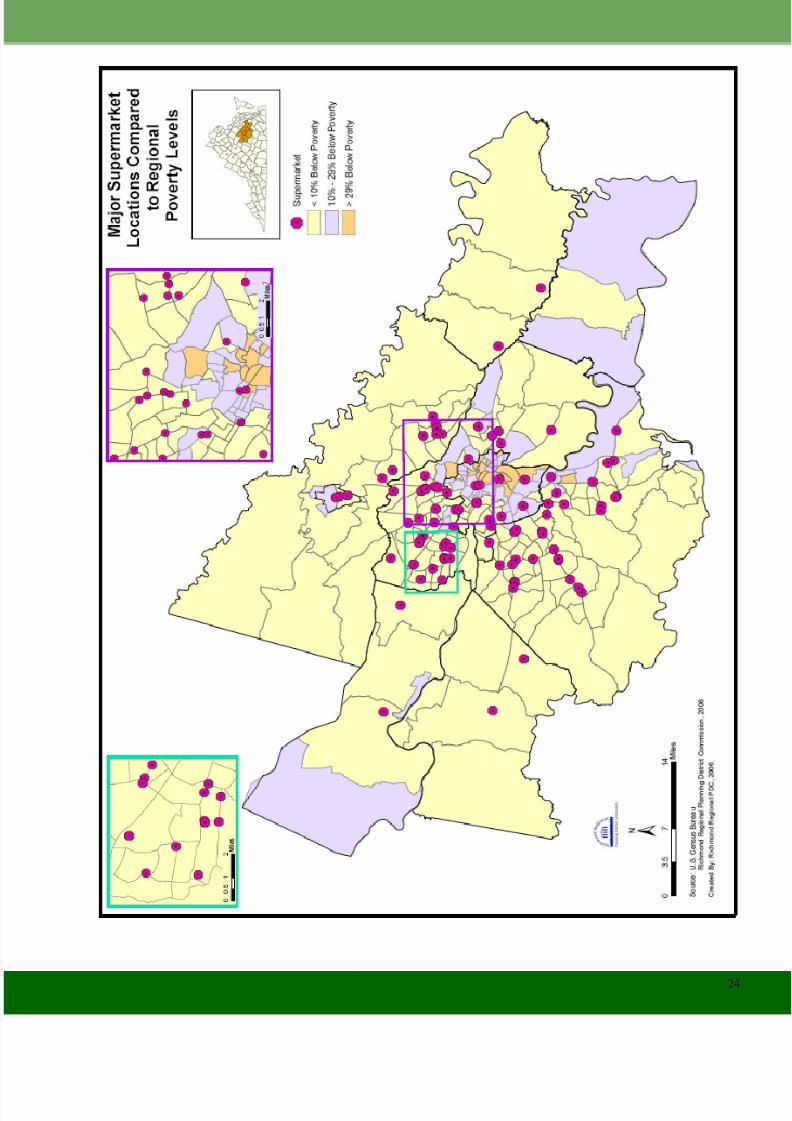
The map on page 23 shows the distribution of supermarkets as related to income (chains likeKroger, Food Lion, and Ukrops). The supermarkets are overwhelmingly located in censustracts with higher income levels. In the areas in blue, there is not one large supermarket—people living in these census tracts, having an incidence of poverty between 28% and 75% musttravel to other locations to shop. In Richmond City, there are only 9 grocery stores belonging tothe four chains listed above, and none located in the city east of Route 1 (Brook Road/ Belvidere/Jefferson Davis Highway). This leaves residents with two options – traveling toanother part of the city or out into the counties to shop at a supermarket, or to buy higher priced,and/or often lower quality food at neighborhood grocery stores and corner/convenience stores.With the loss of the Community Pride and Winn Dixie chains, many central city and ruralresidents lost good access to a grocery store. In the urbanized neighborhoods, established
grocery store chains such as Kroger, Ukrops, and Food Lion should be encouraged to openstores in the locations formerly occupied by Community Pride and Winn Dixie.
According to the USDA Continuing Survey of Food Intakes by Individuals/Diet & HealthKnowledge Survey, from 1985 – 2000, the cost of fruits and vegetables increased 120% whilethe price of soft drinks, fats and sweets increased less than 50%. Additionally, less than half of low income people who receive food stamps own a car, but it is still the main mode of transportation for grocery shopping. They are reliant on using a neighbor’s vehicle, walking, orpublic transportation. About one-third of those surveyed travel less than a mile to shop forfood, another third travel one to four miles, and the last third travel more than four miles toshop for food. In rural locations, four miles could be a reasonable distance to travel for grocery
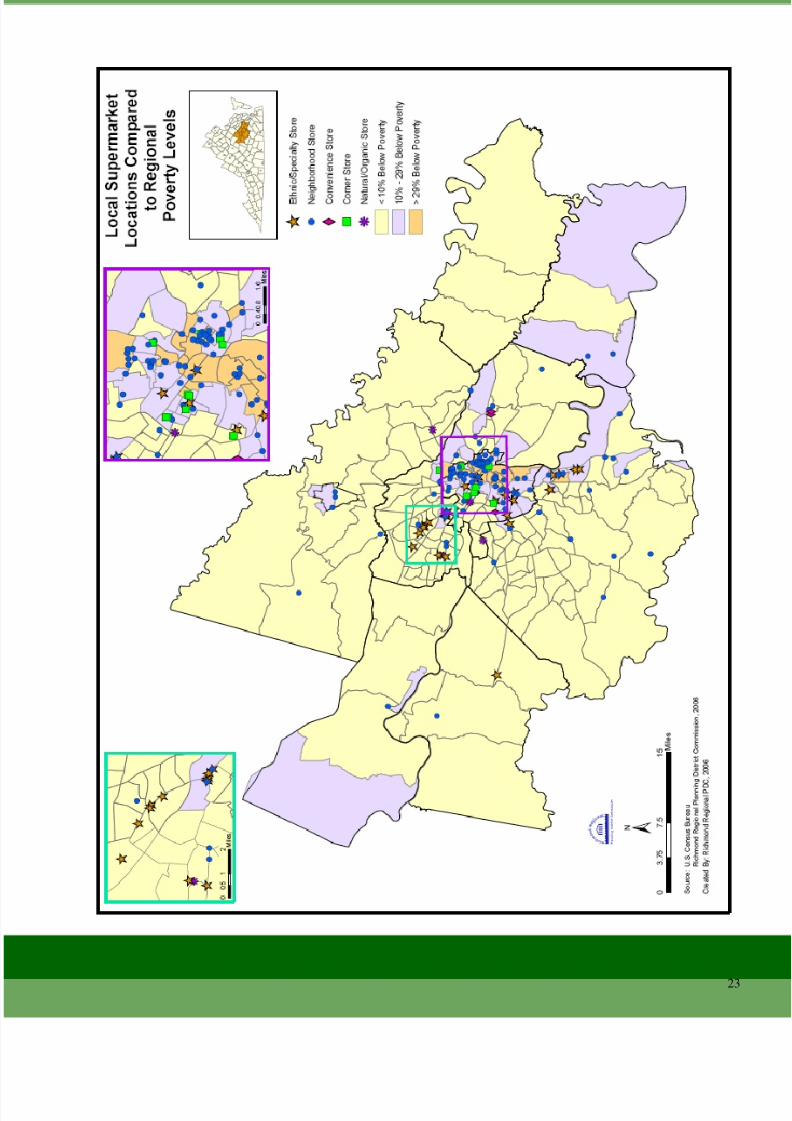
shopping.The second option – buying food at non-supermarket locations, is not always to the shopper’sadvantage. Although there are more than 40 neighborhood grocery stores and corner store/ convenience stores in the same half of Richmond east of Route 1, (see map, pg. 24) the qualityand variety of foods in these establishments is lower than that of large supermarkets. Becauseof the lower sales volume, produce is often of lower quality or simply not available. Prices onstaples like milk, cereal, and eggs are often higher as well. The local situation coincides with
8/14/2019 New Food Systems
http://slidepdf.com/reader/full/new-food-systems 22/30
22
the USDA’s findings that “considerable numbers of [low income families] supplement foodfrom supermarkets with purchases at several other types of stores, including neighborhoodgrocery stores, convenience stores, bakeries, and produce stands.” The perception of stores inlow-income neighborhoods is also often low. “For households who do not usually shop in theirneighborhoods, the most common reasons for shopping elsewhere were high prices in their
neighborhood (48 percent) and lack of stores (40 percent).”Elsewhere in the region, access to goods and services is limited. There are a total of ninesupermarkets and neighborhood grocery stores combined in Powhatan, Goochland, New Kent,and Charles City counties. Increased distance of trips to buy food contributes to trafficcongestion and air pollution.
Farmers MarketsOn an average Thursday in July, over 30 local food vendors sell their locally grown products toover 400 customers at the 17th Street Farmer’s Market in downtown Richmond. Other farmersmarkets in the area include the New Kent Farmers Market in Talleysville and Ashland Farmer’sMarket. In 2005, a new farmer’s market opened in eastern Goochland County. All markets
report an increased interest and demand for locally grown and/or organic foods. Buying food atfarmers markets is a great way to learn more about where and how the food we eat is grown.Food generally travels less than 100 miles to get to these markets, far less than the 1500 milesaveraged by food purchased at the grocery store. In addition, there are many small, seasonalfruit and vegetable stands that compliment the products sold at larger, regional markets.
Food ServiceAnother large part of food consumption is through the service industry. This consists of prepared food for consumption on-site or packaged to take to another location (most often eatenin the home). Many of the meals we eat come from eat-in or take-home restaurants. Somerestaurant chains previously known for eat-in meals have marketed their to-go service, catering
to working professionals with families. Also included in this category are snack bars,cafeterias, food service contractors, and caterers. Full-Service Restaurants actually haveslightly higher trip generation than grocery stores—130 per 1000 square feet. But the total tripsgenerated is less than a grocery store because the square footage is significantly less.
According to NAICS data from 2002, there are around 31,000 persons employed at 1625 foodservices and eating/drinking places in the Richmond-Petersburg Metropolitan Statistical Area.These include 720 full service restaurants, 636 limited-service restaurants, 17 cafeterias, 71snack/nonalcoholic beverage bars, 103 food service contractor establishments, 42 cateringcompanies, and 7 mobile food service units.
Food Security and AccessAccess to food in the Richmond region is good in most areas. Kroger, Ukrops, Food Lion, andWal-Mart alone operate around 100 supermarket stores in the 9-jurisdiction area. Most of thesestores are in Henrico and Chesterfield counties, leaving those who live on the edges or in thecenter of the region with greater distances to travel for low-cost, healthy food.
8/14/2019 New Food Systems
http://slidepdf.com/reader/full/new-food-systems 23/30
23
8/14/2019 New Food Systems
http://slidepdf.com/reader/full/new-food-systems 24/30
24
8/14/2019 New Food Systems
http://slidepdf.com/reader/full/new-food-systems 25/30
25
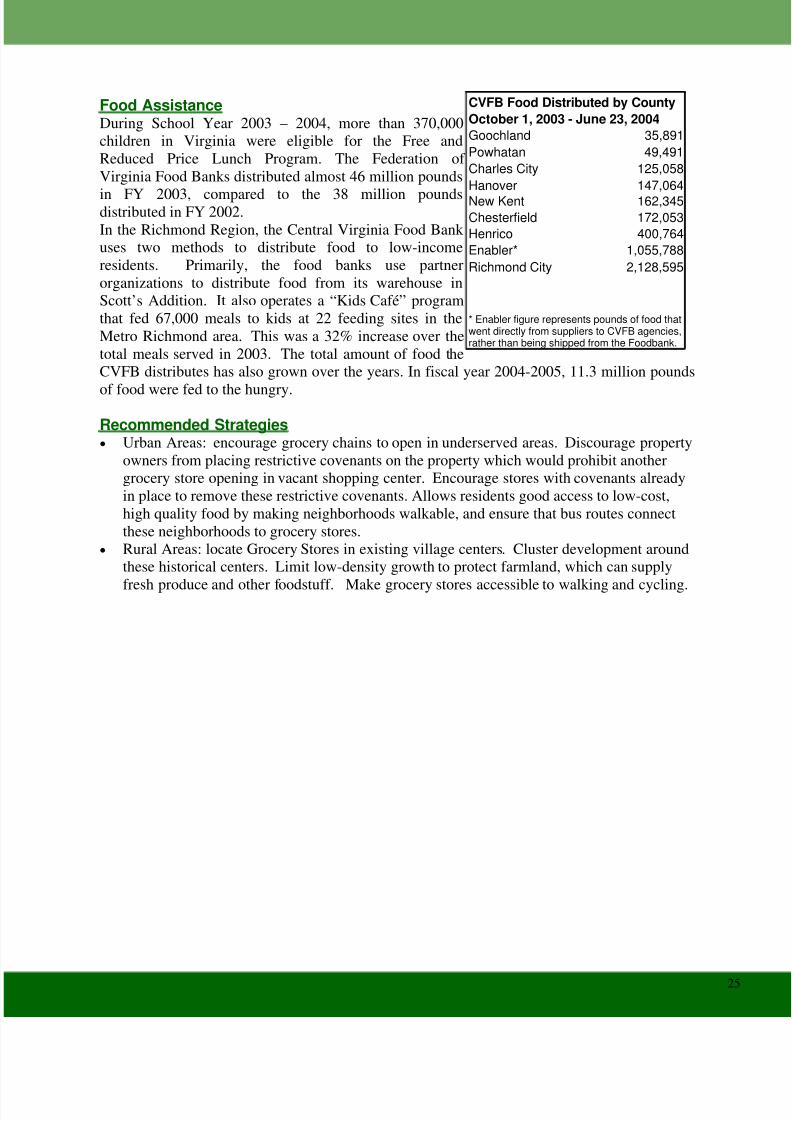
Food AssistanceDuring School Year 2003 – 2004, more than 370,000children in Virginia were eligible for the Free andReduced Price Lunch Program. The Federation of Virginia Food Banks distributed almost 46 million pounds
in FY 2003, compared to the 38 million poundsdistributed in FY 2002.In the Richmond Region, the Central Virginia Food Bank uses two methods to distribute food to low-incomeresidents. Primarily, the food banks use partnerorganizations to distribute food from its warehouse inScott’s Addition. It also operates a “Kids Café” programthat fed 67,000 meals to kids at 22 feeding sites in theMetro Richmond area. This was a 32% increase over thetotal meals served in 2003. The total amount of food theCVFB distributes has also grown over the years. In fiscal year 2004-2005, 11.3 million pounds
of food were fed to the hungry.
Recommended Strategies• Urban Areas: encourage grocery chains to open in underserved areas. Discourage property
owners from placing restrictive covenants on the property which would prohibit anothergrocery store opening in vacant shopping center. Encourage stores with covenants alreadyin place to remove these restrictive covenants. Allows residents good access to low-cost,high quality food by making neighborhoods walkable, and ensure that bus routes connectthese neighborhoods to grocery stores.
• Rural Areas: locate Grocery Stores in existing village centers. Cluster development aroundthese historical centers. Limit low-density growth to protect farmland, which can supply
fresh produce and other foodstuff. Make grocery stores accessible to walking and cycling.
CVFB Food Distributed by CountyOctober 1, 2003 - June 23, 2004Goochland 35,891Powhatan 49,491Charles City 125,058Hanover 147,064New Kent 162,345Chesterfield 172,053Henrico 400,764Enabler* 1,055,788Richmond City 2,128,595
* Enabler figure represents pounds of food thatwent directly from suppliers to CVFB agencies,rather than being shipped from the Foodbank.

8/14/2019 New Food Systems
http://slidepdf.com/reader/full/new-food-systems 26/30
8/14/2019 New Food Systems
http://slidepdf.com/reader/full/new-food-systems 27/30
27
How Food Waste and Packaging contributes to the WasteStream
After food is produced, distributed, and consumed, there is still thematter of disposing of food waste. The Environmental Protection Agency(EPA) estimates that 11.4% of municipal solid waste is food waste. Food
waste is highly recyclable via composting facilities, but only about 2.8% of it is actually recycled. According to the Department of EnvironmentalQuality, on average, each Virginian throws away 4.4 pounds of solid wasteevery day, contributing to a statewide total of about 13,600 tons of trash aday. In addition, food packaging waste comprises a significant amount of the municipal solid waste (MSW) stream. About a third of MSW iscomprised of containers and packaging (food and non-food). Eating foodsthat are fresh, not processed or shipped from outside the region can have asignificant impact on the total amount of solid waste generated.
Food packaging is often difficult to recycle because it is expensive or
impossible to remove the food residue. In some cases, as with plastic milk or soft drink containers, the recovery rate is relatively high—between 25and 32 percent. Average recycling rate for all packaging is 9 percent(EPA).
The Virginia DEQ states that “composting is an effective wastemanagement technology that can produce a useful product while divertinga portion of the waste stream from landfills for disposal. However, thecomposting process is not as simple as sorting recyclables from a solidwaste load. It must be processed according to a strict methodology;otherwise, a useful product will not be yielded from the compost process.”
There are many uses for recycled food waste, including:
• Home gardening
• Greenhouses, nurseries and cemeteries
• Landscaping applications (golf courses, median strips and industrialparks)
• Topsoil substitutes for farmland, sod, erosion control, or turfgrass
• Soil substitute or amendment for landfill cover and land reclamationactivities
• Wetland mitigation/storm water filters/bioremediation.
In the Richmond region, there are many opportunities for food wasterecycling. The best sources of food waste for composting come fromgrocery store food processing facilities, and institutions such as schools,colleges, or prisons. Recycling food wastes can provide an abundance of
8/14/2019 New Food Systems
http://slidepdf.com/reader/full/new-food-systems 28/30
28
fertile soil for CSA’s and community gardens. Since late 2001, Ukrop’s Supermarkets haverecycled an estimated 12 million pounds of vegetable and fruit trimmings from the Ukrop’sCentral Kitchen in Chesterfield County. The waste is composted along with municipal leaf andyard waste, and sold in 20 pound bags at Ukrops stores and in bulk at Watkins Nurseries inMidlothian. A portion of the sale price from each bag of compost is donated to the Alliance for
the Chesapeake Bay.
The Tricycle Gardens in Richmond composts 100-150 pounds of food wastes each week. Thewastes are leftover from the Food Not Bombs program to feed Richmond’s homeless. TheTricycle Gardens also participated in a recycling program with the Ukrop’s Central Kitchen, re-using tin cans from 5 days of kitchen operations to build a storage shed at the garden site.
These programs and others like them are an example of the region’s commitment to asustainable food system. Local Governments should work with food system establishments toimprove nutrient and packaging recycling and encourage local produce production.
Recommended Strategies• Amend local ordinances to allow backyard composting. Provide homeowners with plans
for rodent-proof compost bins.• Partner with landscaping firms to compost yard waste/fall leaf collection.• Promote Community Sponsored Agriculture, Community Gardens, and other local
production/consumption methods to reduce amount of food waste packaging.• Provide separate food waste pickup for institutional/food kitchens. Compost waste at
central facility, and sell to landscape firms or citizens to reclaim costs.
8/14/2019 New Food Systems
http://slidepdf.com/reader/full/new-food-systems 29/30
29
Bibliography
Carver, A.D. and J.E. Yahner. 1996. Defining Prime Agricultural Land and Methods of Protec-tion. Purdue Cooperative Extension Service. AY-283.
Environmental Protection Agency. 2003. Municipal Solid Waste Generation, Recycling, andDisposal in the United States. http://www.epa.gov/msw/msw99.htm
Garret, Steven. “Growing a Community Food System”. Community Ventures: Partnerships inEducation and Research Circular Series Topics. 1997 or 1998??
Hagen, J.W., D. Minami, B. Mason, and W. Dunton. 1999. “California’s Produce Trucking In-dustry:Characteristics and Important Issues.” Center for Agricultural Business, California Agri-cultural Technol-ogy Institute, California State University – Fresno.
Hohenschau, David Lea. “Community Food Security and the Landscape of Cities”. Universityof British Columbia. 2005.
Pirog, Rich. “Food, Fuel, and Freeways: An Iowa Perspective on How Far Food Travels, FuelUsage, and Greenhouse Gas Emissions”. The Leopold Center for Sustainable Agriculture. 2001.
San Francisco Food Alliance. 2005. “2005 San Francisco Collaborative Food System Assess-ment”. San Francisco Department of Public Health.
United States Department of Agriculture. 2002 Agricultural Census. www.nass.usda.gov/ Census_of_Agriculture/index.asp
United States Department of Transportation, Federal Highway Administration, Highway Statis-tics 1997.
United States Department of Agriculture. 2000 Food Review 23(3):27-30
United States Department of Agriculutre. 1998. Continuing Survey of Food Intakes by Indi-viduals/Diet & Health Knowledge Survey, 1994-1996.
United States Department of Agriculture—Food and Nutrition Service. 1999. Food Stamp Par-ticipants’ Access to Food Retailers .http://www.fns.usda.gov/oane/MENU/Published/NutritionEducation/Files/sumnfsps2.htm

8/14/2019 New Food Systems
http://slidepdf.com/reader/full/new-food-systems 30/30
Food Systems Analysis: Farm Data
Number of Farms Land in Farms (acres) Average Farm Size (acres)
2002 1997 Change % Change 2002 1997 Change %
Change 2002 1997 Change %
Change
Charles City 88 71 17 24% 28,676 326 Chesterfield 214 215 (1) 0% 23,312 23,315 (3) 0% 109 108 1 1% Goochland 315 294 21 7% 52,335 52,111 224 0% 166 177 (11) -6%
Hanover 682 598 84 14% 100,537 104,064 (3,527) -3% 147 174 (27) -16% Henrico 185 196 (11) -6% 28,135 28,937 (802) -3% 152 148 4 3% New Kent 100 76 24 32% 19,303 17,139 2,164 13% 193 226 (33) -15% Powhatan 229 263 (34) -13% 54,644 48,621 6,023 12% 239 185 54 29% TOTAL FORREGION 1,813 1,713 100 6% 306,942 274,187 32,755 12% 190 170 21 12%
Source: 2002 Census of Agriculture
Appendix Appendix Appendix
USDA definition:
Market value of agricultural products sold. This category represents the gross market value before taxes and production ex-penses of all agricultural products sold or removed from the place in 2002 regardless of who received the payment. It is equivalentto total sales. It includes sales by the operators as well as the value of any shares received by partners, landlords, contractors, orothers associated with the operation. The value of commodities placed in the Commodity Credit Corporation (CCC) loan program isincluded in this figure. Market value of agricultural products sold does not include payments received for participation in other fed-eral farm programs. Also, it does not include income from farm-related sources such as customwork and other agricultural services,or income from non-farm sources.
The value of crops sold in 2002 does not necessarily represent the sales from crops harvested in 2002. Data may include salesfrom crops produced in earlier years and may exclude some crops produced in 2002 but held in storage and not sold. For commodi-ties such as sugarbeets and wool sold through a co-op that made payments in several installments, respondents were requested toreport the total value received in 2002.
The value of agricultural products sold was requested of all operators. If the operators failed to report this information, estimateswere made based on the amount of crops harvested, livestock or poultry inventory, or number sold. Caution should be used when
comparing sales in the 2002 census with sales reported in earlier censuses. Sales figures are expressed in current dollars and havenot been adjusted for inflation or deflation. The value of sales of some crops and of some livestock and animal specialties wereasked separately in the 1997 census and were combined into categories in the 2002 census as follows:
1. Individual grain crops were combined.2. Hay, silage, field seeds, and grass seeds (excluding grain silage and forage) were com-bined with other crops.3. Individual nursery and greenhouse items were combined. 4. Sales of cut Christmas trees was combinedwith value of short-rotation woody crops. 5. Horses and ponies were combined with horses, ponies, mules, burros, and donkeys. 6.Colonies of bees and honey were combined with other animals and other animal products. 7. Milk goats and goat milk were com-bined with sheep, goats, and their products. 8. Angora goats and mohair were combined with sheep, goats, and their products. 9.Other goats were combined with sheep, goats, and their products. 10. Mink and their pelts were combined with other animals andother animal products. 11. Rabbits and their pelts were combined with other animals and other animal products.